Exhibit 99.1

| 4 Hertz Global Holdings, Inc. th Quarter and Full Year 2007 Conference Call February 21, 2008 |
| Safe Harbor Statement Certain statements made within this presentation contain forward-looking statements, within the meaning of the Private Securities Litigation Reform Act of 1995. Forward-looking statements are not guarantees of performance and by their nature are subject to inherent uncertainties. Actual results may differ materially. Any forward-looking information relayed in this presentation speaks only as of February 21, 2008, and the Company undertakes no obligation to update that information to reflect changed circumstances. Additional information concerning these statements is contained in the Company’s press release regarding its Fourth Quarter and Full Year results issued on February 20, 2008, and the Risk Factors and Forward- Looking Statements sections of the Company’s 2006 10-K and third quarter 2007 10-Q filings with the SEC. Copies of these materials are available from the SEC, the Hertz web site or from the Company’s Investor Relations Department. |

| Today’s Agenda • Strategic Overview – Mark Frissora, Chairman and CEO • Operating and Financial Review – Elyse Douglas, Executive VP and CFO • 2008 Outlook – Mark Frissora, Chairman and CEO • Question & Answer Session |
| Non-GAAP Measures The following Non-GAAP measures will be used in the presentation: • Corporate EBITDA • Adjusted Pre-Tax Income • Adjusted Net Income • Adjusted Diluted Earnings Per Share • Net Corporate Debt • Levered After-Tax Cash Flow After Fleet Growth Definitions and reconciliations of these non-GAAP measures are provided following page 17 of the presentation |
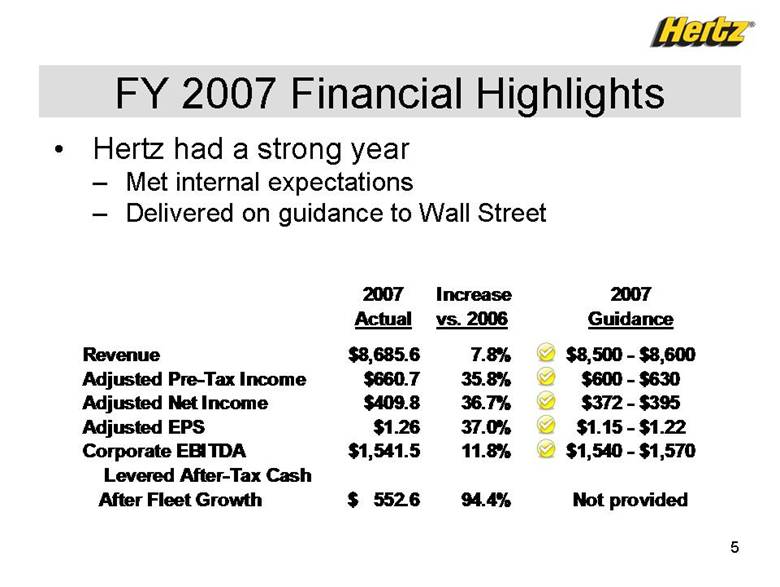
| FY 2007 Financial Highlights • Hertz had a strong year – Met internal expectations – Delivered on guidance to Wall Street 2007 Increase 2007 Actual vs. 2006 Guidance Revenue $8,685.6 7.8% $8,500 - $8,600 Adjusted Pre-Tax Income $660.7 35.8% $600 - $630 Adjusted Net Income $409.8 36.7% $372 - $395 Adjusted EPS $1.26 37.0% $1.15 - $1.22 Corporate EBITDA $1,541.5 11.8% $1,540 - $1,570Levered After-Tax Cash After Fleet Growth 552.6 $ 94.4% Not provided |
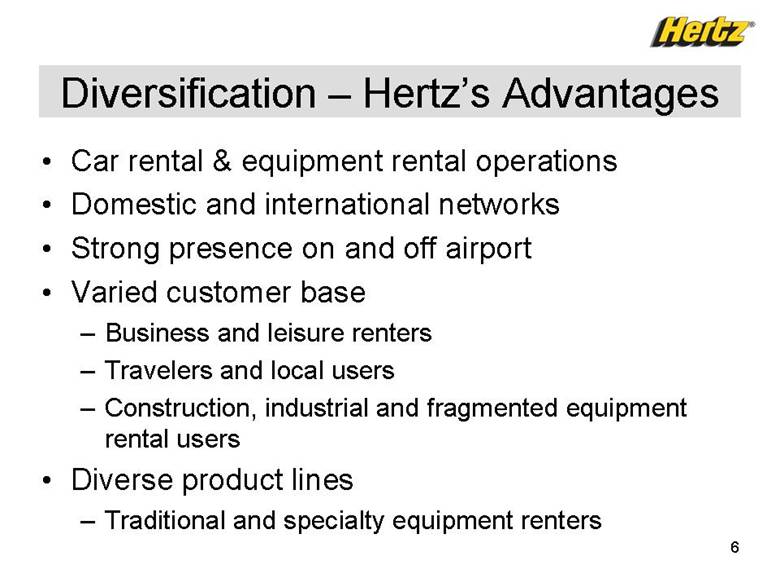
| Diversification – Hertz’s Advantages • Car rental & equipment rental operations • Domestic and international networks • Strong presence on and off airport • Varied customer base – Business and leisure renters – Travelers and local users – Construction, industrial and fragmented equipment rental users • Diverse product lines – Traditional and specialty equipment renters |
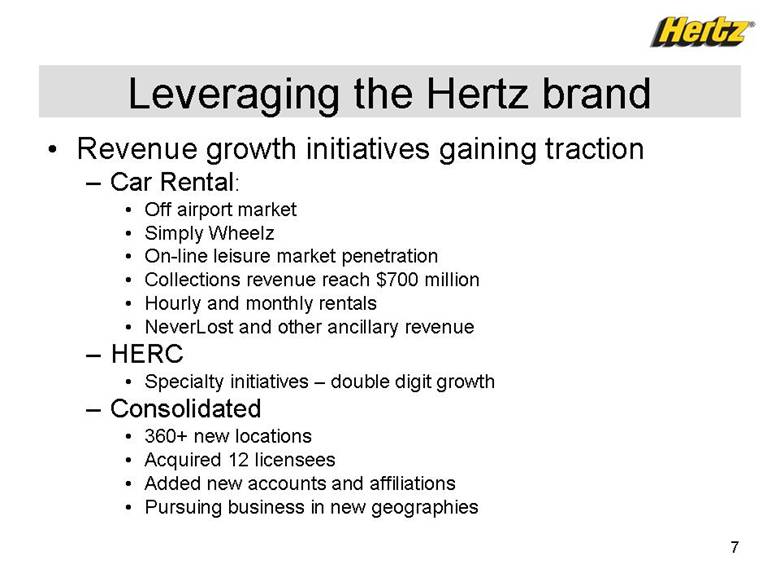
| Leveraging the Hertz brand • Revenue growth initiatives gaining traction – Car Rental: • Off airport market • Simply Wheelz • On-line leisure market penetration • Collections revenue reach $700 million • Hourly and monthly rentals • NeverLost and other ancillary revenue –HERC • Specialty initiatives – double digit growth – Consolidated • 360+ new locations • Acquired 12 licensees • Added new accounts and affiliations • Pursuing business in new geographies |

| Efficiency Initiatives Drive Profitability • Adjusted pre-tax income margin +160 bps y-o- • Annualized net savings in 2008 expected to be $250 million – $75 million included in pre-tax income guidance – Restructuring costs: $30 – $40 million in first half 2008 • Efficiency from 5 major initiatives – Hertz Improvement Process – Lean/Six Sigma – Restructuring – Organization Streamlining – Genesis – company wide business process outsourcing & re-engineering – Global Supply Chain – focus on entire fleet lifecycle – Contribution Management System |

| Car Rental Commentary • Domestic Operations – Slowing airline traffic and economy impact Q4 volume – Leisure pricing was under pressure – Corporate increases +2.4% in Q4 – Current pricing outlook improved • International – Strong volume through 2007 slows in December – Reservation book is encouraging • RPD is impacted by mix shift – On-line leisure and replacement in U.S. – Vans, monthly rentals, leisure in Europe |
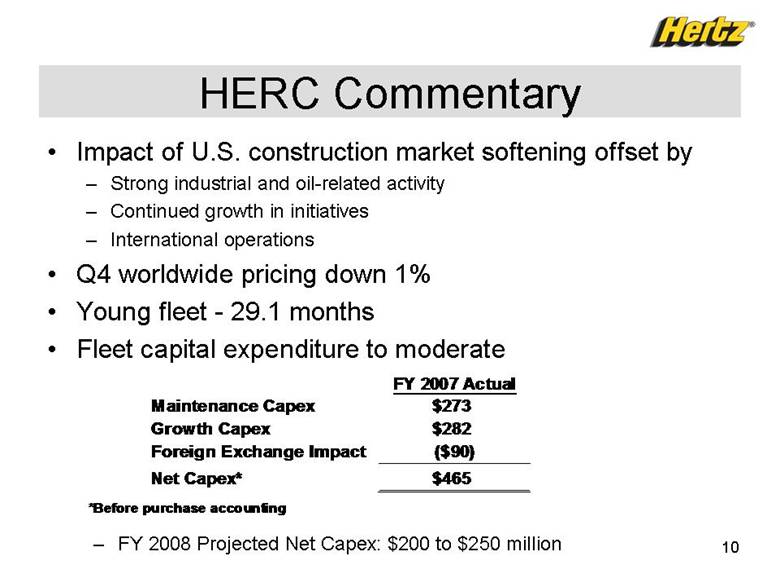
| HERC Commentary • Impact of U.S. construction market softening offset by – Strong industrial and oil-related activity – Continued growth in initiatives – International operations • Q4 worldwide pricing down 1% • Young fleet -29.1 months • Fleet capital expenditure to moderate FY 2007 Actual Maintenance Capex $273 Growth Capex $282 Foreign Exchange Impact ($90) Net Capex* $465 *Before purchase acco untin g – FY 2008 Projected Net Capex: $200 to $250 million |
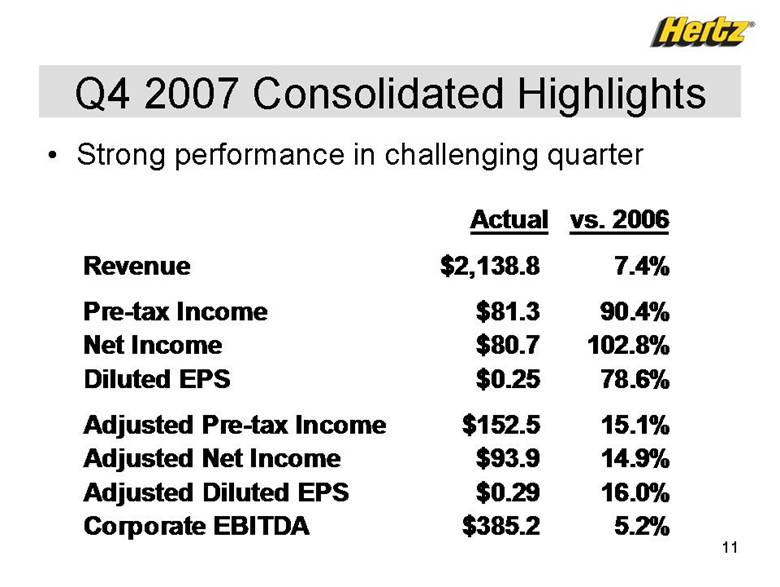
| Q4 2007 Consolidated Highlights • Strong performance in challenging quarter Actual vs. 2006 Revenue $2,138.8 7.4% Pre-tax Income $81.3 90.4% Net Income $80.7 102.8% Diluted EPS $0.25 78.6% Adjusted Pre-tax Income $152.5 15.1% Adjusted Net Income $93.9 14.9% Adjusted Diluted EPS $0.29 16.0% Corporate EBITDA $385.2 5.2% 11 |
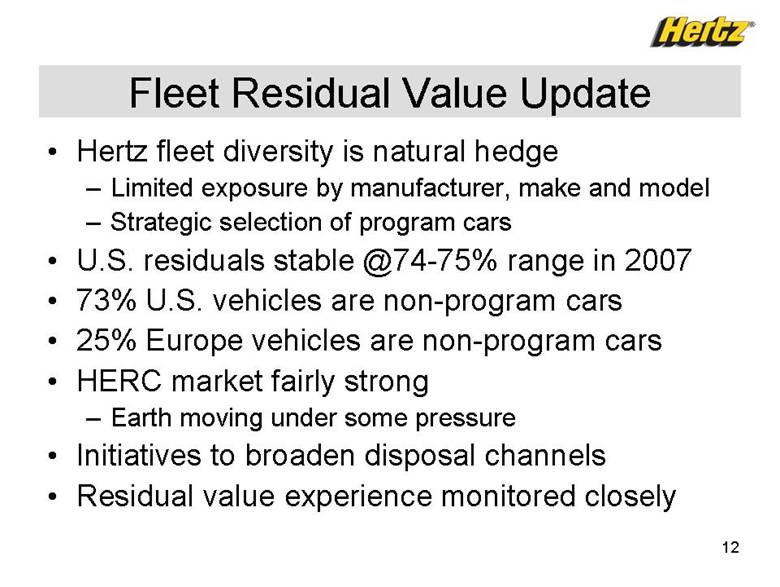
| Fleet Residual Value Update • Hertz fleet diversity is natural hedge – Limited exposure by manufacturer, make and model – Strategic selection of program cars • U.S. residuals stable @74-75% range in 2007 • 73% U.S. vehicles are non-program cars • 25% Europe vehicles are non-program cars • HERC market fairly strong – Earth moving under some pressure • Initiatives to broaden disposal channels • Residual value experience monitored closely |
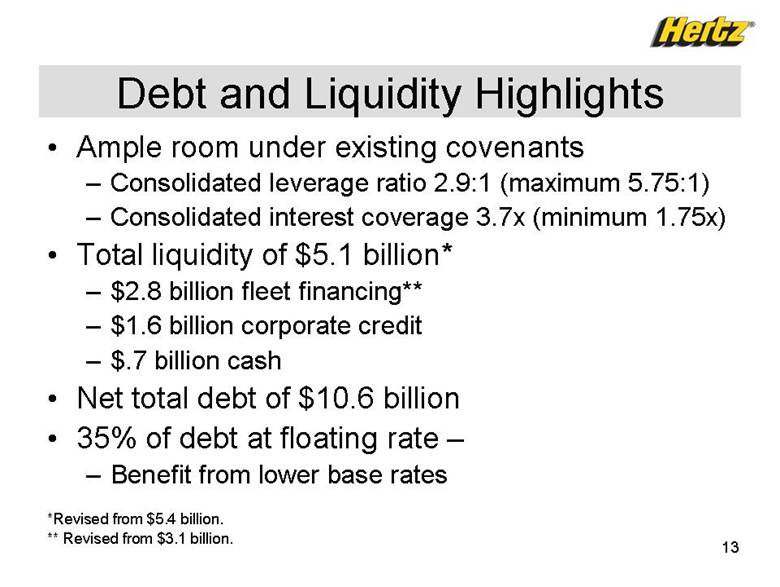
| Debt and Liquidity Highlights • Ample room under existing covenants – Consolidated leverage ratio 2.9:1 (maximum 5.75:1) – Consolidated interest coverage 3.7x (minimum 1.75x) • Total liquidity of $5.1 billion* – $2.8 billion fleet financing** – $1.6 billion corporate credit – $.7 billion cash • Net total debt of $10.6 billion • 35% of debt at floating rate – – Benefit from lower base rates *Revised from $5.4 billion. ** Revised from $3.1 billion. 13 |
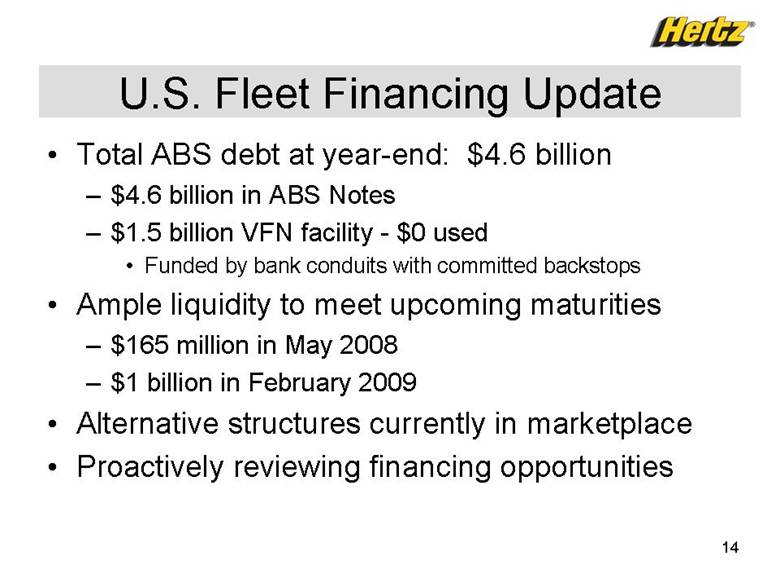
| U.S. Fleet Financing Update • Total ABS debt at year-end: $4.6 billion – $4.6 billion in ABS Notes – $1.5 billion VFN facility -$0 used • Funded by bank conduits with committed backstops • Ample liquidity to meet upcoming maturities – $165 million in May 2008 – $1 billion in February 2009 • Alternative structures currently in marketplace • Proactively reviewing financing opportunities |
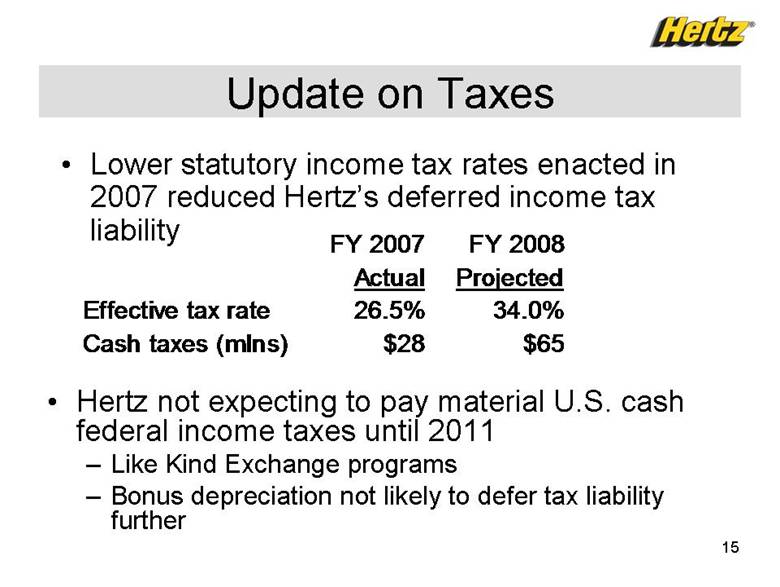
| Update on Taxes • Lower statutory income tax rates enacted in 2007 reduced Hertz’s deferred income tax liability FY 2007 FY 2008 Actual Projected Effective tax rate 26.5% 34.0% Cash taxes (mlns) $28 $65 • Hertz not expecting to pay material U.S. cash federal income taxes until 2011 – Like Kind Exchange programs – Bonus depreciation not likely to defer tax liability further |
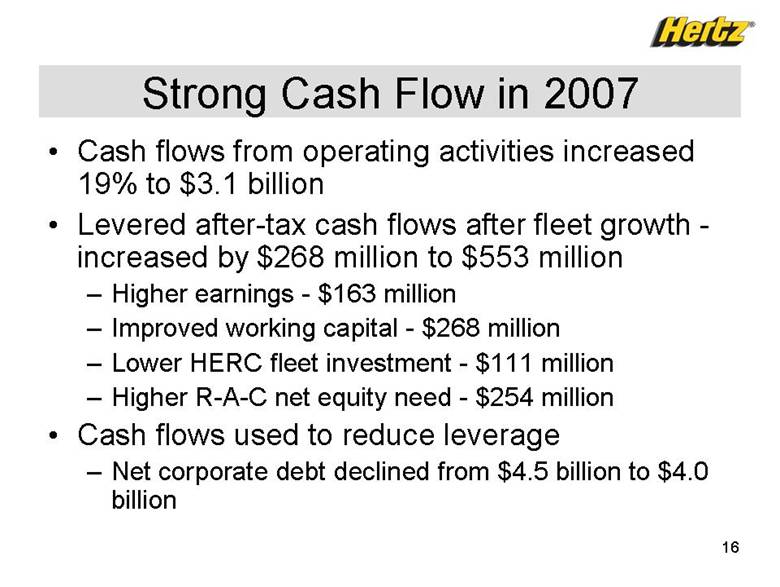
| Strong Cash Flow in 2007 • Cash flows from operating activities increased 19% to $3.1 billion • Levered after-tax cash flows after fleet growth increased by $268 million to $553 million – Higher earnings -$163 million – Improved working capital -$268 million – Lower HERC fleet investment -$111 million – Higher R-A-C net equity need -$254 million • Cash flows used to reduce leverage – Net corporate debt declined from $4.5 billion to $4.0 billion |
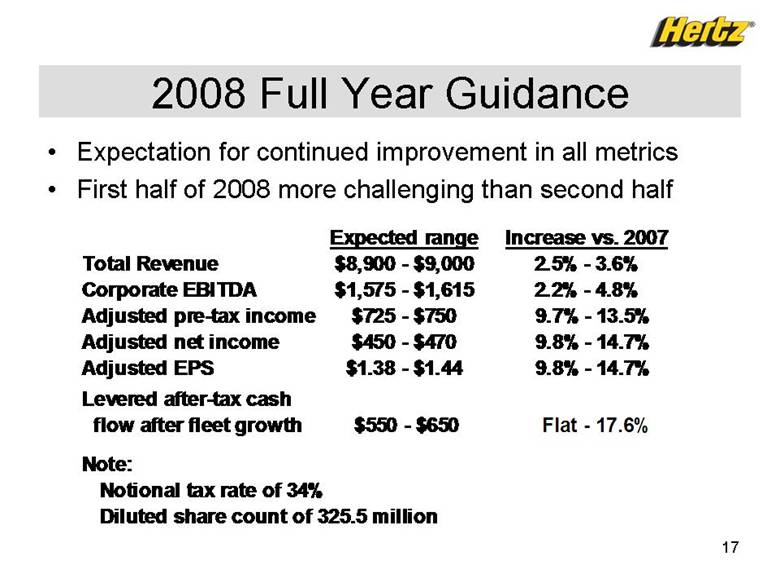
| 2008 Full Year Guidance • Expectation for continued improvement in all metrics • First half of 2008 more challenging than second half Total Revenue Corporate EBITDA Adjusted pre-tax income Adjusted net income Adjusted EPS Levered after-tax cash flow after fleet growth Note: Notional tax rate of 34% Expected range Increase vs. 2007 $8,900 - $9,000 2.5% - 3.6% $1,575 - $1,615 2.2% - 4.8% $725 -$750 9.7% -13.5% $450 -$470 9.8% -14.7% $1.38 -$1.44 9.8% -14.7% $550 - $650 Flat - 17.6% Diluted share count of 325.5 million |
Non-GAAP Measures: Definitions and Use/Importance
On December 21, 2005 (“Closing Date”) an indirect, wholly owned subsidiary of Hertz Global Holdings, Inc. (“Hertz Holdings”) acquired all of The Hertz Corporation’s (“Hertz”) common stock from Ford Holdings LLC (“Ford Holdings”) pursuant to a Stock Purchase Agreement, dated as of September 12, 2005, among Ford Motor Company (“Ford”), Ford Holdings and Hertz Holdings (previously known as CCMG Holdings, Inc.). As a result of this transaction, investment funds associated with or designated by Clayton, Dubilier & Rice, Inc., The Carlyle Group and Merrill Lynch Global Private Equity (collectively, the “Sponsors”), owned all of the common stock of Hertz Holdings. After giving effect to the initial public offering of the common stock of Hertz Holdings in November 2006 and a secondary offering in June 2007, the Sponsors now own approximately 55% of the common stock of Hertz Holdings. We refer to the acquisition of all of Hertz’s common stock as the “Acquisition.” We refer to the Acquisition, together with related transactions entered into to finance the cash consideration for the Acquisition, to refinance certain of our existing indebtedness and to pay related transaction fees and expenses, as the “Transactions.” The term “GAAP” refers to accounting principles generally accepted in the United States of America.
Definitions of non-GAAP financial and other measures utilized in Hertz Holdings’ February 20, 2008 Press Release are set forth below. Also set forth below is a summary of the reasons why management of Hertz Holdings and Hertz believe that presentation of the non-GAAP financial measures included in the Press Release provide useful information regarding Hertz Holdings’ and Hertz’s financial condition and results of operations and additional purposes, if any, for which management of Hertz Holdings and Hertz utilize the non-GAAP financial measures.
1. Earnings Before Interest, Taxes, Depreciation and Amortization (“EBITDA”) and Corporate EBITDA
We present EBITDA and Corporate EBITDA to provide investors with supplemental measures of our operating performance and liquidity and, in the case of Corporate EBITDA, information utilized in the calculation of the financial covenants under Hertz’s senior credit facilities. EBITDA is defined as consolidated net income before net interest expense, consolidated income taxes and consolidated depreciation and amortization. Corporate EBITDA differs from the term “EBITDA” as it is commonly used. Corporate EBITDA means “EBITDA” as that term is defined under Hertz’s senior credit facilities, which is generally consolidated net income before net interest expense (other than interest expense relating to certain car rental fleet financing), consolidated income taxes, consolidated depreciation (other than depreciation related to the car rental fleet) and amortization and before certain other items, in each case as more fully defined in the agreements governing Hertz’s senior credit facilities. The other items excluded in this calculation include, but are not limited to: non-cash expenses and charges; extraordinary, unusual or non-recurring gains or losses; gains or losses associated with the sale or write-down of assets not in the ordinary course of business; certain management fees paid to the Sponsors; and earnings to the extent of cash dividends or distributions paid from non-controlled affiliates. Further, the covenants in Hertz’s senior credit facilities are calculated using Corporate EBITDA for the most recent four fiscal quarters as a whole. As a result, the measure can be disproportionately affected by a particularly strong or weak quarter. Further, it may not be comparable to the measure for any subsequent four-quarter period or for any complete fiscal year.
Management uses EBITDA and Corporate EBITDA as performance and cash flow metrics for internal monitoring and planning purposes, including the preparation of our annual operating budget and monthly operating reviews, as well as to facilitate analysis of investment decisions. In addition, both metrics are important to allow us to evaluate profitability and make performance trend comparisons between us and our competitors. Further, we believe EBITDA and Corporate EBITDA are frequently used by securities analysts, investors and other interested parties in the evaluation of companies in our industries.
EBITDA is also used by management and investors to evaluate our operating performance exclusive of financing costs and depreciation policies. Further, because we have two business segments that are financed differently and have different underlying depreciation characteristics, EBITDA enables investors to isolate the effects on profitability of operating metrics such as revenue, operating expenses and selling, general and administrative expenses. In addition to its use to monitor performance trends, EBITDA provides a comparative metric to management and investors that is consistent across companies with different capital structures and depreciation policies. This enables management and investors to compare our
performance on a consolidated basis and on a segment basis to that of our peers. In addition, our management uses consolidated EBITDA as a proxy for cash flow available to finance fleet expenditures and the costs of our capital structure on a day-to-day basis so that we can more easily monitor our cash flows when a full statement of cash flows is not available.
Corporate EBITDA also serves as an important measure of our performance. Corporate EBITDA for our car rental segment enables us to assess our operating performance inclusive of fleet management performance, depreciation assumptions and the cost of financing our fleet. In addition, Corporate EBITDA for our car rental segment allows us to compare our performance, inclusive of fleet mix and financing decisions, to the performance of our competitors. Since most of our competitors utilize asset-backed fleet debt to finance fleet acquisitions, this measure is relevant for evaluating our operating efficiency inclusive of our fleet acquisition and utilization. For our equipment rental segment, Corporate EBITDA provides an appropriate measure of performance because the investment in our equipment fleet is longer-term in nature than for our car rental segment and therefore Corporate EBITDA allows management to assess operating performance exclusive of interim changes in depreciation assumptions. Further, unlike our car rental segment, our equipment rental fleet is not financed through separate securitization-based fleet financing facilities, but rather through our corporate debt. Corporate EBITDA for our equipment rental segment is a key measure used to make investment decisions because it enables us to evaluate return on investments. For both segments, Corporate EBITDA provides a relevant profitability metric for use in comparison of our performance against our public peers, many of whom publicly disclose a comparable metric. In addition, we believe that investors, analysts and rating agencies consider EBITDA and Corporate EBITDA useful in measuring our ability to meet our debt service obligations and make capital expenditures. Several of Hertz’s material debt covenants are based on financial ratios utilizing Corporate EBITDA and non-compliance with those covenants could result in the requirement to immediately repay all amounts outstanding under those agreements, which could have a material adverse effect on our results of operations, financial position and cash flows.
EBITDA and Corporate EBITDA are not recognized measurements under GAAP. When evaluating our operating performance or liquidity, investors should not consider EBITDA and Corporate EBITDA in isolation of, or as a substitute for, measures of our financial performance and liquidity as determined in accordance with GAAP, such as net income, operating income or net cash provided by operating activities. EBITDA and Corporate EBITDA may have material limitations as performance measures because they exclude items that are necessary elements of our costs and operations. Because other companies may calculate EBITDA and Corporate EBITDA differently than we do, EBITDA may not be, and Corporate EBITDA as presented is not, comparable to similarly titled measures reported by other companies.
Borrowings under Hertz’s senior credit facilities are a key source of our liquidity. Hertz’s ability to borrow under these senior credit facilities depends upon, among other things, the maintenance of a sufficient borrowing base and compliance with the financial ratio covenants based on Corporate EBITDA set forth in the credit agreements for Hertz’s senior credit facilities. Hertz’s senior term loan facility requires it to maintain a specified consolidated leverage ratio and a consolidated interest expense coverage ratio based on Corporate EBITDA, while its senior asset-based loan facility requires that a specified consolidated leverage ratio and consolidated fixed charge coverage ratio be maintained for periods during which there is less than $200 million of available borrowing capacity under the senior asset-based loan facility. These financial covenants became applicable to Hertz beginning September 30, 2006, reflecting the four quarter period ending thereon. Failure to comply with these financial ratio covenants would result in a default under the credit agreements for Hertz’s senior credit facilities and, absent a waiver or an amendment from the lenders, permit the acceleration of all outstanding borrowings under the senior credit facilities. As of December 31, 2007, we performed the calculations associated with the above noted financial covenants and determined that Hertz is in compliance with such covenants.
2. Adjusted Pre-Tax Income
Adjusted pre-tax income is calculated as income before income taxes and minority interest plus non-cash purchase accounting charges, non-cash debt charges relating to the amortization of debt financing costs and debt discounts, unrealized transaction gains (losses) on Euro-denominated debt (through September 30, 2006) and certain one-time charges and non-operational items. Adjusted pre-tax income is important to management and investors because it represents our preferred measure of our operational performance exclusive of the effects of purchase accounting, non-cash debt charges, one-time charges and items that are not operational in nature or comparable to those of our competitors.
3. Adjusted Net Income
Adjusted net income is calculated as adjusted pre-tax income less a provision for income taxes derived utilizing a normalized income tax rate and minority interest. Adjusted net income is important to management and investors because it represents our preferred measure of our operational performance exclusive of the effects of purchase accounting, non-cash debt charges, one-time charges and items that are not operational in nature or comparable to those of our competitors.
4. Adjusted Diluted Earnings Per Share
Adjusted diluted earnings per share is calculated as adjusted net income divided by the pro forma post-IPO number of shares outstanding. Adjusted diluted earnings per share is important to management and investors because it represents a measure of our operational performance exclusive of the effects of purchase accounting adjustments, one-time charges and items that are not operational in nature or comparable to those of our competitors. Utilizing the pro forma post-IPO number of shares outstanding is important to management and investors because it represents a measure of our earnings per share as if the effects of the initial public offering were applicable to all periods.
5. Transaction Days
Transaction days represent the total number of days that vehicles were on rent in a given period.
6. Car Rental Rate Revenue and Rental Rate Revenue Per Transaction Day
Car rental rate revenue consists of all revenue, net of discounts, associated with the rental of cars including charges for optional insurance products, but excluding revenue derived from fueling and concession and other expense pass-throughs, NeverLost units and certain ancillary revenue. Rental rate revenue per transaction day is calculated as total rental rate revenue, divided by the total number of transaction days, with all periods adjusted to eliminate the effect of fluctuations in foreign currency. Our management believes eliminating the effect of fluctuations in foreign currency is appropriate so as not to affect the comparability of underlying trends. This statistic is important to management and investors as it represents the best measurement of the changes in underlying pricing in the car rental business and encompasses the elements in car rental pricing that management has the ability to control.
7. Equipment Rental and Rental Related Revenue
Equipment rental and rental related revenue consists of all revenue, net of discounts, associated with the rental of equipment including charges for delivery, loss damage waivers and fueling, but excluding revenue arising from the sale of equipment, parts and supplies and certain other ancillary revenue. Rental and rental related revenue is adjusted in all periods to eliminate the effect of fluctuations in foreign currency. Our management believes eliminating the effect of fluctuations in foreign currency is appropriate so as not to affect the comparability of underlying trends. This statistic is important to our management and to investors as it is utilized in the measurement of rental revenue generated per dollar invested in fleet on an annualized basis and is comparable with the reporting of other industry participants.
8. Same Store Revenue Growth
Same store revenue growth represents the change in the current period total same store revenue over the prior period total same store revenue as a percentage of the prior period. The same store revenue amounts are adjusted in all periods to eliminate the effect of fluctuations in foreign currency. Our management believes eliminating the effect of fluctuations in foreign currency is appropriate so as not to affect the comparability of underlying trends.
9. Unlevered Pre-Tax Cash Flow
Unlevered pre-tax cash flow is calculated as Corporate EBITDA less equipment rental fleet depreciation including gain (loss) on sale, non-fleet capital expenditures, net of non-fleet disposals, plus changes in working capital (accounts receivable, inventories, prepaid expenses, accounts payable and accrued liabilities), and changes in other assets and liabilities (including
public liability and property damage, U.S. pension liability, other assets and liabilities, equity and minority interest). Unlevered pre-tax cash flow is important to management and investors as it represents funds available to pay corporate interest and taxes and to grow our fleet or reduce debt.
10. Levered After-Tax Cash Flow Before Fleet Growth
Levered after-tax cash flow before fleet growth is calculated as Unlevered Pre-Tax Cash Flow less corporate net cash interest and corporate cash taxes. Levered after-tax cash flow before fleet growth is important to management and investors as it represents the funds available to grow our fleet or reduce our debt.
11. Levered After-Tax Cash Flow After Fleet Growth
Levered after-tax cash flow after fleet growth is calculated as Levered After-Tax Cash Flow Before Fleet Growth less equipment rental fleet growth capital expenditures and less gross car rental fleet growth capital expenditures plus car rental fleet financing. Levered after-tax cash flow after fleet growth is important to management and investors as it represents the funds available for the reduction of corporate debt.
12. Corporate Net Cash Interest (used in the calculation of Levered After-Tax Cash Flow Before Fleet Growth)
Corporate net cash interest represents total interest expense, net of total interest income, less car rental fleet interest expense, net of car rental fleet interest income, and non-cash corporate interest charges. Non-cash corporate interest charges represent the amortization of corporate debt financing costs and corporate debt discounts. Corporate net cash interest helps management and investors measure the ongoing costs of financing the business exclusive of the costs associated with the fleet financing.
13. Corporate Cash Taxes (used in the calculation of Levered After-Tax Cash Flow Before Fleet Growth)
Corporate cash taxes represents cash paid by the Company during the period for income taxes.
14. Net Corporate Debt
Net corporate debt is calculated as total debt excluding fleet debt less cash and equivalents and short-term investments, if any, and “corporate restricted cash.” Corporate debt consists of senior notes and Euro medium term notes issued prior to the Acquisition; borrowings under our Senior Term Facility; borrowings under our Senior ABL Facility; our Senior Notes; our Senior Subordinated Notes; and certain other indebtedness of our domestic and foreign subsidiaries. Net Corporate Debt is important to management, investors and ratings agencies as it helps measure our leverage. Net Corporate Debt also assists in the evaluation of our ability to service our non-fleet-related debt without reference to the expense associated with the fleet debt, which is fully collateralized by assets not available to lenders under the non-fleet debt facilities.
15. Net Fleet Debt
Net fleet debt is calculated as total fleet debt less “restricted cash associated with fleet debt.” Fleet debt consists of our U.S. ABS Fleet Debt, the Fleet Financing Facility, obligations incurred under our International Fleet Debt Facilities, capital lease financings relating to revenue earning equipment that are outside the International Fleet Debt Facilities, the Belgian Revolving Credit Facility, the Brazilian Credit Facility, the Canadian Fleet Financing Facility, the U.K. Leveraged Financing and the pre-Acquisition ABS Notes. This measure is important to management, investors and ratings agencies as it helps measure our leverage.
16. Corporate Restricted Cash (used in the calculation of Net Corporate Debt)
Total restricted cash includes cash and equivalents that are not readily available for our normal disbursements. Total restricted cash and equivalents are restricted for the acquisition of vehicles and other specified uses under our Fleet Debt programs, our like-kind exchange programs and to satisfy certain of our self insurance regulatory reserve requirements. Corporate restricted cash is calculated as total restricted cash less “restricted cash associated with fleet debt.”
17. Restricted Cash Associated with Fleet Debt (used in the calculation of Net Fleet Debt and Corporate Restricted Cash)
Total restricted cash includes cash and equivalents that are not readily available for our normal disbursements. Restricted cash associated with fleet debt is restricted for the purchase of revenue earning vehicles and other specified uses under our Fleet Debt programs and our car rental like-kind exchange program.
Table 1
HERTZ GLOBAL HOLDINGS, INC.
CONDENSED CONSOLIDATED STATEMENTS OF OPERATIONS
(In millions, except per share amounts)
Unaudited
| | Three Months Ended | | As a Percent | | Year Ended | | As a Percent | |
| | December 31, | | of Total Revenues | | December 31, | | of Total Revenues | |
| | 2007 | | 2006 | | 2007 | | 2006 | | 2007 | | 2006 | | 2007 | | 2006 | |
Total revenues | | $ | 2,138.8 | | $ | 1,990.6 | | 100.0 | % | 100.0 | % | $ | 8,685.6 | | $ | 8,058.4 | | 100.0 | % | 100.0 | % |
| | | | | | | | | | | | | | | | | |
Expenses: | | | | | | | | | | | | | | | | | |
Direct operating | | 1,149.0 | | 1,091.8 | | 53.7 | % | 54.8 | % | 4,644.1 | | 4,476.0 | | 53.4 | % | 55.5 | % |
Depreciation of revenue earning equipment | | 504.5 | | 445.8 | | 23.6 | % | 22.4 | % | 2,003.4 | | 1,757.2 | | 23.1 | % | 21.8 | % |
Selling, general and administrative | | 189.9 | | 182.2 | | 8.9 | % | 9.2 | % | 775.9 | | 723.9 | | 8.9 | % | 9.0 | % |
Interest, net of interest income | | 214.1 | | 228.1 | | 10.0 | % | 11.5 | % | 875.4 | | 900.7 | | 10.1 | % | 11.2 | % |
Total expenses | | 2,057.5 | | 1,947.9 | | 96.2 | % | 97.9 | % | 8,298.8 | | 7,857.8 | | 95.5 | % | 97.5 | % |
Income before income taxes and minority interest | | 81.3 | | 42.7 | | 3.8 | % | 2.1 | % | 386.8 | | 200.6 | | 4.5 | % | 2.5 | % |
Benefit (provision) for taxes on income | | 4.7 | | 1.5 | | 0.2 | % | 0.1 | % | (102.6 | ) | (68.0 | ) | (1.2 | )% | (0.9 | )% |
Minority interest | | (5.3 | ) | (4.4 | ) | (0.2 | )% | (0.2 | )% | (19.7 | ) | (16.7 | ) | (0.2 | )% | (0.2 | )% |
Net income | | $ | 80.7 | | $ | 39.8 | | 3.8 | % | 2.0 | % | $ | 264.5 | | $ | 115.9 | | 3.1 | % | 1.4 | % |
| | | | | | | | | | | | | | | | | |
Weighted average number of | | | | | | | | | | | | | | | | | |
shares outstanding: | | | | | | | | | | | | | | | | | |
Basic | | 321.7 | | 277.5 | | | | | | 321.2 | | 242.5 | | | | | |
Diluted | | 326.2 | | 281.0 | | | | | | 325.5 | | 243.4 | | | | | |
| | | | | | | | | | | | | | | | | |
Earnings per share: | | | | | | | | | | | | | | | | | |
Basic | | $ | 0.25 | | $ | 0.14 | | | | | | $ | 0.82 | | $ | 0.48 | | | | | |
Diluted | | $ | 0.25 | | $ | 0.14 | | | | | | $ | 0.81 | | $ | 0.48 | | | | | |
Table 2
HERTZ GLOBAL HOLDINGS, INC.
CONDENSED CONSOLIDATED STATEMENTS OF OPERATIONS
(In millions)
Unaudited
| | Three Months Ended December 31, 2007 | | Three Months Ended December 31, 2006 | |
| | As
Reported | | Adjustments | | As
Adjusted | | As
Reported | | Adjustments | | As
Adjusted | |
Total revenues | | $ | 2,138.8 | | $ | — | | $ | 2,138.8 | | $ | 1,990.6 | | $ | — | | $ | 1,990.6 | |
| | | | | | | | | | | | | |
Expenses: | | | | | | | | | | | | | |
Direct operating | | 1,149.0 | | (22.9 | )(a) | 1,126.1 | | 1,091.8 | | (18.6 | )(a) | 1,073.2 | |
Depreciation of revenue earning equipment | | 504.5 | | (6.6 | )(b) | 497.9 | | 445.8 | | (7.3 | )(b) | 438.5 | |
Selling, general and administrative | | 189.9 | | (23.1 | )(c) | 166.8 | | 182.2 | | (25.1 | )(c) | 157.1 | |
Interest, net of interest income | | 214.1 | | (18.6 | )(d) | 195.5 | | 228.1 | | (38.8 | )(d) | 189.3 | |
Total expenses | | 2,057.5 | | (71.2 | ) | 1,986.3 | | 1,947.9 | | (89.8 | ) | 1,858.1 | |
Income before income taxes and minority interest | | 81.3 | | 71.2 | | 152.5 | | 42.7 | | 89.8 | | 132.5 | |
Benefit (provision) for taxes on income | | 4.7 | (e) | (58.0 | )(f) | (53.3 | ) | 1.5 | (e) | (47.9 | )(f) | (46.4 | ) |
Minority interest | | (5.3 | ) | — | | (5.3 | ) | (4.4 | ) | — | | (4.4 | ) |
Net income | | $ | 80.7 | | $ | 13.2 | | $ | 93.9 | | $ | 39.8 | | $ | 41.9 | | $ | 81.7 | |
| | | | | | | | | | | | | |
| | | | | | | | | | | | | |
| | | | | | | | | | | | | |
| | Year Ended December 31, 2007 | | Year Ended December 31, 2006 | |
| | As
Reported | | Adjustments | | As
Adjusted | | As
Reported | | Adjustments | | As
Adjusted | |
Total revenues | | $ | 8,685.6 | | $ | — | | $ | 8,685.6 | | $ | 8,058.4 | | $ | — | | $ | 8,058.4 | |
| | | | | | | | | | | | | |
Expenses: | | | | | | | | | | | | | |
Direct operating | | 4,644.1 | | (85.0 | )(a) | 4,559.1 | | 4,476.0 | | (75.9 | )(a) | 4,400.1 | |
Depreciation of revenue earning equipment | | 2,003.4 | | (19.6 | )(b) | 1,983.8 | | 1,757.2 | | (13.8 | )(b) | 1,743.4 | |
Selling, general and administrative | | 775.9 | | (63.4 | )(c) | 712.5 | | 723.9 | | (57.0 | )(c) | 666.9 | |
Interest, net of interest income | | 875.4 | | (105.9 | )(d) | 769.5 | | 900.7 | | (139.4 | )(d) | 761.3 | |
Total expenses | | 8,298.8 | | (273.9 | ) | 8,024.9 | | 7,857.8 | | (286.1 | ) | 7,571.7 | |
Income before income taxes and minority interest | | 386.8 | | 273.9 | | 660.7 | | 200.6 | | 286.1 | | 486.7 | |
Provision for taxes on income | | (102.6 | ) | (128.6 | )(f) | (231.2 | ) | (68.0 | ) | (102.3 | )(f) | (170.3 | ) |
Minority interest | | (19.7 | ) | — | | (19.7 | ) | (16.7 | ) | — | | (16.7 | ) |
Net income | | $ | 264.5 | | $ | 145.3 | | $ | 409.8 | | $ | 115.9 | | $ | 183.8 | | $ | 299.7 | |
| | | | | | | | | | | | | | | | | | | | | |
(a) | | Represents the increase in amortization of other intangible assets, depreciation of property and equipment and accretion of certain revalued liabilities relating to purchase accounting. For the three months and year ended December 31, 2007, also includes restructuring charges of $10.8 million and $41.2 million, respectively, and a vacation accrual adjustment of $6.3 million and $29.8 million, respectively. |
(b) | | Represents the increase in depreciation of revenue earning equipment based upon its revaluation relating to purchase accounting. |
(c) | | For the three months and year ended December 31, 2007, includes restructuring charges of $20.2 million and $55.2 million, respectively, and a vacation accrual adjustment of $1.4 million and $6.5 million, respectively. Also includes an increase in depreciation of property and equipment relating to purchase accounting, among other adjustments which are detailed in Table 5. |
(d) | | Represents non-cash debt charges relating to the amortization of deferred debt financing costs and debt discounts. For the three months and year ended December 31, 2007, also includes $2.7 million and $20.4 million, respectively, associated with the ineffectiveness of our interest rate swaps and for the year ended December 31, 2007, includes the write off of $16.2 million of unamortized debt costs associated with a debt modification. For the three months and year ended December 31, 2006, also includes interest on the $1.0 billion HGH loan facility of $16.1 million and $39.9 million, respectively.For the year ended December 31, 2006, also includes $1.0 million associated with the reversal of the ineffectiveness of our interest rate swaps. Total adjusted interest, net of interest income, consists of net corporate cash interest of $66.1 million and $275.3 million and net fleet cash interest of $129.4 million and $494.2 million for the three months and year ended December 31, 2007, respectively, and net corporate cash interest of $74.6 million and $311.8 million and net fleet cash interest of $114.7 million and $449.5 million for the three months and year ended December 31, 2006, respectively. |
(e) | | For the three months ended December 31, 2007 and 2006, includes tax benefits primarily related to the reduction of statutory tax rates in certain jurisdictions. |
(f) | | Represents a provision for income taxes derived utilizing a normalized income tax rate (35%). |
Table 3
HERTZ GLOBAL HOLDINGS, INC.
SEGMENT INFORMATION
(In millions, except per share amounts)
Unaudited
| | Three Months Ended | | Year Ended | |
| | December 31, | | December 31, | |
| | 2007 | | 2006 | | 2007 | | 2006 | |
Revenues: | | | | | | | | | |
Car Rental | | $ | 1,668.4 | | $ | 1,552.7 | | $ | 6,920.6 | | $ | 6,378.0 | |
Equipment Rental | | 468.1 | | 436.0 | | 1,755.9 | | 1,672.6 | |
Corporate and Other | | 2.3 | | 1.9 | | 9.1 | | 7.8 | |
| | $ | 2,138.8 | | $ | 1,990.6 | | $ | 8,685.6 | | $ | 8,058.4 | |
| | | | | | | | | |
Depreciation of property and equipment: | | | | | | | | | |
Car Rental | | $ | 31.0 | | $ | 37.5 | | $ | 130.8 | | $ | 150.8 | |
Equipment Rental | | 10.6 | | 10.4 | | 40.4 | | 40.5 | |
Corporate and Other | | 1.1 | | 1.3 | | 5.9 | | 5.9 | |
| | $ | 42.7 | | $ | 49.2 | | $ | 177.1 | | $ | 197.2 | |
| | | | | | | | | |
Amortization of other intangible assets: | | | | | | | | | |
Car Rental | | $ | 8.2 | | $ | 7.5 | | $ | 30.4 | | $ | 29.5 | |
Equipment Rental | | 7.9 | | 7.9 | | 32.2 | | 32.2 | |
Corporate and Other | | — | | — | | — | | — | |
| | $ | 16.1 | | $ | 15.4 | | $ | 62.6 | | $ | 61.7 | |
| | | | | | | | | |
Income (loss) before income taxes and minority interest: | | | | | | | | | |
Car Rental | | $ | 89.4 | | $ | 90.4 | | $ | 468.6 | | $ | 373.5 | |
Equipment Rental | | 84.3 | | 79.2 | | 308.5 | | 269.5 | |
Corporate and Other | | (92.4 | ) | (126.9 | ) | (390.3 | ) | (442.4 | ) |
| | $ | 81.3 | | $ | 42.7 | | $ | 386.8 | | $ | 200.6 | |
| | | | | | | | | |
Corporate EBITDA (a): | | | | | | | | | |
Car Rental | | $ | 155.3 | | $ | 157.5 | | $ | 741.7 | | $ | 650.9 | |
Equipment Rental | | 230.3 | | 211.7 | | 834.1 | | 759.4 | |
Corporate and Other | | (0.4 | ) | (3.1 | ) | (34.3 | ) | (31.6 | ) |
| | $ | 385.2 | | $ | 366.1 | | $ | 1,541.5 | | $ | 1,378.7 | |
| | | | | | | | | |
Adjusted pre-tax income (loss) (a): | | | | | | | | | |
Car Rental | | $ | 125.0 | | $ | 113.2 | | $ | 609.1 | | $ | 472.3 | |
Equipment Rental | | 102.3 | | 100.5 | | 373.8 | | 345.5 | |
Corporate and Other | | (74.8 | ) | (81.2 | ) | (322.2 | ) | (331.1 | ) |
| | $ | 152.5 | | $ | 132.5 | | $ | 660.7 | | $ | 486.7 | |
| | | | | | | | | |
Adjusted net income (loss) (a): | | | | | | | | | |
Car Rental | | $ | 81.2 | | $ | 73.6 | | $ | 395.9 | | $ | 307.0 | |
Equipment Rental | | 66.5 | | 65.3 | | 243.0 | | 224.6 | |
Corporate and Other | | (53.8 | ) | (57.2 | ) | (229.1 | ) | (231.9 | ) |
| | $ | 93.9 | | $ | 81.7 | | $ | 409.8 | | $ | 299.7 | |
| | | | | | | | | |
Pro forma post-IPO diluted number of shares outstanding (a) | | 324.8 | | 324.8 | | 324.8 | | 324.8 | |
| | | | | | | | | |
Adjusted diluted earnings per share (a) | | $ | 0.29 | | $ | 0.25 | | $ | 1.26 | | $ | 0.92 | |
| | | | | | | | | |
(a) Represents a non-GAAP measure, see the accompanying reconciliations and definitions. | |
| | | | | | | | | |
Note: “Corporate and other” includes general corporate expenses, certain interest expense (including net interest on corporate debt), as well as other business activities such as our third-party claim management services. | |
|
Table 4
HERTZ GLOBAL HOLDINGS, INC.
SELECTED OPERATING AND FINANCIAL DATA
| | Three Months Ended, or as of Dec. 31, | | Percent change from prior year period | | | | Percent change from prior year | |
| | | | Year Ended, or as of Dec. 31, | | |
| | | | | |
| | | | | |
| | 2007 | | | 2007 | | period | |
| | | | | | | | | |
Selected Car Rental Operating Data | | | | | | | | | |
| | | | | | | | | |
Worldwide number of transactions (in thousands) | | 7,002 | | 0.8 | % | 28,977 | | 3.5 | % |
Domestic | | 5,151 | | (1.0 | )% | 21,547 | | 2.9 | % |
International | | 1,851 | | 6.3 | % | 7,430 | | 5.2 | % |
| | | | | | | | | |
Worldwide transaction days (in thousands) | | 30,998 | | 4.8 | % | 129,353 | | 5.0 | % |
Domestic | | 21,195 | | 2.1 | % | 88,988 | | 3.8 | % |
International | | 9,803 | | 10.9 | % | 40,365 | | 7.5 | % |
| | | | | | | | | |
Worldwide rental rate revenue per transaction day (a) | | $ | 43.79 | | (2.3 | )% | $ | 44.54 | | 0.0 | % |
Domestic | | $ | 43.31 | | (3.0 | )% | $ | 43.77 | | (0.4 | )% |
International (b) | | $ | 44.83 | | (0.9 | )% | $ | 46.25 | | 0.9 | % |
| | | | | | | | | |
Worldwide average number of company-operated cars during period | | 444,000 | | 5.3 | % | 461,100 | | 6.6 | % |
Domestic | | 297,500 | | 3.4 | % | 313,300 | | 6.2 | % |
International | | 146,500 | | 9.6 | % | 147,800 | | 7.3 | % |
| | | | | | | | | |
Worldwide revenue earning equipment, net (in millions) * | | $ | 7,610.4 | | 3.3 | % | $ | 7,610.4 | | 3.3 | % |
| | | | | | | | | |
Selected Worldwide Equipment Rental Operating Data | | | | | | | | | |
| | | | | | | | | |
Rental and rental related revenue (in millions) (a) (b) ** | | $ | 402.6 | | 3.5 | % | $ | 1,537.2 | | 3.9 | % |
Same store revenue growth (a) | | 1.2 | % | N/M | | 1.7 | % | N/M | |
Average acquisition cost of rental equipment operated
during period (in millions) | | | | | | | | | |
| $ | 3,524.2 | | 11.2 | % | $ | 3,305.3 | | 9.5 | % |
Revenue earning equipment, net (in millions) | | $ | 2,697.5 | | 10.6 | % | $ | 2,697.5 | | 10.6 | % |
| | | | | | | | | |
Other Financial Data (in millions) | | | | | | | | | |
| | | | | | | | | |
Cash flows provided by operating activities | | $ | 881.0 | | 116.0 | % | $ | 3,089.5 | | 18.6 | % |
Levered after-tax cash flow before fleet growth (a) | | 316.1 | | 110.0 | % | 842.3 | | 95.5 | % |
Levered after-tax cash flow after fleet growth (a) | | 586.8 | | 51.1 | % | 552.6 | | 94.4 | % |
EBITDA (a) | | 853.4 | | 9.9 | % | 3,485.6 | | 12.4 | % |
Corporate EBITDA (a) | | 385.2 | | 5.2 | % | 1,541.5 | | 11.8 | % |
| | | | | | | | | |
| | | | | | | | | | | | | |
Selected Balance Sheet Data (in millions)
| | December 31, | | | December 31, | | |
| | 2007 | | | 2006 | | |
Cash and equivalents | | $ | 730.2 | | | | $ | 674.5 | | | |
Total revenue earning equipment, net *** | | 10,307.9 | | | | 9,805.5 | | | |
Total assets | | 19,255.7 | | | | 18,677.4 | | | |
Total debt | | 11,960.1 | | | | 12,276.2 | | | |
Net corporate debt (a) | | 3,984.7 | | | | 4,537.3 | | | |
Net fleet debt (a) | | 6,584.2 | | | | 6,511.9 | | | |
Stockholders’ equity | | 2,913.4 | | | | 2,534.6 | | | |
| | | | |
| | | | |
(a) | | Represents a non-GAAP measure, see the accompanying reconciliations and definitions. |
(b) | | Based on 12/31/06 foreign exchange rates. |
* | | Revised From $7,610.7 million as of December 31, 2007. |
** | | Revised from $878.1 million and $3,086.6 million for the three months and year ended December 31, 2007, respectively. |
*** | | Revised from $10,308.2 million as of December 31, 2007. |
| | | | | | | | | | | | | |
| HERTZ GLOBAL HOLDINGS, INC. | Table 5 |
RECONCILIATION OF GAAP TO NON-GAAP EARNINGS MEASURES
(In millions, except per share amounts)
ADJUSTED PRE-TAX INCOME (LOSS) AND ADJUSTED NET INCOME (LOSS)
| | Three Months Ended December 31, 2007 | | Three Months Ended December 31, 2006 | |
| | Car
Rental | | Equipment
Rental | | Corporate
and Other | | Total | | Car
Rental | | Equipment
Rental | | Corporate
and Other | | Total | |
Total revenues: | | $ | 1,668.4 | | $ | 468.1 | | $ | 2.3 | | $ | 2,138.8 | | $ | 1,552.7 | | $ | 436.0 | | $ | 1.9 | | $ | 1,990.6 | |
Expenses: | | | | | | | | | | | | | | | | | |
Direct operating and selling, general and administrative | | 1,055.1 | | 256.1 | | 27.7 | | 1,338.9 | | 991.9 | | 241.8 | | 40.3 | | 1,274.0 | |
Depreciation of revenue earning equipment | | 415.7 | | 88.8 | | — | | 504.5 | | 369.5 | | 76.3 | | — | | 445.8 | |
Interest, net of interest income | | 108.2 | | 38.9 | | 67.0 | | 214.1 | | 100.9 | | 38.7 | | 88.5 | | 228.1 | |
Total expenses | | 1,579.0 | | 383.8 | | 94.7 | | 2,057.5 | | 1,462.3 | | 356.8 | | 128.8 | | 1,947.9 | |
Income (loss) before income taxes and minority interest | | 89.4 | | 84.3 | | (92.4 | ) | 81.3 | | 90.4 | | 79.2 | | (126.9 | ) | 42.7 | |
Adjustments: | | | | | | | | | | | | | | | | | |
Purchase accounting (a): | | | | | | | | | | | | | | | | | |
Direct operating and selling, general and administrative | | 10.3 | | 8.8 | | 0.5 | | 19.6 | | 9.3 | | 9.0 | | 0.4 | | 18.7 | |
Depreciation of revenue earning equipment | | (0.1 | ) | 6.7 | | — | | 6.6 | | (2.6 | ) | 9.9 | | — | | 7.3 | |
Non-cash debt charges (b) | | 12.6 | | 2.9 | | 3.1 | | 18.6 | | 16.1 | | 2.4 | | 4.2 | | 22.7 | |
Restructuring charges (c) | | 18.2 | | 1.5 | | 11.3 | | 31.0 | | — | | — | | — | | — | |
Vacation accrual adjustment (c) | | (5.4 | ) | (1.9 | ) | (0.4 | ) | (7.7 | ) | — | | — | | — | | — | |
Unrealized gain on derivative (d) | | — | | — | | (0.9 | ) | (0.9 | ) | — | | — | | — | | — | |
Management transition costs (d) | | — | | — | | 4.0 | | 4.0 | | — | | — | | 4.4 | | 4.4 | |
Loss on sale of swap derivative (d) | | — | | — | | — | | — | | — | | — | | 5.6 | | 5.6 | |
Sponsor termination fee (d) | | — | | — | | — | | — | | — | | — | | 15.0 | | 15.0 | |
Interest on HGH debt | | — | | — | | — | | — | | — | | — | | 16.1 | | 16.1 | |
Adjusted pre-tax income (loss) | | 125.0 | | 102.3 | | (74.8 | ) | 152.5 | | 113.2 | | 100.5 | | (81.2 | ) | 132.5 | |
Assumed (provision) benefit for income taxes of 35% | | (43.8 | ) | (35.8 | ) | 26.3 | | (53.3 | ) | (39.6 | ) | (35.2 | ) | 28.4 | | (46.4 | ) |
Minority interest | | — | | — | | (5.3 | ) | (5.3 | ) | — | | — | | (4.4 | ) | (4.4 | ) |
Adjusted net income (loss) | | $ | 81.2 | | $ | 66.5 | | $ | (53.8 | ) | $ | 93.9 | | $ | 73.6 | | $ | 65.3 | | $ | (57.2 | ) | $ | 81.7 | |
| | | | | | | | | | | | | | | | | |
Pro forma post-IPO diluted number of shares outstanding | | | | | | | | 324.8 | | | | | | | | 324.8 | |
| | | | | | | | | | | | | | | | | |
Adjusted diluted earnings per share | | | | | | | | $ | 0.29 | | | | | | | | $ | 0.25 | |
| | | | | | | | | | | | | | | | | |
| | Year Ended December 31, 2007 | | Year Ended December 31, 2006 | |
| | Car
Rental | | Equipment
Rental | | Corporate
and Other | | Total | | Car
Rental | | Equipment
Rental | | Corporate
and Other | | Total | |
Total revenues: | | $ | 6,920.6 | | $ | 1,755.9 | | $ | 9.1 | | $ | 8,685.6 | | $ | 6,378.0 | | $ | 1,672.6 | | $ | 7.8 | | $ | 8,058.4 | |
Expenses: | | | | | | | | | | | | | | | | | |
Direct operating and selling, general and administrative | | 4,319.8 | | 993.1 | | 107.1 | | 5,420.0 | | 4,100.8 | | 985.5 | | 113.6 | | 5,199.9 | |
Depreciation of revenue earning equipment | | 1,695.4 | | 308.0 | | — | | 2,003.4 | | 1,479.6 | | 277.6 | | — | | 1,757.2 | |
Interest, net of interest income | | 436.8 | | 146.3 | | 292.3 | | 875.4 | | 424.1 | | 140.0 | | 336.6 | | 900.7 | |
Total expenses | | 6,452.0 | | 1,447.4 | | 399.4 | | 8,298.8 | | 6,004.5 | | 1,403.1 | | 450.2 | | 7,857.8 | |
Income (loss) before income taxes and minority interest | | 468.6 | | 308.5 | | (390.3 | ) | 386.8 | | 373.5 | | 269.5 | | (442.4 | ) | 200.6 | |
Adjustments: | | | | | | | | | | | | | | | | | |
Purchase accounting (a): | | | | | | | | | | | | | | | | | |
Direct operating and selling, general and administrative | | 38.3 | | 35.3 | | 1.8 | | 75.4 | | 39.2 | | 35.5 | | 1.9 | | 76.6 | |
Depreciation of revenue earning equipment | | (3.0 | ) | 22.8 | | — | | 19.8 | | (15.4 | ) | 29.2 | | — | | 13.8 | |
Non-cash debt charges (b) | | 66.5 | | 11.2 | | 28.2 | | 105.9 | | 75.0 | | 11.3 | | 13.2 | | 99.5 | |
Restructuring charges (c) | | 64.5 | | 4.9 | | 27.0 | | 96.4 | | — | | — | | — | | — | |
Vacation accrual adjustment (c) | | (25.8 | ) | (8.9 | ) | (1.8 | ) | (36.5 | ) | — | | — | | — | | — | |
Unrealized gain on derivative (d) | | — | | — | | (4.1 | ) | (4.1 | ) | — | | — | | — | | — | |
Secondary offering costs (d) | | — | | — | | 2.0 | | 2.0 | | — | | — | | — | | — | |
Management transition costs (d) | | — | | — | | 15.0 | | 15.0 | | — | | — | | 9.8 | | 9.8 | |
Stock purchase compensation charge (d) | | — | | — | | — | | — | | — | | — | | 13.3 | | 13.3 | |
Gain on sale of swap derivative (d) | | — | | — | | — | | — | | — | | — | | (1.0 | ) | (1.0 | ) |
Sponsor termination fee (d) | | — | | — | | — | | — | | — | | — | | 15.0 | | 15.0 | |
Unrealized transaction loss on Euro-denominated debt (d) (e) | | — | | — | | — | | — | | — | | — | | 19.2 | | 19.2 | |
Interest on HGH debt | | — | | — | | — | | — | | — | | — | | 39.9 | | 39.9 | |
Adjusted pre-tax income (loss) | | 609.1 | | 373.8 | | (322.2 | ) | 660.7 | | 472.3 | | 345.5 | | (331.1 | ) | 486.7 | |
Assumed (provision) benefit for income taxes of 35% | | (213.2 | ) | (130.8 | ) | 112.8 | | (231.2 | ) | (165.3 | ) | (120.9 | ) | 115.9 | | (170.3 | ) |
Minority interest | | — | | — | | (19.7 | ) | (19.7 | ) | — | | — | | (16.7 | ) | (16.7 | ) |
Adjusted net income (loss) | | $ | 395.9 | | $ | 243.0 | | $ | (229.1 | ) | $ | 409.8 | | $ | 307.0 | | $ | 224.6 | | $ | (231.9 | ) | $ | 299.7 | |
| | | | | | | | | | | | | | | | | |
Pro forma post-IPO diluted number of shares outstanding | | | | | | | | 324.8 | | | | | | | | 324.8 | |
| | | | | | | | | | | | | | | | | |
Adjusted diluted earnings per share | | | | | | | | $ | 1.26 | | | | | | | | $ | 0.92 | |
(a) | | Includes the purchase accounting effects of the acquisition of all of Hertz’s common stock on December 21, 2005 and any subsequent acquisitions on our results of operations relating to increased depreciation and amortization of tangible and intangible assets and accretion of revalued workers’ compensation and public liability and property damage liabilities. |
(b) | | Non-cash debt charges represents the amortization of deferred debt financing costs and debt discounts. For the three months and year ended December 31, 2007, also includes $2.7 million and $20.4 million, respectively, associated with the ineffectiveness of our interest rates swaps and for the year ended December 31, 2007, includes the write off of $16.2 million of unamortized debt costs associated with a debt modification. For the year ended December 31, 2006, also includes $1.0 million associated with the reversal of the ineffectiveness of our interest rate swaps. |
(c) | | Amounts are included within direct operating and selling, general and administrative expense in our statement of operations. |
(d) | | Amounts are included within selling, general and administrative in our statement of operations. |
(e) | | Represents unrealized losses on currency translation of Euro-denominated debt, which are included within selling, general and administrative expense in our statement of operations. On October 1, 2006, we designated this Euro-denominated debt as an effective net investment hedge of our Euro-denominated net investment in our foreign operations, as such we will no longer incur unrealized exchange transaction gains or losses in our consolidated statement of operations. |
| HERTZ GLOBAL HOLDINGS, INC. | Table 6 |
RECONCILIATION OF GAAP TO NON-GAAP EARNINGS MEASURES
(In millions)
EBITDA, CORPORATE EBITDA, UNLEVERED PRE-TAX CASH FLOW,
LEVERED AFTER-TAX CASH FLOW BEFORE FLEET GROWTH AND AFTER FLEET GROWTH
| | Three Months Ended December 31, 2007 | | Three Months Ended December 31, 2006 | |
| | Car
Rental | | Equipment
Rental | | Corporate
and Other | | Total | | Car
Rental | | Equipment
Rental | | Corporate
and Other | | Total | |
| | | | | | | | | | | | | | | | | |
Income (loss) before income taxes and minority interest | | $ | 89.4 | | $ | 84.3 | | $ | (92.4 | ) | $ | 81.3 | | $ | 90.4 | | $ | 79.2 | | $ | (126.9 | ) | $ | 42.7 | |
Depreciation and amortization | | 454.9 | | 107.3 | | 1.1 | | 563.3 | | 414.5 | | 94.6 | | 1.3 | | 510.4 | |
Interest, net of interest income | | 108.2 | | 38.9 | | 67.0 | | 214.1 | | 100.9 | | 38.7 | | 88.5 | | 228.1 | |
Minority interest | | — | | — | | (5.3 | ) | (5.3 | ) | — | | — | | (4.4 | ) | (4.4 | ) |
EBITDA | | 652.5 | | 230.5 | | (29.6 | ) | 853.4 | | 605.8 | | 212.5 | | (41.5 | ) | 776.8 | |
Adjustments: | | | | | | | | | | | | | | | | | |
Car rental fleet interest | | (107.1 | ) | — | | — | | (107.1 | ) | (95.9 | ) | — | | — | | (95.9 | ) |
Car rental fleet depreciation | | (415.7 | ) | — | | — | | (415.7 | ) | (369.5 | ) | — | | — | | (369.5 | ) |
Non-cash expenses and charges (a) | | 12.8 | | 0.2 | | 14.3 | | 27.3 | | 17.1 | | (0.8 | ) | 12.7 | | 29.0 | |
Extraordinary, unusual or non-recurring gains and losses (b) | | 12.8 | | (0.4 | ) | 14.9 | | 27.3 | | — | | — | | 25.0 | | 25.0 | |
Sponsors’ fees | | — | | — | | — | | — | | — | | — | | 0.7 | | 0.7 | |
Corporate EBITDA | | $ | 155.3 | | $ | 230.3 | | $ | (0.4 | ) | 385.2 | | $ | 157.5 | | $ | 211.7 | | $ | (3.1 | ) | 366.1 | |
Equipment rental maintenance capital expenditures, net | | | | | | | | (78.7 | ) | | | | | | | (63.2 | ) |
Non-fleet capital expenditures, net | | | | | | | | (23.9 | ) | | | | | | | (33.6 | ) |
Changes in working capital | | | | | | | | 226.8 | | | | | | | | 100.6 | |
Changes in other assets and liabilities | | | | | | | | (84.1 | ) | | | | | | | (94.7 | ) |
Unlevered pre-tax cash flow (c) | | | | | | | | 425.3 | | | | | | | | 275.2 | |
Corporate net cash interest | | | | | | | | (99.3 | ) | | | | | | | (107.6 | ) |
Corporate cash taxes | | | | | | | | (9.9 | ) | | | | | | | (17.1 | ) |
Levered after-tax cash flow before fleet growth (c) | | | | | | | | 316.1 | | | | | | | | 150.5 | |
Equipment rental fleet growth capital expenditures | | | | | | | | 15.7 | | | | | | | | 74.5 | |
Car rental net fleet equity requirement | | | | | | | | 255.0 | | | | | | | | 163.3 | |
Levered after-tax cash flow after fleet growth (c) | | | | | | | | $ | 586.8 | | | | | | | | $ | 388.3 | |
| | | | | | | | | | | | | | | | | |
| | Year Ended December 31, 2007 | | Year Ended December 31, 2006 | |
| | Car
Rental | | Equipment
Rental | | Corporate
and Other | | Total | | Car
Rental | | Equipment
Rental | | Corporate
and Other | | Total | |
| | | | | | | | | | | | | | | | | |
Income (loss) before income taxes and minority interest | | $ | 468.6 | | $ | 308.5 | | $ | (390.3 | ) | $ | 386.8 | | $ | 373.5 | | $ | 269.5 | | $ | (442.4 | ) | $ | 200.6 | |
Depreciation and amortization | | 1,856.6 | | 380.6 | | 5.9 | | 2,243.1 | | 1,659.9 | | 350.3 | | 5.9 | | 2,016.1 | |
Interest, net of interest income | | 436.8 | | 146.3 | | 292.3 | | 875.4 | | 424.1 | | 140.0 | | 336.6 | | 900.7 | |
Minority interest | | — | | — | | (19.7 | ) | (19.7 | ) | — | | — | | (16.7 | ) | (16.7 | ) |
EBITDA | | 2,762.0 | | 835.4 | | (111.8 | ) | 3,485.6 | | 2,457.5 | | 759.8 | | (116.6 | ) | 3,100.7 | |
Adjustments: | | | | | | | | | | | | | | | | | |
Car rental fleet interest | | (427.8 | ) | — | | — | | (427.8 | ) | (400.0 | ) | — | | — | | (400.0 | ) |
Car rental fleet depreciation | | (1,695.4 | ) | — | | — | | (1,695.4 | ) | (1,479.6 | ) | — | | — | | (1,479.6 | ) |
Non-cash expenses and charges (a) | | 64.2 | | 2.7 | | 35.3 | | 102.2 | | 73.0 | | (0.4 | ) | 58.0 | | 130.6 | |
Extraordinary, unusual or non-recurring gains and losses (b) | | 38.7 | | (4.0 | ) | 42.2 | | 76.9 | | — | | — | | 23.8 | | 23.8 | |
Sponsors’ fees | | — | | — | | — | | — | | — | | — | | 3.2 | | 3.2 | |
Corporate EBITDA | | $ | 741.7 | | $ | 834.1 | | $ | (34.3 | ) | 1,541.5 | | $ | 650.9 | | $ | 759.4 | | $ | (31.6 | ) | 1,378.7 | |
Equipment rental maintenance capital expenditures, net | | | | | | | | (272.8 | ) | | | | | | | (236.5 | ) |
Non-fleet capital expenditures, net | | | | | | | | (154.6 | ) | | | | | | | (175.3 | ) |
Changes in working capital | | | | | | | | 283.6 | | | | | | | | 15.3 | |
Changes in other assets and liabilities | | | | | | | | (127.5 | ) | | | | | | | (87.4 | ) |
Unlevered pre-tax cash flow (c) | | | | | | | | 1,270.2 | | | | | | | | 894.8 | |
Corporate net cash interest | | | | | | | | (399.6 | ) | | | | | | | (430.3 | ) |
Corporate cash taxes | | | | | | | | (28.3 | ) | | | | | | | (33.6 | ) |
Levered after-tax cash flow before fleet growth (c) | | | | | | | | 842.3 | | | | | | | | 430.9 | |
Equipment rental fleet growth capital expenditures | | | | | | | | (281.8 | ) | | | | | | | (392.9 | ) |
Car rental net fleet equity requirement | | | | | | | | (7.9 | ) | | | | | | | 246.2 | |
Levered after-tax cash flow after fleet growth (c) | | | | | | | | $ | 552.6 | | | | | | | | $ | 284.2 | |
Table 6 (pg. 2)
(a) | | As defined in the credit agreements for the senior credit facilities, Corporate EBITDA excludes the impact of certain non-cash expenses and charges. The adjustments reflect the following: |
| | Three Months Ended December 31, 2007 | | Three Months Ended December 31, 2006 | |
Non-Cash Expenses and Charges
| | Car
Rental | | Equipment
Rental | | Corporate
and Other | | Total | | Car
Rental | | Equipment
Rental | | Corporate
and Other | | Total | |
| | | | | | | | | | | | | | | | | |
Non-cash amortization of debt costs included in car rental fleet interest | | $ | 12.2 | | $ | — | | $ | — | | $ | 12.2 | | $ | 14.8 | | $ | — | | $ | — | | $ | 14.8 | |
Non-cash stock-based employee compensation charges | | — | | — | | 6.0 | | 6.0 | | — | | — | | 6.3 | | 6.3 | |
Non-cash charges for workers’ compensation | | 0.6 | | 0.2 | | — | | 0.8 | | 2.3 | | (0.8 | ) | — | | 1.5 | |
Non-cash charges for pension | | — | | — | | 9.2 | | 9.2 | | — | | — | | 6.4 | | 6.4 | |
Unrealized gain on derivatives | | — | | — | | (0.9 | ) | (0.9 | ) | — | | — | | — | | — | |
Total non-cash expenses and charges | | $ | 12.8 | | $ | 0.2 | | $ | 14.3 | | $ | 27.3 | | $ | 17.1 | | $ | (0.8 | ) | $ | 12.7 | | $ | 29.0 | |
| | | | | | | | | | | | | | | | | |
| | | | | | | | | | | | | | | | | |
| | | | | | | | | | | | | | | | | |
| | Year Ended December 31, 2007 | | Year Ended December 31, 2006 | |
| | Car
Rental | | Equipment
Rental | | Corporate
and Other | | Total | | Car
Rental | | Equipment
Rental | | Corporate
and Other | | Total | |
| | | | | | | | | | | | | | | | | |
Non-cash amortization of debt costs included in car rental fleet interest | | $ | 64.4 | | $ | — | | $ | — | | $ | 64.4 | | $ | 71.6 | | $ | — | | $ | — | | $ | 71.6 | |
Non-cash stock-based employee compensation charges | | — | | — | | 26.8 | | 26.8 | | — | | — | | 27.2 | | 27.2 | |
Non-cash charges for workers’ compensation | | (0.2 | ) | 2.7 | | 0.1 | | 2.6 | | 1.4 | | (0.4 | ) | — | | 1.0 | |
Non-cash charges for pension | | — | | — | | 12.2 | | 12.2 | | — | | — | | 9.1 | | 9.1 | |
Unrealized (gain) loss on derivatives | | — | | — | | (3.8 | ) | (3.8 | ) | — | | — | | 2.5 | | 2.5 | |
Unrealized transaction loss on Euro-denominated debt | | — | | — | | — | | — | | — | | — | | 19.2 | | 19.2 | |
Total non-cash expenses and charges | | $ | 64.2 | | $ | 2.7 | | $ | 35.3 | | $ | 102.2 | | $ | 73.0 | | $ | (0.4 | ) | $ | 58.0 | | $ | 130.6 | |
(b) | | As defined in the credit agreements for the senior credit facilities, Corporate EBITDA excludes the impact of extraordinary, unusual or non-recurring gains or losses or charges or credits. The adjustments reflect the following: |
| | Three Months Ended December 31, 2007 | | Three Months Ended December 31, 2006 | |
Extraordinary, Unusual or Non-Recurring Items | | Car
Rental | | Equipment
Rental | | Corporate
and Other | | Total | | Car
Rental | | Equipment
Rental | | Corporate
and Other | | Total | |
| | | | | | | | | | | | | | | | | |
Restructuring charges | | $ | 18.2 | | $ | 1.5 | | $ | 11.3 | | $ | 31.0 | | $ | — | | $ | — | | $ | — | | $ | — | |
Vacation accrual adjustment | | (5.4 | ) | (1.9 | ) | (0.4 | ) | (7.7 | ) | — | | — | | — | | — | |
Management transition costs | | — | | — | | 4.0 | | 4.0 | | — | | — | | 4.4 | | 4.4 | |
Loss on sale of swap derivative | | — | | — | | — | | — | | — | | — | | 5.6 | | 5.6 | |
Sponsor fee termination costs | | — | | — | | — | | — | | — | | — | | 15.0 | | 15.0 | |
Total extraordinary, unusual or non-recurring items | | $ | 12.8 | | $ | (0.4 | ) | $ | 14.9 | | $ | 27.3 | | $ | — | | $ | — | | $ | 25.0 | | $ | 25.0 | |
| | | | | | | | | | | | | | | | | |
| | | | | | | | | | | | | | | | | |
| | | | | | | | | | | | | | | | | |
| | Year Ended December 31, 2007 | | Year Ended December 31, 2006 | |
| | Car
Rental | | Equipment
Rental | | Corporate
and Other | | Total | | Car
Rental | | Equipment
Rental | | Corporate
and Other | | Total | |
| | | | | | | | | | | | | | | | | |
Restructuring charges | | $ | 64.5 | | $ | 4.9 | | $ | 27.0 | | $ | 96.4 | | $ | — | | $ | — | | $ | — | | $ | — | |
Vacation accrual adjustment | | (25.8 | ) | (8.9 | ) | (1.8 | ) | (36.5 | ) | — | | — | | — | | — | |
Secondary offering costs | | — | | — | | 2.0 | | 2.0 | | — | | — | | — | | — | |
Management transition costs | | — | | — | | 15.0 | | 15.0 | | — | | — | | 9.8 | | 9.8 | |
Gain on sale of swap derivative | | — | | — | | — | | — | | — | | — | | (1.0 | ) | (1.0 | ) |
Sponsor fee termination costs | | — | | — | | — | | — | | — | | — | | 15.0 | | 15.0 | |
Total extraordinary, unusual or non-recurring items | | $ | 38.7 | | $ | (4.0 | ) | $ | 42.2 | | $ | 76.9 | | $ | — | | $ | — | | $ | 23.8 | | $ | 23.8 | |
(c) | | Amounts include the effect of fluctuations in foreign currency. |
Table 7
HERTZ GLOBAL HOLDINGS, INC.
RECONCILIATION OF NON-GAAP EARNINGS MEASURES
(In millions)
Reconciliation from Adjusted Pre-Tax Income (Loss) to Corporate EBITDA
| | Three Months Ended December 31, 2007 | | Three Months Ended December 31, 2006 | |
| | Car | | Equipment | | Corporate | | | | Car | | Equipment | | Corporate | | | |
| | Rental | | Rental | | and Other | | Total | | Rental | | Rental | | and Other | | Total | |
Adjusted pre-tax income
(loss) (a) | | $ | 125.0 | | $ | 102.3 | | $ | (74.8 | ) | $ | 152.5 | | $ | 113.2 | | $ | 100.5 | | $ | (81.2 | ) | $ | 132.5 | |
Depreciation of property and equipment | | 31.0 | | 10.6 | | 1.1 | | 42.7 | | 37.5 | | 10.4 | | 1.3 | | 49.2 | |
Amortization of other intangible assets | | 8.2 | | 7.9 | | — | | 16.1 | | 7.5 | | 7.9 | | — | | 15.4 | |
Equipment rental fleet depreciation | | — | | 88.8 | | — | | 88.8 | | — | | 76.3 | | — | | 76.3 | |
Interest, net of interest income | | 108.2 | | 38.9 | | 67.0 | | 214.1 | | 100.9 | | 38.7 | | 88.5 | | 228.1 | |
Interest on HGH debt | | — | | — | | — | | — | | — | | — | | (16.1 | ) | (16.1 | ) |
Car rental fleet interest | | (107.1 | ) | — | | — | | (107.1 | ) | (95.9 | ) | — | | — | | (95.9 | ) |
Non-cash debt charges | | (12.6 | ) | (2.9 | ) | (3.1 | ) | (18.6 | ) | (16.1 | ) | (2.4 | ) | (4.2 | ) | (22.7 | ) |
Non-cash amortization of debt costs included in car rental fleet interest | | 12.2 | | — | | — | | 12.2 | | 14.8 | | — | | — | | 14.8 | |
Purchase accounting | | (10.2 | ) | (15.5 | ) | (0.5 | ) | (26.2 | ) | (6.7 | ) | (18.9 | ) | (0.4 | ) | (26.0 | ) |
Non-cash stock-based employee compensation charges | | — | | — | | 6.0 | | 6.0 | | — | | — | | 6.3 | | 6.3 | |
Non-cash charges for workers’ compensation | | 0.6 | | 0.2 | | — | | 0.8 | | 2.3 | | (0.8 | ) | — | | 1.5 | |
Non-cash charges for pension | | — | | — | | 9.2 | | 9.2 | | — | | — | | 6.4 | | 6.4 | |
Sponsors’ fees | | — | | — | | — | | — | | — | | — | | 0.7 | | 0.7 | |
Minority interest | | — | | — | | (5.3 | ) | (5.3 | ) | — | | — | | (4.4 | ) | (4.4 | ) |
Corporate EBITDA (a) | | $ | 155.3 | | $ | 230.3 | | $ | (0.4 | ) | $ | 385.2 | | $ | 157.5 | | $ | 211.7 | | $ | (3.1 | ) | $ | 366.1 | |
| | | | | | | | | | | | | | | | | |
| | Year Ended December 31, 2007 | | Year Ended December 31, 2006 | |
| | Car | | Equipment | | Corporate | | | | Car | | Equipment | | Corporate | | | |
| | Rental | | Rental | | and Other | | Total | | Rental | | Rental | | and Other | | Total | |
Adjusted pre-tax income
(loss) (a) | | $ | 609.1 | | $ | 373.8 | | $ | (322.2 | ) | $ | 660.7 | | $ | 472.3 | | $ | 345.5 | | $ | (331.1 | ) | $ | 486.7 | |
Depreciation of property and equipment | | 130.8 | | 40.4 | | 5.9 | | 177.1 | | 150.8 | | 40.5 | | 5.9 | | 197.2 | |
Amortization of other intangible assets | | 30.4 | | 32.2 | | — | | 62.6 | | 29.5 | | 32.2 | | — | | 61.7 | |
Equipment rental fleet depreciation | | — | | 308.0 | | — | | 308.0 | | — | | 277.6 | | — | | 277.6 | |
Interest, net of interest income | | 436.8 | | 146.3 | | 292.3 | | 875.4 | | 424.1 | | 140.0 | | 336.6 | | 900.7 | |
Interest on HGH debt | | — | | — | | — | | — | | — | | — | | (39.9 | ) | (39.9 | ) |
Car rental fleet interest | | (427.8 | ) | — | | — | | (427.8 | ) | (400.0 | ) | — | | — | | (400.0 | ) |
Non-cash debt charges | | (66.5 | ) | (11.2 | ) | (28.2 | ) | (105.9 | ) | (75.0 | ) | (11.3 | ) | (13.2 | ) | (99.5 | ) |
Non-cash amortization of debt costs included in car rental fleet interest | | | | | | | | | | | | | | | | | |
| 64.4 | | — | | — | | 64.4 | | 71.6 | | — | | — | | 71.6 | |
Purchase accounting | | (35.3 | ) | (58.1 | ) | (1.8 | ) | (95.2 | ) | (23.8 | ) | (64.7 | ) | (1.9 | ) | (90.4 | ) |
Stock purchase compensation charge | | — | | — | | — | | — | | — | | — | | (13.3 | ) | (13.3 | ) |
Non-cash stock-based employee compensation charges | | — | | — | | 26.8 | | 26.8 | | — | | — | | 27.2 | | 27.2 | |
Non-cash charges for workers’ compensation | | (0.2 | ) | 2.7 | | 0.1 | | 2.6 | | 1.4 | | (0.4 | ) | — | | 1.0 | |
Non-cash charges for pension | | — | | — | | 12.2 | | 12.2 | | — | | — | | 9.1 | | 9.1 | |
Unrealized loss on derivatives | | — | | — | | 0.3 | | 0.3 | | — | | — | | 2.5 | | 2.5 | |
Sponsors’ fees | | — | | — | | — | | — | | — | | — | | 3.2 | | 3.2 | |
Minority interest | | — | | — | | (19.7 | ) | (19.7 | ) | — | | — | | (16.7 | ) | (16.7 | ) |
Corporate EBITDA (a) | | $ | 741.7 | | $ | 834.1 | | $ | (34.3 | ) | $ | 1,541.5 | | $ | 650.9 | | $ | 759.4 | | $ | (31.6 | ) | $ | 1,378.7 | |
| | | | | | | | | | | | | | | | | |
(a) Represents a non-GAAP measure, see the accompanying reconciliations and definitions. | |
Table 8
HERTZ GLOBAL HOLDINGS, INC.
RECONCILIATION OF GAAP TO NON-GAAP EARNINGS MEASURES
(In millions, except as noted)
| | Three Months Ended | | Year Ended | |
Reconciliation from Operating Cash Flows | | December 31, | | December 31, | |
to EBITDA: | | 2007 | | 2006 | | 2007 | | 2006 | |
| | | | | | | | | |
Net cash provided by operating activities * | | $ | 881.0 | | $ | 407.9 | | $ | 3,089.5 | | $ | 2,604.8 | |
Amortization of debt and debt modification costs | | (15.8 | ) | (27.0 | ) | (85.3 | ) | (105.0 | ) |
Provision for losses on doubtful accounts | | (3.5 | ) | (3.4 | ) | (13.9 | ) | (17.1 | ) |
Unrealized gain (loss) on derivatives | | 0.9 | | 0.4 | | 3.9 | | (2.5 | ) |
Unrealized transaction loss on Euro-denominated debt | | — | | — | | — | | (19.2 | ) |
(Loss) gain on ineffectiveness of interest rate swaps | | (2.7 | ) | — | | (20.4 | ) | 1.0 | |
Stock-based employee compensation | | (8.6 | ) | (6.3 | ) | (32.9 | ) | (27.2 | ) |
Minority interest | | (5.3 | ) | (4.4 | ) | (19.7 | ) | (16.7 | ) |
Deferred income taxes | | (8.3 | ) | 30.7 | | (66.4 | ) | (30.3 | ) |
Gain on sale of property | | 10.4 | | 3.7 | | 24.8 | | 9.7 | |
(Benefit) provision for taxes on income | | (4.7 | ) | (1.5 | ) | 102.6 | | 68.0 | |
Interest, net of interest income | | 214.1 | | 228.1 | | 875.4 | | 900.7 | |
Net changes in assets and liabilities ** | | (204.1 | ) | 148.6 | | (372.0 | ) | (265.5 | ) |
EBITDA | | $ | 853.4 | | $ | 776.8 | | $ | 3,485.6 | | $ | 3,100.7 | |
* | | Revised from $878.1 million and $3,086.6 million for the three months and year ended December 31, 2007, respectively. |
** | | Revised from $201.2 million and $369.1 million for the three months and year ended December 31, 2007, respectively. |
| | | | | | | | | |
| | December 31, | | December 31, | | | | | |
Net Corporate Debt & Net Fleet Debt | | 2007 | | 2006 | | | | | |
| | | | | | | | | |
Corporate Debt | | | | | | | | | |
Debt, less: | | $ | 11,960.1 | | $ | 12,276.2 | | | | | |
U.S. Fleet Debt and Pre-Acquisition Notes | | 4,603.5 | | 4,845.2 | | | | | |
International Fleet Debt | | 1,912.4 | | 1,987.8 | | | | | |
U.K. Leveraged Financing | | 222.7 | | — | | | | | |
Fleet Financing Facility | | 170.4 | | 165.9 | | | | | |
Canadian Fleet Financing Facility | | 155.4 | | — | | | | | |
Other International Facilities | | 92.9 | | — | | | | | |
Fleet Debt | | $ | 7,157.3 | | $ | 6,998.9 | | | | | |
Corporate Debt | | $ | 4,802.8 | | $ | 5,277.3 | | | | | |
| | | | | | | | | |
Corporate Restricted Cash | | | | | | | | | |
Restricted Cash, less: | | $ | 661.0 | | $ | 552.5 | | | | | |
Restricted Cash Associated with Fleet Debt | | (573.1 | ) | (487.0 | ) | | | | |
Corporate Restricted Cash | | $ | 87.9 | | $ | 65.5 | | | | | |
| | | | | | | | | |
Net Corporate Debt | | | | | | | | | |
Corporate Debt, less: | | $ | 4,802.8 | | $ | 5,277.3 | | | | | |
Cash and Equivalents | | (730.2 | ) | (674.5 | ) | | | | |
Corporate Restricted Cash | | (87.9 | ) | (65.5 | ) | | | | |
Net Corporate Debt | | $ | 3,984.7 | | $ | 4,537.3 | | | | | |
| | | | | | | | | |
Net Fleet Debt | | | | | | | | | |
Fleet Debt, less: | | $ | 7,157.3 | | $ | 6,998.9 | | | | | |
Restricted Cash Associated with Fleet Debt | | (573.1 | ) | (487.0 | ) | | | | |
Net Fleet Debt | | $ | 6,584.2 | | $ | 6,511.9 | | | | | |
| | | | | | | | | |
| | Three Months Ended | | Year Ended | |
| | December 31, | | December 31, | |
Car rental rate revenue per transaction day (a) | | 2007 | | 2006 | | 2007 | | 2006 | |
| | | | | | | | | |
Car rental revenue per statement of operations (b) | | $ | 1,639.5 | | $ | 1,528.0 | | $ | 6,800.7 | | $ | 6,273.6 | |
Non-rental rate revenue (c) | | (229.0 | ) | (209.3 | ) | (938.1 | ) | (860.6 | ) |
Foreign currency adjustment | | (53.0 | ) | 7.4 | | (100.8 | ) | 76.7 | |
Rental rate revenue | | $ | 1,357.5 | | $ | 1,326.1 | | $ | 5,761.8 | | $ | 5,489.7 | |
Transactions days (in thousands) | | 30,998 | | 29,591 | | 129,353 | | 123,251 | |
Rental rate revenue per transaction
day (in whole dollars) | | | | | | | | | |
| $ | 43.79 | | $ | 44.81 | | $ | 44.54 | | $ | 44.54 | |
| | | | | | | | | |
| | Three Months Ended | | Year Ended | |
| | December 31, | | December 31, | |
Equipment rental and rental related revenue (a) | | 2007 | | 2006 | | 2007 | | 2006 | |
| | | | | | | | | |
Equipment rental revenue per statement
of operations | | | | | | | | | |
| $ | 467.9 | | $ | 435.9 | | $ | 1,755.3 | | $ | 1,672.1 | |
Equipment sales and other revenue | | (49.5 | ) | (46.3 | ) | (190.2 | ) | (193.6 | ) |
Foreign currency adjustment | | (15.8 | ) | (0.7 | ) | (27.9 | ) | 1.3 | |
Rental and rental related revenue | | $ | 402.6 | | $ | 388.9 | | $ | 1,537.2 | | $ | 1,479.8 | |
| | | | | | | | | |
| | | | | | | | | |
(a) | | Based on 12/31/06 foreign exchange rates. |
(b) | | Consists of U.S. off-airport revenues of $229.8 million and $218.6 million for the three months ended December 31, 2007 and 2006, respectively, and $962.0 million and $890.1 million for the years ended December 31, 2007 and 2006, respectively. |
(c) | | Consists of domestic revenues of $160.0 million and $144.6 million and international revenues of $69.0 million and $64.7 million for the three months ended December 31, 2007 and 2006, respectively, and domestic revenues of $655.9 million and $588.0 million and international revenues of $282.2 million and $272.6 million for the years ended December 31, 2007 and 2006, respectively. |