Exhibit 99.1

| 2Q 2012 Earnings Call July 31, 2012 10:00 am ET Dial in: (866) 269-9612 (US) (612) 332-0345 (International) Passcode: 253851 Replay available until August 14: (800) 475-6701 U.S.; (320) 365-3844 international passcode: 253851 |

| Safe Harbor Statement Certain statements made within this presentation contain forward-looking statements, within the meaning of the Private Securities Litigation Reform Act of 1995. Forward-looking statements are not guarantees of performance and by their nature are subject to inherent uncertainties. Actual results may differ materially. Any forward-looking information relayed in this presentation speaks only as of July 31, 2012, and the Company undertakes no obligation to update that information to reflect changed circumstances. Additional information concerning these statements is contained in the Company’s press release regarding its Second Quarter 2012 results issued on July 30, 2012, and the Risk Factors and Forward-Looking Statements sections of the Company’s 2011 Form 10-K and Quarterly Reports on Form 10-Q. Copies of these filings are available from the SEC, the Hertz web site or the Company’s Investor Relations Department. |
| Definitions and reconciliations of these non-GAAP measures are provided at the end of the presentation. The following non-GAAP measures will be used in the presentation: Non-GAAP Measures EBITDA Corporate EBITDA Adjusted Pre-Tax Income Adjusted Net Income Adjusted Diluted Earnings Per Share (Adjusted EPS) Net Corporate Debt Net Fleet Debt Total Net Debt Adjusted Interest Expense Adjusted Direct Operating Expense Adjusted Selling, General and Administrative Adjusted Depreciation of Revenue Earning Equipment Levered After-Tax Cash-Flow Before Fleet Growth Corporate Cash Flow |

| Q2:12 Drivers Mark Frissora, Chairman and CEO Q2:12 Financial Overview Elyse Douglas, Executive VP and CFO 2012 Outlook & Residual Values Mark Frissora, Chairman and CEO Questions & Answers Session Today’s Agenda |

| Opening Comments |
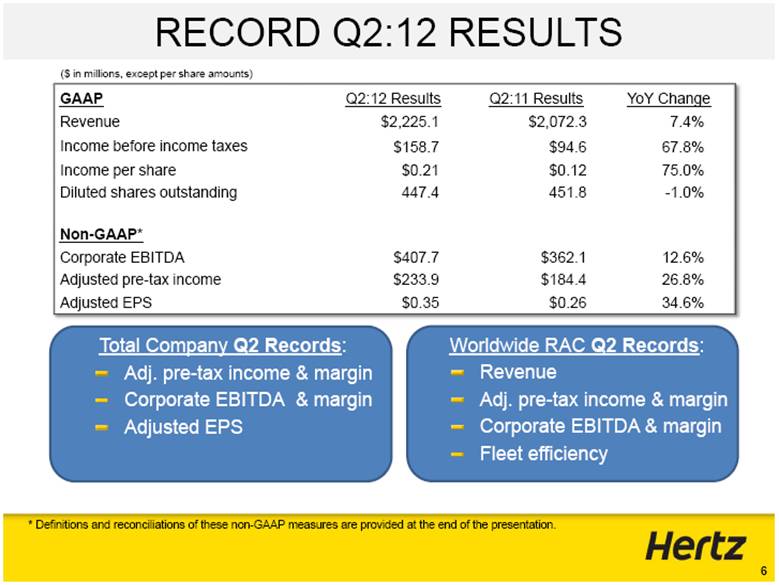
| RECORD Q2:12 RESULTS * Definitions and reconciliations of these non-GAAP measures are provided at the end of the presentation. GAAP Q2:12 Results Q2:11 Results YoY Change Revenue $2,225.1 $2,072.3 7.4% Income before income taxes $158.7 $94.6 67.8% Income per share $0.21 $0.12 75.0% Diluted shares outstanding 447.4 451.8 -1.0% Non-GAAP* Corporate EBITDA $407.7 $362.1 12.6% Adjusted pre-tax income $233.9 $184.4 26.8% Adjusted EPS $0.35 $0.26 34.6% Total Company Q2 Records: Adj. pre-tax income & margin Corporate EBITDA & margin Adjusted EPS ($ in millions, except per share amounts) Worldwide RAC Q2 Records: Revenue Adj. pre-tax income & margin Corporate EBITDA & margin Fleet efficiency |
| Profit Stability Strategic Offsets to Global Volatility Q2:2012 Examples Fleet leasing (multi-year contracts) Donlen revenue +16.9% YoY (on a pro forma basis) RAC entry into emerging markets Brazil / China revenue +23.3% excl. FX Insurance replacement rentals Volume +19.2% (U.S. RAC) Value brand to complement premium brand Advantage U.S. volume +48%; pre-tax margin +920 bps Technology & Innovation ExpressRent kiosks reduce labor Lean/Six Sigma Process Actions Run rate ahead of $350M annual savings target |
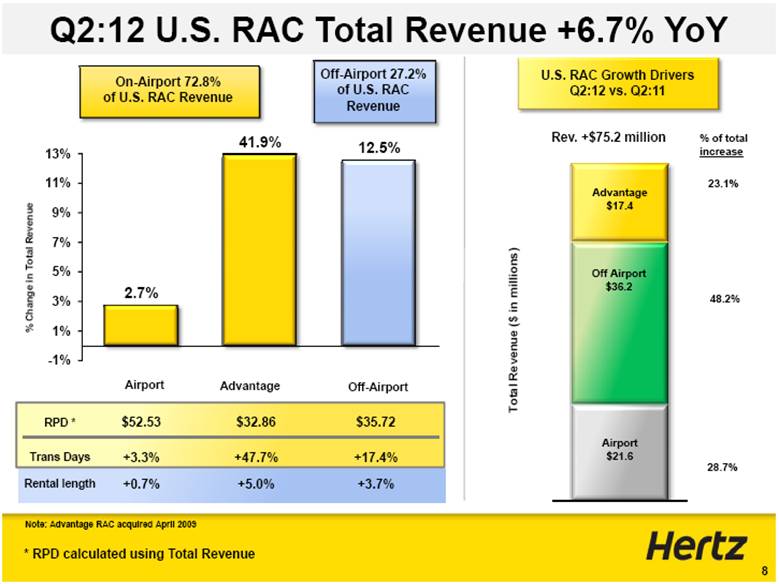
| Q2:12 U.S. RAC Total Revenue +6.7% YoY Rev. +$75.2 million Total Revenue ($ in millions) 23.1% 48.2% 28.7% % of total increase Airport Advantage Off-Airport % Change in Total Revenue On-Airport 72.8% of U.S. RAC Revenue Off-Airport 27.2% of U.S. RAC Revenue RPD * $52.53 $32.86 $35.72 Trans Days +3.3% +47.7% +17.4% Rental length +0.7% +5.0% +3.7% U.S. RAC Growth Drivers Q2:12 vs. Q2:11 Note: Advantage RAC acquired April 2009 Advantage $17.4 Off Airport $36.2 Airport $21.6 * RPD calculated using Total Revenue |
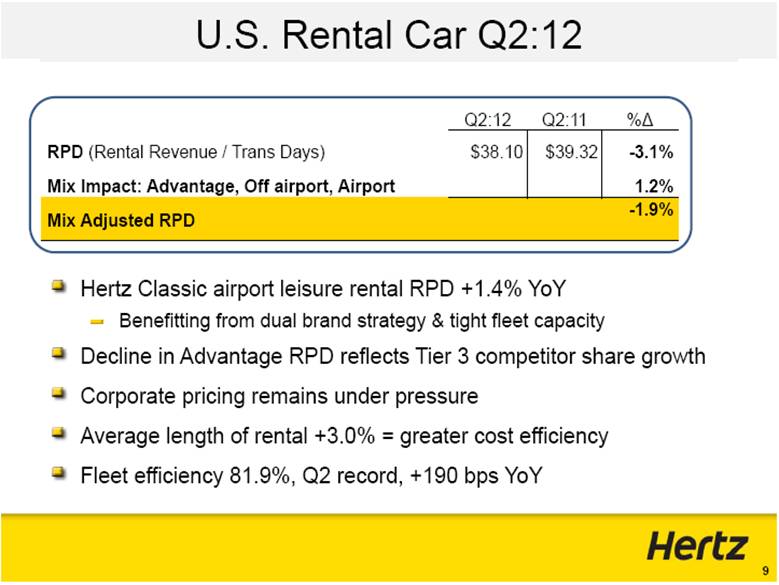
| U.S. Rental Car Q2:12 Hertz Classic airport leisure rental RPD +1.4% YoY Benefitting from dual brand strategy & tight fleet capacity Decline in Advantage RPD reflects Tier 3 competitor share growth Corporate pricing remains under pressure Average length of rental +3.0% = greater cost efficiency Fleet efficiency 81.9%, Q2 record, +190 bps YoY |

| U.S. RAC Monthly Depreciation p/Unit Annual rates Quarterly rates Adjusted pre-tax income +~20%; margin +210 bps YoY Top line leverage 180 bps reduction in operating expense margin (DOE & SG&A) Monthly net depreciation per unit down 2.9% (excl. Donlen) |
| U.S. RAC Shift to More Profitable Channels Channel YoY Retail / Rent2Buy +6pts Dealer Direct +4 pts Wholesale Auction -7 pts Online Auction -3 pts Q2:12 |
| Q2:12 Advantage Performance Update U.S. revenue up 41.9%, 31% on same-store basis (stores open >12 mos.) U.S. adjusted pre-tax margin 920 basis-point expansion U.S. fleet efficiency +590 bps YoY Average rental length 5% greater YoY Adj. direct operating and SG&A expense margin down 910 bps Lower monthly depreciation per unit Worldwide opened 8 locations in quarter (1 U.S. and 7 European) Worldwide: 96 Advantage rental car locations and 15 affiliates |
| Non-North America Rental Car Q2:12 Europe rental car Q2:12 7.2% adj. pre-tax margin Operating expenses 8% lower YoY Fleet efficiency +~1%; Fleet down 3.1% Residual values continue to decline Transactions flat YoY Transaction days down 2% RPD down 3.5% excluding FX Excl. Advantage, RPD down 1.6% excluding FX International (non-North America) Q2:12 results Europe, Australia, Brazil, New Zealand, Puerto Rico, China Transaction days flat YoY Revenue down 2.4% excluding FX RPD down 3.3% excluding FX |

| Equipment Rental (HERC) Q2:12 WW rental rate revenue excl. FX +14.3% YoY N.A. revenue +15.2% U.S. revenue +18.8% WW volume +12.6%; N.A. volume +13.5%; U.S. + 12.3% WW pricing +3.6% YoY N.A. pricing +4.2% National Account base grows to 56% of N.A. rental rate revenue N.A. local account pricing +9.4% U.S. pricing +5.8% N.A. dollar utilization +230bps N.A. time utilization +430bps, reflecting sequential monthly improvements Corporate EBITDA +12.1%; excl. FX +14.2% Note: pricing and volume data exclude Cinelease due to the nature of the business |

| Elyse Douglas CFO Financial Results Cash Flow Review Balance Sheet Review |
| Consolidated Results Q2:12 Q2:11 % var Car rental $1,889.6 $1,768.8 6.8% Equipment rental 335.0 301.7 11.0% Other reconciling items 0.5 1.8 -72.2% Consolidated revenue $2,225.1 $2,072.3 7.4% Consolidated adj. pre-tax 233.9 184.4 26.8% Consolidated adj. earnings per share 0.35 0.26 34.6% GAAP consol. income before taxes 158.7 94.6 67.8% GAAP consol. earnings per share 0.21 0.12 75.0% |
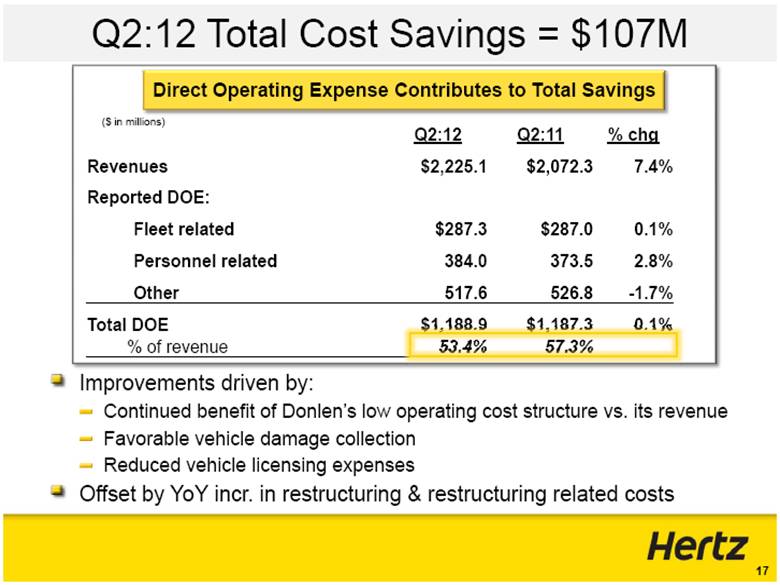
| Q2:12 Total Cost Savings = $107M ($ in millions) Q2:12 Q2:11 % chg Revenues $2,225.1 $2,072.3 7.4% Reported DOE: Fleet related $287.3 $287.0 0.1% Personnel related 384.0 373.5 2.8% Other 517.6 526.8 -1.7% Total DOE $1,188.9 $1,187.3 0.1% % of revenue 53.4% 57.3% Improvements driven by: Continued benefit of Donlen’s low operating cost structure vs. its revenue Favorable vehicle damage collection Reduced vehicle licensing expenses Offset by YoY incr. in restructuring & restructuring related costs Direct Operating Expense Contributes to Total Savings |
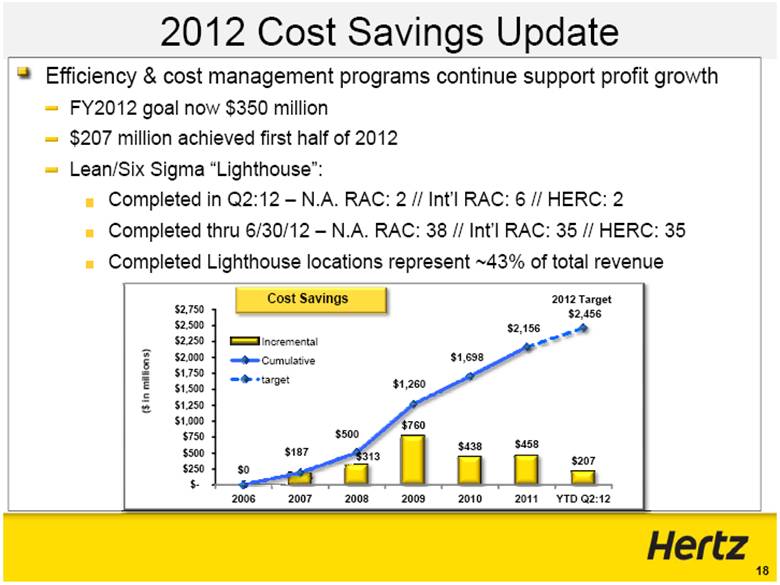
| 2012 Cost Savings Update Efficiency & cost management programs continue support profit growth FY2012 goal now $350 million $207 million achieved first half of 2012 Lean/Six Sigma “Lighthouse”: Completed in Q2:12 – N.A. RAC: 2 // Int’l RAC: 6 // HERC: 2 Completed thru 6/30/12 – N.A. RAC: 38 // Int’l RAC: 35 // HERC: 35 Completed Lighthouse locations represent ~43% of total revenue Cost Savings |
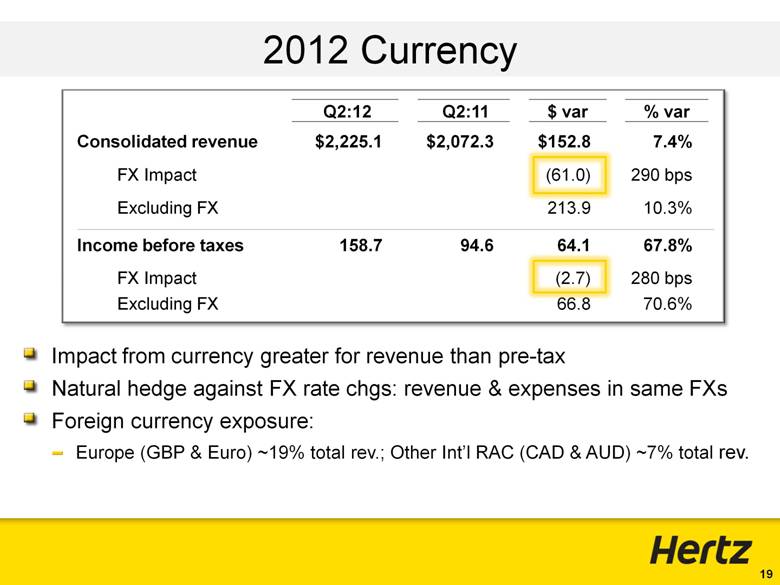
| 2012 Currency Impact from currency greater for revenue than pre-tax Natural hedge against FX rate chgs: revenue & expenses in same FXs Foreign currency exposure: Europe (GBP & Euro) ~19% total rev.; Other Int’l RAC (CAD & AUD) ~7% total rev. Q2:12 Q2:11 $ var % var Consolidated revenue $2,225.1 $2,072.3 $152.8 7.4% FX Impact (61.0) 290 bps Excluding FX 213.9 10.3% Income before taxes 158.7 94.6 64.1 67.8% FX Impact (2.7) 280 bps Excluding FX 66.8 70.6% |
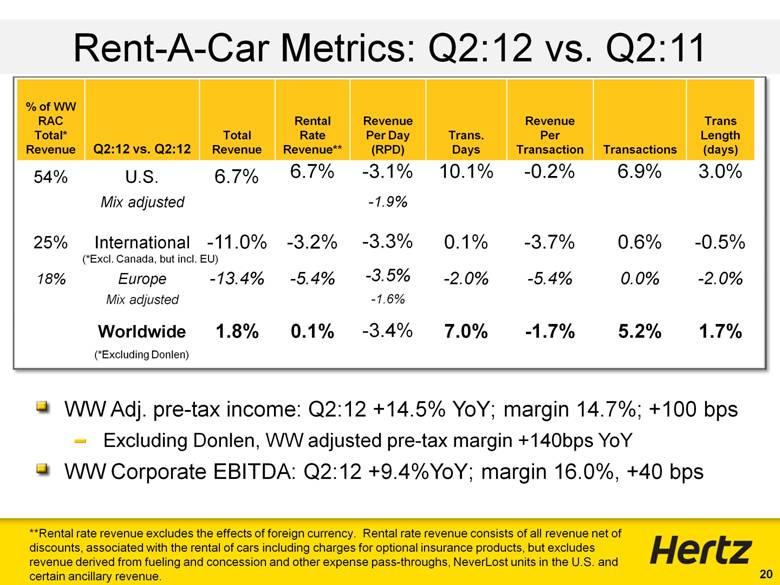
| Rent-A-Car Metrics: Q2:12 vs. Q2:11 % of WW RAC Total* Revenue Q2:12 vs. Q2:12 Total Revenue Rental Rate Revenue** Revenue Per Day (RPD) Trans. Days Revenue Per Transaction Transactions Trans Length (days) 54% U.S. 6.7% 6.7% -3.1% 10.1% -0.2% 6.9% 3.0% Mix adjusted -1.9% 25% International -11.0% -3.2% -3.3% 0.1% -3.7% 0.6% -0.5% 18% Europe -13.4% -5.4% -3.5% -2.0% -5.4% 0.0% -2.0% Mix adjusted -1.6% Worldwide 1.8% 0.1% -3.4% 7.0% -1.7% 5.2% 1.7% **Rental rate revenue excludes the effects of foreign currency. Rental rate revenue consists of all revenue net of discounts, associated with the rental of cars including charges for optional insurance products, but excludes revenue derived from fueling and concession and other expense pass-throughs, NeverLost units in the U.S. and certain ancillary revenue. WW Adj. pre-tax income: Q2:12 +14.5% YoY; margin 14.7%; +100 bps Excluding Donlen, WW adjusted pre-tax margin +140bps YoY WW Corporate EBITDA: Q2:12 +9.4%YoY; margin 16.0%, +40 bps (*Excluding Donlen) (*Excl. Canada, but incl. EU) |
| Worldwide Rent A Car Q2:12 WW RAC = 85% of total company revenue Q2:12 WW RAC total revenue ~$1.9 billion; +6.8% YoY Unit Fleet Mix 6/30/12 6/30/11 U.S. Risk% 83% 68% Europe Risk% 56% 51% WW Risk % 78% 65% Strategically increasing U.S. mix of risk vehicles to capitalize on more profitable resale channels As of: Q2:12Total Revenue by Business U.S. & EU Airport Commercial 25% U.S. & EU Airport Leisure 33% U.S. & EU Off-Airport 27% Other Int’l 9% Donlen 6% |
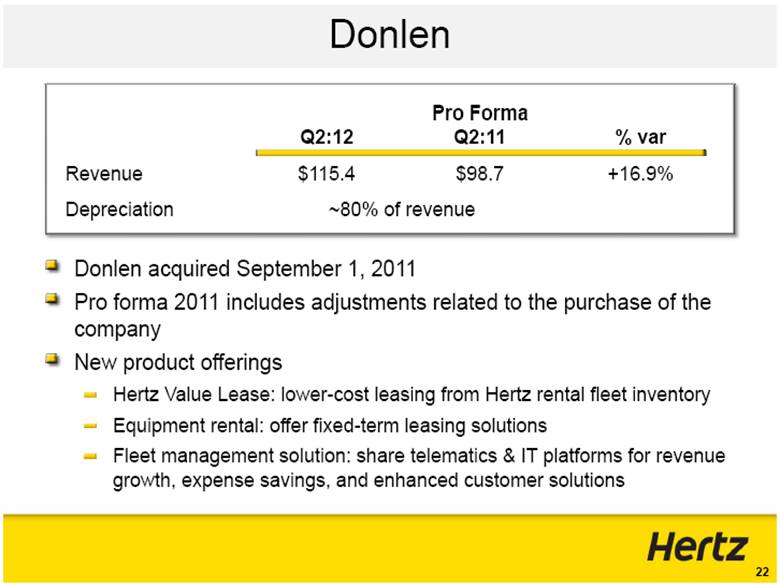
| Donlen Donlen acquired September 1, 2011 Pro forma 2011 includes adjustments related to the purchase of the company New product offerings Hertz Value Lease: lower-cost leasing from Hertz rental fleet inventory Equipment rental: offer fixed-term leasing solutions Fleet management solution: share telematics & IT platforms for revenue growth, expense savings, and enhanced customer solutions Q2:12 Pro Forma Q2:11 % var Revenue $115.4 $98.7 +16.9% Depreciation ~80% of revenue |
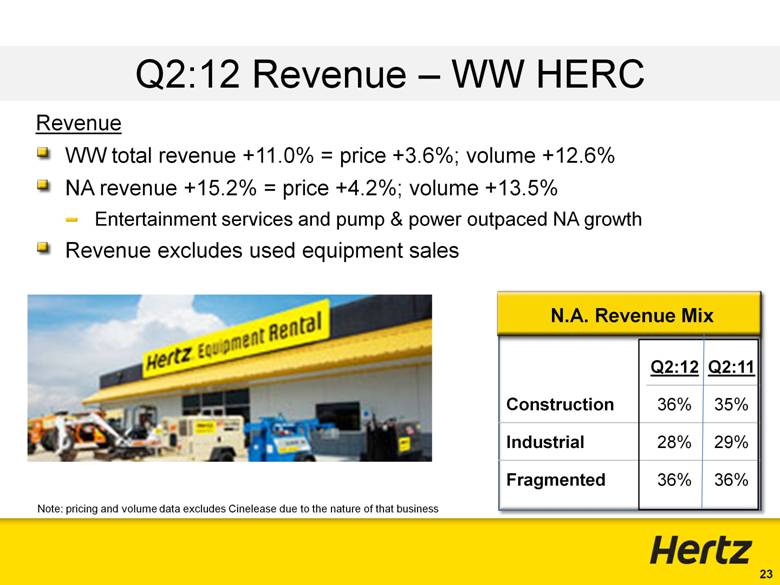
| Q2:12 Revenue – WW HERC Revenue WW total revenue +11.0% = price +3.6%; volume +12.6% NA revenue +15.2% = price +4.2%; volume +13.5% Entertainment services and pump & power outpaced NA growth Revenue excludes used equipment sales Q2:12 Q2:11 Construction 36% 35% Industrial 28% 29% Fragmented 36% 36% N.A. Revenue Mix Note: pricing and volume data excludes Cinelease due to the nature of that business |
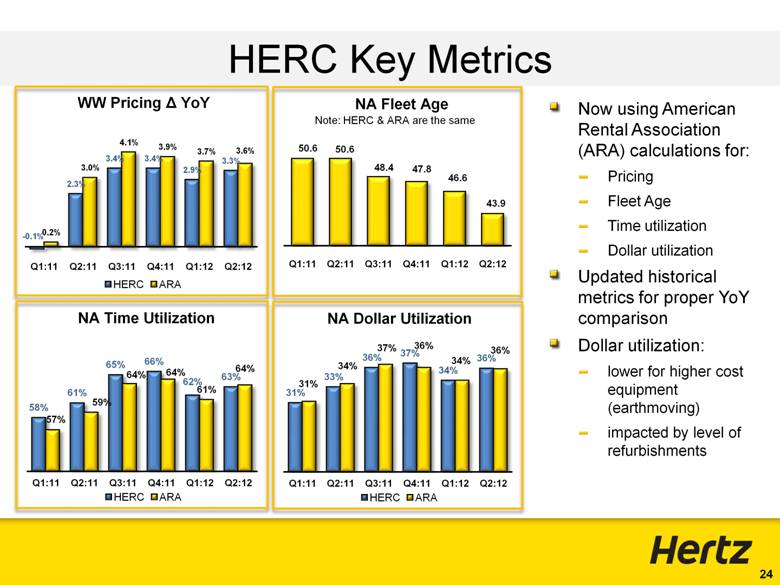
| HERC Key Metrics Now using American Rental Association (ARA) calculations for: Pricing Fleet Age Time utilization Dollar utilization Updated historical metrics for proper YoY comparison Dollar utilization: lower for higher cost equipment (earthmoving) impacted by level of refurbishments Note: HERC & ARA are the same |
| Q2:12 adjusted pre-tax income $42.5M, +27.2% Adjusted pre-tax margin 12.7% +160bps YoY DOE and SG&A down 1020 bps as % of revenue Q2:12 Corporate EBITDA improved 12.1% YoY Corp. EBITDA incremental revenue flow through ~41% Q2:12 Q2:12 negatively impacted by higher insurance claims, legal settlement costs, acquisition integration costs Excluding these costs, flow-through = 59.1% FY2012 flow through expected to be 50-55% after adjusting for the impact of acquisition costs and unusual Q2 settlements Q2:12 Profit – WW HERC |
| Q2:12 WWHERC Fleet Statistics ($ in millions) WW HERC Fleet – Cash Basis ** ($ in millions) Excludes FX Q2:12 Q2:11 Fleet Expenditures $205.4 $83.9 Disposal Proceeds $48.2 $43.2 Net Capital Expenditures $157.2 $40.7 (cash basis) ** Above amounts are on a cash flow basis, consistent with our GAAP statement of cash flows. Purchases* Disposals 1st Cost* Net Fleet Capital Expenditures* * Includes non-cash purchases and sales. Q2:12 average WW fleet age 44 months vs. 50 months in Q2:11 |
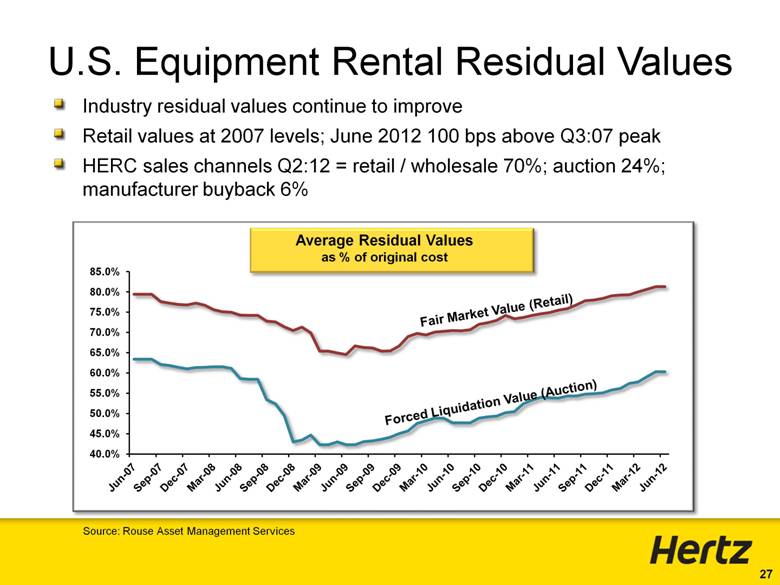
| U.S. Equipment Rental Residual Values Industry residual values continue to improve Retail values at 2007 levels; June 2012 100 bps above Q3:07 peak HERC sales channels Q2:12 = retail / wholesale 70%; auction 24%; manufacturer buyback 6% Fair Market Value (Retail) Forced Liquidation Value (Auction) Source: Rouse Asset Management Services Average Residual Values as % of original cost |
| Interest Expense Summary GAAP Total Interest Expense Q2:12 Q2:11 $152.2M $165.8M Q2:12 Q2:11 $131.6M $138.7M Cash Interest Expense Savings $13.6 Million Savings $7.1 Million Reflects lower rates from refinancing activity and favorable foreign currency translation |
| Restructuring & restructuring-related charges Q2:12 was $21.1M vs. Q2:11 of $36.5M Primarily reflects European rationalization and global reductions related to process & organizational redesign Related cash payments in Q2:12 were $21.1M vs. $13.8M the prior year Taxes Q2:12 GAAP effective income tax rate 41.5% vs. 36.5% in Q2:11 Annual adjusted tax rate normalized = 34% Q2:12 cash taxes paid: $15.2M vs. $13.8M in Q2:11 FY:12 cash taxes estimated to be ~ $75M to $80M Q2:12 Restructuring | Taxes |
| Cash Flow Cash Provided by Operating Activities ($ in millions) Q2:12 Q2:11 $ Net Cash Provided by Operating Activities $666.4 $521.3 $145.1 Corporate Cash Flow $(133.6) $(241.4) $107.8 Note: The presentation of the Corporate Cash Flow was updated in Q1:11 Conceptually same as Levered After Tax Cash Flow After Fleet Growth Corporate Cash Flow now incorporates changes in FX rates HERC maintenance & growth capex were consolidated Improvement in operating cash flow primarily due to higher earnings Corporate cash flow primarily reflects the higher earnings and higher fleet debt advance rates |
| Liquidity & Debt Corporate Liquidity @ 6/30/12 ($ in millions) ABL Availability: $ 782 Unrestricted Cash: 586 Corporate Liquidity: $1,368 Total net corporate debt $4.1 billion Total net fleet debt $7.6 billion Net corporate debt / corporate EBITDA ratio 2.8x |

| OUTLOOK |
| FY:12 Financial Guidance Unchanged Guidance % YoY Revenue $8.90 to $9.00 bil +8.5% Corporate EBITDA $1.60 to $1.66 bil +20.1% Adj. Pre-Tax Income $870 to $940 mil +38.1% Adj. Net Income $570 to $620 mil +44.3% Adjusted Diluted EPS* $1.28 to $1.38 +42.3% * Share count FY:12 = 450 mil RISKS: US political election; EU/China economies; Middle East unrest Cost savings target $350M (includes depreciation savings) Cash interest expense now expected to be lower than FY:2011 |
| LTM 6/30/20121 3 Year2 Goals Revenue Growth 9% 7%-8% Fleet Cost % of Revenue 28% 24%-25% OpEx & SG&A % of Revenue 61% 57%-59% Corp. Interest % of Revenue 3% 2.3%-2.7% Adjusted Pre-tax % of Revenue 9% 14%-15% Corp. EBITDA % of Revenue 17% 21%-23% Economic Model 3-Year Plan: Superior Revenue and EPS Growth Strategy Leverage global brands, market position and technology to DRIVE REVENUE GROWTH DRIVE COST EFFICIENCIES with a culture of continuous improvement 1 -- 6/30/12 LTM vs. 6/30/11 LTM 2 – FY 2012 to FY 2014 – excludes acquisitions |

| EU Rental Car Recovery from bottom slower than expected Still tough resale market Restructuring continues U.S. Rental Car Performance tracking to plan HTZ tight fleeted in Q3 Commercial pricing continues to be challenging Growth initiatives build up resiliency of business Rental car residual values continue strong HERC Performance tracking according to plan Overall market demand consistent Expect to continue to improve utilization 2H:12 Outlook |

| “Investors won’t pay for residuals. They believe it’s transitory profit.” -- Buy-side “Investors are reluctant to pay for a higher multiple as much of the higher earnings increase is due to better used car prices, which companies have no control over.” -- Sell-side Profit Stability Due to Business Model’s Self-leveling Affect “Residual Values Don’t Move in Isolation.” Mark Frissora |
| Lower Sale Prices Offset by Lower Purchase Prices When residual values declined / increased New car prices declined / increased R-squared correlation coefficient = .81 |
| Higher Rental Prices Offset Higher Fleet Costs Typically when fleet costs increased / decreased *1pt of price = $37 million pre-tax income *1 pt of residual value = $25 million pretax income Rental prices increased / decreased 2008 correlation skewed by recession U.S. RAC Pretax income YoY U.S. RAC RPD & Fleet Costs YoY |
| Supply Constrained / Demand Building Pent-up consumer demand as older & higher-mileage cars on road increases Low number of off-lease vehicles keeps late-model used car supply tight Source: Conference Board survey of consumer confidence In Millions of Units Source: Manheim Consulting 2012 U.S. Off-Lease Volumes Percent of Consumer’s Planning to Purchase an Automobile in the Next Six Months 10.2 0.0 2.0 4.0 6.0 8.0 10.0 12.0 14.0 16.0 Jan - 08 Feb - 08 Mar - 08 Apr - 08 May - 08 Jun - 08 Jul - 08 Aug - 08 Sep - 08 Oct - 08 Nov - 08 Dec - 08 Jan - 09 Feb - 09 Mar - 09 Apr - 09 May - 09 Jun - 09 Jul - 09 Aug - 09 Sep - 09 Oct - 09 Nov - 09 Dec - 09 Jan - 10 Feb - 10 Mar - 10 Apr - 10 May - 10 Jun - 10 Jul - 10 Aug - 10 Sep - 10 Oct - 10 Nov - 10 Dec - 10 Jan - 11 Feb - 11 Mar - 11 Apr - 11 May - 11 Jun - 11 Jul - 11 Aug - 11 Sep - 11 Oct - 11 Nov - 11 Dec - 11 Percent of Consumers Planning to Purchase an Automobile in the Next Six Months |
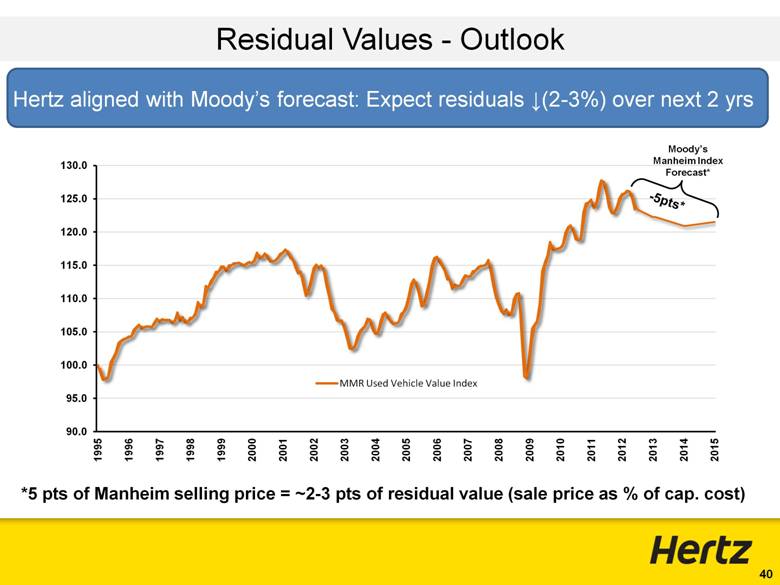
| Hertz aligned with Moody’s forecast: Expect residuals (2-3%) over next 2 yrs Residual Values - Outlook *5 pts of Manheim selling price = ~2-3 pts of residual value (sale price as % of cap. cost) Moody’s Manheim Index Forecast* -5pts* |
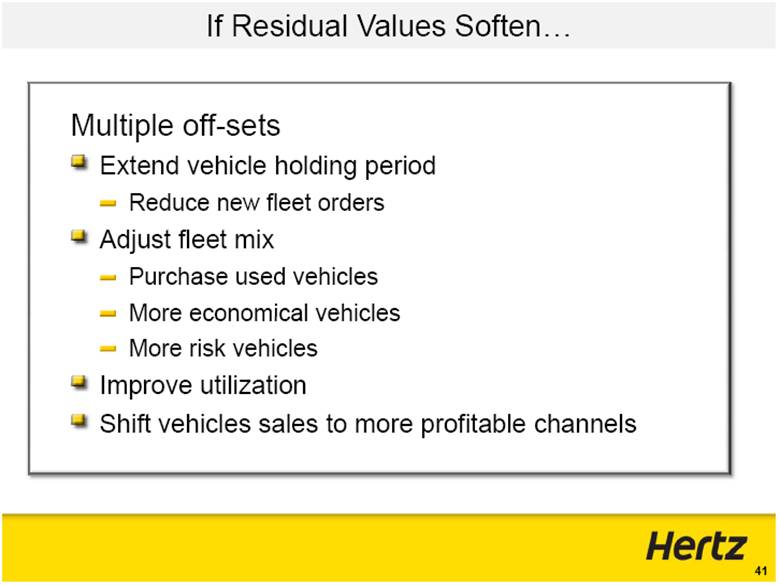
| Multiple off-sets Extend vehicle holding period Reduce new fleet orders Adjust fleet mix Purchase used vehicles More economical vehicles More risk vehicles Improve utilization Shift vehicles sales to more profitable channels If Residual Values Soften |
| Shifting to Higher-Return Sales Channels % of Total Hertz Vehicle Sales Net Gain vs. Auction Retail & R2B Dealer Direct Growing into Higher-Return Resale Channels |

| Q & A |
Table 1
HERTZ GLOBAL HOLDINGS, INC.
CONDENSED CONSOLIDATED STATEMENTS OF OPERATIONS
(In millions, except per share amounts)
Unaudited
| | Three Months Ended | | As a Percentage | |
| | June 30, | | of Total Revenues | |
| | 2012 | | 2011 | | 2012 | | 2011 | |
Total revenues | | $ | 2,225.1 | | $ | 2,072.3 | | 100.0 | % | 100.0 | % |
| | | | | | | | | |
Expenses: | | | | | | | | | |
Direct operating | | 1,188.9 | | 1,187.3 | | 53.4 | % | 57.3 | % |
Depreciation of revenue earning equipment and lease charges | | 519.8 | | 419.7 | | 23.4 | % | 20.3 | % |
Selling, general and administrative | | 206.6 | | 195.6 | | 9.3 | % | 9.4 | % |
Interest expense | | 152.2 | | 165.8 | | 6.8 | % | 8.0 | % |
Interest income | | (0.5 | ) | (1.5 | ) | — | % | (0.1 | )% |
Other (income) expense, net | | (0.6 | ) | 10.8 | | — | % | 0.5 | % |
Total expenses | | 2,066.4 | | 1,977.7 | | 92.9 | % | 95.4 | % |
Income before income taxes | | 158.7 | | 94.6 | | 7.1 | % | 4.6 | % |
Provision for taxes on income | | (65.8 | ) | (34.5 | ) | (2.9 | )% | (1.7 | )% |
Net income | | 92.9 | | 60.1 | | 4.2 | % | 2.9 | % |
Less: Net income attributable to noncontrolling interest | | — | | (5.1 | ) | — | % | (0.2 | )% |
Net income attributable to Hertz Global Holdings, Inc. and Subsidiaries’ common stockholders | | $ | 92.9 | | $ | 55.0 | | 4.2 | % | 2.7 | % |
| | | | | | | | | |
Weighted average number of shares outstanding: | | | | | | | | | |
Basic | | 420.0 | | 415.9 | | | | | |
Diluted | | 447.4 | | 451.8 | | | | | |
| | | | | | | | | |
Earnings per share attributable to Hertz Global Holdings, Inc. and Subsidiaries’ common stockholders: | | | | | | | | | |
Basic | | $ | 0.22 | | $ | 0.13 | | | | | |
Diluted | | $ | 0.21 | | $ | 0.12 | | | | | |
| | Six Months Ended | | As a Percentage | |
| | June 30, | | of Total Revenues | |
| | 2012 | | 2011 | | 2012 | | 2011 | |
Total revenues | | $ | 4,186.1 | | $ | 3,852.3 | | 100.0 | % | 100.0 | % |
| | | | | | | | | |
Expenses: | | | | | | | | | |
Direct operating | | 2,304.1 | | 2,261.0 | | 55.0 | % | 58.7 | % |
Depreciation of revenue earning equipment and lease charges | | 1,033.9 | | 855.7 | | 24.7 | % | 22.2 | % |
Selling, general and administrative | | 414.3 | | 377.8 | | 9.9 | % | 9.8 | % |
Interest expense | | 314.5 | | 362.7 | | 7.5 | % | 9.4 | % |
Interest income | | (1.6 | ) | (3.4 | ) | — | % | — | % |
Other (income) expense, net | | (1.0 | ) | 62.7 | | — | % | 1.6 | % |
Total expenses | | 4,064.2 | | 3,916.5 | | 97.1 | % | 101.7 | % |
Income (loss) before income taxes | | 121.9 | | (64.2 | ) | 2.9 | % | (1.7 | )% |
Provision for taxes on income | | (85.3 | ) | (4.6 | ) | (2.0 | )% | (0.1 | )% |
Net income (loss) | | 36.6 | | (68.8 | ) | 0.9 | % | (1.8 | )% |
Less: Net income attributable to noncontrolling interest | | — | | (8.8 | ) | — | % | (0.2 | )% |
Net income (loss) attributable to Hertz Global Holdings, Inc. and Subsidiaries’ common stockholders | | $ | 36.6 | | $ | (77.6 | ) | 0.9 | % | (2.0 | )% |
| | | | | | | | | |
Weighted average number of shares outstanding: | | | | | | | | | |
Basic | | 419.1 | | 415.0 | | | | | |
Diluted | | 447.9 | | 415.0 | | | | | |
| | | | | | | | | |
Earnings (loss) per share attributable to Hertz Global Holdings, Inc. and Subsidiaries’ common stockholders: | | | | | | | | | |
Basic | | $ | 0.09 | | $ | (0.19 | ) | | | | |
Diluted | | $ | 0.08 | | $ | (0.19 | ) | | | | |
Table 2
HERTZ GLOBAL HOLDINGS, INC.
CONDENSED CONSOLIDATED STATEMENTS OF OPERATIONS
(In millions)
Unaudited
| | Three Months Ended June 30, 2012 | | Three Months Ended June 30, 2011 | |
| | As | | | | As | | As | | | | As | |
| | Reported | | Adjustments | | Adjusted | | Reported | | Adjustments | | Adjusted | |
Total revenues | | $ | 2,225.1 | | $ | — | | $ | 2,225.1 | | $ | 2,072.3 | | $ | — | | $ | 2,072.3 | |
| | | | | | | | | | | | | |
Expenses: | | | | | | | | | | | | | |
Direct operating | | 1,188.9 | | (34.6 | )(a) | 1,154.3 | | 1,187.3 | | (42.8 | )(a) | 1,144.5 | |
Depreciation of revenue earning equipment and lease charges | | 519.8 | | (2.7 | )(b) | 517.1 | | 419.7 | | (3.7 | )(b) | 416.0 | |
Selling, general and administrative | | 206.6 | | (17.3 | )(c) | 189.3 | | 195.6 | | (5.5 | )(c) | 190.1 | |
Interest expense | | 152.2 | | (20.6 | )(d) | 131.6 | | 165.8 | | (27.1 | )(d) | 138.7 | |
Interest income | | (0.5 | ) | — | | (0.5 | ) | (1.5 | ) | — | | (1.5 | ) |
Other (income) expense, net | | (0.6 | ) | — | | (0.6 | ) | 10.8 | | (10.7 | )(e) | 0.1 | |
Total expenses | | 2,066.4 | | (75.2 | ) | 1,991.2 | | 1,977.7 | | (89.8 | ) | 1,887.9 | |
Income before income taxes | | 158.7 | | 75.2 | | 233.9 | | 94.6 | | 89.8 | | 184.4 | |
Provision for taxes on income | | (65.8 | ) | (13.7 | )(f) | (79.5 | ) | (34.5 | ) | (28.2 | )(f) | (62.7 | ) |
Net income | | 92.9 | | 61.5 | | 154.4 | | 60.1 | | 61.6 | | 121.7 | |
Less: Net income attributable to noncontrolling interest | | — | | — | | — | | (5.1 | ) | — | | (5.1 | ) |
Net income attributable to Hertz Global Holdings, Inc. and Subsidiaries’ common stockholders | | $ | 92.9 | | $ | 61.5 | | $ | 154.4 | | $ | 55.0 | | $ | 61.6 | | $ | 116.6 | |
| | Six Months Ended June 30, 2012 | | Six Months Ended June 30, 2011 | |
| | As | | | | As | | As | | | | As | |
| | Reported | | Adjustments | | Adjusted | | Reported | | Adjustments | | Adjusted | |
Total revenues | | $ | 4,186.1 | | $ | — | | $ | 4,186.1 | | $ | 3,852.3 | | $ | — | | $ | 3,852.3 | |
| | | | | | | | | | | | | |
Expenses: | | | | | | | | | | | | | |
Direct operating | | 2,304.1 | | (63.4 | )(a) | 2,240.7 | | 2,261.0 | | (65.5 | )(a) | 2,195.5 | |
Depreciation of revenue earning equipment and lease charges | | 1,033.9 | | (5.5 | )(b) | 1,028.4 | | 855.7 | | (6.0 | )(b) | 849.7 | |
Selling, general and administrative | | 414.3 | | (26.7 | )(c) | 387.6 | | 377.8 | | (11.7 | )(c) | 366.1 | |
Interest expense | | 314.5 | | (45.7 | )(d) | 268.8 | | 362.7 | | (87.0 | )(d) | 275.7 | |
Interest income | | (1.6 | ) | — | | (1.6 | ) | (3.4 | ) | — | | (3.4 | ) |
Other (income) expense, net | | (1.0 | ) | — | | (1.0 | ) | 62.7 | | (62.4 | )(e) | 0.3 | |
Total expenses | | 4,064.2 | | (141.3 | ) | 3,922.9 | | 3,916.5 | | (232.6 | ) | 3,683.9 | |
Income (loss) before income taxes | | 121.9 | | 141.3 | | 263.2 | | (64.2 | ) | 232.6 | | 168.4 | |
Provision for taxes on income | | (85.3 | ) | (4.2 | )(f) | (89.5 | ) | (4.6 | ) | (52.6 | )(f) | (57.2 | ) |
Net income (loss) | | 36.6 | | 137.1 | | 173.7 | | (68.8 | ) | 180.0 | | 111.2 | |
Less: Net income attributable to noncontrolling interest | | — | | — | | — | | (8.8 | ) | — | | (8.8 | ) |
Net income (loss) attributable to Hertz Global Holdings, Inc. and Subsidiaries’ common stockholders | | $ | 36.6 | | $ | 137.1 | | $ | 173.7 | | $ | (77.6 | ) | $ | 180.0 | | $ | 102.4 | |
(a) Represents the increase in amortization of other intangible assets, depreciation of property and equipment and accretion of certain revalued liabilities relating to purchase accounting. For the three months ended June 30, 2012 and 2011, also includes restructuring and restructuring related charges of $9.0 million and $30.8 million, respectively. For the six months ended June 30, 2012 and 2011, also includes restructuring and restructuring related charges of $17.0 million and $35.3 million.
(b) Represents the increase in depreciation of revenue earning equipment based upon its revaluation relating to purchase accounting.
(c) Represents an increase in depreciation of property and equipment relating to purchase accounting. For the three months ended June 30, 2012 and 2011, also includes restructuring and restructuring related charges of $12.2 million and $5.6 million, respectively. For the six months ended June 30, 2012 and 2011, also includes restructuring and restructuring related charges of $14.1 million and $6.5 million, respectively. For all periods presented, also includes other adjustments which are detailed in Table 5.
(d) Represents non-cash debt charges relating to the amortization and write off of deferred debt financing costs and debt discounts.
(e) Represents premiums paid to redeem our 10.5% Senior Subordinated Notes and a portion of our 8.875% Senior Notes.
(f) Represents a provision for income taxes derived utilizing a normalized income tax rate (34% for 2012 and 2011).
Table 3
HERTZ GLOBAL HOLDINGS, INC.
SEGMENT AND OTHER INFORMATION
(In millions, except per share amounts)
Unaudited
| | Three Months Ended | | Six Months Ended | |
| | June 30, | | June 30, | |
| | 2012 | | 2011 | | 2012 | | 2011 | |
Revenues: | | | | | | | | | |
Car rental | | $ | 1,889.6 | | $ | 1,768.8 | | $ | 3,547.9 | | $ | 3,279.1 | |
Equipment rental | | 335.0 | | 301.7 | | 637.1 | | 569.9 | |
Other reconciling items | | 0.5 | | 1.8 | | 1.1 | | 3.3 | |
| | $ | 2,225.1 | | $ | 2,072.3 | | $ | 4,186.1 | | $ | 3,852.3 | |
| | | | | | | | | |
Depreciation of property and equipment: | | | | | | | | | |
Car rental | | $ | 29.9 | | $ | 29.2 | | $ | 60.8 | | $ | 56.7 | |
Equipment rental | | 8.3 | | 8.3 | | 16.6 | | 16.5 | |
Other reconciling items | | 3.3 | | 1.9 | | 6.4 | | 3.9 | |
| | $ | 41.5 | | $ | 39.4 | | $ | 83.8 | | $ | 77.1 | |
| | | | | | | | | |
Amortization of other intangible assets: | | | | | | | | | |
Car rental | | $ | 9.2 | | $ | 7.6 | | $ | 18.4 | | $ | 15.1 | |
Equipment rental | | 10.3 | | 8.9 | | 19.8 | | 17.9 | |
Other reconciling items | | 0.4 | | 0.4 | | 0.8 | | 0.7 | |
| | $ | 19.9 | | $ | 16.9 | | $ | 39.0 | | $ | 33.7 | |
| | | | | | | | | |
Income (loss) before income taxes: | | | | | | | | | |
Car rental | | $ | 234.8 | | $ | 232.1 | | $ | 296.4 | | $ | 273.1 | |
Equipment rental | | 28.1 | | (13.3 | ) | 38.2 | | (21.0 | ) |
Other reconciling items | | (104.2 | ) | (124.2 | ) | (212.7 | ) | (316.3 | ) |
| | $ | 158.7 | | $ | 94.6 | | $ | 121.9 | | $ | (64.2 | ) |
| | | | | | | | | |
Corporate EBITDA (a): | | | | | | | | | |
Car rental | | $ | 302.7 | | $ | 276.8 | | $ | 425.1 | | $ | 369.4 | |
Equipment rental | | 126.4 | | 112.8 | | 233.7 | | 204.3 | |
Other reconciling items | | (21.4 | ) | (27.5 | ) | (43.1 | ) | (45.2 | ) |
| | $ | 407.7 | | $ | 362.1 | | $ | 615.7 | | $ | 528.5 | |
| | | | | | | | | |
Adjusted pre-tax income (loss) (a): | | | | | | | | | |
Car rental | | $ | 277.4 | | $ | 242.2 | | $ | 369.0 | | $ | 303.5 | |
Equipment rental | | 42.5 | | 33.4 | | 68.4 | | 43.6 | |
Other reconciling items | | (86.0 | ) | (91.2 | ) | (174.2 | ) | (178.7 | ) |
| | $ | 233.9 | | $ | 184.4 | | $ | 263.2 | | $ | 168.4 | |
| | | | | | | | | |
Adjusted net income (loss) (a): | | | | | | | | | |
Car rental | | $ | 183.1 | | $ | 159.9 | | $ | 243.6 | | $ | 200.3 | |
Equipment rental | | 28.1 | | 22.0 | | 45.1 | | 28.8 | |
Other reconciling items | | (56.8 | ) | (65.3 | ) | (115.0 | ) | (126.7 | ) |
| | $ | 154.4 | | $ | 116.6 | | $ | 173.7 | | $ | 102.4 | |
| | | | | | | | | |
Adjusted diluted number of shares outstanding (a) | | 447.4 | | 450.0 | | 447.9 | | 431.5 | |
| | | | | | | | | |
Adjusted diluted earnings per share (a) | | $ | 0.35 | | $ | 0.26 | | $ | 0.39 | | $ | 0.24 | |
(a) Represents a non-GAAP measure, see the accompanying reconciliations and definitions.
Note: “Other Reconciling Items” includes general corporate expenses, certain interest expense (including net interest on corporate debt), as well as other business activities such as our third-party claim management services. See Tables 5 and 6.
Table 4
HERTZ GLOBAL HOLDINGS, INC.
SELECTED OPERATING AND FINANCIAL DATA
Unaudited
| | Three | | Percent | | Six | | Percent | |
| | Months | | change | | Months | | change | |
| | Ended, or as | | from | | Ended, or as | | from | |
| | of June 30, | | prior year | | of June 30, | | prior year | |
| | 2012 | | period | | 2012 | | period | |
| | | | | | | | | |
Selected Car Rental Operating Data | | | | | | | | | |
| | | | | | | | | |
Worldwide number of transactions (in thousands) | | 7,517 | | 5.2 | % | 13,905 | | 5.5 | % |
Domestic (Hertz) | | 5,620 | | 6.9 | % | 10,457 | | 7.4 | % |
International (Hertz) | | 1,897 | | 0.3 | % | 3,448 | | 0.2 | % |
| | | | | | | | | |
Worldwide transaction days (in thousands) | | 37,256 | | 7.0 | % | 68,925 | | 6.9 | % |
Domestic (Hertz) | | 26,312 | | 10.1 | % | 49,137 | | 9.9 | % |
International (Hertz) | | 10,944 | | 0.1 | % | 19,788 | | 0.1 | % |
| | | | | | | | | |
Worldwide rental rate revenue per transaction day (a) | | $ | 39.50 | | (3.4 | )% | $ | 39.89 | | (3.6 | )% |
Domestic (Hertz) | | $ | 38.10 | | (3.1 | )% | $ | 38.77 | | (3.7 | )% |
International (Hertz) (b) | | $ | 42.85 | | (3.2 | )% | $ | 42.69 | | (2.8 | )% |
| | | | | | | | | |
Worldwide average number of company-operated cars during period | | 656,200 | | 34.7 | % | 625,500 | | 36.8 | % |
Domestic (Hertz company-operated) | | 353,100 | | 7.6 | % | 336,800 | | 8.0 | % |
International (Hertz company-operated) | | 157,000 | | (1.3 | )% | 144,900 | | (0.3 | )% |
Donlen (under lease and maintenance) | | 146,100 | | N/A | | 143,800 | | N/A | |
| | | | | | | | | |
Worldwide revenue earning equipment, net (in millions) | | $ | 10,408.0 | | 9.3 | % | $ | 10,408.0 | | 9.3 | % |
| | | | | | | | | |
Selected Worldwide Equipment Rental Operating Data | | | | | | | | | |
| | | | | | | | | |
Rental and rental related revenue (in millions) (a) (b) | | $ | 303.0 | | 13.9 | % | $ | 577.3 | | 13.8 | % |
Same store revenue growth, including initiatives (a) (b) | | 7.3 | % | N/M | | 8.1 | % | N/M | |
Average acquisition cost of revenue earning equipment operated during period (in millions) | | $ | 3,003.6 | | 8.1 | % | $ | 2,951.6 | | 6.6 | % |
Worldwide revenue earning equipment, net (in millions) | | $ | 2,030.0 | | 19.2 | % | $ | 2,030.0 | | 19.2 | % |
| | | | | | | | | |
Other Financial Data (in millions) | | | | | | | | | |
| | | | | | | | | |
Cash flows provided by operating activities | | $ | 666.4 | | 27.8 | % | $ | 1,158.4 | | 68.6 | % |
Corporate cash flow (a) | | (133.6 | ) | 44.7 | % | (413.8 | ) | 30.5 | % |
EBITDA (a) | | 891.8 | | 22.1 | % | 1,592.0 | | 26.9 | % |
Corporate EBITDA (a) | | 407.7 | | 12.6 | % | 615.7 | | 16.5 | % |
Selected Balance Sheet Data (in millions)
| | June 30, | | December 31, | |
| | 2012 | | 2011 | |
Cash and cash equivalents | | $ | 586.2 | | $ | 931.8 | |
Total revenue earning equipment, net | | 12,438.0 | | 10,105.4 | |
Total assets | | 19,429.5 | | 17,673.5 | |
Total debt | | 12,467.9 | | 11,317.1 | |
Net corporate debt (a) | | 4,110.3 | | 3,678.6 | |
Net fleet debt (a) | | 7,596.0 | | 6,398.7 | |
Total net debt (a) | | 11,706.3 | | 10,077.3 | |
Total equity | | 2,265.9 | | 2,234.7 | |
| | | | | | | |
(a) Represents a non-GAAP measure, see the accompanying reconciliations and definitions.
(b) Based on 12/31/11 foreign exchange rates.
N/M Percentage change not meaningful.
Table 5
HERTZ GLOBAL HOLDINGS, INC.
RECONCILIATION OF GAAP TO NON-GAAP EARNINGS MEASURES
(In millions, except per share amounts)
Unaudited
ADJUSTED PRE-TAX INCOME (LOSS) AND ADJUSTED NET INCOME (LOSS)
| | Three Months Ended June 30, 2012 | | Three Months Ended June 30, 2011 | |
| | | | | | Other | | | | | | | | Other | | | |
| | Car | | Equipment | | Reconciling | | | | Car | | Equipment | | Reconciling | | | |
| | Rental | | Rental | | Items | | Total | | Rental | | Rental | | Items | | Total | |
Total revenues: | | $ | 1,889.6 | | $ | 335.0 | | $ | 0.5 | | $ | 2,225.1 | | $ | 1,768.8 | | $ | 301.7 | | $ | 1.8 | | $ | 2,072.3 | |
Expenses: | | | | | | | | | | | | | | | | | |
Direct operating and selling, general and administrative | | 1,123.8 | | 230.4 | | 41.3 | | 1,395.5 | | 1,104.0 | | 238.1 | | 40.8 | | 1,382.9 | |
Depreciation of revenue earning equipment and lease charges | | 454.1 | | 65.7 | | — | | 519.8 | | 355.1 | | 64.6 | | — | | 419.7 | |
Interest expense | | 77.2 | | 11.5 | | 63.5 | | 152.2 | | 79.0 | | 12.2 | | 74.6 | | 165.8 | |
Interest income | | (0.3 | ) | (0.1 | ) | (0.1 | ) | (0.5 | ) | (1.4 | ) | — | | (0.1 | ) | (1.5 | ) |
Other (income) expense, net | | — | | (0.6 | ) | — | | (0.6 | ) | — | | 0.1 | | 10.7 | | 10.8 | |
Total expenses | | 1,654.8 | | 306.9 | | 104.7 | | 2,066.4 | | 1,536.7 | | 315.0 | | 126.0 | | 1,977.7 | |
Income (loss) before income taxes | | 234.8 | | 28.1 | | (104.2 | ) | 158.7 | | 232.1 | | (13.3 | ) | (124.2 | ) | 94.6 | |
Adjustments: | | | | | | | | | | | | | | | | | |
Purchase accounting (a): | | | | | | | | | | | | | | | | | |
Direct operating and selling, general and administrative | | 14.5 | | 10.8 | | 1.0 | | 26.3 | | 8.5 | | 9.4 | | 0.9 | | 18.8 | |
Depreciation of revenue earning equipment | | 2.7 | | — | | — | | 2.7 | | — | | 3.7 | | — | | 3.7 | |
Non-cash debt charges (b) | | 10.6 | | 1.1 | | 8.9 | | 20.6 | | 10.6 | | 1.5 | | 15.0 | | 27.1 | |
Restructuring charges (c) | | 11.8 | | 2.5 | | 1.8 | | 16.1 | | 3.5 | | 29.8 | | 0.4 | | 33.7 | |
Restructuring related charges (c) | | 3.1 | | — | | 1.9 | | 5.0 | | 0.5 | | 2.3 | | — | | 2.8 | |
Derivative (gains) losses (c) | | (0.1 | ) | — | | 0.1 | | — | | 0.1 | | — | | (0.1 | ) | — | |
Pension adjustment (c) | | — | | — | | — | | — | | (13.1 | ) | — | | — | | (13.1 | ) |
Acquisition related costs (d) | | — | | — | | 4.5 | | 4.5 | | — | | — | | 6.1 | | 6.1 | |
Premiums paid on debt (e) | | — | | — | | — | | — | | — | | — | | 10.7 | | 10.7 | |
Adjusted pre-tax income (loss) | | 277.4 | | 42.5 | | (86.0 | ) | 233.9 | | 242.2 | | 33.4 | | (91.2 | ) | 184.4 | |
Assumed (provision) benefit for income taxes of 34% | | (94.3 | ) | (14.4 | ) | 29.2 | | (79.5 | ) | (82.3 | ) | (11.4 | ) | 31.0 | | (62.7 | ) |
Noncontrolling interest | | — | | — | | — | | — | | — | | — | | (5.1 | ) | (5.1 | ) |
Adjusted net income (loss) | | $ | 183.1 | | $ | 28.1 | | $ | (56.8 | ) | $ | 154.4 | | $ | 159.9 | | $ | 22.0 | | $ | (65.3 | ) | $ | 116.6 | |
| | | | | | | | | | | | | | | | | |
Adjusted diluted number of shares outstanding | | | | | | | | 447.4 | | | | | | | | 450.0 | |
| | | | | | | | | | | | | | | | | |
Adjusted diluted earnings per share | | | | | | | | $ | 0.35 | | | | | | | | $ | 0.26 | |
| | Six Months Ended June 30, 2012 | | Six Months Ended June 30, 2011 | |
| | | | | | Other | | | | | | | | Other | | | |
| | Car | | Equipment | | Reconciling | | | | Car | | Equipment | | Reconciling | | | |
| | Rental | | Rental | | Items | | Total | | Rental | | Rental | | Items | | Total | |
Total revenues: | | $ | 3,547.9 | | $ | 637.1 | | $ | 1.1 | | $ | 4,186.1 | | $ | 3,279.1 | | $ | 569.9 | | $ | 3.3 | | $ | 3,852.3 | |
Expenses: | | | | | | | | | | | | | | | | | |
Direct operating and selling, general and administrative | | 2,189.2 | | 447.7 | | 81.5 | | 2,718.4 | | 2,130.3 | | 435.7 | | 72.8 | | 2,638.8 | |
Depreciation of revenue earning equipment and lease charges | | 905.8 | | 128.1 | | — | | 1,033.9 | | 724.0 | | 131.7 | | — | | 855.7 | |
Interest expense | | 157.8 | | 24.3 | | 132.4 | | 314.5 | | 154.4 | | 23.4 | | 184.9 | | 362.7 | |
Interest income | | (1.3 | ) | (0.2 | ) | (0.1 | ) | (1.6 | ) | (2.7 | ) | (0.2 | ) | (0.5 | ) | (3.4 | ) |
Other (income) expense, net | | — | | (1.0 | ) | — | | (1.0 | ) | — | | 0.3 | | 62.4 | | 62.7 | |
Total expenses | | 3,251.5 | | 598.9 | | 213.8 | | 4,064.2 | | 3,006.0 | | 590.9 | | 319.6 | | 3,916.5 | |
Income (loss) before income taxes | | 296.4 | | 38.2 | | (212.7 | ) | 121.9 | | 273.1 | | (21.0 | ) | (316.3 | ) | (64.2 | ) |
Adjustments: | | | | | | | | | | | | | | | | | |
Purchase accounting (a): | | | | | | | | | | | | | | | | | |
Direct operating and selling, general and administrative | | 24.7 | | 20.8 | | 2.0 | | 47.5 | | 16.6 | | 18.9 | | 1.7 | | 37.2 | |
Depreciation of revenue earning equipment | | 5.5 | | — | | — | | 5.5 | | — | | 5.9 | | — | | 5.9 | |
Non-cash debt charges (b) | | 21.7 | | 2.7 | | 21.4 | | 45.8 | | 20.8 | | 3.9 | | 62.3 | | 87.0 | |
Restructuring charges (c) | | 17.0 | | 6.7 | | 1.8 | | 25.5 | | 4.5 | | 33.6 | | 0.3 | | 38.4 | |
Restructuring related charges (c) | | 3.7 | | — | | 1.9 | | 5.6 | | 1.0 | | 2.3 | | — | | 3.3 | |
Derivative (gains) losses (c) | | — | | — | | — | | — | | 0.6 | | — | | (0.6 | ) | — | |
Pension adjustment (c) | | — | | — | | — | | — | | (13.1 | ) | — | | — | | (13.1 | ) |
Acquisition related costs (d) | | — | | — | | 11.4 | | 11.4 | | — | | — | | 9.0 | | 9.0 | |
Management transition costs (d) | | — | | — | | — | | — | | — | | — | | 2.5 | | 2.5 | |
Premiums paid on debt (e) | | — | | — | | — | | — | | — | | — | | 62.4 | | 62.4 | |
Adjusted pre-tax income (loss) | | 369.0 | | 68.4 | | (174.2 | ) | 263.2 | | 303.5 | | 43.6 | | (178.7 | ) | 168.4 | |
Assumed (provision) benefit for income taxes of 34% | | (125.4 | ) | (23.3 | ) | 59.2 | | (89.5 | ) | (103.2 | ) | (14.8 | ) | 60.8 | | (57.2 | ) |
Noncontrolling interest | | — | | — | | — | | — | | — | | — | | (8.8 | ) | (8.8 | ) |
Adjusted net income (loss) | | $ | 243.6 | | $ | 45.1 | | $ | (115.0 | ) | $ | 173.7 | | $ | 200.3 | | $ | 28.8 | | $ | (126.7 | ) | $ | 102.4 | |
| | | | | | | | | | | | | | | | | |
Adjusted diluted number of shares outstanding | | | | | | | | 447.9 | | | | | | | | 431.5 | |
| | | | | | | | | | | | | | | | | |
Adjusted diluted earnings per share | | | | | | | | $ | 0.39 | | | | | | | | $ | 0.24 | |
(a) Represents the purchase accounting effects of the acquisition of all of Hertz’s common stock on December 21, 2005 on our results of operations relating to increased depreciation and amortization of tangible and intangible assets and accretion of workers’ compensation and public liability and property damage liabilities. Also represents the purchase accounting effects of subsequent acquisitions on our results of operations relating to increased amortization of intangible assets.
(b) Represents non-cash debt charges relating to the amortization and write-off of deferred debt financing costs and debt discounts.
(c) Amounts are included within direct operating and selling, general and administrative expense in our statement of operations.
(d) Amounts are included within selling, general and administrative expense in our statement of operations.
(e) Represents premiums paid to redeem our 10.5% Senior Subordinated Notes and a portion of our 8.875% Senior Notes. These costs are included within other (income) expense, net in our statement of operations.
Table 6
HERTZ GLOBAL HOLDINGS, INC.
RECONCILIATION OF GAAP TO NON-GAAP EARNINGS MEASURES
(In millions)
Unaudited
EBITDA, CORPORATE EBITDA, UNLEVERED PRE-TAX CASH FLOW, LEVERED AFTER-TAX CASH FLOW BEFORE FLEET GROWTH AND CORPORATE CASH FLOW
| | Three Months Ended June 30, 2012 | | Three Months Ended June 30, 2011 | |
| | | | | | Other | | | | | | | | Other | | | |
| | Car | | Equipment | | Reconciling | | | | Car | | Equipment | | Reconciling | | | |
| | Rental | | Rental | | Items | | Total | | Rental | | Rental | | Items | | Total | |
| | | | | | | | | | | | | | | | | |
Income (loss) before income taxes | | $ | 234.8 | | $ | 28.1 | | $ | (104.2 | ) | $ | 158.7 | | $ | 232.1 | | $ | (13.3 | ) | $ | (124.2 | ) | $ | 94.6 | |
Depreciation, amortization and other purchase accounting | | 493.3 | | 84.4 | | 3.7 | | 581.4 | | 392.1 | | 81.8 | | 2.6 | | 476.5 | |
Interest, net of interest income | | 76.9 | | 11.4 | | 63.4 | | 151.7 | | 77.6 | | 12.2 | | 74.5 | | 164.3 | |
Noncontrolling interest | | — | | — | | — | | — | | — | | — | | (5.1 | ) | (5.1 | ) |
EBITDA | | 805.0 | | 123.9 | | (37.1 | ) | 891.8 | | 701.8 | | 80.7 | | (52.2 | ) | 730.3 | |
Adjustments: | | | | | | | | | | | | | | | | | |
Car rental fleet interest | | (73.5 | ) | — | | — | | (73.5 | ) | (71.2 | ) | — | | — | | (71.2 | ) |
Car rental fleet depreciation | | (454.1 | ) | — | | — | | (454.1 | ) | (355.1 | ) | — | | — | | (355.1 | ) |
Non-cash expenses and charges (a) | | 10.4 | | — | | 7.5 | | 17.9 | | (2.7 | ) | — | | 7.5 | | 4.8 | |
Extraordinary, unusual or non-recurring gains and losses (b) | | 14.9 | | 2.5 | | 8.2 | | 25.6 | | 4.0 | | 32.1 | | 17.2 | | 53.3 | |
Corporate EBITDA | | $ | 302.7 | | $ | 126.4 | | $ | (21.4 | ) | 407.7 | | $ | 276.8 | | $ | 112.8 | | $ | (27.5 | ) | 362.1 | |
Non-fleet capital expenditures, net | | | | | | | | (54.1 | ) | | | | | | | (54.7 | ) |
Changes in working capital: | | | | | | | | | | | | | | | | | |
Receivables, excluding car rental fleet receivables | | | | | | | | (175.2 | ) | | | | | | | (162.8 | ) |
Accounts payable and capital leases | | | | | | | | 229.8 | | | | | | | | 377.3 | |
Accrued liabilities and other | | | | | | | | 27.3 | | | | | | | | (10.8 | ) |
Acquisition and other investing activities | | | | | | | | (15.0 | ) | | | | | | | (34.0 | ) |
Other financing activities, excluding debt | | | | | | | | (2.0 | ) | | | | | | | (17.7 | ) |
Foreign exchange impact on cash and cash equivalents | | | | | | | | (12.8 | ) | | | | | | | 9.9 | |
Unlevered pre-tax cash flow | | | | | | | | 405.7 | | | | | | | | 469.3 | |
Corporate net cash interest | | | | | | | | (108.0 | ) | | | | | | | (94.8 | ) |
Corporate cash taxes | | | | | | | | (15.3 | ) | | | | | | | (13.7 | ) |
Levered after-tax cash flow before fleet growth | | | | | | | | 282.4 | | | | | | | | 360.8 | |
Equipment rental revenue earning equipment expenditures, net of disposal proceeds | | | | | | | | (195.2 | ) | | | | | | | (98.9 | ) |
Car rental fleet equity requirement | | | | | | | | (220.8 | ) | | | | | | | (503.3 | ) |
Corporate cash flow | | | | | | | | $ | (133.6 | ) | | | | | | | $ | (241.4 | ) |
| | Six Months Ended June 30, 2012 | | Six Months Ended June 30, 2011 | |
| | | | | | Other | | | | | | | | Other | | | |
| | Car | | Equipment | | Reconciling | | | | Car | | Equipment | | Reconciling | | | |
| | Rental | | Rental | | Items | | Total | | Rental | | Rental | | Items | | Total | |
| | | | | | | | | | | | | | | | | |
Income (loss) before income taxes | | $ | 296.4 | | $ | 38.2 | | $ | (212.7 | ) | $ | 121.9 | | $ | 273.1 | | $ | (21.0 | ) | $ | (316.3 | ) | $ | (64.2 | ) |
Depreciation, amortization and other purchase accounting | | 985.3 | | 164.7 | | 7.2 | | 1,157.2 | | 796.3 | | 166.2 | | 5.3 | | 967.8 | |
Interest, net of interest income | | 156.5 | | 24.1 | | 132.3 | | 312.9 | | 151.7 | | 23.2 | | 184.4 | | 359.3 | |
Noncontrolling interest | | — | | — | | — | | — | | — | | — | | (8.8 | ) | (8.8 | ) |
EBITDA | | 1,438.2 | | 227.0 | | (73.2 | ) | 1,592.0 | | 1,221.1 | | 168.4 | | (135.4 | ) | 1,254.1 | |
Adjustments: | | | | | | | | | | | | | | | | | |
Car rental fleet interest | | (149.4 | ) | — | | — | | (149.4 | ) | (140.9 | ) | — | | — | | (140.9 | ) |
Car rental fleet depreciation | | (905.8 | ) | — | | — | | (905.8 | ) | (724.0 | ) | — | | — | | (724.0 | ) |
Non-cash expenses and charges (a) | | 21.4 | | — | | 15.0 | | 36.4 | | 7.7 | | — | | 16.0 | | 23.7 | |
Extraordinary, unusual or non-recurring gains and losses (b) | | 20.7 | | 6.7 | | 15.1 | | 42.5 | | 5.5 | | 35.9 | | 74.2 | | 115.6 | |
Corporate EBITDA | | $ | 425.1 | | $ | 233.7 | | $ | (43.1 | ) | 615.7 | | $ | 369.4 | | $ | 204.3 | | $ | (45.2 | ) | 528.5 | |
Non-fleet capital expenditures, net | | | | | | | | (80.7 | ) | | | | | | | (97.0 | ) |
Changes in working capital: | | | | | | | | | | | | | | | | | |
Receivables, excluding car rental fleet receivables | | | | | | | | (228.2 | ) | | | | | | | (173.7 | ) |
Accounts payable and capital leases | | | | | | | | 689.1 | | | | | | | | 624.5 | |
Accrued liabilities and other | | | | | | | | (33.0 | ) | | | | | | | (211.2 | ) |
Acquisition and other investing activities | | | | | | | | (162.5 | ) | | | | | | | (42.6 | ) |
Other financing activities, excluding debt | | | | | | | | (57.2 | ) | | | | | | | (89.9 | ) |
Foreign exchange impact on cash and cash equivalents | | | | | | | | (4.8 | ) | | | | | | | 31.6 | |
Unlevered pre-tax cash flow | | | | | | | | 738.4 | | | | | | | | 570.2 | |
Corporate net cash interest | | | | | | | | (167.1 | ) | | | | | | | (230.6 | ) |
Corporate cash taxes | | | | | | | | (37.7 | ) | | | | | | | (25.3 | ) |
Levered after-tax cash flow before fleet growth | | | | | | | | 533.6 | | | | | | | | 314.3 | |
Equipment rental revenue earning equipment expenditures, net of disposal proceeds | | | | | | | | (306.4 | ) | | | | | | | (133.0 | ) |
Car rental fleet equity requirement | | | | | | | | (641.0 | ) | | | | | | | (776.4 | ) |
Corporate cash flow | | | | | | | | $ | (413.8 | ) | | | | | | | $ | (595.1 | ) |
Table 6 (pg. 2)
(a) As defined in the credit agreements for the senior credit facilities, Corporate EBITDA excludes the impact of certain non-cash expenses and charges. The adjustments reflect the following:
NON-CASH EXPENSES AND CHARGES
| | Three Months Ended June 30, 2012 | | Three Months Ended June 30, 2011 | |
| | | | | | Other | | | | | | | | Other | | | |
| | Car | | Equipment | | Reconciling | | | | Car | | Equipment | | Reconciling | | | |
| | Rental | | Rental | | Items | | Total | | Rental | | Rental | | Items | | Total | |
| | | | | | | | | | | | | | | | | |
Non-cash amortization of debt costs included in car rental fleet interest | | $ | 10.4 | | $ | — | | $ | — | | $ | 10.4 | | $ | 10.3 | | $ | — | | $ | — | | $ | 10.3 | |
Non-cash stock-based employee compensation charges | | — | | — | | 7.5 | | 7.5 | | — | | — | | 7.6 | | 7.6 | |
Derivative (gains) losses | | | | | | | | — | | 0.1 | | | | (0.1 | ) | — | |
Pension adjustment | | — | | — | | — | | — | | (13.1 | ) | — | | — | | (13.1 | ) |
Total non-cash expenses and charges | | $ | 10.4 | | $ | — | | $ | 7.5 | | $ | 17.9 | | $ | (2.7 | ) | $ | — | | $ | 7.5 | | $ | 4.8 | |
NON-CASH EXPENSES AND CHARGES
| | Six Months Ended June 30, 2012 | | Six Months Ended June 30, 2011 | |
| | | | | | Other | | | | | | | | Other | | | |
| | Car | | Equipment | | Reconciling | | | | Car | | Equipment | | Reconciling | | | |
| | Rental | | Rental | | Items | | Total | | Rental | | Rental | | Items | | Total | |
| | | | | | | | | | | | | | | | | |
Non-cash amortization of debt costs included in car rental fleet interest | | $ | 21.4 | | $ | — | | $ | — | | $ | 21.4 | | $ | 20.2 | | $ | — | | $ | — | | $ | 20.2 | |
Non-cash stock-based employee compensation charges | | — | | — | | 15.0 | | 15.0 | | — | | — | | 16.6 | | 16.6 | |
Derivative (gains) losses | | | | — | | | | — | | 0.6 | | — | | (0.6 | ) | — | |
Pension adjustment | | — | | — | | — | | — | | (13.1 | ) | — | | — | | (13.1 | ) |
Total non-cash expenses and charges | | $ | 21.4 | | $ | — | | $ | 15.0 | | $ | 36.4 | | $ | 7.7 | | $ | — | | $ | 16.0 | | $ | 23.7 | |
(b) As defined in the credit agreements for the senior credit facilities, Corporate EBITDA excludes the impact of extraordinary, unusual or non-recurring gains or losses or charges or credits. The adjustments reflect the following:
EXTRAORDINARY, UNUSUAL OR NON-RECURRING ITEMS
| | Three Months Ended June 30, 2012 | | Three Months Ended June 30, 2011 | |
| | | | | | Other | | | | | | | | Other | | | |
| | Car | | Equipment | | Reconciling | | | | Car | | Equipment | | Reconciling | | | |
| | Rental | | Rental | | Items | | Total | | Rental | | Rental | | Items | | Total | |
| | | | | | | | | | | | | | | | | |
Restructuring charges | | $ | 11.8 | | $ | 2.5 | | $ | 1.8 | | $ | 16.1 | | $ | 3.5 | | $ | 29.8 | | $ | 0.4 | | $ | 33.7 | |
Restructuring related charges | | 3.1 | | — | | 1.9 | | 5.0 | | 0.5 | | 2.3 | | — | | 2.8 | |
Acquisition related costs | | — | | — | | 4.5 | | 4.5 | | — | | — | | 6.1 | | 6.1 | |
Premiums paid on debt | | — | | — | | — | | — | | — | | — | | 10.7 | | 10.7 | |
Total extraordinary, unusual or non-recurring items | | $ | 14.9 | | $ | 2.5 | | $ | 8.2 | | $ | 25.6 | | $ | 4.0 | | $ | 32.1 | | $ | 17.2 | | $ | 53.3 | |
EXTRAORDINARY, UNUSUAL OR NON-RECURRING ITEMS
| | Six Months Ended June 30, 2012 | | Six Months Ended June 30, 2011 | |
| | | | | | Other | | | | | | | | Other | | | |
| | Car | | Equipment | | Reconciling | | | | Car | | Equipment | | Reconciling | | | |
| | Rental | | Rental | | Items | | Total | | Rental | | Rental | | Items | | Total | |
| | | | | | | | | | | | | | | | | |
Restructuring charges | | $ | 17.0 | | $ | 6.7 | | $ | 1.8 | | $ | 25.5 | | $ | 4.5 | | $ | 33.6 | | $ | 0.3 | | $ | 38.4 | |
Restructuring related charges | | 3.7 | | — | | 1.9 | | 5.6 | | 1.0 | | 2.3 | | — | | 3.3 | |
Acquisition related costs | | — | | — | | 11.4 | | 11.4 | | — | | — | | 9.0 | | 9.0 | |
Premiums paid on debt | | — | | — | | — | | — | | — | | — | | 62.4 | | 62.4 | |
Management transition costs | | — | | — | | — | | — | | — | | — | | 2.5 | | 2.5 | |
Total extraordinary, unusual or non-recurring items | | $ | 20.7 | | $ | 6.7 | | $ | 15.1 | | $ | 42.5 | | $ | 5.5 | | $ | 35.9 | | $ | 74.2 | | $ | 115.6 | |
Table 7
HERTZ GLOBAL HOLDINGS, INC.
RECONCILIATION OF GAAP TO NON-GAAP EARNINGS MEASURES
(In millions, except as noted)
Unaudited
RECONCILIATION FROM OPERATING CASH FLOWS TO EBITDA:
| | Three Months Ended | | Six Months Ended | |
| | June 30, | | June 30, | |
| | 2012 | | 2011 | | 2012 | | 2011 | |
| | | | | | | | | |
Net cash provided by operating activities | | $ | 666.4 | | $ | 521.3 | | $ | 1,158.4 | | $ | 686.9 | |
Amortization and write-off of debt costs | | (20.6 | ) | (27.0 | ) | (45.4 | ) | (86.9 | ) |
Provision for losses on doubtful accounts | | (6.7 | ) | (8.0 | ) | (13.6 | ) | (14.3 | ) |
Derivative gains (losses) | | (2.1 | ) | (4.7 | ) | 0.9 | | 2.2 | |
Gain (loss) on sale of property and equipment | | 0.5 | | 2.4 | | 0.7 | | 4.7 | |
Loss on revaluation of foreign denominated debt | | — | | — | | (2.5 | ) | — | |
Stock-based compensation charges | | (7.5 | ) | (7.6 | ) | (15.0 | ) | (16.6 | ) |
Asset writedowns | | (0.4 | ) | (22.6 | ) | (3.2 | ) | (23.3 | ) |
Lease charges | | 21.5 | | 22.7 | | 44.6 | | 46.3 | |
Noncontrolling interest | | — | | (5.1 | ) | — | | (8.8 | ) |
Deferred income taxes | | (28.9 | ) | 2.7 | | (31.3 | ) | 29.2 | |
Provision for taxes on income | | 65.8 | | 34.5 | | 85.3 | | 4.6 | |
Interest expense, net of interest income | | 151.7 | | 164.3 | | 312.9 | | 359.3 | |
Changes in assets and liabilities | | 52.1 | | 57.4 | | 100.2 | | 270.8 | |
EBITDA | | $ | 891.8 | | $ | 730.3 | | $ | 1,592.0 | | $ | 1,254.1 | |
NET CORPORATE DEBT, NET FLEET DEBT AND TOTAL NET DEBT
| | June 30, | | March 31, | | December 31, | | June 30, | | March 31, | | December 31, | | June 30, | |
| | 2012 | | 2012 | | 2011 | | 2011 | | 2011 | | 2010 | | 2010 | |
| | | | | | | | | | | | | | | |
Total Corporate Debt | | $ | 4,767.9 | | $ | 4,645.2 | | $ | 4,704.8 | | $ | 4,846.8 | | $ | 5,202.2 | | $ | 5,830.7 | | $ | 4,605.6 | |
Total Fleet Debt | | 7,700.0 | | 6,780.5 | | 6,612.3 | | 6,846.8 | | 5,547.8 | | 5,475.7 | | 7,088.2 | |
Total Debt | | $ | 12,467.9 | | $ | 11,425.7 | | $ | 11,317.1 | | $ | 11,693.6 | | $ | 10,750.0 | | $ | 11,306.4 | | $ | 11,693.8 | |
| | | | | | | | | | | | | | | |
Corporate Restricted Cash | | | | | | | | | | | | | | | |
Restricted Cash, less: | | $ | 175.4 | | $ | 211.9 | | $ | 308.0 | | $ | 274.3 | | $ | 190.9 | | $ | 207.6 | | $ | 743.4 | |
Restricted Cash Associated with Fleet Debt | | (104.0 | ) | (126.5 | ) | (213.6 | ) | (183.2 | ) | (110.2 | ) | (115.6 | ) | (671.2 | ) |
Corporate Restricted Cash | | $ | 71.4 | | $ | 85.4 | | $ | 94.4 | | $ | 91.1 | | $ | 80.7 | | $ | 92.0 | | $ | 72.2 | |
| | | | | | | | | | | | | | | |
Net Corporate Debt | | | | | | | | | | | | | | | |
Corporate Debt, less: | | $ | 4,767.9 | | $ | 4,645.2 | | $ | 4,704.8 | | $ | 4,846.8 | | $ | 5,202.2 | | $ | 5,830.7 | | $ | 4,605.6 | |
Cash and Cash Equivalents | | (586.2 | ) | (594.7 | ) | (931.8 | ) | (747.6 | ) | (1,365.8 | ) | (2,374.2 | ) | (896.8 | ) |
Corporate Restricted Cash | | (71.4 | ) | (85.4 | ) | (94.4 | ) | (91.1 | ) | (80.7 | ) | (92.0 | ) | (72.2 | ) |
Net Corporate Debt | | $ | 4,110.3 | | $ | 3,965.1 | | $ | 3,678.6 | | $ | 4,008.1 | | $ | 3,755.7 | | $ | 3,364.5 | | $ | 3,636.6 | |
| | | | | | | | | | | | | | | |
Net Fleet Debt | | | | | | | | | | | | | | | |
Fleet Debt, less: | | $ | 7,700.0 | | $ | 6,780.5 | | $ | 6,612.3 | | $ | 6,846.8 | | $ | 5,547.8 | | $ | 5,475.7 | | $ | 7,088.2 | |
Restricted Cash Associated with Fleet Debt | | (104.0 | ) | (126.5 | ) | (213.6 | ) | (183.2 | ) | (110.2 | ) | (115.6 | ) | (671.2 | ) |
Net Fleet Debt | | $ | 7,596.0 | | $ | 6,654.0 | | $ | 6,398.7 | | $ | 6,663.6 | | $ | 5,437.6 | | $ | 5,360.1 | | $ | 6,417.0 | |
| | | | | | | | | | | | | | | |
Total Net Debt | | $ | 11,706.3 | | $ | 10,619.1 | | $ | 10,077.3 | | $ | 10,671.7 | | $ | 9,193.3 | | $ | 8,724.6 | | $ | 10,053.6 | |
CAR RENTAL RATE REVENUE PER TRANSACTION DAY (a)
| | Three Months Ended | | Six Months Ended | |
| | June 30, | | June 30, | |
| | 2012 | | 2011 | | 2012 | | 2011 | |
| | | | | | | | | |
Car rental segment revenues (b) | | $ | 1,889.6 | | $ | 1,768.8 | | $ | 3,547.9 | | $ | 3,279.1 | |
Non-rental rate revenue | | (419.4 | ) | (290.3 | ) | (788.7 | ) | (535.9 | ) |
Foreign currency adjustment | | 1.3 | | (55.3 | ) | (9.6 | ) | (75.0 | ) |
Rental rate revenue | | $ | 1,471.5 | | $ | 1,423.2 | | $ | 2,749.6 | | $ | 2,668.2 | |
Transactions days (in thousands) | | 37,256 | | 34,826 | | 68,925 | | 64,476 | |
Rental rate revenue per transaction day (in whole dollars) | | $ | 39.50 | | $ | 40.87 | | $ | 39.89 | | $ | 41.38 | |
EQUIPMENT RENTAL AND RENTAL RELATED REVENUE (a)
| | Three Months Ended | | Six Months Ended | |
| | June 30, | | June 30, | |
| | 2012 | | 2011 | | 2012 | | 2011 | |
| | | | | | | | | |
Equipment rental segment revenues | | $ | 335.0 | | $ | 301.7 | | $ | 637.1 | | $ | 569.9 | |
Equipment sales and other revenue | | (31.3 | ) | (29.4 | ) | (57.6 | ) | (52.8 | ) |
Foreign currency adjustment | | (0.7 | ) | (6.2 | ) | (2.2 | ) | (9.6 | ) |
Rental and rental related revenue | | $ | 303.0 | | $ | 266.1 | | $ | 577.3 | | $ | 507.5 | |
(a) Based on 12/31/11 foreign exchange rates.
(b) Includes U.S. off-airport revenues of $325.0 million and $288.8 million for the three months ended June 30, 2012 and 2011, respectively, and $608.9 million and $551.2 million for the six months ended June 30, 2012 and 2011, respectively.
Exhibit 1
Non-GAAP Measures: Definitions and Use/Importance
Hertz Global Holdings, Inc. (“Hertz Holdings”) is our top-level holding company. The Hertz Corporation (“Hertz”) is our primary operating company. The term “GAAP” refers to accounting principles generally accepted in the United States of America.
Definitions of non-GAAP measures utilized in Hertz Holdings’ July 30, 2012 Press Release are set forth below. Also set forth below is a summary of the reasons why management of Hertz Holdings and Hertz believes that the presentation of the non-GAAP financial measures included in the Press Release provide useful information regarding Hertz Holdings’ and Hertz’s financial condition and results of operations and additional purposes, if any, for which management of Hertz Holdings and Hertz utilize the non-GAAP measures.
1. Earnings Before Interest, Taxes, Depreciation and Amortization (“EBITDA”) and Corporate EBITDA
EBITDA is defined as net income before net interest expense, income taxes and depreciation (which includes revenue earning equipment lease charges) and amortization. Corporate EBITDA, as presented herein, represents EBITDA as adjusted for car rental fleet interest, car rental fleet depreciation and certain other items, as described in more detail in the accompanying tables.
Management uses EBITDA and Corporate EBITDA as operating performance and liquidity metrics for internal monitoring and planning purposes, including the preparation of our annual operating budget and monthly operating reviews, as well as to facilitate analysis of investment decisions, profitability and performance trends. Further, EBITDA enables management and investors to isolate the effects on profitability of operating metrics such as revenue, operating expenses and selling, general and administrative expenses, which enables management and investors to evaluate our two business segments that are financed differently and have different depreciation characteristics and compare our performance against companies with different capital structures and depreciation policies. We also present Corporate EBITDA as a supplemental measure because such information is utilized in the calculation of financial covenants under Hertz’s senior credit facilities.
EBITDA and Corporate EBITDA are not recognized measurements under GAAP. When evaluating our operating performance or liquidity, investors should not consider EBITDA and Corporate EBITDA in isolation of, or as a substitute for, measures of our financial performance and liquidity as determined in accordance with GAAP, such as net income, operating income or net cash provided by operating activities.
2. Adjusted Pre-Tax Income
Adjusted pre-tax income is calculated as income before income taxes plus non-cash purchase accounting charges, non-cash debt charges relating to the amortization of debt financing costs and debt discounts and certain one-time charges and non-operational items. Adjusted pre-tax income is important to management because it allows management to assess operational performance of our business, exclusive of the items mentioned above. It also allows management to assess the performance of the entire business on the same basis as the segment measure of profitability. Management believes that it is important to investors for the same reasons it is important to management and because it allows them to assess the operational performance of the Company on the same basis that management uses internally.
3. Adjusted Net Income
Adjusted net income is calculated as adjusted pre-tax income less a provision for income taxes derived utilizing a normalized income tax rate (34% in 2012 and 2011) and noncontrolling interest. The normalized income tax rate is management’s estimate of our long-term tax rate. Adjusted net income is important to management and investors because it represents our operational performance exclusive of the effects of purchase accounting, non-cash debt charges, one-time charges and items that are not operational in nature or comparable to those of our competitors.
4. Adjusted Diluted Earnings Per Share
Adjusted diluted earnings per share is calculated as adjusted net income divided by, for the three months ended June 30, 2012, 447.4 million which represents the weighted average diluted shares outstanding for the period, for the six months ended June 30, 2012, 447.9 million which represents the weighted average diluted shares outstanding for the period and for the three months ended June 30, 2011, 450.0 million which represents the approximate number of shares outstanding at June 30, 2011, for the six months ended June 30, 2011, 431.5 million which represents the average for the period. Adjusted diluted earnings per share is important to management and investors because it represents a measure of our operational performance exclusive of the effects of purchase accounting adjustments, non-cash debt charges, one-time charges and items that are not operational in nature or comparable to those of our competitors.
5. Transaction Days
Transaction days represent the total number of days that vehicles were on rent in a given period.
6. Car Rental Rate Revenue, Rental Rate Revenue Per Transaction Day and Rental Rate Revenue Per Transaction
Car rental rate revenue consists of all revenue, net of discounts, associated with the rental of cars including charges for optional insurance products, but excluding revenue derived from fueling and concession and other expense pass-throughs, NeverLost units in the U.S. and certain ancillary revenue. Rental rate revenue per transaction day is calculated as total rental rate revenue, divided by the total number of transaction days, with all periods adjusted to eliminate the effect of fluctuations in foreign currency. Rental rate revenue per transaction is calculated as total rental rate revenue, divided by the total number of transactions, with all periods adjusted to eliminate the effects of fluctuations in foreign currency. Our management believes eliminating the effect of fluctuations in foreign currency is appropriate so as not to affect the comparability of underlying trends. These statistics are important to management and investors as they represent the best measurements of the changes in underlying pricing in the car rental business and encompass the elements in car rental pricing that management has the ability to control. The optional insurance products are packaged within certain negotiated corporate, government and membership programs and within certain retail rates being charged. Based upon these existing programs and rate packages, management believes that these optional insurance products should be consistently included in the daily pricing of car rental transactions. On the other hand, non-rental rate revenue items such as refueling and concession pass-through expense items are driven by factors beyond the control of management (i.e. the price of fuel and the concession fees charged by airports). Additionally, NeverLost units are an optional revenue product which management does not consider to be part of their daily pricing of car rental transactions.
7. Equipment Rental and Rental Related Revenue
Equipment rental and rental related revenue consists of all revenue, net of discounts, associated with the rental of equipment including charges for delivery, loss damage waivers and fueling, but excluding revenue arising from the sale of equipment, parts and supplies and certain other ancillary revenue. Rental and rental related revenue is adjusted in all periods to eliminate the effect of fluctuations in foreign currency. Our management believes eliminating the effect of fluctuations in foreign currency is appropriate so as not to affect the comparability of underlying trends. This statistic is important to our management and to investors as it is utilized in the measurement of rental revenue generated per dollar invested in fleet on an annualized basis and is comparable with the reporting of other industry participants.
8. Same Store Revenue Growth/Decline
Same store revenue growth or decline is calculated as the year over year change in revenue for locations that are open at the end of the period reported and have been operating under our direction for more than twelve months. The same store revenue amounts are adjusted in all periods to eliminate the effect of fluctuations in foreign currency. Our management believes eliminating the effect of fluctuations in foreign currency is appropriate so as not to affect the comparability of underlying trends.
9. Unlevered Pre-Tax Cash Flow
Unlevered pre-tax cash flow is calculated as Corporate EBITDA less non-fleet capital expenditures, net of non-fleet disposals, plus changes in working capital (receivables, excluding car rental receivables, inventories, prepaid expenses, accounts payable and accrued liabilities), cash used for acquisitions, cash used for / provided by other investing activities, cash used / provided by non-debt financing activities and the foreign exchange impact on cash and cash equivalents. Unlevered pre-tax cash flow is important to management and investors as it represents funds available to pay corporate interest and taxes and to grow our fleet or reduce debt.
10. Levered After-Tax Cash Flow Before Fleet Growth
Levered after-tax cash flow before fleet growth is calculated as Unlevered Pre-Tax Cash Flow less corporate net cash interest and corporate cash taxes. Levered after-tax cash flow before fleet growth is important to management and investors as it represents the funds available to grow our fleet or reduce our debt.
11. Corporate Net Cash Interest (used in the calculation of Levered After-Tax Cash Flow Before Fleet Growth)
Corporate net cash interest represents cash paid by the Company during the period for interest expense relating to Corporate Debt. Corporate net cash interest helps management and investors measure the ongoing costs of financing the business exclusive of the costs associated with the fleet financing.
12. Corporate Cash Taxes (used in the calculation of Levered After-Tax Cash Flow Before Fleet Growth)
Corporate cash taxes represents cash paid by the Company during the period for income taxes.
13. Corporate Cash Flow
Corporate cash flow is calculated as Levered After-Tax Cash Flow Before Fleet Growth less equipment rental fleet growth capital expenditures, net of disposal proceeds and less the car rental fleet equity requirement. Corporate cash flow is important to management and investors as it represents the cash available for the reduction of corporate debt.
14. Net Corporate Debt
Net corporate debt is calculated as total debt excluding fleet debt less cash and equivalents and corporate restricted cash. Corporate debt consists of our Senior Term Facility; Senior ABL Facility; Senior Notes; Senior Subordinated Notes, Convertible Senior Notes; and certain other indebtedness of our domestic and foreign subsidiaries. Net Corporate Debt is important to management, investors and ratings agencies as it helps measure our leverage. Net Corporate Debt also assists in the evaluation of our ability to service our non-fleet-related debt without reference to the expense associated with the fleet debt, which is fully collateralized by assets not available to lenders under the non-fleet debt facilities.
15. Corporate Restricted Cash (used in the calculation of Net Corporate Debt)
Total restricted cash includes cash and cash equivalents that are not readily available for our normal disbursements. Total restricted cash and equivalents are restricted for the purchase of revenue earning vehicles and other specified uses under our Fleet Debt facilities, our like-kind exchange programs and to satisfy certain of our self insurance regulatory reserve requirements. Corporate restricted cash is calculated as total restricted cash less restricted cash associated with fleet debt.
16. Net Fleet Debt
Net fleet debt is calculated as total fleet debt less restricted cash associated with fleet debt. As of June 30, 2012, fleet debt consists of U.S. Fleet Variable Funding Notes, U.S. Fleet Medium Term Notes, Donlen GN II Variable Funding Notes, U.S. Fleet Financing Facility, European Revolving Credit Facility, European Fleet Notes, European Securitization, Canadian Securitization, Australian Securitization, Brazilian Fleet Financing and Capitalized Leases relating to revenue earning equipment. This measure is important to management, investors and ratings agencies as it helps measure our leverage.
17. Restricted Cash Associated with Fleet Debt (used in the calculation of Net Fleet Debt and Corporate Restricted Cash)
Restricted cash associated with fleet debt is restricted for the purchase of revenue earning vehicles and other specified uses under our Fleet Debt facilities and our car rental like-kind exchange program.
18. Total Net Debt
Total net debt is calculated as net corporate debt plus net fleet debt. This measure is important to management, investors and ratings agencies as it helps measure our leverage.