Exhibit 99.1
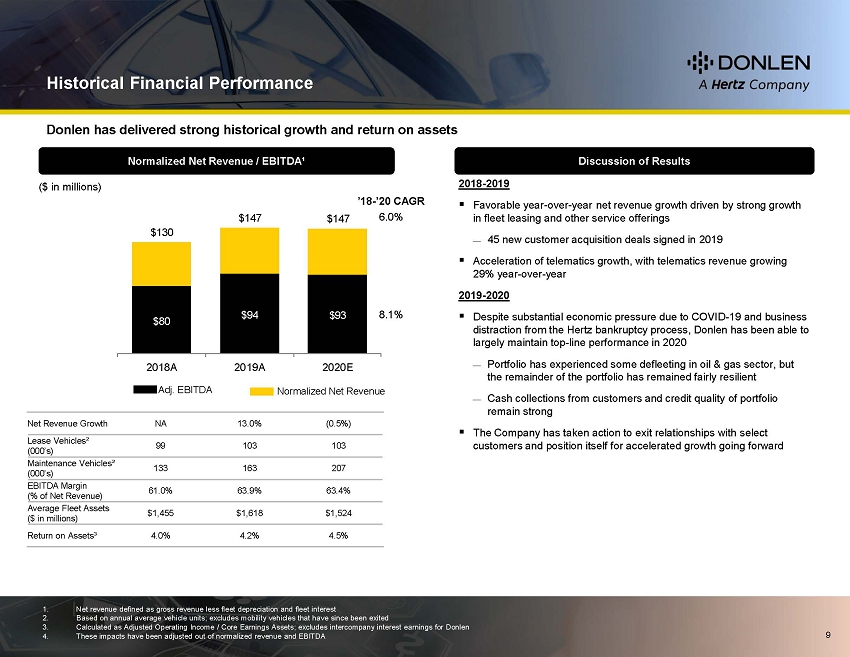
Historical Financial PerformanceDonlen has delivered strong historical growth and return on assets($ in millions)Normalized Net Revenue / EBITDA¹ Discussion of Results2018-2019$130$147 $147’18-’20 CAGR 6.0% Favorable year-over-year net revenue growth driven by strong growth in fleet leasing and other service offerings 45 new customer acquisition deals signed in 2019 Acceleration of telematics growth, with telematics revenue growing 29% year-over-year$80 $94 $932018A 2019A 2020E8.1%2019-2020 Despite substantial economic pressure due to COVID-19 and business distraction from the Hertz bankruptcy process, Donlen has been able to largely maintain top-line performance in 2020 Portfolio has experienced some defleeting in oil & gas sector, but the remainder of the portfolio has remained fairly resilientAdj. EBITDANormalized Net Revenue Cash collections from customers and credit quality of portfolio remain strongNet Revenue Growth NA 13.0% (0.5%) The Company has taken action to exit relationships with selectLease Vehicles² (000’s) Maintenance Vehicles²99 103 103customers and position itself for accelerated growth going forward(000’s) 133 163 207 EBITDA Margin (% of Net Revenue) 61.0% 63.9% 63.4% Average Fleet Assets ($ in millions) $1,455 $1,618 $1,524Return on Assets³ 4.0% 4.2% 4.5%1. Net revenue defined as gross revenue less fleet depreciation and fleet interest 2. Based on annual average vehicle units; excludes mobility vehicles that have since been exited 3. Calculated as Adjusted Operating Income / Core Earnings Assets; excludes intercompany interest earnings for Donlen 4. These impacts have been adjusted out of normalized revenue and EBITDA9

Projected Financial Performance($ in millions)Net Revenue / EBITDA¹ Highlights2021-2025’21-’25 CAGR As a standalone company, Donlen will not be limited in its pursuit of$155 $167$181$199$2168.8%new clients by the overhang of a bankrupt parent entity Management projects meaningful but highly achievable growth in both leasing and non-leasing vehicle units$97 $105 $115 $128$1409.6% Coupled with efficient asset utilization, Donlen’s return on assets is projected to accelerate as the Company expands its breadth and penetration of products and services2021E 2022E 2023E 2024E 2025EReturn on Assets3EBITDANet Revenue5.0% 5.1% 5.1%5.4% 5.6%Net Revenue Growth 5.5% 7.8% 8.5% 9.9% 8.9%Lease Vehicles² (000’s) 109 120 134 150 167 Maintenance Vehicles² (000’s) 242 265 287 309 331 EBITDA Margin (% of Net Revenue) 62.8% 63.1% 63.4% 64.3% 64.8% Average Fleet Assets ($ in millions) $1,677 $1,798 $1,968 $2,139 $2,298Return on Assets³ 5.0% 5.1% 5.1% 5.4% 5.6%2021E 2022E 2023E 2024E 2025E1. Net revenue defined as gross revenue less fleet carrying costs 2. Based on annual average vehicle units 3. Calculated as Adjusted Operating Income / Core Earnings Assets; excludes intercompany interest earnings for Donlen10