Exhibit 99.2
| Hewlett-Packard Separation Will Create Two New Industry-Leading Public Companies Investor Presentation October 6, 2014 |

| Safe harbor 2 This presentation contains forward-looking statements that involve risks, uncertainties and assumptions. If the risks or uncertainties ever materialize or the assumptions prove incorrect, the results of HP may differ materially from those expressed or implied by such forward-looking statements and assumptions. All statements other than statements of historical fact are statements that could be deemed forward-looking statements, including but not limited to any statements of the plans, strategies and objectives of HP for future operations, including the separation transaction; the future performance of Hewlett-Packard Enterprise and HP Inc. if the separation is completed; the execution of restructuring plans and any resulting cost savings or revenue or profitability improvements; any projections of revenue, margins, expenses, HP’s effective tax rate, net earnings, net earnings per share, cash flows, benefit plan funding, share repurchases, currency exchange rates or other financial items; any projections of the amount, timing or impact of cost savings or restructuring charges; any statements concerning the expected development, performance, market share or competitive performance relating to products or services; any statements regarding current or future macroeconomic trends or events and the impact of those trends and events on HP and its financial performance; any statements regarding pending investigations, claims or disputes; any statements of expectation or belief; and any statements of assumptions underlying any of the foregoing. Risks, uncertainties and assumptions include the need to address the many challenges facing HP’s businesses; the competitive pressures faced by HP’s businesses; risks associated with executing HP’s strategy, including the planned separation transaction; the impact of macroeconomic and geopolitical trends and events; the need to manage third-party suppliers and the distribution of HP’s products and services effectively; the protection of HP’s intellectual property assets, including intellectual property licensed from third parties; risks associated with HP’s international operations; the development and transition of new products and services and the enhancement of existing products and services to meet customer needs and respond to emerging technological trends; the execution and performance of contracts by HP and its suppliers, customers and partners; the hiring and retention of key employees; integration and other risks associated with business combination and investment transactions; the execution, timing and results of the separation transaction or restructuring plans, including estimates and assumptions related to the cost including any possible disruption of HP’s business and the anticipated benefits of implementing the separation transaction and restructuring plans; the resolution of pending investigations, claims and disputes; and other risks that are described in HP’s Annual Report on Form 10-K for the fiscal year ended October 31, 2013, and HP’s other filings with the Securities and Exchange Commission, including HP’s Quarterly Report on Form 10-Q for the fiscal quarter ended July 31, 2014. As in prior periods, the financial information set forth in this presentation, including tax-related items, reflects estimates based on information available at this time. While HP believes these estimates to be reasonable, these amounts could differ materially from actual reported amounts in HP’s Annual Report on Form 10-K for the fiscal year ended October 31, 2014. HP assumes no obligation and does not intend to update these forward-looking statements. |

| Use of non-GAAP financial information 3 To supplement HP’s historical and forecasted financial results presented on a GAAP basis, HP provides revenue on a constant currency basis, HP’s non-GAAP tax rate, non-GAAP diluted net earnings per share and free cash flow. Definitions of these non-GAAP financial measures and reconciliations of these non-GAAP financial measures to the most directly comparable GAAP financial measures are included elsewhere in this presentation and available in the supplemental information provided at www.hp.com/investor/2014OctAnnouncement/. HP’s management uses revenue on a constant currency basis, HP’s non-GAAP tax rate and non-GAAP diluted net earnings per share to evaluate and forecast HP’s performance before gains, losses or other charges that are considered by HP’s management to be outside of HP’s core business segment operating results. Free cash flow is a liquidity measure that provides useful information to management about the amount of cash available for investment in HP’s businesses, funding strategic acquisitions, repurchasing stock and other purposes. These non-GAAP financial measures may have limitations as analytical tools, and these measures should not be considered in isolation or as a substitute for analysis of HP’s results as reported under GAAP. Items such as amortization of purchased intangible assets, though not directly affecting HP’s cash position, represent the loss in value of intangible assets over time. The expense associated with this loss in value is not included in non-GAAP diluted net earnings per share and HP’s non-GAAP tax rate and therefore does not reflect the full economic effect of the loss in value of those intangible assets. In addition, items such as restructuring charges that are excluded from non-GAAP diluted net earnings per share and HP’s non-GAAP tax rate can have a material impact on cash flows and earnings per share. Free cash flow does not represent the total increase or decrease in the cash balance for the period. The non-GAAP financial information that we provide also may differ from the non-GAAP information provided by other companies. We compensate for the limitations on our use of these non-GAAP financial measures by relying primarily on our GAAP financial statements and using non-GAAP financial measures only supplementally. We also provide robust and detailed reconciliations of each non-GAAP financial measure to the most directly comparable GAAP measure, and we encourage investors to review carefully those reconciliations. We believe that providing these non-GAAP financial measures in addition to the related GAAP measures provides investors with greater transparency to the information used by HP’s management in its financial and operational decision-making and allows investors to see HP’s results “through the eyes” of management. We further believe that providing this information better enables investors to understand HP’s operating performance and to evaluate the efficacy of the methodology and information used by management to evaluate and measure such performance. |

| Defining the next generation of technology infrastructure, software and services for the New Style of IT Build upon HP’s leading position in servers, storage, networking, converged systems, services and software as well as the company’s OpenStack Helion cloud platform Meg Whitman to be President and Chief Executive Officer of Hewlett-Packard Enterprise; Pat Russo to be Chairman of the Hewlett-Packard Enterprise board Leading personal systems and printing company delivering innovation that will empower people to create, interact and inspire like never before Strong roadmap into some of the most exciting new technologies like 3D printing and new computing experiences Dion Weisler to be President and Chief Executive Officer of HP Inc.; Meg Whitman to be Chairman of the HP Inc. board HP to separate into two new industry-leading public companies 4 Hewlett-Packard Enterprise HP Inc. |

| Operational Improves alignment between rewards and results Simplifies organizational structures to make decisions faster Compelling rationale for separation 5 This move will accelerate the turnaround Strategic Sharper, stronger, more focused companies Better able to compete against a distinct set of competitors Faster to respond to changing customer requirements and market dynamics Financial Optimize the financial profiles of each company to enable distinct investment and growth opportunities Enhance capital allocation efficiency and investor clarity on future cash flow use The separation provides two different and compelling investment opportunities |

| Position of Strength Rebuilt financial foundation – stronger balance sheet, predictable performance Right leadership team Very strong innovation pipeline Now is the right time 6 After three years of work, we are now in a position of strength Confidence Improved credibility with customers, investors, and employees Enhanced channel relationships with industry leading programs and tools Inspired workforce and management teams Speed of Market Transitions Accelerating technology transitions require agility to respond to evolving market conditions and customer demands Increasingly competitive markets necessitate concentrated and distinctive responses for each of the new companies |

| Meg Whitman, Chief Executive Officer Two new independent publicly traded companies 7 Hewlett-Packard Enterprise HP Inc. Personal Systems 59% Printing 41% Enterprise Group 48% Enterprise Services 39% Software 7% Financial Services 6% Revenue Mix(1) Leadership Key Markets Financial Metrics(1) Revenue: $58.4B Operating Profit: $6.0B Operating Margin: 10.2% Revenue: $57.2B Operating Profit: $5.4B Operating Margin: 9.4% Dion Weisler, Chief Executive Officer Based on reported HP segment revenue and segment operating profit for the last twelve months from Q4 fiscal 2013 to Q3 fiscal 2014, totals do not include Corporate Investments segment or intercompany eliminations |

| Hewlett-Packard Enterprise strategy 8 Enabling business outcomes for enterprise customers with secure, market-leading infrastructure, software and services that help run traditional IT better and seamlessly move to the New Style of IT Infrastructure that is the foundation for the New Style of IT The Cloud that delivers the New Style of IT for the enterprise We are the only company that can deliver across these four essential elements at scale. Services that manage and transform traditional to the new Software that provides insights |

| Printing Engineering Ink and laser-based solutions that provide a faster, more affordable way to print & manage documents. Personal Systems Engineering multi-OS devices and immersive computing experiences for business and consumer HP Inc. strategy Empowering people to create, interact and inspire like never before 9 Empowering people to create, interact and inspire like never before 9 © Copyright 2014 Hewlett-Packard Development Company, L.P. The information contained herein is subject to change without notice. |
| Consistent and regular return of capital to shareholders via dividends and share repurchases Key investments will be largely organic to maintain durability of cash flows and to drive growth in new technologies Increased organic investments combined with targeted M&A that complements the existing portfolio Distributions to shareholders weighted towards share repurchases to enable capital flexibility given investment needs Capital structure and allocation principles 10 Capital structures optimized to reflect different growth opportunities and cash flow profiles of each company Investment grade credit ratings for both companies Capital allocation strategy will remain returns-based for both companies Hewlett-Packard Enterprise HP Inc. Guiding Principles |

| Separation transaction details 11 Transaction Structure Financial Implications Expected tax-free distribution to shareholders for federal income tax purposes Stock distribution ratio to be determined at a later date Timing Principal Closing Conditions Transaction is targeted to be complete by the end of fiscal year 2015 subject to market, regulatory and certain other conditions Final approval of HP Board of Directors of detailed separation agreements Receipt of favorable opinion and/or rulings with respect to the tax-free nature of the transaction for federal income tax purposes Effectiveness of a Form 10 filing with the Securities and Exchange Commission Expect to incur one-time GAAP-only charges related to the transaction during the periods preceding the closing Transaction does not impact fiscal year 2014 non-GAAP outlook Both companies are expected to be well capitalized with investment-grade credit ratings and have disciplined, returns-based approaches to capital allocation |

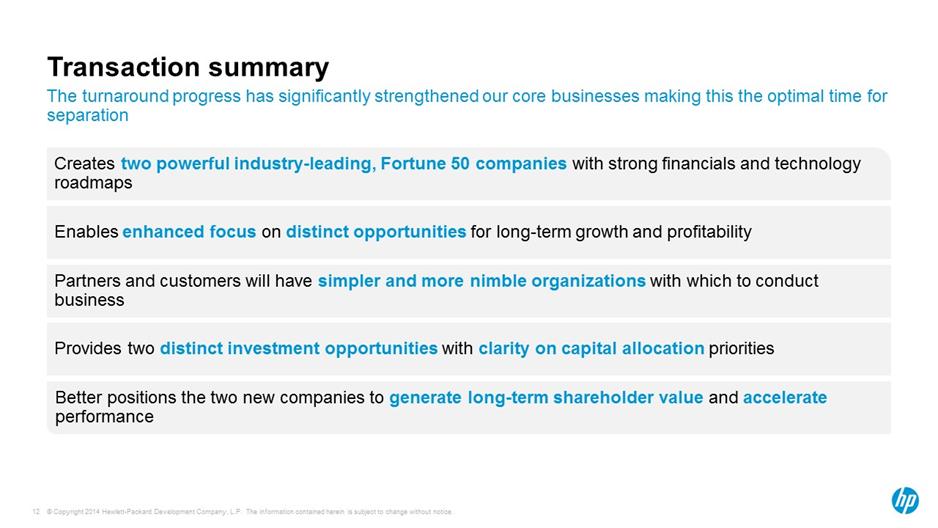
| Transaction summary 12 Creates two powerful industry-leading, Fortune 50 companies with strong financials and technology roadmaps Enables enhanced focus on distinct opportunities for long-term growth and profitability Better positions the two new companies to generate long-term shareholder value and accelerate performance Partners and customers will have simpler and more nimble organizations with which to conduct business Provides two distinct investment opportunities with clarity on capital allocation priorities The turnaround progress has significantly strengthened our core businesses making this the optimal time for separation |
| FY14 and FY15 outlook |

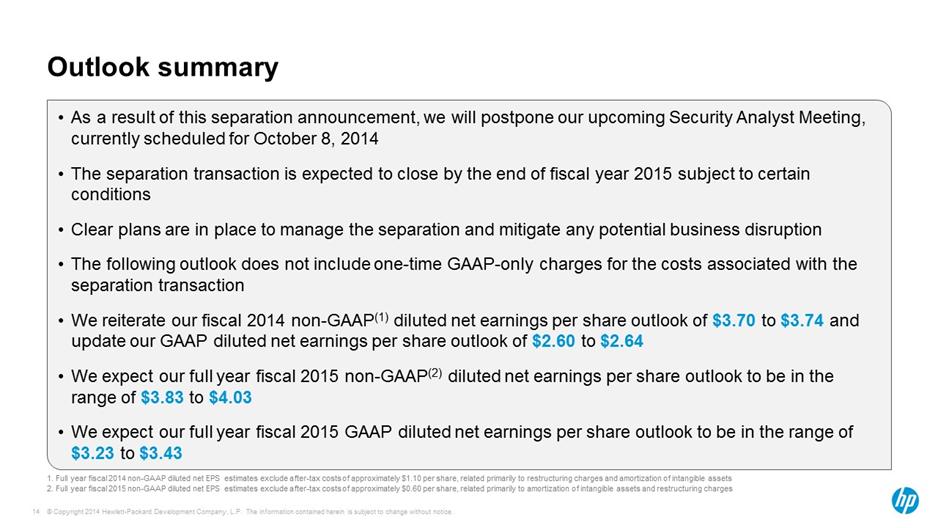
| Outlook summary 14 As a result of this separation announcement, we will postpone our upcoming Security Analyst Meeting, currently scheduled for October 8, 2014 The separation transaction is expected to close by the end of fiscal year 2015 subject to certain conditions Clear plans are in place to manage the separation and mitigate any potential business disruption The following outlook does not include one-time GAAP-only charges for the costs associated with the separation transaction We reiterate our fiscal 2014 non-GAAP(1) diluted net earnings per share outlook of $3.70 to $3.74 and update our GAAP diluted net earnings per share outlook of $2.60 to $2.64 We expect our full year fiscal 2015 non-GAAP(2) diluted net earnings per share outlook to be in the range of $3.83 to $4.03 We expect our full year fiscal 2015 GAAP diluted net earnings per share outlook to be in the range of $3.23 to $3.43 Full year fiscal 2014 non-GAAP diluted net EPS estimates exclude after-tax costs of approximately $1.10 per share, related primarily to restructuring charges and amortization of intangible assets Full year fiscal 2015 non-GAAP diluted net EPS estimates exclude after-tax costs of approximately $0.60 per share, related primarily to amortization of intangible assets and restructuring charges |
| Restructuring update Net incremental savings from increasing the headcount reductions to 55,000 are planned to be used in FY15 to fund investment opportunities in R&D and sales Restructuring plan continues As of Q3’14, approximately 36,000 employees had left the company as part of the program Total plan expected to be higher than previously communicated Estimated employee reductions were communicated during the Q2’14 earnings announcement at 45,000 to 50,000 with charge, savings and cash payment guidance provided at the low end of the range Incremental opportunities for reductions have been identified and we now anticipate a total of 55,000 reductions, independent of the separation transaction Charges, savings and cash payments will increase versus previous guidance 15 |
| FY14 outlook Full year FY14 net EPS guidance GAAP diluted net EPS $2.60 – $2.64 Non-GAAP diluted net EPS(1) $3.70 – $3.74 Full year fiscal 2014 non-GAAP diluted net EPS estimates exclude after-tax costs of approximately $1.10 per share, related primarily to restructuring charges and amortization of intangible assets 16 |

| FY15 outlook and assumptions 17 Key assumptions FY15 Revenue growth Approx. flat Y/Y in constant currency Currency impact Approx. 2% headwind to revenue Operating margin Y/Y increase Eliminations Approx. in-line with FY14 Restructuring charge $0.6B (excluded from non-GAAP results) Restructuring benefit Approx. $5.3B (+$1.8B incremental Y/Y) Non-operational assumptions OI&E Approx. $0.6B Non-GAAP tax rate 22-23% Share count Moderate decline Enterprise Services assumptions Revenue growth -3% to -5% Y/Y Operating margin 4.0% to 6.0% Outlook FY15 Non-GAAP EPS(1) $3.83 - $4.03 GAAP EPS $3.23 - $3.43 1. Full year fiscal 2015 non-GAAP diluted net EPS estimates exclude after-tax costs of approximately $0.60 per share, related primarily to amortization of intangible assets and restructuring charges 17 © Copyright 2014 Hewlett-Packard Development Company, L.P. The information contained herein is subject to change without notice. |
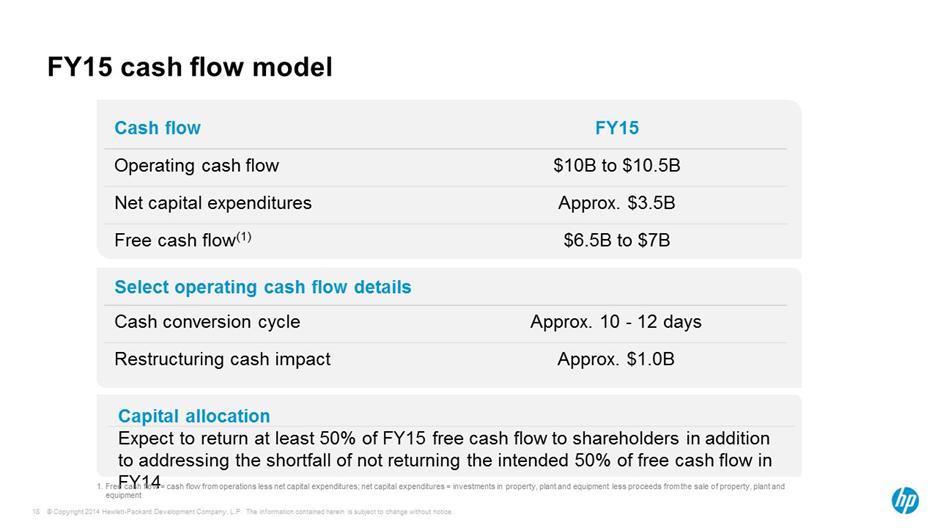
| FY15 cash flow model Select operating cash flow details Cash conversion cycle Approx. 10 - 12 days Restructuring cash impact Approx. $1.0B Cash flow FY15 Operating cash flow $10B to $10.5B Net capital expenditures Approx. $3.5B Free cash flow(1) $6.5B to $7B Capital allocation Expect to return at least 50% of FY15 free cash flow to shareholders in addition to addressing the shortfall of not returning the intended 50% of free cash flow in FY14 Free cash flow = cash flow from operations less net capital expenditures; net capital expenditures = investments in property, plant and equipment less proceeds from the sale of property, plant and equipment 18 |