Exhibit 99.A
| Investor Presentation Peter H. Soderberg Gregory N. Miller Blair A. Rieth, Jr. President & CEO SVP & CFO VP IR, Comm., & Brand |
| Forward Looking Statements Certain statements in this presentation contain forward-looking statements, within the meaning of the Private Securities Litigation Reform Act of 1995, regarding the Company's future plans, objectives, beliefs, expectations, representations and projections. The Company has tried, wherever possible, to identify these forward-looking statements using words such as "intend," "anticipate," "believe," "plan," "encourage," "expect," "may," "goal," "become," "pursue," "estimate," "strategy," "will," "projection," "forecast," "continue," "accelerate," "promise," "increase," "higher," "lower," "reduce," "improve," "expand," "progress," "potential" or the negative of those terms or other variations of them or by comparable terminology. The absence of such terms, however, does not mean that the statement is not forward-looking. It is important to note that forward-looking statements are not guarantees of future performance, and the Company's actual results could differ materially from those set forth in any forward-looking statements. Factors that could cause actual results to differ from forward-looking statements include but are not limited to: the Company's dependence on its relationships with several large national providers and group purchasing organizations, whether the Company's new products are successful in the marketplace, changes in customers' Medicare reimbursements, compliance with FDA regulations, anti-trust litigation, potential exposure to product liability or other claims, failure of the Company's announced strategic initiatives and restructuring and realignment activities to achieve expected growth, efficiencies or cost reductions, disruptions in the Company's business or other adverse consequences resulting from the potential separation of the Company's two operating companies, failure to realize anticipated benefits of the separation, failure of the Company to execute its acquisition and business alliance strategy through the consummation and successful integration of acquisitions or entry into joint ventures or other business alliances, increased costs or unavailability of raw materials, labor disruptions, the ability to retain executive officers and other key personnel, and certain tax-related matters. For a more in depth discussion of these and other factors that could cause actual results to differ from those contained in forward-looking statements, see the discussions under the heading "Risk Factors" in the Company's Annual Report on Form 10-K for the period ended September 30, 2007. The Company assumes no obligation to update or revise any forward-looking statements. All financial information in the Financial Perspective section are presented on an "as adjusted" basis and exclude the effects of special charges, separation costs, antitrust litigation costs and settlements and the write-off of certain deferred taxes. Reconciliations of these "as adjusted" amounts to those in accordance with generally accepted accounting principles in the United States are included in the Appendix to this Investor Presentation. |
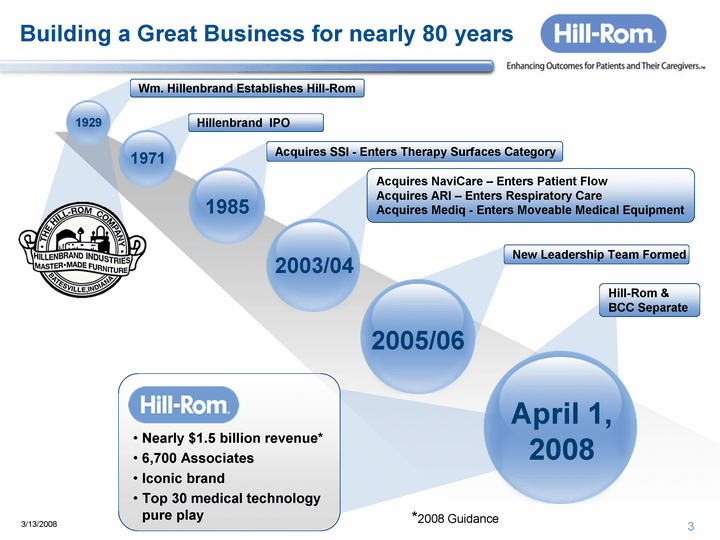
| Building a Great Business for nearly 80 years Wm. Hillenbrand Establishes Hill-Rom Hillenbrand IPO 1971 1985 Acquires SSI - Enters Therapy Surfaces Category 2005/06 New Leadership Team Formed Hill-Rom & BCC Separate Acquires NaviCare - Enters Patient Flow Acquires ARI - Enters Respiratory Care Acquires Mediq - Enters Moveable Medical Equipment 2003/04 1929 April 1, 2008 Nearly $1.5 billion revenue* 6,700 Associates Iconic brand Top 30 medical technology pure play *2008 Guidance |
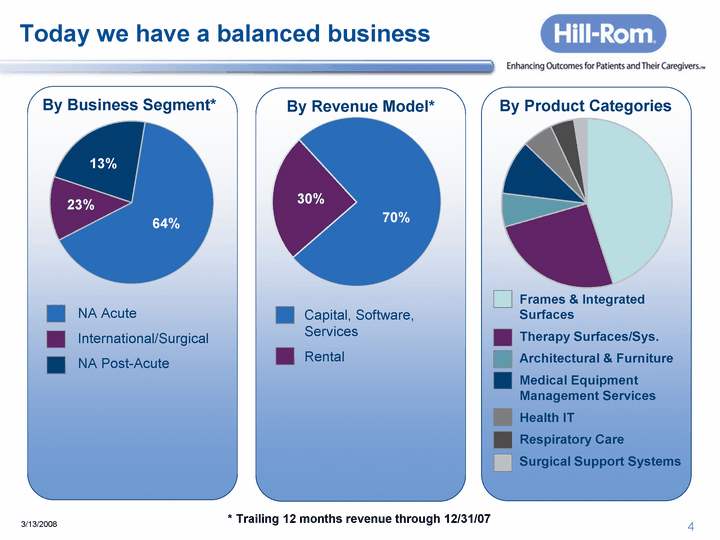
| Today we have a balanced business By Business Segment* NA Acute International/Surgical NA Post-Acute By Product Categories Frames & Integrated Surfaces Therapy Surfaces/Sys. Architectural & Furniture Medical Equipment Management Services Health IT Respiratory Care Surgical Support Systems 64% 23% 13% * Trailing 12 months revenue through 12/31/07 By Revenue Model* Capital, Software, Services Rental 70% 30% |
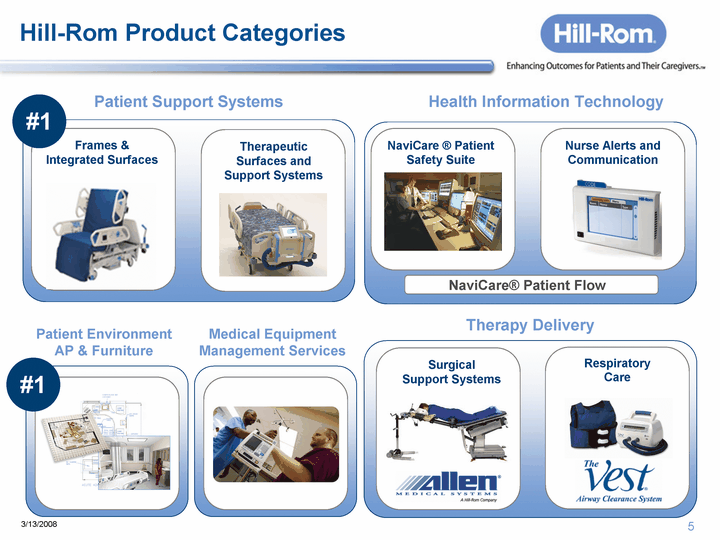
| Frames & Integrated Surfaces Therapeutic Surfaces and Support Systems Patient Support Systems Hill-Rom Product Categories NaviCare (r) Patient Safety Suite Health Information Technology Nurse Alerts and Communication NaviCare(r) Patient Flow Respiratory Care Surgical Support Systems Therapy Delivery #1 Patient Environment #1 Patient Environment AP & Furniture Medical Equipment Management Services |
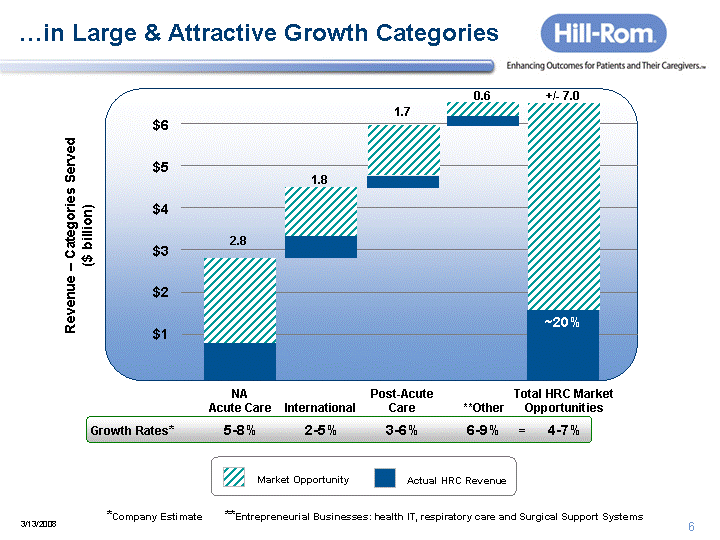
| ....in Large & Attractive Growth Categories $6 $5 $4 $3 $2 $1 Revenue - Categories Served ($ billion) ~20% Market Opportunity 2.8 1.8 1.7 0.6 +/- 7.0 NA Post-Acute Total HRC Market Acute Care International Care **Other Opportunities Growth Rates* 5-8% 2-5% 3-6% 6-9% 4-7% *Company Estimate **Entrepreneurial Businesses: health IT, respiratory care and Surgical Support Systems = Actual HRC Revenue |
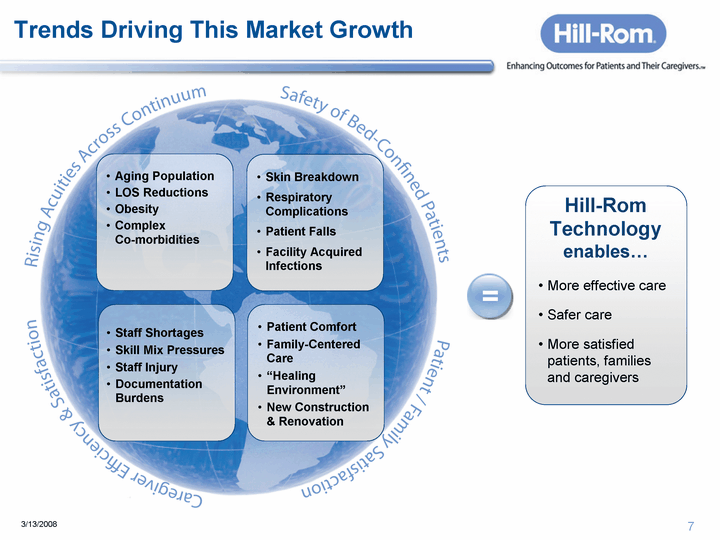
| Trends Driving This Market Growth = Hill-Rom Technology enables... More effective care Safer care More satisfied patients, families and caregivers Skin Breakdown Respiratory Complications Patient Falls Facility Acquired Infections Aging Population LOS Reductions Obesity Complex Co-morbidities Staff Shortages Skill Mix Pressures Staff Injury Documentation Burdens Patient Comfort Family-Centered Care "Healing Environment" New Construction & Renovation |
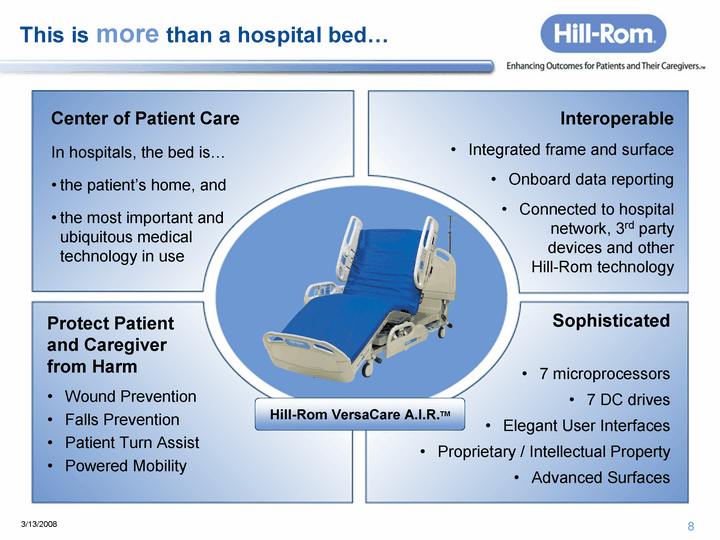
| This is more than a hospital bed... Center of Patient Care In hospitals, the bed is... the patient's home, and the most important and ubiquitous medical technology in use Protect Patient and Caregiver from Harm Wound Prevention Falls Prevention Patient Turn Assist Powered Mobility Interoperable Integrated frame and surface Onboard data reporting Connected to hospital network, 3rd party devices and other Hill-Rom technology Sophisticated 7 microprocessors 7 DC drives Elegant User Interfaces Proprietary / Intellectual Property Advanced Surfaces Hill-Rom VersaCare A.I.R.TM |

| .... and this is more than a mattress Clinical Impact Superior Patient Comfort Cooler & dryer Accommodates bariatric (obese) patients Financial Impact Micro-climate Management(r) Multi-zone pressure sensing Adapts to most bed frames Proprietary / Intellectual Property Wound Prevention Falls Prevention Infection Prevention Turn Assist Patient Experience CMS Non-Payment Ruling Flexible for Institutional Budgeting Asset Management Advantages Sophisticated Hill-Rom E700TM Mattress replacement |
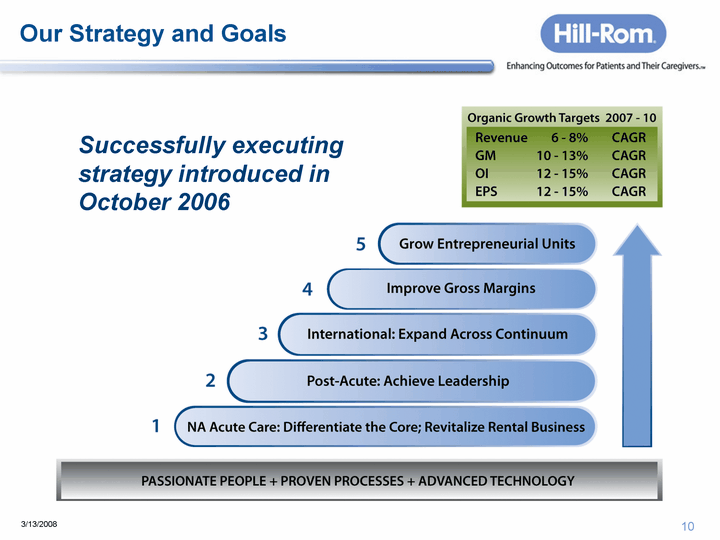
| Our Strategy and Goals Successfully executing strategy introduced in October 2006 |

| Med / Surg ICU NA Acute Care... Differentiate the Core; Revitalize Rental Business Competitive Advantages Installed base...+700,000 beds Iconic brand Strong Channel Convergence of IT & Devices Our Focus Deeper customer partnerships Patient Safety Solutions Innovation and investment in therapy systems Channel enhancements TotalCare(r) CareAssist(r) VersaCare(r) NaviCare(r) Software Solutions Stretchers Affinity (r) IV Specialty Patient Communications Patient Flow Patient Safety |
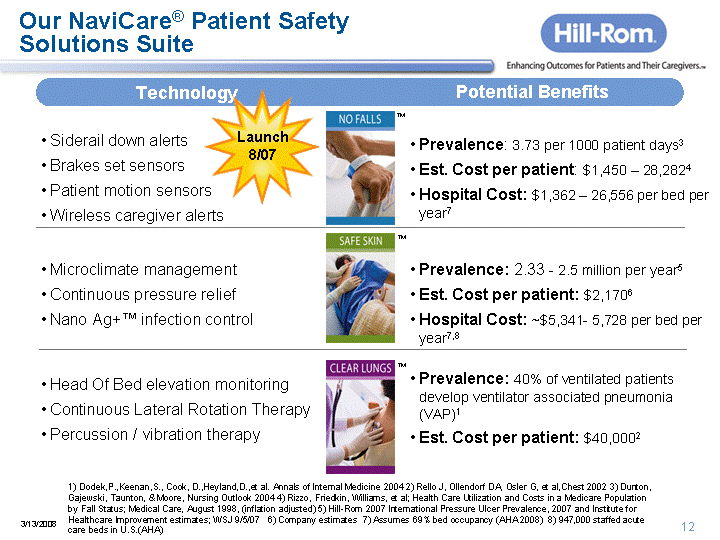
| Our NaviCare(r) Patient Safety Solutions Suite Potential Benefits Technology Siderail down alerts Brakes set sensor Patient pressure sensor Prevalence: 3.73 per 1000 patient days3 Cost per patient: $26,2354 Hospital Cost: ~$30,360 per bed per year7 Head Of Bed elevation monitoring Continuous Lateral Rotation Therapy Percussion / vibration therapy Prevalence: 40% of ventilated patients develop ventilator associated pneumonia (VAP)1 Cost per patient: $40,0002 Microclimate management Continuous pressure relief Nano Ag+(tm) infection control Prevalence: 2.5 million per year5 Cost per patient: $10,843 median6 Hospital Cost: ~$38,725 per bed per year7,8 Launch 8/07 1) Dodek,P.,Keenan,S., Cook, D.,Heyland,D.,et al. Annals of Internal Medicine 2004 2) Rello J, Ollendorf DA, Osler G, et al,Chest 2002 3) Dunton, Gajewski, Taunton, & Moore, Nursing Outlook 2004 4) Haumschild, Karfonta, Haumschild, Phillips, and Wilson, American Journal of Health- System Pharmacists 2003 (adjusted for inflation) 5) Institute for Healthcare Improvement estimates; WSJ 9/5/07 6) Zahn & Miller, JAMA (2003) 7) Assumes 85% bed occupancy 8) Assumes 700,000 acute care beds in U.S.; Company estimates (tm) (tm) (tm) |
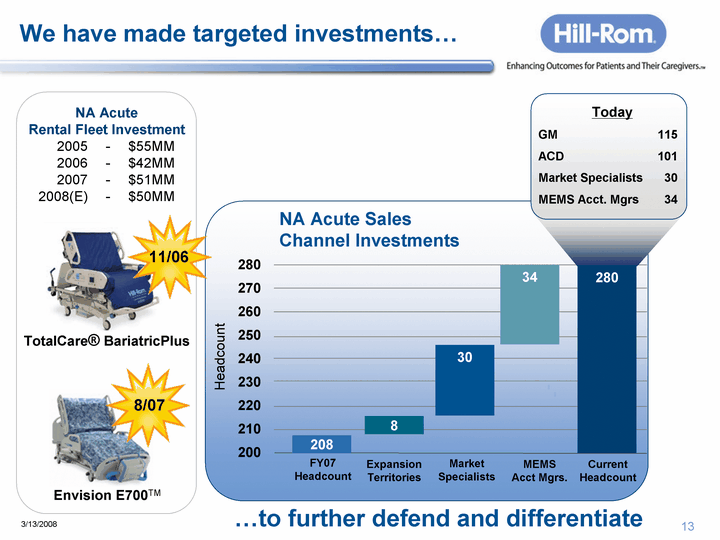
| We have made targeted investments... NA Acute Rental Fleet Investment 2005 - $55MM 2006 - $42MM 2007 - $51MM 2008(E) - $50MM NA Acute Sales Channel Investments FY07 Headcount Expansion Territories Market Specialists MEMS Acct Mgrs. Current Headcount 280 270 260 250 240 230 220 210 200 30 280 208 8 34 Today GM 115 ACD 101 Market Specialists 30 MEMS Acct. Mgrs 34 Headcount ....to further defend and differentiate TotalCare(r) BariatricPlus Envision E700TM 8/07 11/06 |
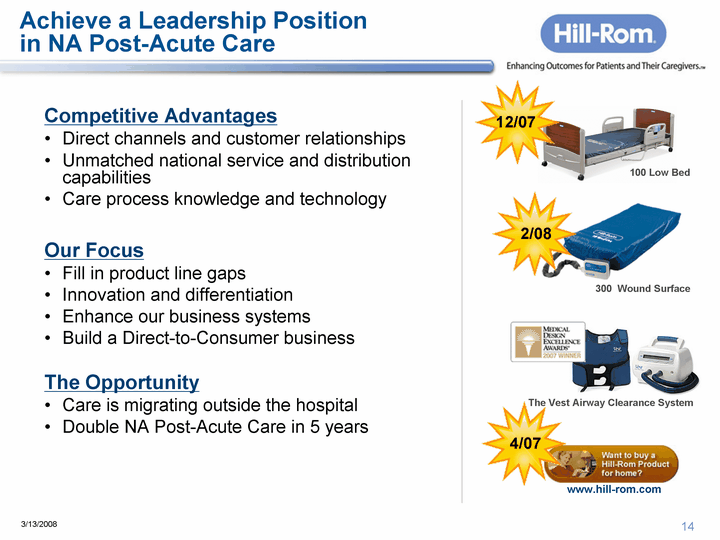
| Achieve a Leadership Position in NA Post-Acute Care Competitive Advantages Direct channels and customer relationships Unmatched national service and distribution capabilities Care process knowledge and technology Our Focus Fill in product line gaps Innovation and differentiation Enhance our business systems Build a Direct-to-Consumer business The Opportunity Care is migrating outside the hospital Double NA Post-Acute Care in 5 years 100 Low Bed The Vest Airway Clearance System 300 Wound Surface www.hill-rom.com 12/07 2/08 4/07 |

| Rapidly Grow International Competitive Advantages Efficient localized manufacturing Outstanding European rental and service operations Product platform leverage Established channels ~200 sales associates and clinical specialists Our Focus Innovation and differentiation Develop European MLTC business Expand in emerging growth regions Establish Monterrey and Singapore operations AvantGuard(tm) 800 Medicalized Long-Term Care Platform AvantGuard(tm) 1600 ICU Platform Meltis(tm) Furniture 9/07 4/08 9/07 |
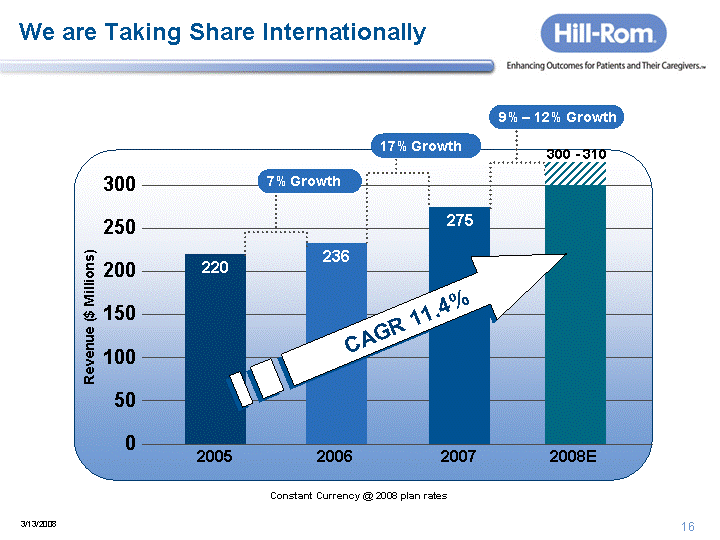
| We are Taking Share Internationally 236 275 220 300 250 200 150 100 50 0 7% Growth 2005 2006 2007 2008E 17% Growth 9% - 12% Growth CAGR 11.4% Constant Currency @ 2008 plan rates 300 - 310 Revenue ($ Millions) |

| Product Pricing and Discounting Disciplined pricing and contracting processes LCR Sourcing / Supply Chain Rationalization We Seek Improved Gross Margins... Monterrey, MX Manufacturing 300,000 sq. ft. facility coming online now Platform Design Faster development Modularity & reuse Quality & reliability Launch Higher Margin Products Innovation commands price and margin $100M $40M 125 100 75 50 25 0 50% 40% 30% 20% 10% 0% $$ of materials spend FY06 FY09(E) % of materials spend Strategic supplier management Leverage Suzhou, China center |
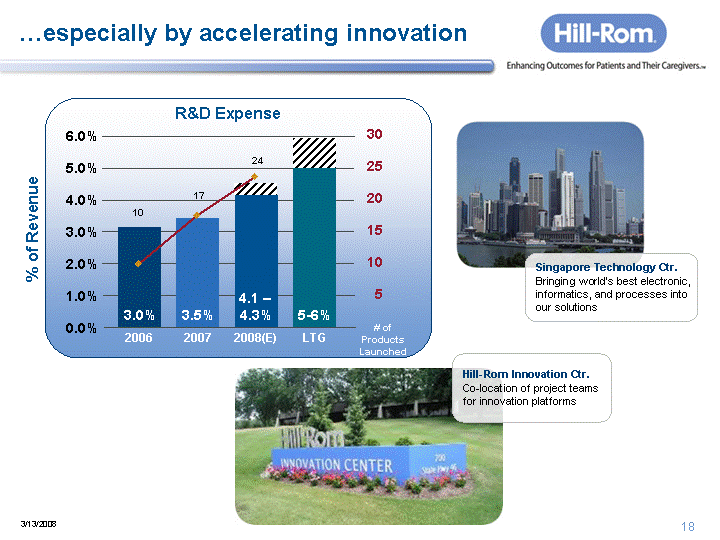
| ....especially by accelerating innovation 6.0% 5.0% 4.0% 3.0% 2.0% 1.0% 0.0% R&D Expense 2006 2007 2008(E) LTG 3.5% 4.1 - 4.3% 3.0% 5-6% Singapore Technology Ctr. Bringing world's best electronic, informatics, and processes into our solutions 10 17 24 30 25 20 15 10 5 # of Products Launched % of Revenue Hill-Rom Innovation Ctr. Co-location of project teams for innovation platforms |

| March 2008 Innovative silver ion technology for better infection control We are looking outward... for opportunities to add value Acquisitions that create value 2 - 4% incremental revenue CAGR via M&A Alliances to rapidly access new products, markets, and customers April 2007 July 2007 February 2008 Introduce jointly developed and branded line of comfort sleep surfaces Groundbreaking distribution alliance in Japan; development in the U.S. October 2006 Acquisition of Australian bed manufacturer IT Alliance to simplify care delivery Alliances Acquisition |
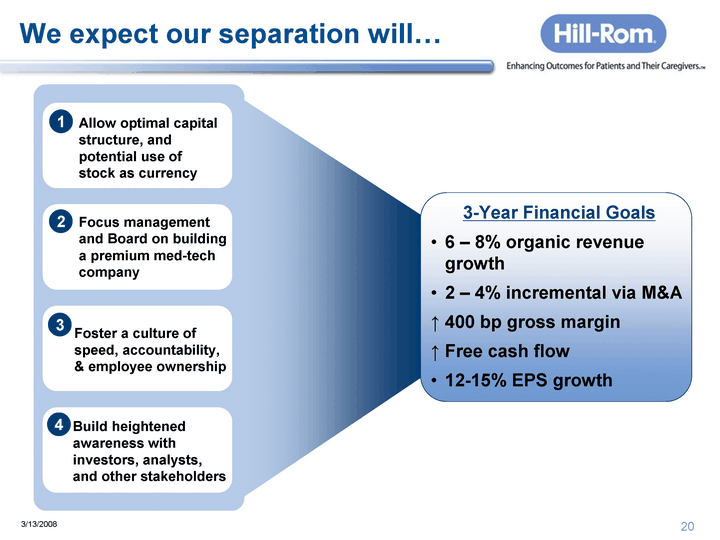
| We expect our separation will... 3-Year Financial Goals 6 - 8% organic revenue growth 2 - 4% incremental via M&A 400 bp gross margin Free cash flow 12-15% EPS growth 1 3 2 4 Focus management and Board on building a premium med-tech company Foster a culture of speed, accountability, & employee ownership Build heightened awareness with investors, analysts, and other stakeholders Allow optimal capital structure, and potential use of stock as currency |

| Financial Perspective |
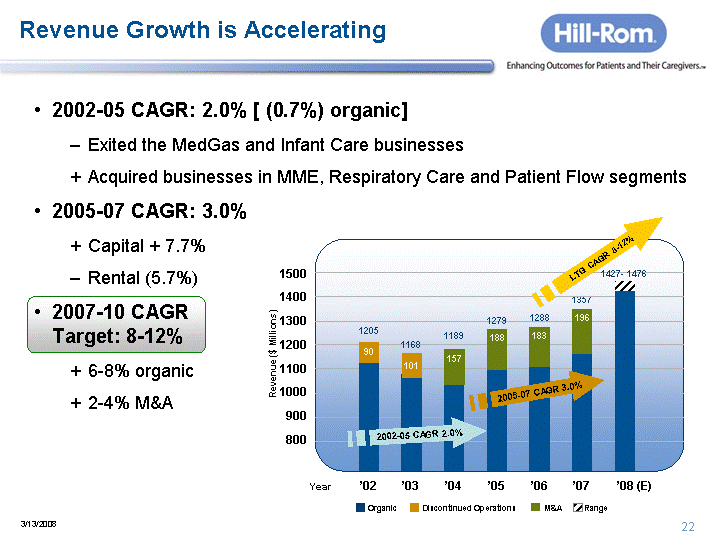
| 2002-05 CAGR: 2.0% [ (0.7%) organic] Exited the MedGas and Infant Care businesses Acquired businesses in MME, Respiratory Care and Patient Flow segments 2005-07 CAGR: 3.0% Capital + 7.7% Rental (5.7%) 2007-10 CAGR Target: 8-12% 6-8% organic 2-4% M&A Revenue Growth is Accelerating Year 1500 1400 1300 1200 1100 1000 900 800 '03 '04 '05 '06 '07 '08 (E) '02 90 188 2002-05 CAGR 2.0% Revenue ($ Millions) 1168 1189 1279 1288 1357 1427- 1476 1205 101 157 183 196 Organic Discontinued Operations M&A Range 2005-07 CAGR 3.0% LTG CAGR 8-12% |

| .... and Recent Quarterly Performance is Encouraging 400 350 300 250 200 150 100 321 312 2.8% Q1 335 315 6.3% Q2 329 304 8.2% Q3 372 357 4.2% Q4 341 2006 2007 2008 6.4% 321 Q1 2006-07 2007- 08 Revenue ($ Million) Growth Vs. Prior Year Q1 FY08 Trailing 12 months growth = 6.2% |
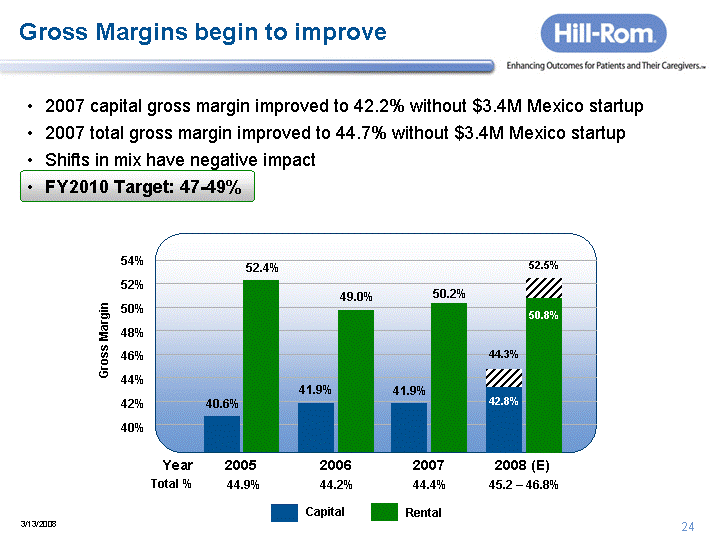
| Gross Margins begin to improve 2007 capital gross margin improved to 42.2% without $3.4M Mexico startup 2007 total gross margin improved to 44.7% without $3.4M Mexico startup Shifts in mix have negative impact FY2010 Target: 47-49% Capital Rental 54% 52% 50% 48% 46% 44% 42% 40% 2005 40.6% Year Total % 2006 2007 2008 (E) 52.4% 41.9% 49.0% 41.9% 50.2% 42.8% 50.8% 44.3% 52.5% 44.9% 44.2% 44.4% 45.2 - 46.8% Gross Margin |
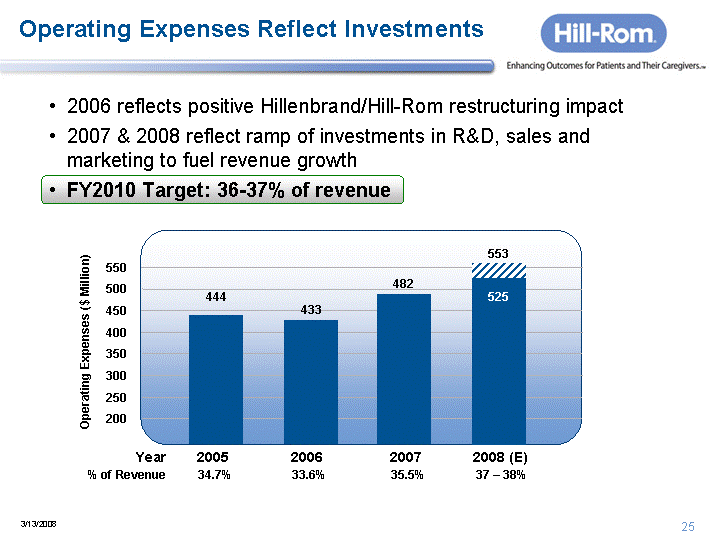
| Operating Expenses Reflect Investments 2006 reflects positive Hillenbrand/Hill-Rom restructuring impact 2007 & 2008 reflect ramp of investments in R&D, sales and marketing to fuel revenue growth FY2010 Target: 36-37% of revenue 05 550 500 450 400 350 300 250 200 2005 444 Year % of Revenue 2006 2007 2008 (E) 433 482 525 553 34.7% 33.6% 35.5% 37 - 38% Operating Expenses ($ Million) |

| EBIT, EBITDA and Adjusted Earnings Per Share Investment ramp reflected in 2007 and 2008 Benefits accelerate in 2008 2007-10 CAGR target: 12-15% 131 121 120 137 300 250 200 150 100 50 0 247 '05 10.2% 17.7% '06 10.6% 17.7% '07 8.9% 15.5% '08 (E) 8 - 9% 16 - 17% $ Million 226 210 229 228 138 EBIT EBITDA Year EBIT % of Rev EBITDA % of Rev $1.40 $1.30 $1.20 $1.10 $1.00 $.90 $.80 $.70 $.60 $.50 '05 '06 '07 '08 (E) Year Diluted Adj. EPS from Continuing Ops $1.02 $1.35 $1.13 $1.13 -1.32 |
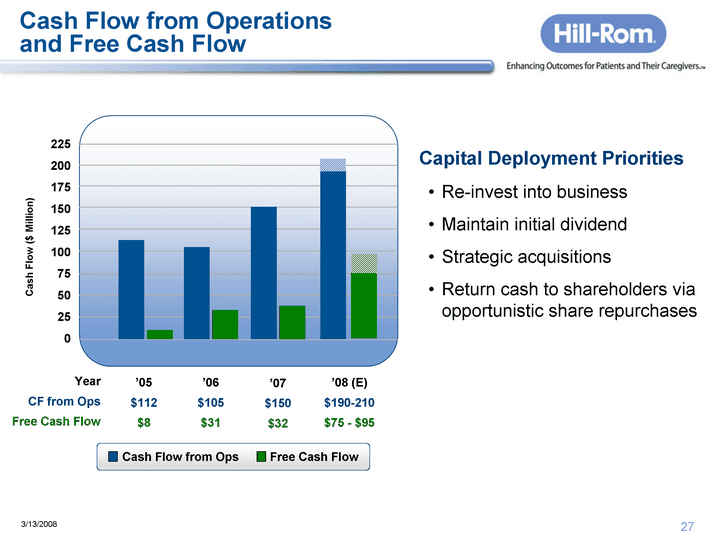
| Cash Flow from Operations and Free Cash Flow Capital Deployment Priorities Re-invest into business Maintain initial dividend Strategic acquisitions Return cash to shareholders via opportunistic share repurchases 225 200 175 150 125 100 75 50 25 0 '05 $112 $8 '06 $80 $6 '07 $150 $32 '08 (E) $190-210 $75 - $95 Year CF from Ops Free Cash Flow Cash Flow ($ Million) Cash Flow from Ops Free Cash Flow |

| Impact of Separation on 2008 Guidance Increased Operating Expenses ( -$0.02 cents/share ) Reflects incremental amortization expense associated with equity award modification accounting Decreased Other Income and Expenses ( -$0.05 cents/share ) Reflects the allocation of Forethought and limited partnership investment and interest income moved to Batesville Casket Company, along with the paydown of debt Effective tax rate increases from 36.5% to 37.7% ( -$0.04 cents/share ) Reflects Hill-Rom specific tax items and the impact of lower Income before taxes upon separation Estimated adjusted earnings per share decreases $0.11 per share |
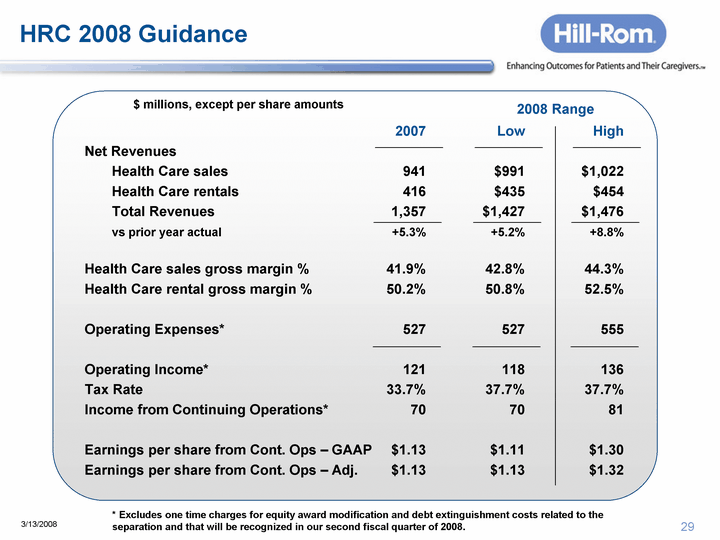
| HRC 2008 Guidance 2007 Low High Net Revenues Health Care sales 941 $991 $1,022 Health Care rentals 416 $435 $454 Total Revenues 1,357 $1,427 $1,476 vs prior year actual +5.3% +5.2% +8.8% Health Care sales gross margin % 41.9% 42.8% 44.3% Health Care rental gross margin % 50.2% 50.8% 52.5% Operating Expenses* 527 529 555 Operating Income* 121 118 133 Tax Rate 33.7% 37.7% 37.7% Income from Continuing Operations* 70 70 81 Earnings per share from Cont. Ops - GAAP $1.13 $1.11 $1.30 Earnings per share from Cont. Ops - Adj. $1.13 $1.13 $1.32 2008 Range $ millions, except per share amounts * Excludes one time charges for equity award modification and debt extinguishment costs related to the separation and that will be recognized in our second fiscal quarter of 2008. |

| Why Hill-Rom? Why Now? New leadership team keeping its promises...investments bearing fruit Iconic brand and large install base Business model and portfolio diversity...Much more than a bed company Growth is clearly accelerating Leverage is building...across the care continuum... around the world Separation holds real potential to unlock value |

| APPENDIX |
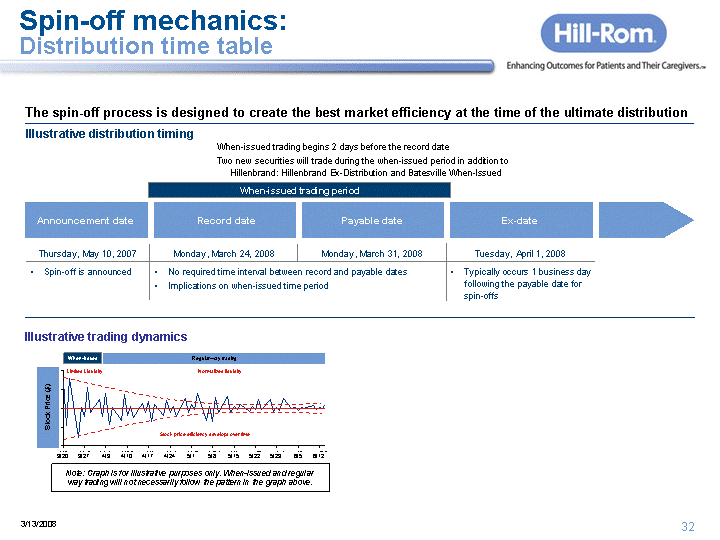
| Spin-off mechanics: Distribution time table The spin-off process is designed to create the best market efficiency at the time of the ultimate distribution Illustrative distribution timing Announcement date Record date Payable date Ex-date Thursday, May 10, 2007 Monday, March 24, 2008 Monday, March 31, 2008 Tuesday, April 1, 2008 Spin-off is announced No required time interval between record and payable dates Implications on when-issued time period No required time interval between record and payable dates Implications on when-issued time period Typically occurs 1 business day following the payable date for spin-offs When-issued trading period When-issued trading begins 2 days before the record date Two new securities will trade during the when-issued period in addition to Hillenbrand: Hillenbrand Ex-Distribution and Batesville When-Issued Illustrative trading dynamics When-issued Regular-way trading Limited Liquidity Normalized liquidity Stock price efficiency develops over time 3/20 3/27 4/3 4/10 4/17 4/24 5/8 6/12 6/5 5/29 5/22 5/1 5/15 Stock Price ($) Note: Graph is for illustrative purposes only. When-issued and regular way trading will not necessarily follow the pattern in the graph above. |
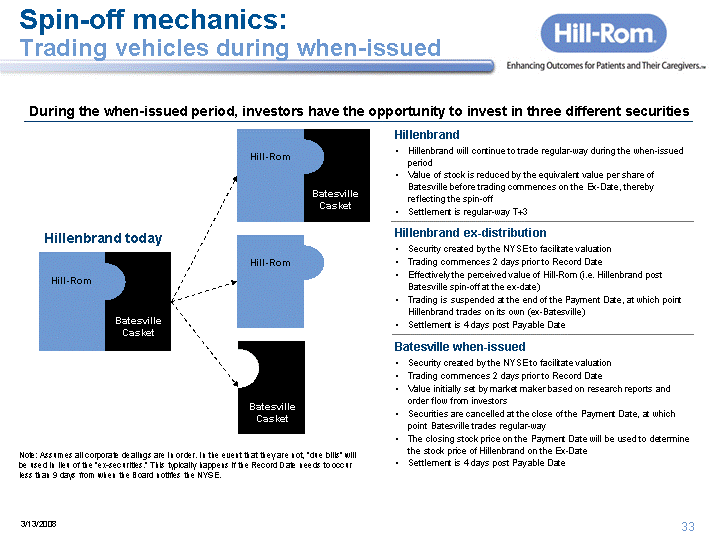
| Spin-off mechanics: Trading vehicles during when-issued During the when-issued period, investors have the opportunity to invest in three different securities Hillenbrand today Batesville Casket Hill-Rom Batesville Casket Hill-Rom Batesville Casket Hillenbrand Hillenbrand will continue to trade regular-way during the when-issued period Value of stock is reduced by the equivalent value per share of Batesville before trading commences on the Ex-Date, thereby reflecting the spin-off Settlement is regular-way T+3 Hillenbrand ex-distribution Security created by the NYSE to facilitate valuation Trading commences 2 days prior to Record Date Effectively the perceived value of Hill-Rom (i.e. Hillenbrand post Batesville spin-off at the ex-date) Trading is suspended at the end of the Payment Date, at which point Hillenbrand trades on its own (ex-Batesville) Settlement is 4 days post Payable Date Batesville when-issued Security created by the NYSE to facilitate valuation Trading commences 2 days prior to Record Date Value initially set by market maker based on research reports and order flow from investors Securities are cancelled at the close of the Payment Date, at which point Batesville trades regular-way The closing stock price on the Payment Date will be used to determine the stock price of Hillenbrand on the Ex-Date Settlement is 4 days post Payable Date Hill-Rom Note: Assumes all corporate dealings are in order. In the event that they are not, "due bills" will be used in lieu of the "ex-securities." This typically happens if the Record Date needs to occur less than 9 days from when the Board notifies the NYSE. |

| Reconciliation: International Revenue 2005 2006 2007 Low High International Revenue - Actual $210 $217 $271 $300 $310 F/X Adjustment to 2008 Rates 10 19 4 -- -- International Revenue - Constant Currency Basis $220 $236 $275 $300 $310 2008 Range |

| Reconciliation: Operating Expenses 2005 2006 2007 Low High Operating Expenses - Actual $467 $438 $483 $525 $553 Antitrust Litigation Costs 23 5 1 -- -- Operating Expenses - Adjusted $444 $433 $482 $525 $553 2008 Range |
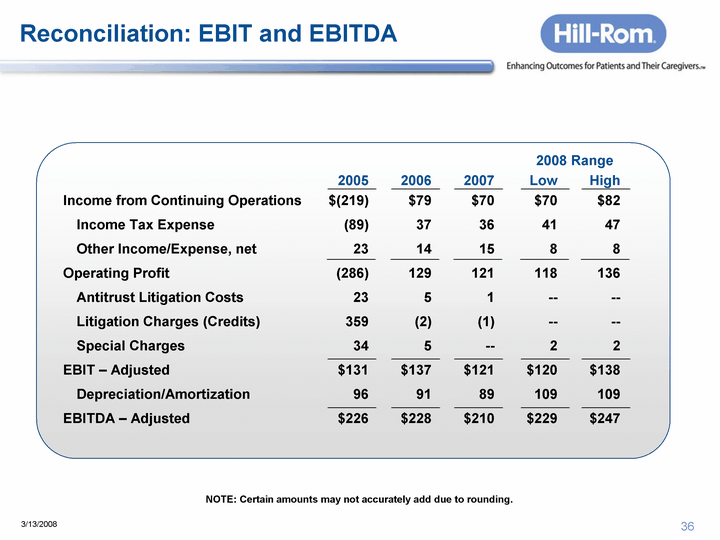
| Reconciliation: EBIT and EBITDA 2005 2006 2007 Low High Income from Continuing Operations $(219) $79 $70 $70 $82 Income Tax Expense (89) 37 36 41 47 Other Income/Expense, net 23 14 15 8 8 Operating Profit (286) 129 121 118 136 Antitrust Litigation Costs 23 5 1 -- -- Litigation Charges (Credits) 359 (2) (1) -- -- Special Charges 34 5 -- 2 2 EBIT - Adjusted $131 $137 $121 $120 $138 Depreciation/Amortization 96 91 89 109 109 EBITDA - Adjusted $226 $228 $210 $229 $247 NOTE: Certain amounts may not accurately add due to rounding. 2008 Range |

| Reconciliation: EPS 2005 2006 2007 Low High Earnings Per Share $(3.55) $1.27 $1.13 $1.10 $1.29 Antitrust Litigation Costs 0.24 0.05 0.01 -- -- Special Charges 0.42 0.05 -- 0.02 0.02 Litigation Charges (Credits) 3.66 (0.02) (0.01) -- -- Write-off of Deferred Tax Asset 0.26 -- -- -- -- Earnings Per Share - Adjusted $1.02 $1.35 $1.13 $1.13 $1.32 NOTE: Certain amounts may not accurately add due to rounding. 2008 Range |
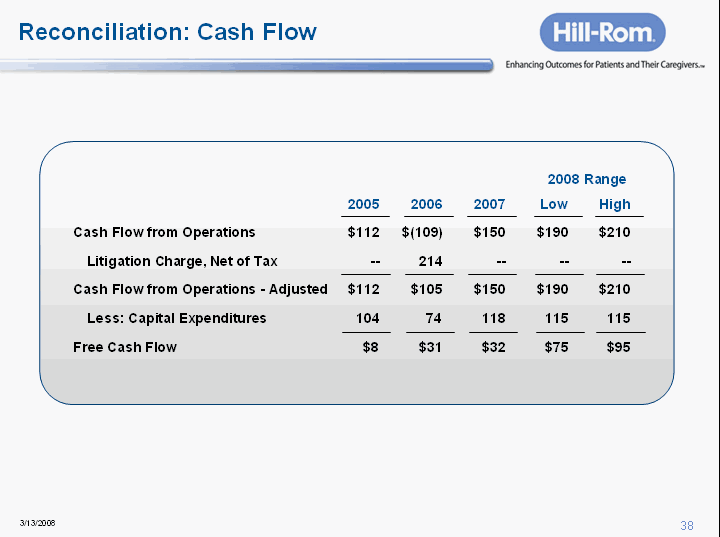
| Reconciliation: Cash Flow 2005 2006 2007 Low High Cash Flow from Operations $112 $(109) $150 $190 $210 Litigation Charge, Net of Tax -- 189 -- -- -- Cash Flow from Operations - Adjusted $112 $80 $150 $190 $210 Less: Capital Expenditures 104 74 118 115 115 Free Cash Flow $8 $6 $32 $75 $95 2008 Range |
| Anti-Trust Litigation Update Batesville Casket Company (BCC) sales policy: BCC has had a long-standing policy of selling caskets only to licensed funeral directors who operate licensed funeral homes. Plaintiffs allege that BCC's maintenance and enforcement of, and alleged modifications to, that policy were the product of a conspiracy among BCC and its funeral home customers to exclude "independent casket discounters" ("ICDs") from an alleged national market for the sale of caskets to consumers. ICDs are casket retailers who are not licensed funeral homes and do not offer funeral services Two cases by ICDs and consumers against: BCC and Hillenbrand Industries/Hill-Rom Holdings, together with three of BCC's large national funeral home customers Plaintiffs seek: certifications of two classes (i.e., consumers in the U.S. who purchased BCC caskets from defendant funeral homes, and U.S. ICDs), trebled monetary damages, attorneys' fees and costs, and change of BCC's sales practices. Procedurally/Substantively: Fact discovery completed Class certification hearings held in early December 2006 - still awaiting a ruling Docket call (i.e., meeting to set trial schedule) is set for May 2008; parties will likely appeal class certification ruling - could impact trial date We believe we have committed no wrongdoing as alleged We believe we have meritorious defenses to class certification and to the plaintiffs' underlying allegations and damage theories and will continue to assert those defenses vigorously We have not established a loss reserve For more information regarding the JSA, refer to the Registration Statement on Form 10 filed by Batesville Holdings. |

| Judgment Sharing Agreement (JSA) While we believe we have committed no wrongdoing as alleged , we concluded that it would be prudent to establish a JSA between BCC and us to predictably allocate any potential litigation exposure and maintain status quo. Expenses: BCC will pay all costs and expenses of the antitrust litigation and related cases. Damages: JSA addresses how we each fund an adverse judgment, a settlement that results in a final dismissal of BCC and HB (Hill-Rom), or a bond to stay an adverse judgment pending appeal. Maximum Funds: Each party is required to use its best efforts to raise maximum funding, with the maximization of proceeds taking precedence over the terms, credit ratings and costs, from (i) all funds on hand, except normal operating cash, (ii) additional debt as may be issued and drawn down under all credit facilities, and (iii) issuance of additional equity. Order of payments: BCC pays first because the subject of the litigation is its channel policy. BCC is required to provide the Maximum Funds available to it, minus a negotiated deductible. HB is then required to provide the Maximum Funds available to us. If required, BCC will provide the deductible. Termination: If either party is dismissed as a defendant (except as a result of a unilateral settlement) or found not liable for any damages, its funding and contribution obligations terminate. Unilateral Settlement: Either party may enter into a settlement without the consent of the other, but its obligations under the JSA continue unless the settlement includes and is agreed to by both companies For more information regarding the JSA, refer to the Registration Statement on Form 10 filed by Batesville Holdings. |