Exhibit 99.1

| Holly Corporation Fall 2005 Company Overview |

| Disclosure Statement Statements made during the course of this presentation that are not historical facts are "forward-looking statements" within the meaning of the U.S. Private Securities Litigation Reform Act of 1995. Forward- looking statements are inherently uncertain and necessarily involve risks that may affect the business prospects and performance of Holly Corporation and/or Holly Energy Partners, L.P., and actual results may differ materially from those discussed during the presentation. Such risks and uncertainties include but are not limited to risks and uncertainties with respect to the actions of actual or potential competitive suppliers and transporters of refined petroleum products in Holly's and Holly Energy Partners' markets, the demand for and supply of crude oil and refined products, the spread between market prices for refined products and market prices for crude oil, the possibility of constraints on the transportation of refined products, the possibility of inefficiencies or shutdowns in refinery operations or pipelines, effects of governmental regulations and policies, the availability and cost of financing to Holly and Holly Energy Partners, the effectiveness of Holly's and Holly Energy Partners' capital investments and marketing and acquisition strategies, the possibility of terrorist attacks and the consequences of any such attacks, and general economic conditions. Additional information on risks and uncertainties that could affect the business prospects and performance of Holly and Holly Energy Partners is provided in the most recent reports of Holly and Holly Energy Partners filed with the Securities and Exchange Commission. All forward-looking statements included in this presentation are expressly qualified in their entirety by the foregoing cautionary statements. Holly and Holly Energy Partners undertake no obligation to publicly update or revise any forward-looking statements, whether as a result of new information, future events or otherwise. |

| Experienced management team Executive officer group averages over 25 years of industry experience Holly & subsidiary officer group averages over 20 years of industry experience Holly directors average over 25 years of industry experience |

| SUN VLO TSO PCO FTO GI HOC 0.037 0.054 0.033 0.063 0.061 0.022 0.056 SUN VLO TSO FTO GI HOC 0.03 0.035 0.02 0.027 0.008 0.035 Strong peer track record Latest 12 months 2000-2004 average |

| SUN VLO TSO PCO FTO GI HOC 0.202 0.189 0.106 0.184 0.278 0.071 0.223 SUN VLO TSO FTO GI HOC 0.119 0.083 0.042 0.122 0.016 0.18 Strong peer track record Latest 12 months 2000-2004 average |
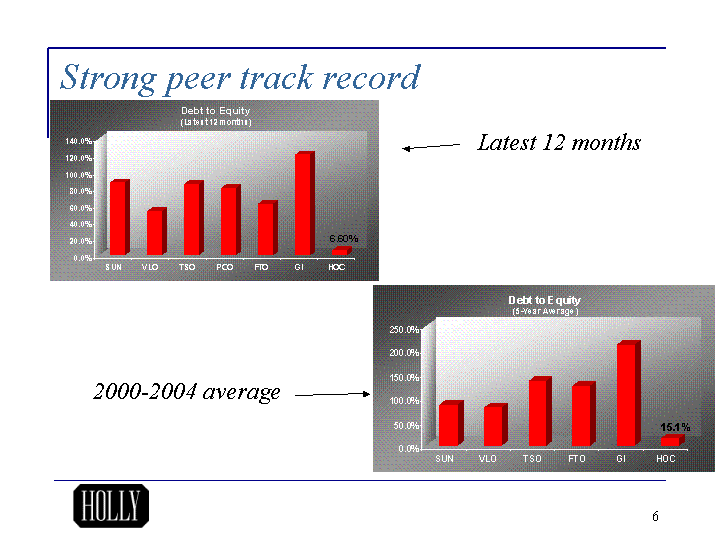
| SUN VLO TSO PCO FTO GI HOC 0.875 0.527 0.852 0.812 0.621 1.212 0.066 SUN VLO TSO FTO GI HOC 0.857 0.799 1.359 1.26 2.12 0.151 Strong peer track record Latest 12 months 2000-2004 average |

| Disciplined focused growth objective-late '90's to 2004: Late 90's Woods Cross NRC Expansion R&M Initiatives P/L Growth* 2004** East 0 60 80 100 120 0 West 46 20 20 20 3 105 14 18 Refining P/L & Logistics (HEP) 'Mid-Cycle' EBITDA growth Mid-cycle EBITDA defined at end of presentation *Net amt. to HOC, excluding minority interest **Mid-cycle at year-end |

| 2004* R&M Initiatives Capital Projects HEP 2007* East 0 123 151 181 0 West 105 28 30 0 163 18 10 28 'Mid-Cycle' EBITDA growth estimates HEP EBITDA equals net HOC ownership amounts Mid-cycle EBITDA defined at end of presentation *Mid-cycle at end of year Refining P/L & Logistics (HEP) Disciplined focused growth objective- 2004--2007: |

| Disciplined focused growth objective-late 90's to 2007: Late 90's '07* Total East 0 0 West 46 163 14 28 Refining P/L & Logistics (HEP) 'Mid-Cycle' EBITDA growth estimates Mid-cycle EBITDA defined at end of presentation *at year-end Focus has been on: Consistent, repeatable growth Conservative deployment of capital |

| Company Operations |

| Holly & HEP Assets 109,000 bpd of refining capacity All HOC refineries directly connected to Domestic / Canadian crude trading hubs Extensive crude oil gathering network in West Texas and Southeast New Mexico for the Navajo Refinery Over 1,600 miles of product pipelines 11 Terminals in 5 states (3 of the terminals are 50% owned) 70% interest in Rio Grande Pipeline Company, a joint venture with BP |
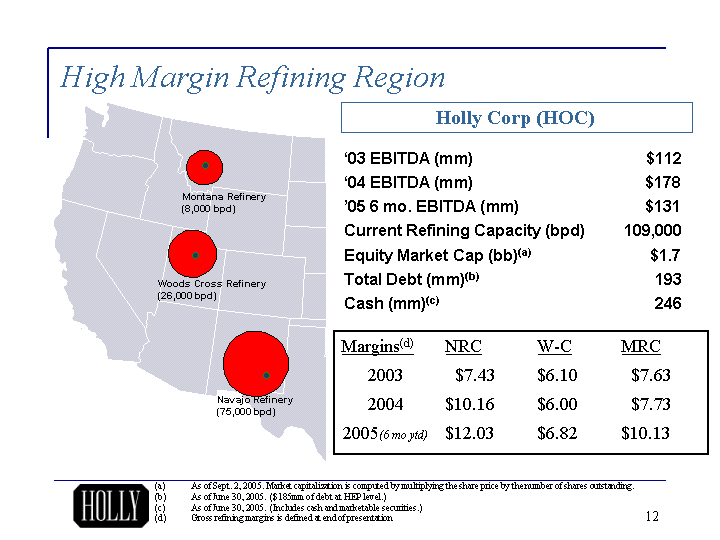
| Woods Cross Refinery (26,000 bpd) Montana Refinery (8,000 bpd) High Margin Refining Region Margins(d) NRC W-C MRC 2003 $7.43 $6.10 $7.63 2004 $10.16 $6.00 $7.73 2005(6 mo ytd) $12.03 $6.82 $10.13 '03 EBITDA (mm) $112 '04 EBITDA (mm) $178 '05 6 mo. EBITDA (mm) $131 Current Refining Capacity (bpd) 109,000 Equity Market Cap (bb)(a) $1.7 Total Debt (mm)(b) 193 Cash (mm)(c) 246 Navajo Refinery (75,000 bpd) Holly Corp (HOC) As of Sept. 2, 2005. Market capitalization is computed by multiplying the share price by the number of shares outstanding. As of June 30, 2005. ($185mm of debt at HEP level.) As of June 30, 2005. (Includes cash and marketable securities.) Gross refining margins is defined at end of presentation |

| Refining Margins by Refinery |

| NRC Refining Margins Jan Feb Mar Apr May Jun Jul Aug Sep Oct Nov Dec East 3.07 4.72 7.33 6.46 4.92 5.11 5.79 5.73 5.1 6.64 6.2 2 West 1.81 1.81 4.05 1.42 1.54 1.21 0.25 2.08 3.77 2.04 1.37 2.66 0.2 0.2 0.2 0.2 0.2 0.2 0.2 0.2 0.2 0.2 0.2 0.2 1.85 3.94 0.35 6.57 9.42 5.47 3.67 2.32 1.26 1.25 0.12 3.13 nrc gm gc 321 budget 05 gc 321 8.61 05 nrc gm 5.67 9.59 11.34 15.67 14.99 13.44 11.6 2000-2005 Refining Gross Margin Range (Bars: '00-04 range; Line: '05 actual; Blue bar: median of range) Estimate per Q2 earnings call |

| Woods Cross Refining Margins Jan Feb Mar Apr May Jun Jul Aug Sep Oct Nov Dec East 1.64 1.21 5.56 4.32 5.75 2.73 2.87 3.93 -0.67 -0.95 4.97 0.57 West 0.38 1.52 1.37 3.68 2.62 2.14 4.28 2.13 8.59 5.44 1.84 3.05 0.2 0.2 0.2 0.2 0.2 0.2 0.2 0.2 0.2 0.2 0.2 0.2 2.68 0.91 3.79 2.89 3.49 3.78 0.44 3.69 2.33 6.38 0.75 2.94 wx gm gc 321 budget 05 gc 321 8.61 05 wx gm -1.09 4.35 6.05 15.56 11.63 2.28 7.3 2000-2005 Refining Gross Margin Range (Bars: '00-04 range; Line: '05 actual; Blue bar: median of range) Estimate per Q2 earnings call |
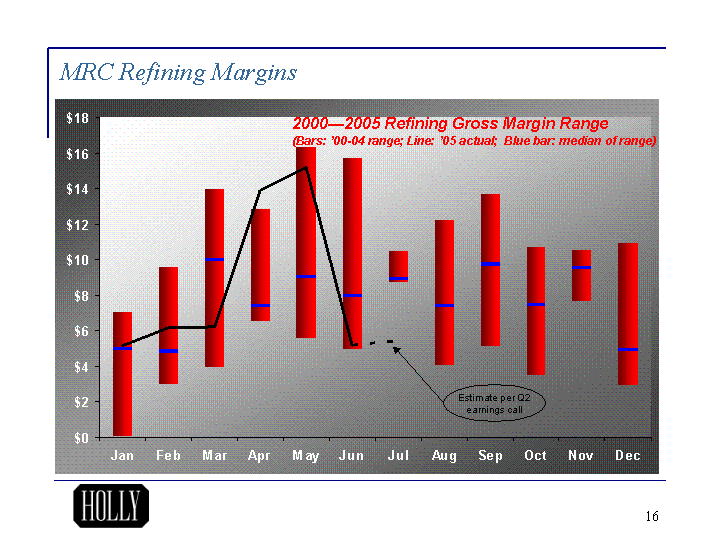
| MRC Refining Margins Jan Feb Mar Apr May Jun Jul Aug Sep Oct Nov Dec East 0.06 2.96 3.92 6.57 5.59 4.95 8.73 4.11 5.15 3.47 7.67 2.94 West 4.86 1.78 5.98 0.78 3.38 2.94 0.1 3.23 4.53 3.92 1.79 1.89 0.2 0.2 0.2 0.2 0.2 0.2 0.2 0.2 0.2 0.2 0.2 0.2 1.96 4.69 3.89 5.31 7.17 7.63 1.5 4.71 3.83 3.11 0.91 5.9 mrc gm gc 321 budget 05 gc 321 8.61 05 mrc gm 5.16 6.19 6.2 13.89 15.24 5.15 5.4 2000-2005 Refining Gross Margin Range (Bars: '00-04 range; Line: '05 actual; Blue bar: median of range) Estimate per Q2 earnings call |

| Recent Initiatives adding to base EBITDA |

| Previous guidance for Mid-Cycle* EBITDA for Company operations *Mid-cycle EBITDA for the refinery operations was calculated by subtracting 2004 operating expenses excluding depreciation from mid-cycle refinery gross margin. Estimated mid-cycle refinery gross margin was calculated by applying the trailing three year average ('02-'04) product values and raw material costs to 2004's actual raw materials charge and product yields. For 2004: Projected EBITDA improvement (in millions) Refinery mid-cycle EBITDA $105 Pipeline & Terminal EBITDA 35 Minority interest in pipelines & terminals <17> Holly's 2004 mid-cycle EBITDA estimate $123 |

| Increase Capacity of Sour Grades of Crude Move from approx. 92% sour crude runs to 100% sour crude runs at Navajo Refinery. (Navajo primarily runs a West Texas Sour (WTS) 'type' of sour crude.) Increase low priced Canadian heavy sour crude at Woods Cross refinery to 8% of runs in 2005. Increase sour crude runs by 8,000bpd for Holly's overall refining system at $4.45/bbl differential. PROJECTED MID-CYCLE EBITDA ADDITION: $13 MILLION |

| Improve Refining Yields High Value Product Yield Improvement: Increase Clean Burning Gasoline (CBG) production at Navajo refining. Upgrade 5,200 bpd from 'conventional' gasoline to higher value CBG gasoline Increase Premium gasoline production Upgrade 1,000 bpd of regular gasoline to premium Increase Low Sulfur diesel production 3,000 bpd Process Unit Configuration Changes: CCR catalyst change at Navajo refining Upgrade 400 bpd of low-value refining gases to high octane gasoline component FCCU feed nozzles / turnaround at Woods Cross refinery Upgrade 300 bpd of lower valued light cycle oil & slurry to high value gasolines PROJECTED MID-CYCLE EBITDA ADDITION: $8 MILLION |

| Increase Refinery Runs Higher crude rates at all refineries. 2005 plan 1,800 bpd from all refineries Higher FCCU rates at Navajo refinery Increase gasoline & diesel production levels by buying additional gas oil from 3rd parties Increased Natural Gasoline Blending 2,100 bpd low cost natural gasoline to finished gasoline blending Additional asphalt tankage at Montana refinery Allows for higher winter run rates PROJECTED MID-CYCLE EBITDA ADDITION: $7 MILLION |

| Summary of Mid-Cycle EBITDA additions from 2005 Refinery initiatives: R&M Improvement Initiative Projected Mid-Cycle EBITDA improvement (in millions) Increased capacity of sour crude feedstocks $13 Improved refining yields 8 Increased refinery runs 7 Estimated mid-cycle EBITDA additions $28 |
| Capital Projects Plan |
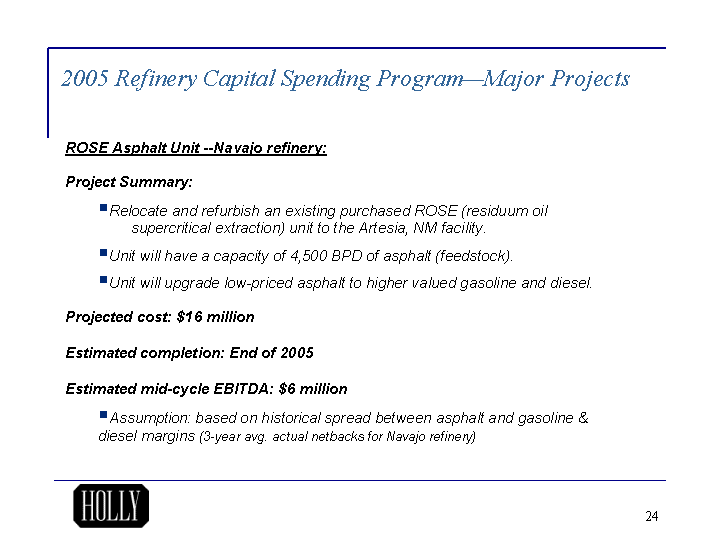
| 2005 Refinery Capital Spending Program-Major Projects ROSE Asphalt Unit --Navajo refinery: Project Summary: Relocate and refurbish an existing purchased ROSE (residuum oil supercritical extraction) unit to the Artesia, NM facility. Unit will have a capacity of 4,500 BPD of asphalt (feedstock). Unit will upgrade low-priced asphalt to higher valued gasoline and diesel. Projected cost: $16 million Estimated completion: End of 2005 Estimated mid-cycle EBITDA: $6 million Assumption: based on historical spread between asphalt and gasoline & diesel margins (3-year avg. actual netbacks for Navajo refinery) |
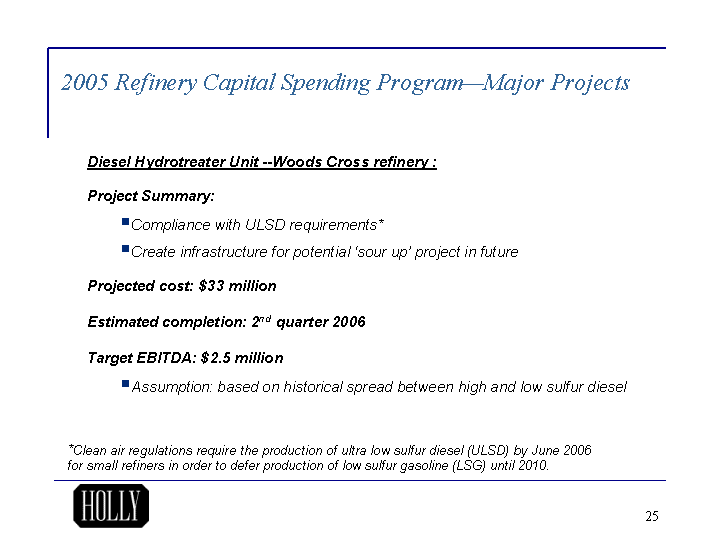
| 2005 Refinery Capital Spending Program-Major Projects Diesel Hydrotreater Unit --Woods Cross refinery : Project Summary: Compliance with ULSD requirements* Create infrastructure for potential 'sour up' project in future Projected cost: $33 million Estimated completion: 2nd quarter 2006 Target EBITDA: $2.5 million Assumption: based on historical spread between high and low sulfur diesel *Clean air regulations require the production of ultra low sulfur diesel (ULSD) by June 2006 for small refiners in order to defer production of low sulfur gasoline (LSG) until 2010. |
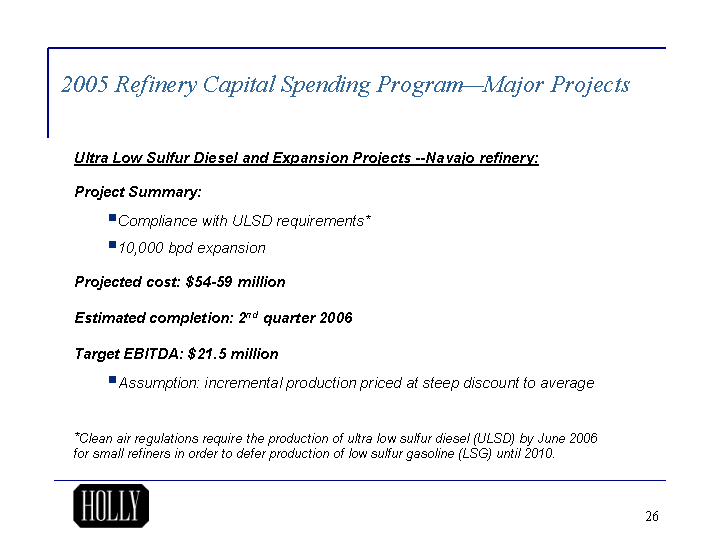
| 2005 Refinery Capital Spending Program-Major Projects Ultra Low Sulfur Diesel and Expansion Projects --Navajo refinery: Project Summary: Compliance with ULSD requirements* 10,000 bpd expansion Projected cost: $54-59 million Estimated completion: 2nd quarter 2006 Target EBITDA: $21.5 million Assumption: incremental production priced at steep discount to average *Clean air regulations require the production of ultra low sulfur diesel (ULSD) by June 2006 for small refiners in order to defer production of low sulfur gasoline (LSG) until 2010. |

| Anticipated Refinery Capital Spending Major Capital Projects Estimated Total Cost * Estimated mid-cycle EBITDA Addition ROSE Unit $16 $6.0 Diesel hydrotreater at Woods Cross 33 2.5 ULSD & Expansion 54-59 21.5 Total $103-108 $30.0 (in millions) *Approx. half these amounts will be spent in 2005, with the remainder in 2006 |

| Forward EBITDA Estimates |
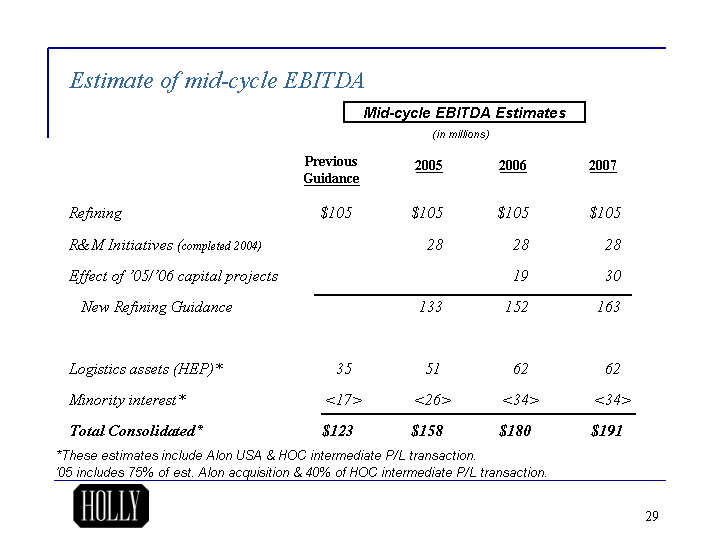
| Estimate of mid-cycle EBITDA Previous Guidance 2005 2006 2007 Refining $105 $105 $105 $105 R&M Initiatives (completed 2004) 28 28 28 Effect of '05/'06 capital projects 19 30 New Refining Guidance 133 152 163 Logistics assets (HEP)* 35 51 62 62 Minority interest* <17> <26> <34> <34> Total Consolidated* $123 $158 $180 $191 *These estimates include Alon USA & HOC intermediate P/L transaction. '05 includes 75% of est. Alon acquisition & 40% of HOC intermediate P/L transaction. Mid-cycle EBITDA Estimates (in millions) |

| Definitions Gross refining margin - Refining revenues less refining cost of products sold Pre-tax margin - Income before income taxes divided by sales and other revenues Return on assets - Net income divided by total assets Return on invested capital - Net income divided by the sum of total stockholders' equity plus debt. Debt includes long-term debt and current maturities of long-term debt. Debt to equity - Debt divided by total stockholders' equity. Mid-cycle EBITDA - Mid-cycle refinery gross margin minus operating expenses excluding interest, depreciation & amortization. Actual/forecast mid-cycle refinery gross margins are calculated by applying average product values and raw material costs for 2002-2004 to actual/forecast raw materials charge and estimated product yields. |

| Definitions Earnings Before Interest, Taxes, Depreciation and Amortization - (in thousands): 2005(ytd) (6 mo.) 2004 2003 Net Income $65,094 $83,879 $46,053 Add provision for income tax 39,626 54,590 28,306 Add interest expense 4,205 3,524 2,136 Subtract interest income (3,252) (4,372) (458) Add depreciation & amortization 24,946 40,481 36,275 EBITDA $130,619 $178,102 $112,312 Earnings before interest, taxes, depreciation and amortization - EBITDA is calculated as net income plus (i) interest expense, (ii) less interest income, (iii) plus income tax provision, and (iv) plus depreciation, depletion and amortization. EBITDA is not a calculation based upon generally accepted accounting principles; however, the amounts included in the EBITDA calculation are derived from amounts included in the consolidated financial statements of Holly. EBITDA should not be considered as an alternative to net income or operating income, as an indication of operating performance of Holly or as an alternative to operating cash flow as a measure of liquidity. EBITDA is not necessarily comparable to similarly titled measures of other companies. EBITDA is presented here because it enhances an investor's understanding of Holly's ability to satisfy principal and interest obligations with respect to Holly's indebtedness and to use cash for other purposes, including capital expenditures. EBITDA is also used by Holly management for internal analysis and as a basis for financial covenants. EBITDA is reconciled to net income in the table above. |

| Holly Corporation Holly Energy Partners, L.P. 100 Crescent Court, Suite 1600 Dallas, Texas 75201 (214) 871-3555 Steve McDonnell Vice President, CFO (214) 871-3584 steve@hollycorp.com Neale Hickerson V.P.-Investor Relations (214) 871-3572 neale@hollycorp.com |