EXHIBIT 99.1
Holly Corporation Fall 2006 Company Update |
Disclosure Statement Statements made during the course of this presentation that are not historical facts are "forward-looking statements" within the meaning of the U.S. Private Securities Litigation Reform Act of 1995. Forward- looking statements are inherently uncertain and necessarily involve risks that may affect the business prospects and performance of Holly Corporation and/or Holly Energy Partners, L.P., and actual results may differ materially from those discussed during the presentation. Such risks and uncertainties include but are not limited to risks and uncertainties with respect to the actions of actual or potential competitive suppliers and transporters of refined petroleum products in Holly's and Holly Energy Partners' markets, the demand for and supply of crude oil and refined products, the spread between market prices for refined products and market prices for crude oil, the possibility of constraints on the transportation of refined products, the possibility of inefficiencies or shutdowns in refinery operations or pipelines, effects of governmental regulations and policies, the availability and cost of financing to Holly and Holly Energy Partners, the effectiveness of Holly's and Holly Energy Partners' capital investments and marketing and acquisition strategies, the possibility of terrorist attacks and the consequences of any such attacks, and general economic conditions. Additional information on risks and uncertainties that could affect the business prospects and performance of Holly and Holly Energy Partners is provided in the most recent reports of Holly and Holly Energy Partners filed with the Securities and Exchange Commission. All forward-looking statements included in this presentation are expressly qualified in their entirety by the foregoing cautionary statements. Holly and Holly Energy Partners undertake no obligation to publicly update or revise any forward-looking statements, whether as a result of new information, future events or otherwise. |
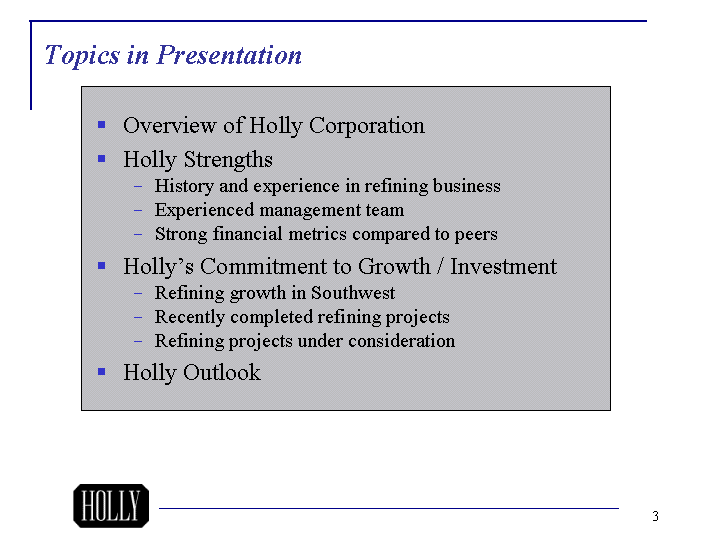
Overview of Holly Corporation Holly Strengths History and experience in refining business Experienced management team Strong financial metrics compared to peers Holly's Commitment to Growth / Investment Refining growth in Southwest Recently completed refining projects Refining projects under consideration Holly Outlook Topics in Presentation |
Overview of Holly Corporation |
Holly Corporation (NYSE: HOC) Overview Independent refiner in Southwest / Rocky Mountain states Own 2 refineries: New Mexico & Salt Lake City Wholesale marketer supplying West Texas, Arizona, New Mexico, Colorado, Utah, Nevada, Idaho & Washington Also built extensive logistics operations (pipelines & terminals) to support refineries--delivering refined products to end markets Formed a publicly traded Master Limited Partnership, Holly Energy Partners (NYSE: HEP) with those assets-- currently own a 45% interest in HEP. |
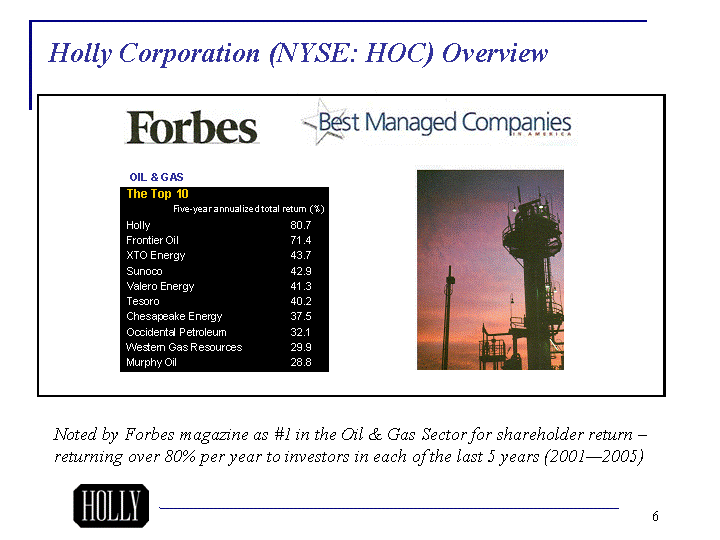
Holly Corporation (NYSE: HOC) Overview Noted by Forbes magazine as #1 in the Oil & Gas Sector for shareholder return - returning over 80% per year to investors in each of the last 5 years (2001-2005) |
Asset Summary Holly Corp: Holly's refineries operate in the high margin & high growth Southwest & Rockies markets 108,000 bpd of refining capacity All HOC refineries directly connected to Domestic / Canadian crude trading hubs Extensive crude oil gathering network in West Texas and Southeast New Mexico for the Navajo Refinery Holly Energy Partners: Over 1,600 miles of product pipelines 11 Terminals in 5 states (3 of the terminals are 50% owned) 70% interest in Rio Grande Pipeline Company, a joint venture with BP |
Holly Strengths |
Holly's History in the Refining Business 30+ years in the refining business Acquired refinery in Artesia, NM-expanded 4 times since 1969 purchase Acquired refinery in Woods Cross, UT in 2003 Have built extensive logistics operations (pipelines and terminals) to deliver refined products to end markets Formed new pipeline and terminal company in 2004 with these assets: Holly Energy Partners L.P. (NYSE: HEP) Consistently profitable-never had a loss year since entering the refining business |
Experienced Management Team Executive officer group averages over 25 years of refining and marketing industry experience Holly and subsidiary officer group averages over 20 years of refining/energy industry experience Holly directors average over 20 years of refining industry experience Dedicated management team who know our operations and region very well to better serve customer base |
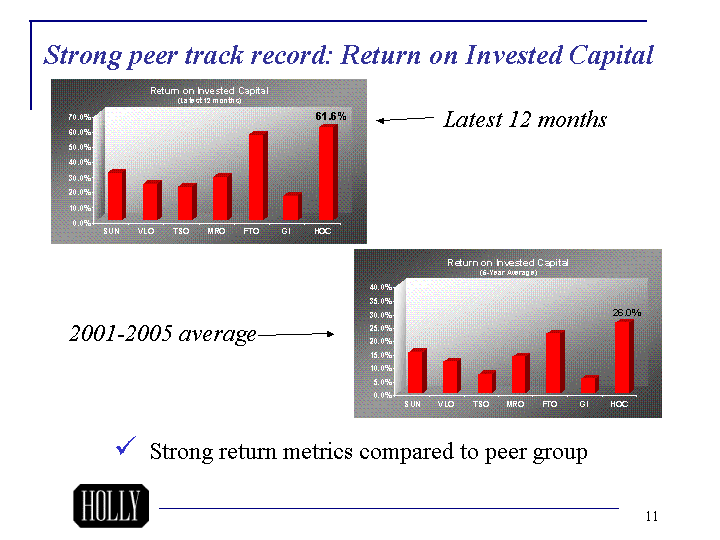
Strong peer track record: Return on Invested Capital Latest 12 months 2001-2005 average SUN VLO TSO MRO FTO GI HOC 0.314 0.239 0.22 0.288 0.566 0.163 0.616 Strong return metrics compared to peer group |
Strong peer track record: Debt to Equity Latest 12 months 2001-2005 average SUN VLO TSO MRO FTO GI HOC 0.695 0.357 0.549 0.322 0.295 0.688 0 Conservative balance sheet w/ debt capacity for value adding opportunities |
Holly's Commitment to Growth and Investment |
Refinery Capacity Growth to Meet Growing Product Demand in Southwest / Rocky Mtn. Markets 1969 Early 1980's Early 1990's 2003 Wood Cross Acquisiton 2006-07 TOTAL East 0 16 30 65 75 101 0 West 16 14 35 10 26 10 110 0 16k bpd 75k bpd 65k bpd 30k bpd 10k bpd* *Interim Navajo Refinery expansion in 2006 to 82,000 bpd; full expansion of Navajo Refinery to 85,000 bpd scheduled for completion by end of 2007. 26k bpd 111k bpd* |
Recently Completed Capital Projects Refinery Project Benefits Navajo ULSD compliance* 100% ULSD capability ROSE unit +3,000 BPD light products 10,000 bpd expansion +9,000 BPD light products Woods Cross ULSD compliance* 100% ULSD capability Sour-up infrastructure Sets up heavier crude capability *Clean air regulations required the production of ultra low sulfur diesel (ULSD) by June 2006 for small refiners in order to defer requirement to produce low sulfur gasoline (LSG) until 2010. |
Recently Completed Capital Projects Projects announced in January 2005 with 18 month time frame All projects completed on time & within $3mm of budget Final spending on projects: $123 mm |
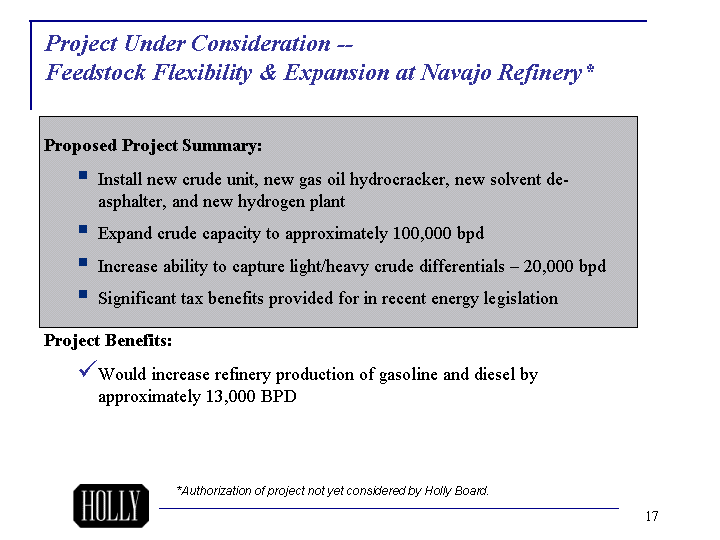
Project Under Consideration -- Feedstock Flexibility & Expansion at Navajo Refinery* Proposed Project Summary: Install new crude unit, new gas oil hydrocracker, new solvent de- asphalter, and new hydrogen plant Expand crude capacity to approximately 100,000 bpd Increase ability to capture light/heavy crude differentials - 20,000 bpd Significant tax benefits provided for in recent energy legislation Project Benefits: Would increase refinery production of gasoline and diesel by approximately 13,000 BPD *Authorization of project not yet considered by Holly Board. |
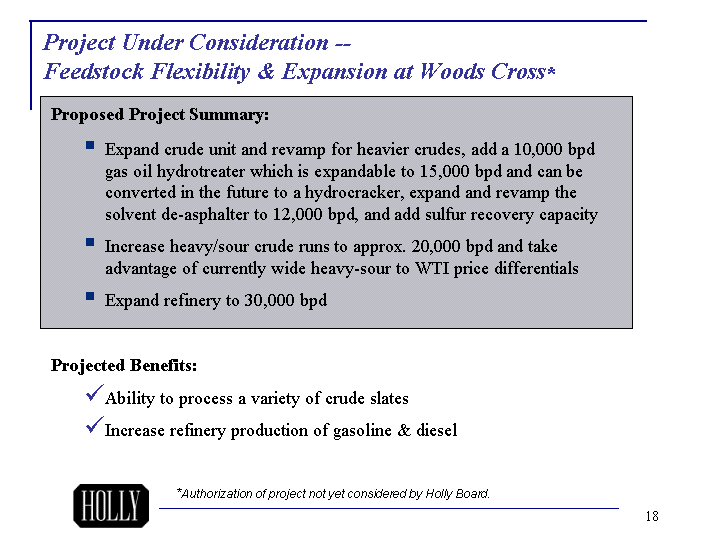
Project Under Consideration -- Feedstock Flexibility & Expansion at Woods Cross* Proposed Project Summary: Expand crude unit and revamp for heavier crudes, add a 10,000 bpd gas oil hydrotreater which is expandable to 15,000 bpd and can be converted in the future to a hydrocracker, expand and revamp the solvent de-asphalter to 12,000 bpd, and add sulfur recovery capacity Increase heavy/sour crude runs to approx. 20,000 bpd and take advantage of currently wide heavy-sour to WTI price differentials Expand refinery to 30,000 bpd Projected Benefits: Ability to process a variety of crude slates Increase refinery production of gasoline & diesel *Authorization of project not yet considered by Holly Board. |
Proposed Project Summary: Increase refined product outlet to fast growing, consistent annual demand market Probable joint project with Holly Energy Partners-HEP could be ultimate owner/operator Projected Benefits: Allows for possible gasoline & diesel product exchanges between Las Vegas and Phoenix/Tucson Supports Woods Cross capacity expansion -- possible additional expansion of Woods Cross to approx. 35,000 / 40,000 bpd of crude capacity running predominately lower priced, cost advantaged crudes Project Under Consideration -- Salt Lake City to Las Vegas Refined Products Pipeline* *Authorization of project not yet considered by Holly & Holly Energy Boards. |
Refinery Capital Expenditures by Year: Major Capital Projects: 2006 2007 2008 Total 1) Diesel Hydrotreater at WX (completed 6/06) $13(1) $13 2) ULSD & other projects at NRC (completed 6/06) 36(1) 36 3) Sulfur recovery unit at NRC 7 10 9 26 4) NRC feedstock flexibility & expansion (2) 10 100 130 240 5) WX feedstock flexibility & expansion (2) 10 30 20 60 6) Sustaining capital & turnaround 35 55 45 135 Total 111 195 204 510 Estimates: (in millions) (1) Actual amount spent on project (2) Estimated spending on proposed project |
Holly Outlook |
Estimated Additions to Pro Forma Refining EBITDA from CAPEX Using '03-'05 avg. prices: Recently completed capital projects increase estimated pro forma EBITDA by approx. $50 million beginning in 2006 (as projects phase-in); increasing to approx. $70 million in 2007; finally increasing to approx. $80 million at full project implementation. Projects under consideration increase estimated pro forma EBITDA by approx. $140 million beginning in 2009 Using 2005 avg. prices: Recently completed capital projects increase estimated pro forma EBITDA by approx. $70 million beginning in 2006 (as projects phase-in); increasing to approx. $90 million in 2007; finally increasing to approx. $100 million at full project implementation. Projects under consideration increase estimated pro forma EBITDA by approx. $170 million beginning in 2009 |
Anticipated 2006 / 2007 Tax Benefits American Jobs Creation Act of 2004: Created tax incentives for small refiners to produce ULSD Provides immediate deduction of 75% of certain capital costs Provides a tax credit based on ULSD production up to 25% of these costs Energy Policy Act of 2005: Provides an election to expense 50% of refinery capacity expansion costs when assets placed in service Expected benefits to Holly: Base tax rate of 39% will be reduced by est. tax credit of approx.$15 million in both 2006 and 2007 from American Jobs Creation Act Legislation Amount of benefit from Energy Policy Act to be determined by amount of spending on project |
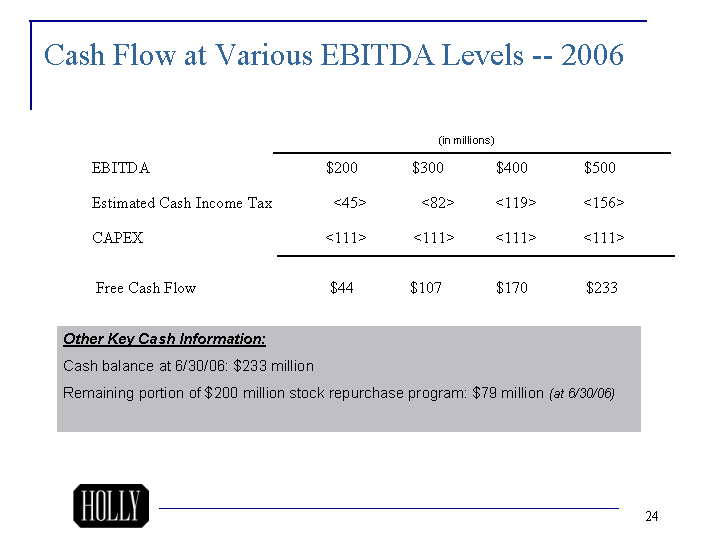
Cash Flow at Various EBITDA Levels -- 2006 EBITDA $200 $300 $400 $500 Estimated Cash Income Tax <45> <82> <119> <156> CAPEX <111> <111> <111> <111> Free Cash Flow $44 $107 $170 $233 (in millions) Other Key Cash Information: Cash balance at 6/30/06: $233 million Remaining portion of $200 million stock repurchase program: $79 million (at 6/30/06) |
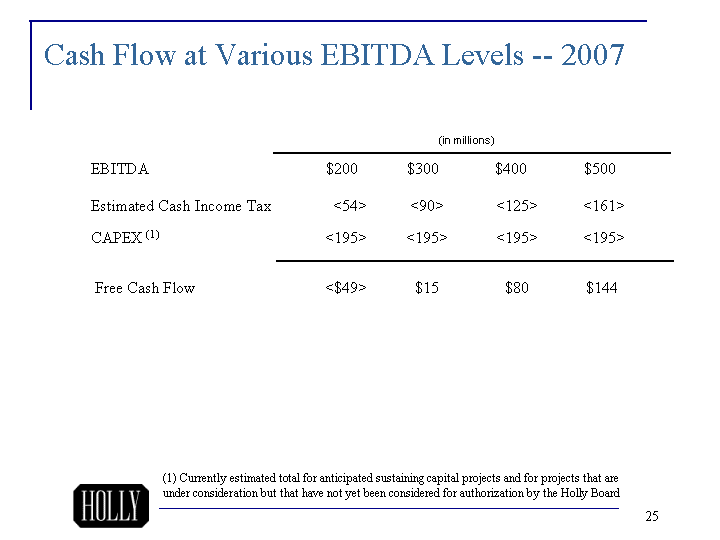
Cash Flow at Various EBITDA Levels -- 2007 EBITDA $200 $300 $400 $500 Estimated Cash Income Tax <54> <90> <125> <161> CAPEX (1) <195> <195> <195> <195> Free Cash Flow <$49> $15 $80 $144 (in millions) (1) Currently estimated total for anticipated sustaining capital projects and for projects that are under consideration but that have not yet been considered for authorization by the Holly Board |
Cash Flow at Various EBITDA Levels -- 2008 EBITDA $200 $300 $400 $500 Estimated Cash Income Tax <4> <40> <76> <112> CAPEX (1) <204> <204> <204> <204> Free Cash Flow <$8> $56 $120 $184 (in millions) (1) Currently estimated total for anticipated sustaining capital projects and for projects that are under consideration but that have not yet been considered for authorization by the Holly Board |
Jan Feb Mar Apr May Jun Jul Aug Sep Oct Nov Dec East 3.9 5.21 7.33 6.46 4.92 5.48 5.79 5.73 5.1 6.64 6.2 2 West 1.67 2.31 4.05 7 7.46 5.67 0.25 2.08 3.77 2.04 1.43 2.66 0.2 0.2 0.2 0.2 0.2 0.2 0.2 0.2 0.2 0.2 0.2 0.2 1.16 2.95 0.35 3.71 3.5 1.93 4.45 6.81 13.89 14.33 3.07 4.43 nrc gm 9.4 9.3 19.05 22.23 24.97 23.19 21.7 gc 321 4.97 4.88 5.86 7.66 6.86 5.37 5.54 6.57 9.6 7.23 3.7 3.77 budget 05 gc 321 05 nrc gm 5.67 9.59 11.34 17.37 15.9 13.28 10.69 14.82 22.96 23.21 10.9 9.29 Rev bud Bud 06 Navajo Refining Margins (monthly) Red bars represent '01-'05 5-yr. high & low gross margin range. Median of that range is depicted in blue. Actual '06 gross margin is represented with solid line. Dotted line is '05 gross margin actual. Solid maroon line is Gulf Coast '3-2-1' Refining Margin Estimate for month per Q2 earnings call |
Woods Cross Margins (monthly) Jan Feb Mar Apr May Jun Jul Aug Sep Oct Nov Dec East -1.09 1.21 5.56 4.32 6.98 2.33 2.87 3.93 -0.67 -0.95 4.97 -0.97 West 3.01 1.52 0.19 5.58 3.93 1.93 4.28 2.13 10.38 5.44 2.56 3.15 0.2 0.2 0.2 0.2 0.2 0.2 0.2 0.2 0.2 0.2 0.2 0.2 2.78 1.43 4.97 5 2.74 4.39 1.05 2.8 14.65 18.48 0.72 2.37 wx gm 1.01 12.98 14.19 15.99 21.68 21.88 16.53 gc 321 4.97 4.88 5.86 7.66 6.86 5.37 5.54 6.57 9.6 7.23 3.7 3.77 budget 05 gc 321 05 wx gm 0 4.35 6.05 15.1 13.85 2.33 8.4 8.12 24.56 23.17 8.45 0 Rev bud 06 Bud Red bars represent '01-'05 5-yr. high & low gross margin range. Median of that range is depicted in blue. Actual '06 gross margin is represented with solid line. Dotted line is '05 gross margin actual. Solid maroon line is Gulf Coast '3-2-1' Refining Margin Estimate for month per Q2 earnings call |
Western U.S. Supply Production / Logistics Longhorn |
Strong management team Strong financial fundamentals Strong industry fundamentals Favorable comparison to peer group metrics Operates in high margin, high growth markets Demonstrated growth ability Capital initiatives to continue growth in place Industry leading return of capital metrics Concluding remarks |
Holly Corporation 100 Crescent Court, Suite 1600 Dallas, Texas 75201 (214) 871-3555 Steve McDonnell, VP-Chief Financial Officer M. Neale Hickerson, VP-Investor Relations www.hollycorp.com |
Definitions BPD - Barrels per day EBITDA - Earnings before interest, taxes, depreciation and amortization which is calculated as net income plus (i) interest expense net of interest income and (ii) depreciation and amortization. EBITDA is not a calculation based upon U.S. generally accepted accounting principles ("U.S. GAAP"). However, the amounts included in the EBITDA calculation are derived from amounts included in our consolidated financial statements. EBITDA should not be considered as an alternative to net income or operating income, as an indication of our operating performance or as an alternative to operating cash flow as a measure of liquidity. EBITDA is not necessarily comparable to similarly titled measures of other companies. EBITDA is presented here because it is a widely used financial indicator used by investors and analysts to measure performance. EBITDA is also used by our management for internal analysis and as a basis for compliance with financial covenants. Debt to equity - Debt divided by total stockholders' equity. Return on invested capital - Net income divided by the sum of total stockholders' equity plus debt. Debt includes long-term debt and current maturities of long-term debt. |