Exhibit 99.1
Holly Corporation Spring 2009 Update |
Disclosure Statement Statements made during the course of this presentation that are not historical facts are "forward-looking statements" within the meaning of the U.S. Private Securities Litigation Reform Act of 1995. Forward- looking statements are inherently uncertain and necessarily involve risks that may affect the business prospects and performance of Holly Corporation and/or Holly Energy Partners, L.P., and actual results may differ materially from those discussed during the presentation. Such risks and uncertainties include but are not limited to risks and uncertainties with respect to the actions of actual or potential competitive suppliers and transporters of refined petroleum products in Holly's and Holly Energy Partners' markets, the demand for and supply of crude oil and refined products, the spread between market prices for refined products and market prices for crude oil, the possibility of constraints on the transportation of refined products, the possibility of inefficiencies or shutdowns in refinery operations or pipelines, effects of governmental regulations and policies, the availability and cost of financing to Holly and Holly Energy Partners, the effectiveness of Holly's and Holly Energy Partners' capital investments and marketing and acquisition strategies, the possibility of terrorist attacks and the consequences of any such attacks, and general economic conditions. Additional information on risks and uncertainties that could affect the business prospects and performance of Holly and Holly Energy Partners is provided in the most recent reports of Holly and Holly Energy Partners filed with the Securities and Exchange Commission. All forward-looking statements included in this presentation are expressly qualified in their entirety by the foregoing cautionary statements. Holly and Holly Energy Partners undertake no obligation to publicly update or revise any forward-looking statements, whether as a result of new information, future events or otherwise. |
Holly Operations & Growth Advantages Pure play independent refiner 40 years of refining experience Assets positioned to serve historically high growth & high margin markets Track record of superior returns on capital among peers Strong balance sheet & cash flow generation for capital investment & share repurchases Capital projects with significant impact relative to current cash flow Strong growth orientation in capital deployment ("Offensive play") Increased optionality in capital deployment ("Defensive play") Relationship with Holly Energy Partners, L.P. Proven management team to execute on consistent operations & efficient capital deployment |
Strong Financial Position vs. Peer Group (Excludes HEP reconsolidation in 2008) 4 Return on Invested Capital Return on Invested Capital 2004 26% 2005 45% 2006 63% 2007 63% 20081 22% High return on invested capital Strong cash flow generation 1 Excludes HEP debt-including HEP debt, ROIC equals 14% 2 Excludes HEP debt-including HEP debt, 5-year average ROIC equals 37% 2 |
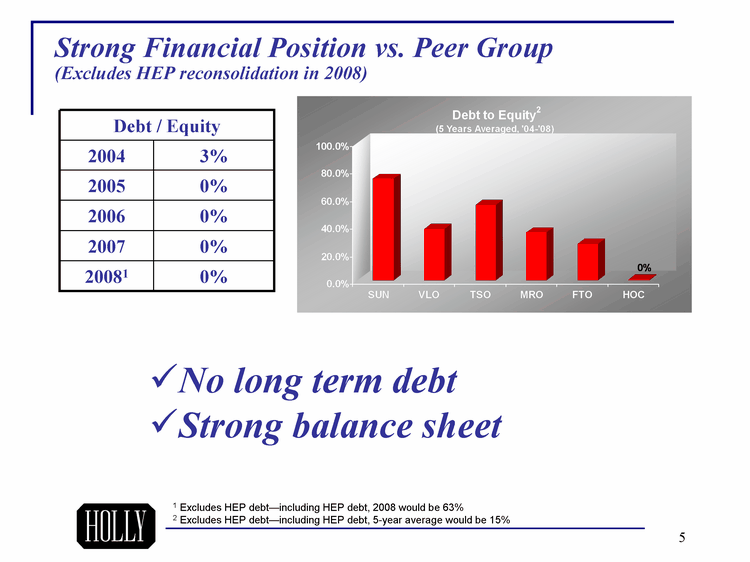
Strong Financial Position vs. Peer Group (Excludes HEP reconsolidation in 2008) 5 Debt / Equity Debt / Equity 2004 3% 2005 0% 2006 0% 2007 0% 20081 0% No long term debt Strong balance sheet 1 Excludes HEP debt-including HEP debt, 2008 would be 63% 2 Excludes HEP debt-including HEP debt, 5-year average would be 15% |
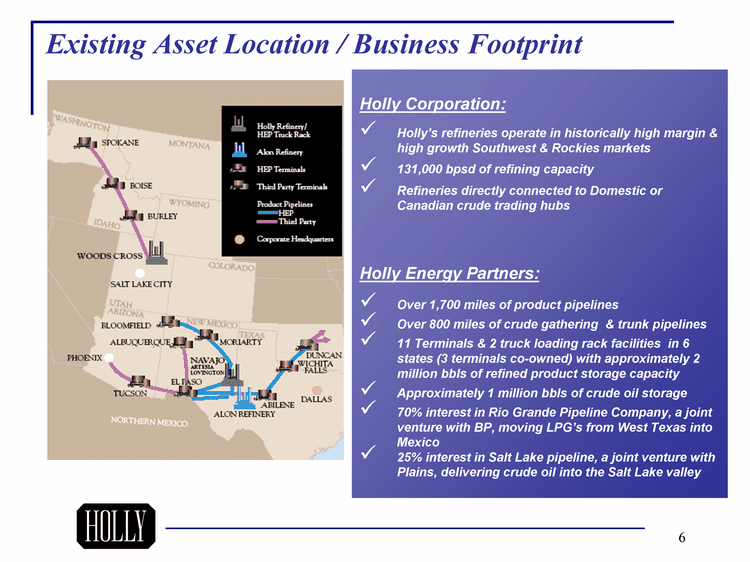
Existing Asset Location / Business Footprint Holly Corporation: Holly's refineries operate in historically high margin & high growth Southwest & Rockies markets 131,000 bpsd of refining capacity Refineries directly connected to Domestic or Canadian crude trading hubs Holly Energy Partners: Over 1,700 miles of product pipelines Over 800 miles of crude gathering & trunk pipelines 11 Terminals & 2 truck loading rack facilities in 6 states (3 terminals co-owned) with approximately 2 million bbls of refined product storage capacity Approximately 1 million bbls of crude oil storage 70% interest in Rio Grande Pipeline Company, a joint venture with BP, moving LPG's from West Texas into Mexico 25% interest in Salt Lake pipeline, a joint venture with Plains, delivering crude oil into the Salt Lake valley |
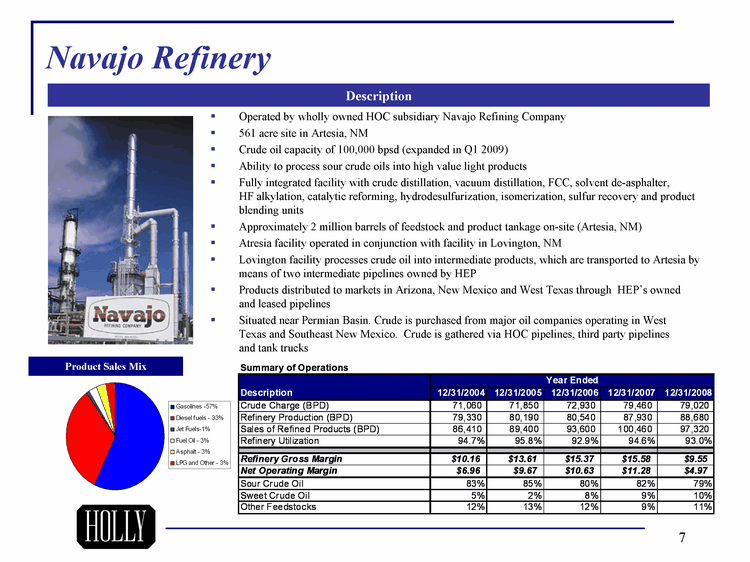
Navajo Refinery Description Operated by wholly owned HOC subsidiary Navajo Refining Company 561 acre site in Artesia, NM Crude oil capacity of 100,000 bpsd (expanded in Q1 2009) Ability to process sour crude oils into high value light products Fully integrated facility with crude distillation, vacuum distillation, FCC, solvent de-asphalter, HF alkylation, catalytic reforming, hydrodesulfurization, isomerization, sulfur recovery and product blending units Approximately 2 million barrels of feedstock and product tankage on-site (Artesia, NM) Atresia facility operated in conjunction with facility in Lovington, NM Lovington facility processes crude oil into intermediate products, which are transported to Artesia by means of two intermediate pipelines owned by HEP Products distributed to markets in Arizona, New Mexico and West Texas through HEP's owned and leased pipelines Situated near Permian Basin. Crude is purchased from major oil companies operating in West Texas and Southeast New Mexico. Crude is gathered via HOC pipelines, third party pipelines and tank trucks Product Sales Mix |
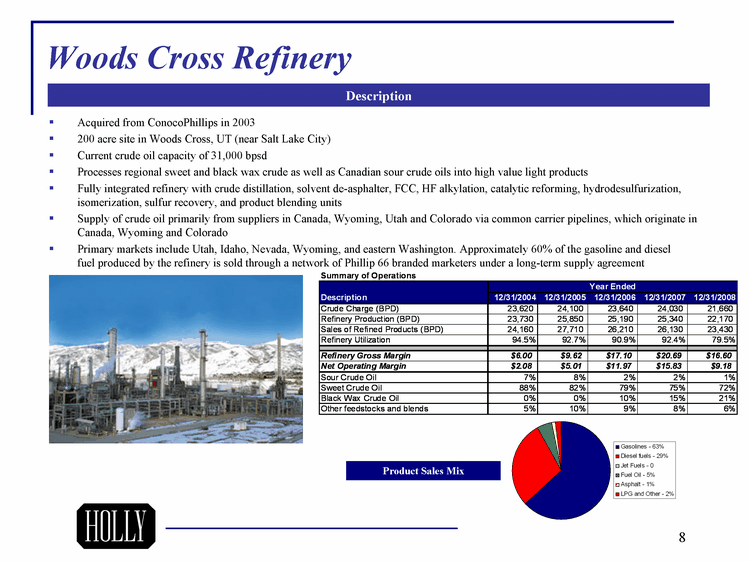
Woods Cross Refinery Description Acquired from ConocoPhillips in 2003 200 acre site in Woods Cross, UT (near Salt Lake City) Current crude oil capacity of 31,000 bpsd Processes regional sweet and black wax crude as well as Canadian sour crude oils into high value light products Fully integrated refinery with crude distillation, solvent de-asphalter, FCC, HF alkylation, catalytic reforming, hydrodesulfurization, isomerization, sulfur recovery, and product blending units Supply of crude oil primarily from suppliers in Canada, Wyoming, Utah and Colorado via common carrier pipelines, which originate in Canada, Wyoming and Colorado Primary markets include Utah, Idaho, Nevada, Wyoming, and eastern Washington. Approximately 60% of the gasoline and diesel fuel produced by the refinery is sold through a network of Phillip 66 branded marketers under a long-term supply agreement Product Sales Mix |
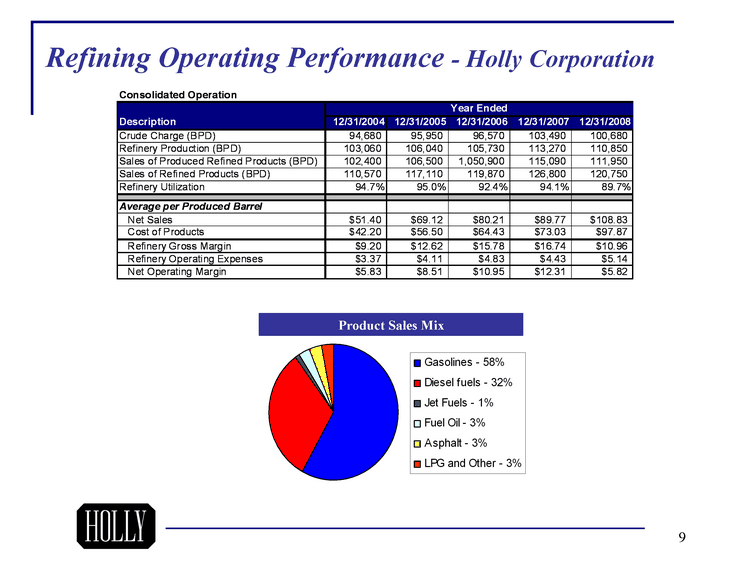
Refining Operating Performance - Holly Corporation Product Sales Mix |
2003 2004 2005 2006 2007 2008 East 112 174 303 414 528.9 262 Gross Margin: $7.23/BBL $9.20/BBL $12.62/BBL $15.78/BBL $16.74/BBL 10 Holly Historical EBITDA (in millions) & Associated Gross Margin per bbl *HEP formed in July 2004 $10.96/BBL |
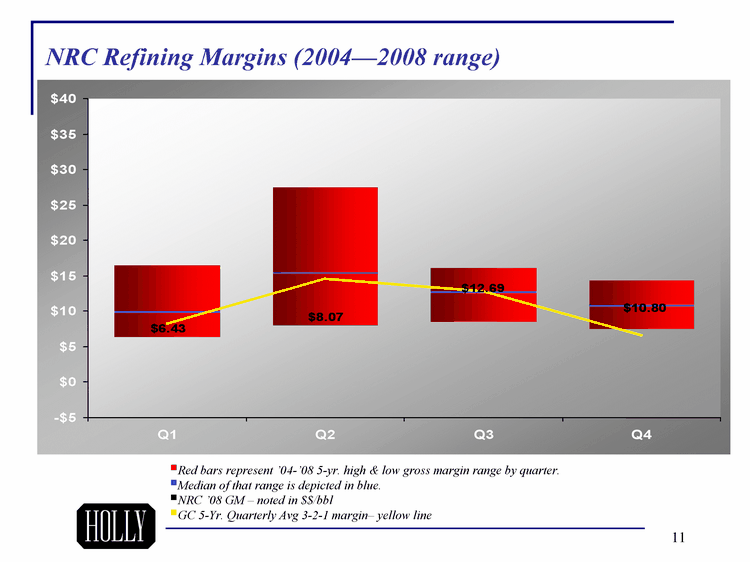
NRC Refining Margins (2004-2008 range) Q1 Q2 Q3 Q4 East 6.43 8.07 8.56 7.47 West 3.35 7.26 4.03 3.23 0.2 0.2 0.2 0.2 6.56 12.01 3.32 3.46 nrc 08 gm 6.43 8.07 12.69 10.8 gc 321 8.33 14.61 12.86 6.62 08 gm 0 line 2006 gm Rev bud Bud 06 Red bars represent '04-'08 5-yr. high & low gross margin range by quarter. Median of that range is depicted in blue. NRC '08 GM - noted in $$/bbl GC 5-Yr. Quarterly Avg 3-2-1 margin- yellow line |
Q1 Q2 Q3 Q4 East 3.17 10.07 4.26 4.98 West 6.18 2.32 15.43 9.97 0.2 0.2 0.2 0.2 5.19 18.63 8.15 2.13 wx 08 gm 12.54 12.49 28.04 17 gc 321 8.33 14.61 12.86 6.62 08 gm 0 line 2006 gm Rev bud Bud 06 Woods Cross Refining Margins (2004-2008 range): Red bars represent '04-'08 5-yr. high & low gross margin range by quarter. Median of that range is depicted in blue. WX '08 GM - noted in $$/bbl GC 5-Yr. Quarterly Avg 3-2-1 margin- yellow line |
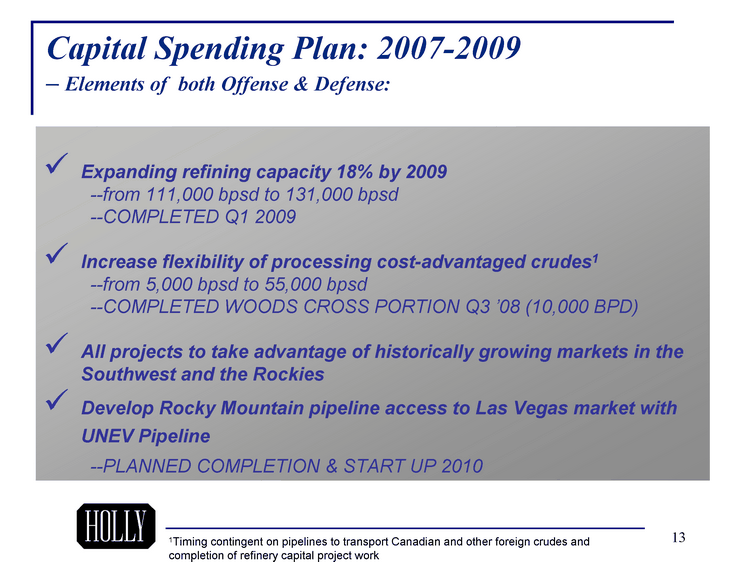
Capital Spending Plan: 2007-2009 - - Elements of both Offense & Defense: Expanding refining capacity 18% by 2009 - --from 111,000 bpsd to 131,000 bpsd - --COMPLETED Q1 2009 Increase flexibility of processing cost-advantaged crudes1 - --from 5,000 bpsd to 55,000 bpsd - --COMPLETED WOODS CROSS PORTION Q3 '08 (10,000 BPD) All projects to take advantage of historically growing markets in the Southwest and the Rockies Develop Rocky Mountain pipeline access to Las Vegas market with UNEV Pipeline - --PLANNED COMPLETION & START UP 2010 1Timing contingent on pipelines to transport Canadian and other foreign crudes and completion of refinery capital project work |
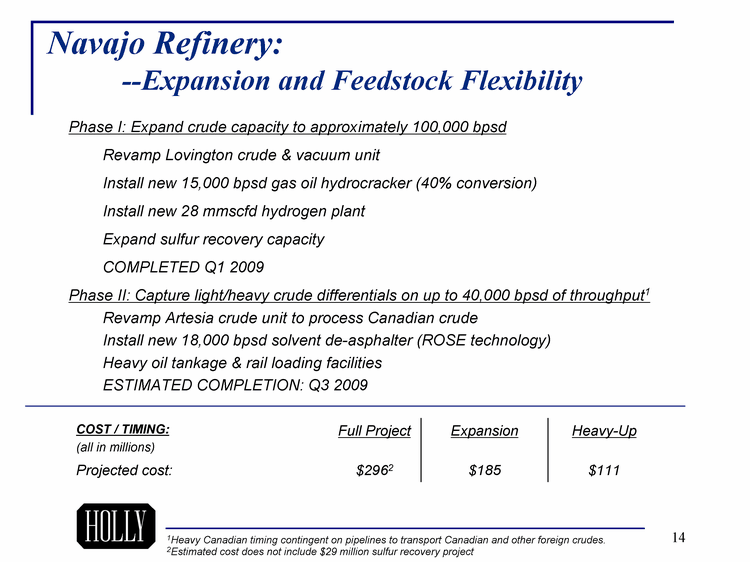
Navajo Refinery: --Expansion and Feedstock Flexibility Phase I: Expand crude capacity to approximately 100,000 bpsd Revamp Lovington crude & vacuum unit Install new 15,000 bpsd gas oil hydrocracker (40% conversion) Install new 28 mmscfd hydrogen plant Expand sulfur recovery capacity COMPLETED Q1 2009 Phase II: Capture light/heavy crude differentials on up to 40,000 bpsd of throughput1 Revamp Artesia crude unit to process Canadian crude Install new 18,000 bpsd solvent de-asphalter (ROSE technology) Heavy oil tankage & rail loading facilities ESTIMATED COMPLETION: Q3 2009 COST / TIMING: (all in millions) Full Project Expansion Heavy-Up Projected cost: $2962 $185 $111 1Heavy Canadian timing contingent on pipelines to transport Canadian and other foreign crudes. 2Estimated cost does not include $29 million sulfur recovery project |
Woods Cross Refinery: --Expansion and Feedstock Flexibility Expand refinery to 31,000 bpsd Increase amount of Canadian / Black Wax Crudes to 50% of crude capacity Install new 15,000 bpsd gas oil hydrocracker (40% conversion) New Black Wax desalter Expand sulfur recovery capacity Black Wax crude unloading facility Cost: $122 million COMPLETED Q3 2008 |
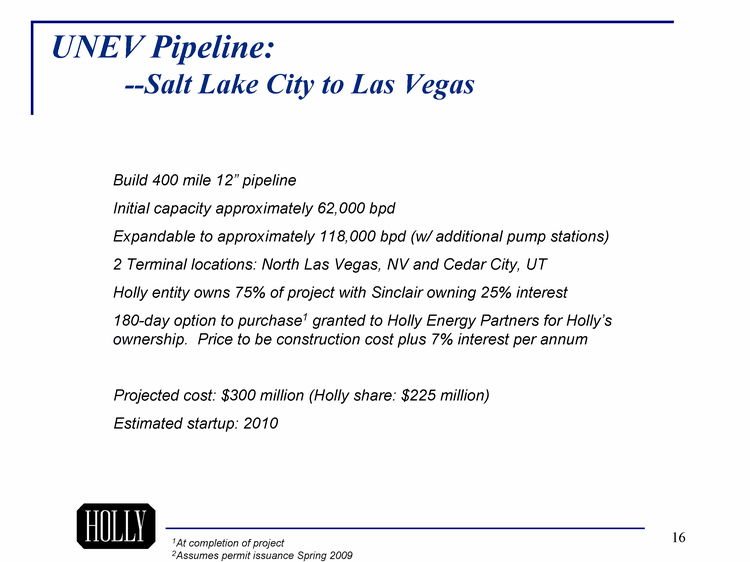
UNEV Pipeline: --Salt Lake City to Las Vegas Build 400 mile 12" pipeline Initial capacity approximately 62,000 bpd Expandable to approximately 118,000 bpd (w/ additional pump stations) 2 Terminal locations: North Las Vegas, NV and Cedar City, UT Holly entity owns 75% of project with Sinclair owning 25% interest 180-day option to purchase1 granted to Holly Energy Partners for Holly's ownership. Price to be construction cost plus 7% interest per annum Projected cost: $300 million (Holly share: $225 million) Estimated startup: 2010 1At completion of project 2Assumes permit issuance Spring 2009 |
Projected Capital Expenditures by Year Capital Projects: 2007 2008 2009 Total NRC expansion and feedstock flexibility 59 132 90 281 Phase I - Expansion 52 88 45 185 Phase II - Feedstock Flexibility 7 42 40 89 Heavy oil tankage & loading facility 0 2 5 7 WX expansion and feedstock flexibility 40 68 14 122 Sulfur recovery unit at NRC 9 15 7 31 Sustaining capital, turnaround & payout projects 47 63 47 157 Refinery Project Total 155 278 158 591 UNEV pipeline1 8 64 120 192 Roadrunner pipeline2 & interconnects 0 24 72 96 Total 163 366 350 879 Estimates: ($ in millions) Actual: ($ in millions) 1Capital spending assumes 75% ownership interest, w/ 25% Sinclair joint venture partner 2Pipeline to be constructed from the terminus of the Centurion Pipeline delivering crude to Navajo Refinery complexes |
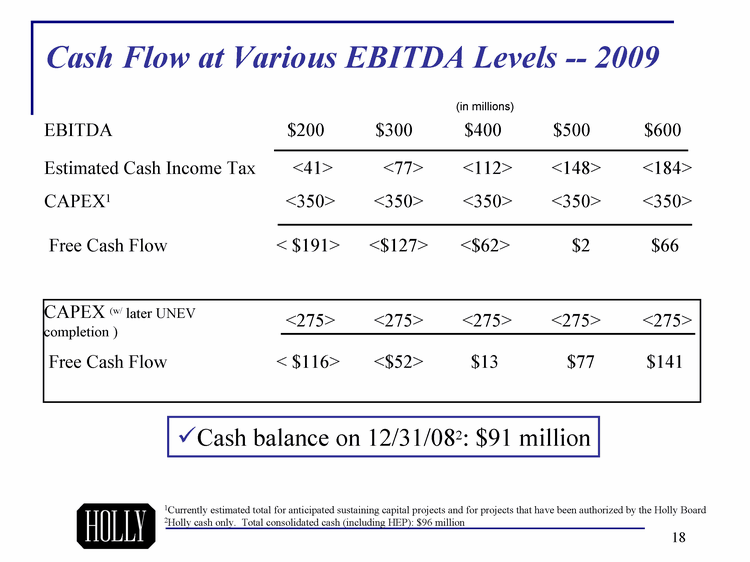
Cash Flow at Various EBITDA Levels -- 2009 EBITDA $200 $300 $400 $500 $600 Estimated Cash Income Tax <41> <77> <112> <148> <184> CAPEX1 <350> <350> <350> <350> <350> Free Cash Flow < $191> <$127> <$62> $2 $66 (in millions) 1Currently estimated total for anticipated sustaining capital projects and for projects that have been authorized by the Holly Board 2Holly cash only. Total consolidated cash (including HEP): $96 million Cash balance on 12/31/082: $91 million CAPEX (w/ later UNEV completion ) <275> <275> <275> <275> <275> Free Cash Flow < $116> <$52> $13 $77 $141 |
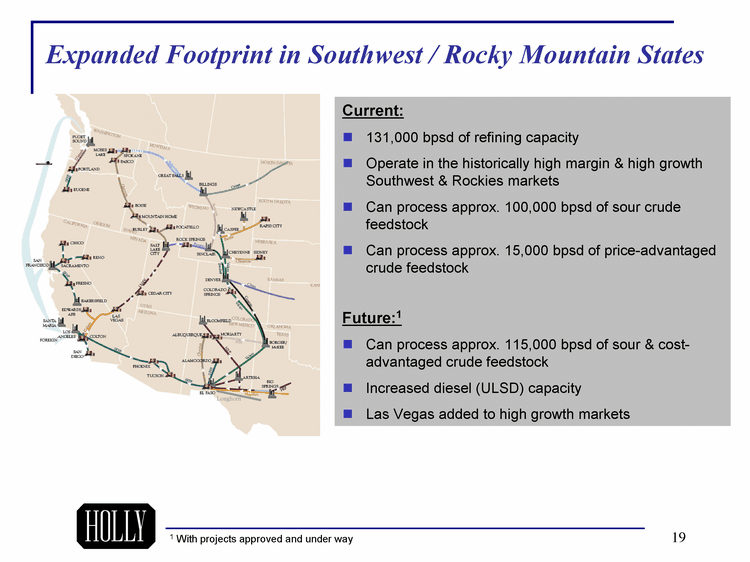
Expanded Footprint in Southwest / Rocky Mountain States Current: 131,000 bpsd of refining capacity Operate in the historically high margin & high growth Southwest & Rockies markets Can process approx. 100,000 bpsd of sour crude feedstock Can process approx. 15,000 bpsd of price-advantaged crude feedstock Future:1 Can process approx. 115,000 bpsd of sour & cost- advantaged crude feedstock Increased diesel (ULSD) capacity Las Vegas added to high growth markets 1 With projects approved and under way Longhorn |
Estimated Effects of Capital Projects at Holly's Refineries Illustrative computations of impact of expansion & gross margins 20 Gross Margin/bbl Consolidated Navajo Woods Cross 2003 $7.23 $7.43 $6.10 2004 $9.20 $10.16 $6.00 2005 $12.62 $13.61 $9.62 2006 $15.78 $15.37 $17.10 2007 $16.74 $15.58 $20.69 2008 $10.96 $9.55 $16.60 For every +/- $1/bbl change in gross margin: NRC equals $5.475 million -- WX equals $1.825 million |
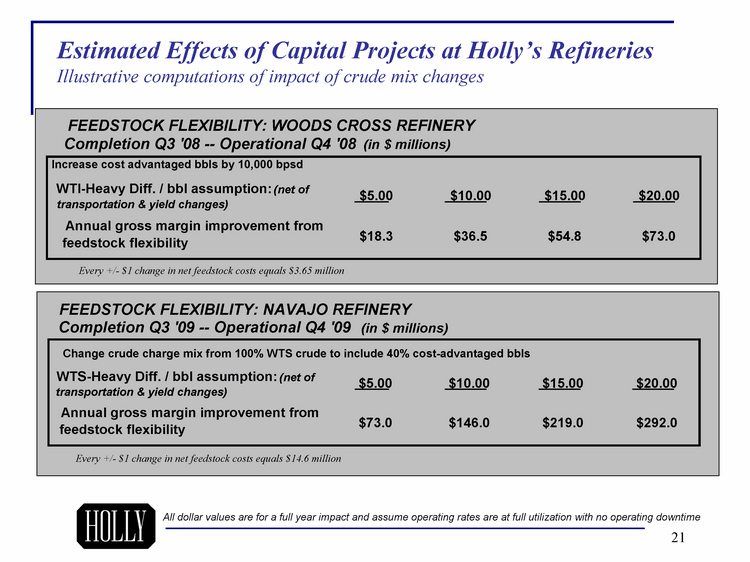
21 Estimated Effects of Capital Projects at Holly's Refineries Illustrative computations of impact of crude mix changes Every +/- $1 change in net feedstock costs equals $3.65 million Every +/- $1 change in net feedstock costs equals $14.6 million All dollar values are for a full year impact and assume operating rates are at full utilization with no operating downtime FEEDSTOCK FLEXIBILITY: WOODS CROSS REFINERY Completion Q3 '08 -- Operational Q4 '08 (in $ millions) Increase cost advantaged bbls by 10,000 bpsd WTI-Heavy Diff. / bbl assumption: (net of transportation & yield changes) $5.00 $10.00 $15.00 $20.00 Annual gross margin improvement from feedstock flexibility $18.3 $36.5 $54.8 $73.0 FEEDSTOCK FLEXIBILITY: NAVAJO REFINERY Completion Q3 '09 -- Operational Q4 '09 (in $ millions) Change crude charge mix from 100% WTS crude to include 40% cost-advantaged bbls WTS-Heavy Diff. / bbl assumption: (net of transportation & yield changes) $5.00 $10.00 $15.00 $20.00 Annual gross margin improvement from feedstock flexibility $73.0 $146.0 $219.0 $292.0 |
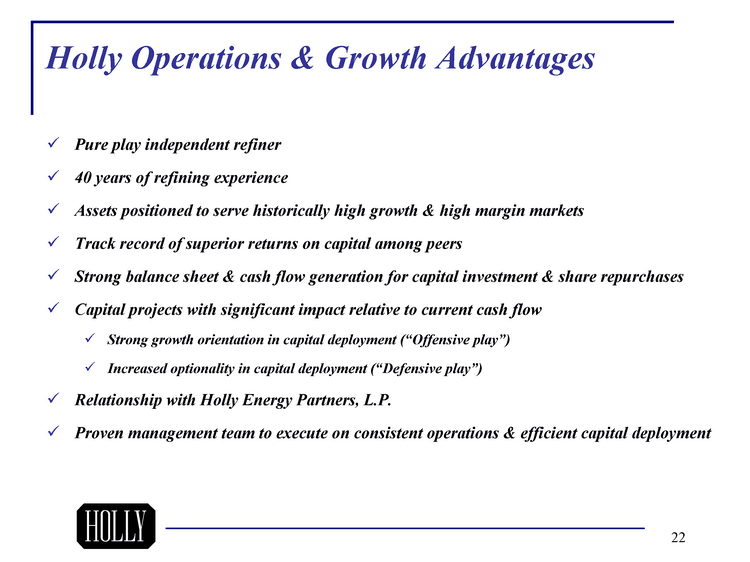
Holly Operations & Growth Advantages Pure play independent refiner 40 years of refining experience Assets positioned to serve historically high growth & high margin markets Track record of superior returns on capital among peers Strong balance sheet & cash flow generation for capital investment & share repurchases Capital projects with significant impact relative to current cash flow Strong growth orientation in capital deployment ("Offensive play") Increased optionality in capital deployment ("Defensive play") Relationship with Holly Energy Partners, L.P. Proven management team to execute on consistent operations & efficient capital deployment |
Holly Corporation 100 Crescent Court, Suite 1600 Dallas, Texas 75201 (214) 871-3555 Bruce Shaw, Senior VP-Chief Financial Officer M. Neale Hickerson, VP-Investor Relations www.hollycorp.com |
Appendix |
Definitions BPD: the number of barrels per calendar day of crude oil or petroleum products. BPSD: the number of barrels per stream day of crude oil or petroleum products. EBITDA: Earnings before interest, taxes, depreciation and amortization, which we refer to as EBITDA, is calculated as net income plus (i) interest expense net of interest income, (ii) income tax provision, and (iii) depreciation, depletion and amortization. EBITDA is not a calculation provided for under accounting principles generally accepted in the United States; however, the amounts included in the EBITDA calculation are derived from amounts included in our consolidated financial statements. Gas Oil Hydrocracker: a refinery unit which uses catalyst at high pressure and temperature and in the presence of hydrogen to convert high boiling point hydrocarbons to light transportation fuels and low sulfur FCC feedstock. MMSCFD: million standard cubic feet per day. Refining gross margin or refinery gross margin: the difference between average net sales price and average costs of products per barrel of produced refined products. This does not include the associated depreciation, depletion and amortization costs. Solvent deasphalter / residuum oil supercritical extraction ("ROSE"): a refinery unit that uses a light hydrocarbon like propane or butane to extract non asphaltene heavy oils from asphalt or atmospheric reduced crude. These deasphalted oils are then further converted to gasoline and diesel in the FCC process. The remaining asphaltenes are either sold, blended to fuel oil or blended with other asphalt as a hardener. .. |
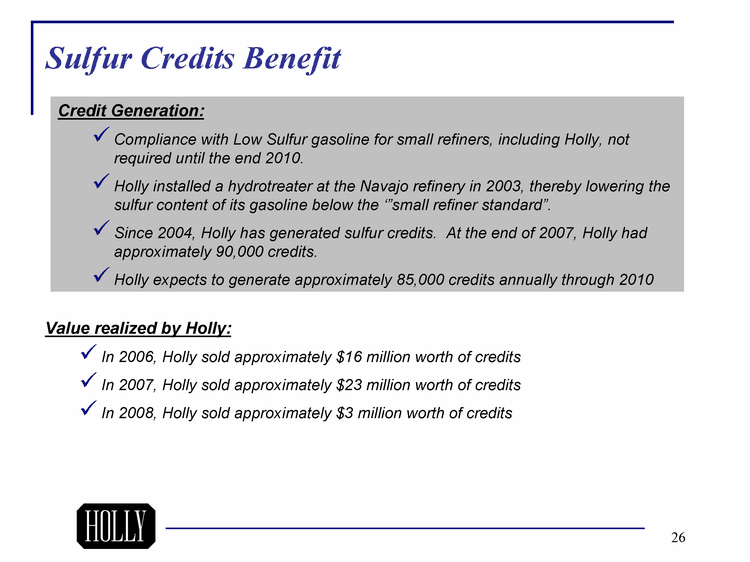
Sulfur Credits Benefit Value realized by Holly: In 2006, Holly sold approximately $16 million worth of credits In 2007, Holly sold approximately $23 million worth of credits In 2008, Holly sold approximately $3 million worth of credits Credit Generation: Compliance with Low Sulfur gasoline for small refiners, including Holly, not required until the end 2010. Holly installed a hydrotreater at the Navajo refinery in 2003, thereby lowering the sulfur content of its gasoline below the '"small refiner standard". Since 2004, Holly has generated sulfur credits. At the end of 2007, Holly had approximately 90,000 credits. Holly expects to generate approximately 85,000 credits annually through 2010 |