Exhibit 13.1
SELECTED PAGES OF THE 2013 ANNUAL STOCKHOLDERS’ REPORT
Selected Financial Data
(in thousands, except per share amounts) | | 2013 | 2012 | 2011 | 2010 | 2009 |
| | | | | | | | | | | |
Operations | | | | | | | | | | | |
Net Sales | | $8,751,654 | | $8,230,670 | | $7,895,089 | | $7,220,719 | | $6,533,671 | |
Net Earnings | | 530,076 | | 504,961 | | 479,196 | | 399,776 | | 345,978 | |
Net Earnings Attributable to Hormel Foods Corporation | | 526,211 | | 500,050 | | 474,195 | | 395,587 | | 342,813 | |
% of net sales | | 6.01 | % | 6.08 | % | 6.01 | % | 5.48 | % | 5.25 | % |
EBIT(1) | | 802,124 | | 759,763 | | 737,283 | | 642,386 | | 533,414 | |
% of net sales | | 9.17 | % | 9.23 | % | 9.34 | % | 8.90 | % | 8.16 | % |
EBITDA(2) | | 926,974 | | 879,257 | | 861,448 | | 767,977 | | 660,552 | |
% of net sales | | 10.59 | % | 10.68 | % | 10.91 | % | 10.64 | % | 10.11 | % |
Return on Invested Capital(3) | | 14.92 | % | 16.43 | % | 16.85 | % | 14.89 | % | 14.09 | % |
| | | | | | | | | | | |
Financial Position | | | | | | | | | | | |
Total Assets | | 4,915,880 | | 4,563,966 | | 4,244,391 | | 4,053,918 | | 3,692,055 | |
Long-term Debt less Current Maturities | | 250,000 | | 250,000 | | 250,000 | | – | | 350,000 | |
Hormel Foods Corporation Shareholders’ Investment | | 3,311,040 | | 2,819,455 | | 2,656,582 | | 2,400,657 | | 2,122,608 | |
| | | | | | | | | | | |
Selected Cash Flow Data | | | | | | | | | | | |
Depreciation and Amortization | | 124,850 | | 119,494 | | 124,165 | | 125,591 | | 127,138 | |
Capital Expenditures | | 106,762 | | 132,303 | | 96,911 | | 89,823 | | 96,961 | |
Acquisitions of Businesses | | 665,415 | | 168 | | 7,207 | | 28,104 | | 701 | |
Share Repurchase | | 70,819 | | 61,366 | | 152,930 | | 69,574 | | 38,147 | |
Dividends Paid | | 174,320 | | 152,204 | | 129,975 | | 109,374 | | 101,376 | |
| | | | | | | | | | | |
Common Stock | | | | | | | | | | | |
Weighted-Average Shares Outstanding — Basic | | 264,317 | | 263,466 | | 266,394 | | 266,732 | | 268,454 | |
Weighted-Average Shares Outstanding — Diluted | | 270,224 | | 268,891 | | 271,915 | | 270,698 | | 270,979 | |
Earnings per Share — Basic | | $ 1.99 | | $ 1.90 | | $ 1.78 | | $ 1.48 | | $ 1.28 | |
Earnings per Share — Diluted | | 1.95 | | 1.86 | | 1.74 | | 1.46 | | 1.27 | |
Dividends per Share | | 0.68 | | 0.60 | | 0.51 | | 0.42 | | 0.38 | |
Hormel Foods Corporation Shareholders’ Investment per Share | | 12.56 | | 10.72 | | 10.06 | | 9.03 | | 7.94 | |
The Company provides EBIT, EBITDA, and Return on Invested Capital because these measures are useful to investors as indicators of operating strength and performance relative to prior years, and are typically used to benchmark our Company’s performance against other companies in our industry. Management uses EBIT as a component of certain executive plans, but does not utilize EBITDA for any material purpose. These measures are calculated as follows:
| | 2013 | 2012 | 2011 | 2010 | 2009 |
(1) EBIT: | | | | | | | | | | | |
Net Earnings Attributable toHormel Foods Corporation | | $ 526,211 | | $ 500,050 | | $ 474,195 | | $ 395,587 | | $ 342,813 | |
Plus: Income Tax Expense | | 268,431 | | 253,374 | | 239,640 | | 224,775 | | 182,169 | |
Plus: Interest Expense | | 12,453 | | 12,859 | | 22,662 | | 26,589 | | 27,995 | |
Less: Interest and Investment Income (Loss) | | 4,971 | | 6,520 | | (786 | ) | 4,565 | | 19,563 | |
EBIT | | $ 802,124 | | $ 759,763 | | $ 737,283 | | $ 642,386 | | $ 533,414 | |
(2) EBITDA: | | | | | | | | | | | |
EBIT per (1) above | | $ 802,124 | | $ 759,763 | | $ 737,283 | | $ 642,386 | | $ 533,414 | |
Plus: Depreciation and Amortization | | 124,850 | | 119,494 | | 124,165 | | 125,591 | | 127,138 | |
EBITDA | | $ 926,974 | | $ 879,257 | | $ 861,448 | | $ 767,977 | | $ 660,552 | |
(3) Return on Invested Capital: | | | | | | | | | | | |
EBIT per (1) above | | $ 802,124 | | $ 759,763 | | $ 737,283 | | $ 642,386 | | $ 533,414 | |
X (1 — Effective Tax Rate*) | | 66.22 | % | 66.37 | % | 66.43 | % | 63.77 | % | 65.30 | % |
After-tax EBIT | | 531,166 | | 504,257 | | 489,771 | | 409,631 | | 348,319 | |
Divided by: | | | | | | | | | | | |
Total Debt | | 250,000 | | 250,000 | | 250,000 | | 350,000 | | 350,000 | |
Hormel Foods Corporation Shareholders’ Investment | | 3,311,040 | | 2,819,455 | | 2,656,582 | | 2,400,657 | | 2,122,608 | |
Total Debt and Shareholders’ Investment | | 3,561,040 | | 3,069,455 | | 2,906,582 | | 2,750,657 | | 2,472,608 | |
Return on Invested Capital | | 14.92 | % | 16.43 | % | 16.85 | % | 14.89 | % | 14.09 | % |
* Excluding earnings attributable to noncontrolling interests.
13
Management’s Discussion and Analysis of Financial Condition and Results of Operations
EXECUTIVE OVERVIEW
Fiscal 2013: Hormel Foods achieved record sales and earnings for fiscal 2013. Sales grew more than 6 percent to $8.8 billion with all five reporting segments recording top line increases. Net earnings for the year were $526.2 million, an increase of 5.2 percent over 2012, with four of five segments contributing to the growth. Earnings per diluted share were $1.95, a 4.8 percent improvement compared to last year.
Significant contributions by both the Grocery Products and International & Other segments drove top and bottom-line growth. Double-digit gains for these segments were supported by the addition of the SKIPPY® peanut butter business, acquired at the beginning of the second quarter. The International & Other segment also benefitted from continued strength in export sales of the SPAM® family of products and fresh pork, along with improved profitability by the Company’s China operations. The results for the Refrigerated Foods segment improved slightly over last year, as the impact of higher pork input costs weighed on the value-added Meat Products and Foodservice businesses. Pork operating margins improved from the challenging environment last year. Significantly higher grain costs and lower commodity turkey meat prices combined to drive lower results for the Jennie-O Turkey Store segment. Momentum from continued growth in value-added products, along with performance gains and expense reductions in the live production supply chain more than offset these year-over-year higher costs during the last quarter of the fiscal year. Strong results in the first nine months of fiscal 2013 drove full year operating profit gains for Specialty Foods. Specialty Foods net sales and segment profit were negatively affected in the last quarter of the year, due to the expiration of the agreement allowing Diamond Crystal Brands to sell certain sugar substitutes in foodservice trade channels. General corporate expense was higher on increased salary, pension, and insurance expense while net interest and investment expense increased due to lower interest income.
Our financial performance continued to generate substantial operating cash flows. We announced our 48th consecutive year of dividend increases, raising our dividend rate by 17.6 percent for fiscal 2014, and repurchased 1.7 million shares of common stock in fiscal 2013, spending $70.8 million.
Fiscal 2014 Outlook: In fiscal 2014, we expect to deliver year-over-year improvements in both sales and earnings. More favorable grain and turkey commodity costs are expected, along with more normalized pork operating margins. We expect the Grocery Products, Refrigerated Foods, Jennie-O
Turkey Store, and International & Other segments to deliver year-over-year earnings growth, while our Specialty Foods segment is projected to post lower earnings as it rebuilds after the expiration of a contract representing a portion of its sugar substitute business. We will benefit from a full year of contributions from the SKIPPY® peanut butter business. Building our branded, value-added product lines and delivering product innovation will be continued priorities which will allow us to provide consumers with great tasting, convenient, and healthy food options at a good value. Our strong balance sheet and free cash flow will provide the opportunity to build our business through internal expansion or strategic acquisitions, as well as continue to return cash to our shareholders.
CRITICAL ACCOUNTING POLICIES
This discussion and analysis of financial condition and results of operations is based upon the consolidated financial statements of Hormel Foods Corporation (the Company), which have been prepared in accordance with U.S. generally accepted accounting principles (GAAP). The preparation of these financial statements requires the Company to make estimates and judgments that affect the reported amounts of assets, liabilities, revenues and expenses, and related disclosure of contingent assets and liabilities. The Company evaluates, on an ongoing basis, its estimates for reasonableness as changes occur in its business environment. The Company bases its estimates on experience, the use of independent third-party specialists, and various other assumptions that are believed to be reasonable under the circumstances, the results of which form the basis for making judgments about the carrying values of assets and liabilities that are not readily apparent from other sources. Actual results may differ materially from these estimates under different assumptions or conditions.
Critical accounting policies are defined as those that are reflective of significant judgments, estimates, and uncertainties, and potentially result in materially different results under different assumptions and conditions. The Company believes the following are its critical accounting policies:
Inventory Valuation: The Company values its pork inventories at the lower of cost or USDA market prices (primal values). When the carcasses are disassembled and transferred from primal processing to various manufacturing departments, the primal values, as adjusted by the Company for product specifications and further processing, become the basis for calculating inventory values. Turkey raw materials are represented by the deboned meat quantities. The Company values
these raw materials using a concept referred to as the “meat cost pool.” The meat cost pool is determined by combining the cost to grow turkeys with processing costs, less any net sales revenue from by-products created from the processing and not used in producing Company products. The Company has developed a series of ratios using historical data and current market conditions (which themselves involve estimates and judgment determinations by the Company) to allocate the meat cost pool to each meat component. Substantially all inventoriable expenses, meat, packaging, and supplies are valued by the average cost method.
Goodwill and Other Intangibles: The Company’s identifiable intangible assets are amortized over their useful lives, unless the useful life is determined to be indefinite. The useful life of an identifiable intangible asset is based on an analysis of several factors including: contractual, regulatory, or legal obligations, demand, competition, and industry trends. Goodwill and indefinite-lived intangible assets are not amortized, but are tested at least annually for impairment.
The Company’s goodwill impairment test is performed at the reporting unit level. The Company’s reporting units represent operating segments (aggregations of business units that have similar economic characteristics and share the same production facilities, raw materials, and labor force). In conducting the goodwill impairment test, the Company first performs a qualitative assessment to determine whether it is more likely than not (> 50% likelihood) that the fair value of any reporting unit is less than its carrying amount. If the Company concludes that this is the case, then a two-step quantitative test for goodwill impairment is performed for the appropriate reporting units. Otherwise, the Company concludes that no impairment is indicated and does not perform the two-step test.
In conducting the initial qualitative assessment, the Company analyzes actual and projected growth trends for net sales, gross margin, and segment profit for each reporting unit, as well as historical performance versus plan and the results of prior quantitative tests performed. Additionally, each reporting unit assesses critical areas that may impact its business, including macroeconomic conditions and the related impact, market related exposures, any plans to market all or a portion of their business, competitive changes, new or discontinued product lines, changes in key personnel, or any other potential risks to their projected financial results. All of the assumptions used in the qualitative assessment require significant judgment.
If performed, the quantitative goodwill impairment test is a two-step process. First, the fair value of each reporting unit is compared to its corresponding carrying value, including goodwill. The fair value of each reporting unit is estimated using discounted cash flow valuations. The assumptions used in the estimate of fair value, including future growth rates, terminal values, and discount rates, require significant judgment.
The estimates and assumptions used consider historical performance and are consistent with the assumptions used in determining future profit plans for each reporting unit, which are approved by the Company’s Board of Directors. The Company reviews product growth patterns, market share information, industry trends, peer group statistics, changes in distribution channels, and economic indicators in determining the estimates and assumptions used to develop cash flow and profit plan assumptions. Additionally, the Company performs sensitivity testing of the profit plan assumptions and discount rate to assess the impact on the fair value for each reporting unit under various circumstances.
If the first step results in the carrying value exceeding the fair value of any reporting unit, then a second step must be completed in order to determine the amount of goodwill impairment that should be recorded. In the second step, the implied fair value of the reporting unit’s goodwill is determined by allocating the reporting unit’s fair value to all of its assets and liabilities other than goodwill in a manner similar to a purchase price allocation. The implied fair value of the goodwill that results from the application of this second step is then compared to the carrying amount of the goodwill and an impairment charge is recorded for the difference. Even if not required, the Company periodically elects to perform the quantitative test in order to confirm the qualitative assessment.
Based on the qualitative assessment conducted in fiscal 2013, performance of the quantitative two-step test was not required for any of the Company’s reporting units. However, the Company also elected to perform the quantitative test in fiscal 2013 to further validate the qualitative assessment. No goodwill impairment charges were recorded.
In conducting the annual impairment test for its indefinite-lived intangible assets, the Company first performs a qualitative assessment to determine whether it is more likely than not (> 50% likelihood) that an indefinite-lived intangible asset is impaired. If the Company concludes that this is the case, then a quantitative test for impairment must still be performed. Otherwise, the Company does not need to perform a quantitative test.
In conducting the initial qualitative assessment, the Company analyzes growth rates for historical net sales and the results of prior quantitative tests performed. Additionally, each reporting unit assesses critical areas that may impact their intangible assets or the applicable royalty rates to determine if there are factors that could impair the asset.
If performed, the quantitative impairment test compares the fair value and carrying value of the indefinite-lived intangible asset. The fair value of indefinite-lived intangible assets is primarily determined on the basis of estimated discounted value, using the relief from royalty method. The assumptions used in the estimate of fair value, including future sales projections
and discount rates, require significant judgment. The estimates and assumptions used consider historical performance and are consistent with the assumptions used in determining future sales projection for each reporting unit as included in their profit plans. The Company reviews various Company and industry factors when determining the assumptions to use in estimating the fair value. Additionally, the Company performs sensitivity testing of the sales assumptions and discount rate to assess the impact on the fair value for each intangible asset under various circumstances. If the carrying value exceeds fair value, the indefinite-lived intangible asset is considered impaired and an impairment charge is recorded for the difference. Even if not required, the Company periodically elects to perform the quantitative test in order to confirm the qualitative assessment.
Based on the qualitative assessment conducted in fiscal 2013, performance of the quantitative test was not required for any of the Company’s indefinite-lived intangible assets. No impairment charges were recorded for indefinite-lived intangible assets for fiscal 2013.
Accrued Promotional Expenses: Accrued promotional expenses are unpaid liabilities for customer promotional programs in process or completed as of the end of the fiscal year. Promotional contractual accruals are based on agreements with customers for defined performance. The liability relating to these agreements is based on a review of the outstanding contracts on which performance has taken place but for which the promotional payments relating to such contracts remain unpaid as of the end of the fiscal year. The level of customer performance is a significant estimate used to determine these liabilities.
Employee Benefit Plans: The Company incurs expenses relating to employee benefits, such as noncontributory defined benefit pension plans and post-retirement health care benefits. In accounting for these employment costs, management must make a variety of assumptions and estimates including mortality rates, discount rates, overall Company compensation increases, expected return on plan assets, and health care cost trend rates. The Company considers historical data as well as current facts and circumstances when determining these estimates. The Company uses third-party specialists to assist management in the determination of these estimates and the calculation of certain employee benefit expenses.
Income Taxes: The Company records income taxes in accordance with the liability method of accounting. Deferred taxes are recognized for the estimated taxes ultimately payable or recoverable based on enacted tax law. Changes in enacted tax rates are reflected in the tax provision as they occur.
The Company computes its provision for income taxes based on the statutory tax rates and tax planning opportunities available to it in the various jurisdictions in which it operates. Significant judgment is required in evaluating the Company’s tax positions and determining its annual tax provision. While the Company considers all of its tax positions fully supportable, the Company is occasionally challenged by various tax authorities regarding the amount of taxes due. The Company recognizes a tax position in its financial statements when it is more likely than not that the position will be sustained upon examination, based on the technical merits of the position. That position is then measured at the largest amount of benefit that is greater than 50 percent likely of being realized upon ultimate settlement. A change in judgment related to the expected ultimate resolution of uncertain tax positions will be recognized in earnings in the quarter of such change.
Contingent Liabilities: At any time, the Company may be subject to investigations, legal proceedings, or claims related to the on-going operation of its business, including claims both by and against the Company. Such proceedings typically involve claims related to product liability, contract disputes, wage and hour laws, employment practices, or other actions brought by employees, consumers, competitors, or suppliers. The Company routinely assesses the likelihood of any adverse outcomes related to these matters on a case by case basis, as well as the potential ranges of losses and fees. The Company establishes accruals for its potential exposure, as appropriate, for claims against the Company when losses become probable and reasonably estimable. Where the Company is able to reasonably estimate a range of potential losses, the Company records the amount within that range that constitutes the Company’s best estimate. The Company also discloses the nature of and range of loss for claims against the Company when losses are reasonably possible and material. These accruals and disclosures are determined based on the facts and circumstances related to the individual cases and require estimates and judgments regarding the interpretation of facts and laws, as well as the effectiveness of strategies or other factors beyond our control.
RESULTS OF OPERATIONS
The Company is a processor of branded and unbranded food products for retail, foodservice, and fresh product customers. The Company operates in the following five reportable segments:
Segment | | Business Conducted |
| | |
Grocery Products | | This segment consists primarily of the processing, marketing, and sale of shelf-stable food products sold predominantly in the retail market. This segment also includes the results from the Company’s MegaMex Foods, LLC (MegaMex) joint venture. |
| | |
Refrigerated Foods | | This segment includes the Hormel Refrigerated operating segment and the Affiliated Business Units. This segment consists primarily of the processing, marketing, and sale of branded and unbranded pork and beef products for retail, foodservice, and fresh product customers. The Affiliated Business Units include the Farmer John, Burke Corporation, Dan’s Prize, Saag’s Products, Inc., and Precept Foods businesses. Precept Foods, LLC is a 50.01 percent owned joint venture. |
| | |
Jennie-O Turkey Store | | This segment consists primarily of the processing, marketing, and sale of branded and unbranded turkey products for retail, foodservice, and fresh product customers. |
| | |
Specialty Foods | | This segment includes the Diamond Crystal Brands (DCB), Century Foods International (CFI), and Hormel Specialty Products (HSP) operating segments. This segment consists of the packaging and sale of private label shelf stable products, nutritional products, sugar, and condiments to industrial, retail, and foodservice customers. This segment also includes the processing, marketing, and sale of nutritional food products and supplements to hospitals, nursing homes, and other marketers of nutritional products. |
| | |
International & Other | | This segment includes the Hormel Foods International operating segment, which manufactures, markets, and sells Company products internationally. This segment also includes the results from the Company’s international joint ventures and miscellaneous corporate sales. This segment was previously the All Other segment, and was renamed in the second quarter of fiscal 2013 with no change in the composition of the segment. |
The Company’s fiscal year consisted of 52 weeks in 2013, 2012, and 2011.
FISCAL YEARS 2013 AND 2012:
Consolidated Results
Net Earnings: Net earnings attributable to the Company for the fourth quarter of fiscal 2013 were $157.3 million, an increase of 18.7 percent compared to earnings of $132.6 million for the same quarter last year. Diluted earnings per share were $0.58 compared to $0.49 for the same quarter last year. Net earnings attributable to the Company for fiscal 2013 increased 5.2 percent to $526.2 million, from $500.1 million in fiscal 2012. Diluted earnings per share for fiscal 2013 increased 4.8 percent to $1.95 compared to $1.86 per share last year.
Net Sales: Net sales for the fourth quarter of fiscal 2013 increased to $2.32 billion from $2.17 billion in 2012, an increase of 7.1 percent. Net sales for fiscal 2013 increased 6.3 percent to $8.75 billion compared to $8.23 billion in the prior year. Tonnage for the fourth quarter increased 3.0 percent to 1.30 billion lbs. compared to 1.26 billion lbs. for the same period last year. Tonnage for the fiscal year increased 2.8 percent to 4.97 billion lbs. from 4.83 billion lbs. in the prior year. Four of the Company’s five reporting segments delivered sales growth in the fourth quarter of fiscal 2013, and all five segments improved on a full year basis compared to fiscal 2012.
Net sales for fiscal 2013 were enhanced by the addition of the SKIPPY® peanut butter business acquired at the beginning of the second quarter. These sales contributed an incremental $94.8 million of net sales and 58.1 million lbs. for the fourth quarter, and $272.8 million of net sales and 163.4 million lbs. for the fiscal year. Additionally, top-line comparative results for the year were impacted by the addition of Don Miguel Foods Corp. sales (additional product lines within the MegaMex joint venture) when the Company’s retail sales force assumed responsibility for these sales beginning in the third quarter of fiscal 2012. These sales contributed an incremental $103.2 million of net sales and 47.4 million lbs. to the top-line results for the fiscal year. Higher export sales of the SPAM® family of products by the Company’s international business provided notable growth throughout fiscal 2013. Increased value-added sales within the Refrigerated Foods and Jennie-O Turkey Store segments also contributed to the top-line results for both the fourth quarter and fiscal year. The more modest tonnage increase reflects continued lower sales of commodity meat items as harvest levels were reduced to limit the Company’s exposure to unfavorable operating margins. In addition, planned reductions in the Refrigerated Foods feed sales business impacted volume comparisons.
The Company expects to continue its strong top-line momentum entering 2014. The addition of the SKIPPY® line of products represents a significant opportunity for the Company to grow its branded presence in the center of the store with a non-meat protein product and reinforces the Company’s balanced portfolio. The SKIPPY® product line will also strengthen the Company’s global presence and complement the sales strategy in China for the SPAM® family of products. Driven by a new “Make the Switch” advertising campaign, strong sales
of Jennie-O Turkey Store® lean ground turkey are expected. The Company plans to continue building the REV® brand with advertising support in 2014. In addition, the Company intends to launch the first national advertising campaign in over ten years in support of the SKIPPY® line of products in the latter half of fiscal 2014.
Gross Profit: Gross profit was $385.5 million and $1.41 billion for the 2013 fourth quarter and fiscal year, respectively, compared to $351.8 million and $1.33 billion last year. As a percentage of net sales, gross profit increased to 16.6 percent for the fourth quarter compared to 16.2 percent in fiscal 2012, but decreased to 16.1 percent for the year compared to 16.2 percent in fiscal 2012. Strong fourth quarter performances from the Refrigerated Foods, Grocery Products, and International & Other segments offset lower margins in the Jennie-O Turkey Store and Specialty Foods segments. The additional margins from SKIPPY® peanut butter sales boosted margins for both the Grocery Products and International & Other segments. Additionally, continued strong margins were experienced on export sales of the SPAM® family of products in the International & Other segment and improved results in the value-added businesses were seen in the Refrigerated Foods segment during the fourth quarter. These increases were able to overcome a sharp decline in the Specialty Foods segment due to the expiration of the agreement allowing Diamond Crystal Brands to sell certain sugar substitutes in foodservice trade channels and higher input costs for Hormel Specialty Products. For the full year, gross margins were hindered by high grain costs and weak commodity turkey prices for Jennie-O Turkey Store and poor pork processing margins for Refrigerated Foods. In addition, shipping and handling expenses for the fiscal year increased compared to fiscal 2012 in four of the Company’s five reporting segments.
Moving into fiscal 2014, the Company expects continued improved results from the Grocery Products, Refrigerated Foods, Jennie-O Turkey Store, and International & Other segments. The Specialty Foods segment will be challenged as the segment rebuilds after the expiration of a contract representing a portion of the sugar substitute business. Headwinds to the outlook for fiscal 2014 include high beef input costs and potentially volatile hog costs. However, more favorable grain and turkey commodity costs are expected as well as more normalized pork operating margins. Turkey production will be modestly increased in 2014 to support the Jennie-O Turkey Store value-added product needs. The Company will also benefit from a full year of SKIPPY® peanut butter sales aiding the Grocery Products and International & Other segments. Advertising support of the Company’s core brands should also enhance margin results in fiscal 2014.
Selling, General and Administrative: Selling, general and administrative expenses for the fourth quarter and year were $147.4 million and $627.3 million, respectively, compared to $159.7 million and $605.9 million last year. Selling, general and administrative expenses as a percentage of net sales for the fourth quarter decreased to 6.3 percent compared to the
prior year at 7.4 percent. For the fiscal year, these expenses decreased to 7.2 percent of net sales from 7.4 percent in fiscal 2012. The expense incurred in fiscal 2013 includes transition and transaction costs incurred related to the acquisition of the SKIPPY® peanut butter business compared to the prior year. A reduction in advertising expenses led to a lower expense for both the fourth quarter and year as the prior year included a significant investment in the “Make the Switch” media campaign. Lower employee benefit-related costs were also seen in the fourth quarter compared to the prior year. As a percentage of net sales, the Company expects selling, general and administrative expenses to be between 7.3 percent and 7.6 percent in fiscal 2014.
Research and development expenses were $7.2 million and $29.9 million for the fiscal 2013 fourth quarter and year, respectively, compared to $8.1 million and $29.8 million in fiscal 2012. Product innovation and further expansion of value-added product lines continue to be a priority for the Company in fiscal 2014.
Equity in Earnings of Affiliates: Equity in earnings of affiliates was $2.1 million and $20.5 million for the fiscal 2013 fourth quarter and year, respectively, compared to $10.1 million and $38.7 million last year. The decrease is a result of lower earnings from the Company’s 50 percent owned MegaMex joint venture, which experienced higher incentive expense on the Fresherized Foods acquisition, unfavorable exchange rates, and higher input costs. Overall improved results were seen in the Company’s international joint ventures for the fourth quarter, while fiscal 2013 resulted in an overall decline for those operations compared to the prior year.
The Company accounts for its majority-owned operations under the consolidation method. Investments in which the Company owns a minority interest, and for which there are no other indicators of control, are accounted for under the equity or cost method. These investments, along with receivables from other affiliates, are included in the Consolidated Statements of Financial Position as investments in and receivables from affiliates. The composition of this line item at October 27, 2013, was as follows:
(in thousands)
Country | | Investments/Receivables |
| | |
United States | | $203,413 |
Philippines | | 52,652 |
Vietnam | | 5,671 |
Mexico | | 5,724 |
Japan | | 3,149 |
Total | | $270,609 |
Income Taxes: The Company’s effective tax rate for the fiscal 2013 fourth quarter and year was 33.9 percent and 33.6 percent, respectively, compared to 33.1 percent and 33.4 percent, respectively, for the quarter and year in fiscal 2012. The Company expects the effective tax rate in fiscal 2014 to be between 34 percent and 35 percent.
Segment Results
Net sales and operating profits for each of the Company’s reportable segments are set forth below. The Company is an integrated enterprise, characterized by substantial intersegment cooperation, cost allocations, and sharing of assets. Therefore, the Company does not represent that these segments, if operated independently, would report the operating profit and other financial information shown below. (Additional segment financial information can be found in Note O “Segment Reporting.”)
| | Fourth Quarter Ended | Year Ended |
(in thousands) | | October 27,
2013 | October 28,
2012 | % Change | October 27,
2013 | October 28,
2012 | % Change |
Net Sales | | | | | | | | | | | | | |
Grocery Products | | $ 419,615 | | $ 340,222 | | 23.3 | | $1,517,557 | | $1,170,871 | | 29.6 | |
Refrigerated Foods | | 1,108,157 | | 1,063,941 | | 4.2 | | 4,251,515 | | 4,222,752 | | 0.7 | |
Jennie-O Turkey Store | | 459,670 | | 429,199 | | 7.1 | | 1,601,868 | | 1,549,227 | | 3.4 | |
Specialty Foods | | 212,485 | | 247,429 | | (14.1 | ) | 932,533 | | 924,472 | | 0.9 | |
International & Other | | 123,275 | | 89,393 | | 37.9 | | 448,181 | | 363,348 | | 23.3 | |
Total | | $2,323,202 | | $2,170,184 | | 7.1 | | $8,751,654 | | $8,230,670 | | 6.3 | |
Segment Operating Profit | | | | | | | | | | | | | |
Grocery Products | | $ 63,476 | | $ 54,248 | | 17.0 | | $ 213,646 | | $ 181,251 | | 17.9 | |
Refrigerated Foods | | 79,453 | | 61,150 | | 29.9 | | 232,692 | | 228,665 | | 1.8 | |
Jennie-O Turkey Store | | 65,550 | | 52,232 | | 25.5 | | 222,117 | | 238,298 | | (6.8 | ) |
Specialty Foods | | 15,975 | | 24,093 | | (33.7 | ) | 88,873 | | 83,089 | | 7.0 | |
International & Other | | 22,069 | | 12,126 | | 82.0 | | 71,490 | | 49,889 | | 43.3 | |
Total segment operating profit | | 246,523 | | 203,849 | | 20.9 | | 828,818 | | 781,192 | | 6.1 | |
Net interest and investment expense (income) | | 595 | | 1,407 | | (57.7 | ) | 7,482 | | 6,339 | | 18.0 | |
General corporate expense | | 7,466 | | 3,389 | | 120.3 | | 26,694 | | 21,429 | | 24.6 | |
Noncontrolling interest | | 1,145 | | 1,685 | | (32.0 | ) | 3,865 | | 4,911 | | (21.3 | ) |
Earnings before income taxes | | $ 239,607 | | $ 200,738 | | 19.4 | | $ 798,507 | | $ 758,335 | | 5.3 | |
Grocery Products: Grocery Products net sales increased 23.3 percent for the fiscal 2013 fourth quarter and 29.6 percent for the year compared to fiscal 2012. Tonnage increased 24.4 percent for the quarter and 29.1 percent for the year compared to prior year results. The comparative results reflect the addition of the newly acquired SKIPPY® peanut butter business beginning in the second quarter of fiscal 2013 and Don Miguel Foods Corp. sales (additional product lines within the MegaMex joint venture) beginning in the third quarter of fiscal 2012 when the Company’s retail sales force assumed responsibility for these sales. The addition of the SKIPPY® peanut butter business contributed an incremental $75.6 million of net sales and 48.1 million lbs. to the top-line results for the fourth quarter. On a combined basis, these businesses contributed an incremental $322.0 million of net sales and 182.8 million lbs. to the top-line results for fiscal 2013.
Improved sales in both the fourth quarter and fiscal year were recorded for Hormel® bacon toppings and the Herdez® and Don Miguel® products within the Company’s MegaMex Foods joint venture which offset declines in categories such as Hormel® chili and Hormel® chunk meats. Sales of the Hormel® Compleats® line of microwave meals were also strong, enhanced by the introduction of new breakfast meal items towards the end of the third quarter.
Segment profit for Grocery Products increased 17.0 percent for the fourth quarter and 17.9 percent for the year compared to fiscal 2012. Along with the positive performance from the
SKIPPY® peanut butter products, profit results for the fourth quarter and year benefitted from improved margin performance in Hormel® Compleats® microwave meals and Hormel® bacon toppings. Higher pork and beef input costs squeezed margins of Hormel® chili and the SPAM® family of products. Lower equity in earnings results from the MegaMex joint venture in also impacted profits due to higher incentive expense on the Fresherized Food acquisition, unfavorable exchange rates, and higher input costs.
Looking ahead, the Company expects continued sales growth in fiscal 2014 for Grocery Products. The segment will benefit from a full year of SKIPPY® peanut butter sales, and the Company intends to launch the first national advertising campaign in over ten years in support of the SKIPPY® line of products in the latter half of fiscal 2014 to further enhance sales. Continued volatile protein markets remain a concern for this segment entering 2014, and the need for pricing actions will be assessed to protect margin contributions as the year progresses.
Refrigerated Foods: Net sales for the Refrigerated Foods segment increased 4.2 percent for the fiscal 2013 fourth quarter and increased 0.7 percent for the year compared to fiscal 2012. Tonnage decreased 4.8 percent for the fourth quarter and decreased 3.7 percent for the fiscal year compared to prior year results, as planned reductions in this segment’s feed sales business beginning late in the first quarter of fiscal
2013 impacted volume comparisons. Lower sales of commodity fresh pork items contributed to top-line declines in the first half of fiscal 2013, as a reduction in harvest levels was taken to limit the Company’s exposure to unfavorable pork operating margins. However, top-line results strengthened during the second half of the year and solid net sales gains across several key value-added product lines were able to offset the decline in fresh pork sales for the fourth quarter.
Several value-added product lines within Refrigerated Foods experienced notable growth during fiscal 2013. The Meat Products business unit had a solid performance throughout fiscal 2013 for Hormel® pepperoni, Hormel® Natural Choice® deli meats, and Lloyd’s® ribs in the retail channel. The new Hormel® REV® wraps enjoyed broad consumer acceptance, driven in part by a national advertising campaign which began in late July. Within the Foodservice business unit, sales gains for fiscal 2013 were generated by several value-added products, led by sales of Hormel® Natural Choice® deli meats and Hormel® Fire BraisedTM meats.
Segment profit for Refrigerated Foods increased 29.9 percent in the fourth quarter and 1.8 percent for the year, compared to fiscal 2012. Pork operating margins in the fourth quarter improved compared to last year’s challenging operating environment, offsetting unseasonably high hog costs. Additionally, retail bacon pricing actions taken during the third quarter drove improved margins toward the end of fiscal 2013.
Entering fiscal 2014, the Company expects more normalized pork operating margins and continued growth in the Refrigerated Foods value-added product lines. However, hog costs may potentially be volatile later in the year due to concerns in the marketplace about the Porcine Epidemic Diarrhea Virus (PEDV) affecting industry supply. The Company intends to maintain hog harvest levels flat with fiscal 2013 levels, but will monitor the impact of hog prices as the year progresses. Ongoing new product activity, including reformulation and packaging updates of the Hormel® Country Crock® side dishes and continued distribution of Hormel® REV® wraps should enhance sales for this segment entering the new fiscal year.
Jennie-O Turkey Store: Jennie-O Turkey Store (JOTS) net sales for the fiscal 2013 fourth quarter and year increased 7.1 percent and 3.4 percent, respectively, compared to fiscal 2012. Tonnage increased 7.8 percent for the fourth quarter and 1.3 percent for the year, compared to prior year results. JOTS value-added products continued to deliver sales gains throughout the fourth quarter and fiscal year. Retail sales of Jennie-O Turkey Store® fresh turkey chubs, turkey breakfast sausage, and turkey bacon were robust, while Jennie-O Turkey Store® fresh turkey tray pack sales were down during the fourth quarter. Total harvest volume increased during the fourth quarter compared to fiscal 2012, after intentional reductions were taken earlier in the year to reduce the segment’s exposure to weak commodity meat pricing.
Segment profit for JOTS increased 25.5 percent for the fourth quarter and decreased 6.8 percent for the year, compared to fiscal 2012. Significantly higher grain costs and lower commodity turkey meat prices during the first half of the year resulted in lower earnings for fiscal 2013, partially offset by operational efficiencies and continued momentum from value-added business. Fourth quarter results were also driven by continued growth in value-added sales, along with performance gains and expense reductions in operations, live production and supply chain, which were able to offset the impact of market conditions as the fiscal year ended. Reductions in advertising expense also provided lower expenses for this segment for both the fourth quarter and fiscal year.
Entering fiscal 2014, the value-added businesses for JOTS will look to expand across several categories with fresh tray pack items, fresh turkey chubs, and turkey bacon leading the increase. A renewed focus on the JOTS “Make the Switch” advertising campaign featuring lean ground turkey is also expected to enhance sales in fiscal 2014. Lower feed costs, more favorable commodity markets, and increased value-added sales will benefit JOTS in 2014. A modest increase in turkey production is planned in 2014 to support JOTS value-added product needs.
Specialty Foods: Specialty Foods net sales decreased 14.1 percent for the fiscal 2013 fourth quarter and increased 0.9 percent for the year compared to fiscal 2012. Tonnage decreased 8.3 percent for the quarter and 2.0 percent for the year, compared to prior year results. Sales declines at DCB drove the top-line decreases for both the quarter and fiscal year, due to the expiration of the agreement allowing DCB to sell certain sugar substitutes in foodservice trade channels. Softer sugar and liquid portion sales also contributed to the year-over-year decline. CFI experienced sales declines in the fourth quarter in the nutritional category, which was partially offset by higher ready-to-drink sales. For the fiscal year, ready-to-drink and nutritional sales drove the year-over-year sales increase. HSP posted sales gains in canned meats in the fourth quarter and fiscal year.
Specialty Foods segment profit decreased 33.7 percent for the fourth quarter and increased 7.0 percent for the year compared to fiscal 2012. Declines in the fourth quarter were driven by the expiration of the sugar substitute agreement noted above. High protein raw material costs negatively impacted results in the fourth quarter and fiscal year. The favorable results for the fiscal year were driven by efforts to diversify the customer base and a favorable product mix for CFI, improved margins in Hormel Health Labs, and stronger ingredient sales for HSP.
Looking forward to fiscal 2014, the Specialty Foods segment will likely register sales and profit declines as it experiences continued higher raw material costs and refocuses following the expiration of its sugar substitute contract.
International & Other: International & Other net sales increased 37.9 percent for the fiscal 2013 fourth quarter and 23.3 percent for the year compared to fiscal 2012. Strong export sales of the SPAM® family of products and improved performance by the Company’s China operations were the principal drivers of the top-line results for both the fourth quarter and fiscal year. The addition of worldwide SKIPPY® product sales (excluding Mainland China) also enhanced top- line results, contributing $17.5 million of net sales and 9.3 million lbs. in the fourth quarter and $51.0 million of net sales and 26.4 million lbs. for fiscal 2013.
International & Other segment profit increased 82.0 percent and 43.3 percent for the fiscal 2013 fourth quarter and year, respectively, compared to fiscal 2012. Segment profit gains for the fourth quarter and fiscal year were largely driven by robust margins on exports of the SPAM® family of products and fresh pork items. Improved overall results for the Company’s international joint ventures also provided a benefit for fiscal 2013.
After achieving another record segment profit year in fiscal 2013, the Company’s international business is entering 2014 with good momentum. The Company expects strong export sales of the SPAM® family of products and fresh pork to continue in fiscal 2014, coupled with positive results from the Company’s China operations and the addition of a full year of SKIPPY® product sales. Subsequent to the end of the fiscal year, the Company completed the acquisition of the China based SKIPPY® peanut butter business which will further enhance the Company’s presence in China and results for this segment.
Unallocated Income and Expenses: The Company does not allocate investment income, interest expense, and interest income to its segments when measuring performance. The Company also retains various other income and unallocated expenses at corporate. Equity in earnings of affiliates is included in segment operating profit; however, earnings attributable to the Company’s noncontrolling interests are excluded. These items are included in the segment table for the purpose of reconciling segment results to earnings before income taxes.
Net interest and investment expense (income) for the fourth quarter and fiscal year was a net expense of $0.6 million and $7.5 million, respectively, compared to a net expense of $1.4 million and $6.3 million for the comparable periods of fiscal 2012. The decreased expense for the fourth quarter is primarily due to better returns on the Company’s rabbi trust. For the year, increased net expense primarily reflects lower interest income, as the acquisition of the United States based SKIPPY® peanut butter business decreased invested funds in the current year. Interest expense was $12.5 million for fiscal 2013, decreasing slightly from $12.9 million in fiscal 2012. The Company expects interest expense to be approximately $12.0 to $14.0 million for fiscal 2014.
General corporate expense for the fourth quarter and year was $7.5 million and $26.7 million, respectively, compared to $3.4 million and $21.4 million for the comparable periods of the prior year. An increase in the Company’s lower of cost or market inventory reserve caused a notable expense increase for the fourth quarter and fiscal year compared to fiscal 2012. The higher expense for both the fourth quarter and fiscal year also reflects an increase in employee-related expenses compared to the prior year.
Net earnings attributable to the Company’s noncontrolling interests were $1.1 million and $3.9 million for the 2013 fourth quarter and fiscal year, respectively, compared to $1.7 million and $4.9 million for the comparable periods of fiscal 2012. The Company’s Precept Foods business generated lower results for both the fourth quarter and full year compared to fiscal 2012. However, these declines were partially offset by continued improvement from the Company’s China operations, which were up for both the fourth quarter and fiscal year compared to prior year results.
FISCAL YEARS 2012 AND 2011:
Consolidated Results
Net Earnings: Net earnings attributable to the Company for the fourth quarter of fiscal 2012 were $132.6 million, an increase of 13.0 percent compared to earnings of $117.3 million for the same quarter in fiscal 2011. Diluted earnings per share were $0.49 compared to $0.43 for the same quarter in fiscal 2011. Net earnings attributable to the Company for fiscal 2012 increased 5.5 percent to $500.1 million, from $474.2 million in fiscal 2011. Diluted earnings per share for fiscal 2012 increased 6.9 percent to $1.86 compared to $1.74 per share in fiscal 2011.
Net Sales: Net sales for the fourth quarter of fiscal 2012 increased to $2.17 billion from $2.10 billion in 2011, an increase of 3.2 percent. Net sales for fiscal 2012 increased 4.3 percent to $8.23 billion compared to $7.90 billion in fiscal 2011. Tonnage for the fourth quarter increased 1.6 percent to 1.26 billion lbs. compared to 1.24 billion lbs. for the same period in fiscal 2011. Tonnage for fiscal year 2012 increased 0.2 percent to 4.83 billion lbs. from 4.82 billion lbs. in fiscal 2011. Four of the Company’s five reporting segments delivered sales growth in the fourth quarter of fiscal 2012, and all five segments improved on a full year basis compared to fiscal 2011. Increased value-added sales across all segments of the Company drove the top-line results for both the fourth quarter and fiscal year in 2012. The more modest tonnage increase reflected a decline in commodity meat sales for both the Refrigerated Foods and Jennie-O Turkey Store segments in fiscal 2012 compared to fiscal 2011.
The record sales results for fiscal year 2012 reflected ongoing support of the Company’s key Hormel® and Jennie-O Turkey Store® brands through effective media campaigns. The Company also benefitted from a new advertising campaign celebrating the 75th anniversary of the iconic SPAM® brand featuring the Sir-Can-A-LotTM character. Top-line results for Grocery Products were further enhanced by the inclusion of sales of Don Miguel Foods Corp. products (additional product lines within the MegaMex joint venture), as the Company’s retail sales force assumed responsibility for these sales beginning in the third quarter of fiscal 2012. These sales contributed $95.9 million to the top line results for fiscal 2012. In addition, the Company achieved its remarkable goal of generating more than $2 billion in sales from new products that did not exist 12 years ago.
Gross Profit: Gross profit was $351.8 million and $1.33 billion for the 2012 fourth quarter and fiscal year, respectively, compared to $336.0 million and $1.33 billion in fiscal 2011. As a percentage of net sales, gross profit increased to 16.2 percent for the fourth quarter of fiscal 2012 compared to 16.0 percent in the fourth quarter of fiscal 2011, but decreased to 16.2 percent for fiscal year 2012 compared to 16.9 percent in fiscal 2011. Shipping and handling expenses increased compared to fiscal 2011 across all segments of the Company. Additionally, the spread between hog costs and primal values remained well below prior year levels throughout fiscal 2012, resulting in substantial declines in pork operating margins compared to fiscal 2011. Losses in the Company’s live hog operations and the negative impact of grain based procurement contracts also decreased margins for Refrigerated Foods. Although value-added sales growth for that segment was strong for fiscal 2012, it was unable to fully offset the losses in operations. Jennie-O Turkey Store generated strong margins for fiscal year 2012, as value-added sales growth and ongoing operational efficiencies were able to overcome the impact of significantly higher feed costs. Lower raw material costs and an improved product mix also enhanced margins for the Company’s international business.
Selling, General and Administrative: Selling, general and administrative expenses for the 2012 fourth quarter and fiscal year were $159.7 million and $605.9 million, respectively, compared to $156.7 million and $618.6 million in fiscal 2011. Selling, general and administrative expenses as a percentage of net sales for the fourth quarter remained flat compared to the fourth quarter of fiscal year 2011 at 7.4 percent. For fiscal year 2012, these expenses decreased to 7.4 percent of net sales from 7.8 percent in fiscal 2011. The lower expense incurred in fiscal 2012 was primarily due to a reduction in advertising. In fiscal 2011, the Company invested significantly in “Make the Switch” media campaigns for Jennie-O Turkey Store® products. In fiscal 2012, the Company was able to build upon this successful media campaign by introducing new turkey bacon and breakfast sausage products, but overall spending did not reach fiscal year 2011 levels. Pension and
insurance related expenses also decreased during fiscal 2012, but were partially offset by increases in brokerage and professional service expenses compared to fiscal 2011.
Research and development expenses were $8.1 million and $29.8 million for the fiscal 2012 fourth quarter and year, respectively, compared to $8.2 million and $29.4 million in fiscal 2011.
Equity in Earnings of Affiliates: Equity in earnings of affiliates was $10.1 million and $38.7 million for the fiscal 2012 fourth quarter and year, respectively, compared to $7.6 million and $26.8 million in fiscal 2011. Strong results from the Company’s 50 percent owned MegaMex joint venture were the primary driver of the increase for both the fourth quarter and year compared to fiscal 2011. Results were mixed for the Company’s international joint ventures, resulting in an overall decline for those operations for fiscal 2012 compared to fiscal 2011.
The Company accounts for its majority-owned operations under the consolidation method. Investments in which the Company owns a minority interest, and for which there are no other indicators of control, are accounted for under the equity or cost method. These investments, along with receivables from other affiliates, are included in the Consolidated Statements of Financial Position as investments in and receivables from affiliates. The composition of this line item at October 28, 2012, was as follows:
(in thousands) Country | | Investments/Receivables |
United States | | $205,315 |
Philippines | | 60,728 |
Vietnam | | 11,470 |
Mexico | | 5,518 |
Japan | | 3,506 |
Total | | $286,537 |
Income Taxes: The Company’s effective tax rate for the fiscal 2012 fourth quarter and year was 33.1 percent and 33.4 percent, respectively, compared to 34.3 percent and 33.3 percent, respectively, for the quarter and year in fiscal 2011.
Segment Results
Net sales and operating profits for each of the Company’s reportable segments are set forth below. The Company is an integrated enterprise, characterized by substantial intersegment cooperation, cost allocations, and sharing of assets. Therefore, the Company does not represent that these segments, if operated independently, would report the operating profit and other financial information shown below. (Additional segment financial information can be found in Note O “Segment Reporting.”)
| | Fourth Quarter Ended | Year Ended |
(in thousands) | | | October 28,
2012 | | | October 30,
2011 | | | % Change | | | October 28,
2012 | | | October 30,
2011 | | | % Change | |
Net Sales | | | | | | | | | | | | | | | | | | | |
Grocery Products | | | $ 340,222 | | | $ 282,018 | | | 20.6 | | | $1,170,871 | | | $ 1,064,558 | | | 10.0 | |
Refrigerated Foods | | | 1,063,941 | | | 1,092,024 | | | (2.6 | ) | | 4,222,752 | | | 4,189,224 | | | 0.8 | |
Jennie-O Turkey Store | | | 429,199 | | | 408,943 | | | 5.0 | | | 1,549,227 | | | 1,467,222 | | | 5.6 | |
Specialty Foods | | | 247,429 | | | 232,213 | | | 6.6 | | | 924,472 | | | 835,584 | | | 10.6 | |
International & Other | | | 89,393 | | | 88,700 | | | 0.8 | | | 363,348 | | | 338,501 | | | 7.3 | |
Total | | | $2,170,184 | | | $2,103,898 | | | 3.2 | | | $8,230,670 | | | $ 7,895,089 | | | 4.3 | |
Segment Operating Profit | | | | | | | | | | | | | | | | | | | |
Grocery Products | | | $ 54,248 | | | $ 44,518 | | | 21.9 | | | $ 181,251 | | | $ 162,556 | | | 11.5 | |
Refrigerated Foods | | | 61,150 | | | 69,420 | | | (11.9 | ) | | 228,665 | | | 292,624 | | | (21.9 | ) |
Jennie-O Turkey Store | | | 52,232 | | | 49,561 | | | 5.4 | | | 238,298 | | | 204,940 | | | 16.3 | |
Specialty Foods | | | 24,093 | | | 22,322 | | | 7.9 | | | 83,089 | | | 76,905 | | | 8.0 | |
International & Other | | | 12,126 | | | 9,770 | | | 24.1 | | | 49,889 | | | 36,250 | | | 37.6 | |
Total segment operating profit | | | 203,849 | | | 195,591 | | | 4.2 | | | 781,192 | | | 773,275 | | | 1.0 | |
Net interest and investment expense (income) | | | 1,407 | | | 6,611 | | | (78.7 | ) | | 6,339 | | | 23,448 | | | (73.0 | ) |
General corporate expense | | | 3,389 | | | 9,827 | | | (65.5 | ) | | 21,429 | | | 35,992 | | | (40.5 | ) |
Noncontrolling interest | | | 1,685 | | | 1,186 | | | 42.1 | | | 4,911 | | | 5,001 | | | (1.8 | ) |
Earnings before income taxes | | | $ 200,738 | | | $ 180,339 | | | 11.3 | | | $ 758,335 | | | $ 718,836 | | | 5.5 | |
Grocery Products: Grocery Products net sales increased 20.6 percent for the fiscal 2012 fourth quarter and 10.0 percent for the year compared to fiscal 2011. Tonnage increased 17.3 percent for the quarter and 5.8 percent for fiscal year 2012 compared to fiscal 2011 results. The comparative results reflected the addition of Don Miguel Foods Corp. sales (additional product lines within the MegaMex joint venture) as the Company’s retail sales force assumed responsibility for these sales beginning in the third quarter of fiscal 2012. These sales contributed an incremental $95.9 million of net sales and 46.0 million lbs. to the top-line results for fiscal 2012.
Following declines in the first half of fiscal 2012, sales and tonnage results for Grocery Products strengthened during the latter half of the year due to increased sales of core product lines. Strong sales of the SPAM® family of products were propelled by an advertising campaign featuring the Sir-Can-A-LotTM character and publicity around the 75th anniversary. Sales of Mexican food products with the Company’s MegaMex joint venture were also robust throughout fiscal 2012. Improved results for other key items in the fourth quarter, including Hormel® bacon toppings and Hormel® chili, offset declines in categories such as Hormel® chunk meats and Dinty Moore® canned products. Sales of the Hormel® Compleats® line of microwave meals were also softer during the fourth quarter of fiscal 2012 due to a shift in promotional timing.
Segment profit for Grocery Products increased 21.9 percent for the fiscal year 2012 fourth quarter and 11.5 percent for the year compared to fiscal 2011. Profit results for both the 2012 fourth quarter and fiscal year benefitted from the volume increases in core products noted above, such as the SPAM® family of products and Hormel® chili. Lower pork and beef input costs in the latter half of fiscal year 2012 also improved profit
results for this segment. Increased equity in earnings results from the MegaMex joint venture also contributed to higher profitability throughout fiscal 2012 compared to fiscal 2011.
Refrigerated Foods: Net sales for the Refrigerated Foods segment decreased 2.6 percent for the fiscal 2012 fourth quarter and increased 0.8 percent for the year compared to fiscal 2011. Tonnage remained flat for the fourth quarter and decreased 0.8 percent for fiscal year 2012 compared to fiscal 2011 results. The top-line softness reflected reduced sales of commodity fresh pork items resulting from reduced harvest levels and lower commodity markets, primarily in the latter half of fiscal year 2012. However, gains were reported across several key value-added product categories during fiscal 2012, partially offsetting the decline in fresh pork sales.
As noted, value-added product lines within Refrigerated Foods did experience notable growth during fiscal 2012. The Meat Products business unit had a solid performance throughout fiscal 2012 for Hormel® Natural Choice® deli meats, Hormel® party trays, and Hormel® pepperoni. Sales of Hormel® Cure 81® premium hams, Hormel® refrigerated entrees, and convenience bacon were also strong during the fourth quarter of fiscal 2012. Within the Foodservice business unit, sales gains for fiscal 2012 were reported in several core categories, with particularly strong growth in Hormel® Natural Choice® deli meats and Hormel® premium bacon. Sales of Hormel® Always Tender® prepared pork were also up nicely for the fiscal 2012 fourth quarter compared to fiscal 2011.
Segment profit for Refrigerated Foods decreased 11.9 percent in the fiscal 2012 fourth quarter and 21.9 percent for the year compared to fiscal 2011. Strong results in the segment’s value-added businesses were not able to fully offset significantly lower pork operating margins, as the spread between hog costs
and primal values remained below prior year levels for much of fiscal 2012. Losses in the Company’s live hog operations due to elevated grain costs also negatively impacted results.
Jennie-O Turkey Store: Jennie-O Turkey Store (JOTS) net sales for the fiscal 2012 fourth quarter and year increased 5.0 percent and 5.6 percent, respectively, compared to fiscal 2011. Tonnage decreased 1.9 percent for the fourth quarter and 2.2 percent for the year, compared to fiscal 2011 results. The top-line growth was driven by continued strength in sales of value-added products and an improved product mix. Value-added net sales experienced double-digit growth for both the 2012 fourth quarter and fiscal year, led by sales of Jennie-O Turkey Store® fresh tray pack items and turkey burgers. This growth more than offset lower commodity meat sales resulting from reduced volumes and pricing compared to fiscal 2011. The tonnage decline in the fiscal 2012 fourth quarter also reflected a shift in the timing of shipments, as a portion of the holiday whole bird sales shipped later in the year and are reflected in fiscal 2013 results.
This segment continued to benefit from its “Make the Switch” marketing campaign, with new commercials in the fourth quarter of fiscal 2012 focusing on turkey bacon and breakfast sausage products. This campaign positively impacted results during the fiscal 2012 fourth quarter.
Segment profit for JOTS increased 5.4 percent for the fiscal 2012 fourth quarter and 16.3 percent for the year compared to fiscal 2011. Increased value-added business, ongoing operational efficiencies, and lower advertising expenses were key drivers of the improved profitability. Whole bird pricing was also much improved compared to fiscal 2011. These factors were able to mitigate the higher, volatile grain markets that were experienced throughout fiscal 2012, which caused feed costs to be significantly higher than fiscal 2011. Commodity meat pricing also averaged well below prior year levels, which further constricted profit results for this segment in fiscal 2012.
Specialty Foods: Specialty Foods net sales increased 6.6 percent for the fiscal 2012 fourth quarter and 10.6 percent for the year compared to fiscal 2011. Tonnage decreased 2.3 percent for the quarter and increased 1.1 percent for the year, compared to fiscal 2011 results. Sales growth at CFI drove the top-line increases for both the quarter and fiscal year in 2012, led by strong sales of nutritional products, ready-to-drink items, and store brands. Sales gains for HSP were also noted on private label canned meats and savory items, aided by pricing actions. Although DCB continued to report increased sales of blended products, overall declines in sugar substitutes and other core products were experienced throughout fiscal 2012.
Specialty Foods segment profit increased 7.9 percent for the fiscal 2012 fourth quarter and 8.0 percent for the year compared to fiscal 2011. The results were driven by a strong
fourth quarter for HSP, reflecting the benefit of lower raw material costs for hash, luncheon meat, and chili items. Prior pricing actions in response to higher raw material costs for other key product categories also strengthened margins in the back half of fiscal year 2012. Overall improvements in both product mix and the customer base contributed to the profitability for this segment for both the fiscal 2012 fourth quarter and year compared to fiscal 2011.
International & Other: International & Other net sales increased 0.8 percent for the fiscal 2012 fourth quarter and 7.3 percent for the year compared to fiscal 2011. Strong export sales of fresh pork and the SPAM® family of products drove top-line results for fiscal year 2012, although moderating in the fourth quarter.
International & Other segment profit increased 24.1 percent and 37.6 percent for the fiscal 2012 fourth quarter and year, respectively, compared to fiscal 2011. Segment profit was driven by strong export volumes throughout the year, as well as prior pricing actions and the benefit of lower raw material costs. Results for the Company’s China operations also continued to improve throughout the year due to lower raw material costs and an improved product mix, which were able to offset an overall decline for the Company’s international joint venture operations for fiscal 2012.
Unallocated Income and Expenses: The Company does not allocate investment income, interest expense, and interest income to its segments when measuring performance. The Company also retains various other income and unallocated expenses at corporate. Equity in earnings of affiliates is included in segment operating profit; however, earnings attributable to the Company’s noncontrolling interests are excluded. These items are included in the segment table for the purpose of reconciling segment results to earnings before income taxes.
Net interest and investment expense (income) for the 2012 fourth quarter and fiscal year was a net expense of $1.4 million and $6.3 million, respectively, compared to a net expense of $6.6 million and $23.4 million for the comparable periods of fiscal 2011. Interest expense was $12.9 million for fiscal 2012, decreasing from $22.7 million in fiscal 2011, due to a lower overall long-term debt balance and a lower interest rate. The only debt balance outstanding at the end of fiscal 2012 related to the Company’s $250.0 million senior notes which mature in 2021.
General corporate expense for the 2012 fourth quarter and fiscal year was $3.4 million and $21.4 million, respectively, compared to $9.8 million and $36.0 million for the comparable periods of fiscal 2011. The lower expense for both the fourth quarter and fiscal year in 2012 reflected a decline in pension, insurance, and compensation related expenses
compared to fiscal 2011. A reduction in the lower of cost or market inventory reserve also caused a notable expense decrease in the fiscal 2012 fourth quarter compared to fiscal 2011.
Net earnings attributable to the Company’s noncontrolling interests were $1.7 million and $4.9 million for the 2012 fourth quarter and fiscal year, respectively, compared to $1.2 million and $5.0 million for the comparable periods of fiscal 2011. The Company’s Precept Foods business generated a gain for the fiscal 2012 fourth quarter, but experienced a modest decline for the full year compared to fiscal 2011. The Company’s China operations also continued to improve, up slightly for both the fourth quarter and fiscal year in 2012 compared to fiscal 2011 results.
RELATED PARTY TRANSACTIONS
The Company was not party to any material related party transactions during fiscal years 2013 and 2012.
LIQUIDITY AND CAPITAL RESOURCES
Cash and cash equivalents were $434.0 million at the end of fiscal year 2013 compared to $682.4 million at the end of fiscal year 2012 and $463.1 million at the end of fiscal year 2011.
During fiscal 2013, cash provided by operating activities was $637.8 million compared to $517.8 million in 2012 and $490.5 million in 2011. Increased earnings and improved working capital balances largely generated the increase in 2013.
Cash used in investing activities increased to $691.1 million in fiscal year 2013 from $106.8 million in fiscal year 2012 and $171.0 million in fiscal year 2011. In anticipation of the second quarter acquisition of the United States based SKIPPY® peanut butter business from Unilever United States Inc., the Company liquidated its marketable securities portfolio at the end of the first quarter of fiscal year 2013, which generated $77.6 million in cash. The Company then completed that acquisition on January 31, 2013 for a purchase price of $665.4 million in cash, plus related expenses. These items were partially offset by lower expenditures on fixed assets in fiscal 2013 of $106.8 million, decreasing from $132.3 million in 2012 and up from $96.9 million in 2011. The cash used in fiscal 2011 included an additional investment of $61.0 million into MegaMex to facilitate the joint venture’s acquisition of Fresherized Foods, and also a new investment of $20.0 million in marketable securities that did not reoccur in fiscal 2012. Capital expenditures for fiscal 2014 are estimated to be approximately $140.0 million.
Cash used in financing activities was $195.5 million in fiscal 2013 compared to $192.7 million in fiscal 2012 and $325.5 million in fiscal 2011. In 2011, the Company repaid $350.0 million of its 6.625% senior unsecured notes that matured and issued $250.0 million of new 4.125% notes due in 2021, resulting in a non-recurring net outflow. Partially offsetting this item was a reduction in proceeds generated from the Company’s stock option plan exercises, which decreased from 2011 primarily due to that years’ vesting of options under the Universal Stock Option award granted to all employees in 2007.
The Company used $70.8 million for common stock repurchases during fiscal 2013, compared to $61.4 million in fiscal 2012 and $152.9 million in fiscal 2011. During fiscal 2013, the Company repurchased 1.7 million shares of its common stock at an average price per share of $40.58. On January 31, 2013, the Company announced that its Board of Directors had authorized the repurchase of 10,000,000 shares of its common stock with no expiration date. The Company’s prior share repurchase program authorized in fiscal 2010 was fully utilized prior to commencing purchases under this new authorization. At of the end of fiscal 2013, there were 9.4 million shares remaining for repurchase under the current authorization in place.
Cash dividends paid to the Company’s shareholders also continue to be an ongoing financing activity for the Company, with $174.3 million in dividends paid in fiscal 2013, compared to $152.2 million in the fiscal 2012 and $130.0 million in fiscal 2011. The dividend rate was $0.68 per share in 2013, which reflected a 13.3 percent increase over the fiscal 2012 rate. The Company has paid dividends for 341 consecutive quarters and expects to continue doing so in the future. The annual dividend rate for fiscal 2014 was increased 17.6 percent to $0.80 per share, representing the 48th consecutive annual dividend increase.
Cash flows from operating activities continue to provide the Company with its principal source of liquidity. The Company does not anticipate a significant risk to cash flows from this source in the foreseeable future because the Company operates in a relatively stable industry and has strong brands across many product lines.
Maximizing the value returned to shareholders through dividend payments remains a priority for use of the Company’s strong cash position going forward. The Company remains well positioned to take advantage of strategic acquisition opportunities and continues to evaluate options in that area. Capital spending to enhance and expand current operations and share repurchases are expected to continue in 2014.
Contractual Obligations and Commercial Commitments
The following table outlines the Company’s future contractual financial obligations as of October 27, 2013 (for additional information regarding these obligations, see Note H “Long-term Debt and Other Borrowing Arrangements” and Note K “Commitments and Contingencies”):
| | | Payments Due by Periods | |
Contractual Obligations (in thousands) | | | Total | | | Less Than
1 Year | | | 1-3 Years | | | 3-5 Years | | | More Than
5 Years | |
Purchase obligations: | | | | | | | | | | | | | | | | |
Hog and turkey commitments (1) | | | $5,203,588 | | | $1,340,587 | | | $1,576,798 | | | $1,141,840 | | | $1,144,363 | |
Grain commitments (1) | | | 71,765 | | | 71,519 | | | 246 | | | – | | | – | |
Turkey grow-out contracts (2) | | | 61,819 | | | 8,708 | | | 12,327 | | | 11,309 | | | 29,475 | |
Other (3) | | | 217,839 | | | 175,099 | | | 28,341 | | | 3,230 | | | 11,169 | |
Acquisitions (4) | | | 41,800 | | | 41,800 | | | – | | | – | | | – | |
Long-term debt | | | 250,000 | | | – | | | – | | | – | | | 250,000 | |
Interest payments on long-term debt | | | 77,344 | | | 10,313 | | | 20,625 | | | 20,625 | | | 25,781 | |
Capital expenditures (5) | | | 104,686 | | | 104,686 | | | – | | | – | | | – | |
Leases | | | 13,780 | | | 5,872 | | | 4,228 | | | 1,703 | | | 1,977 | |
Other long-term liabilities (6) (7) | | | 60,860 | | | 4,741 | | | 9,240 | | | 7,788 | | | 39,091 | |
Total Contractual Cash Obligations | | | $6,103,481 | | | $1,763,325 | | | $1,651,805 | | | $1,186,495 | | | $1,501,856 | |
(1) In the normal course of business, the Company commits to purchase fixed quantities of livestock and grain from producers to ensure a steady supply of production inputs. Certain of these contracts are based on market prices at the time of delivery, for which the Company has estimated the purchase commitment using current market prices as of October 27, 2013. The Company also utilizes various hedging programs to manage the price risk associated with these commitments. As of October 27, 2013, these hedging programs result in a net decrease of $6.1 million in future cash payments associated with the purchase commitments, which is not reflected in the table above.
(2) The Company also utilizes grow-out contracts with independent farmers to raise turkeys for the Company. Under these contracts, the turkeys, feed, and other supplies are owned by the Company. The farmers provide the required labor and facilities, and receive a fee per pound when the turkeys are delivered. Some of the facilities are sub-leased by the Company to the independent farmers. As of October 27, 2013, the Company had approximately 100 active contracts ranging from two to twenty-five years in duration. The grow-out activity is assumed to continue through the term of these active contracts, and amounts in the table represent the Company’s obligation based on turkeys expected to be delivered from these farmers.
(3) Amounts presented for other purchase obligations represent all known open purchase orders and all known contracts exceeding $1.0 million, related to the procurement of materials, supplies, and various services. The Company primarily purchases goods and services on an as-needed basis. Therefore, the amounts in the table represent only a portion of expected future cash expenditures.
(4) As of October 27, 2013, the Company was committed to close the acquisition of the China based SKIPPY® peanut butter business. On November 26, 2013, this acquisition closed for $41.4 million, subject to working capital and tax adjustments to be made later in the first quarter of fiscal 2014.
(5) Amounts presented for capital expenditures represent only the Company’s current commitments to complete construction in progress at various locations. The Company estimates total capital expenditures for fiscal year 2014 to approximate $140 million.
(6) Other long-term liabilities represent payments under the Company’s deferred compensation plans. Excluded from the table above are payments under the Company’s defined benefit pension and other post-retirement benefit plans. (See estimated benefit payments for the next ten fiscal years in Note I “Pension and Other Post-retirement Benefits.”)
(7) As discussed in Note J “Income Taxes,” the total liability for unrecognized tax benefits, including interest and penalties, at October 27, 2013, was $23.1 million, which is not included in the table above as the ultimate amount or timing of settlement of the Company’s reserves for income taxes cannot be reasonably estimated.
In addition to the commitments set forth in the above table, at October 27, 2013, the Company had $42.6 million in standby letters of credit issued on behalf of the Company. The standby letters of credit are primarily related to the Company’s self-insured workers’ compensation programs.
The Company believes its financial resources, including a revolving credit facility for $300.0 million and anticipated funds from operations, will be adequate to meet all current commitments.
Off-Balance Sheet Arrangements
As of October 27, 2013, the Company had $42.6 million of standby letters of credit issued on its behalf. The standby letters of credit are primarily related to the Company’s self-insured workers’ compensation programs. However, that amount also includes a revocable $4.9 million standby letter
of credit for obligations of an affiliated party that may arise under workers’ compensation claims. Letters of credit are not reflected in the Company’s Consolidated Statements of Financial Position.
FORWARD-LOOKING STATEMENTS
This report contains “forward-looking” information within the meaning of the federal securities laws. The “forward-looking” information may include statements concerning the Company’s outlook for the future as well as other statements of beliefs, future plans, strategies, or anticipated events and similar expressions concerning matters that are not historical facts.
The Private Securities Litigation Reform Act of 1995 (the Reform Act) provides a “safe harbor” for forward-looking statements to encourage companies to provide prospective information. The Company is filing this cautionary statement in connection with the Reform Act. When used in the Company’s Annual Report to Stockholders, other filings by the Company with the Securities and Exchange Commission (the Commission), the Company’s press releases, and oral statements made by the Company’s representatives, the words or phrases “should result,” “believe,” “intend,” “plan,” “are expected to,” “targeted,” “will continue,” “will approximate,” “is anticipated,” “estimate,” “project,” or similar expressions are intended to identify forward-looking statements within the meaning of the Reform Act. Such statements are subject to certain risks and uncertainties that could cause actual results to differ materially from historical earnings and those anticipated or projected.
In connection with the “safe harbor” provisions of the Reform Act, the Company is identifying risk factors that could affect financial performance and cause the Company’s actual results to differ materially from opinions or statements expressed with respect to future periods. The following discussion of risk factors contains certain cautionary statements regarding the Company’s business, which should be considered by investors and others. Such risk factors should be considered in conjunction with any discussions of operations or results by the Company or its representatives, including any forward-looking discussion, as well as comments contained in press releases, presentations to securities analysts or investors, or other communications by the Company.
In making these statements, the Company is not undertaking, and specifically declines to undertake, any obligation to address or update each or any factor in future filings or communications regarding the Company’s business or results, and is not undertaking to address how any of these factors may have caused changes to discussions or information contained in previous filings or communications. Though the Company has attempted to list comprehensively these important cautionary risk factors, the Company wishes to caution investors and others that other factors may in the future prove to be important in affecting the Company’s business or results of operations.
The Company cautions readers not to place undue reliance on forward-looking statements, which represent current views as of the date made. Forward-looking statements are inherently at risk to any changes in the national and worldwide economic environment, which could include, among other things, economic conditions, political developments, currency exchange rates, interest and inflation rates, accounting standards, taxes, and laws and regulations affecting the Company and its markets.
Risk Factors
The Company’s operations are subject to the general risks of the food industry. The food products manufacturing industry is subject to the risks posed by:
· food spoilage;
· food contamination caused by disease-producing organisms or pathogens, such as Listeria monocytogenes, Salmonella, and pathogenic E coli.;
· food allergens;
· nutritional and health-related concerns;
· federal, state, and local food processing controls;
· disruption to operations if government inspectors are unavailable due to furloughs;
· consumer product liability claims;
· product tampering; and
· the possible unavailability and/or expense of liability insurance.
The pathogens which may cause food contamination are found generally in livestock and in the environment and thus may be present in our products as a result of food processing. These pathogens also can be introduced to our products as a result of improper handling by customers or consumers. We do not have control over handling procedures once our products have been shipped for distribution. If one or more of these risks were to materialize, the Company’s brand and business reputation could be negatively impacted. In addition, revenues could decrease, costs of doing business could increase, and the Company’s operating results could be adversely affected.
Deterioration of economic conditions could harm the Company’s business. The Company’s business may be adversely affected by changes in national or global economic conditions, including inflation, interest rates, availability of capital markets, energy availability and costs (including fuel surcharges), and the effects of governmental initiatives to manage economic conditions. Decreases in consumer spending rates and shifts in consumer product preferences could also negatively impact the Company.
volatility in financial markets and the deterioration of national and global economic conditions could impact the Company’s operations as follows:
· The financial stability of our customers and suppliers may be compromised, which could result in additional bad debts for the Company or non-performance by suppliers; and
· The value of our investments in debt and equity securities may decline, including most significantly the Company’s trading securities held as part of a rabbi trust to fund supplemental executive retirement plans and deferred income plans, and the Company’s assets held in pension plans.
The Company also utilizes hedging programs to manage its exposure to various commodity market risks, which qualify for hedge accounting for financial reporting purposes. volatile fluctuations in market conditions could cause these
instruments to become ineffective, which could require any gains or losses associated with these instruments to be reported in the Company’s earnings each period. These instruments may also limit the Company’s ability to benefit from market gains if commodity prices become more favorable than those that have been secured under the Company’s hedging programs.
Additionally, if a high pathogenic disease outbreak developed in the United States, it may negatively impact the national economy, demand for Company products, and/or the Company’s workforce availability, and the Company’s financial results could suffer. The Company has developed contingency plans to address infectious disease scenarios and the potential impact on its operations, and will continue to update these plans as necessary. There can be no assurance given, however, that these plans will be effective in eliminating the negative effects of any such diseases on the Company’s operating results.
Fluctuations in commodity prices of pork, poultry, feed ingredients, avocados, and peanuts could harm the Company’s earnings. The Company’s results of operations and financial condition are largely dependent upon the cost and supply of pork, poultry, feed grains, avocados, and peanuts as well as the selling prices for many of our products, which are determined by constantly changing market forces of supply and demand.
The live hog industry has evolved to very large, vertically integrated operations operating under long-term supply agreements. This has resulted in fewer hogs being available on the cash spot market. Additionally, overall hog production in the U.S. has declined. The decrease in the supply of hogs could diminish the utilization of harvest and production facilities and increase the cost of the raw materials they produce. Consequently, the Company uses long-term supply contracts based on market-based formulas or the cost of production to ensure a stable supply of raw materials while minimizing extreme fluctuations in costs over the long term. This may result, in the short term, in costs for live hogs that are higher than the cash spot market depending on the relationship of the cash spot market to contract prices. Market-based pricing on certain product lines, and lead time required to implement pricing adjustments, may prevent all or part of these cost increases from being recovered, and these higher costs could adversely affect our short-term financial results.
Jennie-O Turkey Store raises turkeys and also contracts with turkey growers to meet its raw material requirements for whole birds and processed turkey products. Additionally, the Company owns various hog raising facilities that supplement its supply of raw materials. Results in these operations are affected by the cost and supply of feed grains, which fluctuate due to climate conditions, production forecasts, and supply and demand conditions at local, regional, national, and worldwide levels. The Company attempts to manage some of its short-term exposure to fluctuations in feed prices by
forward buying, using futures contracts, and pursuing pricing advances. However, these strategies may not be adequate to overcome sustained increases in market prices due to alternate uses for feed grains or other changes in these market conditions.
International trade barriers and other restrictions could result in less foreign demand and increased domestic supply of proteins which could lower prices.
Outbreaks of disease among livestock and poultry flocks could harm the Company’s revenues and operating margins. The Company is subject to risks associated with the outbreak of disease in pork and beef livestock, and poultry flocks, including Bovine Spongiform Encephalopathy (BSE), pneumo-virus, Porcine Circovirus 2 (PCV2), Porcine Reproduction & Respiratory Syndrome (PRRS), Foot-and-Mouth Disease (FMD), Porcine Epidemic Diarrhea virus (PEDV), and Avian Influenza. The outbreak of disease could adversely affect the Company’s supply of raw materials, increase the cost of production, and reduce operating margins. Additionally, the outbreak of disease may hinder the Company’s ability to market and sell products both domestically and internationally. The Company has developed business continuity plans for various disease scenarios and will continue to update these plans as necessary. There can be no assurance given, however, that these plans will be effective in eliminating the negative effects of any such diseases on the Company’s operating results.
Market demand for the Company’s products may fluctuate. The Company faces competition from producers of alternative meats and protein sources, including pork, beef, turkey, chicken, fish, and peanut butter. The bases on which the Company competes include:
· price;
· product quality and attributes;
· brand identification;
· breadth of product line; and
· customer service.
Demand for the Company’s products is also affected by competitors’ promotional spending, the effectiveness of the Company’s advertising and marketing programs, and consumer perceptions. The Company may be unable to compete successfully on any or all of these bases in the future.
The Company’s operations are subject to the general risks associated with acquisitions. The Company has made several acquisitions in recent years, most recently the acquisition of the SKIPPY® peanut butter business, and regularly reviews opportunities for strategic growth through acquisitions. Potential risks associated with acquisitions include the inability to integrate new operations successfully, the diversion of management’s attention from other business concerns, the potential loss of key employees and customers of the acquired companies, the possible assumption of unknown liabilities, potential disputes with the sellers, potential impairment charges if purchase assumptions are not achieved or market
conditions decline, and the inherent risks in entering markets or lines of business in which the Company has limited or no prior experience. Any or all of these risks could impact the Company’s financial results and business reputation. In addition, acquisitions outside the United States may present unique challenges and increase the Company’s exposure to the risks associated with foreign operations.
The Company’s operations are subject to the general risks of litigation. The Company is involved on an ongoing basis in litigation arising in the ordinary course of business. Trends in litigation may include class actions involving employees, consumers, competitors, suppliers, shareholders, or injured persons, and claims relating to product liability, contract disputes, intellectual property, advertising, labeling, wage and hour laws, employment practices, or environmental matters. Litigation trends and the outcome of litigation cannot be predicted with certainty and adverse litigation trends and outcomes could adversely affect the Company’s financial results.
The Company is subject to the loss of a material contract. The Company is a party to several supply, distribution, contract packaging, and other material contracts. The loss of a material contract could adversely affect the Company’s financial results. In fiscal 2013, the Company agreed to end its hog supply contract with AgFeed USA, LLC. The Company is confident there will be an adequate hog supply to replace the quantity represented by this contract and expects there will be no effect on operations.
Government regulation, present and future, exposes the Company to potential sanctions and compliance costs that could adversely affect the Company’s business. The Company’s operations are subject to extensive regulation by the U.S. Department of Homeland Security, the U.S. Department of Agriculture, the U.S. Food and Drug Administration, federal and state taxing authorities, and other state and local authorities that oversee workforce immigration laws, tax regulations, animal welfare, food safety standards, and the processing, packaging, storage, distribution, advertising, and labeling of the Company’s products. The Company’s manufacturing facilities and products are subject to constant inspection by federal, state, and local authorities. Claims or enforcement proceedings could be brought against the Company in the future. The availability of government inspectors due to a government furlough could also cause disruption to the Company’s manufacturing facilities. Additionally, the Company is subject to new or modified laws, regulations, and accounting standards. The Company’s failure or inability to comply with such requirements could subject the Company to civil remedies, including fines, injunctions, recalls, or seizures, as well as potential criminal sanctions.
The Company is subject to stringent environmental regulation and potentially subject to environmental litigation, proceedings, and investigations. The Company’s past and present business operations and ownership and operation of real property are subject to stringent federal, state, and
local environmental laws and regulations pertaining to the discharge of materials into the environment, and the handling and disposition of wastes (including solid and hazardous wastes) or otherwise relating to protection of the environment. Compliance with these laws and regulations, and the ability to comply with any modifications to these laws and regulations, is material to the Company’s business. New matters or sites may be identified in the future that will require additional investigation, assessment, or expenditures. In addition, some of the Company’s facilities have been in operation for many years and, over time, the Company and other prior operators of these facilities may have generated and disposed of wastes that now may be considered hazardous. Future discovery of contamination of property underlying or in the vicinity of the Company’s present or former properties or manufacturing facilities and/or waste disposal sites could require the Company to incur additional expenses. The occurrence of any of these events, the implementation of new laws and regulations, or stricter interpretation of existing laws or regulations, could adversely affect the Company’s financial results.
The Company’s foreign operations pose additional risks to the Company’s business. The Company operates its business and markets its products internationally. The Company’s foreign operations are subject to the risks described above, as well as risks related to fluctuations in currency values, foreign currency exchange controls, compliance with foreign laws, compliance with applicable U.S. laws, including the Foreign Corrupt Practices Act, and other economic or political uncertainties. International sales are subject to risks related to general economic conditions, imposition of tariffs, quotas, trade barriers and other restrictions, enforcement of remedies in foreign jurisdictions and compliance with applicable foreign laws, and other economic and political uncertainties. All of these risks could result in increased costs or decreased revenues, which could adversely affect the Company’s financial results.
Deterioration of labor relations or increases in labor costs could harm the Company’s business. As of October 27, 2013, the Company had approximately 19,800 employees worldwide, of which approximately 5,600 were represented by labor unions, principally the United Food and Commercial Workers’ Union. A significant increase in labor costs or a deterioration of labor relations at any of the Company’s facilities or contracted hog processing facilities that results in work slowdowns or stoppages could harm the Company’s financial results. Union contracts at the Company’s facilities in Rochelle, Illinois and San Leandro, California will expire during fiscal 2014, covering a combined total of approximately 635 employees. Negotiations at these two facilities have not yet been initiated.
QUANTITATIVE AND QUALITATIVE
DISCLOSURE ABOUT MARKET RISKS
Hog Markets: The Company’s earnings are affected by fluctuations in the live hog market. To minimize the impact on earnings, and to ensure a steady supply of quality hogs, the Company has entered into contracts with producers for the purchase of hogs at formula-based prices over periods of up to 10 years. Purchased hogs under contract accounted for 98 percent and 97 percent of the total hogs purchased by the Company in fiscal years 2013 and 2012, respectively. The majority of these contracts use market-based formulas based on hog futures, hog primal values, or industry reported hog markets. Other contracts use a formula based on the cost of production, which can fluctuate independently from hog markets. Under normal, long-term market conditions, changes in the cash hog market are offset by proportional changes in primal values. Therefore, a hypothetical 10 percent change in the cash hog market would have had an immaterial effect on the Company’s results of operations.
Certain procurement contracts allow for future hog deliveries (firm commitments) to be forward priced. The Company generally hedges these firm commitments by using hog futures contracts. These futures contracts are designated and accounted for as fair value hedges. The change in the market value of such futures contracts is highly effective at offsetting changes in price movements of the hedged item, and the Company evaluates the effectiveness of the contracts on a regular basis. Changes in the fair value of the futures contracts, along with the gain or loss on the firm commitment, are marked-to-market through earnings and are recorded on the Consolidated Statements of Financial Position as a current asset and liability, respectively. The fair value of the Company’s open futures contracts as of October 27, 2013, was $(10.9) million compared to $(2.3) million as of October 28, 2012.
The Company measures its market risk exposure on its hog futures contracts using a sensitivity analysis, which considers a hypothetical 10 percent change in market prices. A 10 percent increase in market prices would have negatively impacted the fair value of the Company’s October 27, 2013 open contracts by $13.4 million, which in turn would lower the Company’s future cost of purchased hogs by a similar amount.
Turkey and Hog Production Costs: The Company raises or contracts for live turkeys and hogs to meet some of its raw material supply requirements. Production costs in raising turkeys and hogs are subject primarily to fluctuations in feed prices, and to a lesser extent, fuel costs. Under normal, long-term market conditions, changes in the cost to produce turkeys and hogs are offset by proportional changes in their respective markets.
To reduce the Company’s exposure to changes in grain prices, the Company utilizes a hedge program to offset the fluctuation in the Company’s future direct grain purchases. This program currently utilizes corn futures for JOTS, and these contracts are accounted for under cash flow hedge
accounting. The open contracts are reported at their fair value with an unrealized loss of ($6.3) million, before tax, on the Consolidated Statements of Financial Position as of October 27, 2013, compared to an unrealized gain of $9.5 million, before tax, as of October 28, 2012.
The Company measures its market risk exposure on its grain futures contracts using a sensitivity analysis, which considers a hypothetical 10 percent change in the market prices for grain. A 10 percent decrease in the market price for grain would have negatively impacted the fair value of the Company’s October 27, 2013, open grain contracts by $6.8 million, which in turn would lower the Company’s future cost on purchased grain by a similar amount.
Long-Term Debt: A principal market risk affecting the Company is the exposure to changes in interest rates on the Company’s fixed-rate, long-term debt. Market risk for fixed- rate, long-term debt is estimated as the potential increase in fair value, resulting from a hypothetical 10 percent decrease in interest rates, and amounts to approximately $5.8 million. The fair value of the Company’s long-term debt was estimated using discounted future cash flows based on the Company’s incremental borrowing rates for similar types of borrowing arrangements.
Investments: The Company holds trading securities as part of a rabbi trust to fund certain supplemental executive retirement plans and deferred income plans. As of October 27, 2013, the balance of these securities totaled $114.3 million. A majority of these securities represent fixed income funds. The Company is subject to market risk due to fluctuations in the value of the remaining investments, as unrealized gains and losses associated with these securities are included in the Company’s net earnings on a mark-to-market basis. A 10 percent decline in the value of the investments not held in fixed income funds would have a direct negative impact to the Company’s pretax earnings of approximately $3.8 million, while a 10 percent increase in value would have a positive impact of the same amount.
International: The fair values of certain Company assets are subject to fluctuations in foreign currencies. The Company’s net asset position in foreign currencies as of October 27, 2013, was $216.6 million, compared to $146.4 million as of October 28, 2012, with most of the exposure existing in Chinese yuan and Philippine pesos. Changes in currency exchange rates impact the fair values of Company assets either currently through the Consolidated Statements of Operations as currency gains/losses, or by affecting other comprehensive loss.
The Company measures its foreign currency exchange risk by using a 10 percent sensitivity analysis on the Company’s primary foreign net asset position, the Chinese yuan, as of October 27, 2013. A 10 percent strengthening in the value of the yuan relative to the U.S. dollar would result in other comprehensive income of $9.3 million pretax. A 10 percent weakening in the value of the yuan relative to the U.S. dollar would result in other comprehensive loss of the same amount.
Management’s Responsibility for Financial Statements
The accompanying financial statements were prepared by the management of Hormel Foods Corporation which is responsible for their integrity and objectivity. These statements have been prepared in accordance with U.S. generally accepted accounting principles appropriate in the circumstances and, as such, include amounts that are based on our best estimates and judgments.
Hormel Foods Corporation has developed a system of internal controls designed to assure that the records reflect the transactions of the Company and that the established policies and procedures are adhered to. This system is augmented by well-communicated written policies and procedures, a strong program of internal audit, and well-qualified personnel.
These financial statements have been audited by Ernst & Young LLP, an independent registered public accounting firm, and their report is included herein. The audit was conducted in accordance with the standards of the Public Company Accounting Oversight Board (United States) and includes a review of the Company’s accounting and financial controls and tests of transactions.
The Audit Committee of the Board of Directors, composed solely of outside directors, meets periodically with the independent auditors, management, and the internal auditors to assure that each is carrying out its responsibilities. Both Ernst & Young LLP and our internal auditors have full and free access to the Audit Committee, with or without the presence of management, to discuss the results of their audit work and their opinions on the adequacy of internal controls and the quality of financial reporting.
Management’s Report on Internal Control Over Financial Reporting
Management of Hormel Foods Corporation is responsible for establishing and maintaining adequate internal control over financial reporting for the Company, as such term is defined in Exchange Act Rule 13a–15(f). The Company’s internal control system is designed to provide reasonable assurance regarding the reliability of financial reporting and the preparation of financial statements for external purposes in accordance with generally accepted accounting standards. Under the supervision, and with the participation of management, including the Chief Executive Officer and Chief Financial Officer, we conducted an evaluation of the effectiveness of our internal control over financial reporting based on the framework in Internal Control – Integrated Framework issued by the Committee of Sponsoring Organizations of the Treadway Commission (1992 framework).
Based on our evaluation under the framework in Internal Control – Integrated Framework, we concluded that our internal control over financial reporting was effective as of October 27, 2013. Our internal control over financial reporting as of October 27, 2013, has been audited by Ernst & Young LLP, an independent registered public accounting firm, as stated in their report which is included herein.

| | 
|
Jeffrey M. Ettinger | | Jody H. Feragen |
Chairman of the Board, | | Executive Vice President, |
President, Chief Executive | | Chief Financial Officer, |
Officer, and Director | | and Director |
Report of Independent Registered Public Accounting Firm
The Board of Directors and Shareholders Hormel Foods Corporation
We have audited Hormel Foods Corporation’s internal control over financial reporting as of October 27, 2013, based on criteria established in Internal Control—Integrated Framework issued by the Committee of Sponsoring Organizations of the Treadway Commission (1992 framework) (the COSO criteria). Hormel Foods Corporation’s management is responsible for maintaining effective internal control over financial reporting, and for its assessment of the effectiveness of internal control over financial reporting included in the accompanying Report of Management entitled Management’s Report on Internal Control Over Financial Reporting. Our responsibility is to express an opinion on the company’s internal control over financial reporting based on our audit.
We conducted our audit in accordance with the standards of the Public Company Accounting Oversight Board (United States). Those standards require that we plan and perform the audit to obtain reasonable assurance about whether effective internal control over financial reporting was maintained in all material respects. Our audit included obtaining an understanding of internal control over financial reporting, assessing the risk that a material weakness exists, testing and evaluating the design and operating effectiveness of internal control based on the assessed risk, and performing such other procedures as we considered necessary in the circumstances. We believe that our audit provides a reasonable basis for our opinion.
A company’s internal control over financial reporting is a process designed to provide reasonable assurance regarding the reliability of financial reporting and the preparation of financial statements for external purposes in accordance with generally accepted accounting principles. A company’s internal control over financial reporting includes those policies and procedures that (1) pertain to the maintenance of records that, in reasonable detail, accurately and fairly reflect the transactions and dispositions of the assets of the company; (2) provide reasonable assurance that transactions are recorded as necessary to permit preparation of financial statements in accordance with generally accepted accounting principles, and that receipts and expenditures of the company are being made only in accordance with authorizations of management and directors of the company; and (3) provide reasonable assurance regarding prevention or timely detection of unauthorized acquisition, use, or disposition of the company’s assets that could have a material effect on the financial statements.
Because of its inherent limitations, internal control over financial reporting may not prevent or detect misstatements. Also, projections of any evaluation of effectiveness to future periods are subject to the risk that controls may become inadequate because of changes in conditions, or that the degree of compliance with the policies or procedures may deteriorate.
In our opinion, Hormel Foods Corporation maintained, in all material respects, effective internal control over financial reporting as of December 18, 2013, based on the COSO criteria.
We also have audited, in accordance with the standards of the Public Company Accounting Oversight Board (United States), the consolidated statements of financial position of Hormel Foods Corporation as of October 27, 2013 and October 28, 2012, and the related consolidated statements of operations, comprehensive income, changes in shareholders’ investment, and cash flows for each of the three years in the period ended October 27, 2013, and our report dated December 18, 2013, expressed an unqualified opinion thereon.

Minneapolis, MN
December 18, 2013
Report of Independent Registered Public Accounting Firm
The Board of Directors and Shareholders Hormel Foods Corporation
We have audited the accompanying consolidated statements of financial position of Hormel Foods Corporation as of October 27, 2013 and October 28, 2012, and the related consolidated statements of operations, comprehensive income, changes in shareholders’ investment, and cash flows for each of the three years in the period ended October 27, 2013. These financial statements are the responsibility of the Company’s management. Our responsibility is to express an opinion on these financial statements based on our audits.
We conducted our audits in accordance with the standards of the Public Company Accounting Oversight Board (United States). Those standards require that we plan and perform the audit to obtain reasonable assurance about whether the financial statements are free of material misstatement. An audit includes examining, on a test basis, evidence supporting the amounts and disclosures in the financial statements. An audit also includes assessing the accounting principles used and significant estimates made by management, as well as evaluating the overall financial statement presentation. We believe that our audits provide a reasonable basis for our opinion.
In our opinion, the financial statements referred to above present fairly, in all material respects, the consolidated financial position of Hormel Foods Corporation at October 27, 2013 and October 28, 2012, and the consolidated results of its operations and its cash flows for each of the three years in the period ended October 27, 2013, in conformity with U.S. generally accepted accounting principles.
We also have audited, in accordance with the standards of the Public Company Accounting Oversight Board (United States), Hormel Foods Corporation’s internal control over financial reporting as of October 27, 2013, based on criteria established in Internal Control-Integrated Framework issued by the Committee of Sponsoring Organizations of the Treadway Commission (1992 framework) and our report dated December 18, 2013 expressed an unqualified opinion thereon.

Minneapolis, MN
December 18, 2013
Consolidated Statements of Financial Position
(in thousands, except share and per share amounts) | | October 27,
2013 | October 28,
2012 |
Assets | | | | | |
Current Assets | | | | | |
Cash and cash equivalents | | $ | 434,014 | | $ | 682,388 | |
Short-term marketable securities | | – | | 77,387 | |
Accounts receivable (net of allowance for doubtful accounts of $4,000 at October 27, 2013 and $4,000 at October 28, 2012) | | 551,500 | | 507,041 | |
Inventories | | 967,977 | | 950,521 | |
Income taxes receivable | | – | | 16,460 | |
Deferred income taxes | | 73,543 | | 68,560 | |
Prepaid expenses | | 13,000 | | 12,772 | |
Other current assets | | 7,379 | | 5,555 | |
Total Current Assets | | 2,047,413 | | 2,320,684 | |
| | | | | |
Deferred Income Taxes | | 25,086 | | 144,245 | |
Goodwill | | 934,472 | | 630,875 | |
Other Intangibles | | 378,093 | | 123,072 | |
Pension Assets | | 162,535 | | 49 | |
Investments in and Receivables from Affiliates | | 270,609 | | 286,537 | |
Other Assets | | 142,339 | | 134,024 | |
Property, Plant and Equipment | | | | | |
Land | | 58,506 | | 56,258 | |
Buildings | | 784,133 | | 767,876 | |
Equipment | | 1,532,527 | | 1,435,630 | |
Construction in progress | | 85,696 | | 82,254 | |
| | 2,460,862 | | 2,342,018 | |
Less allowance for depreciation | | (1,505,529 | ) | (1,417,538 | ) |
| | 955,333 | | 924,480 | |
Total Assets | | $ | 4,915,880 | | $ | 4,563,966 | |
Liabilities and Shareholders’ Investment | | | | | |
Current Liabilities | | | | | |
Accounts payable | | $ | 387,284 | | $ | 385,877 | |
Accrued expenses | | 20,965 | | 49,792 | |
Accrued workers compensation | | 38,217 | | 33,543 | |
Accrued marketing expenses | | 91,332 | | 78,712 | |
Employee related expenses | | 192,063 | | 193,463 | |
Taxes payable | | 8,637 | | 4,864 | |
Interest and dividends payable | | 45,511 | | 40,049 | |
Total Current Liabilities | | 784,009 | | 786,300 | |
| | | | | |
Long-Term Debt — less current maturities | | 250,000 | | 250,000 | |
Pension and Post-Retirement Benefits | | 481,230 | | 615,428 | |
Other Long-Term Liabilities | | 84,062 | | 87,313 | |
| | | | | |
Shareholders’ Investment | | | | | |
Preferred stock, par value $.01 a share — authorized 160,000,000 shares; issued — none | | | | | |
Common stock, nonvoting, par value $.01 a share — authorized 400,000,000 shares; issued — none | | | | | |
Common stock, par value $.0293 a share — authorized 800,000,000 shares;
issued 263,658,296 shares October 27, 2013
issued 263,044,280 shares October 28, 2012 | | 7,725 | | 7,707 | |
Accumulated other comprehensive loss | | (149,214 | ) | (323,569 | ) |
Retained earnings | | 3,452,529 | | 3,135,317 | |
Hormel Foods Corporation Shareholders’ Investment | | 3,311,040 | | 2,819,455 | |
Noncontrolling Interest | | 5,539 | | 5,470 | |
Total Shareholders’ Investment | | 3,316,579 | | 2,824,925 | |
Total Liabilities and Shareholders’ Investment | | $ | 4,915,880 | | $ | 4,563,966 | |
See Notes to Consolidated Financial Statements.
34
Consolidated Statements of Operations
| | Fiscal Year Ended | |
(in thousands, except per share amounts) | | October 27,
2013 | October 28,
2012 | October 30,
2011 |
Net sales | | $8,751,654 | | $8,230,670 | | $7,895,089 | |
Cost of products sold | | 7,338,838 | | 6,898,819 | | 6,560,976 | |
Gross Profit | | 1,412,816 | | 1,331,851 | | 1,334,113 | |
Selling, general and administrative | | 627,340 | | 605,868 | | 618,586 | |
Equity in earnings of affiliates | | 20,513 | | 38,691 | | 26,757 | |
Operating Income | | 805,989 | | 764,674 | | 742,284 | |
Other income and expense: | | | | | | | |
Interest and investment income (loss) | | 4,971 | | 6,520 | | (786 | ) |
Interest expense | | (12,453 | ) | (12,859 | ) | (22,662 | ) |
Earnings Before Income Taxes | | 798,507 | | 758,335 | | 718,836 | |
Provision for income taxes | | 268,431 | | 253,374 | | 239,640 | |
Net Earnings | | 530,076 | | 504,961 | | 479,196 | |
Less: Net earnings attributable to noncontrolling interest | | 3,865 | | 4,911 | | 5,001 | |
Net Earnings Attributable to Hormel Foods Corporation | | $ 526,211 | | $ 500,050 | | $ 474,195 | |
Net Earnings Per Share: | | | | | | | |
Basic | | $ 1.99 | | $ 1.90 | | $ 1.78 | |
Diluted | | $ 1.95 | | $ 1.86 | | $ 1.74 | |
Weighted-Average Shares Outstanding: | | | | | | | |
Basic | | 264,317 | | 263,466 | | 266,394 | |
Diluted | | 270,224 | | 268,891 | | 271,915 | |
See Notes to Consolidated Financial Statements.
Consolidated Statements of Comprehensive Income
| | Fiscal Year Ended | |
(in thousands) | | October 27,
2013 | October 28,
2012 | October 30,
2011 |
Net earnings | | $530,076 | | $504,961 | | $479,196 | |
Other comprehensive income (loss), net of tax: | | | | | | | |
Foreign currency translation | | (2,820 | ) | 2,774 | | 1,094 | |
Pension and other benefits | | 192,464 | | (143,282 | ) | 3,060 | |
Deferred hedging | | (15,085 | ) | (7,527 | ) | (3,476 | ) |
Total other comprehensive income (loss) | | 174,559 | | (148,035 | ) | 678 | |
Comprehensive income | | 704,635 | | 356,926 | | 479,874 | |
Less: Comprehensive income attributable to noncontrolling interest | | 4,069 | | 4,962 | | 5,252 | |
Comprehensive income attributable to Hormel Foods Corporation | | $700,566 | | $351,964 | | $474,622 | |
See Notes to Consolidated Financial Statements.
35
Consolidated Statements of Changes in Shareholders’ Investment
| | Hormel Foods Corporation Shareholders | | | | | |
| | | | | | | | | | | | | | Accumulated | | | | | |
| | | | | | | | | | Additional | | | Other | | Non- | | Total | |
(in thousands, | | Common Stock | | Treasury Stock | | Paid-In | Retained | | Comprehensive | | controlling | | Shareholders’ | |
except per share amounts) | | Shares | | Amount | | Shares | | Amount | | Capital | Earnings | | Income (Loss) | | Interest | | Investment | |
Balance at October 31, 2010 | | 265,963 | | $ | 7,793 | | – | | $ | – | | $ | – | | $ | 2,568,774 | | $ | (175,910 | ) | $ | 5,982 | | $ | 2,406,639 | |
| | | | | | | | | | | | | | | | | | | |
Net earnings | | | | | | | | | | | | 474,195 | | | | 5,001 | | 479,196 | |
Other comprehensive income | | | | | | | | | | | | | | 427 | | 251 | | 678 | |
Purchases of common stock | | | | | | (5,497 | ) | (152,930 | ) | | | | | | | | | (152,930 | ) |
Stock-based compensation expense | | | | | | | | | | 17,229 | | | | | | | | 17,229 | |
Exercise of stock options/ nonvested shares | | 3,503 | | 102 | | (6 | ) | (163 | ) | 53,100 | | | | | | | | 53,039 | |
Shares retired | | (5,503 | ) | (161 | ) | 5,503 | | 153,093 | | (70,329 | ) | (82,603 | ) | | | | | – | |
Distribution to noncontrolling interest | | | | | | | | | | | | | | | | (8,000 | ) | (8,000 | ) |
Declared cash dividends — $.51 per share | | | | | | | | | | | | (136,035 | ) | | | | | (136,035 | ) |
Balance at October 30, 2011 | | 263,963 | | $ | 7,734 | | – | | $ | – | | $ | – | | $ | 2,824,331 | | $ | (175,483 | ) | $ | 3,234 | | $ | 2,659,816 | |
| | | | | | | | | | | | | | | | | | | |
Net earnings | | | | | | | | | | | | 500,050 | | | | 4,911 | | 504,961 | |
Other comprehensive (loss) income | | | | | | | | | | | | | | (148,086 | ) | 51 | | (148,035 | ) |
Purchases of common stock | | | | | | (2,142 | ) | (61,366 | ) | | | | | | | | | (61,366 | ) |
Stock-based compensation expense | | | | | | | | | | 16,710 | | | | | | | | 16,710 | |
Exercise of stock options/ nonvested shares | | 1,233 | | 36 | | (10 | ) | (295 | ) | 13,576 | | | | | | | | 13,317 | |
Shares retired | | (2,152 | ) | (63 | ) | 2,152 | | 61,661 | | (30,286 | ) | (31,312 | ) | | | | | – | |
Proceeds from noncontrolling interest | | | | | | | | | | | | | | | | 774 | | 774 | |
Distribution to noncontrolling interest | | | | | | | | | | | | | | | | (3,500 | ) | (3,500 | ) |
Declared cash dividends — $.60 per share | | | | | | | | | | | | (157,752 | ) | | | | | (157,752 | ) |
Balance at October 28, 2012 | | 263,044 | | $ | 7,707 | | – | | $ | – | | $ | – | | $ | 3,135,317 | | $ | (323,569 | ) | $ | 5,470 | | $ | 2,824,925 | |
Net earnings | | | | | | | | | | | | 526,211 | | | | 3,865 | | 530,076 | |
Other comprehensive (loss) income | | | | | | | | | | | | | | 174,355 | | 204 | | 174,559 | |
Purchases of common stock | | | | | | (1,745 | ) | (70,819 | ) | | | | | | | | | (70,819 | ) |
Stock-based compensation expense | | | | | | | | | | 17,596 | | | | | | | | 17,596 | |
Exercise of stock options/ nonvested shares | | 2,359 | | 69 | | | | | | 23,955 | | | | | | | | 24,024 | |
Shares retired | | (1,745 | ) | (51 | ) | 1,745 | | 70,819 | | (41,551 | ) | (29,217 | ) | | | | | – | |
Proceeds from noncontrolling interest | | | | | | | | | | | | | | | | – | | – | |
Distribution to noncontrolling interest | | | | | | | | | | | | | | | | (4,000 | ) | (4,000 | ) |
Declared cash dividends — $.68 per share | | | | | | | | | | | | (179,782 | ) | | | | | (179,782 | ) |
Balance at October 27, 2013 | | 263,658 | | $ | 7,725 | | – | | $ | – | | $ | – | | $ | 3,452,529 | | $ | (149,214 | ) | $ | 5,539 | | $ | 3,316,579 | |
See Notes to Consolidated Financial Statements.
36
Consolidated Statements of Cash Flows
| | | Fiscal Year Ended | |
(in thousands) | | | October 27,
2013 | | | October 28,
2012 | | | October 30,
2011 | |
Operating Activities | | | | | | | | | | |
Net earnings | | | $ 530,076 | | | | $ 504,961 | | | | $ 479,196 | |
Adjustments to reconcile to net cash provided by operating activities: | | | | | | | | | | | | |
Depreciation | | | 115,371 | | | | 110,519 | | | | 114,689 | |
Amortization of intangibles | | | 9,479 | | | | 8,975 | | | | 9,476 | |
Equity in earnings of affiliates, net of dividends | | | 13,507 | | | | (1,583 | ) | | | (22,726 | ) |
Provision for deferred income taxes | | | 1,067 | | | | 4,668 | | | | 6,752 | |
Gain on property/equipment sales and plant facilities | | | (2,127 | ) | | | (170 | ) | | | (632 | ) |
Non-cash investment activities | | | (2,705 | ) | | | (3,514 | ) | | | 3,995 | |
Stock-based compensation expense | | | 17,596 | | | | 16,710 | | | | 17,229 | |
Excess tax benefit from stock-based compensation | | | (23,406 | ) | | | (8,847 | ) | | | (15,205 | ) |
Other | | | 963 | | | | – | | | | 486 | |
Changes in operating assets and liabilities, net of acquisitions: | | | | | | | | | | | | |
Increase in accounts receivable | | | (44,459 | ) | | | (45,931 | ) | | | (30,171 | ) |
Decrease (increase) in inventories | | | 31,699 | | | | (64,698 | ) | | | (92,052 | ) |
(Increase) decrease in prepaid expenses and other current assets | | | (9,792 | ) | | | 7,194 | | | | 10,513 | |
Increase (decrease) in pension and post-retirement benefits | | | 11,283 | | | | (10,019 | ) | | | 5,197 | |
(Decrease) increase in accounts payable and accrued expenses | | | (10,747 | ) | | | (484 | ) | | | 3,732 | |
Net Cash Provided by Operating Activities | | | 637,805 | | | | 517,781 | | | | 490,479 | |
Investing Activities | | | | | | | | | | | | |
Net sale (purchase) of trading securities | | | 77,558 | | | | – | | | | (20,000 | ) |
Acquisitions of businesses/intangibles | | | (665,415 | ) | | | (168 | ) | | | (7,207 | ) |
Purchases of property/equipment | | | (106,762 | ) | | | (132,303 | ) | | | (96,911 | ) |
Proceeds from sales of property/equipment | | | 10,164 | | | | 4,564 | | | | 4,386 | |
(Increase) decrease in investments, equity in affiliates, and other assets | | | (6,619 | ) | | | 21,143 | | | | (51,253 | ) |
Net Cash Used in Investing Activities | | | (691,074 | ) | | | (106,764 | ) | | | (170,985 | ) |
Financing Activities | | | | | | | | | | | | |
Proceeds from long-term debt, net | | | – | | | | – | | | | 247,564 | |
Principal payments on long-term debt | | | – | | | | – | | | | (350,000 | ) |
Dividends paid on common stock | | | (174,320 | ) | | | (152,204 | ) | | | (129,975 | ) |
Share repurchase | | | (70,819 | ) | | | (61,366 | ) | | | (152,930 | ) |
Proceeds from exercise of stock options | | | 30,212 | | | | 14,700 | | | | 53,780 | |
Excess tax benefit from stock-based compensation | | | 23,406 | | | | 8,847 | | | | 15,205 | |
Distribution to noncontrolling interest | | | (4,000 | ) | | | (3,500 | ) | | | (8,000 | ) |
Proceeds from noncontrolling interest | | | – | | | | 774 | | | | – | |
Other | | | – | | | | – | | | | (1,146 | ) |
Net Cash Used in Financing Activities | | | (195,521 | ) | | | (192,749 | ) | | | (325,502 | ) |
Effect of Exchange Rate Changes on Cash | | | 416 | | | | 990 | | | | 1,293 | |
(Decrease) Increase in Cash and Cash Equivalents | | | (248,374 | ) | | | 219,258 | | | | (4,715 | ) |
Cash and cash equivalents at beginning of year | | | 682,388 | | | | 463,130 | | | | 467,845 | |
Cash and Cash Equivalents at End of Year | | | $ 434,014 | | | | $ 682,388 | | | | $ 463,130 | |
See Notes to Consolidated Financial Statements.
37
Notes to Consolidated Financial Statements October 27, 2013
NOTE A
SUMMARY OF SIGNIFICANT ACCOUNTING POLICIES
Principles of Consolidation: The consolidated financial statements include the accounts of Hormel Foods Corporation (the Company) and all of its majority-owned subsidiaries after elimination of intercompany accounts, transactions, and profits.
Reclassifications: Certain reclassifications of previously reported amounts have been made to conform to the current year presentation. The reclassifications had no impact on net earnings or operating cash flows as previously reported.
Stock Split: On November 22, 2010, the Company’s Board of Directors authorized a two-for-one split of the Company’s common stock, which was subsequently approved by shareholders at the Company’s Annual Meeting on January 31, 2011, and effected on February 1, 2011. The Company’s common stock was reclassified by reducing the par value from $0.0586 per share to $0.0293 per share and the number of authorized shares was increased from 400,000,000 to 800,000,000 shares, in order to effect a two-for-one stock split. The number of authorized shares of nonvoting common stock and preferred stock were also increased to 400,000,000 shares and 160,000,000 shares, respectively, with no change in the par value of those shares.
Unless otherwise noted, all prior year share amounts and per share calculations throughout this Annual Report have been restated to reflect the impact of this split, and to provide data on a comparable basis. Such restatements include calculations regarding the Company’s weighted-average shares, earnings per share, and dividends per share, as well as disclosures regarding the Company’s stock-based compensation plans and share repurchase activity.
Use of Estimates: The preparation of financial statements in conformity with U.S. generally accepted accounting principles requires management to make estimates and assumptions that affect the amounts reported in the financial statements and accompanying notes. Actual results could differ from those estimates.
Fiscal Year: The Company’s fiscal year ends on the last Sunday in October. Fiscal years 2013, 2012, and 2011 consisted of 52 weeks.
Cash and Cash Equivalents: The Company considers all investments with an original maturity of three months or less on their acquisition date to be cash equivalents. The Company’s cash equivalents as of October 27, 2013, and October 28, 2012, consisted primarily of money market funds rated AAA, and other highly liquid investment accounts.
Fair Value Measurements: Pursuant to the provisions of Accounting Standards Codification (ASC) 820, Fair Value Measurements and Disclosures (ASC 820), the Company
measures certain assets and liabilities at fair value or discloses the fair value of certain assets and liabilities recorded at cost in the consolidated financial statements. Fair value is calculated as the price that would be received to sell an asset or paid to transfer a liability in an orderly transaction between market participants at the measurement date (an exit price). ASC 820 establishes a fair value hierarchy which requires assets and liabilities measured at fair value to be categorized into one of three levels based on the inputs used in the valuation. The Company classifies assets and liabilities in their entirety based on the lowest level of input significant to the fair value measurement. The three levels are defined as follows:
Level 1: Observable inputs based on quoted prices (unadjusted) in active markets for identical assets or liabilities.
Level 2: Observable inputs, other than those included in Level 1, based on quoted prices for similar assets and liabilities in active markets, or quoted prices for identical assets and liabilities in inactive markets.
Level 3: Unobservable inputs that reflect an entity’s own assumptions about what inputs a market participant would use in pricing the asset or liability based on the best information available in the circumstances.
See additional discussion regarding the Company’s fair value measurements in Notes I, M, and N.
Investments: The Company maintains a rabbi trust to fund certain supplemental executive retirement plans and deferred income plans, which is included in other assets on the Consolidated Statements of Financial Position. The securities held by the trust are classified as trading securities. Therefore, unrealized gains and losses associated with these investments are included in the Company’s earnings. Securities held by the trust generated a gain of $4.6 million for the fiscal year ended October 27, 2013, a gain of $4.3 million for the fiscal year ended October 28, 2012, and a gain of $1.2 million for the fiscal year ended October 30, 2011. The Company has transitioned the majority of this portfolio to more fixed return investments to reduce the exposure to volatility in equity markets.
During fiscal 2011, 2012, and 2013, the Company also held securities as part of an investment portfolio, which are classified as short-term marketable securities on the Consolidated Statements of Financial Position. These investments are also trading securities. Therefore, unrealized gains and losses are included in the Company’s earnings. The Company recorded a gain of $0.2 million related to these investments during the first quarter of the fiscal year ended October 27, 2013, compared to a gain of $1.3 million for the fiscal year ended October 28, 2012, and a gain of $0.5 million for the fiscal year ended October 30, 2011. These securities were liquidated in the first quarter of fiscal 2013.
Inventories: Inventories are stated at the lower of cost or market. Cost is determined principally under the average cost method. Adjustments to the Company’s lower of cost or market inventory reserve are reflected in cost of products sold in the Consolidated Statements of Operations.
Property, Plant and Equipment: Property, plant and equipment are stated at cost. The Company uses the straight-line method in computing depreciation. The annual provisions for depreciation have been computed principally using the following ranges of asset lives: buildings 20 to 40 years, machinery and equipment 5 to 10 years.
Software development and implementation costs are expensed until the Company has determined that the software will result in probable future economic benefits, and management has committed to funding the project. Thereafter, all material development and implementation costs, and purchased software costs, are capitalized and amortized using the straight-line method over the remaining estimated useful lives.
Goodwill and Other Intangibles: Goodwill and other intangible assets are originally recorded at their estimated fair values at date of acquisition, and are allocated to reporting units that will receive the related sales and income. The Company’s reporting units represent operating segments (aggregations of business units that have similar economic characteristics and share the same production facilities, raw materials, and labor force). Definite-lived intangible assets are amortized over their estimated useful lives and are evaluated for impairment annually, or more frequently if impairment indicators are present, using a process similar to that used to test long-lived assets for impairment. Goodwill and indefinite-lived intangible assets are tested annually for impairment, or more frequently if impairment indicators arise.
In conducting the annual impairment test for goodwill, the Company first performs a qualitative assessment to determine whether it is more likely than not (> 50% likelihood) that the fair value of any reporting unit is less than its carrying amount. If the Company concludes that this is the case, then a two-step quantitative test for goodwill impairment is performed for the appropriate reporting units. Otherwise, the Company concludes that no impairment is indicated and does not perform the two-step test.
In conducting the initial qualitative assessment, the Company analyzes actual and projected growth trends for net sales, gross margin, and segment profit for each reporting unit, as well as historical performance versus plan and the results of prior quantitative tests performed. Additionally, each reporting unit assesses critical areas that may impact their business, including macroeconomic conditions and the related impact, market related exposures, any plans to market all or a portion of their business, competitive changes, new or discontinued product lines, changes in key personnel, or any other potential risks to their projected financial results.
If performed, the quantitative goodwill impairment test is a two-step process performed at the reporting unit level. First, the fair value of each reporting unit is compared to
its corresponding carrying value, including goodwill. The fair value of each reporting unit is estimated using discounted cash flow valuations (Level 3), which incorporate assumptions regarding future growth rates, terminal values, and discount rates. The estimates and assumptions used consider historical performance and are consistent with the assumptions used in determining future profit plans for each reporting unit, which are approved by the Company’s Board of Directors. If the first step results in the carrying value exceeding the fair value of any reporting unit, then a second step must be completed in order to determine the amount of goodwill impairment that should be recorded. In the second step, the implied fair value of the reporting unit’s goodwill is determined by allocating the reporting unit’s fair value to all of its assets and liabilities other than goodwill in a manner similar to a purchase price allocation. The implied fair value of the goodwill that results from the application of this second step is then compared to the carrying amount of the goodwill and an impairment charge is recorded for the difference. Even if not required, the Company periodically elects to perform the quantitative test in order to confirm the qualitative assessment.
Based on the qualitative assessment conducted in fiscal 2013, performance of the quantitative two-step test was not required for any of the Company’s reporting units. However, the Company also elected to perform the quantitative test in fiscal year 2013 to further validate the qualitative assessment. No goodwill impairment charges were recorded in fiscal years 2013, 2012, or 2011.
In conducting the annual impairment test for its indefinite-lived intangible assets, the Company first performs a qualitative assessment to determine whether it is more likely than not (> 50% likelihood) that an indefinite-lived intangible asset is impaired. If the Company concludes that this is the case, then a quantitative test for impairment must still be performed. Otherwise, the Company does not need to perform a quantitative test.
In conducting the initial qualitative assessment, the Company analyzes growth rates for historical net sales and the results of prior quantitative tests performed. Additionally, each reporting unit assesses critical areas that may impact their intangible assets or the applicable royalty rates to determine if there are factors that could impair the asset.
If performed, the quantitative impairment test compares the fair value and carrying value of the indefinite-lived intangible asset. The fair value of indefinite-lived intangible assets is primarily determined on the basis of estimated discounted value, using the relief from royalty method (Level 3), which incorporates assumptions regarding future sales projections and discount rates. If the carrying value exceeds fair value, the indefinite-lived intangible asset is considered impaired and an impairment charge is recorded for the difference. Even if not required, the Company periodically elects to perform the quantitative test in order to confirm the qualitative assessment.
Based on the qualitative assessment conducted in fiscal 2013, performance of the quantitative test was not required for any of the Company’s indefinite-lived intangible assets. No material impairment charges were recorded for indefinite-lived intangible assets for fiscal years 2013, 2012, or 2011.
Impairment of Long-lived Assets: The Company reviews long-lived assets and definite-lived intangible assets for impairment annually, or more frequently when events or changes in circumstances indicate that the carrying amount of an asset may not be recoverable. If impairment indicators are present and the estimated future undiscounted cash flows are less than the carrying value of the assets and any related goodwill, the carrying value is reduced to the estimated fair value. No material write-downs were recorded in fiscal years 2013, 2012, or 2011.
Contingent Liabilities: The Company may be subject to investigations, legal proceedings, or claims related to the on-going operation of its business, including claims both by and against the Company. Such proceedings typically involve claims related to product liability, contract disputes, wage and hour laws, employment practices, or other actions brought by employees, consumers, competitors, or suppliers. The Company establishes accruals for its potential exposure, as appropriate, for claims against the Company when losses become probable and reasonably estimable. Where the Company is able to reasonably estimate a range of potential losses, the Company records the amount within that range that constitutes the Company’s best estimate. The Company also discloses the nature of and range of loss for claims against the Company when losses are reasonably possible and material.
Foreign Currency Translation: Assets and liabilities denominated in foreign currency are translated at the current exchange rate as of the statement of financial position date, and amounts in the statement of operations are translated at the average monthly exchange rate. Translation adjustments resulting from fluctuations in exchange rates are recorded as a component of accumulated other comprehensive loss in shareholders’ investment.
When calculating foreign currency translation, the Company deemed its foreign investments to be permanent in nature and has not provided for taxes on currency translation adjustments arising from converting the investment in a foreign currency to U.S. dollars.
Derivatives and Hedging Activity: The Company uses commodity and currency positions to manage its exposure to price fluctuations in those markets. The contracts are recorded at fair value on the Consolidated Statements of Financial Position within other current assets or accounts payable. Additional information on hedging activities is presented in Note M.
Equity Method Investments: The Company has a number of investments in joint ventures where its voting interests are in excess of 20 percent but not greater than 50 percent, and for which there are no other indicators of control. The Company
accounts for such investments under the equity method of accounting, and its underlying share of each investee’s equity is reported in the Consolidated Statements of Financial Position as part of investments in and receivables from affiliates.
The Company regularly monitors and evaluates the fair value of our equity investments. If events and circumstances indicate that a decline in the fair value of these assets has occurred and is other than temporary, the Company will record a charge in equity in earnings of affiliates in the Consolidated Statements of Operations. The Company’s equity investments do not have a readily determinable fair value as none of them are publicly traded. The fair values of the Company’s private equity investments are determined by discounting the estimated future cash flows of each entity. These cash flow estimates include assumptions on growth rates and future currency exchange rates (Level 3). The Company did not record an impairment charge on any of its equity investments in fiscal years 2013, 2012, or 2011.
See additional discussion regarding the Company’s equity method investments in Note G.
Revenue Recognition: The Company recognizes sales when title passes upon delivery of its products to customers, net of applicable provisions for discounts, returns, and allowances. Products are delivered upon receipt of customer purchase orders with acceptable terms, including price and collectability that is reasonably assured.
The Company offers various sales incentives to customers and consumers. Incentives that are offered off-invoice include prompt pay allowances, will call allowances, spoilage allowances, and temporary price reductions. These incentives are recognized as reduction of revenue at the time title passes. Coupons are used as an incentive for consumers to purchase various products. The coupons reduce revenues at the time they are offered, based on estimated redemption rates. Promotional contracts are performed by customers to promote the Company’s products to the consumers. These incentives reduce revenues at the time of performance through direct payments and accrued promotional funds. Accrued promotional funds are unpaid liabilities for promotional contracts in process or completed at the end of a quarter or fiscal year. Promotional contract accruals are based on a review of the unpaid outstanding contracts on which performance has taken place. Estimates used to determine the revenue reduction include the level of customer performance and the historical spend rate versus contracted rates.
Allowance for Doubtful Accounts: The Company estimates the allowance for doubtful accounts based on a combination of factors, including the age of its accounts receivable balances, customer history, collection experience, and current market factors. Additionally, a specific reserve may be established if the Company becomes aware of a customer’s inability to meet its financial obligations.
Advertising Expenses: Advertising costs are expensed when incurred. Advertising expenses include all media advertising but exclude the costs associated with samples, demonstrations, and market research. Advertising costs for fiscal years 2013, 2012, and 2011 were $89.9 million, $103.4 million, and $115.3 million, respectively.
Shipping and Handling Costs: The Company’s shipping and handling expenses are included in cost of products sold.
Research and Development Expenses: Research and development costs are expensed as incurred and are included in selling, general and administrative expenses. Research and development expenses incurred for fiscal years 2013, 2012, and 2011 were $29.9 million, $29.8 million, and $29.4 million, respectively.
Income Taxes: The Company records income taxes in accordance with the liability method of accounting. Deferred taxes are recognized for the estimated taxes ultimately payable or recoverable based on enacted tax law. Changes in enacted tax rates are reflected in the tax provision as they occur.
In accordance with ASC 740, Income Taxes, the Company recognizes a tax position in its financial statements when it is more likely than not that the position will be sustained upon examination based on the technical merits of the position. That position is then measured at the largest amount of benefit that is greater than 50 percent likely of being realized upon ultimate settlement.
Employee Stock Options: The Company records stock- based compensation expense in accordance with ASC 718, Compensation — Stock Compensation. For options subject to graded vesting, the Company recognizes stock-based compensation expense ratably over the shorter of the vesting period or requisite service period. Stock-based compensation expense for grants made to retirement-eligible employees is recognized on the date of grant.
Share Repurchases: On May 24, 2010, the Company’s Board of Directors authorized the Company to repurchase 5.0 million shares of common stock with no expiration date. On a pre-split basis, the Company purchased 0.6 million shares at an average price of $42.86 during fiscal 2010 under this authorization.
On November 22, 2010, the Board of Directors also authorized a two-for-one stock split of the Company’s common stock. As part of the Board’s approval of that stock split, the number of shares remaining to be repurchased was adjusted proportionately. On a post-split basis, 1.2 million shares at an average price of $39.67 were purchased during fiscal 2013, 2.1 million shares at an average price of $28.65 were purchased during fiscal 2012, and 5.5 million shares at an average price of $27.82 were purchased during fiscal 2011, which fully depleted that program.
On January 29, 2013, the Company’s Board of Directors authorized the repurchase of up to an additional 10,000,000 shares of its common stock with no expiration date. During fiscal 2013, 0.6 million shares at an average price of $42.54 were purchased under this new authorization.
Supplemental Cash Flow Information: Non-cash investment activities presented on the Consolidated Statements of Cash Flows generally consist of unrealized gains or losses on the Company’s rabbi trust and other investments, amortization of affordable housing investments, and amortization of bond financing costs. The noted investments are included in other assets or short-term marketable securities on the Consolidated Statements of Financial Position. Changes in the value of these investments are included in the Company’s net earnings and are presented in the Consolidated Statements of Operations as either interest and investment income (loss) or interest expense, as appropriate.
Accounting Changes and Recent Accounting Pronouncements: In December 2011, the Financial Accounting Standards Board (FASB) updated the guidance within ASC 210, Balance Sheet. The update enhances disclosures related to the offsetting of certain assets and liabilities to enable users of financial statements to understand the effect of those arrangements on financial position. The updated guidance is effective for annual reporting periods beginning on or after January 1, 2013, and interim periods within those annual periods. The Company will adopt the new provisions of this accounting standard at the beginning of fiscal year 2014, and adoption is not expected to have a material impact on the consolidated financial statements.
In February 2013, the FASB updated the guidance within ASC 220, Comprehensive Income. The update requires companies to report, in one place, information about reclassifications out of accumulated other comprehensive income (AOCI) and changes in AOCI balances. For significant items reclassified out of AOCI to net income in their entirety in the same reporting period, reporting is required about the effect of the reclassifications on the respective line items in the statement where net income is presented. For items that are not reclassified to net income in their entirety in the same reporting period, a cross reference to other disclosures currently required under U.S. generally accepted accounting principles is required. The above information must be presented in one place, either parenthetically on the face of the financial statements by income statement line item, or in a note. The updated guidance is to be applied prospectively, and is effective for fiscal years, and interim periods within those years, beginning after December 15, 2012, with early adoption permitted. The Company will adopt the new provisions of this accounting standard at the beginning of fiscal year 2014, and adoption is not expected to have a material impact on the consolidated financial statements as it relates to presentation and disclosure only.
NOTE B
ACCUMULATED OTHER COMPREHENSIVE LOSS |
Components of accumulated other comprehensive loss are as follows:
(in thousands) | | Foreign
Currency
Translation | | Pension &
Other Benefits | | Deferred
Gain (Loss)
– Hedging | | Accumulated
Other
Comprehensive
Loss | |
Balance at October 31, 2010 | | $ | 8,849 | | $ | (205,243 | ) | $ | 20,484 | | $ | (175,910 | ) |
Unrecognized gains (losses): | | | | | | | | | |
Gross | | 843 | | (15,115 | ) | 39,480 | | 25,208 | |
Tax effect | | – | | 5,534 | | (14,895 | ) | (9,361 | ) |
Reclassification into net earnings: | | | | | | | | | |
Gross | | – | | 20,363 | | (45,103 | ) | (24,740 | ) |
Tax effect | | – | | (7,722 | ) | 17,042 | | 9,320 | |
Net of tax amount | | 843 | | 3,060 | | (3,476 | ) | 427 | |
Balance at October 30, 2011 | | $ | 9,692 | | $ | (202,183 | ) | $ | 17,008 | | $ | (175,483 | ) |
Unrecognized gains (losses): | | | | | | | | | |
Gross | | 2,723 | | (248,434 | ) | 10,261 | | (235,450 | ) |
Tax effect | | – | | 93,580 | | (3,888 | ) | 89,692 | |
Reclassification into net earnings: | | | | | | | | | |
Gross | | – | | 18,609 | | (22,319 | ) | (3,710 | ) |
Tax effect | | – | | (7,037 | ) | 8,419 | | 1,382 | |
Net of tax amount | | 2,723 | | (143,282 | ) | (7,527 | ) | (148,086 | ) |
Balance at October 28, 2012 | | $ | 12,415 | | $ | (345,465 | ) | $ | 9,481 | | $ | (323,569 | ) |
Unrecognized gains (losses): | | | | | | | | | |
Gross | | (3,024 | ) | 273,408 | | (18,329 | ) | 252,055 | |
Tax effect | | – | | (102,846 | ) | 6,898 | | (95,948 | ) |
Reclassification into net earnings: | | | | | | | | | |
Gross | | – | | 35,327 | | (5,871 | ) | 29,456 | |
Tax effect | | – | | (13,425 | ) | 2,217 | | (11,208 | ) |
Net of tax amount | | (3,024 | ) | 192,464 | | (15,085 | ) | 174,355 | |
Balance at October 27, 2013 | | $ | 9,391 | | $ | (153,001 | ) | $ | (5,604 | ) | $ | (149,214 | ) |
NOTE C
The reported net earnings attributable to the Company were used when computing basic and diluted earnings per share for all years presented. A reconciliation of the shares used in the computation is as follows:
(in thousands) | | | 2013 | | | 2012 | | | 2011 | |
Basic weighted-average shares outstanding | | | 264,317 | | | 263,466 | | | 266,394 | |
Dilutive potential common shares | | | 5,907 | | | 5,425 | | | 5,521 | |
Diluted weighted-average shares outstanding | | | 270,224 | | | 268,891 | | | 271,915 | |
For fiscal years 2013, 2012, and 2011, a total of 0.4 million, 2.2 million, and 0.7 million weighted-average outstanding stock options, respectively, were not included in the computation of dilutive potential common shares since their inclusion would have had an antidilutive effect on earnings per share.
NOTE D
On January 31, 2013, the Company acquired the United States based SKIPPY® peanut butter business from Conopco, Inc. (doing business as Unilever United States Inc.), of Englewood Cliffs, N.J. for a purchase price of $665.4 million in cash. This acquisition included the Little Rock, Arkansas manufacturing facility and all sales worldwide, except sales in China. The purchase price was funded by the Company with cash on hand generated from operations and liquidating marketable securities.
The acquisition was accounted for as a business combination using the acquisition method. The Company estimated the acquisition date fair values of the assets acquired and liabilities assumed, using independent appraisals and other analyses,
and has determined final working capital adjustments. Therefore, an allocation of the purchase price to the acquired assets, liabilities, and goodwill is presented in the table below.
At January 31, 2013 (in thousands) | | | |
Inventory | | $ | 49,156 | |
Property, plant and equipment | | 48,461 | |
Intangible assets | | 264,500 | |
Goodwill | | 303,597 | |
Current liabilities | | (299 | ) |
Purchase price | | $ | 665,415 | |
Goodwill is calculated as the excess of the purchase price over the fair value of the net assets recognized. The goodwill recorded as part of the acquisition primarily reflects the value of the assembled workforce, cost synergies, and the potential to integrate and expand existing product lines. The goodwill balance is expected to be deductible for income tax purposes. The goodwill and intangible assets have been allocated to the Grocery Products and International & Other reporting segments.
The Company recognized approximately $7.7 million of transaction costs (excluding transitional service expenses) related to the acquisition and the charges were reported in selling, general and administrative expense in the Consolidated Statement of Operations.
Operating results for this acquisition have been included in the Company’s Consolidated Statements of Operations from the date of acquisition (i.e. beginning in the second quarter) and are primarily reflected in the Grocery Products and International & Other reporting segments. The acquisition contributed $94.8 million of net sales for the fourth quarter
and $272.8 million of net sales since the date of acquisition. Pro forma results are not presented, as the acquisition was not considered material to the consolidated Company.
On November 26, 2013, subsequent to the end of the fiscal year, the Company also completed the acquisition of the China based SKIPPY® peanut butter business for an additional investment of $41.4 million. The purchase price is preliminary subject to working capital and tax adjustments. Operating results for this acquisition will be included in the Company’s Consolidated Statements of Operations from the date of acquisition and will be reflected in the International & Other reporting segment.
SKIPPY® is a well-established brand that allows the Company to expand its presence in the center of the store with a non-meat protein product and reinforces the Company’s balanced product portfolio. The acquisition also provides the opportunity to strengthen the Company’s global presence and complements the international sales strategy for the SPAM® family of products.
NOTE E
Principal components of inventories are:
(in thousands) | | October 27,
2013 | | | October 28,
2012 | |
Finished products | | $ 544,858 | | | $ 494,298 | |
Raw materials and work-in-process | | 248,411 | | | 267,877 | |
Materials and supplies | | 174,708 | | | 188,346 | |
Total | | $ 967,977 | | | $ 950,521 | |
NOTE F
GOODWILL AND INTANGIBLE ASSETS |
The changes in the carrying amount of goodwill for the fiscal years ended October 27, 2013, and October 28, 2012, are presented in the table below. The additions during the fiscal year ended October 27, 2013 are entirely due to the acquisition of the United States based SKIPPY® peanut butter business on January 31, 2013.
(in thousands) | | Grocery
Products | | Refrigerated
Foods | | JOTS | | Specialty
Foods | | International
& Other | | Total | |
Balance as of October 30, 2011 | | $ 123,316 | | $ 96,652 | | $ 203,214 | | $ 207,028 | | $ 674 | | $ 630,884 | |
Goodwill acquired | | – | | (9 | ) | – | | – | | – | | (9 | ) |
Balance as of October 28, 2012 | | $ 123,316 | | $ 96,643 | | $ 203,214 | | $ 207,028 | | $ 674 | | $ 630,875 | |
Goodwill acquired | | 199,626 | | – | | – | | – | | 103,971 | | 303,597 | |
Balance as of October 27, 2013 | | $ 322,942 | | $ 96,643 | | $ 203,214 | | $ 207,028 | | $ 104,645 | | $ 934,472 | |
43
The gross carrying amount and accumulated amortization for definite-lived intangible assets are presented in the table below. Customer relationships of $25.1 million were acquired during the second quarter of fiscal 2013 related to the United States based SKIPPY® peanut butter business.
| October 27, 2013 | October 28, 2012 |
(in thousands) | Gross
Carrying
Amount | Accumulated
Amortization | Weighted-
Avg Life
(in Years) | Gross
Carrying
Amount | Accumulated
Amortization | Weighted-
Avg Life
(in Years) |
Customer lists/relationships | $43,340 | $(14,719) | 11.0 | $22,148 | $(14,684) | 10.9 |
Formulas & recipes | 17,854 | (13,824) | 8.8 | 17,854 | (11,686) | 8.8 |
Proprietary software & technology | 14,820 | (12,024) | 10.2 | 22,000 | (17,319) | 9.3 |
Other intangibles | 9,386 | (7,999) | 7.7 | 13,586 | (10,686) | 7.9 |
Total | $85,400 | $(48,566) | 10.1 | $75,588 | $(54,375) | 9.4 |
Amortization expense for the fiscal years ended October 27, 2013, October 28, 2012, and October 30, 2011, was $9.5 million, $9.0 million, and $9.5 million, respectively.
Estimated annual amortization expense (in thousands) for the five fiscal years after October 27, 2013, is as follows:
2014 | $8,654 |
2015 | 5,474 |
2016 | 3,349 |
2017 | 2,918 |
2018 | 2,676 |
The carrying amounts for indefinite-lived intangible assets are as follows. The increase in fiscal 2013 represents the fair value of the trade name and trademarks acquired with the United States based SKIPPY® peanut butter business.
(in thousands) | October 27,
2013 | October 28,
2012 |
Brand/tradename/trademarks | $ 333,275 | $ 93,875 |
Other intangibles | 7,984 | 7,984 |
Total | $ 341,259 | $101,859 |
During the fourth quarter of fiscal years 2013 and 2012, the Company completed the required annual impairment tests of indefinite-lived intangible assets and goodwill, with no impairment indicated. Useful lives of intangible assets were also reviewed during this process, with no changes identified.
NOTE G
INVESTMENTS IN AND RECEIVABLES FROM AFFILIATES
The Company accounts for its majority-owned operations under the consolidation method. Investments in which the Company owns a minority interest, and for which there are no other indicators of control, are accounted for under the equity or cost method. These investments, along with any related receivables from affiliates, are included in the Consolidated Statements of Financial Position as investments in and receivables from affiliates.
Investments in and receivables from affiliates consists of the following:
| | | | | | October 27, | | October 28, | |
(in thousands) | | Segment | | % Owned | | 2013 | | 2012 | |
MegaMex Foods, LLC | | Grocery Products | | 50% | | $ 203,413 | | $ 205,315 | |
Foreign Joint ventures | | International & Other | | Various (26–50%) | | 67,196 | | 81,222 | |
Total | | | | | | $ 270,609 | | $ 286,537 | |
Equity in earnings of affiliates consists of the following:
(in thousands) | | Segment | | 2013 | | 2012 | | 2011 | |
MegaMex Foods, LLC | | Grocery Products | | $ 17,261 | | $ 35,762 | | $ 24,532 | |
Foreign Joint Ventures | | International & Other | | 3,252 | | 2,929 | | 3,423 | |
Other | | Various | | – | | – | | (1,198) | |
Total | | | | $ 20,513 | | $ 38,691 | | $ 26,757 | |
Dividends received from affiliates for the fiscal years ended October 27, 2013, October 28, 2012, and October 30, 2011, were $34.0 million, $37.1 million, and $4.0 million, respectively. The Company recognized a basis difference of $21.3 million associated with the formation of MegaMex, which is being amortized through equity in earnings of affiliates.
44
NOTE H
LONG-TERM DEBT AND OTHER BORROWING ARRANGEMENTS
Long-term debt consists of:
(in thousands) | | October 27,
2013 | October 28,
2012 |
Senior unsecured notes, with interest at 4.125%, interest due semi-annually through April 2021 maturity date | | $250,000 | $250,000 |
Less current maturities | | – | – |
Total | | $250,000 | $250,000 |
The Company has a $300.0 million revolving line of credit which bears interest at a variable rate based on LIBOR. As of October 27, 2013, and October 28, 2012, the Company had not drawn from this line of credit. A fixed fee is paid for the availability of this credit line. On November 22, 2011, the Company amended the terms and conditions for this line of credit and extended the maturity date to November 2016.
The Company is required by certain covenants in its debt agreements to maintain specified levels of financial ratios and financial position. At the end of the current fiscal year, the Company was in compliance with all of these covenants.
Total interest paid during fiscal 2013, 2012, and 2011 was $12.5 million, $12.9 million, and $31.7 million, respectively.
NOTE I
PENSION AND OTHER POST-RETIREMENT BENEFITS
The Company has several defined benefit plans and defined contribution plans covering most employees. Total costs associated with the Company’s defined contribution benefit plans in 2013, 2012, and 2011 were $29.9 million, $27.8 million, and $27.1 million, respectively. Benefits for defined benefit pension plans covering hourly employees are provided based on stated
amounts for each year of service, while plan benefits covering salaried employees are based on final average compensation. The Company’s funding policy is to make annual contributions of not less than the minimum required by applicable regulations. Actuarial gains and losses and any adjustments resulting from plan amendments are deferred and amortized to expense over periods ranging from 8-30 years.
Certain groups of employees are eligible for post-retirement health or welfare benefits. Benefits for retired employees vary for each group depending on respective retirement dates and applicable plan coverage in effect. Contribution requirements for retired employees are governed by the Retiree Health Care Payment Program and may change each year as the cost to provide coverage is determined. Eligible employees hired after January 1, 1990, may receive post-retirement medical coverage but must pay the full cost of the coverage. On October 17, 2012, the plan was amended, effective April 1, 2013, to terminate coverage for certain nonunion retirees who retired on or after August 1, 2002, and who are or will be Medicare eligible. If the cost of the nonunion retiree coverage is currently subsidized by the Company for the affected retirees, credits will be established in a health reimbursement account to help reimburse the retiree for the cost of purchasing coverage in the individual market. Actuarial gains and losses and any adjustments resulting from plan amendments are deferred and amortized to expense over periods ranging from 6-19 years.
Several changes were enacted that affected the Company’s defined benefit pension plans at the 2011 measurement date. The defined benefit pension plan covering collectively bargained employees was amended as a result of labor negotiations, causing an increase in the benefit obligation. The benefit obligation for the other defined benefit plans was reduced as a result of a change in the pension formula effective January 1, 2017. The amended formula remains a defined benefit formula, but will base the accrued benefit credit on age and service and define the benefit as a lump sum. Effective October 31, 2016, the 401k match for these participants will be increased.
Net periodic cost of defined benefit plans included the following:
| | Pension Benefits | Post-retirement Benefits |
(in thousands) | | 2013 | 2012 | 2011 | 2013 | 2012 | 2011 |
Service cost | | $ 30,979 | $ 23,425 | $ 24,206 | $ 2,494 | $ 2,272 | $ 2,219 |
Interest cost | | 47,688 | 49,135 | 50,282 | 14,910 | 17,910 | 18,891 |
Expected return on plan assets | | (73,144) | (68,511) | (62,989) | – | – | – |
Amortization of prior service cost | | (5,079) | (5,079) | (607) | (1,332) | 3,561 | 4,341 |
Recognized actuarial loss (gain) | | 34,019 | 20,130 | 16,633 | 7,719 | (3) | (4) |
Curtailment charge | | 6 | – | – | – | – | – |
Net periodic cost | | $ 34,469 | $ 19,100 | $ 27,525 | $23,791 | $23,740 | $25,447 |
45
Included in accumulated other comprehensive loss for pension benefits at October 27, 2013, and October 28, 2012, are the following amounts that have not yet been recognized in net periodic pension cost: unrecognized prior service credit of $42.3 million and unrecognized actuarial losses of $265.3 million, and unrecognized prior service credit of $47.4 million and unrecognized actuarial losses of $521.4 million, respectively. The prior service credit and actuarial loss included in accumulated other comprehensive loss and expected to be recognized in net periodic pension cost during the fiscal year ending October 26, 2014, are $5.0 million and $12.7 million, respectively.
Included in accumulated other comprehensive loss for post-retirement benefits at October 27, 2013, and October 28, 2012, are the following amounts that have not yet been recognized in net periodic post-retirement benefit cost: unrecognized prior service credit of $5.5 million and unrecognized actuarial losses of $29.3 million, and unrecognized prior service credit of $6.8 million and unrecognized actuarial losses of $88.3 million, respectively. The prior service credit and actuarial loss included in accumulated other comprehensive loss and expected to be recognized in net periodic post-retirement benefit cost during the fiscal year ending October 26, 2014, are $1.3 million and $0.0 million, respectively.
The following is a reconciliation of the beginning and ending balances of the benefit obligation, the fair value of plan assets, and the funded status of the plans as of the October 27, 2013 and the October 28, 2012 measurement dates:
| Pension Benefits | Post-retirement Benefits |
(in thousands) | 2013 | 2012 | 2013 | 2012 |
Change in benefit obligation: | | | | |
Benefit obligation at beginning of year | $1,192,369 | $ 942,626 | $389,512 | $351,134 |
Service cost | 30,979 | 23,425 | 2,494 | 2,272 |
Interest cost | 47,688 | 49,135 | 14,910 | 17,910 |
Plan amendments | – | – | (68) | (22,262) |
Actuarial (gain) loss | (125,072) | 222,541 | (51,290) | 63,177 |
Employee contributions | – | – | 2,512 | 2,495 |
Medicare Part D subsidy | – | – | 2,217 | 2,320 |
Benefits paid | (47,904) | (45,358) | (25,840) | (27,534) |
Benefit obligation at end of year | $1,098,060 | $1,192,369 | $334,447 | $389,512 |
| Pension Benefits | Post-retirement Benefits |
(in thousands) | 2013 | 2012 | 2013 | 2012 |
Change in plan assets: | | | | |
Fair value of plan assets at beginning of year | $ 939,230 | $ 870,923 | $ – | $ – |
Actual return on plan assets | 170,116 | 83,533 | – | – |
Employee contributions | – | – | 2,512 | 2,495 |
Employer contributions | 25,873 | 30,132 | 23,328 | 25,039 |
Benefits paid | (47,904) | (45,358) | (25,840) | (27,534) |
Fair value of plan assets at end of year | $1,087,315 | $ 939,230 | $ – | $ – |
Funded status at end of year | $ (10,745) | $(253,139) | $(334,447) | $(389,512) |
Amounts recognized in the Consolidated Statements of Financial Position as of October 27, 2013, and October 28, 2012, are as follows:
| Pension Benefits | Post-retirement Benefits |
(in thousands) | 2013 | 2012 | 2013 | 2012 |
Pension assets | $ 162,535 | $ 49 | $ – | $ – |
Employee related expenses | (4,159) | (3,650) | (22,338) | (23,622) |
Pension and post-retirement benefits | (169,121) | (249,538) | (312,109) | (365,890) |
Net amount recognized | $ (10,745) | $(253,139) | $ (334,447) | $(389,512) |
The projected benefit obligation, accumulated benefit obligation, and fair value of plan assets for the pension plans with accumulated benefit obligations in excess of plan assets were $173.3 million, $161.4 million, and $0.0 million, respectively, as of October 27, 2013, and $475.3 million, $457.6 million, and $263.0 million, respectively, as of October 28, 2012.
46
Weighted-average assumptions used to determine benefit obligations are as follows:
| 2013 | 2012 |
Discount rate | 4.89% | 4.05% |
Rate of future compensation increase (for plans that base benefits on final compensation level) | 3.91% | 3.97% |
Weighted-average assumptions used to determine net periodic benefit costs are as follows:
| 2013 | 2012 | 2011 |
Discount rate | 4.05% | 5.33% | 5.82% |
Rate of future compensation increase (for plans that base benefits on final compensation level) | 3.97% | 3.93% | 4.03% |
Expected long-term return on plan assets | 7.90% | 8.00% | 8.00% |
The expected long-term rate of return on plan assets is developed in consultation with outside advisors. A range is determined based on the composition of the asset portfolio, historical long-term rates of return, and estimates of future performance.
For measurement purposes, an 8.0% annual rate of increase in the per capita cost of covered health care benefits for pre-Medicare and post-Medicare retirees’ coverage is assumed for 2014. The pre-Medicare and post-Medicare rate is assumed to decrease to 5.0% for 2019, and remain at that level thereafter.
The assumed discount rate, expected long-term rate of return on plan assets, rate of future compensation increase, and health care cost trend rate have a significant impact on the amounts reported for the benefit plans. A one-percentage-point change in these rates would have the following effects:
| 1-Percentage-Point |
| Expense | Benefit Obligation |
(in thousands) | Increase | Decrease | Increase | Decrease |
Pension Benefits: | | | | |
Discount rate | $ | (9,833) | $ | 15,569 | $ | (133,968) | $ | 166,887 |
Expected long-term rate of return on plan assets | | (10,731) | | 10,731 | | – | | – |
Rate of future compensation increase | | 1,257 | | (1,208) | | 6,636 | | (6,463) |
Post-retirement Benefits: | | | | | | | | |
Discount rate | $ | 1,087 | $ | 3,684 | $ | (32,338) | $ | 39,046 |
Health care cost trend rate | | 1,529 | | (1,405) | | 35,049 | | (29,181) |
The actual and target weighted-average asset allocations for the Company’s pension plan assets as of the plan measurement date are as follows:
| 2013 | 2012 |
Asset Category | Actual | Target Range | Actual | Target Range |
Large Capitalization Equity | 29.2% | 15-35% | 29.4% | 20-35% |
Hormel Foods Corporation Stock | 6.7% | 0-10% | 5.2% | 0-10% |
Small Capitalization Equity | 6.3% | 5-15% | 5.7% | 5-15% |
International Equity | 22.0% | 15-25% | 19.7% | 15-25% |
Private Equity | 4.2% | 0-15% | 3.6% | 0-15% |
Total Equity Securities | 68.4% | 55-75% | 63.6% | 55-75% |
Fixed Income | 30.0% | 25-45% | 35.0% | 25-45% |
Cash and Cash Equivalents | 1.5% | – | 1.4% | – |
Target allocations are established in consultation with outside advisors through the use of asset-liability modeling to attempt to match the duration of the plan assets with the duration of the Company’s projected benefit liability. The asset allocation strategy attempts to minimize the long-term cost of pension benefits, reduce the volatility of pension expense, and achieve a healthy funded status for the plans.
As of the 2013 measurement date, plan assets included 1.7 million shares of common stock of the Company having a market value of $72.6 million. Dividends paid during the year on shares held by the plan were $1.1 million. In 2012, plan assets included 1.7 million shares of common stock of the Company having a market value of $48.9 million.
Based on the October 27, 2013 measurement date, the Company anticipates making contributions of $26.8 million to fund the pension plans during fiscal year 2014. The Company also expects to make contributions of $27.1 million during 2014 that represent benefit payments for unfunded plans.
47
Benefits expected to be paid over the next ten fiscal years are as follows:
(in thousands) | Pension
Benefits | Post-
retirement
Benefits |
2014 | $ 48,716 | $ 20,502 |
2015 | 50,234 | 20,849 |
2016 | 52,559 | 20,977 |
2017 | 55,428 | 20,943 |
2018 | 58,367 | 20,994 |
2019 – 2023 | 339,843 | 101,459 |
Post-retirement benefits are net of expected federal subsidy receipts related to prescription drug benefits granted under the Medicare Prescription Drug, Improvement and Modernization Act of 2003, which are estimated to be $2.5 million per year through 2023.
The fair values of the defined benefit pension plan investments as of October 27, 2013 and October 28, 2012, by asset category and fair value hierarchy level, are as follows:
| | | Fair Value Measurements at October 27, 2013 | |
(in thousands) | | | Total
Fair Value | | Quoted Prices
in Active
Markets for
Identical Assets
(Level 1) | | Significant Other
Observable
Inputs
(Level 2) | | Significant
Unobservable
Inputs
(Level 3) | |
Investments at Fair Value: | | | | | | | | | | |
Cash equivalents(1) | | | $ 16,373 | | $ 16,373 | | $ – | | $ – | |
Large Capitalization Equity(2) | | | | | | | | | | |
Domestic | | | $ 355,084 | | $248,398 | | $106,686 | | $ – | |
Foreign | | | 35,466 | | 35,466 | | – | | – | |
Total Large Capitalization Equity | | | $ 390,550 | | $283,864 | | $106,686 | | $ – | |
Small Capitalization Equity(3) | | | | | | | | | | |
Domestic | | | $ 60,579 | | $ 60,579 | | $ – | | $ – | |
Foreign | | | 7,503 | | 7,503 | | – | | – | |
Total Small Capitalization Equity | | | $ 68,082 | | $ 68,082 | | $ – | | $ – | |
International Equity(4) | | | | | | | | | | |
Mutual fund | | | $ 66,260 | | $ – | | $ 66,260 | | $ – | |
Collective trust | | | 173,044 | | – | | 173,044 | | – | |
Total International Equity | | | $ 239,304 | | $ – | | $239,304 | | $ – | |
Private Equity(5) | | | | | | | | | | |
Domestic | | | $ 35,226 | | $ – | | $ – | | $35,226 | |
International | | | 10,557 | | – | | – | | 10,557 | |
Total Private Equity | | | $ 45,783 | | $ – | | $ – | | $45,783 | |
Total Equity | | | $ 743,719 | | $351,946 | | $345,990 | | $45,783 | |
Fixed Income(6) | | | | | | | | | | |
US government issues | | | $ 104,087 | | $ 77,381 | | $ 26,706 | | $ – | |
Municipal issues | | | 21,405 | | – | | 21,405 | | – | |
Corporate issues – domestic | | | 176,319 | | – | | 176,319 | | – | |
Corporate issues – foreign | | | 25,412 | | – | | 25,412 | | – | |
Total Fixed Income | | | $ 327,223 | | $ 77,381 | | $249,842 | | $ – | |
Total Investments at Fair Value | | | $1,087,315 | | $445,700 | | $595,832 | | $45,783 | |
48
| | | Fair Value Measurements at October 28, 2012 | |
(in thousands) | | | Total Fair
Value | | Quoted Prices
in Active
Markets for
Identical Assets
(Level 1) | | Significant Other
Observable
Inputs
(Level 2) | | Significant
Unobservable
Inputs
(Level 3) | |
Investments at Fair Value: | | | | | | | | | | |
Cash equivalents(1) | | | $ 13,544 | | $ 13,544 | | $ – | | $ – | |
Large Capitalization Equity(2) | | | | | | | | | | |
Domestic | | | $298,375 | | $181,994 | | $116,381 | | $ – | |
Foreign | | | 26,503 | | 26,503 | | – | | – | |
Total Large Capitalization Equity | | | $324,878 | | $208,497 | | $116,381 | | $ – | |
Small Capitalization Equity(3) | | | | | | | | | | |
Domestic | | | $ 47,883 | | $ 47,883 | | $ – | | $ – | |
Foreign | | | 5,456 | | 5,456 | | – | | – | |
Total Small Capitalization Equity | | | $ 53,339 | | $ 53,339 | | $ – | | $ – | |
International Equity(4) | | | | | | | | | | |
Mutual fund | | | $ 50,317 | | $ – | | $ 50,317 | | $ – | |
Collective trust | | | 134,926 | | – | | 134,926 | | – | |
Total International Equity | | | $185,243 | | $ – | | $185,243 | | $ – | |
Private Equity(5) | | | | | | | | | | |
Domestic | | | $ 26,785 | | $ – | | $ – | | $26,785 | |
International | | | 6,883 | | – | | – | | 6,883 | |
Total Private Equity | | | $ 33,668 | | $ – | | $ – | | $33,668 | |
Total Equity | | | $597,128 | | $261,836 | | $301,624 | | $33,668 | |
Fixed Income(6) | | | | | | | | | | |
US government issues | | | $122,207 | | $ 94,346 | | $ 27,861 | | $ – | |
Municipal issues | | | 18,294 | | – | | 18,294 | | – | |
Corporate issues — domestic | | | 166,029 | | – | | 166,029 | | – | |
Corporate issues — foreign | | | 22,028 | | – | | 22,028 | | – | |
Total Fixed Income | | | $328,558 | | $ 94,346 | | $234,212 | | $ – | |
Total Investments at Fair Value | | | $939,230 | | $369,726 | | $535,836 | | $33,668 | |
The following is a description of the valuation methodologies used for instruments measured at fair value, including the general classification of such instruments pursuant to the valuation hierarchy:
(1) Cash Equivalents: These Level 1 investments consist primarily of money market mutual funds that are highly liquid and traded in active markets.
(2) Large Capitalization Equity: The Level 1 investments include a mix of predominately U.S. common stocks and foreign common stocks, which are valued at the closing price reported on the active market in which the individual securities are traded. The Level 2 investment includes a mutual fund consisting of a mix of U.S. common stocks that is valued at the publicly available net asset value (NAV) of shares held by the pension plans at year end.
(3) Small Capitalization Equity: The Level 1 investments include a mix of predominately U.S. common stocks and foreign common stocks, which are valued at the closing price reported on the active market in which the individual securities are traded.
(4) International Equity: These Level 2 investments include a mix of collective investment funds and mutual funds. The mutual funds are valued at the publicly available NAV of shares held by the pension plans at year end. The value of the collective investment funds is based on the fair value of the underlying investments and the NAV can be calculated for these funds.
(5) Private Equity: These Level 3 investments consist of various collective investment funds, which are managed by a third party, that invest in a well diversified portfolio of equity investments from top performing, high quality firms that focus on U.S. and foreign small to mid markets; venture capitalists; and entrepreneurs with a concentration in areas of innovation. Investment strategies include buyouts, growth capital, buildups, and distressed; investment strategies also include early stages of company development mainly in the U.S. The fair value of the units for these investments is based on the fair value of the underlying investments, and the NAV can be calculated for these funds.
(6) Fixed Income: The Level 1 investments include U.S. Treasury bonds and notes, which are valued at the closing price reported on the active market in which the individual securities are traded. The Level 2 investments consist principally of U.S. government securities, which are valued daily using institutional bond quote sources and mortgage-backed securities pricing sources; municipal, domestic, and foreign securities, which are valued daily using institutional bond quote sources; and mutual funds invested in long-duration corporate bonds that are valued at the publicly available NAV of shares held by the pension plans at year-end.
49
A reconciliation of the beginning and ending balance of the investments measured at fair value using significant unobservable inputs (Level 3) is as follows:
(in thousands) | | | 2013 | | | 2012 | |
Beginning Balance | | | $33,668 | | | $21,847 | |
Purchases, issuances, and settlements (net) | | | 7,288 | | | 9,316 | |
Unrealized gains | | | 2,718 | | | 478 | |
Realized gains | | | 1,471 | | | 1,812 | |
Interest and dividend income | | | 638 | | | 215 | |
Ending Balance | | | $45,783 | | | $33,668 | |
The Company has commitments totaling $85.0 million for the private equity investments within the pension plans, of which $42.1 million and $53.2 million remain unfunded at fiscal year end 2013 and 2012, respectively. These commitments include $27.1 million and $15.0 million for domestic and foreign equity investments, respectively, for fiscal year end 2013 compared to the $34.5 million and $18.7 million for domestic and foreign equity investments, respectively, for fiscal year end 2012. Funding for future private equity capital calls will come from existing pension plan asset investments and not from additional cash contributions into the Company’s pension plans.
NOTE J
The components of the provision for income taxes are as follows:
(in thousands) | | | 2013 | | | 2012 | | | 2011 | |
Current: | | | | | | | | | | |
U.S. Federal | | | $231,359 | | | $216,620 | | | $202,084 | |
State | | | 30,671 | | | 26,303 | | | 26,978 | |
Foreign | | | 5,334 | | | 5,783 | | | 3,826 | |
Total current | | | 267,364 | | | 248,706 | | | 232,888 | |
Deferred: | | | | | | | | | | |
U.S. Federal | | | 1,080 | | | 4,443 | | | 6,358 | |
State | | | (194 | ) | | 225 | | | 394 | |
Foreign | | | 181 | | | – | | | – | |
Total deferred | | | 1,067 | | | 4,668 | | | 6,752 | |
Total provision for income taxes | | | $268,431 | | | $253,374 | | | $239,640 | |
Deferred income taxes reflect the net tax effects of temporary differences between the carrying amounts of assets and liabilities for financial reporting purposes and the amounts used for income tax purposes. The Company believes that, based upon its lengthy and consistent history of profitable operations, it is more likely than not that the net deferred tax assets of $98.6 million will be realized on future tax returns,
primarily from the generation of future taxable income. Significant components of the deferred income tax liabilities and assets are as follows:
(in thousands) | | | October 27,
2013 | | | October 28,
2012 | |
Deferred tax liabilities: | | | | | | | |
Tax over book depreciation | | | $ (89,823 | ) | | $ (91,545 | ) |
Book/tax basis difference from acquisitions | | | (25,442 | ) | | (26,295 | ) |
Other, net | | | (92,813 | ) | | (76,851 | ) |
Deferred tax assets: | | | | | | | |
Post-retirement benefits | | | 127,093 | | | 147,278 | |
Stock options | | | 32,036 | | | 32,210 | |
Deferred compensation | | | 25,089 | | | 23,115 | |
Insurance accruals | | | 19,007 | | | 16,728 | |
Vacation accruals | | | 15,073 | | | 14,905 | |
Promotional accruals | | | 10,779 | | | 7,524 | |
Federal benefit of state tax | | | 7,786 | | | 9,965 | |
Pension benefits | | | 5,249 | | | 96,641 | |
Other, net | | | 64,595 | | | 59,130 | |
Net deferred tax assets | | | $ 98,629 | | | $ 212,805 | |
Reconciliation of the statutory federal income tax rate to the Company’s effective tax rate is as follows:
| | | 2013 | | | | 2012 | | | | 2011 | |
U.S. statutory rate | | | 35.0 | % | | | 35.0 | % | | | 35.0 | % |
State taxes on income, net of federal tax benefit | | | 2.7 | | | | 2.5 | | | | 2.7 | |
Domestic production activities deduction | | | (2.4 | ) | | | (2.6 | ) | | | (2.6 | ) |
All other, net | | | (1.7 | ) | | | (1.5 | ) | | | (1.8 | ) |
Effective tax rate | | | 33.6 | % | | | 33.4 | % | | | 33.3 | % |
No provision has been made for U.S. federal income taxes on certain undistributed earnings of foreign subsidiaries and joint ventures that we intend to permanently invest or that may be remitted substantially tax-free. The total of undistributed earnings that would be subject to federal income tax if remitted under existing law is approximately $69.2 million as of October 27, 2013. Determination of the unrecognized deferred tax liability related to these earnings is not practicable because of the complexities with its hypothetical calculation. Upon distribution of these earnings, we will be subject to U.S. taxes and withholding taxes payable to various foreign governments. A credit for foreign taxes already paid would be available to reduce the U.S. tax liability.
Total income taxes paid during fiscal 2013, 2012, and 2011 were $226.2 million, $226.7 million, and $227.3 million, respectively.
The following table sets forth changes in the unrecognized tax benefits, excluding interest and penalties, for fiscal years 2012 and 2013.
(in thousands) | | | |
Balance as of October 30, 2011 | | $ 21,398 | |
Tax positions related to the current period: | | | |
Increases | | 3,066 | |
Decreases | | – | |
Tax positions related to prior periods: | | | |
Increases | | 1,302 | |
Decreases | | (2,541 | ) |
Settlements | | (624 | ) |
Decreases related to a lapse of applicable statute of limitations: | | (470 | ) |
Balance as of October 28, 2012 | | $ 22,131 | |
Tax positions related to the current period: | | | |
Increases | | 4,353 | |
Decreases | | – | |
Tax positions related to prior periods: | | | |
Increases | | 3,091 | |
Decreases | | (4,738 | ) |
Settlements | | (1,173 | ) |
Decreases related to a lapse of applicable statute of limitations: | | (3,579 | ) |
Balance as of October 27, 2013 | | $ 20,085 | |
The amount of unrecognized tax benefits, including interest and penalties, at October 27, 2013, recorded in other long-term liabilities was $23.1 million, of which $15.3 million would impact the Company’s effective tax rate if recognized. The Company includes accrued interest and penalties related to uncertain tax positions in income tax expense, with gains of $4.7 million included in expense for fiscal 2013. The amount of accrued interest and penalties at October 27, 2013, associated with unrecognized tax benefits was $3.0 million.
The Company is regularly audited by federal and state taxing authorities. During fiscal year 2013, the United States Internal Revenue Service (I.R.S.) concluded its examination of the Company’s consolidated federal income tax returns for the fiscal years through 2011. The Company is in various stages of audit by several state taxing authorities on a variety of fiscal years, as far back as 2006. While it is reasonably possible that one or more of these audits may be completed within the next 12 months and that the related unrecognized tax benefits may change, based on the status of the examinations it is not possible to reasonably estimate the effect of any amount of such change to previously recorded uncertain tax positions.
NOTE K
COMMITMENTS AND CONTINGENCIES |
In order to ensure a steady supply of hogs and turkeys, and to keep the cost of products stable, the Company has entered into contracts with producers for the purchase of hogs and turkeys at formula-based prices over periods up to 10 years. The Company has also entered into grow-out contracts with independent farmers to raise turkeys for the Company for periods up to 25 years. Under these arrangements, the Company owns the livestock, feed, and other supplies while the independent farmers provide facilities and labor. The Company has also contracted for the purchase of corn, soybean meal, and other feed ingredients from independent suppliers for periods up to three years. Under these contracts, the Company is committed at October 27, 2013, to make purchases, assuming current price levels, as follows:
(in thousands) | | | |
2014 | | $1,420,814 | |
2015 | | 933,079 | |
2016 | | 656,292 | |
2017 | | 583,994 | |
2018 | | 569,155 | |
Later Years | | 1,173,838 | |
Total | | $5,337,172 | |
Purchases under these contracts for fiscal 2013, 2012, and 2011 were $2.0 billion, $2.0 billion, and $1.8 billion, respectively.
The Company has noncancelable operating lease commitments on facilities and equipment at October 27, 2013, as follows:
(in thousands) | | | |
2014 | | $ 5,872 | |
2015 | | 2,468 | |
2016 | | 1,760 | |
2017 | | 992 | |
2018 | | 711 | |
Later Years | | 1,977 | |
Total | | $ 13,780 | |
The Company expensed $21.6 million, $21.6 million, and $23.1 million for rent in fiscal 2013, 2012, and 2011, respectively.
The Company has commitments to expend approximately $104.7 million to complete construction in progress at various locations as of October 27, 2013.
As of October 27, 2013, the Company has $42.6 million of standby letters of credit issued on its behalf. The standby letters of credit are primarily related to the Company’s self-insured workers’ compensation programs. However, that amount also includes a revocable $4.9 million standby letter of credit for obligations of an affiliated party that may arise under worker compensation claims. Letters of credit are not reflected in the Company’s consolidated statements of financial position.
As of October 27, 2013, the Company was committed to close the acquisition of the China based SKIPPY® peanut butter business. Subsequent to the end of the fiscal year, this acquisition closed on November 26, 2013, for $41.4 million, subject to working capital and tax adjustments.
The Company is involved on an ongoing basis in litigation arising in the ordinary course of business. In the opinion of management, the outcome of litigation currently pending will not materially affect the Company’s results of operations, financial condition, or liquidity.
NOTE L
The Company issues stock options and nonvested shares as part of its stock incentive plans for employees and non-employee directors. The Company’s policy is to grant options with the exercise price equal to the market price of the common stock on the date of grant. Options typically vest over periods ranging from six months to four years and expire ten years after the date of the grant. The Company recognizes stock-based compensation expense ratably over the shorter of the requisite service period or vesting period. The fair value of stock-based compensation granted to retirement-eligible individuals is expensed at the time of grant.
During the first quarter of fiscal 2007, the Company made a one-time grant of 100 stock options (pre-2011 split) to each active, full-time employee of the Company on January 8, 2007. This grant was to vest upon the earlier of five years or attainment of a closing stock price of $50.00 per share (pre-2011 split) for five consecutive trading days, and had an expiration of ten years after the grant date. During the first quarter of fiscal 2011, the options vested after the stock attained the required closing price per share for five consecutive trading days.
A reconciliation of the number of options outstanding and exercisable (in thousands) as of October 27, 2013, and changes during the fiscal year then ended, is as follows:
| | Shares | | Weighted-
Average
Exercise
Price | | Weighted-
Average
Remaining
Contractual
Term | | Aggregate
Intrinsic
value
(in thousands) | |
Outstanding at October 28, 2012 | | 20,454 | | $19.67 | | | | | |
Granted | | 2,218 | | 32.19 | | | | | |
Exercised | | 4,181 | | 15.56 | | | | | |
Forfeited | | 25 | | 27.77 | | | | | |
Outstanding at October 27, 2013 | | 18,466 | | $22.09 | | 5.6 yrs | | $397,571 | |
Exercisable at October 27, 2013 | | 12,429 | | $19.02 | | 4.3 yrs | | $305,727 | |
The weighted-average grant date fair value of stock options granted and the total intrinsic value of options exercised (in thousands) during each of the past three fiscal years is as follows:
| | | Fiscal Year Ended | |
| | | October 27, | | | October 28, | | October 30, | |
| | | 2013 | | | 2012 | | 2011 | |
Weighted-average grant date fair value | | | $ | 5.50 | | | $ | 5.64 | | | $ | 5.54 | |
Intrinsic value of exercised options | | | $ | 77,610 | | | $ | 30,210 | | | $ | 54,859 | |
The fair value of each option award is calculated on the date of grant using the Black-Scholes valuation model utilizing the following weighted-average assumptions:
| | | Fiscal Year Ended | |
| | | October 27, | | | October 28, | | October 30, | |
| | | 2013 | | | 2012 | | 2011 | |
Risk-free interest rate | | | 1.4% | | | 1.8% | | | 2.9% | |
Dividend yield | | | 2.1% | | | 2.0% | | | 2.0% | |
Stock price volatility | | | 20.0% | | | 21.0% | | | 21.0% | |
Expected option life | | | 8 years | | | 8 years | | | 8 years | |
As part of the annual valuation process, the Company reassesses the appropriateness of the inputs used in the valuation models. The Company establishes the risk-free interest rate using stripped U.S. Treasury yields as of the grant date where the remaining term is approximately the expected life of the option. The dividend yield is set based on the dividend rate approved by the Company’s Board of Directors and the stock price on the grant date. The expected volatility assumption is set based primarily on historical volatility. As a reasonableness test, implied volatility from exchange traded options is also examined to validate the volatility range obtained from the historical analysis. The expected life assumption is set based on an analysis of past exercise behavior by option holders. In performing the valuations for option grants, the Company has not stratified option holders as exercise behavior has historically been consistent across all employee and non-employee director groups.
The Company’s nonvested shares granted on or before September 26, 2010, vest after five years or upon retirement. Nonvested shares granted after September 26, 2010, vest after one year. A reconciliation of the nonvested shares (in thousands) as of October 27, 2013, and changes during the fiscal year then ended is as follows:
| | Shares | | Weighted-
Average
Grant Date
Fair value | |
Nonvested at October 28, 2012 | | 139 | | $21.47 | |
Granted | | 45 | | 35.42 | |
Vested | | 72 | | 25.07 | |
Nonvested at October 27, 2013 | | 112 | | $24.77 | |
The weighted-average grant date fair value of nonvested shares granted, the total fair value (in thousands) of non- vested shares granted, and the fair value (in thousands) of shares that have vested during each of the past three fiscal years is as follows:
| | | Fiscal Year Ended |
| | | October 27, | | | October 28, | | | October 30, | |
| | | 2013 | | | 2012 | | | 2011 | |
Weighted-average grant date fair value | | | $35.42 | | | $28.98 | | | $25.11 | |
Fair value of nonvested shares granted | | | $1,600 | | | $1,369 | | | $1,299 | |
Fair value of shares vested | | | $1,824 | | | $2,476 | | | $ 751 | |
Stock-based compensation expense, along with the related income tax benefit, for each of the past three fiscal years is presented in the table below:
| | | Fiscal Year Ended |
(in thousands) | | | October 27,
2013 | | | October 28,
2012 | | | October 30,
2011 | |
Stock-based compensation expense recognized | | | $17,596 | | | $16,710 | | | $17,229 | |
Income tax benefit recognized | | | (6,655) | | | (6,334 | ) | | (6,542) | |
After-tax stock-based compensation expense | | | $10,941 | | | $10,376 | | | $10,687 | |
At October 27, 2013, there was $7.4 million of total unrecognized compensation expense from stock-based compensation arrangements granted under the plans. This compensation is expected to be recognized over a weighted-average period of approximately 4.4 years. During fiscal years 2013, 2012, and 2011, cash received from stock option exercises was $30.2 million, $14.7 million, and $53.8 million, respectively. The total tax benefit to be realized for tax deductions from these option exercises was $29.4 million, $1 1.4 million, and $20.8 million, respectively.
Shares issued for option exercises and nonvested shares may be either authorized but unissued shares, or shares of treasury stock acquired in the open market or otherwise. The number of shares available for future grants was 27.9 million at October 27, 2013, 30.0 million at October 28, 2012, and 32.6 million at October 30, 2011.
NOTE M
The Company uses hedging programs to manage price risk associated with commodity purchases. These programs utilize futures contracts and swaps to manage the Company’s exposure to price fluctuations in the commodities markets. The Company has determined that its programs which are designated as hedges are highly effective in offsetting the changes in fair value or cash flows generated by the items hedged.
Cash Flow Hedges: The Company currently utilizes corn futures to offset the price fluctuation in the Company’s future direct grain purchases, and has historically entered into various swaps to hedge the purchases of grain and natural gas at certain plant locations. The financial instruments are designated and accounted for as cash flow hedges, and the Company measures the effectiveness of the hedges on a regular basis. Effective gains or losses related to these cash flow hedges are reported in accumulated other comprehensive loss (AOCL) and reclassified into earnings, through cost of products sold, in the period or periods in which the hedged transactions affect earnings. Any gains or losses related to hedge ineffectiveness are recognized in the current period cost of products sold. The Company typically does not hedge its grain or natural gas exposure beyond the next two upcoming fiscal years. As of October 27, 2013, and October 28, 2012, the Company had the following outstanding commodity futures contracts that were entered into to hedge forecasted purchases:
| | Volume |
Commodity | | October 27, 2013 | | | October 28, 2012 | |
Corn | | 14.7 million bushels | | | 12.0 million bushels | |
As of October 27, 2013, the Company has included in AOCL, hedging loss of $9.0 million (before tax) relating to its positions, compared to gains of $15.2 million (before tax) as of October 28, 2012. The Company expects to recognize the majority of these losses over the next 12 months. The balance as of October 27, 2013, includes a loss of $1.1 million related to corn futures contracts held for the Company’s hog operations. These contracts were dedesignated as cash flow hedges during fiscal year 2013, as they were no longer highly effective. These losses will remain in AOCL until the hedged transactions occur or it is probable the hedged transactions will not occur. Gains or losses related to these contracts after the date of dedesignation have been recognized in earnings as incurred.
Fair Value Hedges: The Company utilizes futures to minimize the price risk assumed when forward priced contracts are offered to the Company’s commodity suppliers. The intent of the program is to make the forward priced commodities cost nearly the same as cash market purchases at the date of delivery. The futures contracts are designated and accounted for as fair value hedges, and the Company measures the effectiveness of the hedges on a regular basis. Changes in the fair value of the futures contracts, along with the gain or loss on the hedged purchase commitment, are marked-to-market through earnings and are recorded on the Consolidated Statement of Financial Position as a current asset and liability, respectively. Effective gains or losses related to these fair value hedges are recognized through cost of products sold in the period or periods in which the hedged transactions affect earnings. Any gains or losses related to hedge ineffectiveness are recognized in the current period cost of products sold. As of October 27, 2013, and October 28, 2012, the Company had the following outstanding commodity futures contracts designated as fair value hedges:
| | Volume |
Commodity | | October 27, 2013 | | | October 28, 2012 | |
Corn | | 5.8 million bushels | | | 8.0 million bushels | |
Lean hogs | | 1.4 million cwt | | | 0.9 million cwt | |
Other Derivatives: During fiscal years 2013 and 2012, the Company has held certain futures and options contract positions as part of a merchandising program and to manage the Company’s exposure to fluctuations in commodity markets and foreign currencies. The Company has not applied hedge accounting to these positions. All foreign exchange and options contracts were closed as of the end of the fiscal year.
Additionally, during fiscal year 2013, the Company dedesignated its corn futures contracts held for its hog operations that were previously designated as cash flow hedges, as these contracts were no longer highly effective. Hedge accounting is no longer being applied to these contracts, and gains or losses occurring after the date of dedesignation have been recognized in earnings as incurred.
As of October 27, 2013, and October 28, 2012, the Company had the following outstanding futures contracts related to these programs:
| | Volume |
Commodity | | October 27, 2013 | | | October 28, 2012 | |
Corn | | 1.7 million bushels | | | – | |
Fair Values: The fair values of the Company’s derivative instruments as of October 27, 2013, and October 28, 2012, were as follows:
| | | | | | Fair Value(1) | |
(in thousands) | | | Location on Consolidated
Statements of Financial Position | | | October 27,
2013 | | October 28,
2012 |
Asset Derivatives: | | | | | | | | | | |
Derivatives Designated as Hedges: | | | | | | | | | | |
Commodity contracts | | | Other current assets | | | $(25,802) | | | $7,483 | |
Derivatives Not Designated as Hedges: | | | | | | | | | | |
Commodity contracts | | | Other current assets | | | (3,783) | | | – | |
Total Asset Derivatives | | | | | | $(29,585) | | | $7,483 | |
(1) Amounts represent the gross fair value of derivative assets and liabilities. The Company nets the derivative assets and liabilities for each of its hedging programs, including cash collateral, when a master netting arrangement exists between the Company and the counterparty to the derivative contract. The amount or timing of cash collateral balances may impact the classification of the derivative in the Consolidated Statement of Financial Position. See Note N for a discussion of these net amounts as reported in the Consolidated Statements of Financial Position.
54
Derivative Gains and Losses: Gains or losses (before tax, in thousands) related to the Company’s derivative instruments for the fiscal year ended October 27, 2013, and October 28, 2012, were as follows:
| | | Gain/(Loss) Recognized
in AOCL
(Effective Portion)(1) (2) | | | | | | Gain/(Loss) Reclassified from AOCL into Earnings
(Effective Portion)(1) (2) | | | Gain/(Loss)
Recognized in Earnings (Ineffective Portion)(3) (5) | |
| | | Fiscal Year Ended | | | | | | Fiscal Year Ended | | | Fiscal Year Ended | |
Cash Flow Hedges: | | | October 27,
2013 | | | October 28,
2012 | | | Location on Consolidated
Statements of Operations | | | October 27,
2013 | | | October 28,
2012 | | | October 27,
2013 | | | October 28,
2012 | |
Commodity contracts | | | $(18,329) | | | $10,261 | | | Cost of products sold | | | $5,871 | | | $22,319 | | | $(5,272) | | | $ – | |
| | | | Gain/(Loss)
Recognized in Earnings
(Effective Portion)(4) | | | Gain/(Loss)
Recognized in Earnings
(Ineffective Portion)(3) (6) | |
| | | | Fiscal Year Ended | | | Fiscal Year Ended | |
Fair Value Hedges: | Location on Consolidated
Statements of Operations | | | October 27,
2013 | | | October 28,
2012 | | | October 27,
2013 | | | October 28,
2012 | |
Commodity contracts | Cost of products sold | | | $6,067 | | | $(10,670) | | | $3,560 | | | $ 19 | |
| | | | Gain/(Loss)
Recognized in Earnings(2) | | |
| | | | Fiscal Year Ended | | |
Derivatives Not
Designated as Hedges: | Location on Consolidated
Statements of Operations | | | October 27,
2013 | | | October 28,
2012 | | |
Commodity contracts | Cost of products sold | | | $(2,227) | | | $46 | | |
Foreign exchange contracts | Interest and investment income (loss) | | | $ 244 | | | $ – | | |
(1) Amounts represent gains or losses in AOCL before tax. See Note B for the after tax impact of these gains or losses on net earnings.
(2) During fiscal year 2013, the Company dedesignated and ceased hedge accounting for its corn futures contracts held for its hog operations. At the date of dedesignation of these hedges, losses of $2.0 million (before tax) were deferred in AOCL, with $1.1 million (before tax) remaining as of October 27, 2013. These losses will remain in AOCL until the hedged transactions occur or it is probable the hedged transactions will not occur. Gains or losses related to these contracts after the date of dedesignation have been recognized in earnings as incurred.
(3) There were no gains or losses excluded from the assessment of hedge effectiveness during the fiscal year. Fiscal year 2013 includes the mark-to-market impact on certain Jennie-O Turkey Store corn futures contracts which resulted from a temporary suspension of hedge accounting due to market volatility.
(4) Amounts represent losses on commodity contracts designated as fair value hedges that were closed during the fiscal year, which were offset by a corresponding gain on the underlying hedged purchase commitment. Additional gains or losses related to changes in the fair value of open commodity contracts, along with the offsetting gain or loss on the hedged purchase commitment, are also marked-to-market through earnings with no impact on a net basis.
(5) There were no gains or losses resulting from the discontinuance of cash flow hedges during the fiscal year.
(6) There were no gains or losses recognized as a result of a hedged firm commitment no longer qualifying as a fair value hedge during the fiscal year.
55
NOTE N
Pursuant to the provisions of ASC 820, the Company’s financial assets and liabilities carried at fair value on a recurring basis in the consolidated financial statements as of October 27, 2013, and October 28, 2012, and their level within the fair value hierarchy, are presented in the table below.
| | | Fair Value Measurements at October 27, 2013 | |
(in thousands) | | | Fair Value at
October 27,
2013 | | Quoted Prices in
Active Markets
for Identical
Assets (Level 1) | | Significant Other
Observable
Inputs (Level 2) | | Significant
Unobservable
Inputs (Level 3) | |
Assets at Fair Value: | | | | | | | | | | |
Cash and cash equivalents(1) | | | $434,014 | | $434,014 | | $ – | | $ – | |
Other trading securities(2) | | | 114,300 | | 38,489 | | 75,811 | | – | |
Commodity derivatives(3) | | | 6,086 | | 6,086 | | – | | – | |
Total Assets at Fair value | | | $554,400 | | $478,589 | | $75,811 | | $ – | |
Liabilities at Fair Value: | | | | | | | | | | |
Deferred compensation(2) | | | $ 52,771 | | $ 21,257 | | $31,514 | | $ – | |
Total Liabilities at Fair value | | | $ 52,771 | | $ 21,257 | | $31,514 | | $ – | |
| | | Fair value Measurements at October 28, 2012 | |
(in thousands) | | | Fair value at
October 28,
2012 | | Quoted Prices in
Active Markets
for Identical
Assets (Level 1) | | Significant Other
Observable
Inputs (Level 2) | | Significant
Unobservable
Inputs (Level 3) | |
Assets at Fair Value: | | | | | | | | | | |
Cash and cash equivalents(1) | | | $682,388 | | $682,388 | | $ – | | $ – | |
Short-term marketable securities(4) | | | 77,387 | | 2,349 | | 75,038 | | – | |
Other trading securities(2) | | | 109,676 | | 36,305 | | 73,371 | | – | |
Commodity derivatives(3) | | | 3,884 | | 3,884 | | – | | – | |
Total Assets at Fair value | | | $873,335 | | $724,926 | | $ 148,409 | | $ – | |
Liabilities at Fair Value: | | | | | | | | | | |
Deferred compensation(2) | | | $ 47,953 | | $ 16,866 | | $ 31,087 | | $ – | |
Total Liabilities at Fair value | | | $ 47,953 | | $ 16,866 | | $ 31,087 | | $ – | |
The following methods and assumptions were used to estimate the fair value of the financial assets and liabilities above:
(1) The Company’s cash equivalents consist primarily of money market funds rated AAA, and other highly liquid investment accounts. As these investments have a maturity date of three months or less, the carrying value approximates fair value.
(2) The Company holds trading securities as part of a rabbi trust to fund certain supplemental executive retirement plans and deferred income plans. The rabbi trust is included in other assets on the Consolidated Statements of Financial Position and is valued based on the underlying fair value of each fund held by the trust. A majority of the funds held related to the supplemental executive retirement plans have been invested in fixed income funds managed by a third party. The declared rate on these funds is set based on a formula using the yield of the general account investment portfolio that supports the fund, adjusted for expenses and other charges. The rate is guaranteed for one year at issue, and may be reset annually on the policy anniversary, subject to a guaranteed minimum rate. As the value is based on adjusted market rates, and the fixed rate is only reset on an annual basis, these funds are classified as Level 2. The remaining funds held are also managed by a third party, and include equity securities, money market accounts, bond funds, or other portfolios for which there is an active quoted market. Therefore these securities are classified as Level 1. The related deferred compensation liabilities are included in other long-term liabilities on the Consolidated Statements of Financial Position and are valued based on the underlying investment selections held in each participant’s account. Investment options generally mirror those funds held by the rabbi trust, for which there is an active quoted market. Therefore these investment balances are classified as Level 1. The Company also offers a fixed rate investment option to participants. The rate earned on these investments is adjusted annually based on a specified percentage of the I.R.S. Applicable Federal Rates in effect and therefore these balances are classified as Level 2.
(3) The Company’s commodity derivatives represent futures contracts used in its hedging or other programs to offset price fluctuations associated with purchases of corn and soybean meal, and to minimize the price risk assumed when forward priced contracts are offered to the Company’s commodity suppliers. The Company’s futures contracts for corn and soybean meal are traded on the Chicago Board of Trade, while futures contracts for lean hogs are traded on the Chicago Mercantile Exchange. These are active markets with quoted prices available and therefore these contracts are classified as Level 1. All derivatives are reviewed for potential credit risk and risk of nonperformance. The Company nets the derivative assets and liabilities for each of its hedging programs, including cash collateral, when a master netting arrangement exists between the Company and the counterparty to the derivative contract. The net balance for each program is included in other current assets or accounts payable, as appropriate, in the Consolidated Statements of Financial Position. As of October 27, 2013, the Company has recognized the right to reclaim cash collateral of $35.7 million from various counterparties. As of October 28, 2012, the Company had recognized the right to reclaim cash collateral of $27.5 million from, and the obligation to return cash collateral of $31.1 million to, various counterparties.
56
(4) During fiscal 2012 and 2013, the Company held trading securities as part of a portfolio maintained to generate investment income and to provide cash for operations of the Company, if necessary. The portfolio was managed by a third party who was responsible for daily trading activities, and all assets within the portfolio were highly liquid. The cash, U.S. government securities, and highly rated money market funds held by the portfolio were classified as Level 1. The investment portfolio also included corporate bonds, international government securities, commercial paper, agency securities, mortgage-backed securities, and other asset-backed securities for which there is an active, quoted market. Market prices were obtained from a variety of industry standard providers, large financial institutions, and other third-party sources to calculate a representative daily market value, and therefore, these securities were classified as Level 2. These securities were liquidated in the first quarter of fiscal 2013.
The Company’s financial assets and liabilities also include accounts receivable, accounts payable, and other liabilities, for which carrying value approximates fair value. The Company does not carry its long-term debt at fair value in its Consolidated Statements of Financial Position. Based on borrowing rates available to the Company for long-term financing with similar terms and average maturities, the fair value of long-term debt, utilizing discounted cash flows (Level 2), was $261.7 million as of October 27, 2013, and $283.6 million as of October 28, 2012.
In accordance with the provisions of ASC 820, the Company also measures certain nonfinancial assets and liabilities at fair value that are recognized or disclosed on a nonrecurring basis (e.g. goodwill, intangible assets, and property, plant and equipment). During fiscal years 2013, 2012, and 2011, there were no material remeasurements of assets or liabilities at fair value on a nonrecurring basis subsequent to their initial recognition.
NOTE O
The Company develops, processes, and distributes a wide array of food products in a variety of markets. The Company reports its results in the following five segments: Grocery Products, Refrigerated Foods, Jennie-O Turkey Store, Specialty Foods, and International & Other.
The Grocery Products segment consists primarily of the processing, marketing, and sale of shelf-stable food products sold predominantly in the retail market. This segment also includes the results from the Company’s MegaMex joint venture.
The Refrigerated Foods segment includes the Hormel Refrigerated operating segment and the Affiliated Business Units. This segment consists primarily of the processing, marketing, and sale of branded and unbranded pork and beef products for retail, foodservice, and fresh product customers.
The Affiliated Business Units include the Farmer John, Burke Corporation, Dan’s Prize, Saag’s Products, Inc., and Precept Foods businesses. Precept Foods, LLC, is a 50.01 percent owned joint venture.
The Jennie-O Turkey Store segment consists primarily of the processing, marketing, and sale of branded and unbranded turkey products for retail, foodservice, and fresh product customers.
The Specialty Foods segment includes the Diamond Crystal Brands, Century Foods International, and Hormel Specialty Products operating segments. This segment consists of the packaging and sale of private label shelf stable products, nutritional products, sugar, and condiments to industrial, retail, and foodservice customers. This segment also includes the processing, marketing, and sale of nutritional food products and supplements to hospitals, nursing homes, and other marketers of nutritional products.
The International & Other segment includes the Hormel Foods International operating segment, which manufactures, markets, and sells Company products internationally. This segment also includes the results from the Company’s international joint ventures and miscellaneous corporate sales. This segment was previously the All Other segment, and was renamed in the second quarter of fiscal 2013, with no change in the composition of the segment.
Intersegment sales are recorded at prices that approximate cost and are eliminated in the Consolidated Statements of Operations. The Company does not allocate investment income, interest expense, and interest income to its segments when measuring performance. The Company also retains various other income and unallocated expenses at corporate. Equity in earnings of affiliates is included in segment operating profit; however, earnings attributable to the Company’s noncontrolling interests are excluded. These items are included below as net interest and investment expense (income), general corporate expense, and noncontrolling interest when reconciling to earnings before income taxes.
Sales and operating profits for each of the Company’s reportable segments and reconciliation to earnings before income taxes are set forth below. The Company is an integrated enterprise, characterized by substantial intersegment cooperation, cost allocations, and sharing of assets. Therefore, the Company does not represent that these segments, if operated independently, would report the operating profit and other financial information shown below.
(in thousands) | | | 2013 | | | 2012 | | | 2011 | |
Sales to Unaffiliated | | | | | | | | | | |
Customers | | | | | | | | | | |
Grocery Products | | | $1,517,557 | | | $1,170,871 | | | $1,064,558 | |
Refrigerated Foods | | | 4,251,515 | | | 4,222,752 | | | 4,189,224 | |
Jennie-O Turkey Store | | | 1,601,868 | | | 1,549,227 | | | 1,467,222 | |
Specialty Foods | | | 932,533 | | | 924,472 | | | 835,584 | |
International & Other | | | 448,181 | | | 363,348 | | | 338,501 | |
Total | | | $8,751,654 | | | $8,230,670 | | | $7,895,089 | |
Intersegment Sales | | | | | | | | | | |
Grocery Products | | | $ – | | | $ – | | | $ – | |
Refrigerated Foods | | | 17,359 | | | 12,144 | | | 14,101 | |
Jennie-O Turkey Store | | | 123,420 | | | 125,575 | | | 124,868 | |
Specialty Foods | | | 108 | | | 133 | | | 127 | |
International & Other | | | – | | | – | | | – | |
Total | | | 140,887 | | | 137,852 | | | 139,096 | |
Intersegment elimination | | | (140,887 | ) | | (137,852 | ) | | (139,096 | ) |
Total | | | $ – | | | $ – | | | $ – | |
Net Sales | | | | | | | | | | |
Grocery Products | | | $1,517,557 | | | $1,170,871 | | | $1,064,558 | |
Refrigerated Foods | | | 4,268,874 | | | 4,234,896 | | | 4,203,325 | |
Jennie-O Turkey Store | | | 1,725,288 | | | 1,674,802 | | | 1,592,090 | |
Specialty Foods | | | 932,641 | | | 924,605 | | | 835,711 | |
International & Other | | | 448,181 | | | 363,348 | | | 338,501 | |
Intersegment elimination | | | (140,887 | ) | | (137,852 | ) | | (139,096 | ) |
Total | | | $8,751,654 | | | $8,230,670 | | | $7,895,089 | |
Segment Operating Profit | | | | | | | | | | |
Grocery Products | | | $ 213,646 | | | $ 181,251 | | | $ 162,556 | |
Refrigerated Foods | | | 232,692 | | | 228,665 | | | 292,624 | |
Jennie-O Turkey Store | | | 222,117 | | | 238,298 | | | 204,940 | |
Specialty Foods | | | 88,873 | | | 83,089 | | | 76,905 | |
International & Other | | | 71,490 | | | 49,889 | | | 36,250 | |
Total segment operating profit | | | $ 828,818 | | | $ 781,192 | | | $ 773,275 | |
Net interest and investment expense (income) | | | 7,482 | | | 6,339 | | | 23,448 | |
General corporate expense | | | 26,694 | | | 21,429 | | | 35,992 | |
Noncontrolling interest | | | 3,865 | | | 4,911 | | | 5,001 | |
Earnings before income taxes | | | $ 798,507 | | | $ 758,335 | | | $ 718,836 | |
(in thousands) | | | 2013 | | | 2012 | | | 2011 | |
Assets | | | | | | | | | | |
Grocery Products | | | $1,237,405 | | | $ 683,601 | | | $ 670,398 | |
Refrigerated Foods | | | 1,218,418 | | | 1,171,161 | | | 1,177,588 | |
Jennie-O Turkey Store | | | 819,343 | | | 857,682 | | | 805,459 | |
Specialty Foods | | | 469,599 | | | 506,237 | | | 475,289 | |
International & Other | | | 361,038 | | | 224,847 | | | 196,957 | |
Corporate | | | 810,077 | | | 1,120,438 | | | 918,700 | |
Total | | | $4,915,880 | | | $4,563,966 | | | $4,244,391 | |
Additions to Property, | | | | | | | | | | |
Plant and Equipment | | | | | | | | | | |
Grocery Products | | | $ 10,100 | | | $ 17,966 | | | $ 10,910 | |
Refrigerated Foods | | | 58,523 | | | 67,003 | | | 45,244 | |
Jennie-O Turkey Store | | | 22,863 | | | 33,594 | | | 29,507 | |
Specialty Foods | | | 3,606 | | | 3,779 | | | 3,470 | |
International & Other | | | 2,973 | | | 2,794 | | | 1,145 | |
Corporate | | | 8,697 | | | 7,167 | | | 6,635 | |
Total | | | $ 106,762 | | | $ 132,303 | | | $ 96,911 | |
Depreciation and | | | | | | | | | | |
Amortization | | | | | | | | | | |
Grocery Products | | | $ 22,912 | | | $ 15,870 | | | $ 15,597 | |
Refrigerated Foods | | | 57,879 | | | 60,229 | | | 65,689 | |
Jennie-O Turkey Store | | | 26,921 | | | 26,144 | | | 25,379 | |
Specialty Foods | | | 9,232 | | | 9,871 | | | 9,817 | |
International & Other | | | 1,906 | | | 1,437 | | | 1,387 | |
Corporate | | | 6,000 | | | 5,943 | | | 6,296 | |
Total | | | $ 124,850 | | | $ 119,494 | | | $ 124,165 | |
The Company’s products primarily consist of meat and other food products. Perishable meat includes fresh meats, refrigerated meal solutions, sausages, hams, wieners, and bacon (excluding JOTS products). The Poultry category is composed primarily of JOTS products. Shelf-stable includes canned luncheon meats, shelf-stable microwaveable meals, stews, chilies, hash, meat spreads, flour and corn tortillas, salsas, tortilla chips, peanut butter, and other items that do not require refrigeration. The Other category primarily consists of nutritional food products and supplements, sugar and sugar substitutes, dessert and drink mixes, and industrial gelatin products. The percentages of total revenues contributed by classes of similar products for the last three fiscal years are as follows:
| | | Fiscal Year Ended | |
| | | October 27,
2013 | | | October 28,
2012 | | | October 30,
2011 | |
Perishable meat | | | 50.9% | | | 53.5% | | | 55.1% | |
Shelf-stable | | | 21.4 | | | 17.6 | | | 16.8 | |
Poultry | | | 18.8 | | | 19.3 | | | 19.1 | |
Other | | | 8.9 | | | 9.6 | | | 9.0 | |
| | | 100.0% | | | 100.0% | | | 100.0% | |
Revenues from external customers are classified as domestic or foreign based on the final customer destination where title passes. No individual foreign country is material to the consolidated results. Additionally, the Company’s long-lived assets located in foreign countries are not significant. Total revenues attributed to the U.S. and all foreign countries in total for the last three fiscal years are as follows:
| | | Fiscal Year Ended | |
| | | October 27, | | | October 28, | | | October 30, | |
(in thousands) | | | 2013 | | | 2012 | | | 2011 | |
United States | | | $8,193,730 | | | $7,739,826 | | | $7,431,798 | |
Foreign | | | 557,924 | | | 490,844 | | | 463,291 | |
| | | $8,751,654 | | | $8,230,670 | | | $7,895,089 | |
In fiscal 2013, sales to Wal-Mart Stores, Inc. (Wal-Mart) represented $1.33 billion or 13.9 percent of the Company’s consolidated revenues (measured as gross sales less returns and allowances). Wal-Mart is a customer for all five segments of the Company.
NOTE P
QUARTERLY RESULTS OF OPERATIONS (UNAUDITED)
The following tabulations reflect the unaudited quarterly results of operations for the years ended October 27, 2013, and October 28, 2012.
(in thousands, except per share data) | | | Net Sales | | Gross
Profit | | Net
Earnings | | Net Earnings
Attributable to
Hormel Foods
Corporation(1) | | Basic
Earnings
Per Share(2) | | Diluted
Earnings
Per Share(2) | |
2013 | | | | | | | | | | | | | | |
First quarter | | | $2,116,241 | | $344,193 | | $131,045 | | $129,716 | | $0.49 | | $0.48 | |
Second quarter | | | 2,152,686 | | 352,801 | | 126,641 | | 125,520 | | 0.47 | | 0.46 | |
Third quarter | | | 2,159,525 | | 330,306 | | 113,905 | | 113,635 | | 0.43 | | 0.42 | |
Fourth quarter | | | 2,323,202 | | 385,516 | | 158,485 | | 157,340 | | 0.60 | | 0.58 | |
2012 | | | | | | | | | | | | | | |
First quarter | | | $2,039,439 | | $337,409 | | $129,333 | | $128,395 | | $0.49 | | $0.48 | |
Second quarter | | | 2,012,859 | | 335,607 | | 128,935 | | 127,887 | | 0.49 | | 0.48 | |
Third quarter | | | 2,008,188 | | 307,056 | | 112,407 | | 111,167 | | 0.42 | | 0.41 | |
Fourth quarter | | | 2,170,184 | | 351,779 | | 134,286 | | 132,601 | | 0.50 | | 0.49 | |
(1) Excludes net earnings attributable to the Company’s noncontrolling interests.
(2) Quarterly amounts are independently computed and may not add to the annual amounts.
59
Ernst & Young LLP
220 South Sixth Street, Ste. 1400
Minneapolis, MN 55402-4509

| Hormel Foods Corporation’s common stock is traded on the New York Stock Exchange under the symbol HRL. The CUSIP number is 440452100. |
There are approximately 11,500 record shareholders and 41,000 shareholders whose shares are held in street name by brokerage firms and financial institutions.
The high and low prices of the Company’s common stock and the dividends per share declared for each fiscal quarter of 2013 and 2012, respectively, are shown below:
2013 | | High | | Low | | Dividend | |
First Quarter | | $35.38 | | $29.32 | | $0.17 | |
Second Quarter | | 42.09 | | 34.60 | | 0.17 | |
Third Quarter | | 43.17 | | 37.46 | | 0.17 | |
Fourth Quarter | | 44.22 | | 40.60 | | 0.17 | |
2012 | | High | | Low | | Dividend | |
First Quarter | | $30.33 | | $28.17 | | $0.15 | |
Second Quarter | | 29.65 | | 27.98 | | 0.15 | |
Third Quarter | | 30.70 | | 27.70 | | 0.15 | |
Fourth Quarter | | 29.85 | | 27.28 | | 0.15 | |
TRANSFER AGENT AND REGISTRAR
Wells Fargo Shareowner Services
1110 Centre Pointe Curve, Suite 101
MAC N9173-010
Mendota Heights, MN 55120
www.shareowneronline.com
For the convenience of shareholders, a toll-free number (1-877-536-3559) can be used whenever questions arise regarding changes in registered ownership, lost or stolen certificates, address changes, or other matters pertaining to the transfer of stock or shareholder records. When requesting information, shareholders must provide their Wells Fargo account number or tax identification number, the name(s) in which their stock is registered, and their record address.
The company participates in the Direct Registration Profile Modification System (DRPMS). Transfers or issuances of shares are now issued in book-entry form, unless you specifically request a stock certificate. A statement will be delivered to you reflecting any transactions processed in your account.
The transfer agent makes shareholder account data available to shareholders of record via the Internet. This service allows shareholders to view various account details, such as certificate information, dividend payment history, and dividend reinvestment plan records, over a secure Internet connection with the required entry of an account number and authentication ID. Information is available 24 hours per day, 7 days a week. If you are interested, you may use the website www.shareowneronline.com and access “Sign Up Now!” to arrange for setup.
DIVIDEND REINVESTMENT PLAN
Hormel Foods Corporation’s Dividend Reinvestment Plan, available to record shareholders, allows for full dividend reinvestment and voluntary cash purchases with brokerage commissions or other service fees paid by the Company. Automatic debit for cash contribution is also available. This is a convenient method to have money automatically withdrawn each month from a checking or savings account and invested in your Dividend Reinvestment Plan account. To enroll in the plan or obtain additional information, contact Wells Fargo Shareowner Services, using the address or telephone number provided, listed previously in this section as Company transfer agent and registrar. Enrollment in the plan is also available on the Internet at www.shareowneronline.com.
An optional direct dividend deposit service offers shareholders a convenient method of having quarterly dividend payments electronically deposited into their personal checking or savings account. The dividend payment is made in the account each payment date, providing shareholders with immediate use of their money. For information about the service and how to participate, contact Wells Fargo Shareowner Services, transfer agent. You may also activate this feature on the Internet at www.shareowneronline.com.
The declaration of dividends and all dates related to the declaration of dividends are subject to the judgment and discretion of the Board of Directors of Hormel Foods Corporation. Quarterly dividends are typically paid on the 15th of February, May, August, and November. Postal delays may cause receipt dates to vary.
Copies of the Company’s Form 10-K (annual report) and Form 10-Q (quarterly report) to the Securities and Exchange Commission (SEC), proxy statement, all news releases and other corporate literature are available free upon request by calling (507) 437-5345 or by accessing the information on the Internet at www.hormelfoods.com. Notice and access to the Company’s Annual Report is mailed approximately one month before the Annual Meeting. The Annual Report can be viewed at the website named above or a hard copy will be available free upon request via email, mail, or by calling (507) 437-5571.
The Annual Meeting of Shareholders will be held on Tuesday, January 28, 2014 in the Richard L. Knowlton Auditorium at Austin (Minn.) High School. The meeting will convene at 8:00 p.m. (CT).
QUESTIONS ABOUT HORMEL FOODS
Shareholder Inquiries
(507) 437-5944
Analyst/Investor Inquiries
(507) 437-5248
Media Inquiries
(507) 437-5345
Inquiries regarding products of Hormel Foods Corporation should be addressed:
Consumer Response
Hormel Foods Corporation
1 Hormel Place
Austin, MN 55912-3680
or call 1-800-523-4635
References in italic within this report, excluding titles of periodicals on page 3 and 12, represent valuable trademarks owned or licensed by Hormel Foods, LLC or subsidiaries of Hormel Foods Corporation.
“Country Crock” is a registered trademark of the Unilever Group and is used under license. All rights reserved. ©Unilever Group. All rights reserved.
Stock Performance Chart
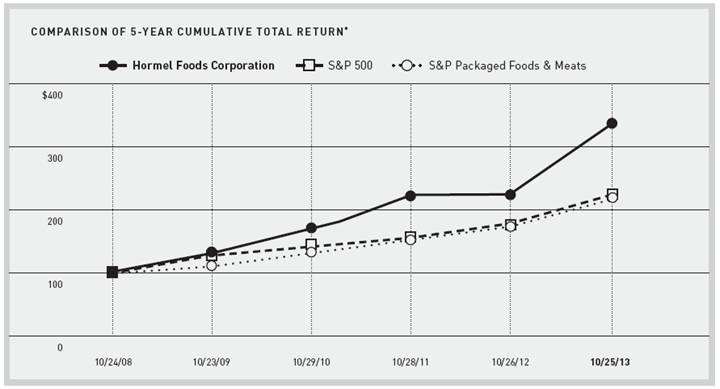
*$100 invested on 10/24/08 in stock or index – including reinvestment of dividends.
61
Corporate Officers
Jeffrey M. Ettinger* Chairman of the Board, President and Chief Executive Officer Jody H. Feragen* Executive Vice President and Chief Financial Officer Steven G. Binder Executive Vice President and President, Hormel Business Units Deanna T. Brady Group Vice President, Foodservice (effective 10/28/2013) Thomas R. Day Group Vice President, Refrigerated Foods (effective 10/28/2013) Donald H. Kremin Group Vice President, Specialty Foods Glenn R. Leitch Group Vice President; President, Jennie-O Turkey Store, Inc. James P. Snee Group Vice President; President, Hormel Foods International
Corporation James M. Splinter Group Vice President,
Grocery Products Larry L. Vorpahl Group Vice President; President, Consumer Products Sales William F. Snyder Senior Vice President, Supply Chain D. Scott Aakre Vice President, Corporate Innovation and New Product Development | Jeffrey R. Baker Vice President, Foodservice Marketing Mark A. Coffey Vice President, Affiliated Business Units Refrigerated Foods Patrick J. Connor Vice President; Senior Vice President, Sales, Consumer Products Sales Julie H. Craven Vice President, Corporate Communications Michael L. Devine Vice President, Grocery Products Operations Bryan D. Farnsworth Vice President,
Quality Management Roland G. Gentzler Vice President, Finance
and Treasurer Fred D. Halvin Vice President,
Corporate Development Brian D. Johnson Vice President and
Corporate Secretary David P. Juhlke Vice President,
Human Resources Lori J. Marco Vice President, External Affairs
and General Counsel Luis G. Marconi Vice President, Grocery Products Marketing | Phillip L. Minerich, Ph.D. Vice President, Research and Development
(retires effective 12/31/2013) Kurt F. Mueller Vice President; Senior Vice President, Sales,
Consumer Products Sales Kevin L. Myers, Ph.D. Vice President, Research and Development
(effective 10/28/2013) Jeff A. Nuytten Vice President, Refrigerated Foods Operations Mark J. Ourada Vice President, Foodservice Sales
(effective 10/28/2013) James R. Schroeder Vice President,
Engineering Patrick J. Schwab Vice President; Senior Vice President, Sales,
Consumer Products Sales James N. Sheehan Vice President and Controller Joe C. Swedberg Vice President,
Legislative Affairs Steven J. Venenga Vice President, Meat Products Marketing James T. Anderson Assistant Controller * Director |
62