| AGA Financial Forum NYSE:CNP www.CenterPointEnergy.com Scottsdale, Arizona May 8, 2006 |
| This presentation contains statements concerning our expectations, beliefs, plans, objectives, goals, strategies, future events or performance and underlying assumptions and other statements that are not historical facts. These statements are "forward-looking statements" within the meaning of the Private Securities Litigation Reform Act of 1995. Actual results may differ materially from those expressed or implied by these statements. You can generally identify our forward-looking statements by the words "anticipate," "believe," "continue," "could," "estimate," "expect," "forecast," "goal," "intend," "may," "objective," "plan," "potential," "predict," "projection," "should," "will," or other similar words. We have based our forward-looking statements on our management's beliefs and assumptions based on information currently available to our management at the time the statements are made. We caution you that assumptions, beliefs, expectations, intentions, and projections about future events may and often do vary materially from actual results. Therefore, we cannot assure you that actual results will not differ materially from those expressed or implied by our forward-looking statements. Some of the factors that could cause actual results to differ from those expressed or implied by our forward-looking statements include the timing and amount of our recovery of the true-up components, including, in particular, the results of appeals to the courts of determination on rulings obtained to date, the timing and impact of future regulatory, legislative and IRS decisions, financial market conditions and other factors described in CenterPoint Energy, Inc.'s Form 10-K for the period ended December 31, 2005, under "Risk Factors" and under "Management's Discussion and Analysis of Financial Condition and Results of Operations - Certain Factors Affecting Future Earnings" and in CenterPoint Energy, Inc.'s Form 10-Q for the quarterly period ended March 31, 2006, under "Management's Discussion and Analysis of Financial Condition and Results of Operations of CenterPoint Energy Inc. and Subsidiaries - Certain Factors Affecting Future Earnings". You should not place undue reliance on forward-looking statements. Each forward-looking statement speaks only as of the date of this presentation, and we undertake no obligation to publicly update or revise any forward-looking statements. Cautionary Statement Regarding Forward-Looking Information |
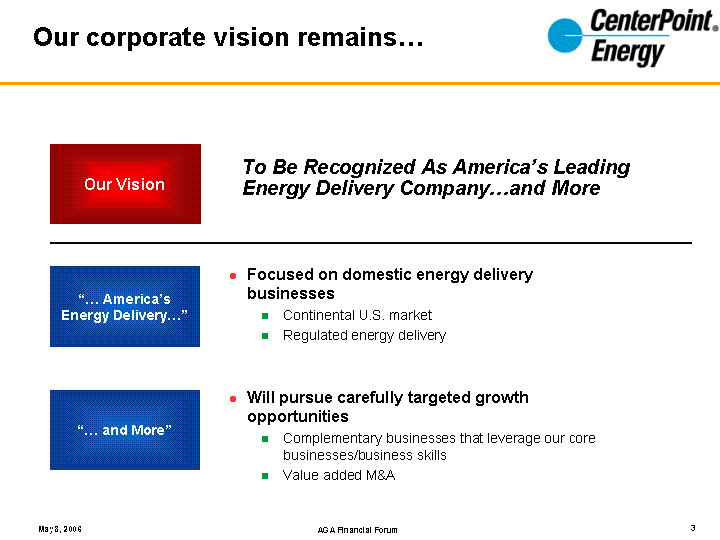
| To Be Recognized As America's Leading Energy Delivery Company...and More Focused on domestic energy delivery businesses Continental U.S. market Regulated energy delivery Will pursue carefully targeted growth opportunities Complementary businesses that leverage our core businesses/business skills Value added M&A Our Vision Our corporate vision remains... "... America's Energy Delivery..." "... and More" |
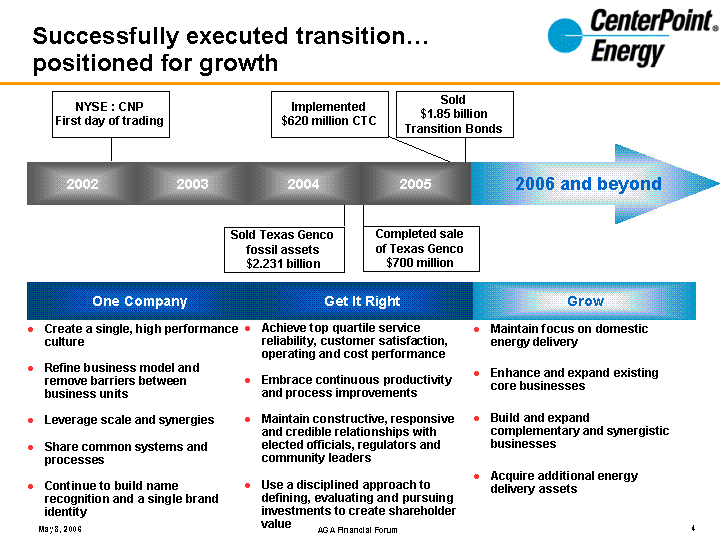
| Successfully executed transition... positioned for growth 2005 2004 2003 2002 2006 and beyond One Company Get It Right Grow Implemented $620 million CTC Sold $1.85 billion Transition Bonds NYSE : CNP First day of trading Sold Texas Genco fossil assets $2.231 billion Completed sale of Texas Genco $700 million Achieve top quartile service reliability, customer satisfaction, operating and cost performance Embrace continuous productivity and process improvements Maintain constructive, responsive and credible relationships with elected officials, regulators and community leaders Use a disciplined approach to defining, evaluating and pursuing investments to create shareholder value Create a single, high performance culture Refine business model and remove barriers between business units Leverage scale and synergies Share common systems and processes Continue to build name recognition and a single brand identity Maintain focus on domestic energy delivery Enhance and expand existing core businesses Build and expand complementary and synergistic businesses Acquire additional energy delivery assets |
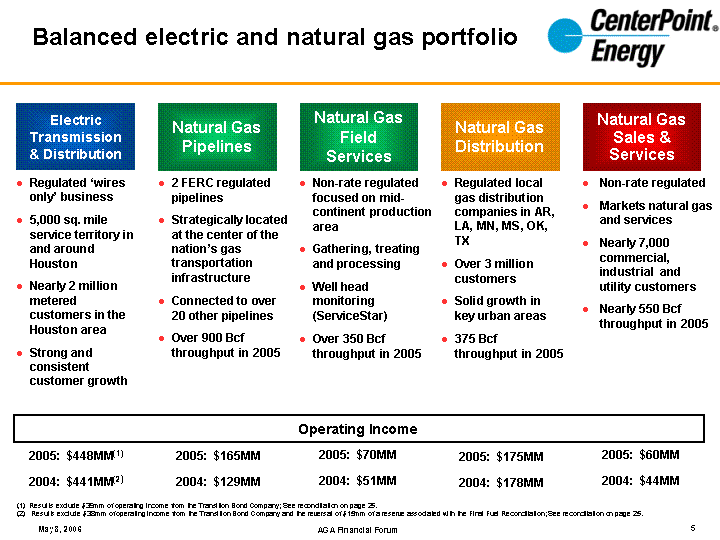
| Natural Gas Distribution Electric Transmission & Distribution Regulated local gas distribution companies in AR, LA, MN, MS, OK, TX Over 3 million customers Solid growth in key urban areas 375 Bcf throughput in 2005 (1) Results exclude $39mm of operating income from the Transition Bond Company; See reconciliation on page 25. (2) Results exclude $38mm of operating income from the Transition Bond Company and the reversal of $15mm of a reserve associated with the Final Fuel Reconciliation; See reconciliation on page 25. Regulated 'wires only' business 5,000 sq. mile service territory in and around Houston Nearly 2 million metered customers in the Houston area Strong and consistent customer growth Non-rate regulated Markets natural gas and services Nearly 7,000 commercial, industrial and utility customers Nearly 550 Bcf throughput in 2005 Balanced electric and natural gas portfolio Natural Gas Pipelines 2 FERC regulated pipelines Strategically located at the center of the nation's gas transportation infrastructure Connected to over 20 other pipelines Over 900 Bcf throughput in 2005 Natural Gas Field Services Operating Income Non-rate regulated focused on mid- continent production area Gathering, treating and processing Well head monitoring (ServiceStar) Over 350 Bcf throughput in 2005 2005: $448MM(1) 2004: $441MM(2) 2005: $175MM 2004: $178MM 2005: $165MM 2004: $129MM 2005: $70MM 2004: $51MM 2005: $60MM 2004: $44MM Natural Gas Sales & Services |
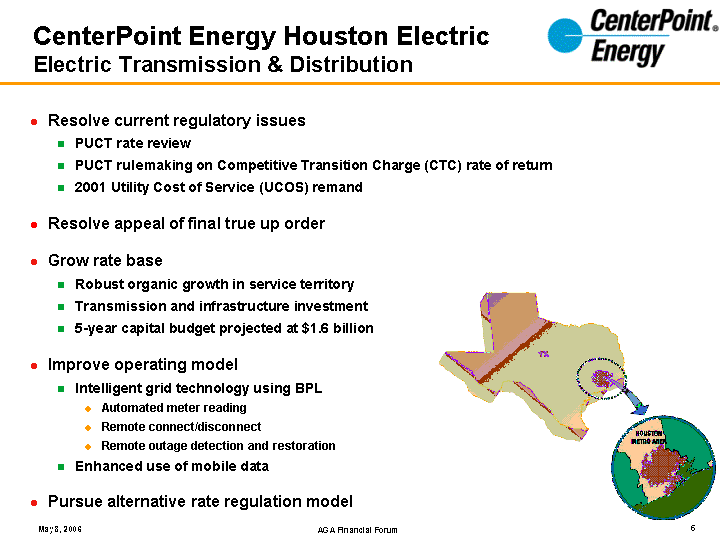
| CenterPoint Energy Houston Electric Electric Transmission & Distribution Resolve current regulatory issues PUCT rate review PUCT rulemaking on Competitive Transition Charge (CTC) rate of return 2001 Utility Cost of Service (UCOS) remand Resolve appeal of final true up order Grow rate base Robust organic growth in service territory Transmission and infrastructure investment 5-year capital budget projected at $1.6 billion Improve operating model Intelligent grid technology using BPL Automated meter reading Remote connect/disconnect Remote outage detection and restoration Enhanced use of mobile data Pursue alternative rate regulation model |
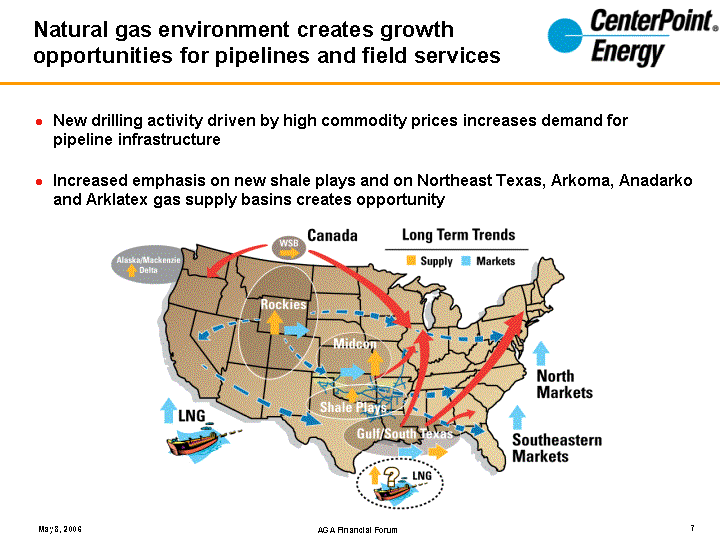
| New drilling activity driven by high commodity prices increases demand for pipeline infrastructure Increased emphasis on new shale plays and on Northeast Texas, Arkoma, Anadarko and Arklatex gas supply basins creates opportunity Natural gas environment creates growth opportunities for pipelines and field services |
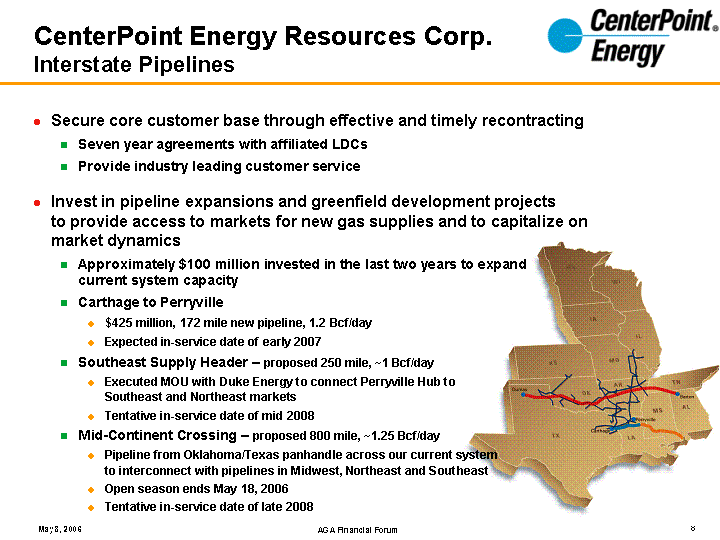
| CenterPoint Energy Resources Corp. Interstate Pipelines Secure core customer base through effective and timely recontracting Seven year agreements with affiliated LDCs Provide industry leading customer service Invest in pipeline expansions and greenfield development projects to provide access to markets for new gas supplies and to capitalize on market dynamics Approximately $100 million invested in the last two years to expand current system capacity Carthage to Perryville $425 million, 172 mile new pipeline, 1.2 Bcf/day Expected in-service date of early 2007 Southeast Supply Header - proposed 250 mile, ~1 Bcf/day Executed MOU with Duke Energy to connect Perryville Hub to Southeast and Northeast markets Tentative in-service date of mid 2008 Mid-Continent Crossing - proposed 800 mile, ~1.25 Bcf/day Pipeline from Oklahoma/Texas panhandle across our current system to interconnect with pipelines in Midwest, Northeast and Southeast Open season ends May 18, 2006 Tentative in-service date of late 2008 |
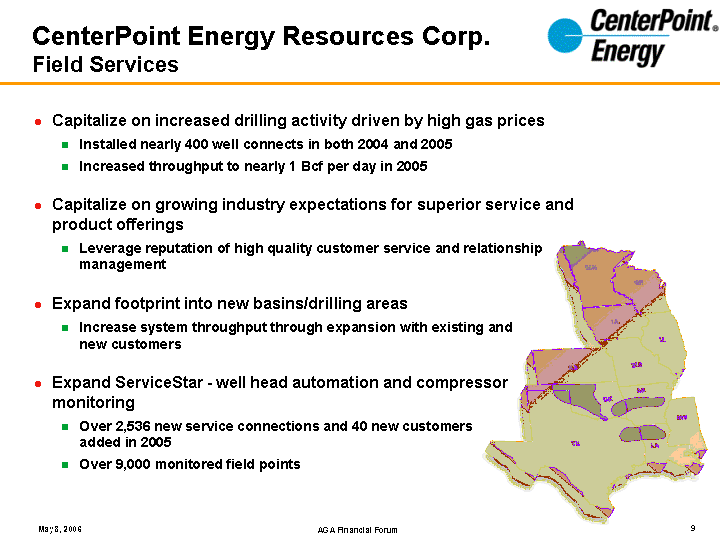
| CenterPoint Energy Resources Corp. Field Services Capitalize on increased drilling activity driven by high gas prices Installed nearly 400 well connects in both 2004 and 2005 Increased throughput to nearly 1 Bcf per day in 2005 Capitalize on growing industry expectations for superior service and product offerings Leverage reputation of high quality customer service and relationship management Expand footprint into new basins/drilling areas Increase system throughput through expansion with existing and new customers Expand ServiceStar - well head automation and compressor monitoring Over 2,536 new service connections and 40 new customers added in 2005 Over 9,000 monitored field points |
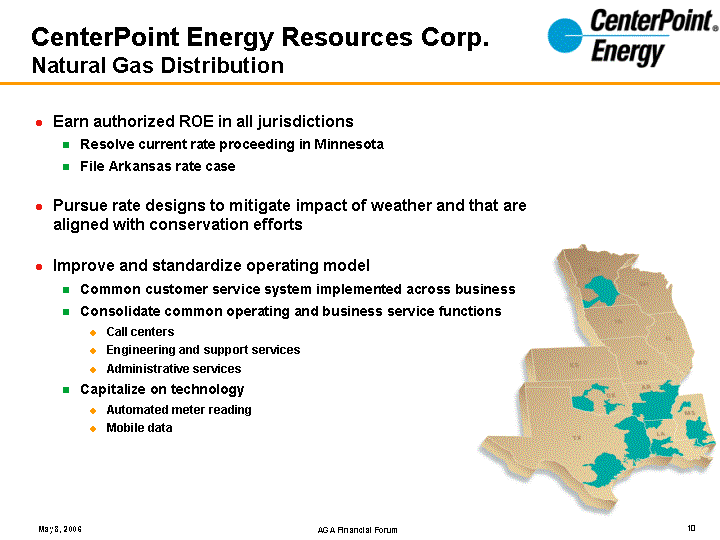
| CenterPoint Energy Resources Corp. Natural Gas Distribution Earn authorized ROE in all jurisdictions Resolve current rate proceeding in Minnesota File Arkansas rate case Pursue rate designs to mitigate impact of weather and that are aligned with conservation efforts Improve and standardize operating model Common customer service system implemented across business Consolidate common operating and business service functions Call centers Engineering and support services Administrative services Capitalize on technology Automated meter reading Mobile data |
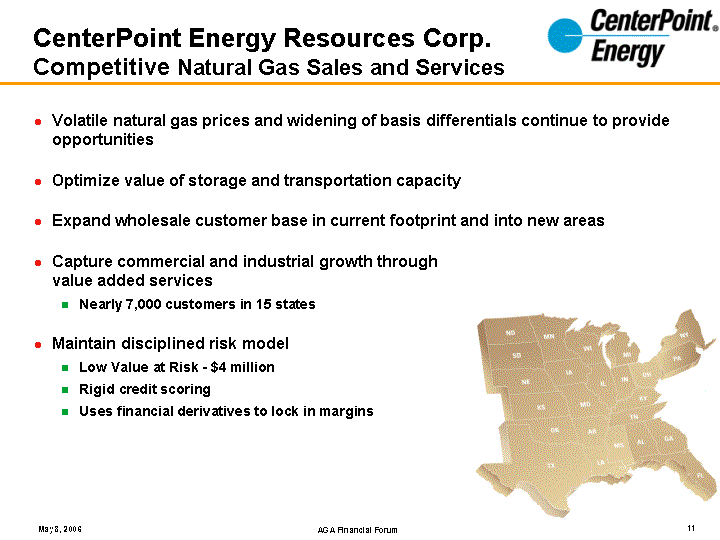
| Volatile natural gas prices and widening of basis differentials continue to provide opportunities Optimize value of storage and transportation capacity Expand wholesale customer base in current footprint and into new areas Capture commercial and industrial growth through value added services Nearly 7,000 customers in 15 states Maintain disciplined risk model Low Value at Risk - $4 million Rigid credit scoring Uses financial derivatives to lock in margins CenterPoint Energy Resources Corp. Competitive Natural Gas Sales and Services |
| First Quarter 2006 Results |
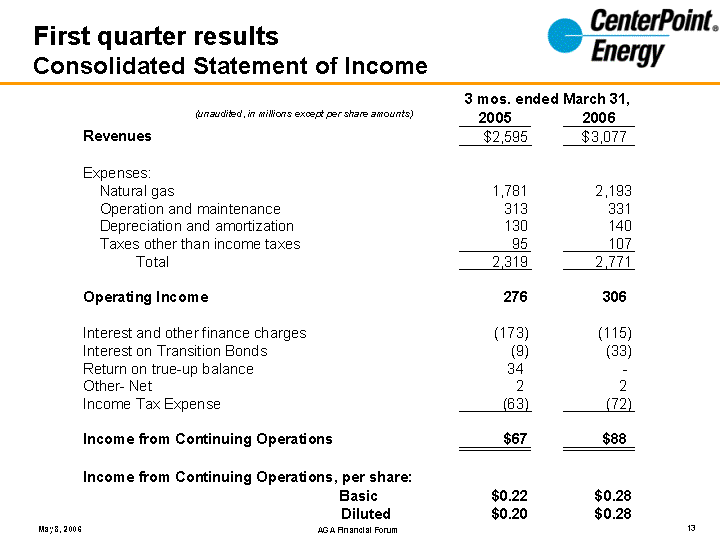
| First quarter results Consolidated Statement of Income (unaudited, in millions except per share amounts) |
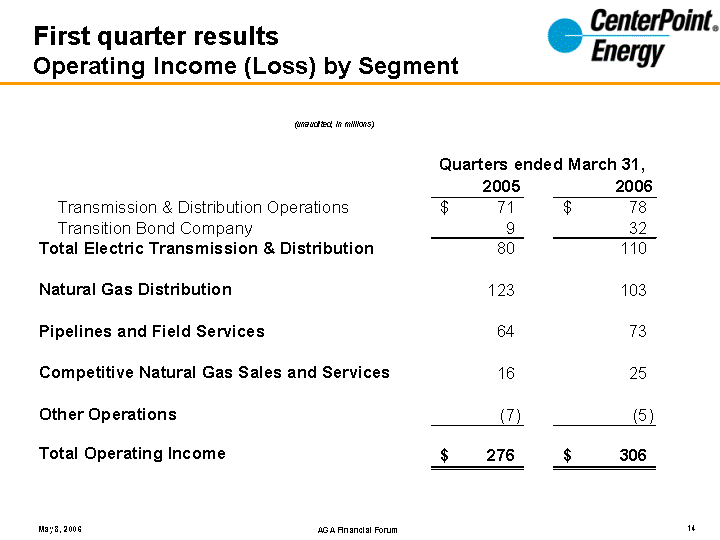
| (unaudited, in millions) First quarter results Operating Income (Loss) by Segment |

| Operating Income by business (in millions) * Operating income is adjusted to exclude ECOM, the Transition Bond Company and the Final Fuel Reconciliation components of the Electric Transmission & Distribution utility's results (see reconciliation on page 25). Operating income does not include an extraordinary loss recorded as a result of actions taken by the Texas PUC in the stranded cost true-up case. * $ |
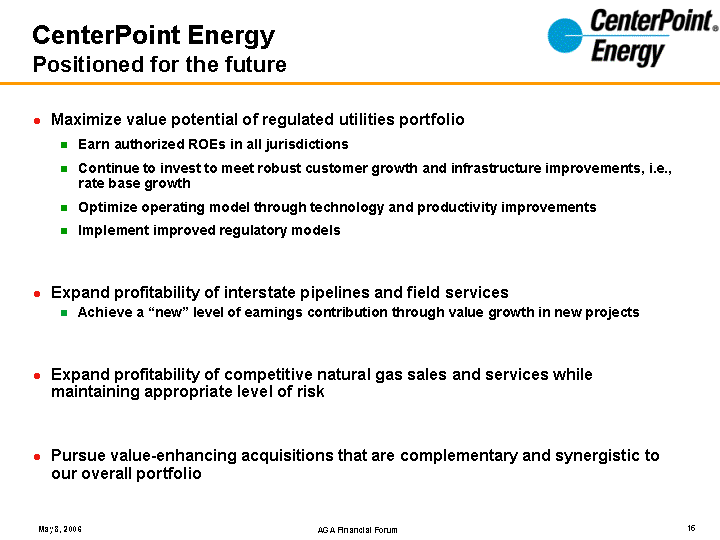
| CenterPoint Energy Positioned for the future Maximize value potential of regulated utilities portfolio Earn authorized ROEs in all jurisdictions Continue to invest to meet robust customer growth and infrastructure improvements, i.e., rate base growth Optimize operating model through technology and productivity improvements Implement improved regulatory models Expand profitability of interstate pipelines and field services Achieve a "new" level of earnings contribution through value growth in new projects Expand profitability of competitive natural gas sales and services while maintaining appropriate level of risk Pursue value-enhancing acquisitions that are complementary and synergistic to our overall portfolio |
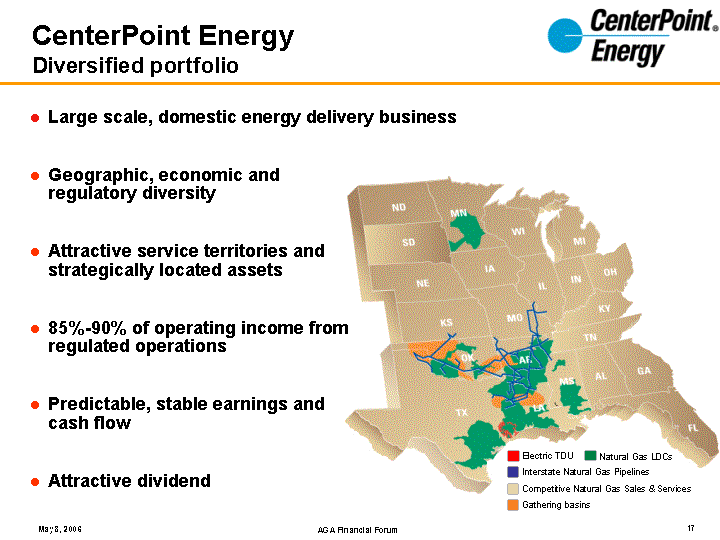
| CenterPoint Energy Diversified portfolio Large scale, domestic energy delivery business Geographic, economic and regulatory diversity Attractive service territories and strategically located assets 85%-90% of operating income from regulated operations Predictable, stable earnings and cash flow Attractive dividend Electric TDU Natural Gas LDCs Interstate Natural Gas Pipelines Competitive Natural Gas Sales & Services Gathering basins |
| Appendix |
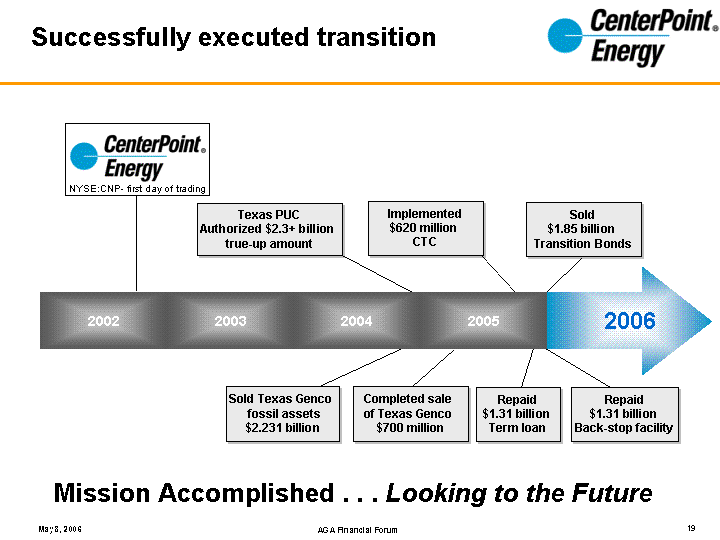
| Successfully executed transition NYSE:CNP- first day of trading Texas PUC Authorized $2.3+ billion true-up amount Completed sale of Texas Genco $700 million 2006 Sold Texas Genco fossil assets $2.231 billion 2003 2002 Repaid $1.31 billion Term loan Sold $1.85 billion Transition Bonds Repaid $1.31 billion Back-stop facility Mission Accomplished . . . Looking to the Future Implemented $620 million CTC 2004 2005 |
| 2005 Financial Results |
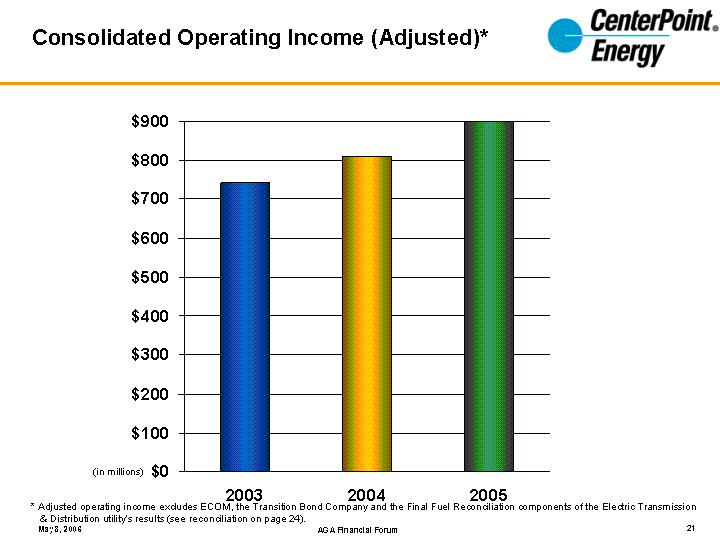
| 2003 2004 2005 743 810 900 (in millions) Consolidated Operating Income (Adjusted)* * Adjusted operating income excludes ECOM, the Transition Bond Company and the Final Fuel Reconciliation components of the Electric Transmission & Distribution utility's results (see reconciliation on page 24). |
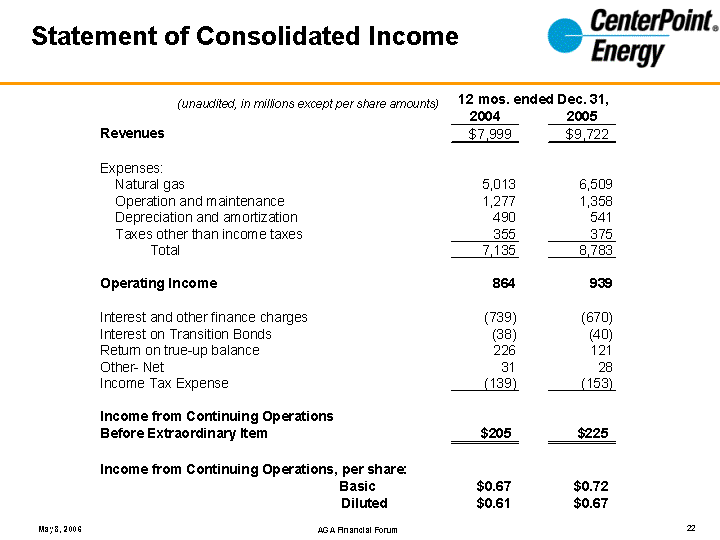
| Statement of Consolidated Income (unaudited, in millions except per share amounts) |
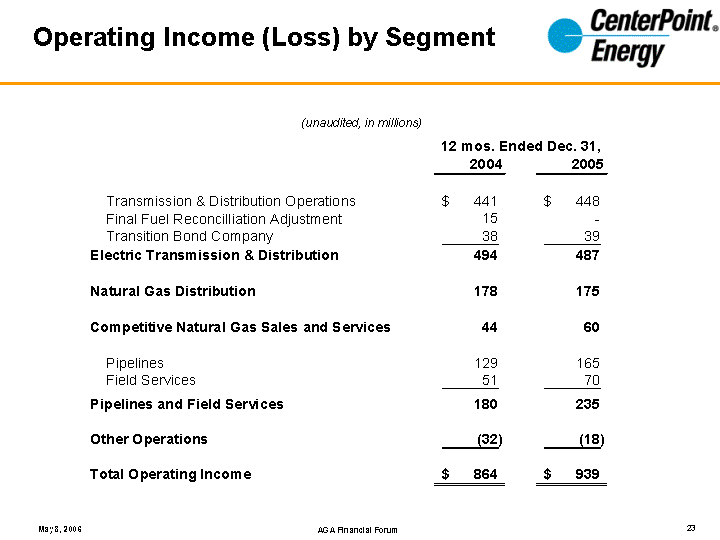
| Operating Income (Loss) by Segment (unaudited, in millions) |
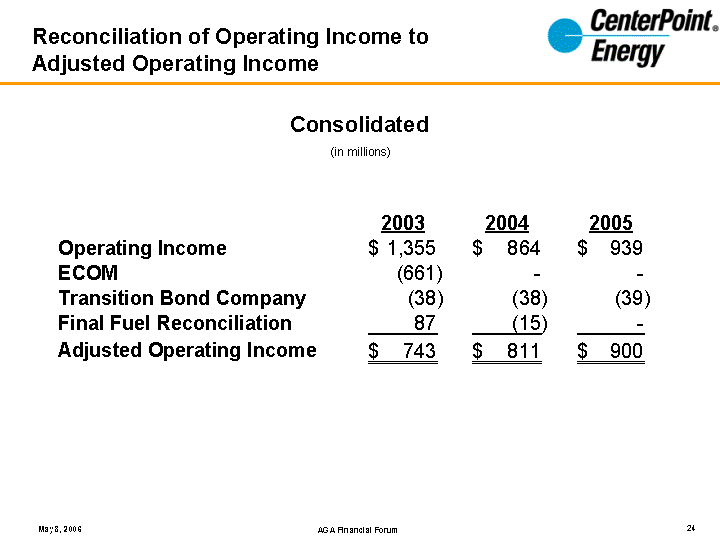
| Reconciliation of Operating Income to Adjusted Operating Income (in millions) Consolidated |
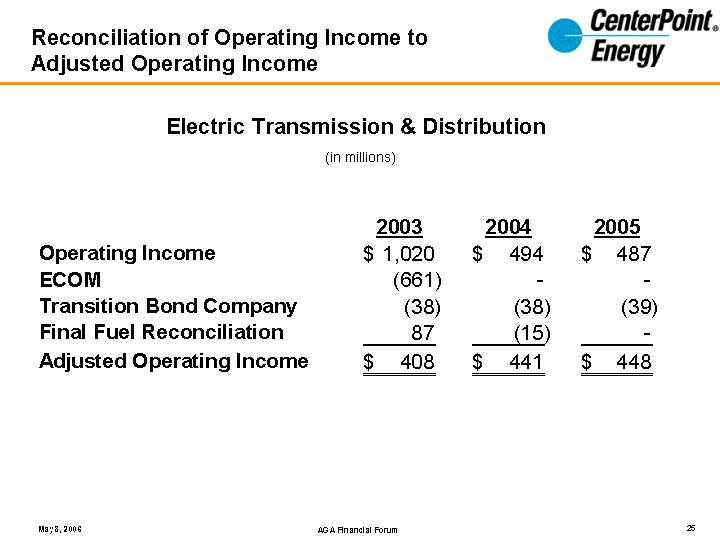
| (in millions) Electric Transmission & Distribution Reconciliation of Operating Income to Adjusted Operating Income |
| Debt & Maturity Schedules As of March 31, 2006 |
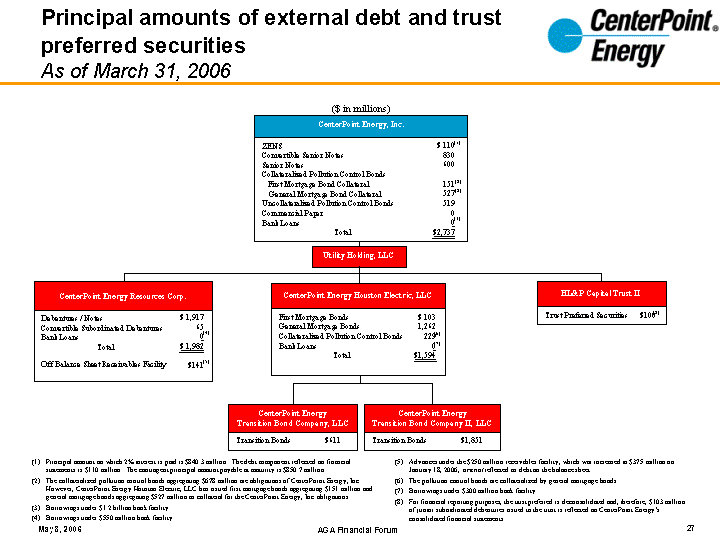
| (5) Advances under the $250 million receivables facility, which was increased to $375 million on January 18, 2006, are not reflected as debt on the balance sheet. (6) The pollution control bonds are collateralized by general mortgage bonds. (7) Borrowings under $300 million bank facility. (8) For financial reporting purposes, the trust preferred is deconsolidated and, therefore, $103 million of junior subordinated debentures issued to the trust is reflected on CenterPoint Energy's consolidated financial statements. CenterPoint Energy, Inc. ZENS Convertible Senior Notes Senior Notes Collateralized Pollution Control Bonds First Mortgage Bond Collateral General Mortgage Bond Collateral Uncollateralized Pollution Control Bonds Commercial Paper Bank Loans Total CenterPoint Energy Resources Corp. Debentures / Notes Convertible Subordinated Debentures Bank Loans Total Off Balance Sheet Receivables Facility CenterPoint Energy Houston Electric, LLC First Mortgage Bonds General Mortgage Bonds Collateralized Pollution Control Bonds Bank Loans Total HL&P Capital Trust II Transition Bonds $611 $ 110 830 600 151 527 519 0 0 $2,737 Trust Preferred Securities $100 $ 1,917 65 0 $ 1,982 $141 $ 103 1,262 229 0 $1,594 CenterPoint Energy Transition Bond Company, LLC (1) Principal amount on which 2% interest is paid is $840.3 million. The debt component reflected on financial statements is $110 million. The contingent principal amount payable at maturity is $850.7 million. (2) The collateralized pollution control bonds aggregating $678 million are obligations of CenterPoint Energy, Inc. However, CenterPoint Energy Houston Electric, LLC has issued first mortgage bonds aggregating $151 million and general mortgage bonds aggregating $527 million as collateral for the CenterPoint Energy, Inc. obligations. (3) Borrowings under $1.2 billion bank facility. Borrowings under $550 million bank facility. ($ in millions) Utility Holding, LLC (1) (2) (2) (3) (4) (5) (6) (7) (8) Principal amounts of external debt and trust preferred securities As of March 31, 2006 Transition Bonds $1,851 CenterPoint Energy Transition Bond Company II, LLC |
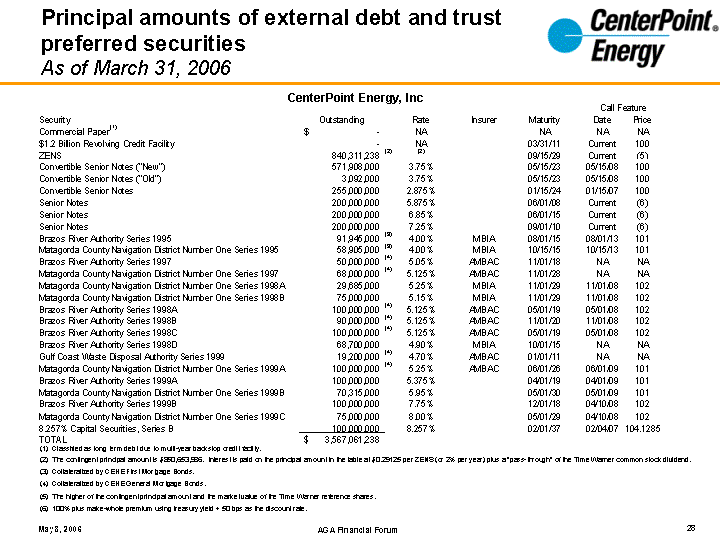
| CenterPoint Energy, Inc Principal amounts of external debt and trust preferred securities As of March 31, 2006 |
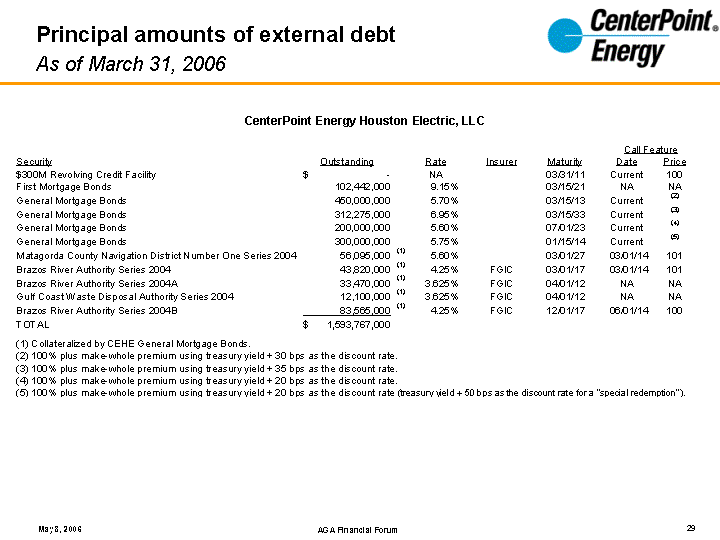
| Principal amounts of external debt As of March 31, 2006 CenterPoint Energy Houston Electric, LLC |
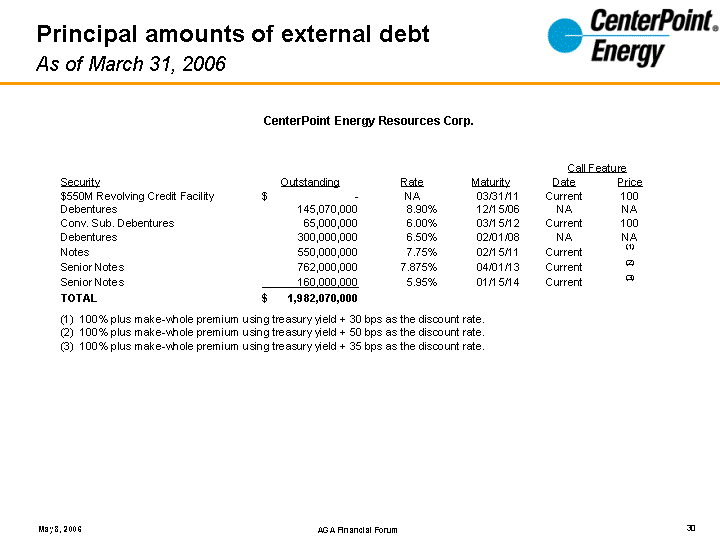
| Principal amounts of external debt As of March 31, 2006 CenterPoint Energy Resources Corp. |
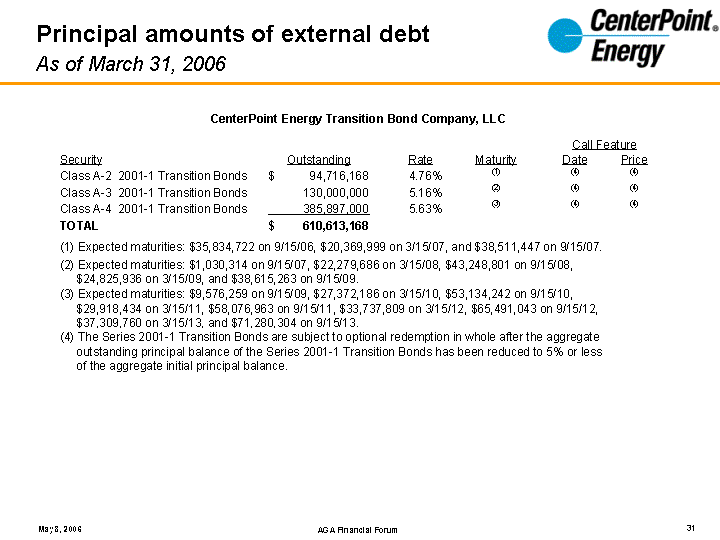
| Principal amounts of external debt As of March 31, 2006 CenterPoint Energy Transition Bond Company, LLC |
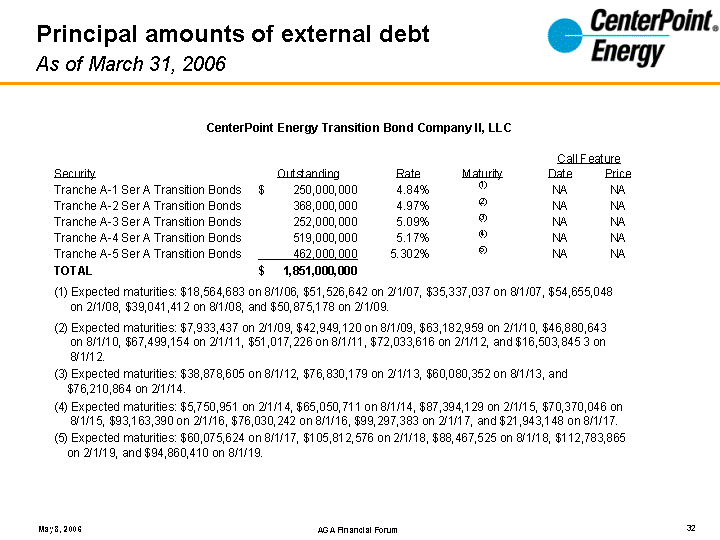
| Principal amounts of external debt As of March 31, 2006 CenterPoint Energy Transition Bond Company II, LLC |
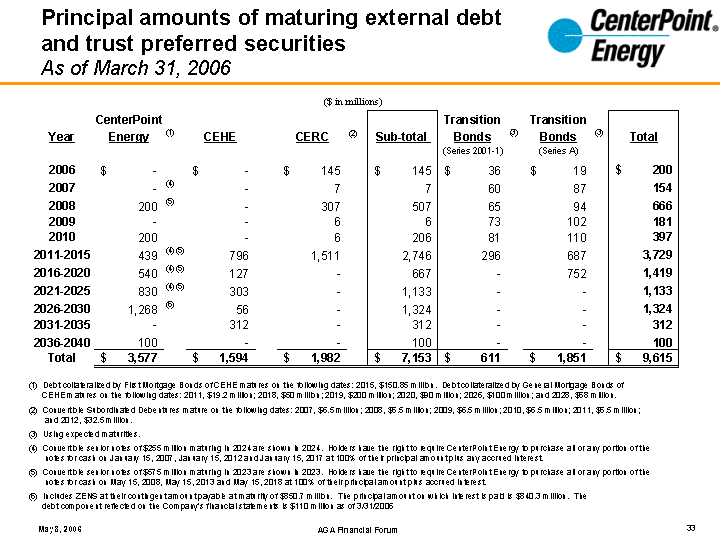
| ($ in millions) Principal amounts of maturing external debt and trust preferred securities As of March 31, 2006 |