FORWARD LOOKING STATEMENT
Certain statements set forth in this presentation consist of forward-looking statements within the meaning of the Private Securities Litigation Reform Act of 1995. These forward-looking statements involve known and unknown risks, uncertainties, and other factors that may cause the actual results, performance, or achievements of the Company to be different from any future results, performance, and achievements expressed or implied by these statements. They should be read in conjunction with the company’s most recent annual report, as well as the company’s Form 10-K and other reports filed with the Securities and Exchange Commission containing a discussion of the company’s business and of various factors that may affect it. Statements in this presentation may include adjusted financial measures governed by Regulation G. For a reconciliation of these measures, please visit the Investor Relations page at www.hughessupply.com
1
Company Overview
2

Company Overview
75-year history as a leading diversified distributor of construction, repair and maintenance products with approximately $3.5 billion in sales and $150 million in operating income
– 489 branches in 38 states
Strong market share position in high growth end markets
– #1 or #2 market position in high growth product segments
– 70% of revenues in 10 fastest growing states in the U.S.
Comprehensive product offering, highly knowledgeable sales force and loyal customer base developed over long history
– Over 350,000 products and 100,000 customers
Transformational leadership initiating significant operational and financial changes
3
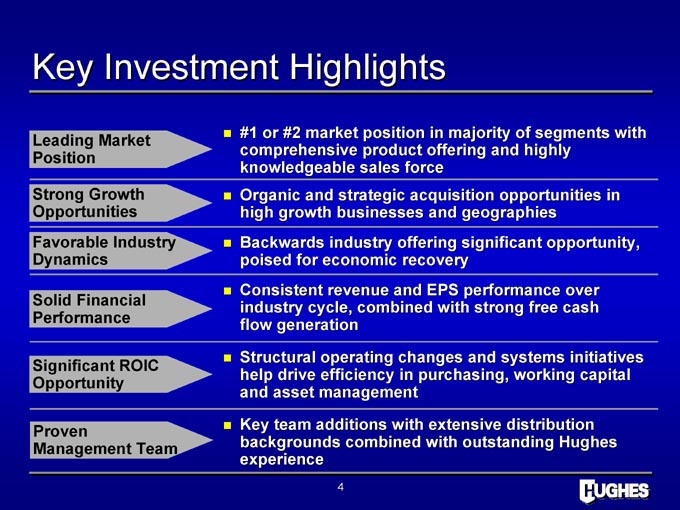
Key Investment Highlights
#1 or #2 market position in majority of segments with
Leading Market
comprehensive product offering and highly
Position
knowledgeable sales force
Strong Growth Organic and strategic acquisition opportunities in
Opportunities high growth businesses and geographies
Favorable Industry Backwards industry offering significant opportunity,
Dynamics poised for economic recovery
Consistent revenue and EPS performance over
Solid Financial industry cycle, combined with strong free cash
Performance flow generation
Structural operating changes and systems initiatives change
Significant ROIC
help drive efficiency in purchasing, working capital
Opportunity
and asset management
Proven Key team additions with extensive distribution
Management Team backgrounds combined with outstanding Hughes
experience
4
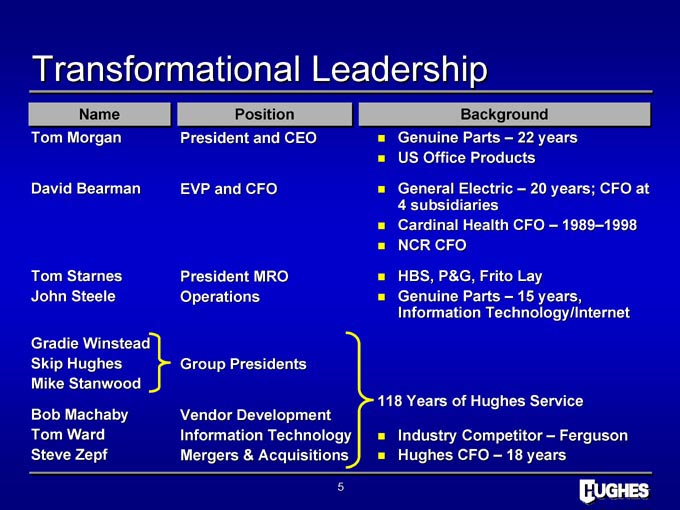
Transformational Leadership
Name Position Background
Tom Morgan President and CEO Genuine Parts – 22 years
US Office Products
David Bearman EVP and CFO General Electric – 20 years; CFO at
4 subsidiaries
Cardinal Health CFO – 1989–1998
NCR CFO
Tom Starnes President MRO HBS, P&G, Frito Lay
John Steele Operations Genuine Parts – 15 years,
Information Technology/Internet
Gradie Winstead
Skip Hughes Group Presidents
Mike Stanwood
118 Years of Hughes Service
Bob Machaby Vendor Development
Tom Ward Information Technology Industry Competitor – Ferguson
Steve Zepf Mergers & Acquisitions Hughes CFO – 18 years
5
Industry & Business Overview
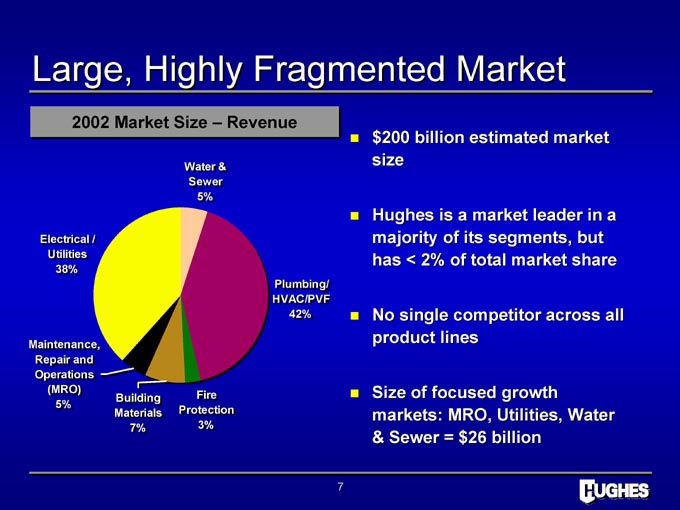
Large, Highly Fragmented Market
2002 Market Size – Revenue
Water & size
&
Sewer
5%
Hughes is a market leader in a
Electrical / / majority of its segments, but
Utilities has < 2% of total market share
38%
Plumbing/
HVAC/PVF
42% No single competitor across all
product lines
Maintenance,
Repair and
Operations
(MRO) Size of focused growth
Building Fire
5%
Materials Protection markets: MRO, Utilities, Water
7% 3%
& Sewer = $26 billion
7
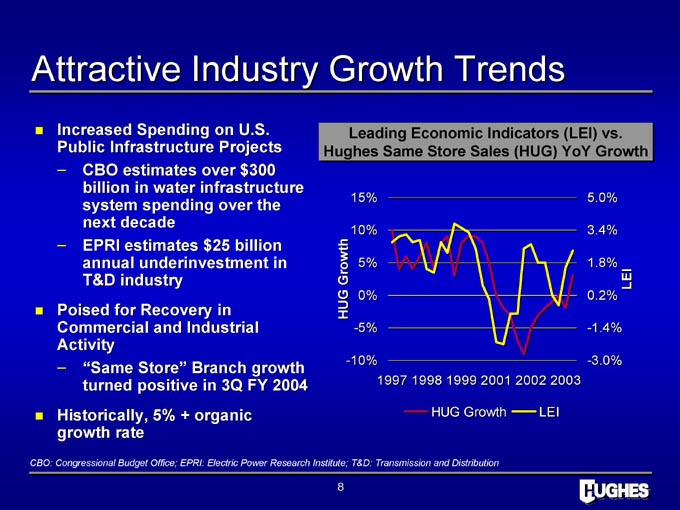
Attractive Industry Growth Trends
Increased Spending on U.S. Public Infrastructure Projects
– CBO estimates over $300 billion in water infrastructure system spending over the next decade
– EPRI estimates $25 billion annual underinvestment in T&D industry
Poised for Recovery in Commercial and Industrial Activity
– “Same Store” Branch growth turned positive in 3Q FY 2004
Historically, 5% + organic growth rate
Leading Economic Indicators (LEI) vs. Hughes Same Store Sales (HUG) YoY Growth
CBO: Congressional Budget Office; EPRI: Electric Power Research Institute; T&D: Transmission and Distribution
8
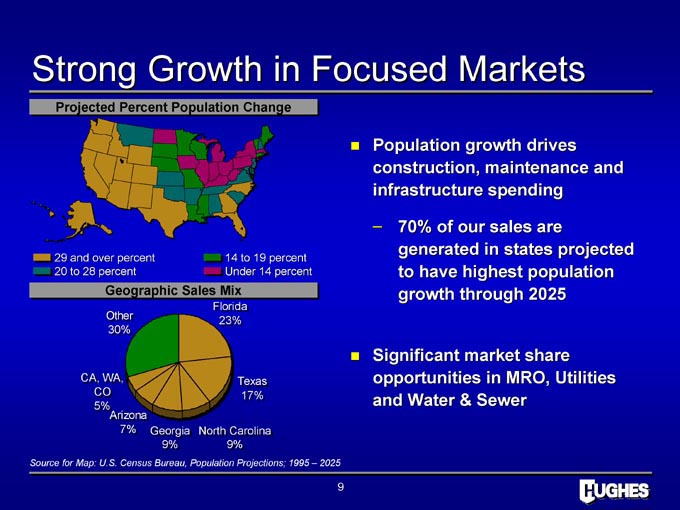
Strong Growth in Focused Markets
Projected Percent Population Change
29 and over percent 14 to 19 percent 20 to 28 percent Under 14 percent
Geographic Sales Mix
Population growth drives construction, maintenance and infrastructure spending
– 70% of our sales are generated in states projected to have highest population growth through 2025
Significant market share opportunities in MRO, Utilities and Water & Sewer
Source for Map: U.S. Census Bureau, Population Projections; 1995 – 2025
9
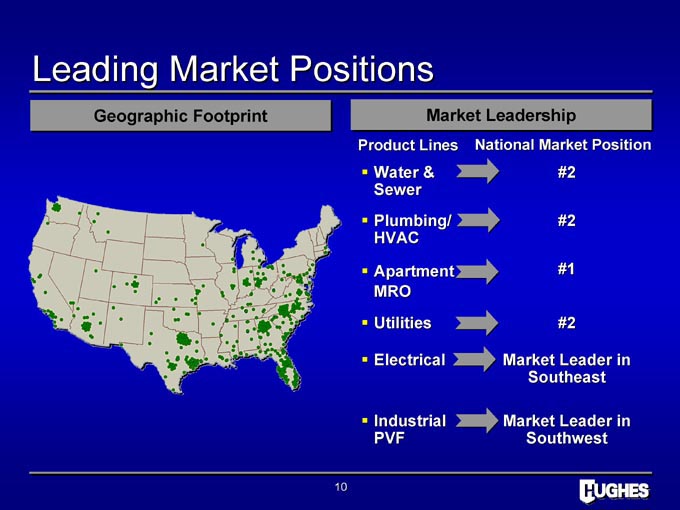
Leading Market Positions
Geographic Footprint
Market Leadership
Product Lines National Market Position
Water & #2
Sewer
Plumbing/ #2
HVAC
Apartment #1
MRO
Utilities #2
Electrical Market Leader in
Southeast
Industrial Market Leader in
PVF Southwest
10
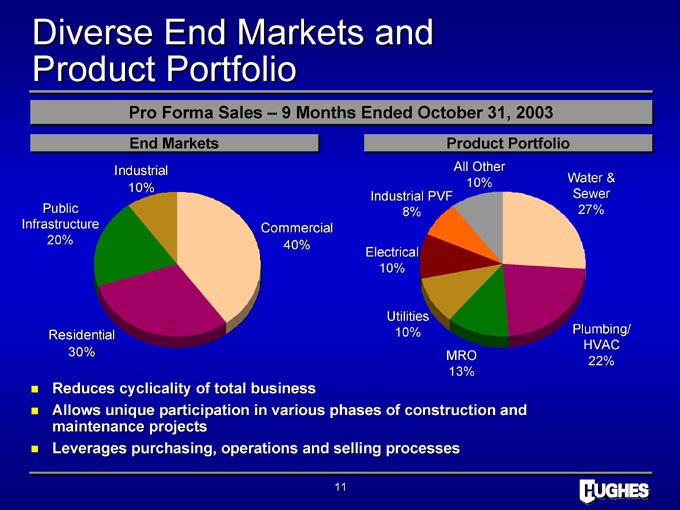
Diverse End Markets and Product Portfolio
Pro Forma Sales – 9 Months Ended October 31, 2003
End Markets Product Portfolio
Industrial All Other
10% Water &
10%
Industrial PVF Sewer
Public 8% 27%
Infrastructure Commercial
20% 40%
Electrical
10%
Utilities
Residential 10% Plumbing/
HVAC
30% MRO
22%
13%
Reduces cyclicality of total business
Allows unique participation in various phases of construction and maintenance projects
Leverages purchasing, operations and selling processes
11
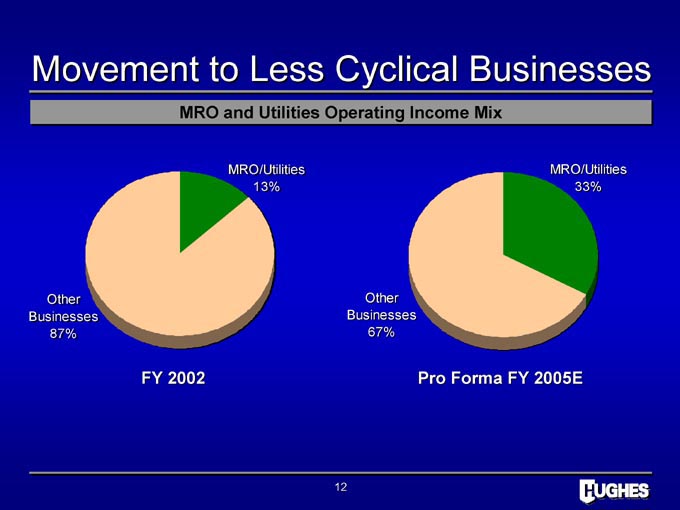
Movement to Less Cyclical Businesses
MRO and Utilities Operating Income Mix
MRO/Utilities MRO/Utilities
13% 33%
Other Other
Businesses Businesses
87% 67%
FY 2002 Pro Forma FY 2005E
12
Reporting Segments
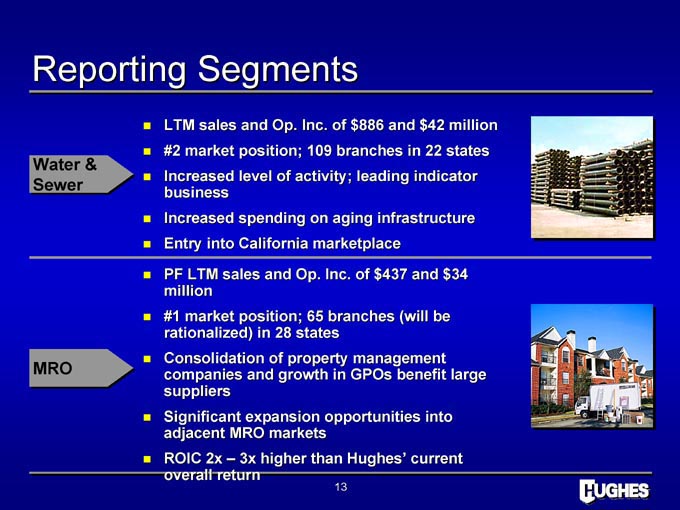
LTM sales and EBIT of $886 and $42 million
#2 market position; 109 branches in 22 states
Water &
Increased level of activity; leading indicator
Sewer
business
Increased spending on aging infrastructure
Entry into California marketplace
PF LTM sales and EBIT of $437 and $34 million
#1 market position; 65 branches (will be
rationalized) in 28 states
Consolidation of property management
companies and growth in GPOs benefit large
MRO suppliers
Significant expansion opportunities into
adjacent MRO markets
ROIC 2x – 3x higher than Hughes’ current
overall return
13
Century Acquisition
$ 360 million acquisition closed on December 19, 2003
Large, fast-growing participant in MRO market complements Hughes business
Opportunities to expand into adjacent markets – lodging / hospitality, healthcare / assisted living, education, government / military
– From a $2.5 billion market opportunity to atunity $10 billion market opportunity
Good management, superior business model – superior margins, costs, capital efficiency, annuity characteristics
Significant net synergies over next two years – facilities/distribution model, transportation, purchasing, marketing, corporate services, less amortization of intangibles
Accretive to EPS and strengthens overall financial equation
Strong step in the transformation of Hughes
14
Reporting Segments
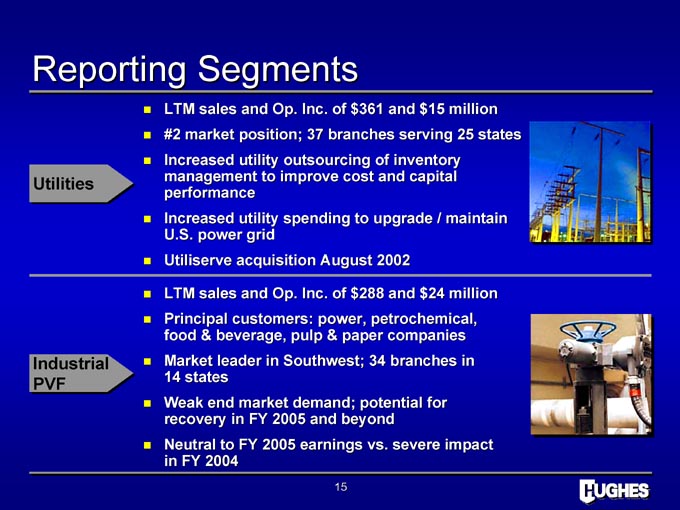
LTM sales and EBIT of $361 and $15 million
#2 market position; 37 branches serving 25 states
Increased utility outsourcing of inventory
Utilities management to improve cost and capital
performance
Increased utility spending to upgrade / maintain
U.S. power grid
Utiliserve acquisition August 2002
LTM sales and EBIT of $288 and $24 million
Principal customers: power, petrochemical,
food & beverage, pulp & paper companies
Industrial Market leader in Southwest; 34 branches in
PVF 14 states
Weak end market demand; potential for
recovery in FY 2005 and beyond
Neutral to FY 2005 earnings vs. severe impact
in FY 2004
15
Reporting Segments
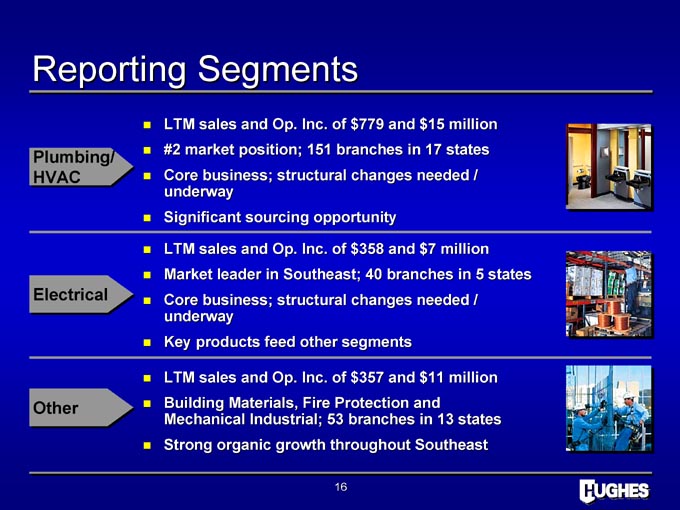
LTM sales and EBIT of $779 and $15 million
Plumbing/ #2 market position; 151 branches in 17 states
HVAC Core business; structural changes needed /
underway
Significant sourcing opportunity
LTM sales and EBIT of $358 and $7 million
Market leader in Southeast; 40 branches in 5 states
Electrical Core business; structural changes needed /
underway
Key products feed other segments
LTM sales and EBIT of $357 and $11 million
Other Building Materials, Fire Protection and
Mechanical Industrial; 53 branches in 13 states
Strong organic growth throughout Southeast
16
Business Strategy
17
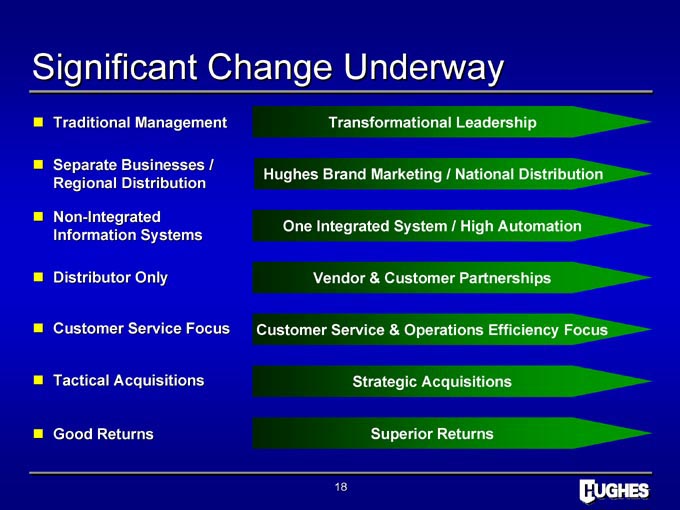
Significant Change Underway
Traditional Management Transformational Leadership
Separate Businesses /
Hughes Brand Marketing / National Distribution
Regional Distribution
Non-Integrated
One Integrated System / High Automation
Information Systems
Distributor Only Vendor & Customer Partnerships
Customer Service Focus Customer Service & Operations Efficiency Focus
Tactical Acquisitions Strategic Acquisitions
Good Returns Superior Returns
18
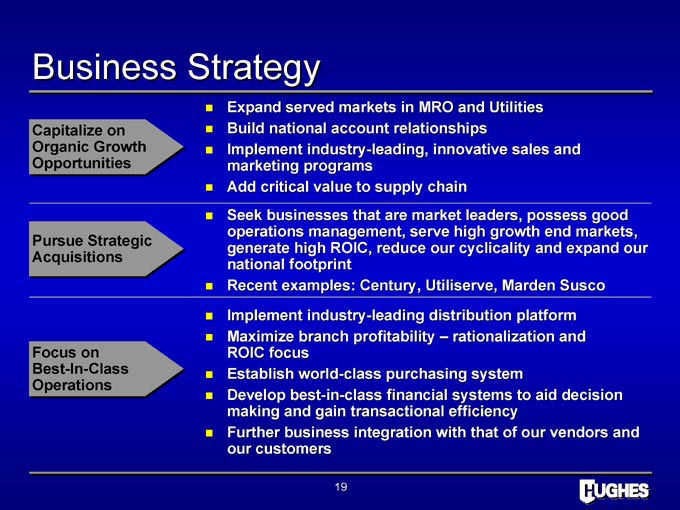
Business Strategy
Expand served markets in MRO and Utilities
Capitalize on Build national account relationships
Organic Growth Implement industry-leading, innovative sales and
Opportunities marketing programs
Add critical value to supply chain
Seek businesses that are market leaders, possess good
operations management, serve high growth end markets,
Pursue Strategic
generate high ROIC, reduce our cyclicality and expand our
Acquisitions
national footprint
Recent examples: Century, Utiliserve, Marden Susco
Implement industry-leading distribution platform
Maximize branch profitability – rationalization and
Focus on ROIC focus
Best-In-Class—- Establish world-class purchasing system
Operations
Develop best-in-class financial systems to aid decision
making and gain transactional efficiency
Further business integration with that of our vendors and
our customers
19
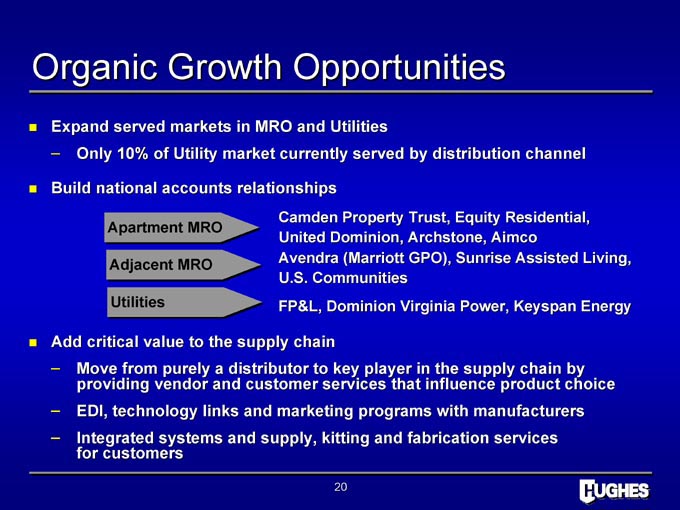
Organic Growth Opportunities
Expand served markets in MRO and Utilities
– Only 10% of Utility market currently served by distribution channel curren
Build national accounts relationships
Camden Property Trust, Equity Residential,
Apartment MRO
United Dominion, Archstone, Aimco
Adjacent MRO Avendra (Marriott GPO), Sunrise Assisted Living,
U.S. Communities
Utilities FP&L, Dominion Virginia Power, Keyspan Energy
Add critical value to the supply chain
– Move from purely a distributor to key player in the supply chain by providing vendor and customer services that influence product choice
– EDI, technology links and marketing programs with manufacturers ing
– Integrated systems and supply, kitting and fabrication services for customers
20
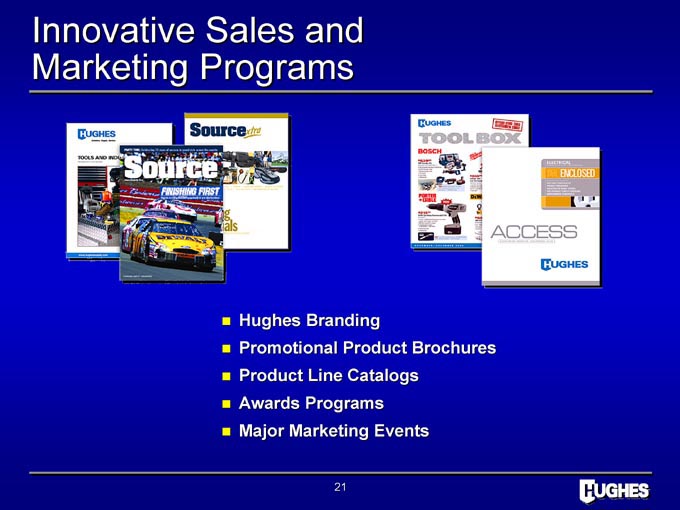
Innovative Sales and Marketing Programs
Hughes Branding
Promotional Product Brochures
Product Line Catalogs
Awards Programs
Major Marketing Events
21
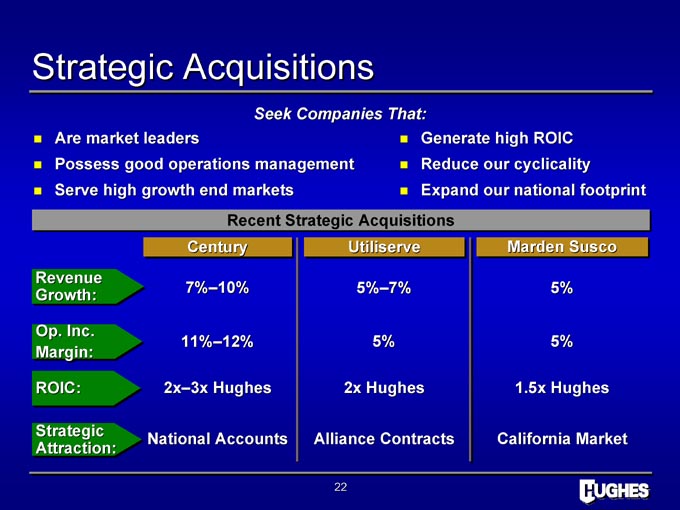
Strategic Acquisitions
Seek Companies That:
Are market leaders Generate high ROIC
Possess good operations management Reduce our cyclicality
Serve high growth end markets Expand our national footprint
Recent Strategic Acquisitions
Century Utiliserve Marden Susco
Revenue
7%–10% 5%–7% 5%
Growth:
EBIT
11%–12% 5% 5%
Margin:
ROIC: 2x–3x Hughes 2x Hughes 1.5x Hughes
Strategic
National Accounts Alliance Contracts California Market
Attraction:
22
Operations Strategy
23
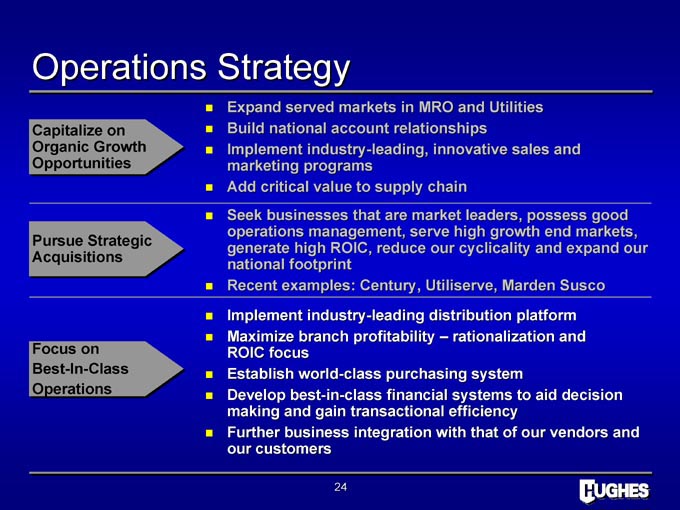
Operations Strategy
Expand served markets in MRO and Utilities
Capitalize on Build national account relationships
Organic Growth Implement industry-leading, innovative sales and
Opportunities marketing programs
Add critical value to supply chain
Seek businesses that are market leaders, possess good
operations management, serve high growth end markets,
Pursue Strategic
generate high ROIC, reduce our cyclicality and expand our
Acquisitions
national footprint
Recent examples: Century, Utiliserve, Marden Susco
Implement industry-leading distribution platform
Maximize branch profitability – rationalization and
Focus on ROIC focus
Best-In-Class—- Establish world-class purchasing system
Operations Develop best-in-class financial systems to aid decision
making and gain transactional efficiency
Further business integration with that of our vendors and
our customers
24
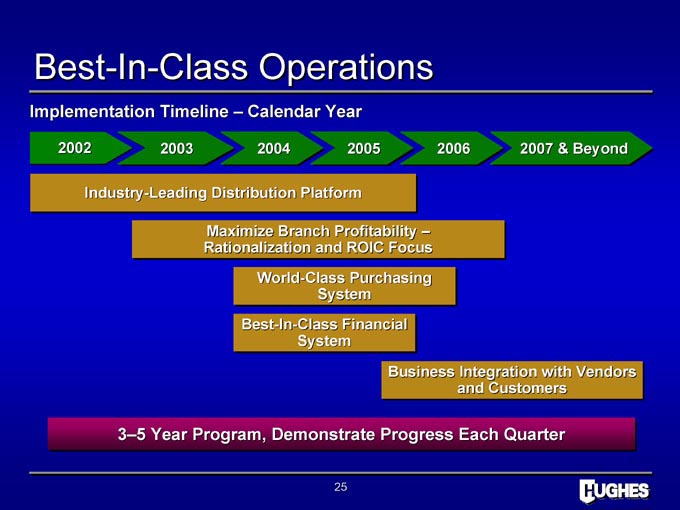
Best-In-Class Operations
Implementation Timeline – Calendar Year
2002 2003 2004 2005 2006 2007 & Beyond
Industry-Leading Distribution Platform
Maximize Branch Profitability –Rationalization and ROIC Focus World-Class Purchasing System Best-In-Class Financial System
Business Integration with Vendors and Customers
3–5 Year Program, Demonstrate Progress Each Quarter
25
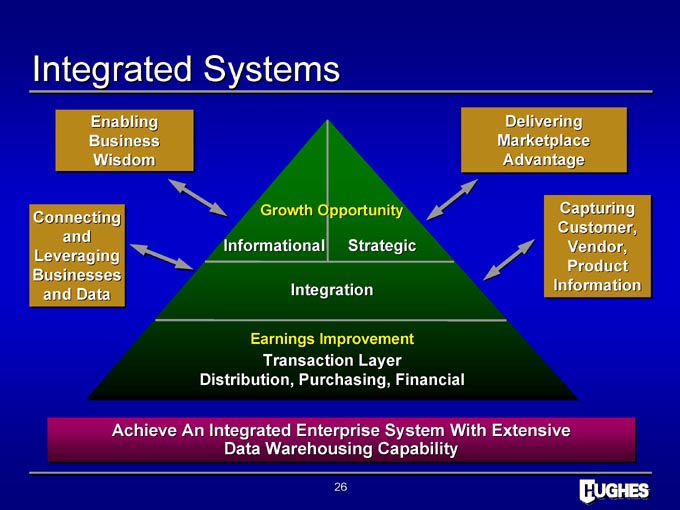
Integrated Systems
Enabling Delivering
Business Marketplace
Wisdom Advantage
Growth Opportunity Capturing
Connecting
Customer,
and
Informational Strategic Vendor,
Leveraging
Product
Businesses
Integration Information
and Data
Earnings Improvement
Transaction Layer
Distribution, Purchasing, Financial
Achieve An Integrated Enterprise System With Extensive Data Warehousing Capability
26
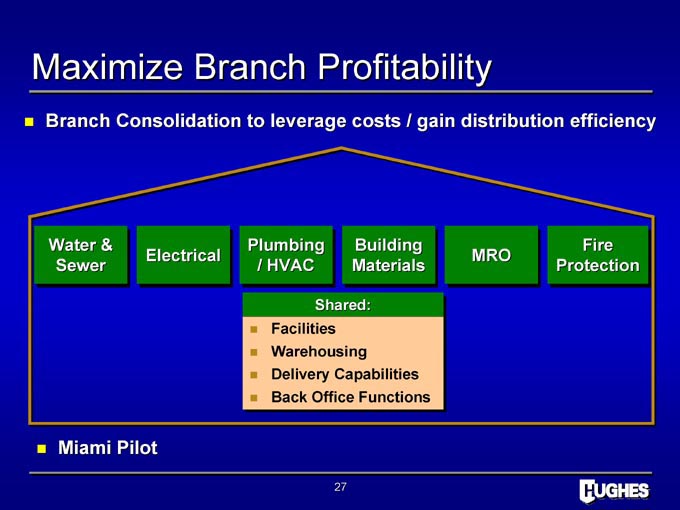
Maximize Branch Profitability
Branch Consolidation to leverage costs / gain distribution efficiency
Water & Plumbing Building Fire
Electrical MRO
Sewer / HVAC Materials Protection
Shared:
Facilities
Warehousing
Delivery Capabilities
Back Office Functions
Miami Pilot
27
Financial Review
28
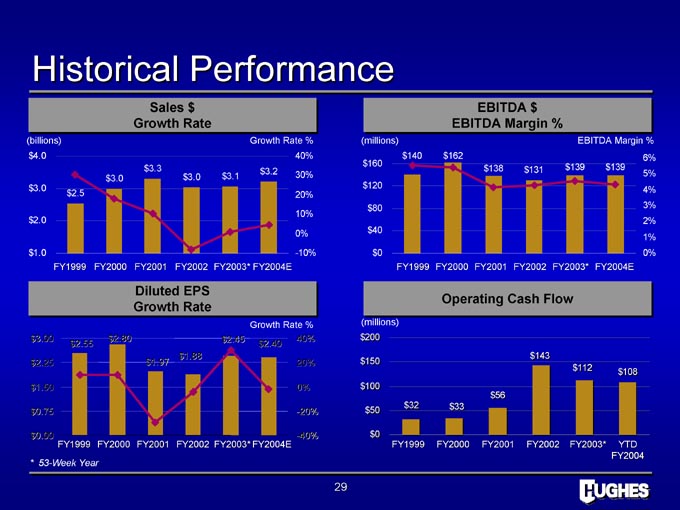
Historical Performance
Sales $ EBITDA $
Growth Rate EBITDA Margin %
(billions) Growth Rate % (millions) EBITDA Margin %
Diluted EPS
Operating Cash Flow
Growth Rate
Growth Rate % (millions)
* 53-Week Year
29
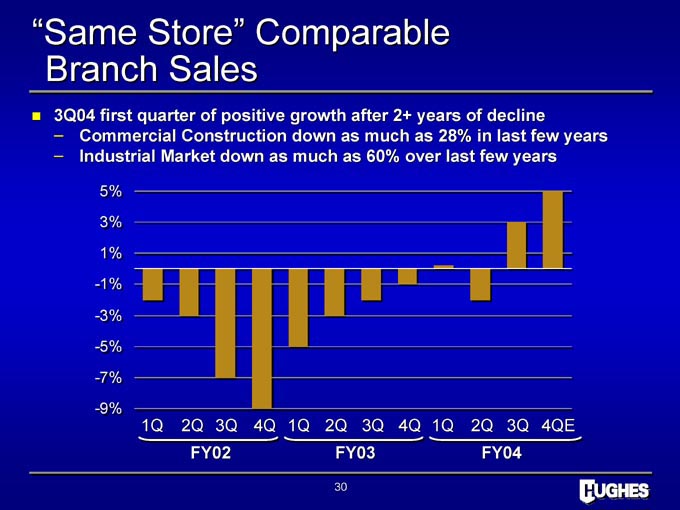
“Same Store” Comparable Branch Sales
3Q04 first quarter of positive growth after 2+ years of decline
– Commercial Construction down as much as 28% in last few years
– Industrial Market down as much as 60% over last few years
1Q 2Q 3Q 4Q 1Q 2Q 3Q 4Q 1Q 2Q 3Q 4QE
FY02 FY03 FY04
30
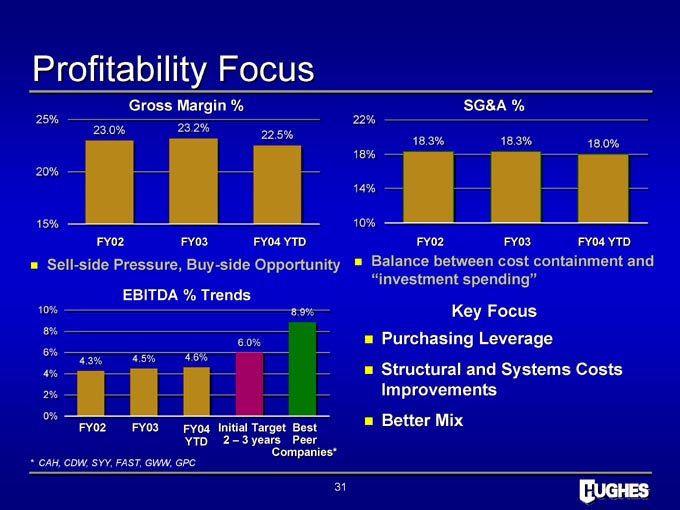
Profitability Focus
Gross Margin % SG&A %
Sell-side Pressure, Buy-side Opportunity Balance between cost containment and
“investment spending”
EBITDA % Trends
FY02 FY03 FY04 Initial Target Best
YTD 2 – 3 years Peer
Companies*
* CAH, CDW, SYY, FAST, GWW, GPC
Key Focus
Purchasing Leverage
Structural and Systems Costs Improvements
Better Mix
31
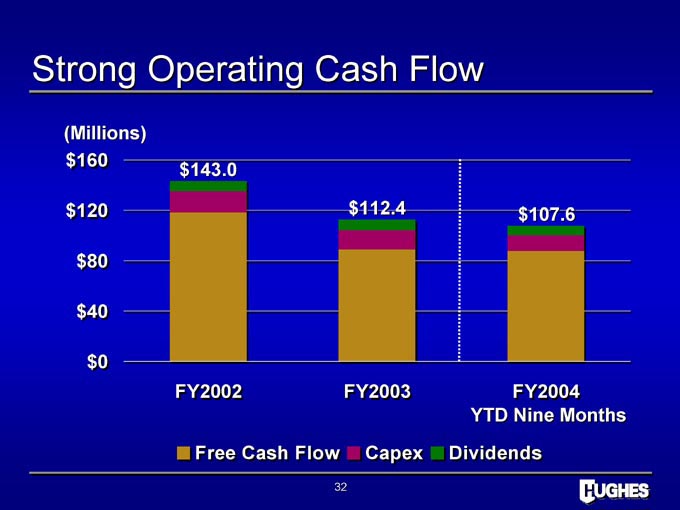
Strong Operating Cash Flow
(Millions)
FY2002 FY2003 FY2004
YTD Nine Months
Free Cash Flow Capex Dividends
32
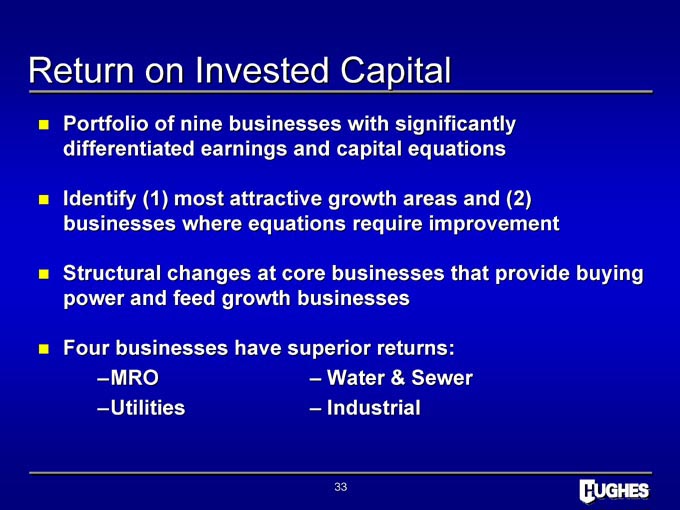
Return on Invested Capital
Portfolio of nine businesses with significantly differentiated earnings and capital equations
Identify (1) most attractive growth areas and (2) businesses where equations require improvement
Structural changes at core businesses that provide buying power and feed growth businesses
Four businesses have superior returns:
–MRO – Water & Sewer
–Utilities – Industrial
33
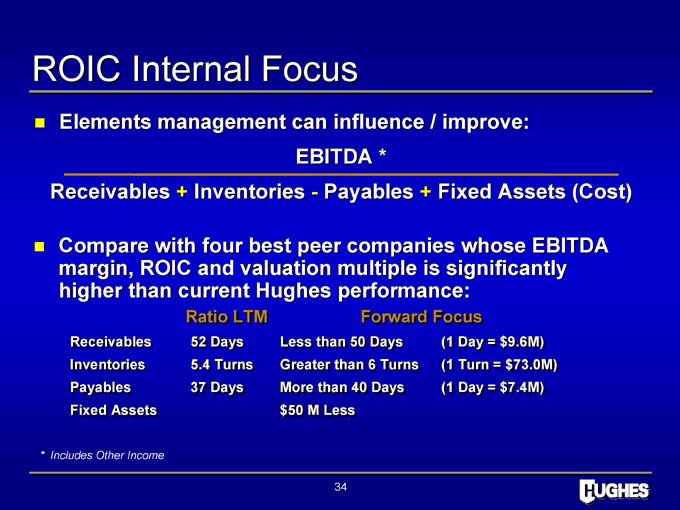
ROIC Internal Focus
Elements management can influence / improve: EBITDA *
Receivables + Inventories—Payables + Fixed Assets (Cost)
Compare with four best peer companies whose EBITDA margin, ROIC and valuation multiple is significantly higher than current Hughes performance:
Ratio LTM Forward Focus
Receivables 52 Days Less than 50 Days (1 Day = $ $9. 9.6M)
Inventories 5.4 Turns 5.4 Greater than 6 Turns 6 (1 Turn = $ $73.0M) .
Payables 37 Days More than 40 Days (1 Day = $ $7. 7.4M)
Fixed Assets $ $ 50 M Less
* Includes Other Income
34
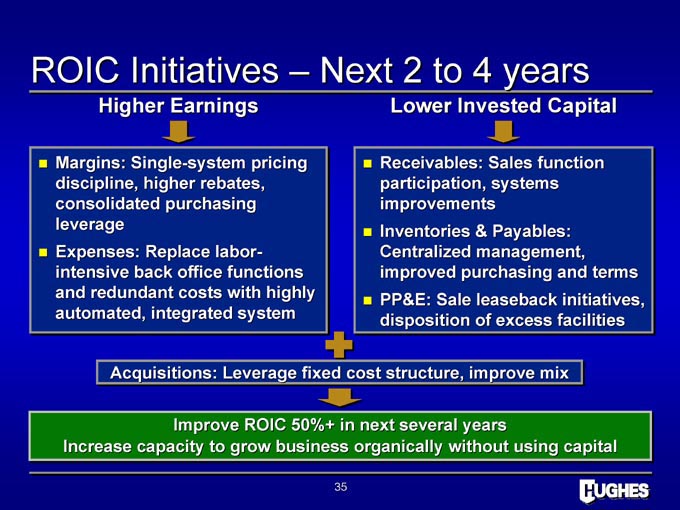
ROIC Initiatives – Next 2 to 4 years
Higher Earnings
Margins: Single-system pricing
discipline, higher rebates,
consolidated purchasing
leverage
Expenses: Replace labor-
intensive back office functions
and redundant costs with highly
automated, integrated system
Lower Invested Capital
Receivables: Sales function
participation, systems
improvements
Inventories & Payables:
Centralized management,
improved purchasing and terms
PP&E: Sale leaseback initiatives,
disposition of excess facilities
Acquisitions: Leverage fixed cost structure, improve mix
Improve ROIC 50%+ in next several years
Increase capacity to grow business organically without using capital
35
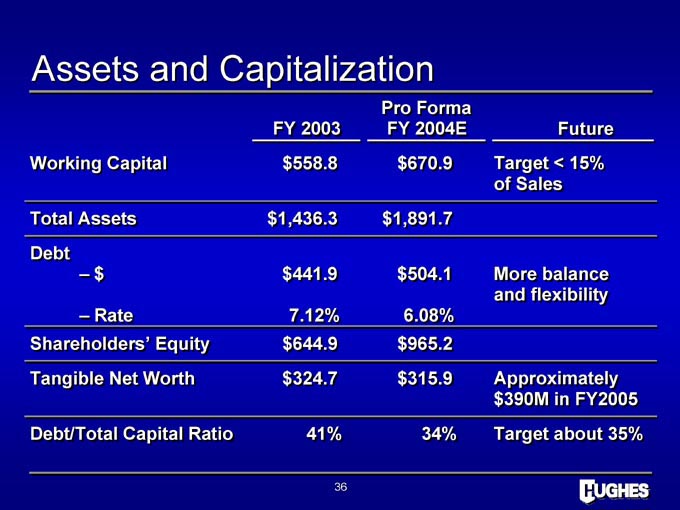
Assets and Capitalization
Pro Forma
FY 2003 FY 2004E Future
Working Capital $558.8 $670.9 Target < 15% of Sales
Total Assets $1,436.3 $1,891.7
Debt
– $ $441.9 $504.1 More balance and flexibility
– Rate 7.12% 6.08%
Shareholders’ Equity $644.9 $965.2
Tangible Net Worth $324.7 $315.9 Approximately $390M in FY2005
Debt/Total Capital Ratio 41% 34% Target about 35%
36
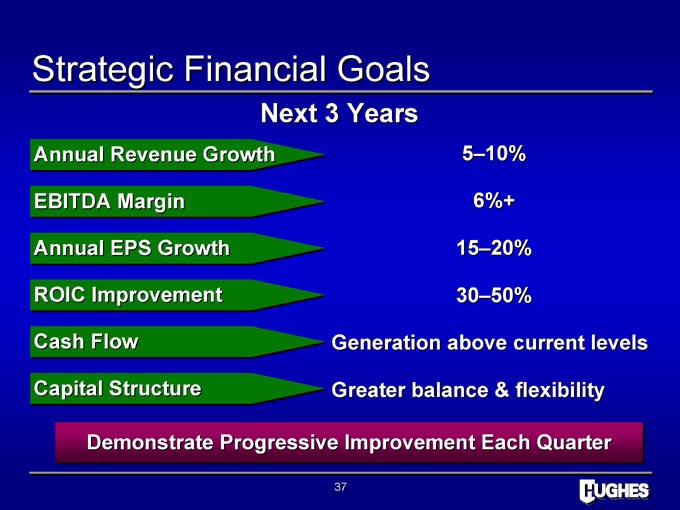
Strategic Financial Goals
Next 3 Years
Annual Revenue Growth 5–10%
EBITDA Margin 6%+
Annual EPS Growth 15–20%
ROIC Improvement 30–50%
Cash Flow Generation above current levels
Capital Structure Greater balance & flexibility
Demonstrate Progressive Improvement Each Quarter
37
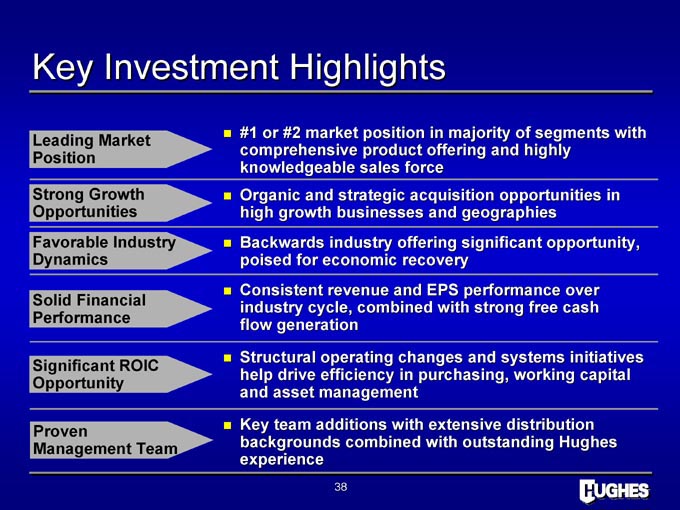
Key Investment Highlights
#1 or #2 market position in majority of segments with
Leading Market comprehensive product offering and highly
Position knowledgeable sales force
Strong Growth Organic and strategic acquisition opportunities in
Opportunities high growth businesses and geographies
Favorable Industry Backwards industry offering significant opportunity,
Dynamics poised for economic recovery
Consistent revenue and EPS performance over
Solid Financial industry cycle, combined with strong free cash
Performance flow generation
Significant ROIC Structural operating changes and systems initiatives change
Opportunity help drive efficiency in purchasing, working capital
and asset management
Proven Key team additions with extensive distribution
Management Team backgrounds combined with outstanding Hughes
experience
38