2009
United States
Securities and Exchange Commission
Washington, D.C. 20549
Form 40-F
| ¨ | Registration Statement pursuant to section 12 of the Securities Exchange Act of 1934 |
| x | Annual report pursuant to section 13(a) or 15(d) of the Securities Exchange Act of 1934 |
| | |
| For the fiscal year ended December 31, 2009 | | Commission File Number: 001-04307 |
Husky Energy Inc.
(Exact name of Registrant as specified in its charter)
| | | | |
Alberta, Canada | | 1311 | | Not Applicable |
| (Province or other jurisdiction of incorporation or organization) | | (Primary Standard Industrial Classification Code Numbers (if applicable)) | | (I.R.S. Employer Identification Number (if applicable)) |
707-8th Avenue S.W., P.O. Box 6525 Station D, Calgary, Alberta, Canada T2P 3G7
(403) 298-6111
(Address and telephone number of Registrant’s principal executive office)
CT Corporation System, 111 Eighth Avenue, New York, New York 10011
(212) 894-8400
(Name, address (including zip code) and telephone number (including area code) of agent for service in the United States)
Securities registered or to be registered pursuant to Section 12(b) of the Act:
Title of Class: None
Securities registered or to be registered pursuant to Section 12(g) of the Act:
Title of Class: None
Securities for which there is a reporting obligation pursuant to Section 15(d) of the Act:
Title of Class: Debt Securities
The Registrant is a “voluntary filer” and files annual reports on Form 40-F, amendments to such reports and furnishes information on Form 6-K to the Securities and Exchange Commission, pursuant to its obligations under its Indentures dated June 14, 2002 and September 11, 2007 relating to its debt securities issued thereunder.
For annual reports, indicate by check mark the information filed with this Form:
| | |
| x Annual information form | | x Audited annual financial statements |
Number of outstanding shares of each of the issuer’s classes of capital or common stock as of the close of the period covered by the annual report: 849,860,935
Common Shares outstanding as of December 31, 2009
Indicate by check mark whether the Registrant has submitted electronically and posted on its corporate Website, if any, every Interactive Data File required to be submitted and posted pursuant to Rule 405 of Regulation S-T (s.232.405 of this chapter) during the preceding 12 months (or for such shorter period that the Registrant was required to submit and post such files). Yes ¨ No ¨
Indicate by check mark whether the Registrant (1) has filed all reports required to be filed by Section 13 or 15(d) of the Exchange Act during the preceding 12 months (or for such shorter period that the Registrant was required to file such reports) and (2) has been subject to such filing requirements for the past 90 days. Yes x No ¨
The Annual Report on Form 40-F shall be incorporated by reference into or as an exhibit to, as applicable, the Registrant’s Registration Statement under the Securities Act of 1933: Form F-9 File No. 333-157389.
Principal Documents
The following documents have been filed as part of this Annual Report on Form 40-F:
| A. | Annual Information Form |
The Annual Information Form of Husky Energy Inc. (“Husky” or “the Company”) for the year ended December 31, 2009 is included as Document A of this Annual Report on Form 40-F.
| B. | Audited Annual Financial Statements |
Husky’s audited consolidated financial statements for the year ended December 31, 2009 and 2008, including the auditor’s report with respect thereto, is included as Document B of this Annual Report on Form 40-F. The reconciliation of Husky’s audited consolidated financial statements to accounting principles generally accepted in the United States is included as Document C of this Annual Report on Form 40-F. In addition, see the “Disclosure about Oil and Gas Producing Activities — Accounting Standards Codification 932, “Extractive Activities — Oil and Gas” in the Annual Information Form included as Document A of this Annual Report on Form 40-F.
| C. | Reconciliation to Accounting Principles Generally Accepted in the United States |
The reconciliation of Husky’s audited consolidated financial statements to accounting principles generally accepted in the United States is included as Document C of this Annual Report on Form 40-F. In addition, see the “Disclosure about Oil and Gas Producing Activities — Accounting Standards Codification 932, “Extractive Activities — Oil and Gas” in the Annual Information Form included as Document A of the Annual Report on Form 40-F.
| D. | Management’s Discussion and Analysis |
Husky’s Management’s Discussion and Analysis for the year ended December 31, 2009 is included as Document D of this Annual Report on Form 40-F.
Certifications
See Exhibits 23.1, 23.2, 31.1, 31.2, 32.1 and 32.2, which are included as Exhibits to this Annual Report on Form 40-F.
Controls and Procedures
See the section “Controls and Procedures” in Husky’s Management’s Discussion and Analysis for the year ended December 31, 2009 which is included as Document D to this Annual Report on Form 40-F.
Management’s Annual Report on Internal Control Over Financial Reporting
The required disclosure is included in “Management’s Report” that accompanies Husky’s consolidated financial statements for the year ended December 31, 2009, which is included as Document B to this Annual Report on Form 40-F.
Attestation Report of the Registered Public Accounting Firm
The required disclosure is included in “Auditors’ Report to the Shareholders” that accompanies Husky’s consolidated financial statements for the year ended December 31, 2009, which is included as Document B to this Annual Report on Form 40-F.
Page ii
Changes in Internal Control Over Financial Reporting
The required disclosure is included in the section “Controls and Procedures” in Husky’s Management’s Discussion and Analysis for the year ended December 31, 2009, which is included as Document D to this Annual Report on Form 40-F.
Notice Pursuant to Regulation BTR
Not Applicable.
Audit Committee Financial Expert
The Board of Directors of Husky has determined that R. Donald Fullerton is an “audit committee financial expert” (as defined in paragraph 8(b) of General Instruction B to Form 40-F) serving on its Audit Committee. Pursuant to paragraph 8(a)(2) of General Instruction B to Form 40-F, the Board has applied the definition of independence applicable to the audit committee members of New York Stock Exchange listed companies. Mr. Fullerton is a corporate director and is independent under the New York Stock Exchange standard. For a description of Mr. Fullerton’s relevant experience in financial matters, see Mr. Fullerton’s five year history in the section “Directors and Officers” and in the section “Audit Committee” in Husky’s Annual Information Form for the year ended December 31, 2009, which is included as Document A of this Annual Report on Form 40-F.
Code of Business Conduct and Ethics
Husky’s Code of Ethics is disclosed in its Code of Business Conduct, which is applicable to its principal executive officer, principal financial officer, principal accounting officer or controller or persons performing similar functions and all its other employees, and is posted on its website atwww.huskyenergy.com. In the fiscal year ended December 31, 2009, there have been no amendments to Husky’s Code of Ethics, nor has Husky granted a waiver including an implicit waiver from a provision of its Code of Ethics. In the event that, during Husky’s ensuing fiscal year, Husky:
| | i. | amends any provision of its Code of Business Conduct that applies to its principal executive officer, principal financial officer, principal accounting officer or controller or persons performing similar functions that relates to any element of the code of ethics definition enumerated in paragraph (9)(b) of General Instruction B to Form 40-F, or |
| | ii. | grants a waiver, including an implicit waiver, from a provision of its Code of Business Conduct to any of its principal executive officer, principal financial officer, principal accounting officer or controller or persons performing similar functions that relates to one or more of the items set forth in paragraph (9)(b) of General Instruction B to Form 40-F. |
Husky will promptly disclose such occurrences on its website following the date of such amendment or waiver and will specifically describe the nature of any amendment or waiver, and in the case of a waiver, name the person to whom the waiver was granted and the date of the waiver.
Principal Accountant Fees and Services
See the section “Audit Committee” in the Annual Information Form for the year ended December 31, 2009, which is included as Document A to this Annual Report on Form 40-F.
Off-Balance Sheet Arrangements
See the section “Off-Balance Sheet Arrangements” in Husky’s Management’s Discussion and Analysis for the year ended December 31, 2009, which is included as Document D to this Annual Report on Form 40-F.
Page iii
Disclosure of Contractual Obligations
See the section “Contractual Obligations and Other Commercial Commitments” in Husky’s Management’s Discussion and Analysis for the year ended December 31, 2009, which is included as Document D to this Annual Report on Form 40-F.
Identification of the Audit Committee
Husky has a separately-designated standing audit committee established in accordance with Section 3(a)(58)(A) of the Exchange Act. The members of the audit committee are: R.D. Fullerton, M.J.G. Glynn, C. S. Russel and W. Shurniak.
Page iv
Undertaking and Consent to Service of Process
Undertaking
Husky undertakes to make available, in person or by telephone, representatives to respond to inquiries made by the Commission staff, and to furnish promptly, when requested to do so by the Commission staff, information relating to: the securities in relation to which the obligation to file an annual report on Form 40-F arises; or transactions in said securities.
Consent to Service of Process
A Form F-X signed by Husky and its agent for service of process has been filed with the Commission together with Forms F-9 (333 - 137211), (333 - 157389) and (333 - 89714) in connection with its debt securities registered on such forms.
Any change to the name or address of the agent for service of process of Husky shall be communicated promptly to the Commission by an amendment to the Form F-X referencing the file number of Husky.
Signatures
Pursuant to the requirements of the Exchange Act, Husky Energy Inc. certifies that it meets all of the requirements for filing on Form 40-F and has duly caused this Annual Report to be signed on its behalf by the undersigned, thereto duly authorized.
Dated this 24th day of February, 2010
| | |
| Husky Energy Inc. |
| |
By: | | /s/ JOHN C.S. LAU |
| Name: | | John C.S. Lau |
| Title: | | President & Chief Executive Officer |
| |
By: | | /s/ JAMES D. GIRGULIS |
| Name: | | James D. Girgulis |
| Title: | | Vice President, Legal & Corporate Secretary |
Page v
Document A
Form 40-F
Annual Information Form
For the Year Ended December 31, 2009
Husky Energy Inc.
Annual Information Form
For the Year Ended December 31, 2009
February 24, 2010
TABLE OF CONTENTS
In this Annual Information Form the term “Husky,” “we,” “our,” “us,” and “the Company,” means Husky Energy Inc. and its subsidiaries and partnership interests on a consolidated basis including information with respect to predecessor corporations.
Unless otherwise indicated, all financial information is in accordance with accounting principles generally accepted in Canada. Unless otherwise indicated, gross reserves or gross production are reserves or production attributable to Husky’s interest prior to deduction of royalties; net reserves or net production are reserves or production net of such royalties. Gross or net production reported refers to sales volume, unless otherwise indicated. Natural gas volumes are converted to a barrels of oil equivalent (“boe”) basis using the ratio of six thousand cubic feet (“mcf”) of natural gas to one barrel (“bbl”) of oil and natural gas liquids. Unless otherwise indicated, oil and gas commodity prices are quoted after the effect of hedging gains and losses. Natural gas volumes are stated at the official temperature and pressure basis of the area in which the reserves are located. The calculation of boe and thousands of cubic feet equivalent (“mcfge”) are based on a conversion rate of six mcf to one bbl.
Page 3
The Company has disclosed discovered petroleum initially-in-place in this Annual Information Form. Discovered petroleum initially-in-place is that quantity of petroleum that is estimated, as of a given date, to be contained in known accumulations prior to production. The recoverable portion of discovered petroleum initially-in-place includes production, reserves and contingent resources; the remainder is unrecoverable. A recovery project cannot be defined for these volumes of discovered petroleum initially-in-place at this time. There is no certainty that it will be commercially viable to produce any portion of the resources.
Cautionary Note to U.S. Investors
The United States Securities and Exchange Commission (“SEC”) permits U.S. oil and gas companies, in their filings with the SEC, to separately disclose proved, probable and possible reserves that have been determined in accordance with SEC rules. Husky uses certain terms in this document, such as “discovered petroleum initially-in-place” that the SEC’s guidelines strictly prohibit in filings with the SEC by U.S. oil and gas companies.
Boe or mcfge may be misleading, particularly if used in isolation. A boe conversion ratio of six mcf to one bbl is based on an energy equivalency conversion method primarily applicable at the burner tip and does not represent a value equivalency at the wellhead.
This Annual Information Form contains “forward-looking information and statements” within the meaning of applicable securities laws. For a full discussion of the forward-looking information and statements and the risks to which they are subject, see the “Special Note Regarding Forward-Looking Statements” in this Annual Information Form.
EXCHANGE RATE INFORMATION
Except where otherwise indicated, all dollar amounts stated in this Annual Information Form (“AIF”) are Canadian dollars. The following table discloses various indicators of the Canadian/United States rate of exchange or the cost of a U.S. dollar in Canadian currency for the three years indicated.
| | | | | | |
| | | Year ended December 31 |
| | | 2009 | | 2008 | | 2007 |
Year end | | 1.047 | | 1.224 | | 0.988 |
Low | | 1.029 | | 0.972 | | 0.917 |
High | | 1.300 | | 1.297 | | 1.185 |
Average | | 1.136 | | 1.066 | | 1.074 |
Notes:
| (1) | The exchange rates were as quoted by the Federal Reserve Bank of New York for the noon buying rate. |
| (2) | The high, low and average rates were either quoted or calculated as of the last day of the relevant month. |
DISCLOSURE OF EXEMPTION UNDER NATIONAL INSTRUMENT 51-101
Husky believes that comparability of its disclosures with those required in its major capital market, the United States, is important to many of the investors and prospective investors in its securities. Accordingly, the Company applied for and was granted an exemption by the Canadian securities regulators under the provisions of National Instrument 51-101 “Standards of Disclosures for Oil and Gas Activities” (“NI 51-101”). The exemption permits Husky to disclose, according to the rules of the SEC and the Financial Accounting Standards Board in the United States (“FASB”) in place of much of the disclosure required by NI 51-101. In accordance with the
Page 4
exemption, proved and probable oil and gas reserves data and certain other disclosures with respect to Husky’s oil and gas activities in this Annual Information Form are presented in accordance with the following requirements:
| | • | | FASB Accounting Standards Codification 932, “Extractive Activities — Oil and Gas”; |
| | • | | FASB Current Text Section Oi5, “Oil and Gas Producing Activities” paragraphs .103, .106, .107, .108, .112, 160 through .167, .174 through ..184 and .401 through .408; |
| | • | | Regulation S-K (17 CFR 229.302(b)) Items 102, 302(b) and 1200 through 1208; and |
| | • | | The definitions and disclosures required by SEC Regulation S-X (CFR 210.4-10). |
Proved and probable oil and gas reserves information and other disclosures about oil and gas activities in this Annual Information Form are in accordance with SEC requirements and definitions and, accordingly, may differ from corresponding information otherwise required by NI 51-101.
NI 51-101 specifies that proved, probable and possible reserves be determined in accordance with the Canadian Oil and Gas Evaluation Handbook (“COGEH”) definitions. There were no material differences between the oil and gas reserves determined using the SEC definitions and the COGEH definitions.
Modernization of Oil and Gas Reporting
In December 2008, the SEC issued its final rule, Modernization of Oil and Gas Reporting (Release Nos. 33-8995; 34-59192; FR-78). The disclosure requirements under the final rule are effective for registration statements filed on or after January 1, 2010 and for annual reports for fiscal years ending on or after December 31, 2009. The final rule changes a number of oil and gas estimation and disclosure requirements, as well as definitions, under SEC regulations S-K and S-X.
Among the principal changes in the final rule are the requirements to use a price based on a 12-month average for reserves estimation and disclosure instead of a single period end price (NI 51-101 requires the evaluation of oil and gas reserves to be based on a forecast of economic conditions); allowing the optional disclosure of probable and possible reserves; expanding the definition of oil and gas activities to include certain non-traditional resources such as bitumen extracted from oil sands, oil and gas extracted from oil shales; modifying the definition of geographic area for disclosure of reserve estimates and production; amending the disclosures of proved reserve quantities to include separate disclosures of synthetic oil and gas; expanding proved undeveloped reserves disclosures (PUDs), including discussion of PUDs five years old or more; permitting the use of new reliable technologies to establish reasonable certainty of proved reserves; and disclosure of the chief technical person who oversees the Company’s overall reserves estimation process.
Husky believes that its reserves evaluators are qualified and that it has a well established reserves evaluation process that is at least as rigorous as would be the case were Husky to rely upon independent reserves evaluators. Husky has adopted written evaluation practices and procedures using the COGEH modified to the extent necessary to reflect the definitions and standards under SEC disclosure requirements. In addition, Husky engaged a firm of independent qualified reserves evaluators to conduct an audit of the reserves estimates and respective present worth value of the reserves as at December 31, 2009. They conducted their audit in accordance with the standards described in the COGEH and the auditing standards generally accepted in the United States.
The Audit Committee of the Board of Directors has reviewed the Company’s procedures for providing information to the internal and external qualified oil and gas reserves evaluators; met with the internal and external qualified oil and gas reserves evaluators to determine whether any restrictions placed by management affect the ability of the qualified oil and gas reserves evaluators to report without reservation; and reviewed the reserves data with management and the internal qualified reserves evaluator. An external consultant was engaged by the Audit Committee to provide an assessment and recommendation in respect of the oil and gas reserves evaluation and reporting process.
Page 5
NI 51-101 prescribes a relatively comprehensive set of disclosures in respect of oil and gas reserves and other disclosures about oil and gas activities. The SEC also prescribes an extensive set of disclosures but instructs reporting companies to remain flexible in their disclosure, where appropriate, in order to provide meaningful disclosure in the circumstances.
In either jurisdiction, information to further an investor’s understanding is specifically encouraged to be included in the Company’s Management’s Discussion and Analysis (“MD&A”). The MD&A is intended to be a narrative explanation describing the Company, both its history and prospects, as perceived by management. The readers of the AIF are encouraged to also read the Company’s MD&A, which is filed, in accordance with the requirements of the Canadian Securities Administrators, on the System for Electronic Data Analysis and Retrieval (“SEDAR”). Documents filed on SEDAR may be accessed online atwww.sedar.com. This AIF together with the MD&A and the Company’s Audited Consolidated Financial Statements are included in Husky’s Form 40-F which is filed with SEC’s Electronic Data Gathering Analysis and Retrieval (“EDGAR”) system, which may be accessed online atwww.sec.gov.
CORPORATE STRUCTURE
Husky Energy Inc.
Husky Energy Inc. was incorporated under theBusiness Corporations Act(Alberta) on June 21, 2000.
Husky Energy Inc. has its registered office and its head and principal office at 707 — 8th Avenue S.W., P.O. Box 6525, Station D, Calgary, Alberta, T2P 3G7.
Intercorporate Relationships
The principal subsidiaries of Husky and place of incorporation, continuance or place of organization, as the case may be, are as follows.(1) All of the following companies and partnerships, except as otherwise indicated, are 100% beneficially owned or controlled or directed, directly or indirectly.
| | |
Name | | Jurisdiction |
Subsidiaries of Husky Energy Inc. | | |
Husky Oil Operations Limited (“HOOL”) | | Nova Scotia |
| |
Subsidiaries of Husky Oil Operations Limited | | |
Husky Oil Limited Partnership | | Alberta |
Husky Terra Nova Partnership | | Alberta |
Husky Downstream General Partnership | | Alberta |
Husky Energy Marketing Partnership | | Alberta |
Sunrise Oil Sands Partnership (50%) | | Alberta |
BP Husky Refining LLC (50%) | | Delaware |
Lima Refining Company | | Delaware |
Husky Marketing and Supply Company | | Delaware |
Notes:
| (1) | Principal operating subsidiaries exclusive of intercorporate relationships due to financing related receivables and investments. |
Page 6
GENERAL DEVELOPMENT OF HUSKY
Three Year History of Husky
2007
On January 15, 2007, Husky acquired an interest in three Exploration Licences (“EL”) in the Jeanne d’Arc Basin offshore Newfoundland and Labrador. Husky acquired a 100% interest in EL 1099 covering 61,376 acres, a 50% interest in EL 1100 covering 75,545 acres and a 50% interest in EL 1101 covering 51,914 acres. Husky has committed to spend $23.5 million on these EL areas during the five year period commencing in 2007.
In January 2007, Husky signed a three-year contract with Seadrill Offshore AS for the deep water semi-submersible drilling rig,West Hercules. The rig, which was constructed in Korea, was delivered to Husky’s offshore properties in the South China Sea in late 2008. The rig commenced drilling operations in November 2008 and is scheduled to drill several delineation wells at the Liwan natural gas discovery and a number of stratigraphic test wells on Husky’s exploration blocks.
On June 19, 2007, Husky announced it had been awarded two exploration and exploitation licences by the governments of Greenland and Denmark. The licences are for Block 5 with an area of 10,138 sq km and Block 7 with an area of 10,929 sq km. These blocks are located in an offshore area west of Disko Island in West Greenland. Husky holds an 87.5% interest. Both of these licences expire on May 31, 2017.
Effective July 1, 2007, Husky acquired all of the issued and outstanding shares of the Lima Refining Company from The Premcor Refinery Group Inc., a wholly owned subsidiary of Valero Energy Corporation. The purchase price was U.S. $1.9 billion plus U.S. $540 million for feedstock and product inventory. The 160 mbbls/day refinery is located at Lima, Ohio.
On September 6, 2007, Husky announced the issuance of U.S. $300 million of 6.20% 10 year notes due September 15, 2017 and U.S. $450 million of 6.80% 30 year notes due September 15, 2037. These notes rank equally with Husky’s other unsecured debt. The net proceeds from the notes were used to partially repay a U.S. $1.5 billion short-term bridge financing arranged to acquire the Lima Refinery.
On October 11, 2007, Husky was awarded an additional exploration and exploitation licence by the governments of Greenland and Denmark. The licence is for Block 6 with an area of 13,213 sq km. Block 6 is located in an offshore area west of Disko Island in West Greenland. Husky holds a 43.75% interest. This licence will expire on May 31, 2017.
On October 30, 2007, Husky completed Gas Sales Agreements between Husky Oil (Madura) Ltd. and PT Inti Parna Raya, PT Inti Alasindo Energy and PT Perusahaan Gas Negara (Persero) Tbk (“PNG”) for the sale of natural gas from the Madura BD natural gas and natural gas liquids field offshore Java, Indonesia. The BD field is expected to be developed after receipt of an extension to the production sharing contract (“PSC”).
On December 4, 2007, Husky completed construction of the Minnedosa ethanol plant. The plant is located at Minnedosa, Manitoba and has the capacity to produce 130 million litres of ethanol for blending with gasoline.
On December 5, 2007, Husky announced an agreement with BP Canada Energy Company (“BP”) to create an integrated North American oil sands business. The business consists of a 50/50 partnership to develop the Sunrise oil sands project contributed and operated by Husky and a 50/50 limited liability company for the Toledo Refinery contributed and operated by BP. The transaction closed at the end of the first quarter of 2008 with an effective date of January 1, 2008.
On December 17, 2007, a framework agreement between the Province of Newfoundland and Labrador and Husky and its partner was signed for the development of North Amethyst, West White Rose and the South White Rose Extension. Under the terms of the agreement, a crown corporation of Newfoundland and Labrador acquired a 5% equity interest in the White Rose expansion oil fields in January 2009.
Page 7
2008
On January 18, 2008, Husky announced that it had secured the Transocean owned semi-submersible drilling rig,GSF Grand Banks, for continuing operations in the White Rose area and for continued delineation drilling offshore Newfoundland and Labrador. The three year agreement also includes an option for two additional one year extensions.
On March 11, 2008, Husky announced an agreement with Suncor (formerly Petro-Canada) and StatoilHydro to secure the semi-submersible drilling rig,Henry Goodrich, for a period of 24 to 30 months. Husky will use the rig on its operated properties offshore Newfoundland and Labrador for 17 months.
On March 31, 2008, Husky announced that all necessary government and regulatory approvals had been received and the arrangements for the formation of an integrated oil sands/refining joint venture with BP had been completed. The effective date of the transaction was January 1, 2008.
On April 2, 2008, Husky announced that it had received approval from the federal and provincial governments and regulators to proceed with the development of the North Amethyst oil field, a satellite of the South Avalon White Rose producing oil field.
On April 17, 2008, Husky announced that it had reached an agreement with China National Offshore Oil Corporation (“CNOOC”) to jointly develop the Madura BD natural gas and natural gas liquids field offshore the East Java Sea, Indonesia. The agreement covers the development and further exploration of the Madura Strait Production Sharing Contract. CNOOC paid U.S. $125 million to acquire a 50% equity interest in Husky Oil (Madura) Ltd., which holds the Madura Strait Production Sharing Contract.
On June 5, 2008, Husky repaid the remaining U.S. $750 million short-term bridge facility arranged in 2007 to acquire the Lima Refinery.
On June 12, 2008, Husky announced a cash tender offer to purchase any and all of its outstanding 8.90% Capital Securities. The offer was for payment of U.S. $1,010 per U.S. $1,000 principal amount plus accrued and unpaid interest. On July 11, 2008, 95% of the 8.90% Capital Securities had been validly tendered and accepted for payment. The Company subsequently redeemed all remaining 8.90% Capital Securities.
On June 25, 2008, Husky announced that it had signed a contract with CNOOC for an exploration block in the South China Sea. The 63/05 block covers approximately 1,777 sq km and is located in the Qiongdongnan Basin approximately 100 km south of Hainan Island, in less than 120m of water.
On August 29, 2008, Husky redeemed the 6.95% medium-term notes Series E at a redemption price of $208 million including accrued interest.
On September 11, 2008, Husky announced that it had acquired two parcels (Block 1 and 3) offshore Labrador, on the Labrador Shelf. Parcel NL07-2-1, Block 1, covers approximately 2,370 sq km and Parcel NL07-2-3, Block 3, covers approximately 2,337 sq km.
During 2008, Husky repurchased a total of U.S. $63 million of the outstanding U.S. $450 million 6.80% notes due September 2037.
2009
In 2009, theWest Hercules drilling rig completed drilling and testing of three appraisal wells at the Liwan 3-1 field on Block 29/26, in the South China Sea.
Page 8
In 2009, an application was made in the East Bawean II PSC to relinquish the block. The application was based on the drilling of two exploration wells, the Adiyasa 1 and Kukura 1, which were abandoned without testing in the third quarter.
Husky filed a debt shelf prospectus with the Alberta Securities Commission on February 26, 2009 and the SEC on February 27, 2009. The shelf prospectus enables Husky to offer up to U.S. $3.0 billion of debt securities in the U.S. until March 26, 2011.
On May 11, 2009, Husky issued U.S. $750 million of 5.90% notes due June 15, 2014 and U.S. $750 million of 7.25% notes due December 15, 2019 under the debt shelf prospectus filed in February 2009.
In August 2009, Husky completed theSeaRose FPSOmaintenance at the White Rose oil field and work on the satellite development is proceeding on schedule.
On October 29, 2009, Husky announced it has completed and tested two exploratory wells to evaluate the shale gas potential in the Montney and Doig formations in Northeast British Columbia, Canada.
On November 23, 2009, Husky announced the discovery of additional oil resources in the White Rose area. Analysis of results from the North Amethyst E-17 exploration well that was drilled in 2008 to the deeper Hibernia formation revealed 55 m of net oil-bearing reservoir.
On November 30, 2009, Husky announced an agreement to purchase Penn West Energy Trust heavy oil properties contained within Husky’s Lloydminister area of operations in Alberta and Saskatchewan. The asset acquisition provides Husky more than 6,000 barrels of oil production per day.
On December 8, 2009, Husky announced that theWest Herculesdrilling rig drilled a significant new natural gas discovery at Liuhau 34-2-1 on Block 29/26 in the South China Sea. The well tested natural gas with high liquids content at an equipment restricted rate of 55 mmcf/day, with indications that future well deliveries could exceed 140 mmcf/day.
On December 10, 2009, Husky announced that it has entered into an agreement with Suncor Energy Inc. and Suncor Energy Products Inc. to purchase 98 retail outlets in the Ontario market. The first site will be transferred to Husky in March 2010, with the remaining sites transferred between April and November 2010.
On December 21, 2009, Husky filed a debt shelf prospectus that enables Husky to offer up to $1.0 billion of medium term notes in Canada until January 21, 2012.
Page 9
Business Environment Trends
There are a number of trends that are developing, which may have both long and short-term effects on the oil and gas industry in Canada. Conventional production of crude oil in the Western Canada Sedimentary Basin (“WCSB”) has been in decline since 2000 and will, according to industry forecasts(1), continue to decline. Since 2000, increased crude oil production from the WCSB has come from mining and in-situ production of bitumen and heavy crude oil. An increase in overall crude oil production from the WCSB beyond current production levels is forecast(1) to be non-conventional production. Natural gas exploration efforts are focused on the traditionally less accessible areas in the overthrust belt along the eastern slope of the Rocky Mountains, in the Northwest Territories, offshore the East Coast of Canada and smaller shallow gas deposits and coal bed methane in the WCSB.
The trend of volatile commodity prices is expected to continue. Natural gas prices are sensitive to regional supply/demand imbalances, regional industrial activity levels, weather patterns and access to cheaper sources of energy. As a result of numerous supply disruptions and increased demand from emerging economies oil prices reached historic highs in 2008. Notwithstanding supply disruptions or major policy changes in respect of greenhouse gas emissions, recent forecasts(2) by the Energy Information Administration (“EIA”) in the United States indicates the possibility of crude oil production capacity increasing significantly over the next two decades, particularly conventional production from Brazil, Russia, Kazakhstan and with higher prices supporting economic viability, Canada’s oil sands could reach 4.5 mmbbls/day in 2035. Although crude oil prices declined significantly in the fourth quarter of 2008 in response to the economic downturn, prices improved during 2009 and the EIA’s reference case forecast prices continue to increase gradually as the world economy rebounds and global demand out paces supplies from non-OPEC producers.
The EIA short-term energy outlook(3) was published on February 10, 2010 and provides the following insights to the near-term energy environment. World energy demand is expected to continue to increase in 2010 and 2011, particularly in Asia. Although global oil inventories and spare production capacity are high, the EIA expects the Organization of Petroleum Exporting Countries (“OPEC”) to increase production in line with recovering global demand. Most of the OPEC’s spare capacity is concentrated in Saudi Arabia, who is not expected to over produce provided markets are stable and prices remain within its U.S. $70/bbl to U.S. $80/bbl target range.
DESCRIPTION OF HUSKY’S BUSINESS
General
Husky is a publicly held integrated international energy and energy related company headquartered in Calgary, Alberta, Canada.
Husky’s business is conducted predominantly in three major business sectors—upstream, midstream and downstream.
Upstream includes exploration for, development and production of crude oil, natural gas and natural gas liquids. The Company’s upstream operations and key prospects are located in Western Canada, offshore Eastern Canada, offshore Greenland, United States, offshore China, and offshore Indonesia (upstream business segment).
Notes:
| (1) | “Canadian Crude Oil Production and Supply forecast,” May 2006, Canadian Association of Petroleum Producers “Oil Sands Technology Roadmap,” January 30, 2004, Alberta Chamber of Resources. |
| (2) | Annual Energy Outlook 2010 Early Release Overview, December 2009, Energy Information Administration U.S. Department of Energy. |
| (3) | “Short-Term Energy Outlook,” February 10, 2010, Energy Information Administration U.S. Department of Energy. |
Page 10
Midstream includes upgrading of heavy crude oil feedstock into synthetic crude oil (upgrading); marketing of the Company’s and other producers’ crude oil, natural gas, natural gas liquids, sulphur and petroleum coke; pipeline transportation, processing of heavy crude oil, storage of crude oil, diluent and natural gas, and cogeneration of electrical and thermal energy (infrastructure and marketing).
Downstream includes refining of light and heavy crude oil, production of ethanol, and marketing of refined petroleum products including gasoline, diesel, jet fuel, blending stocks, ethanol blended fuels, asphalt and the marketing of a wide variety of merchandise through convenience stores at Husky’s retail outlet locations. The downstream sector includes the Canadian refined products business segment and the U.S. refining and marketing business segment.
Social and Environmental Policy
Husky approaches social responsibility and sustainable development by seeking a balance among economic, operational reliability, health, safety, environmental and social issues while maintaining growth. Husky strives to find solutions to these issues that do not compromise the needs of future generations. In 2008, Husky implemented the Husky Operational Integrity Management System (HOIMS) which is followed by all Husky businesses, with particular emphasis on projects and operations, and manages operational integrity through the life cycle of the assets. HOIMS includes 14 fundamental elements; each element contains well defined aims and expectations that guide Husky to continuously improve operational integrity performance. The aims outline the overall intent behind each element and expectations outline the individual activities that are undertaken to support the aims. HOIMS guides Husky employees in effectively managing the risks associated with Husky’s business and creating a safe and secure place to work. Resources are applied and dedicated to the continued implementation and execution of HOIMS, and progress will be monitored at all levels of the Company. Periodic reviews and audits are conducted to ensure that HOIMS is effectively integrated into daily operations and to continuously improve performance.
Aims:
| | 1. | Ensure all levels of management demonstrate leadership and commitment to operational integrity. Define and ensure appropriate accountability for HOIMS throughout the organization. |
| | 2. | Prevent incidents by identifying and minimizing workplace and personal health risks. Promote and reinforce all safe behaviours. |
| | 3. | Manage risks by performing comprehensive risk assessments to provide essential decision-making information. Develop and implement plans to manage significant risks and impacts to as low as reasonably practical levels. |
| | 4. | Be prepared for an emergency or security threat, identify all necessary actions to be taken to protect people, the environment, the organization’s assets and reputation in the event of an emergency or security threat. |
| | 5. | Maintain operations reliability and integrity by use of clearly defined and documented operational, maintenance, inspection and corrosion programs. Seek improvements in process and equipment dependability by systematically eliminating defects and sources of loss. |
| | 6. | Provide assurance that personnel possess the necessary competencies, knowledge, abilities and demonstrate behaviours to perform their tasks and designated responsibilities effectively, efficiently and safely. |
| | 7. | Report and investigate all incidents. Learn from incidents and use the information to take corrective action and prevent recurrence. |
| | 8. | Operate responsibly to minimize the environmental impact of how we conduct our business. Leave a positive legacy behind us when operations cease. |
Page 11
| | 9. | Ensure that risks and exposures from proposed changes are identified, evaluated and managed to remain at an acceptable level. |
| | 10. | Identify, maintain and safeguard important information. Ensure personnel can readily access and retrieve information. Promote and encourage constructive dialogue within the organization to share industry recommended practices and acquired knowledge. |
| | 11. | Ensure conformance with corporate policies and compliance with all relevant government regulations. Work constructively to influence proposed laws and regulations, and debate. |
| | 12. | Design, construct, commission, operate and decommission all assets in a healthy, safe, secure, environmentally sound, reliable and efficient manner. |
| | 13. | Ensure contractors and suppliers perform in a manner that is consistent and compatible with Husky’s policies and business performance standards. Ensure contracted services and procured materials meet the requirements and expectations of Husky’s standards. |
| | 14. | Confirm that HOIMS processes are implemented and assess whether they are working effectively. Measure progress and continually improve towards meeting HOIMS objectives, targets, and key performance indicators. |
The Health, Safety and Environment Committee of the Board of Directors is responsible for reviewing and recommending for approval by the Board of Directors updates to the health, safety and environment policy, the development with management and achievement of specific environmental objectives and targets, and for monitoring compliance with the Company’s environmental policies and regulatory requirements. The mandate of the Health, Safety and Environment Committee is available on the Husky website atwww.huskyenergy.com.
Environmental Protection
Husky’s operations are subject to various environmental requirements under federal, provincial, state and local laws and regulations, as well as international conventions. These laws and regulations cover matters such as air emissions, wastewater discharge, freshwater use, land disturbances and handling and disposal of waste materials. These laws and regulations have proliferated and become more complex over time, governing an increasingly broad aspect of the industry’s mode of operating and product characteristics. Husky continues to monitor emerging environmental laws and regulations and proactively implements programs as required for compliance. According to the American Petroleum Institute, between 1990 and 2007, reported environmental expenditures by the oil and gas industry in the United States increased by 85%.(1)
Husky is required by the Government of Canada to report facilities that emit greater than 50,000 tonnes of CO2E. The Lloydminster upgrader, Lloydminster refinery, Prince George refinery,SeaRose FPSO, Ram River gas plant, Rainbow Lake gas plant, Tucker thermal oil plant, Bolney steam assisted gravity drainage (“SAGD”) thermal plant and Pikes Peak CSS thermal plant, Lloydminster ethanol plant, Minnedosa ethanol plant are in this category. Husky has implemented an Environmental Performance Reporting System (“EPRS”) that will gather, consolidate, calculate, report and identify trends including greenhouse gas emissions. To ensure the integrity of the EPRS data, Husky will have an independent third party audit performed at Ram River gas plant and Tucker thermal oil plant. Husky is also a member of the Integrated CO2 Network, which is working to reduce greenhouse gas emissions. The group continues to study technologies in respect of capture, transportation and storage of CO2. A project is underway at Husky to review the engineering to capture, compress and liquefy CO2from the Lloydminster ethanol plant for injection into heavy oil fields for Enhanced Oil Recovery. At Lloydminster and Rainbow Lake, Husky utilizes cogeneration to produce both electricity and thermal energy for use at its
Note:
| (1) | “Environmental Expenditures by the U.S. Oil and Natural Gas Industry,” 2009, American Petroleum Institute. |
Page 12
processing facilities. This configuration has less adverse effects on the environment and is cost effective. Electrical energy in excess of Husky’s requirements is sold into the grid. Fugitive emissions are a contributor to greenhouse gas, a potential hazard and a waste of money. In 2009, Husky implemented a program to detect and repair leaks. At Husky’s Tucker SAGD project vapour recovery systems are in use on all tanks and process vessels.
Husky has undertaken programs to minimize water consumption, particularly freshwater, and minimize risk to water resources. At the Tucker project, 90% of water is recycled and very saline (i.e. non-potable) water is used for make-up water. Husky is implementing various technologies to reduce water usage. Husky’s alkaline surfactant polymer floods which increases the efficiency of water and the use of CO2 instead of water to mobilize heavy oil in the reservoir are being evaluated in pilots to reduce overall water consumption.
A large proportion of environmental costs are embedded in general capital costs, particularly when compliance is achieved by upgrading or expanding facilities. Husky continually implements a variety of initiatives that have cost efficiency, environmental protection and safety benefits. Such projects have included gas conservation, vapour recovery, boiler/heater efficiency and tank and pipeline integrity. At December 31, 2009, Husky had 473 retail locations in its light refined products operations, which consisted of 315 owned and leased locations (Husky controlled) and 156 independent retailer locations. An additional 98 owned and leased stations in the Toronto area will be added in 2010, acquired from Suncor/Petro-Canada. Husky is continually monitoring the owned and leased locations for environmental compliance and where required performing remediation, which have averaged approximately $6 million per year for the past five years. Husky also performs routine underground tank replacements. During 2009, 5 locations received new tanks at a cost of approximately $9 million.
Husky has several “legacy” (inactive facility) sites which require remediation. These inactive sites range from refinery sites to retail locations. In 2009, Husky spent $6 million on remediation and expects to spend approximately $15 million over the next three years to complete remediation of these locations. On-going remediation and reclamation work is occurring at over 3,000 abandoned well sites and 100 abandoned facility sites. Husky plans to spend $12 million to $15 million annually on these programs. Husky spent approximately $40 million in 2009 at the Lima Refinery in respect of vapour recovery, emission control and water treatment.
It is not possible to predict with certainty the amount of additional investment in new or existing facilities required to be incurred in the future for environmental protection or to address regulatory compliance requirements, such as reporting. Although these costs may be significant, Husky does not expect that they will have a material adverse effect on liquidity and financial position over the long-term.
Risk Factors
The following factors should be considered in evaluating Husky:
Adequacy of crude oil and natural gas prices
Husky’s results of operations and financial condition are dependent on the prices received for its crude oil and natural gas production. Lower prices for crude oil and natural gas could adversely affect the value and quantity of Husky’s oil and gas reserves. Husky has significant quantities of heavier grades of crude oil reserves that trade at a discount to light crude oil. Heavier grades of crude oil are typically more expensive to produce, process, transport and refine into high value refined products. Refining capacity for heavy crude oil is limited. As a result, wider price differentials could have adverse effects on financial performance and condition, reduce the value and quantities of Husky’s heavier crude oil reserves and delay or cancel projects that involve the development of heavier crude oil resources.
Prices for crude oil are based on world supply and demand. Supply and demand can be affected by a number of factors including, but not limited to, actions taken by OPEC, non-OPEC crude oil supply, social conditions in oil producing countries, the occurrence of natural disasters, general and specific economic conditions, prevailing weather patterns and the availability of alternate sources of energy.
Page 13
Husky’s natural gas production is located entirely in Western Canada and is, therefore, subject to North American market forces. North American natural gas supply and demand is affected by a number of factors including, but not limited to, the amount of natural gas available to specific market areas either from the well head or from storage facilities, prevailing weather patterns, the price of crude oil, the U.S. and Canadian economies, the occurrence of natural disasters and pipeline restrictions.
Demand for Husky’s other products and services and the cost of required inputs
Husky’s results of operations and financial condition are dependent on the price of refinery feedstock, the price of energy, the demand and pricing for refined petroleum products and electrical power and the ability of Husky to recover the increased cost of these inputs from the customer. Husky is also dependent on the demand for pipeline and processing capacity.
Reserves data and future net revenue estimates
The reserves data in this Annual Information Form represent estimates only. In general, estimates of economically recoverable crude oil and gas reserves and the future net cash flows therefrom are based upon a number of variable factors and assumptions, such as product prices, future operating and capital costs, historical production from the properties and the assumed effects of regulation by governmental agencies, including with respect to royalty payments, all of which may vary considerably from actual results. All such estimates are to some degree uncertain and classifications of reserves are only attempts to define the degree of uncertainty involved. For those reasons, estimates of the economically recoverable oil and gas reserves attributable to any particular group of properties, classification of such reserves based on risk of recovery and estimates of future net revenues expected therefrom, prepared by different engineers or by the same engineers at different times, may vary substantially.
Additions to reserves are required to maintain asset value and production
In order to maintain the Company’s future production of crude oil, natural gas and natural gas liquids and maintain the value of the reserves portfolio, additional reserves must be added through discoveries, extensions, improved recovery, performance related revisions and acquisitions. The production rate of oil and gas properties tends to decline as the reserves are depleted while the associated unit operating costs increase. In order to prevent this the Company must undertake successful exploration and development programs, increase the recovery factor from existing properties through applied technology and identify and execute strategic acquisitions of proved developed and undeveloped properties and unproved prospects. Maintaining an inventory of developable projects depends on, among other things, obtaining and renewing rights to explore, develop and produce oil and natural gas, drilling success, completing long-lead time capital intensive projects on budget and on schedule and the application of successful exploitation techniques on mature properties.
The Company’s reserve replacement ratio(2) for the last three years was as follows:
| | | | | | | | | |
| | | 2009 | | | 2008 | | | 2007 | |
Gross proved oil and gas reserves | | | | | | | | | |
Excluding acquisition & divestiture | | 121 | % | | NM | (1) | | 112 | % |
Including acquisition & divestiture | | 133 | % | | 9 | % | | 107 | % |
Net proved oil and gas reserves | | | | | | | | | |
Excluding acquisition & divestiture | | 118 | % | | 13 | % | | 100 | % |
Including acquisition & divestiture | | 130 | % | | 31 | % | | 95 | % |
Notes:
| (1) | NM means not meaningful. |
| (2) | Reserve replacement ratio calculated as reserves added during the period divided by total production during the period. |
Page 14
Competition
The energy industry is highly competitive with respect to gaining access to the resources required to increase oil and gas reserves and production and gain access to markets. Husky competes with others to acquire prospective lands, to retain drilling capacity and field operating and construction services, to attract and retain experienced skilled management and oil and gas professionals, to obtain sufficient pipeline and other transportation capacity, to gain access to and retain adequate markets for its products and services and gain access to capital markets. Husky’s ability to successfully complete development projects could be adversely affected by an inability to acquire economic supplies and services due to competition. Subsequent increases in the cost of, or delays in acquiring supplies and services could result in uneconomic projects. Husky’s competitors comprise all types of energy companies, some of which have greater resources.
Delays and cost overruns of capital projects
Husky is involved in capital projects such as exploration programs, development of oil and gas properties, plant and facilities construction, expansion and modification. Project delays can adversely affect expected cash flow and overall project costs thereby eroding project economics. Risk factors include, but are not limited to:
| | • | | availability and cost of capital; |
| | • | | availability of skilled labour; |
| | • | | availability of manufacturing capacity, supplies, material and equipment; |
| | • | | faulty construction and design errors; |
| | • | | accidents, labour disruptions, bankruptcies and productivity issues affecting Husky directly or indirectly; and |
| | • | | unexpected changes in the scope of a project. |
Business interruption of operations
Husky’s operations are subject to various risks with respect to normal operating conditions. These risks comprise, but are not limited to, explosions, blowouts, cratering, fires, severe storms and adverse weather, all forms of marine perils, release of toxic, combustible or explosive substances. These risks could cause loss of life, injury and destruction of public, private and Husky’s owned property.
The occurrence of any of the above listed events, or others not listed, could result in adverse financial performance and conditions that may not be fully recoverable from Husky’s insurers.
Foreign exchange risk
Husky’s results are affected by the exchange rate between the Canadian and U.S. dollar. The majority of expenditures are in Canadian dollars. The majority of revenues are received in U.S. dollars or from the sale of oil and gas commodities that receive prices determined by reference to U.S. benchmark prices. An increase in the value of the Canadian dollar relative to the U.S. dollar will decrease the revenues received from the sale of oil and gas commodities. Correspondingly, a decrease in the value of the Canadian dollar relative to the U.S. dollar will increase the revenues received from the sale of oil and gas commodities.
In addition, a change in the value of the Canadian dollar against the U.S. dollar will result in an increase or decrease in Husky’s U.S. dollar denominated debt, as expressed in Canadian dollars, as well as in the related interest expense. At December 31, 2009, 100% or $3.2 billion of Husky’s long-term debt was denominated in U.S. dollars. The percentage of long-term debt exposed to the U.S./Cdn exchange rate decreases to 88% when
Page 15
cross currency swaps are included. Additionally, U.S. $987 million of the Company’s U.S. dollar denominated debt has been designated as a hedge of a net investment and the unrealized foreign exchange gain is recorded in Other Comprehensive Income, further reducing the long-term debt exposed to the U.S./Cdn exchange rate to 57%.
The contribution receivable representing BP’s obligation to fund capital expenditures of the Sunrise partnership is denominated in U.S. dollars and gains and losses from changes in the value of the Canadian dollar versus the U.S. dollar are recorded in foreign exchange gains and losses in the current year. At December 31, 2009, Husky’s share of the balance of this receivable was U.S. $1.2 billion including accrued interest. Husky has an obligation to fund capital expenditures of the BP-Husky Toledo Refinery and this contribution payable is denominated in U.S. dollars. Gains and losses from the translation of this obligation are recorded in Other Comprehensive Income as this item relates to a self sustaining foreign operation. At December 31, 2009, Husky’s share of the balance of this obligation was U.S. $1.4 billion including accrued interest.
Environmental risks
All phases of the oil and natural gas business are subject to environmental regulation pursuant to a variety of federal, provincial, state and local laws and regulations, as well as international conventions (collectively, “environmental legislation”).
Environmental legislation imposes, among other things, restrictions, liabilities, and obligations in connection with the generation, handling, storage, transportation, treatment and disposal of hazardous substances and waste and in connection with spills, releases and emissions of various substances to the environment. Environmental legislation also requires that wells, facilities and other properties associated with Husky’s operations be operated, maintained, abandoned and reclaimed to the satisfaction of applicable regulatory authorities. In addition, certain types of operations, including exploration and development projects and significant changes to certain existing projects, may require the submission and approval of environmental impact assessments. Compliance with environmental legislation can require significant expenditures and failure to comply with environmental legislation may result in the imposition of fines and penalties and liability for clean-up costs and damages. Husky cannot be certain that the costs of complying with environmental legislation in the future will not be significant, however, Husky does not expect that they will have a material adverse effect on our financial condition and results of operations.
Husky anticipates that changes in environmental legislation may require reductions in emissions from its operations and result in increased capital expenditures. Further changes in environmental legislation could occur, which may result in stricter standards and enforcement, larger fines and liability, and increased capital expenditures and operating costs, which could have a material adverse effect on our financial condition and results of operations.
In 1994, the United Nations’ Framework Convention on Climate Change came into force and three years later led to the Kyoto Protocol, which requires the reduction of greenhouse gas emissions. On December 16, 2002, Canada ratified the Kyoto Protocol. In 2007, the world’s nations met again to gain the agreement of major countries that were not signatories to the Kyoto protocol such as the United States, China and India. This meeting in Bali, Indonesia did little to advance wider agreement on limiting greenhouse gases and setting new limits for emissions, which expire in 2012 under the Kyoto Protocol. These initiatives may require Husky to significantly reduce emissions at its operations of greenhouse gases such as carbon dioxide, which may increase capital expenditures. Details regarding the implementation of the Kyoto Protocol and the ultimate completion of the Bali agreement in 2009 remain unclear.
The Copenhagen Accord is a commitment by all major emitting countries to take action to avoid dangerous human interference with the climate system. In January 2010, countries committed to nationally appropriate mitigation actions. Canada has committed to cut greenhouse gas emissions by 17% below 2005 levels by 2020;
Page 16
this aligns Canada with the stated target of the United States. The commitments will be reviewed by 2015 to assess progress toward the long-term goal to limit the global average temperature rise to 1.5 degrees Celsius. The effect of the Copenhagen Accord on Husky is currently uncertain but will continue to evolve.
The Federal Government of Canada has announced certain regulations in respect of greenhouse gases and other pollutants. Although the impact of these regulations is uncertain, they may adversely affect the Company’s operations and increase costs. These regulations may become more onerous over time as public and political pressures increase to implement initiatives that further reduce the emission of greenhouse gases.
In June 2009, the United States House of Representatives passed the Waxman-Markey American Clean Energy and Security Act, which requires a 17% reduction of greenhouse gas emissions from 2005 levels by 2020 and an 80% reduction by 2050. The bill also sets a system of permitting under which regulated industries would need to acquire sufficient allowances for their emissions. In September 2009, the Kerry-Boxer Clean Energy Jobs and American Power Act, which increases the required reduction of greenhouse gases to 20% by 2020, was introduced in the United States Senate. Each bill requires further legislative approvals before becoming law and their respective scope and requirements could be changed through this process before receiving final approval. Husky’s operations may be impacted by whatever legislation emerges as law. Such legislation could require U.S. refining operations to significantly reduce emissions and/or purchase allowances, which may increase capital and operating expenditures.
Changes to government fiscal policy
All of Husky’s oil and gas production is subject to royalties which are potentially impacted by changes in government fiscal policies. The Company maintains close contact with governments in the areas within which it operates.
General economic conditions may have a material adverse effect on the Company’s results of operations, liquidity and financial condition
The current economic and financial crisis has contributed to increased uncertainty and a deterioration of near-term expectations in respect of the global economy. Although some evidence of improvement has been reported, there is no assurance that the crisis will not continue or worsen in the future. If the economic conditions do not improve, demand for petroleum products could continue to diminish and adversely affect the price the Company receives for its commodities. The Company’s cash flow could decline, assets could be impaired, future access to capital could be restricted and major development projects delayed.
The cost or availability of oil and gas field equipment adversely affects the Company’s ability to undertake exploration, development and construction projects
The oil and gas industry is cyclical in nature and is prone to shortages of supply of equipment and services including land and offshore drilling rigs, land and offshore geological and geophysical services, engineering and construction services and construction materials. These materials and services may not be available when required at a reasonable price.
International operations can have uncertain political, economic and other risks
The Company’s operations that are in certain jurisdictions may be adversely affected by political, economic or social instability or events. These events may include, but are not limited to, acts of war, terrorism, abduction, expropriation, onerous fiscal policy, renegotiation or nullification of agreements, imposition of onerous regulation, financial constraints and unreasonable taxation. This could adversely affect the Company’s interest in its foreign operations and future profitability.
Page 17
Climatic conditions may have significant adverse effects on operations
Demand for energy can be affected to a large degree by weather and climate. In addition, the Company’s exploration, production and construction operations can be affected by extreme weather, which may result in cessation of production, delay of exploration and development activities or delay of plant construction. All of these could potentially cause financial losses.
Recruitment, retention and succession
Failure to retain current employees and attract new skilled employees could materially affect the Company’s ability to conduct its business. Demand for qualified employees with appropriate experience remains high. In addition, a significant portion of the workforce will become eligible for retirement in the near term.
Credit rating risk
The Company’s debt instruments are rated by various credit rating agencies. These ratings affect the Company’s ability to gain access to reasonably priced debt financing. If any of the Company’s credit rating agencies downgrade the Company’s debt instruments it may restrict the Company’s ability to issue debt and may also increase the cost of borrowing, including existing credit facilities.
Page 18
Upstream Operations
Disclosures of Oil and Gas Activities
In the tables that follow, the following definitions apply: light crude oil (30° API and lighter), medium crude oil (between 20° and 30° API), heavy crude oil (between 20° API and 10° API and is liquid) and bitumen (solid or semi-solid with a viscosity greater than 10,000 centipoise).
Heavy crude oil and bitumen have been restated in accordance with the SEC definition of bitumen, as part of its new requirements for oil and gas reserves disclosure effective December 31, 2009. Under the new definition, a portion of crude oil previously reported as heavy crude oil has now been reclassified as bitumen. The presentation of heavy crude oil reported in prior periods has been restated to reflect the new definition.
Production
| | | | | | | | | | | | |
| | | 2009 |
| | | Total | | Western
Canada | | East
Coast | | Canada | | China | | Libya |
Crude Oil(mbbls/day) | | | | | | | | | | | | |
Light crude oil and NGL | | 89.1 | | 22.8 | | 55.1 | | 77.9 | | 11.1 | | 0.1 |
Medium crude oil | | 25.4 | | 25.4 | | — | | 25.4 | | — | | — |
Heavy crude oil | | 78.6 | | 78.6 | | — | | 78.6 | | — | | — |
Bitumen | | 23.1 | | 23.1 | | — | | 23.1 | | — | | — |
| | | | | | | | | | | | |
Total gross(1) | | 216.2 | | 149.9 | | 55.1 | | 205.0 | | 11.1 | | 0.1 |
| | | | | | | | | | | | |
Total net(1) | | 181.7 | | 130.5 | | 41.8 | | 172.3 | | 9.3 | | 0.1 |
| | | | | | | | | | | | |
Natural Gas(mmcf/day) | | | | | | | | | | | | |
Gross(1) | | 541.7 | | 541.7 | | — | | 541.7 | | — | | — |
| | | | | | | | | | | | |
Net(1) | | 457.3 | | 457.3 | | — | | 457.3 | | — | | — |
| | | | | | | | | | | | |
| |
| | | 2008 |
| | | Total | | Western
Canada | | East
Coast | | Canada | | China | | Libya |
Crude Oil(mbbls/day) | | | | | | | | | | | | |
Light crude oil and NGL | | 122.9 | | 24.6 | | 86.1 | | 110.7 | | 12.1 | | 0.1 |
Medium crude oil | | 26.9 | | 26.9 | | — | | 26.9 | | — | | — |
Heavy crude oil | | 84.4 | | 84.4 | | — | | 84.4 | | — | | — |
Bitumen | | 22.6 | | 22.6 | | — | | 22.6 | | — | | — |
| | | | | | | | | | | | |
Total gross(1) | | 256.8 | | 158.5 | | 86.1 | | 244.6 | | 12.1 | | 0.1 |
| | | | | | | | | | | | |
Total net(1) | | 206.8 | | 134.9 | | 62.7 | | 197.6 | | 9.1 | | 0.1 |
| | | | | | | | | | | | |
Natural Gas(mmcf/day) | | | | | | | | | | | | |
Gross(1) | | 594.4 | | 594.4 | | — | | 594.4 | | — | | — |
| | | | | | | | | | | | |
Net(1) | | 464.2 | | 464.2 | | — | | 464.2 | | — | | — |
| | | | | | | | | | | | |
| |
| | | 2007 |
| | | Total | | Western
Canada | | East
Coast | | Canada | | China | | Libya |
Crude Oil(mbbls/day) | | | | | | | | | | | | |
Light crude oil and NGL | | 138.7 | | 26.4 | | 99.5 | | 125.9 | | 12.7 | | 0.1 |
Medium crude oil | | 27.1 | | 27.1 | | — | | 27.1 | | — | | — |
Heavy crude oil | | 86.5 | | 86.5 | | — | | 86.5 | | — | | — |
Bitumen | | 20.4 | | 20.4 | | — | | 20.4 | | — | | — |
| | | | | | | | | | | | |
Total gross(1) | | 272.7 | | 160.4 | | 99.5 | | 259.9 | | 12.7 | | 0.1 |
| | | | | | | | | | | | |
Total net(1) | | 233.0 | | 134.6 | | 88.2 | | 222.8 | | 10.1 | | 0.1 |
| | | | | | | | | | | | |
Natural Gas(mmcf/day) | | | | | | | | | | | | |
Gross(1) | | 623.3 | | 623.3 | | — | | 623.3 | | — | | — |
| | | | | | | | | | | | |
Net(1) | | 492.3 | | 492.3 | | — | | 492.3 | | — | | — |
| | | | | | | | | | | | |
Note:
| (1) | Gross volumes are Husky’s lessor royalty, overriding royalty and working interest share of production before deduction of royalties. Net volumes are Husky’s gross volumes, less royalties. |
Page 19
Revenue
| | | | | | | | | | | | |
| | | 2009 |
| | | Total | | Western
Canada | | East
Coast | | Canada | | China | | Libya |
| | | ($ millions) |
Crude Oil | | | | | | | | | | | | |
Light crude oil and NGL | | 2,042 | | 455 | | 1,300 | | 1,755 | | 283 | | 4 |
Medium crude oil | | 522 | | 522 | | — | | 522 | | — | | — |
Heavy crude oil | | 1,507 | | 1,507 | | — | | 1,507 | | — | | — |
Bitumen | | 437 | | 437 | | — | | 437 | | — | | — |
| | | | | | | | | | | | |
Total gross | | 4,508 | | 2,921 | | 1,300 | | 4,221 | | 283 | | 4 |
| | | | | | | | | | | | |
Total net | | 3,650 | | 2,403 | | 1,010 | | 3,413 | | 233 | | 4 |
| | | | | | | | | | | | |
Natural Gas | | | | | | | | | | | | |
Gross | | 759 | | 759 | | — | | 759 | | — | | — |
| | | | | | | | | | | | |
Net | | 727 | | 727 | | — | | 727 | | — | | — |
| | | | | | | | | | | | |
Processing/Transportation | | 46 | | 46 | | — | | 46 | | — | | — |
| | | | | | | | | | | | |
| |
| | | 2008 |
| | | Total | | Western
Canada | | East
Coast | | Canada | | China | | Libya |
| | | ($ millions) |
Crude Oil | | | | | | | | | | | | |
Light crude oil and NGL | | 4,374 | | 780 | | 3,157 | | 3,937 | | 433 | | 4 |
Medium crude oil | | 805 | | 805 | | — | | 805 | | — | | — |
Heavy crude oil | | 2,223 | | 2,223 | | — | | 2,223 | | — | | — |
Bitumen | | 582 | | 582 | | — | | 582 | | — | | — |
| | | | | | | | | | | | |
Total gross | | 7,984 | | 4,390 | | 3,157 | | 7,547 | | 433 | | 4 |
| | | | | | | | | | | | |
Total net | | 6,225 | | 3,621 | | 2,289 | | 5,910 | | 312 | | 3 |
| | | | | | | | | | | | |
Natural Gas | | | | | | | | | | | | |
Gross | | 1,876 | | 1,876 | | — | | 1,876 | | — | | — |
| | | | | | | | | | | | |
Net | | 1,563 | | 1,563 | | — | | 1,563 | | — | | — |
| | | | | | | | | | | | |
Processing/Transportation | | 72 | | 72 | | — | | 72 | | — | | — |
| | | | | | | | | | | | |
| |
| | | 2007 |
| | | Total | | Western
Canada | | East
Coast | | Canada | | China | | Libya |
| | | ($ millions) |
Crude Oil | | | | | | | | | | | | |
Light crude oil and NGL | | 3,722 | | 626 | | 2,736 | | 3,362 | | 357 | | 3 |
Medium crude oil | | 504 | | 504 | | — | | 504 | | — | | — |
Heavy crude oil | | 1,276 | | 1,276 | | — | | 1,276 | | — | | — |
Bitumen | | 291 | | 291 | | — | | 291 | | — | | — |
| | | | | | | | | | | | |
Total gross | | 5,793 | | 2,697 | | 2,736 | | 5,433 | | 357 | | 3 |
| | | | | | | | | | | | |
Total net | | 4,965 | | 2,256 | | 2,421 | | 4,677 | | 285 | | 3 |
| | | | | | | | | | | | |
Natural Gas | | | | | | | | | | | | |
Gross | | 1,430 | | 1,430 | | — | | 1,430 | | — | | — |
| | | | | | | | | | | | |
Net | | 1,200 | | 1,200 | | — | | 1,200 | | — | | — |
| | | | | | | | | | | | |
Processing/Transportation | | 64 | | 64 | | — | | 64 | | — | | — |
| | | | | | | | | | | | |
Page 20
Sales Prices
| | | | | | | | | | | | |
| | | 2009 |
| | | Total | | Western
Canada | | East
Coast | | Canada | | China | | Libya |
Crude Oil($/bbl) | | | | | | | | | | | | |
Light crude oil and NGL | | 62.70 | | 54.62 | | 64.60 | | 61.68 | | 69.62 | | 80.28 |
Medium crude oil | | 56.37 | | 56.37 | | — | | 56.37 | | — | | — |
Heavy crude oil | | 52.54 | | 52.54 | | — | | 52.54 | | — | | — |
Bitumen | | 51.90 | | 51.90 | | — | | 51.90 | | — | | — |
| | | | | | | | | | | | |
Total crude oil and NGL | | 57.11 | | 53.40 | | 64.60 | | 56.42 | | 69.62 | | 80.28 |
| | | | | | | | | | | | |
Natural Gas($/mcf) | | 3.83 | | 3.83 | | — | | 3.83 | | — | | — |
| | | | | | | | | | | | |
| | | 2008 |
| | | Total | | Western
Canada | | East
Coast | | Canada | | China | | Libya |
Crude Oil($/bbl) | | | | | | | | | | | | |
Light crude oil and NGL | | 97.28 | | 86.65 | | 100.12 | | 97.13 | | 98.56 | | 118.97 |
Medium crude oil | | 81.79 | | 81.79 | | — | | 81.79 | | — | | — |
Heavy crude oil | | 71.98 | | 71.98 | | — | | 71.98 | | — | | — |
Bitumen | | 70.24 | | 70.24 | | — | | 70.24 | | — | | — |
| | | | | | | | | | | | |
Total crude oil and NGL | | 84.96 | | 75.67 | | 100.12 | | 84.28 | | 98.56 | | 118.97 |
| | | | | | | | | | | | |
Natural Gas($/mcf) | | 7.94 | | 7.94 | | — | | 7.94 | | — | | — |
| | | | | | | | | | | | |
| | | 2007 |
| | | Total | | Western
Canada | | East
Coast | | Canada | | China | | Libya |
Crude Oil($/bbl) | | | | | | | | | | | | |
Light crude oil and NGL | | 73.54 | | 65.01 | | 75.37 | | 73.18 | | 77.03 | | 82.21 |
Medium crude oil | | 51.12 | | 51.12 | | — | | 51.12 | | — | | — |
Heavy crude oil | | 40.43 | | 40.43 | | — | | 40.43 | | — | | — |
Bitumen | | 38.96 | | 38.96 | | — | | 38.96 | | — | | — |
| | | | | | | | | | | | |
Total crude oil and NGL | | 58.24 | | 46.12 | | 75.37 | | 57.31 | | 77.03 | | 82.21 |
| | | | | | | | | | | | |
Natural Gas($/mcf) | | 6.19 | | 6.19 | | — | | 6.19 | | — | | — |
Page 21
Capital Expenditures
| | | | | | | | | | | | | | | | | | |
| | | 2009 |
| | | Total | | Western
Canada | | East
Coast | | Canada | | United
States | | China | | Greenland | | Indonesia | | Libya |
| | | ($ millions) |
Property acquisition | | 309 | | 307 | | — | | 307 | | 2 | | — | | — | | — | | — |
Exploration | | 841 | | 228 | | 64 | | 292 | | 23 | | 457 | | 32 | | 37 | | — |
Development | | 1,176 | | 654 | | 510 | | 1,164 | | — | | 7 | | — | | — | | 5 |
| | | | | | | | | | | | | | | | | | |
| | 2,326 | | 1,189 | | 574 | | 1,763 | | 25 | | 464 | | 32 | | 37 | | 5 |
| | | | | | | | | | | | | | | | | | |
| |
| | | 2008 |
| | | Total | | Western
Canada | | East
Coast | | Canada | | United
States | | China | | Greenland | | Indonesia | | Libya |
| | | ($ millions) |
Property acquisition | | 530 | | 485 | | — | | 485 | | 45 | | — | | — | | — | | — |
Exploration | | 836 | | 436 | | 160 | | 596 | | 15 | | 214 | | — | | 11 | | — |
Development | | 2,214 | | 1,640 | | 569 | | 2,209 | | — | | 3 | | — | | — | | 2 |
| | | | | | | | | | | | | | | | | | |
| | 3,580 | | 2,561 | | 729 | | 3,290 | | 60 | | 217 | | — | | 11 | | 2 |
| | | | | | | | | | | | | | | | | | |
| |
| | | 2007 |
| | | Total | | Western
Canada | | East
Coast | | Canada | | United
States | | China | | Greenland | | Indonesia | | Libya |
| | | ($ millions) |
Property acquisition | | 172 | | 172 | | — | | 172 | | — | | — | | — | | — | | — |
Exploration | | 564 | | 410 | | 83 | | 493 | | — | | 54 | | — | | 17 | | — |
Development | | 1,652 | | 1,449 | | 197 | | 1,646 | | — | | 1 | | — | | 5 | | — |
| | | | | | | | | | | | | | | | | | |
| | 2,388 | | 2,031 | | 280 | | 2,311 | | — | | 55 | | — | | 22 | | — |
| | | | | | | | | | | | | | | | | | |
Page 22
Oil and Gas Netbacks(1)
| | | | | | | | | | | | |
| | | 2009 |
| | | Total | | Western
Canada | | East
Coast | | Canada | | China | | Libya |
Crude Oil($/bbl) | | | | | | | | | | | | |
Light crude oil | | | | | | | | | | | | |
Sales revenue | | 62.38 | | 52.28 | | 64.60 | | 61.28 | | 69.62 | | 80.28 |
Royalties | | 13.36 | | 6.03 | | 16.34 | | 13.56 | | 12.16 | | — |
Operating costs | | 9.96 | | 15.79 | | 8.73 | | 10.63 | | 5.35 | | 16.35 |
| | | | | | | | | | | | |
Netback | | 39.06 | | 30.46 | | 39.53 | | 37.09 | | 52.11 | | 63.93 |
| | | | | | | | | | | | |
Medium crude oil | | | | | | | | | | | | |
Sales revenue | | 54.88 | | 54.88 | | — | | 54.88 | | — | | — |
Royalties | | 8.67 | | 8.67 | | — | | 8.67 | | — | | — |
Operating costs | | 15.40 | | 15.40 | | — | | 15.40 | | — | | — |
| | | | | | | | | | | | |
Netback | | 30.81 | | 30.81 | | — | | 30.81 | | — | | — |
| | | | | | | | | | | | |
Heavy crude oil | | | | | | | | | | | | |
Sales revenue | | 51.95 | | 51.95 | | — | | 51.95 | | — | | — |
Royalties | | 7.24 | | 7.24 | | — | | 7.24 | | — | | — |
Operating costs | | 13.26 | | 13.26 | | — | | 13.26 | | — | | — |
| | | | | | | | | | | | |
Netback | | 31.45 | | 31.45 | | — | | 31.45 | | — | | — |
| | | | | | | | | | | | |
Bitumen | | | | | | | | | | | | |
Sales revenue | | 51.90 | | 51.90 | | — | | 51.90 | | — | | — |
Royalties | | 7.13 | | 7.13 | | — | | 7.13 | | — | | — |
Operating costs | | 16.38 | | 16.38 | | — | | 16.38 | | — | | — |
| | | | | | | | | | | | |
Netback | | 28.39 | | 28.39 | | — | | 28.39 | | — | | — |
| | | | | | | | | | | | |
Total crude oil | | | | | | | | | | | | |
Sales revenue | | 56.49 | | 52.50 | | 64.60 | | 55.76 | | 69.62 | | 80.28 |
Royalties | | 9.86 | | 7.31 | | 16.34 | | 9.74 | | 12.16 | | — |
Operating costs | | 12.53 | | 14.46 | | 8.73 | | 12.92 | | 5.35 | | 16.35 |
| | | | | | | | | | | | |
Netback | | 34.10 | | 30.73 | | 39.53 | | 33.10 | | 52.11 | | 63.93 |
| | | | | | | | | | | | |
Natural Gas($/mcf) | | | | | | | | | | | | |
Sales revenue | | 4.08 | | 4.08 | | — | | 4.08 | | — | | — |
Royalties | | 0.42 | | 0.42 | | — | | 0.42 | | — | | — |
Operating costs | | 1.69 | | 1.69 | | — | | 1.69 | | — | | — |
| | | | | | | | | | | | |
Netback | | 1.97 | | 1.97 | | — | | 1.97 | | — | | — |
| | | | | | | | | | | | |
Equivalent Unit($boe) | | | | | | | | | | | | |
Sales revenue | | 47.06 | | 41.98 | | 64.60 | | 46.21 | | 69.62 | | 80.28 |
Royalties | | 7.70 | | 5.51 | | 16.34 | | 7.53 | | 12.16 | | — |
Operating costs | | 11.82 | | 12.86 | | 8.73 | | 12.09 | | 5.35 | | 16.35 |
| | | | | | | | | | | | |
Netback | | 27.54 | | 23.61 | | 39.53 | | 26.59 | | 52.11 | | 63.93 |
| | | | | | | | | | | | |
Note:
| (1) | Netbacks reflect the results of operations for leases classified as oil or natural gas. Co-products, such as natural gas produced at an oil property or natural gas liquids produced at a natural gas property, have been converted to equivalent units of oil or natural gas depending on the lease product classification. |
Page 23
Oil and Gas Netbacks(1) (continued)
| | | | | | | | | | | | |
| | | 2008 |
| | | Total | | Western
Canada | | East
Coast | | Canada | | China | | Libya |
Crude Oil($/bbl) | | | | | | | | | | | | |
Light crude oil | | | | | | | | | | | | |
Sales revenue | | 96.73 | | 82.97 | | 100.12 | | 96.51 | | 98.56 | | 118.97 |
Royalties | | 25.14 | | 11.53 | | 28.45 | | 24.89 | | 27.65 | | — |
Operating costs | | 6.56 | | 13.90 | | 4.99 | | 6.74 | | 4.78 | | 17.35 |
| | | | | | | | | | | | |
Netback | | 65.03 | | 57.54 | | 66.68 | | 64.88 | | 66.13 | | 101.62 |
| | | | | | | | | | | | |
Medium crude oil | | | | | | | | | | | | |
Sales revenue | | 79.91 | | 79.91 | | — | | 79.91 | | — | | — |
Royalties | | 13.91 | | 13.91 | | — | | 13.91 | | — | | — |
Operating costs | | 15.60 | | 15.60 | | — | | 15.60 | | — | | — |
| | | | | | | | | | | | |
Netback | | 50.40 | | 50.40 | | — | | 50.40 | | — | | — |
| | | | | | | | | | | | |
Heavy crude oil | | | | | | | | | | | | |
Sales revenue | | 71.45 | | 71.45 | | — | | 71.45 | | — | | — |
Royalties | | 10.55 | | 10.55 | | — | | 10.55 | | — | | — |
Operating costs | | 13.68 | | 13.68 | | — | | 13.68 | | — | | — |
| | | | | | | | | | | | |
Netback | | 47.22 | | 47.22 | | — | | 47.22 | | — | | — |
| | | | | | | | | | | | |
Bitumen | | | | | | | | | | | | |
Sales revenue | | 70.24 | | 70.24 | | — | | 70.24 | | — | | — |
Royalties | | 10.42 | | 10.42 | | — | | 10.42 | | — | | — |
Operating costs | | 22.93 | | 22.93 | | — | | 22.93 | | — | | — |
| | | | | | | | | | | | |
Netback | | 36.89 | | 36.89 | | — | | 36.89 | | — | | — |
| | | | | | | | | | | | |
Total crude oil | | | | | | | | | | | | |
Sales revenue | | 84.13 | | 74.43 | | 100.12 | | 83.47 | | 98.56 | | 118.97 |
Royalties | | 17.75 | | 11.26 | | 28.45 | | 17.28 | | 27.65 | | — |
Operating costs | | 11.39 | | 15.27 | | 4.99 | | 11.68 | | 4.78 | | 17.35 |
| | | | | | | | | | | | |
Netback | | 54.99 | | 47.90 | | 66.68 | | 54.51 | | 66.13 | | 101.62 |
| | | | | | | | | | | | |
Natural Gas($/mcf) | | | | | | | | | | | | |
Sales revenue | | 8.21 | | 8.21 | | — | | 8.21 | | — | | — |
Royalties | | 1.60 | | 1.60 | | — | | 1.60 | | — | | — |
Operating costs | | 1.59 | | 1.59 | | — | | 1.59 | | — | | — |
| | | | | | | | | | | | |
Netback | | 5.02 | | 5.02 | | — | | 5.02 | | — | | — |
| | | | | | | | | | | | |
Equivalent Unit($boe) | | | | | | | | | | | | |
Sales revenue | | 74.57 | | 64.89 | | 100.12 | | 73.72 | | 98.56 | | 118.97 |
Royalties | | 15.52 | | 10.63 | | 28.45 | | 15.09 | | 27.65 | | — |
Operating costs | | 10.93 | | 13.16 | | 4.99 | | 11.14 | | 4.78 | | 17.35 |
| | | | | | | | | | | | |
Netback | | 48.12 | | 41.10 | | 66.68 | | 47.49 | | 66.13 | | 101.62 |
| | | | | | | | | | | | |
Note:
| (1) | Netbacks reflect the results of operations for leases classified as oil or natural gas. Co-products, such as natural gas produced at an oil property or natural gas liquids produced at a natural gas property, have been converted to equivalent units of oil or natural gas depending on the lease product classification. |
Page 24
Oil and Gas Netbacks(1) (continued)
| | | | | | | | | | | | |
| | | 2007 |
| | | Total | | Western
Canada | | East
Coast | | Canada | | China | | Libya |
Crude Oil($/bbl) | | | | | | | | | | | | |
Light crude oil | | | | | | | | | | | | |
Sales revenue | | 72.94 | | 61.02 | | 75.37 | | 72.56 | | 77.03 | | 82.21 |
Royalties | | 9.72 | | 7.87 | | 9.43 | | 9.12 | | 15.63 | | — |
Operating costs | | 5.70 | | 13.24 | | 4.07 | | 5.89 | | 3.68 | | 23.12 |
| | | | | | | | | | | | |
Netback | | 57.52 | | 39.91 | | 61.87 | | 57.55 | | 57.72 | | 59.09 |
| | | | | | | | | | | | |
Medium crude oil | | | | | | | | | | | | |
Sales revenue | | 50.42 | | 50.42 | | — | | 50.42 | | — | | — |
Royalties | | 8.89 | | 8.89 | | — | | 8.89 | | — | | — |
Operating costs | | 13.92 | | 13.92 | | — | | 13.92 | | — | | — |
| | | | | | | | | | | | |
Netback | | 27.61 | | 27.61 | | — | | 27.61 | | — | | — |
| | | | | | | | | | | | |
Heavy crude oil | | | | | | | | | | | | |
Sales revenue | | 40.35 | | 40.35 | | — | | 40.35 | | — | | — |
Royalties | | 5.48 | | 5.48 | | — | | 5.48 | | — | | — |
Operating costs | | 11.03 | | 11.03 | | — | | 11.03 | | — | | — |
| | | | | | | | | | | | |
Netback | | 23.84 | | 23.84 | | — | | 23.84 | | — | | — |
| | | | | | | | | | | | |
Bitumen | | | | | | | | | | | | |
Sales revenue | | 38.96 | | 38.96 | | — | | 38.96 | | — | | — |
Royalties | | 4.33 | | 4.33 | | — | | 4.33 | | — | | — |
Operating costs | | 20.54 | | 20.54 | | — | | 20.54 | | — | | — |
| | | | | | | | | | | | |
Netback | | 14.09 | | 14.09 | | — | | 14.09 | | — | | — |
| | | | | | | | | | | | |
Total crude oil | | | | | | | | | | | | |
Sales revenue | | 57.60 | | 45.13 | | 75.37 | | 56.65 | | 77.03 | | 82.21 |
Royalties | | 7.87 | | 6.30 | | 9.43 | | 7.49 | | 15.63 | | — |
Operating costs | | 9.37 | | 13.07 | | 4.07 | | 9.64 | | 3.68 | | 23.12 |
| | | | | | | | | | | | |
Netback | | 40.36 | | 25.76 | | 61.87 | | 39.52 | | 57.72 | | 59.09 |
| | | | | | | | | | | | |
Natural Gas($/mcf) | | | | | | | | | | | | |
Sales revenue | | 6.42 | | 6.42 | | — | | 6.42 | | — | | — |
Royalties | | 1.23 | | 1.23 | | — | | 1.23 | | — | | — |
Operating costs | | 1.39 | | 1.39 | | — | | 1.39 | | — | | — |
| | | | | | | | | | | | |
Netback | | 3.80 | | 3.80 | | — | | 3.80 | | — | | — |
| | | | | | | | | | | | |
Equivalent Unit($boe) | | | | | | | | | | | | |
Sales revenue | | 52.41 | | 42.57 | | 75.37 | | 51.54 | | 77.03 | | 82.21 |
Royalties | | 7.74 | | 6.72 | | 9.43 | | 7.46 | | 15.63 | | — |
Operating costs | | 9.09 | | 11.24 | | 4.07 | | 9.28 | | 3.68 | | 23.12 |
| | | | | | | | | | | | |
Netback | | 35.58 | | 24.61 | | 61.87 | | 34.80 | | 57.72 | | 59.09 |
| | | | | | | | | | | | |
Note:
| (1) | Netbacks reflect the results of operations for leases classified as oil or natural gas. Co-products, such as natural gas produced at an oil property or natural gas liquids produced at a natural gas property, have been converted to equivalent units of oil or natural gas depending on the lease product classification. |
Page 25
Productive Wells
| | | | | | | | | | | | |
| | | Oil Wells | | Natural Gas Wells | | Total |
| | | Gross (1)(2) | | Net(1) | | Gross (1)(2) | | Net(1) | | Gross (1)(2) | | Net(1) |
Canada | | | | | | | | | | | | |
Alberta | | 4,281 | | 3,395 | | 5,834 | | 4,480 | | 10,115 | | 7,875 |
Saskatchewan | | 5,818 | | 4,789 | | 1,395 | | 1,261 | | 7,213 | | 6,050 |
British Columbia | | 203 | | 58 | | 253 | | 214 | | 456 | | 272 |
Newfoundland | | 23 | | 8 | | — | | — | | 23 | | 8 |
| | | | | | | | | | | | |
| | 10,325 | | 8,250 | | 7,482 | | 5,955 | | 17,807 | | 14,205 |
| | | | | | | | | | | | |
International | | | | | | | | | | | | |
China | | 31 | | 12 | | — | | — | | 31 | | 12 |
Libya | | 2 | | 1 | | — | | — | | 2 | | 1 |
| | | | | | | | | | | | |
| | 33 | | 13 | | — | | — | | 33 | | 13 |
| | | | | | | | | | | | |
As at December 31, 2009 | | 10,358 | | 8,263 | | 7,482 | | 5,955 | | 17,840 | | 14,218 |
| | | | | | | | | | | | |
Canada | | | | | | | | | | | | |
Alberta | | 4,276 | | 3,406 | | 5,631 | | 4,346 | | 9,907 | | 7,752 |
Saskatchewan | | 5,697 | | 4,682 | | 1,318 | | 1,205 | | 7,015 | | 5,887 |
British Columbia | | 203 | | 58 | | 259 | | 205 | | 462 | | 263 |
Newfoundland | | 23 | | 8 | | — | | — | | 23 | | 8 |
| | | | | | | | | | | | |
| | 10,199 | | 8,154 | | 7,208 | | 5,756 | | 17,407 | | 13,910 |
| | | | | | | | | | | | |
International | | | | | | | | | | | | |
China | | 29 | | 12 | | — | | — | | 29 | | 12 |
Libya | | 2 | | 1 | | — | | — | | 2 | | 1 |
| | | | | | | | | | | | |
| | 31 | | 13 | | — | | — | | 31 | | 13 |
| | | | | | | | | | | | |
As at December 31, 2008 | | 10,230 | | 8,167 | | 7,208 | | 5,756 | | 17,438 | | 13,923 |
| | | | | | | | | | | | |
Canada | | | | | | | | | | | | |
Alberta | | 4,090 | | 3,211 | | 5,489 | | 4,274 | | 9,579 | | 7,485 |
Saskatchewan | | 5,479 | | 4,514 | | 1,192 | | 1,085 | | 6,671 | | 5,599 |
British Columbia | | 204 | | 58 | | 239 | | 170 | | 443 | | 228 |
Newfoundland | | 22 | | 7 | | — | | — | | 22 | | 7 |
| | | | | | | | | | | | |
| | 9,795 | | 7,790 | | 6,920 | | 5,529 | | 16,715 | | 13,319 |
| | | | | | | | | | | | |
International | | | | | | | | | | | | |
China | | 29 | | 12 | | — | | — | | 29 | | 12 |
Libya | | 2 | | 1 | | — | | — | | 2 | | 1 |
| | | | | | | | | | | | |
| | 31 | | 13 | | — | | — | | 31 | | 13 |
| | | | | | | | | | | | |
As at December 31, 2007 | | 9,826 | | 7,803 | | 6,920 | | 5,529 | | 16,746 | | 13,332 |
| | | | | | | | | | | | |
Notes:
| (1) | The number of gross wells is the total number of wells in which Husky owns a working interest. The number of net wells is the sum of the fractional interests owned in the gross wells. Productive wells are those producing or capable of producing at December 31, 2009. |
| (2) | The above table does not include producing wells in which Husky has no working interest but does have a royalty interest. At December 31, 2009, Husky had a royalty interest in 3,881 wells of which 1,248 were oil producers and 2,633 were gas producers. |
| (3) | For purposes of the above table, multiple completions are counted as a single well. Where one of the completions in a given well is an oil completion, the well is classified as an oil well. In 2009, there were 361 gross, 345 net oil wells and 855 gross, 713 net natural gas wells which were completed in two or more formations and from which production is not commingled. |
Page 26
Landholdings
| | | | |
| | | Developed Acreage |
| | | Gross | | Net |
| | | (thousands of acres) |
As at December 31, 2009 | | | | |
Western Canada | | |
Alberta | | 4,100 | | 2,692 |
Saskatchewan | | 856 | | 672 |
British Columbia | | 168 | | 128 |
| | | | |
| | 5,124 | | 3,492 |
| | | | |
Eastern Canada | | 54 | | 18 |
| | | | |
| | 5,178 | | 3,510 |
| | | | |
China | | 17 | | 7 |
Libya | | 7 | | 2 |
| | | | |
| | 5,202 | | 3,519 |
| | | | |
As at December 31, 2008 | | | | |
Western Canada | | |
Alberta | | 3,159 | | 2,658 |
Saskatchewan | | 779 | | 657 |
British Columbia | | 167 | | 114 |
| | | | |
| | 4,105 | | 3,429 |
| | | | |
Eastern Canada | | 54 | | 18 |
| | | | |
| | 4,159 | | 3,447 |
| | | | |
China | | 17 | | 7 |
Libya | | 7 | | 2 |
| | | | |
| | 4,183 | | 3,456 |
| | | | |
As at December 31, 2007 | | | | |
Western Canada | | | | |
Alberta | | 3,102 | | 2,610 |
Saskatchewan | | 638 | | 574 |
British Columbia | | 183 | | 115 |
| | | | |
| | 3,923 | | 3,299 |
| | | | |
Eastern Canada | | 42 | | 9 |
| | | | |
| | 3,965 | | 3,308 |
| | | | |
China | | 17 | | 7 |
Libya | | 7 | | 2 |
| | | | |
| | 3,989 | | 3,317 |
| | | | |
Page 27
Landholdings (continued)
| | | | |
| | | Undeveloped Acreage |
| | | Gross | | Net |
| | | (thousands of acres) |
As at December 31, 2009 | | | | |
Western Canada | | | | |
Alberta | | 4,941 | | 3,523 |
Saskatchewan | | 1,571 | | 1,384 |
British Columbia | | 996 | | 739 |
Manitoba | | 4 | | 1 |
| | | | |
| | 7,512 | | 5,647 |
| | | | |
Northwest Territories and Arctic | | 1,207 | | 487 |
Eastern Canada | | 5,128 | | 3,137 |
| | | | |
| | 13,847 | | 9,271 |
| | | | |
United States | | 1,707 | | 422 |
| | | | |
China | | 1,970 | | 1,970 |
| | | | |
Indonesia | | 1,940 | | 1,595 |
| | | | |
Greenland | | 8,471 | | 5,983 |
| | | | |
| | 27,935 | | 19,241 |
| | | | |
As at December 31, 2008 | | | | |
Western Canada | | | | |
Alberta | | 4,287 | | 3,743 |
Saskatchewan | | 1,563 | | 1,473 |
British Columbia | | 962 | | 662 |
Manitoba | | 1 | | 1 |
| | | | |
| | 6,813 | | 5,879 |
| | | | |
Northwest Territories and Arctic | | 1,042 | | 629 |
Eastern Canada | | 4,364 | | 3,192 |
| | | | |
| | 12,219 | | 9,700 |
| | | | |
United States | | 1,707 | | 422 |
| | | | |
China | | 6,337 | | 6,337 |
| | | | |
Indonesia | | 2,992 | | 2,646 |
| | | | |
Greenland | | 8,471 | | 5,983 |
| | | | |
| | 31,726 | | 25,088 |
| | | | |
As at December 31, 2007 | | | | |
Western Canada | | | | |
Alberta | | 4,118 | | 3,600 |
Saskatchewan | | 1,547 | | 1,404 |
British Columbia | | 888 | | 610 |
Manitoba | | 1 | | 1 |
| | | | |
| | 6,554 | | 5,615 |
| | | | |
Northwest Territories and Arctic | | 1,021 | | 396 |
Eastern Canada | | 2,429 | | 1,566 |
| | | | |
| | 10,004 | | 7,577 |
| | | | |
China | | 7,372 | | 7,372 |
| | | | |
Indonesia | | 1,742 | | 1,742 |
| | | | |
Greenland | | 8,471 | | 5,984 |
| | | | |
| | 27,589 | | 22,675 |
| | | | |
Page 28
Drilling Activity
| | | | | | | | | | | | |
| | | Year ended December 31 |
| | | 2009 | | 2008 | | 2007 |
| | | Gross | | Net | | Gross | | Net | | Gross | | Net |
Western Canada Drilling | | | | | | | | | | | | |
Exploration | | | | | | | | | | | | |
Oil | | 18 | | 9 | | 80 | | 70 | | 79 | | 79 |
Gas | | 37 | | 22 | | 102 | | 79 | | 114 | | 92 |
Dry | | 7 | | 6 | | 27 | | 23 | | 14 | | 12 |
| | | | | | | | | | | | |
| | 62 | | 37 | | 209 | | 172 | | 207 | | 183 |
| | | | | | | | | | | | |
Development | | | | | | | | | | | | |
Oil | | 315 | | 278 | | 685 | | 578 | | 571 | | 530 |
Gas | | 122 | | 61 | | 435 | | 270 | | 343 | | 251 |
Dry | | 7 | | 7 | | 36 | | 36 | | 31 | | 29 |
| | | | | | | | | | | | |
| | 444 | | 346 | | 1,156 | | 884 | | 945 | | 810 |
| | | | | | | | | | | | |
| | 506 | | 383 | | 1,365 | | 1,056 | | 1,152 | | 993 |
| | | | | | | | | | | | |
Offshore East Coast — Canada | | | | | | | | | | | | |
Development | | | | | | | | | | | | |
Oil | | — | | — | | 1 | | 1 | | 1 | | 1 |
| | | | | | | | | | | | |
International | | | | | | | | | | | | |
Exploration | | | | | | | | | | | | |
Dry | | 1 | | 1 | | — | | — | | — | | — |
| | | | | | | | | | | | |
| | 1 | | 1 | | — | | — | | — | | — |
| | | | | | | | | | | | |
Development | | | | | | | | | | | | |
Oil | | 2 | | 1 | | — | | — | | — | | — |
| | | | | | | | | | | | |
| | 2 | | 1 | | — | | — | | — | | — |
| | | | | | | | | | | | |
Present Activities
| | | | | | | | |
| | | Exploratory | | Development |
| | | Gross | | Net | | Gross | | Net |
Wells Drilling(1) | | | | | | | | |
Western Canada | | 4 | | 2.6 | | 4 | | 2.5 |
United States | | — | | — | | — | | — |
Stratigraphic Test Wells | | | | | | | | |
Offshore East Coast — Canada | | 1 | | 1 | | 1 | | 0.7 |
Offshore China | | 1 | | 1 | | — | | — |
Note:
| (1) | Denotes wells that were drilling at December 31, 2009. |
Oil and Gas Reserves Disclosures
Husky’s oil and gas reserves are estimated in accordance with the regulations and guidelines of the FASB and the SEC (U.S.). The SEC amended its oil and gas reserves estimation and disclosure requirements effective for annual reporting periods ending on or after December 31, 2009, requiring the determination of reserve quantities to be based on a 12 month average price. This resulted in lower prices compared with the prices in effect at December 31, 2009, particularly for natural gas.
Page 29
Husky’s oil and gas reserves are prepared internally by Husky’s reserve evaluation staff. Husky uses a formalized process for determining, approving and booking reserves. This process provides for all reserves evaluations to be done on a consistent basis using established definitions and guidelines. Approval of any significant reserve additions and changes requires review by an internal panel of qualified reserves evaluators.
Audit of Oil and Gas Reserves
McDaniel & Associates Consultants Ltd., an independent firm of qualified oil and gas reserves evaluation engineers, was engaged to conduct an audit of Husky’s crude oil, natural gas and natural gas products reserves. McDaniel & Associates Consultants Ltd. issued an audit opinion stating that Husky’s internally generated proved and probable reserves and net present values based on forecast and constant price assumptions are, in aggregate, reasonable, and have been prepared in accordance with generally accepted oil and gas engineering and evaluation practices in the United States and as set out in the COGEH.
Proved Reserves
| | | | | | | | | | | | |
| | | Crude Oil & NGL (1) | | Natural Gas(1) | | Future Net
Cash Flows
Before Tax(1)(4) |
| | | Gross(2) | | Net(2) | | Gross (2) | | Net(2) | | 0% | | 10% |
| | | (mmbbls) | | (bcf) | | ($ millions) |
Proved developed(3) | | 425 | | 368 | | 1,452 | | 1,265 | | 12,518 | | 8,514 |
Proved undeveloped(3)(5)(6) | | 220 | | 198 | | 273 | | 248 | | 3,227 | | 990 |
| | | | | | | | | | | | |
Proved total(3) | | 645 | | 566 | | 1,725 | | 1,513 | | 15,745 | | 9,504 |
| | | | | | | | | | | | |
Notes:
| (1) | Husky applied for and was granted an exemption from National Instrument 51-101 “Standards of Disclosure for Oil and Gas Activities” to provide oil and gas reserves disclosures in accordance with the SEC guidelines and the FASB disclosure standards. The information disclosed may differ from information prepared in accordance with National Instrument 51-101. Husky’s internally generated oil and gas reserves data was audited by an independent firm of qualified reserves evaluators. |
| (2) | Gross reserves are Husky’s lessor royalty, overriding royalty and working interest share of reserves, before deduction of royalties. Net reserves are gross reserves, less royalties. Effective date of measure of reserves is as at December 31, 2009. |
| (3) | These reserve categories have the same meanings as those set out in SEC Regulation S-X. |
| (4) | On December 31, 2009, the date proved oil and gas reserves were evaluated, the discounted future net cash flows were based on the calculated 12-month average natural gas price of $3.57/mcf and the calculated 12-month average WTI crude oil price of U.S. $61.18/bbl. The calculated price of Lloydminster heavy crude was $53.67/bbl and Tucker bitumen was $50.72/bbl. By comparison the year-end prices resulted in a negative price revision of 59 mmboe, 90% of which was related to proved natural gas reserves. Please refer to Husky’s 2009 MD&A for further discussion about price revisions. |
| (5) | Material changes from prior year included additions to Sunrise (63.7 mmbbls), North Amethyst (4.5 mmbbls) and West White Rose extension (3.4 mmbbls) offset by negative revisions due primarily to reduced natural gas prices. Proved undeveloped reserves converted to proved developed reserves amounted to 19.5 mmboe. Drilling from Lloydminster Heavy Oil provided 8.3 mmboe of this conversion. Capital expenditures in 2009 were reduced in response to the commodity price environment, in particular natural gas prices. The result is a limited transfer of undeveloped reserves to developed reserves in 2009. Capital expenditures were incurred in 2009 to tie in the North Amethyst satellite development project to the existing White Rose infrastructure which is expected to commence production in 2010 at which time undeveloped reserves will be transferred to developed reserves. As at December 31, 2009, there are no material proved undeveloped reserves that have remained classified as undeveloped for greater than five years. |
Page 30
| (6) | Estimated future capital expenditures required to gain access to proved undeveloped reserves as at December 31, 2009, 2008 and 2007 were as follows: |
| | | | | | | | | | | | | | |
| | | As at December 31, 2009 |
| | | Total | | 2010 | | 2011 | | 2012 | | 2013 | | 2014 | | Thereafter |
| | | ($ millions undiscounted) |
Western Canada | | 3,491 | | 648 | | 1,068 | | 648 | | 491 | | 141 | | 495 |
Eastern Canada | | 903 | | 402 | | 371 | | 62 | | 3 | | 3 | | 62 |
| | | | | | | | | | | | | | |
| | 4,394 | | 1,050 | | 1,439 | | 710 | | 494 | | 144 | | 557 |
| | | | | | | | | | | | | | |
| |
| | | As at December 31, 2008 |
| | | Total | | 2009 | | 2010 | | 2011 | | 2012 | | 2013 | | Thereafter |
| | | ($ millions undiscounted) |
Western Canada | | 1,615 | | 370 | | 428 | | 319 | | 151 | | 96 | | 251 |
Eastern Canada | | 391 | | 256 | | 111 | | — | | — | | — | | 24 |
| | | | | | | | | | | | | | |
| | 2,006 | | 626 | | 539 | | 319 | | 151 | | 96 | | 275 |
| | | | | | | | | | | | | | |
| |
| | | As at December 31, 2007 |
| | | Total | | 2008 | | 2009 | | 2010 | | 2011 | | 2012 | | Thereafter |
| | | ($ millions undiscounted) |
Western Canada | | 1,943 | | 713 | | 520 | | 272 | | 119 | | 87 | | 232 |
Eastern Canada | | 476 | | 198 | | 237 | | 19 | | — | | — | | 22 |
| | | | | | | | | | | | | | |
| | 2,419 | | 911 | | 757 | | 291 | | 119 | | 87 | | 254 |
| | | | | | | | | | | | | | |
Page 31
Reconciliation of Proved Gross Reserves
| | | | | | | | | | | | | | | | | | | | | | | | | | | | | | | | |
| | | Canada | | | International | | Total | |
| | Western Canada | | | East Coast | | | Light
Crude
Oil &
NGL | | | Natural
Gas | | Crude
Oil
& NGL | | | Natural
Gas | | | Total
Company | |
| | Light
Crude
Oil &
NGL | | | Medium
Crude
Oil | | | Heavy
Crude
Oil(2) | | | Natural
Gas | | | Bitumen (2) | | | Light
Crude
Oil | | | | | | |
| | | (mmbbls) | | | (mmbbls) | | | (mmbbls) | | | (bcf) | | | (mmbbls) | | | (mmbbls) | | | (mmbbls) | | | (bcf) | | (mmbbls) | | | (bcf) | | | (mmboe) | |
Proved reserves, before royalties(1) | | | | | | | | | | | | | | | |
| | | | | | | | | | | |
End of 2006 | | 166 | | | 87 | | | 144 | | | 2,143 | | | 129 | | | 107 | | | 14 | | | — | | 647 | | | 2,143 | | | 1,004 | |
| | | | | | | | | | | | | | | | | | | | | | | | | | | | | | | | |
Revisions— Technical | | — | | | 4 | | | (10 | ) | | 46 | | | (1 | ) | | 26 | | | 2 | | | — | | 21 | | | 46 | | | 29 | |
Revisions — Economic | | 1 | | | — | | | 3 | | | 18 | | | — | | | — | | | — | | | — | | 4 | | | 18 | | | 7 | |
Purchases | | 1 | | | — | | | — | | | 36 | | | — | | | — | | | — | | | — | | 1 | | | 36 | | | 7 | |
Sales | | (10 | ) | | — | | | — | | | (23 | ) | | — | | | — | | | — | | | — | | (10 | ) | | (23 | ) | | (14 | ) |
Discoveries and extensions | | 8 | | | 6 | | | 27 | | | 189 | | | 21 | | | 19 | | | — | | | — | | 81 | | | 189 | | | 112 | |
Improved recovery | | 2 | | | 1 | | | 1 | | | 10 | | | — | | | — | | | — | | | — | | 4 | | | 10 | | | 6 | |
Production | | (9 | ) | | (10 | ) | | (32 | ) | | (228 | ) | | (7 | ) | | (36 | ) | | (5 | ) | | — | | (99 | ) | | (228 | ) | | (137 | ) |
| | | | | | | | | | | | | | | | | | | | | | | | | | | | | | | | |
End of 2007 | | 159 | | | 88 | | | 133 | | | 2,191 | | | 142 | | | 116 | | | 11 | | | — | | 649 | | | 2,191 | | | 1,014 | |
| | | | | | | | | | | | | | | | | | | | | | | | | | | | | | | | |
Revisions — Technical | | (3 | ) | | 7 | | | (1 | ) | | (20 | ) | | 2 | | | 15 | | | — | | | — | | 20 | | | (20 | ) | | 16 | |
Revisions — Economic | | (9 | ) | | (4 | ) | | (7 | ) | | (22 | ) | | (76 | ) | | — | | | — | | | — | | (96 | ) | | (22 | ) | | (99 | ) |
Purchases | | 2 | | | 1 | | | 6 | | | 96 | | | — | | | — | | | — | | | — | | 9 | | | 96 | | | 25 | |
Sales | | (1 | ) | | — | | | — | | | (19 | ) | | — | | | — | | | — | | | — | | (1 | ) | | (19 | ) | | (4 | ) |
Discoveries and extensions | | 6 | | | 2 | | | 20 | | | 150 | | | 5 | | | — | | | — | | | — | | 33 | | | 150 | | | 58 | |
Improved recovery | | 3 | | | 1 | | | 2 | | | 32 | | | — | | | 5 | | | — | | | — | | 11 | | | 32 | | | 16 | |
Production | | (9 | ) | | (10 | ) | | (31 | ) | | (218 | ) | | (8 | ) | | (32 | ) | | (4 | ) | | — | | (94 | ) | | (218 | ) | | (130 | ) |
| | | | | | | | | | | | | | | | | | | | | | | | | | | | | | | | |
End of 2008 | | 148 | | | 85 | | | 122 | | | 2,190 | | | 65 | | | 104 | | | 7 | | | — | | 531 | | | 2,190 | | | 896 | |
| | | | | | | | | | | | | | | | | | | | | | | | | | | | | | | | |
Revisions — Technical | | (3 | ) | | 4 | | | (2 | ) | | 21 | | | (1 | ) | | — | | | 6 | | | — | | 4 | | | 21 | | | 8 | |
Revisions — Economic (3) | | 1 | | | — | | | 6 | | | (388 | ) | | 76 | | | — | | | — | | | — | | 83 | | | (388 | ) | | 18 | |
Purchases | | — | | | — | | | 11 | | | 18 | | | — | | | — | | | — | | | — | | 11 | | | 18 | | | 14 | |
Sales | | — | | | — | | | — | | | — | | | — | | | — | | | — | | | — | | — | | | — | | | — | |
Discoveries and extensions | | 3 | | | 2 | | | 11 | | | 82 | | | 69 | | | 4 | | | — | | | — | | 89 | | | 82 | | | 103 | |
Improved recovery | | — | | | — | | | 1 | | | — | | | — | | | 5 | | | — | | | — | | 6 | | | — | | | 6 | |
Production | | (8 | ) | | (9 | ) | | (29 | ) | | (198 | ) | | (9 | ) | | (20 | ) | | (4 | ) | | — | | (79 | ) | | (198 | ) | | (112 | ) |
| | | | | | | | | | | | | | | | | | | | | | | | | | | | | | | | |
End of 2009 | | 141 | | | 82 | | | 120 | | | 1,725 | | | 200 | | | 93 | | | 9 | | | — | | 645 | | | 1,725 | | | 933 | |
| | | | | | | | | | | | | | | | | | | | | | | | | | | | | | | | |
Note:
| (1) | Proved oil and gas reserves are those quantities of oil and gas, which by analysis of geoscience and engineering data can be estimated with reasonable certainty to be economically producible from a given date forward, from known reservoirs, and under existing economic conditions, operating methods, and government regulations. |
| (2) | Restated in accordance with the SEC definition of bitumen, as part of its new requirements for oil and gas reserves disclosure effective December 31, 2009. Under the new definition, a portion of crude oil previously reported as heavy crude oil has now been reclassified as bitumen. The presentation of heavy crude oil and bitumen reported in prior periods has been restated to reflect the new definition. |
| (3) | Included in Revisions — economic is a reduction of 59 mmboe of proved reserves as a result of the revised SEC guidelines for the method of determining prices on which the economics of the reserves are based. |
Page 32
Revised SEC Guidelines
Husky’s oil and gas reserves are estimated in accordance with the regulations and guidelines of the SEC, which amended its oil and gas reserves estimation and disclosure requirements effective for annual reporting periods ending on or after December 31, 2009.
The new guidelines changed the method of determining prices on which the economics of the reserves are based. Previously, prices used were those in effect on the date the reserves were estimated. The new guidelines require prices to be a 12-month average of the first day of each month in the reporting period. This method of determining prices resulted in lower prices compared with the prices in effect at December 31, 2009, particularly for natural gas. The lower prices resulted in a reduction of gross proved oil and gas reserves amounting to 59 mmboe, 90% was related to natural gas.
The calculated average price of West Texas Intermediate (“WTI”) in 2009 based on the new SEC rules was U.S. $61.18/bbl compared with U.S. $79.36/bbl at December 31, 2009 and U.S. $44.60/bbl at December 31, 2008. Lloydminster heavy crude oil, which trades at a discount to light crude oil, averaged $53.67/bbl in 2009 compared with $65.39/bbl at December 31, 2009 and $34.56/bbl at December 31, 2008. Natural gas averaged $3.57/mcf in 2009 compared with $5.60/mcf at December 31, 2009 and $6.10/mcf at December 31, 2008.
The other changes to the SEC reserves reporting guidelines did not have a material effect on Husky’s reserves estimated quantities or future cash flow.
Note regarding the reclassification of heavy oil to bitumen
The SEC issued its new requirements for oil and gas reserves estimation and disclosure effective December 31, 2009. Among other changes the new rules provide a definition of bitumen that differs from the one Husky had previously used. Under the new definition some crude oil that had been reported as heavy crude oil has now been reclassified as bitumen. The presentation of heavy crude oil and bitumen in prior years has been restated.
Reserves Replacement
In 2007, on a gross basis, 112% of production was replaced excluding sales of reserves net of purchases of reserves. When sales of reserves net of purchases of reserves are included in the replacement calculation, 107% of production was replaced. In 2007, on a net of royalties basis, 95% of production was replaced. The shortfall was due primarily to sales of reserves exceeding purchases.
In 2008, on a gross basis, reserves replacement excluding purchases of reserves net of sales of reserves was not meaningful since negative economic revisions exceeded total additions. The economic revisions reduced reserves by 99 mmboe and were due to low crude oil and natural gas prices at December 31, 2008 compared with the last day of 2007. The economic revision was related to bitumen reserves, 77%, crude oil and NGL, 20% and natural gas, 3%. When purchases of reserves net of sales of reserves are included in the replacement calculation 9% of production was replaced. During 2008, the Company was working on a number of major projects that require various approvals, sanctions, marketing agreements, delineation results and front end engineering design before the associated resources and probable reserves could be classified as proved reserves.
In 2009, on a gross basis, reserves replacement excluding purchases of reserves net of sales of reserves was 121% of production. When purchases of reserves net of sales are included in the replacement calculation 133% of production was replaced.
Page 33
Reserves and Production by Principal Area
| | | | |
| | | Gross |
| | | Proved Reserves | | Production |
| | | (mmbbls) | | (mbbls/day) |
Crude Oil and NGL(1) | | | | |
Canada | | | | |
Western Canada | | | | |
British Columbia and Foothills | | | | |
Alberta and BC Plains area | | 26.3 | | 4.1 |
Foothills Deep Gas area | | 27.2 | | 4.8 |
Ram River and Kaybob areas | | 4.6 | | 1.9 |
Northwest Alberta Plains | | | | |
Rainbow Lake area | | 68.2 | | 6.7 |
Athabasca area | | 11.2 | | 4.2 |
East Central Alberta | | | | |
North area | | 3.1 | | 0.5 |
South area | | 2.4 | | 0.9 |
Provost area | | 32.5 | | 14.4 |
Southern Alberta and Saskatchewan | | | | |
South Alberta area | | 25.0 | | 8.1 |
North Saskatchewan area | | 35.9 | | 7.5 |
South Saskatchewan area | | 23.7 | | 6.1 |
Lloydminster Area | | | | |
Primary Heavy oil and Medium oil production | | 82.9 | | 67.1 |
Bitumen | | 200.4 | | 23.1 |
Other | | 0.1 | | 0.5 |
| | | | |
| | 543.5 | | 149.9 |
| | | | |
East Coast Canada | | | | |
Terra Nova | | 15.4 | | 10.0 |
White Rose | | 77.5 | | 45.1 |
| | | | |
| | 92.9 | | 55.1 |
| | | | |
China | | | | |
Wenchang | | 9.1 | | 11.2 |
| | | | |
| | 645.5 | | 216.2 |
| | | | |
Note:
| (1) | Gross crude oil and NGL reserves as at December 31, 2009 and average 2009 daily gross production of crude oil and NGL. |
Page 34
| | | | |
| | | Gross |
| | | Proved Reserves | | Production |
| | | (bcf) | | (mmcf/day) |
Natural Gas(1) | | | | |
Canada | | | | |
Western Canada | | | | |
British Columbia and Foothills | | | | |
Alberta and BC Plains area | | 88.5 | | 43.2 |
Foothills Deep Gas area | | 402.4 | | 99.4 |
Ram River and Kaybob areas | | 193.9 | | 67.3 |
Northwest Alberta Plains | | | | |
Rainbow Lake area | | 362.9 | | 58.6 |
Northern Alberta area | | 142.3 | | 46.7 |
East Central Alberta | | | | |
Provost area | | 84.0 | | 43.2 |
North area | | 155.2 | | 34.7 |
South area | | 89.2 | | 48.9 |
Southern Alberta and Saskatchewan | | | | |
South Alberta area | | 28.7 | | 23.1 |
North Saskatchewan area | | 101.0 | | 30.3 |
South Saskatchewan area | | 13.2 | | 4.2 |
Lloydminster Area | | 63.7 | | 34.9 |
Other | | — | | 7.2 |
| | | | |
| | 1,725.0 | | 541.7 |
| | | | |
Note:
| (1) | Gross natural gas reserves as at December 31, 2009 and average 2009 daily gross production of natural gas. |
Inherent Uncertainty of Probable Reserves Estimates
There are numerous uncertainties inherent in estimating quantities of crude oil and natural gas reserves. Classifications of reserves as proved or probable are only attempts to define the degree of uncertainty associated with the estimates. In addition, whereas proved reserves are those reserves that can be estimated with reasonable certainty to be economically producible, probable reserves are those reserves as likely as not to be recovered. Therefore, probable reserves estimates, by definition, have a higher degree of uncertainty than proved reserves.
Probable Oil and Gas Reserves(1)(2)
| | | | | | | | | | |
| | | Canada | | International | | Total |
| | | Western Canada | | East Coast | | | | |
| | | Conventional (3) | | Bitumen (3) | | | | | | |
Crude Oil & NGL | | | | | | | | | | |
| | | (mmbbls) |
2009 | | 91 | | 1,094 | | 74 | | 15 | | 1,274 |
2008 | | 85 | | 140 | | 64 | | 14 | | 303 |
2007 | | 105 | | 1,809 | | 100 | | 25 | | 2,039 |
| | | | | |
Natural Gas | | | | | | | | | | |
| | | (bcf) |
2009 | | 343 | | — | | — | | 258 | | 601 |
2008 | | 458 | | — | | — | | 258 | | 716 |
2007 | | 473 | | — | | — | | 516 | | 989 |
| | | | | |
Barrels of Oil Equivalent | | | | | | | | | | |
| | | (mmboe) |
2009 | | 148 | | 1,094 | | 74 | | 58 | | 1,374 |
2008 | | 162 | | 140 | | 64 | | 57 | | 423 |
2007 | | 184 | | 1,809 | | 100 | | 111 | | 2,204 |
Page 35
Notes:
| (1) | The probable reserves in 2009 presented have been prepared using 2009 12-month average constant prices and costs, in accordance with SEC definitions. Effective in 2009 date of measure of reserves is as at December 31, 2009. The estimates of reserves for the year end 2009 differ from those that were determined in previous years, which were estimated using year end single day pricing. |
| (2) | Under the SEC rules, the disclosure of probable reserves is permitted, but not required. |
| (3) | Restated in accordance with the SEC definition of bitumen, as part of its new requirements for oil and gas reserves disclosure effective December 31, 2009. Under the new definition, a portion of crude oil previously reported as heavy crude oil has now been reclassified as bitumen. The presentation of heavy crude oil and bitumen reported in prior periods has been restated to reflect the new definition. |
Disclosure about Oil and Gas Producing Activities — Accounting Standards Codification 932, “Extractive Activities — Oil and Gas”
The following disclosures have been prepared in accordance with FASB Accounting Standards Codification 932, “Extractive Activities — Oil and Gas”:
Oil and Gas Reserves
Proved oil and gas reserves are those quantities of oil and gas, which, by analysis of geoscience and engineering data, can be estimated with reasonable certainty to be economically producible from a given date forward, from known reservoirs, and under existing economic conditions, operating methods, and government regulations.
Proved developed oil and gas reserves are proved reserves that can be expected to be recovered:(i) through existing wells with existing equipment and operating methods or in which the cost of the required equipment is relatively minor compared to the cost of a new well; and (ii) through installed extraction equipment and infrastructure operational at the time of the reserves estimate if the extraction is by means not involving a well.
Proved undeveloped oil and gas reserves are proved reserves that are expected to be recovered from new wells on undrilled acreage, or from existing wells where a relatively major expenditure is required for recompletion.
Canadian provincial royalties are determined based on a graduated percentage scale, which varies with prices and production volumes. Canadian reserves, as presented on a net basis, assume prices and royalty rates in existence at the time the estimates were made, and Husky’s estimate of future production volumes. Future fluctuations in prices, production rates, or changes in political or regulatory environments could cause Husky’s share of future production from Canadian reserves to be materially different from that presented.
Subsequent to December 31, 2009, no major discovery or other favourable or adverse event is believed to have caused a material change in the estimates of developed or undeveloped reserves as of that date.
Page 36
Results of Operations for Producing Activities(1)(2)
| | | | | | | | | | | | | | | | | | |
| | | Canada | | International | | Total |
| | | 2009 | | 2008 | | 2007 | | 2009 | | 2008 | | 2007 | | 2009 | | 2008 | | 2007 |
| | | ($ millions except per boe amounts) |
Oil and gas production revenue | | 4,280 | | 7,667 | | 5,998 | | 237 | | 315 | | 288 | | 4,517 | | 7,982 | | 6,286 |
| | | | | | | | | | | | | | | | | | |
Operating costs | | | | | | | | | | | | | | | | | | |
Lease operating expenses | | 1,357 | | 1,469 | | 1,292 | | 30 | | 25 | | 21 | | 1,387 | | 1,494 | | 1,313 |
Production taxes | | 65 | | 93 | | 64 | | — | | — | | — | | 65 | | 93 | | 64 |
Asset retirement obligation accretion | | 39 | | 44 | | 38 | | 1 | | 1 | | — | | 40 | | 45 | | 38 |
| | | | | | | | | | | | | | | | | | |
| | 1,461 | | 1,606 | | 1,394 | | 31 | | 26 | | 21 | | 1,492 | | 1,632 | | 1,415 |
Depreciation, depletion and amortization | | 1,324 | | 1,457 | | 1,563 | | 73 | | 48 | | 52 | | 1,397 | | 1,505 | | 1,615 |
| | | | | | | | | | | | | | | | | | |
Earnings before taxes | | 1,495 | | 4,604 | | 3,041 | | 133 | | 241 | | 215 | | 1,628 | | 4,845 | | 3,256 |
Income tax | | 449 | | 1,409 | | 994 | | 40 | | 74 | | 70 | | 489 | | 1,483 | | 1,064 |
| | | | | | | | | | | | | | | | | | |
Results of operations | | 1,046 | | 3,195 | | 2,047 | | 93 | | 167 | | 145 | | 1,139 | | 3,362 | | 2,192 |
| | | | | | | | | | | | | | | | | | |
Amortization rate per gross boe | | 11.92 | | 11.58 | | 11.77 | | 17.83 | | 10.93 | | 11.10 | | 12.14 | | 11.56 | | 11.75 |
Amortization rate per net boe | | 14.59 | | 14.47 | | 14.06 | | 21.60 | | 14.77 | | 14.01 | | 14.85 | | 14.48 | | 14.05 |
Notes:
| (1) | The costs in this schedule exclude corporate overhead, interest expense and other operating costs, which are not directly related to producing activities. |
| (2) | Under U.S. GAAP, the depreciation, depletion and amortization for Canadian producing activities for 2009 amounted to $1,341 million (2008 — $1,435 million; 2007 — $1,507 million). Income taxes for Canadian producing activities under U.S. GAAP for 2009 amounted to $444 million (2008 — $1,415 million; 2007 — $1,011 million). |
Page 37
Costs Incurred in Oil and Gas Property Acquisition, Exploration and Development Activities(1)
| | | | | | |
| | | Canada | | International | | Total |
| | | | | ($ millions) | | |
2009 | | | | | | |
Property acquisition | | | | | | |
Proved | | 220 | | — | | 220 |
Unproved | | 87 | | 2 | | 89 |
Exploration | | 259 | | 549 | | 808 |
Development | | 1,225 | | 17 | | 1,242 |
Capitalized interest | | 16 | | — | | 16 |
| | | | | | |
Total costs incurred | | 1,807 | | 568 | | 2,375 |
Less: Proved acquisitions | | 220 | | — | | 220 |
Capitalized interest | | 16 | | — | | 16 |
| | | | | | |
Finding and development costs | | 1,571 | | 568 | | 2,139 |
| | | | | | |
2008 | | | | | | |
Property acquisition | | | | | | |
Proved | | 241 | | — | | 241 |
Unproved | | 244 | | 45 | | 289 |
Exploration | | 596 | | 240 | | 836 |
Development | | 2,209 | | 5 | | 2,214 |
Capitalized interest | | — | | — | | — |
| | | | | | |
Total costs incurred | | 3,290 | | 290 | | 3,580 |
Less: Proved acquisitions | | 241 | | — | | 241 |
Capitalized interest | | — | | — | | — |
| | | | | | |
Finding and development costs | | 3,049 | | 290 | | 3,339 |
| | | | | | |
2007 | | | | | | |
Property acquisition | | | | | | |
Proved | | 126 | | — | | 126 |
Unproved | | 46 | | — | | 46 |
Exploration | | 580 | | 70 | | 650 |
Development | | 1,559 | | 6 | | 1,565 |
Capitalized interest | | 6 | | — | | 6 |
| | | | | | |
Total costs incurred | | 2,317 | | 76 | | 2,393 |
Less: Proved acquisitions | | 126 | | — | | 126 |
Capitalized interest | | 6 | | — | | 6 |
| | | | | | |
Finding and development costs | | 2,185 | | 76 | | 2,261 |
| | | | | | |
Note:
| (1) | Development costs incurred exclude actual retirement expenditures and include asset retirement obligation incurred.Asset retirement obligation incurred for 2009 was $75 million (2008 — $40 million; 2007 — $39 million). |
Acquisition costs include costs incurred to purchase, lease, or otherwise acquire oil and gas properties.
Exploration costs include the costs of geological and geophysical activity, retaining undeveloped properties and drilling and equipping exploration wells.
Development costs include the costs of drilling and equipping development wells, facilities to extract, treat and gather and store oil and gas and settle the related asset retirement obligations.
Exploration and development costs include administrative costs and depreciation of support equipment directly associated with these activities.
Page 38
The following table sets forth a summary of oil and gas property costs not being amortized at December 31, 2009, by the year in which the costs were incurred:
| | | | | | | | | | |
Withheld Costs | | Total | | 2009 | | 2008 | | 2007 | | Prior to
2007 |
| | | ($ millions) |
Property acquisitions | | | | | | | | | | |
Canada | | 67 | | — | | — | | — | | 67 |
International | | 38 | | — | | — | | — | | 38 |
| | | | | | | | | | |
| | 105 | | — | | — | | — | | 105 |
| | | | | | | | | | |
Exploration | | | | | | | | | | |
Canada | | 2,118 | | 1,189 | | 929 | | — | | — |
International | | 771 | | 561 | | 210 | | — | | — |
| | | | | | | | | | |
| | 2,889 | | 1,750 | | 1,139 | | — | | — |
| | | | | | | | | | |
Development | | | | | | | | | | |
Canada | | 819 | | 47 | | 544 | | 228 | | — |
International | | 19 | | 5 | | 1 | | 4 | | 9 |
| | | | | | | | | | |
| | 838 | | 52 | | 545 | | 232 | | 9 |
| | | | | | | | | | |
Capitalized interest | | | | | | | | | | |
Canada | | 120 | | 16 | | — | | 6 | | 98 |
| | | | | | | | | | |
| | 3,952 | | 1,818 | | 1,684 | | 238 | | 212 |
| | | | | | | | | | |
Capitalized Costs Relating to Oil and Gas Producing Activities
| | | | | | |
| | | Canada | | International | | Total |
| | | ($ millions) |
2009 | | | | | | |
Proved properties(1) | | 22,663 | | 863 | | 23,526 |
Unproved properties | | 3,125 | | 827 | | 3,952 |
| | | | | | |
| | 25,788 | | 1,690 | | 27,478 |
Accumulated DD&A | | 12,129 | | 559 | | 12,688 |
| | | | | | |
Net Capitalized Costs(2) | | 13,659 | | 1,131 | | 14,790 |
| | | | | | |
2008 | | | | | | |
Proved properties(1) | | 21,515 | | 580 | | 22,095 |
Unproved properties | | 2,703 | | 485 | | 3,188 |
| | | | | | |
| | 24,218 | | 1,065 | | 25,283 |
Accumulated DD&A | | 10,946 | | 486 | | 11,432 |
| | | | | | |
Net Capitalized Costs(2) | | 13,272 | | 579 | | 13,851 |
| | | | | | |
2007 | | | | | | |
Proved properties(1) | | 20,830 | | 584 | | 21,414 |
Unproved properties | | 1,954 | | 243 | | 2,197 |
| | | | | | |
| | 22,784 | | 827 | | 23,611 |
Accumulated DD&A | | 9,500 | | 456 | | 9,956 |
| | | | | | |
Net Capitalized Costs(2) | | 13,284 | | 371 | | 13,655 |
| | | | | | |
Page 39
Notes:
| (1) | Capitalized costs related to proved properties include the asset retirement obligations. The asset retirement obligations for the years presented were as follows: |
| | | | | | |
| | | Canada | | International | | Total |
| | | ($ millions) |
2009 | | 557 | | 11 | | 568 |
2008 | | 488 | | 6 | | 494 |
2007 | | 454 | | 6 | | 460 |
| (2) | The net capitalized costs for Canadian oil and gas exploration, development and producing activities under U.S. GAAP for 2009 were $13,292 million (2008 — $12,921 million, 2007 — $12,911 million). The net capitalized costs for International property oil & gas exploration, development and producing activities under U.S. GAAP for 2009 were $1,130 million (2008 — $578 million, 2007 — $370 million). Please refer to the Company’s Form 40-F for an explanation of the differences between Canadian and U.S. GAAP for oil and gas activities. |
Oil and Gas Reserve Information
In Canada, Husky’s proved crude oil, natural gas liquids and natural gas reserves are located in the provinces of Alberta, Saskatchewan, British Columbia, and offshore the East Coast. Husky’s international proved reserves are located in China and Libya.
| | | | | | | | | | | | | | | | | | | | |
| | | Canada | | | International | | Total | |
Reserves | | Crude
Oil & NGL | | | Natural
Gas | | | Crude
Oil & NGL | | | Natural
Gas | | Crude
Oil & NGL | | | Natural
Gas | | | Total
Company | |
| | | (mmbbls) | | | (bcf) | | | (mmbbls) | | | (bcf) | | (mmbbls) | | | (bcf) | | | (mmboe) | |
Net proved reserves(1)(2)(3)(4) | | | | | | | | | | | | | | | | | | | | |
End of year 2006 | | 555 | | | 1,799 | | | 12 | | | — | | 567 | | | 1,799 | | | 867 | |
| | | | | | | | | | | | | | | | | | | | |
Revisions | | 3 | | | 61 | | | — | | | — | | 3 | | | 61 | | | 13 | |
Purchases | | 1 | | | 29 | | | — | | | — | | 1 | | | 29 | | | 6 | |
Sales | | (9 | ) | | (18 | ) | | — | | | — | | (9 | ) | | (18 | ) | | (12 | ) |
Improved recovery | | 4 | | | 8 | | | — | | | — | | 4 | | | 8 | | | 5 | |
Discoveries and extensions | | 71 | | | 155 | | | — | | | — | | 71 | | | 155 | | | 97 | |
Production | | (81 | ) | | (180 | ) | | (4 | ) | | — | | (85 | ) | | (180 | ) | | (115 | ) |
| | | | | | | | | | | | | | | | | | | | |
End of year 2007 | | 544 | | | 1,854 | | | 8 | | | — | | 552 | | | 1,854 | | | 861 | |
| | | | | | | | | | | | | | | | | | | | |
Revisions | | (54 | ) | | 2 | | | 1 | | | — | | (53 | ) | | 2 | | | (53 | ) |
Purchases | | 8 | | | 89 | | | — | | | — | | 8 | | | 89 | | | 22 | |
Sales | | (1 | ) | | (16 | ) | | — | | | — | | (1 | ) | | (16 | ) | | (3 | ) |
Improved recovery | | 10 | | | 28 | | | — | | | — | | 10 | | | 28 | | | 15 | |
Discoveries and extensions | | 30 | | | 125 | | | — | | | — | | 30 | | | 125 | | | 51 | |
Production | | (73 | ) | | (170 | ) | | (3 | ) | | — | | (76 | ) | | (170 | ) | | (104 | ) |
| | | | | | | | | | | | | | | | | | | | |
End of year 2008 | | 464 | | | 1,912 | | | 6 | | | — | | 470 | | | 1,912 | | | 789 | |
| | | | | | | | | | | | | | | | | | | | |
Revisions(5) | | 60 | | | (315 | ) | | 5 | | | — | | 65 | | | (315 | ) | | 12 | |
Purchases | | 10 | | | 16 | | | — | | | — | | 10 | | | 16 | | | 12 | |
Sales | | — | | | — | | | — | | | — | | — | | | — | | | — | |
Improved recovery | | 6 | | | — | | | — | | | — | | 6 | | | — | | | 6 | |
Discoveries and extensions | | 81 | | | 67 | | | — | | | — | | 81 | | | 67 | | | 93 | |
Production | | (63 | ) | | (167 | ) | | (3 | ) | | — | | (66 | ) | | (167 | ) | | (94 | ) |
| | | | | | | | | | | | | | | | | | | | |
End of year 2009 | | 558 | | | 1,513 | | | 8 | | | — | | 566 | | | 1,513 | | | 818 | |
| | | | | | | | | | | | | | | | | | | | |
Net proved developed reserves(1)(2)(3)(4) | | | | | | | | | | | | | | | | | | | | |
End of year 2006 | | 442 | | | 1,424 | | | 12 | | | — | | 454 | | | 1,424 | | | 691 | |
End of year 2007 | | 407 | | | 1,494 | | | 8 | | | — | | 415 | | | 1,494 | | | 664 | |
End of year 2008 | | 357 | | | 1,524 | | | 6 | | | — | | 363 | | | 1,524 | | | 617 | |
End of year 2009 | | 360 | | | 1,265 | | | 8 | | | — | | 368 | | | 1,265 | | | 579 | |
Page 40
Notes:
| (1) | Net reserves are the Company’s lesser royalty, overriding royalty and working interest share of the gross remaining reserves, after deduction of any crown, freehold and overriding royalties. Such royalties are subject to change by legislation or regulation and can also vary depending on production rates, selling prices and timing of initial production. |
| (2) | Reserves are the estimated remaining quantities of oil and gas and related substances anticipated to be economically producible, as of a given date, by application of development projects to known accumulations. |
| (3) | Proved oil and gas reserves are those quantities of oil and gas, which, by analysis of geoscience and engineering data, can be estimated with reasonable certainty to be economically producible from a given date forward, from known reservoirs, and under existing economic conditions, operating methods, and government regulations. |
| (4) | Proved developed oil and gas reserves are proved reserves that can be expected to be recovered: (i) through existing wells with existing equipment and operating methods or in which the cost of the required equipment is relatively minor compared to the cost of a new well; and (ii) through installed extraction equipment and infrastructure operational at the time of the reserves estimate if the extraction is by means not involving a well. Proved undeveloped oil and gas reserves are proved reserves that are expected to be recovered from new wells on undrilled acreage, or from existing wells where a relatively major expenditure is required for recompletion. |
| (5) | Included in revisions is a reduction of 38 net mmboe of proved reserves as a result of the revised SEC guidelines for the method of determining prices on which the economics of the reserves are based. |
Standardized Measure of Discounted Future Net Cash Flows Relating to Proved Oil and Gas Reserves
The following information has been developed utilizing procedures prescribed by FASB Accounting Standards Codification 932, “Extractive Activities — Oil and Gas” and based on crude oil and natural gas reserve and production volumes estimated by our reserves evaluation staff. It may be useful for certain comparison purposes, but should not be solely relied upon in evaluating Husky or its performance. Further, information contained in the following table should not be considered as representative of realistic assessments of future cash flows, nor should the standardized measure of discounted future net cash flows be viewed as representative of the current value of Husky’s reserves.
The future cash flows presented below are based on 2009 average sales prices and cost rates, and statutory income tax rates in existence as of the date of the projections. It is expected that material revisions to some estimates of crude oil and natural gas reserves may occur in the future, development and production of the reserves may occur in periods other than those assumed, and actual prices realized and costs incurred may vary significantly from those used.
Management does not rely upon the following information in making investment and operating decisions. Such decisions are based upon a wide range of factors, including estimates of probable as well as proved reserves, and varying price and cost assumptions considered more representative of a range of possible economic conditions that may be anticipated.
The computation of the standardized measure of discounted future net cash flows relating to proved oil and gas reserves at December 31, 2009 was based on the NYMEX 2009 average natural gas cash market price of U.S. $3.87/mmbtu (2008 year-end — U.S. $5.41/mmbtu; 2007 year-end — U.S. $7.11/mmbtu) and on crude oil prices computed with reference to the 2009 average WTI spot price of U.S. $61.18/bbl (2008 year-end — U.S. $44.60/bbl; 2007 year-end — U.S. $95.98/bbl).
Page 41
| | | | | | | | | | | | | | | | | | |
| | | Canada(1) | | International(1) | | Total(1) |
Standardized Measure | | 2009 | | 2008 | | 2007 | | 2009 | | 2008 | | 2007 | | 2009 | | 2008 | | 2007 |
| | | ($ millions) |
Future cash inflows | | 34,528 | | 29,640 | | 49,383 | | 593 | | 278 | | 952 | | 35,121 | | 29,918 | | 50,335 |
Future production costs | | 12,749 | | 11,596 | | 12,394 | | 119 | | 99 | | 136 | | 12,868 | | 11,695 | | 12,530 |
Future development costs | | 6,487 | | 4,006 | | 4,550 | | 21 | | 14 | | 16 | | 6,508 | | 4,020 | | 4,566 |
Future income taxes | | 3,989 | | 3,667 | | 9,022 | | 144 | | 48 | | 252 | | 4,133 | | 3,715 | | 9,274 |
| | | | | | | | | | | | | | | | | | |
Future net cash flows | | 11,303 | | 10,371 | | 23,417 | | 309 | | 117 | | 548 | | 11,612 | | 10,488 | | 23,965 |
Annual 10% discount factor | | 4,781 | | 4,121 | | 9,039 | | 39 | | 8 | | 93 | | 4,820 | | 4,129 | | 9,132 |
| | | | | | | | | | | | | | | | | | |
Standardized measure of discounted Future net cash flows | | 6,522 | | 6,250 | | 14,378 | | 270 | | 109 | | 455 | | 6,792 | | 6,359 | | 14,833 |
| | | | | | | | | | | | | | | | | | |
Note:
| (1) | The schedules above are calculated using year-end prices, costs, statutory income tax rates for 2007 and 2008 and for 2009, year average prices and year-end costs, statutory income tax rates and existing proved oil and gas reserves. The value of exploration properties and probable reserves, future exploration costs, future change in oil and gas prices and in production and development costs are excluded. |
Changes in Standardized Measure of Discounted Future Net Cash Flows Relating
to Proved Oil and Gas Reserves
| | | | | | | | | | | | | | | | | | | | | | | | | | | |
| | | Canada(1) | | | International(1) | | | Total(1) | |
| | | 2009 | | | 2008 | | | 2007 | | | 2009 | | | 2008 | | | 2007 | | | 2009 | | | 2008 | | | 2007 | |
| | | ($ millions) | |
Present value at January 1 | | 6,250 | | | 14,378 | | | 9,706 | | | 109 | | | 455 | | | 416 | | | 6,359 | | | 14,833 | | | 10,122 | |
Sales and transfers, net of production costs | | (2,913 | ) | | (6,167 | ) | | (4,696 | ) | | (215 | ) | | (294 | ) | | (270 | ) | | (3,128 | ) | | (6,461 | ) | | (4,966 | ) |
Net change in sales and transfer prices, net of development and production costs | | 1,918 | | | (10,514 | ) | | 7,380 | | | 187 | | | (338 | ) | | 265 | | | 2,105 | | | (10,852 | ) | | 7,645 | |
Development cost incurred that reduced future development costs | | 1,518 | | | 2,450 | | | 1,772 | | | 5 | | | 5 | | | 6 | | | 1,523 | | | 2,455 | | | 1,778 | |
Changes in estimated future development costs | | (2,985 | ) | | (1,582 | ) | | (2,157 | ) | | (10 | ) | | (6 | ) | | (4 | ) | | (2,995 | ) | | (1,588 | ) | | (2,161 | ) |
Extensions, discoveries and improved recovery, net of related costs | | 1,881 | | | 1,572 | | | 2,226 | | | 23 | | | 18 | | | 13 | | | 1,904 | | | 1,590 | | | 2,239 | |
Revisions of quantity estimates | | 313 | | | 107 | | | 868 | | | 241 | | | 12 | | | (13 | ) | | 554 | | | 119 | | | 855 | |
Accretion of discount | | 863 | | | 2,032 | | | 1,422 | | | 16 | | | 66 | | | 61 | | | 879 | | | 2,098 | | | 1,483 | |
Sale of reserves in place | | — | | | (104 | ) | | (256 | ) | | — | | | — | | | — | | | — | | | (104 | ) | | (256 | ) |
Purchase of reserves in place | | 268 | | | 368 | | | 114 | | | — | | | — | | | — | | | 268 | | | 368 | | | 114 | |
Changes in timing of future net cash flows and other | | (388 | ) | | 155 | | | (575 | ) | | (6 | ) | | 27 | | | — | | | (394 | ) | | 182 | | | (575 | ) |
Net change in income taxes | | (203 | ) | | 3,555 | | | (1,426 | ) | | (80 | ) | | 164 | | | (19 | ) | | (283 | ) | | 3,719 | | | (1,445 | ) |
| | | | | | | | | | | | | | | | | | | | | | | | | | | |
Net increase (decrease) | | 272 | | | (8,128 | ) | | 4,672 | | | 161 | | | (346 | ) | | 39 | | | 433 | | | (8,474 | ) | | 4,711 | |
| | | | | | | | | | | | | | | | | | | | | | | | | | | |
Present value at December 31 | | 6,522 | | | 6,250 | | | 14,378 | | | 270 | | | 109 | | | 455 | | | 6,792 | | | 6,359 | | | 14,833 | |
| | | | | | | | | | | | | | | | | | | | | | | | | | | |
Note:
| (1) | The schedules above are calculated using year-end prices, costs, statutory income tax rates for 2007 and 2008 and for 2009, year-end average prices and year-end costs, statutory income tax rates and existing proved oil and gas reserves. The value of exploration properties and probable reserves, future exploration costs, future changes in oil and gas prices and in production and development costs are excluded. |
Page 42
Description of Major Properties and Facilities
Description of Major Properties and Facilities
Husky’s portfolio of upstream assets includes properties with reserves of light (30° API and lighter), medium (between 20° and 30° API), heavy (20° API and heavier but lighter than 10° API) and bitumen (solid or semi-solid with a viscosity greater than 10,000 centipoise at original temperature in the deposit and atmospheric pressure), NGL, natural gas and sulphur.
Lloydminster Heavy Oil and Gas
Husky’s heavy oil assets are primarily concentrated in a large producing region in the Lloydminster Alberta/Saskatchewan area. The Company maintains a land position of approximately 2 million gross acres within this area. Approximately 92% of Husky’s proved reserves in the region are contained in the heavy crude oil producing fields of Pikes Peak, Edam, Tangleflags, Celtic, Bolney, Westhazel, Big Gully, Hillmond, Mervin, Marwayne, Lashburn, Gully Lake and Rush Lake, and in the medium gravity crude oil producing fields of Wildmere and Wainwright. These fields contain accumulations of heavy crude oil at relatively shallow depths.
Husky currently produces from oil and gas wells ranging in depth from 450 m to 650 m and holds a 100% working interest in the majority of these wells. Production of heavy oil from the Lloydminster area uses a variety of techniques, including standard primary production methods, as well as steam injection, horizontal well technology and SAGD. Husky has increased primary production from the area through cold production techniques which utilize progressive cavity pumps capable of simultaneous production of sand and heavy oil from unconsolidated formations. Husky’s gross heavy and medium crude oil production from the area totalled 86.3 mbbls/day in 2009. Of the total production, 64.6 mbbls/day was primarily production of heavy crude oil, including cold production techniques, 19.2 mbbls/day was production from Husky’s thermal operations at Pikes Peak (cyclic steam), Bolney/Celtic (SAGD) and the Pikes Peak South pilot (SAGD), and 2.5 mbbls/day was from the medium gravity waterflooded fields in the Wainwright and Wildmere areas. Husky also produces natural gas from numerous small shallow pools in the Lloydminster region, and recovers solution gas produced from heavy oil wells. During 2009, Husky’s gross natural gas production from the Lloydminster region averaged 34.9 mmcf/day.
In the Lloydminster area, the Company owns and operates 19 oil treating facilities which are tied into the Husky heavy oil pipeline systems. These pipeline systems transport heavy crude oil from the field locations to the Husky Lloydminster asphalt refinery, the Husky Lloydminster Upgrader, the Enbridge Pipeline, the Express Pipeline and the Inter Pipeline Fund systems at Hardisty, Alberta.
The Company is focused on increasing its heavy oil production and believes that its undeveloped land position, coupled with the development and application of improved recovery technologies, will grow heavy crude oil production in the Lloydminster area.
Non-Thermal EOR
In the Lloydminster heavy oil producing area, Husky continues to test various non-thermal enhanced recovery techniques. Operations continue at the Company’s first cold enhanced pilot project where six successful injection/production cycles have been completed. Husky’s second pilot project, which utilizes CO2, continued to operate to the end of 2009 with promising initial results. Both pilots continue to provide insight into reservoir response and process economics.
Page 43
Lloydminster Area
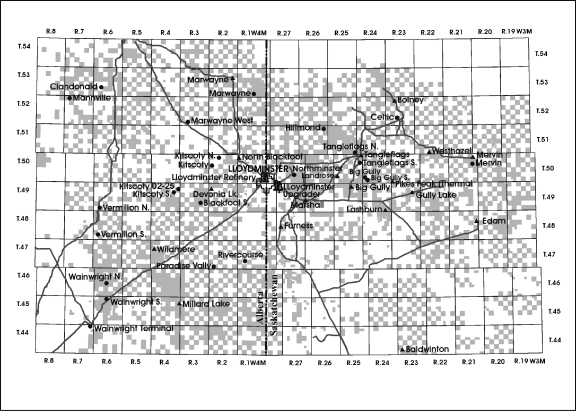
British Columbia/Foothills/Northwest Plains
Rainbow Lake District
Rainbow Lake, located approximately 700 km northwest of Edmonton, Alberta, is the site of Husky’s largest light oil production operation in Western Canada. Husky operates a number of crude oil pools in the Rainbow basin, with an average working interest of 54%. Production in this district is derived from more than 50 oil and gas pools.
Husky uses secondary and tertiary oil recovery methods extensively in the Rainbow Lake district. These methods include injecting water, natural gas and NGL into various sections of the oil reservoirs to enhance crude oil recovery. The use of tertiary recovery programs, such as the miscible flood used at Rainbow Lake, has increased the estimated amount recoverable from discovered petroleum initially in-place from 50% to 70% in certain pools. Historically, only small volumes of gas and NGL have been marketed from the Rainbow Lake district prior to 2002. In 2003, the recovery of natural gas commenced from several pools. Husky uses horizontal drilling techniques, including the re-entry of existing well bores, to maintain the level of crude oil production and to increase recovery rates. Husky plans to continue exploration efforts to supplement its development initiatives in the Rainbow Lake district. Husky’s gross (working interest) production from this area averaged 6.5 mbbls/day of light crude oil and NGL and 13.7 mmcf/day of natural gas during 2009.
Husky holds a 50% interest in, and operates, the Rainbow Lake processing plant. The processing design rate capacity of the plant is 69 mbbls/day of crude oil and water and 230 mmcf/day of raw gas. The extraction design capacity is 17 mbbls/day of NGL.
Husky also has a 100% interest in a compression and dehydration facility at Bivouac that has a capacity to process 20 mmcf/day. In 2009, throughput at this facility averaged 17.0 mmcf/day natural gas and 146 bbls/day
Page 44
of crude oil and NGL. Husky’s strategy in respect of this area is to drill and tie-in four to eight development wells per year to fully load the facility in 2010. Husky is advancing plans to expand production to 40-50 mmcf/day from this area in the 2011-2013 timeframe. Husky also holds a working interest in the EnCana Sierra gas plant in this same area. In October 2008, Husky completed an asset exchange divesting its interest in the Sierra area to increase its interest and gain operatorship of the Ekwan non-operated assets which Husky believes has greater development potential. In 2009, gross production from the Ekwan asset was 10.3 mmcf/day natural gas and 49 bbls/day of NGL. The Company is active in both these areas with development and exploration drilling. Husky holds in excess of 200,000 acres of undeveloped land in these two areas.
Husky holds an interest in one non-operated property at Bistcho in the Rainbow Lake District. Husky’s gross production from this property averaged 1.7 mmcf/day of natural gas and 5 bbls/day of liquid hydrocarbon in 2009.
North East Alberta District
The North East Alberta District is located approximately 200 km northeast of Edmonton, Alberta and is comprised primarily of shallow gas production with primarily heavy oil production. Natural gas is produced from the Clearwater, Colony, McMurray and Wabasca or a combination of these zones that lie at a depth of approximately 600 m. In 2009, gross production from this district averaged 47.8 mmcf/day of natural gas. Husky’s largest property in the district is at Muskwa, which consists of a 32 mmcf/day dehydrator facility, 6,255 horsepower of compression and a gathering system that collects natural gas from an area seven townships in size. Husky gross production from Muskwa averaged 9.3 mmcf/day in 2009.
The Company continued to expand its primary heavy oil production base in this district averaging 4,144 bbls/day (gross) in 2009. Heavy oil production is expected to increase from a development program started in late 2009 and carrying through into the first quarter 2010 at McMullen. Primary heavy oil production tests are also underway in both the Amadou and Panny areas.
In 2010, Husky plans to continue to undertake re-completions and work-overs to increase production and add natural gas reserves at a low unit cost and take advantage of existing infrastructure and capacity. The Company will continue technical evaluations on its primary heavy oil assets to position for development when market conditions improve.
High Level District
The High Level district of Alberta is approximately 600 km northwest of Edmonton, Alberta. Husky is the operator and holds close to 100% working interests in its properties. The area contains shallow Bluesky natural gas reservoirs that are characterized as low deliverability and low decline. In 2009, gross production from this area averaged 12.0 mmcf/day of natural gas.
Ram River District
The Ram River district is located in west central Alberta and includes the large Blackstone, Ricinus and Clearwater/ Limestone natural gas fields.
The Blackstone field is the most prolific of these fields and contains three high deliverability natural gas wells, capable of combined raw gas production of 27 mmcf/day. Husky holds a 34% interest in one unitized well, and a 24% and 50% interest, respectively, in two non-unit wells, and acts as the contract operator of the Blackstone field. Production from the area is processed at the Ram River gas plant.
Husky holds an average 72% interest in and operates the Ram River sour gas plant and related processing facilities. The Ram River plant has the capacity to process 622 mmcf/day of sour gas, resulting in sales gas
Page 45
capacity of 525 mmcf/day. The plant also has the capacity to produce in excess of 2.8 mlt/day of sulphur from raw gas. During 2009, the plant operated at approximately 45.9% of its approved inlet raw gas capacity. The Ram River plant processes in excess of 10% of the Company’s total gross natural gas production. This includes an average of 32 mmcf/day of Husky gross production from the Blackstone, Brown Creek, Cordel and Stolberg fields and an average of 11 mmcf/day of Husky gross production from Ricinus and Clearwater/Limestone and Benjamin fields. In addition the Company processes third party volumes. Gross production from the Strachan, Ferrier and North Blackstone areas, which is processed at other gas plants, averaged 19 mmcf/day of natural gas, bringing total Husky gross production of natural gas from the Ram River district to 62 mmcf/day in 2009. The Company’s 2010 plans for the Ram River district include continued exploration and development drilling in North Blackstone area and application of new horizontal well fracture stimulation techniques to low rate Mississippian wells.
Husky has a sour gas pipeline network that supports the Ram River plant. Husky operates a network of 845 km of sour gas pipelines in the Ram River district and holds a 30% interest in 684 km of this pipeline system. The sour gas processed at the Ram River plant is produced from 18 sour gas fields located as far as 145 km from the Ram River plant.
Husky believes that the Ram River plant and the extensive infrastructure of gathering pipelines, transmission systems and rail lines, which support the plant, represents a strategic base for natural gas exploration and development planned in this part of the foothills region.
In addition, other companies are active in pursuing exploration and production activities in this area which may provide additional opportunities for generating third party natural gas processing revenue. In 2009, net processing income was $10.5 million down from $35.0 million in 2008 due, in part, to lower Shell Tay River natural gas volumes and no third party processing of re-melt sulphur volumes in 2009.
Kaybob District
The Kaybob district consists of land located in the Fox Creek region of Alberta and is divided into three areas. The Kaybob South Triassic Unit 1 (40.5% working interest), Kaybob South Triassic Unit 2 (26.8% working interest), and non-unit lands (various working interests from gross overriding royalty to 100% working interest).
Husky has a 13.2% working interest in the sour gas portion and a 17.8% working interest in the sweet gas portion of the plant. The Company also has various working interests in sweet gas gathering and compression facilities in the area. During 2009, Husky gross production from this district was 527 bbls/day of crude oil and NGL and 9.3 mmcf/day of natural gas.
Alberta/British Columbia Plains District
Boundary Lake Area
Husky holds a 50% working interest in the Boundary Lake Gas Unit and a 34% and 19% interest in the Boundary Lake Oil Unit 1 and 2, respectively, in northeast British Columbia. Husky natural gas production from this area is derived from five Belloy sour gas pools and is processed at the nearby Boundary Lake processing plant. Husky gross production from this area was 7.8 mmcf/day of natural gas and 1,220 bbls/day of crude oil and NGL during 2009.
Valhalla and Wapiti Area
Husky holds an approximate 30% interest in three Valhalla oil units, a 100% interest in the Valhalla non-unit waterflood wells and a 100% interest in the Wapiti property. Production is primarily from the Doe
Page 46
Creek and Cardium zones and consists of light crude oil, NGL and natural gas. Husky gross production from these properties averaged 2,384 bbls/day of crude oil and NGL and 7.2 mmcf/day of natural gas in 2009. The Company’s plans for this area in 2010 are to continue optimizing Husky’s Valhalla assets to improve waterflood conformance and arrest declining production in the main Doe Creek I pool.
Kakwa Area
Husky holds an average 60% working interest in oil and gas processing facilities and associated oil and gas gathering systems in the Kakwa area. Husky gross production from this area was 9.8 mmcf/day of natural gas and 446 bbls/day of crude oil and NGL in 2009.
Lynx, Copton and Grande Cache Areas
During 2009, Husky average gross production from this asset was 13.1 mmcf/day of natural gas exiting 2009 at 16.1 mmcf/day with the start-up of production from a sour Debolt well tie-in completed in late summer 2009.
Foothills West District
Caroline Area
Husky holds an 11% working interest in the 32,000 acre Caroline natural gas field located approximately 97 km northwest of Calgary. The field has a high proportion of NGL and as a result the economics of this field are enhanced.
Husky also holds an 11% interest in the Caroline sour gas processing facility. The plant is presently running at 78% utilization based on design capacity and is processing approximately 93 mmcf/day of total plant sales gas and 15,575 mbbls/day of NGL. Husky gross production was 1,388 bbls/day of NGL and 3.4 mmcf/day of natural gas in 2009.
Edson Area
Husky holds and operates an average 85% working interest in two gas processing facilities and associated gas gathering systems in the Edson area. Husky’s gross production from these properties averaged 42.9 mmcf/day of natural gas and 1,873 bbls/day of NGL in 2009. The 2009 development drilling program consisted of four gross wells. The Company plans to drill six gross gas wells and tie in 15 gross gas wells in 2010 to maintain average production at 43 mmcf/day and improve drainage of the reservoir.
Sikanni and Federal Areas
Husky holds interests in properties in the Sikanni and Federal areas of northeast British Columbia, which averaged gross production of 14.8 mmcf/day of natural gas from six wells in 2009. Husky natural gas production flows through its gathering systems for processing at third party plants at Sikanni and McMahon. The Company plans for 2010 are to complete the tie-in of a standing Halfway well which is expected to be placed on production in March.
Graham Area
Husky holds a 40% working interest in land in the Graham area of northeast British Columbia. Husky gross production from this area in 2009 averaged 4.4 mmcf/day of natural gas. Production from the property is from one Halfway and seven Baldonnel pools. Husky also holds an interest in two 1,500 horsepower compressor stations and the non-operated Cypress gas plant. Plant capacity is 45 mmcf/day and the plant is currently operating at 57% capacity. The Company holds a 33.2% interest in the gas treating unit, 28.2% interest in the amine unit and 28% interest in the sulphur unit.
Page 47
Grizzly Valley and Bullmoose Area
Husky holds a 33-50% working interest in nine wells in this new exploration area. Husky is currently flowing natural gas production though interruptible capacity in the Spectra (Duke) system and averaged 8.7 mmcf/day of gross natural gas production from this area in 2009. In September, 2009 tie-in of two non-operated wells at Bullmoose were completed adding 20 mmcf/day of additional gross Husky production. In 2010, the Company plans to continue its exploration and development activities in the Bullmoose area with the drilling and tie-in of one non-operated exploration well.
East Central Alberta
Red Deer and Hussar Districts
The core of the Red Deer and Hussar districts is located between Calgary, Drumheller and Sylvan Lake. Husky operates 21 facilities with gas gathering systems in these districts. Husky gross production from this area averaged 126.8 mmcf/day of natural gas and 15.8 mbbls/day of crude oil and NGL in 2009. Husky intends to continue to develop the natural gas potential of these districts with infill, step out and exploratory wells to optimize gas recovery and develop new pools in order to operate the facilities at capacity. The Company is involved in coal bed methane development in this district. During 2009, 18 gross coal bed methane wells were drilled. At year end, there were 601 coal bed methane wells that were producing a total of 54 mmcf/day (24 mmcf/day Husky’s share) of natural gas. Husky’s development plan for 2010 has been significantly reduced due to lower returns in the current price environment. Husky plans to recomplete approximately 15 wells from lower, depleted horizons, to the coal zones. In addition, Husky will tie in 6 standing wells to hold Husky’s gross production at approximately 24 mmcf/day of natural gas from coal bed methane.
Provost District
The centre of the Provost district is approximately 240 km southeast of Edmonton. It is predominantly a medium crude oil area that averaged gross production of 12.8 mbbls/day of crude oil and 16.9 mmcf/day of natural gas in 2009. Husky intends to increase efforts to reduce operating costs and improve oil recovery through application of new technologies, such as chemical flooding and horizontal drilling with multiple fracturing treatments. Husky holds a large land position and maintains close to a 100% working interest in most of its facilities. In 2010, Husky intends to extensively apply horizontal wells with multi-zone frac’s and will advance the planned alkaline surfactant polymer (“ASP”) flood in the Macklin area.
Athabasca District
The Athabasca district extends approximately 175 km north of Edmonton, and from the Alberta-Saskatchewan border in the east, to the Alberta foothills in the west. The predominant area target has traditionally been shallow gas, ranging from 450 m to 900 m in the multi-zone Palaeozoic Mannville formation, but more recently Husky has applied horizontal wells with multiple frac’s for oil in the Viking formation, with excellent results. The main producing areas are Athabasca, Craigend and Redwater. Husky operates 32 facilities with pipeline systems and holds an average working interest of 90% in the producing wells. Husky intends to continue developing the gas areas with infill and step out wells to optimize recovery, but at a reduced pace from past years in light of the current market conditions. Horizontal oil drilling in the Viking formation will be preferentially applied to maximize capital returns at current oil prices. Husky gross production from this area averaged 35 mmcf/day of natural gas and 470 bbls/day of crude oil in 2009.
Southern Alberta and Southern Saskatchewan
Southern Saskatchewan District
Husky is a prominent operator in southern Saskatchewan primarily producing medium gravity crude oil, with some natural gas and light crude oil. Husky gross production from properties in this district averaged 13.6 mbbls/day of crude oil and 34.5 mmcf/day of natural gas during 2009.
Page 48
Husky operates 300 oil batteries and 8 gas facilities in the southern Saskatchewan district. The oil pools in this area are exploited using pressure maintenance and waterflood recovery operations.
At the Shackleton/Lacadena Milk River shallow gas project, 18 wells were drilled and 34 were tied-in in 2009. The remaining 52 wells will be tied-in in 2010. The project was producing at a rate of 22.6 mmcf/day of natural gas at December 31, 2009 from a total of 685 wells.
At Gull Lake, the ASP flood is fully operational and chemical injection is underway, anticipating preliminary oil response in the second quarter of 2010.
All front end reservoir technical work is complete at the Fosterton ASP project and Husky is proceeding with detailed facility cost design. The Fosterton ASP flood development project is expected to start up in 2011. Husky is the operator and holds a 62.4% working interest in this project.
Southern Alberta District
Taber and Brooks are Husky’s two major centres in southern Alberta. Husky operates 25 oil facilities and 3 natural gas facilities with an average working interest of 95%. Oil production is mainly medium gravity crude with the majority of reserves being supported by waterfloods or active aquifers. Natural gas production is from a mixture of deep and shallow formations. At Warner, near Taber, Husky operates an ASP flood to increase recovery from the Cretaceous Mannville reservoir and Husky has recently implemented an additional ASP flood at Crowsnest in 2008. Husky gross production from this district averaged 8.1 mbbls/day of crude oil and 23.0 mmcf/day of natural gas during 2009.
Page 49
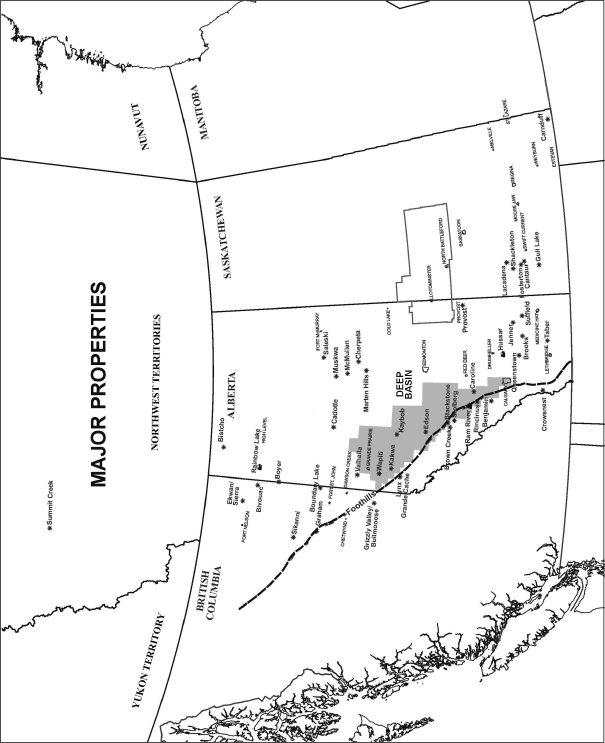
Page 50
Oil Sands
Tucker
At Tucker, an in-situ SAGD oil sands project located 30 km northwest of Cold Lake, Alberta, production commenced at the end of 2006. Production from the initial 32 well pairs was slow to ramp-up largely due to the position of some wells relative to the water saturation zone of the reservoir. At the end of 2007, eight new well pairs had been completed. Optimization strategies were conducted through 2008 on existing well pads and the eight new well pairs on Pad C resulting in encouraging production response. Throughout 2009, work continued to optimize reservoir operating strategy with production improving throughout 2009 to a December 2009 average rate of 5 mbbls/day (gross). Work to ascertain new well placements, completion design, and start-up strategy progressed throughout the year and resulted in commencement of an infill drilling program of three well pairs on B Pad North. Drilling programs at A Pad and D Pad North have been developed and await regulatory and financial sanction before anticipated execution in 2010.
Sunrise
In early 2008, Husky and BP created an integrated North American oil sands business consisting of upstream and downstream assets based on Husky’s Sunrise holdings and BP’s Toledo, Ohio, USA Refinery. The business consists of a 50/50 partnership to develop the Sunrise oil sands project contributed and operated by Husky and a 50/50 limited liability company for the Toledo Refinery contributed and operated by BP.
The front end engineering design (“FEED”) for the Sunrise in-situ SAGD oil sands project, located in the Athabasca region of northern Alberta, was completed in December 2009. Request for proposal packages for engineering, procurement and construction services for the central plant and field facilities will be issued to a select group of contractors in the first quarter of 2010. Site preparation for initial construction activities will take place in the summer of 2010. Detailed engineering is expected to begin in the fourth quarter of 2010.
The Sunrise project was approved by the Energy Resources Conservation Board (“ERCB”) in December 2005. An amendment application was submitted in March of 2007, which outlines changes and optimizations resulting from ongoing depletion planning and FEED. Amendment approvals from the ERCB were received in December 2008 and approval from Alberta Environment was received in the first quarter of 2009. A second amendment to optimize the central plant facility design was filed with the regulators in July 2009 and approval was received from both the ERCB and Alberta Environment in December 2009. Work is ongoing with various industry participants on regional infrastructure issues, including an access road and private air strip, is underway. Bitumen production is expected to commence approximately four years following project sanction. Phase I will produce 60,000 barrels per day of the full project production target of 200 mbbls/day once all phases are constructed and operational. The partners will review the project sanction package in mid-2010 for formal approval in late 2010.
Undeveloped Oil Sands Assets
Husky holds 448,000 acres in 8 undeveloped oil sands leases that contain future thermal development potential. Of these, Saleski is the largest asset with 299,360 acres followed by McMullen with 69,137 acres. Oil sands capital was re-allocated in 2009 with a focus on Sunrise and Tucker. Although no wells were drilled in 2009 into the undeveloped assets, the 2010 program will include drilling and seismic to retain quality leases and to delineate the assets.
Husky’s development of the McMullen property, which is located in the west central region of the Athabasca oil sands of northern Alberta, involves a cold production project and plans for a thermal pilot project. In December 2009, Husky commenced, completed and tied-in a 13 well program at the cold production project. An additional 13 wells were drilled in November and December of 2009 and are being completed and equipped for start-up in February 2010. Based on the results of a 2008 delineation and seismic program, the Company submitted an application to the Energy Resources Conservation Board in December 2008 to construct a 500 bbls/day thermal pilot. Pilot implementation was delayed through 2009 awaiting improved economic conditions.
Page 51
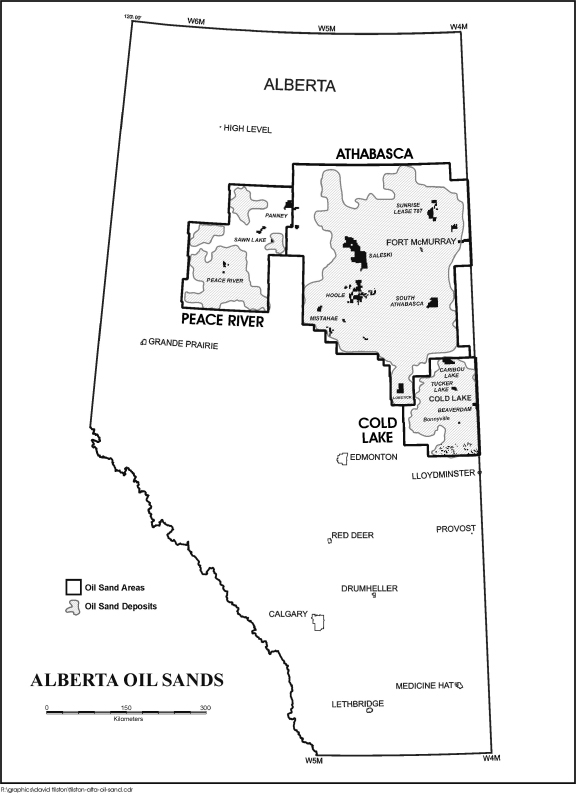
Page 52
Northwest Territories (“NWT”)
In the NWT, Husky has a focused land position in the Central Mackenzie Valley consisting of three ELs. In addition, the Company has interests in several freehold blocks and two Significant Discovery Licences (“SDL”). During 2009, Husky had no activity in the NWT. Husky was granted a one year extension for both EL 441 and EL 443. No activity is planned for 2010. Husky holds a 40% to 75% working interest in the NWT lands.
Offshore East Coast — Canada
Husky’s offshore East Coast exploration and development program is focused in the Jeanne d’Arc Basin offshore Newfoundland and Labrador, which contains the Hibernia, Terra Nova, White Rose and North Amethyst oil fields. Husky is the operator of the White Rose oil field and North Amethyst field satellite tiebacks and holds a working interest in the Terra Nova, White Rose and North Amethyst oil fields as well as in a number of smaller undeveloped fields in the central part of the basin. In 2009, Husky participated in drilling the Mizzen oil discovery in the deep water Flemish Pass basin. This is the first significant oil discovery on the Grand Banks outside of the Jeanne d’Arc Basin. In addition, Husky holds working interests in undeveloped discoveries offshore Labrador and Nunavut.
White Rose Oil Field
The White Rose oil field, which Husky operates, is located 354 km off the coast of Newfoundland and Labrador approximately 48 km east of the Hibernia oil field on the eastern section of the Jeanne d’Arc Basin.
First oil was achieved at White Rose in November 2005. The White Rose field was the third oil field developed offshore Newfoundland and Labrador. During 2009, a third gas injection well was added to the field, bringing the total well count to eight producers, ten water injectors, and three gas injectors. Husky continues to look at means of enhancing oil recovery from the core field. During 2009, gross production from the White Rose field averaged 45.1 mbbls/day.
Husky continued to progress development of the North Amethyst oil field in 2009, installing and commissioning subsea equipment and preparing theSeaRose FPSO production vessel to receive North Amethyst production. Development drilling commenced in March 2009, however, delays were encountered due to a second consecutive severe ice season. Located approximately 6 km southwest of theSeaRose FPSO, North Amethyst represents the first satellite tieback to an existing field in Canada. First oil is anticipated in the second quarter of 2010. A total of 11 wells are currently planned for the North Amethyst development.
Husky is the Operator of the North Amethyst satellite field with a 68.875% working interest. Other partners include Suncor (formerly Petro-Canada) 26.125%, and Nalcor Energy, the energy corporation of the province of Newfoundland and Labrador, with 5%.
In December 2009, Husky announced the results of stratigraphic well testing of a second, deeper formation at North Amethyst. Drilled in 2008, the well encountered an oil bearing zone with approximately 55 m of net pay in the Hibernia sandstones.
Further processing of data from a well drilled in the White Rose main field (E-09), also indicated significant additional resource potential in the Hibernia sandstones beneath the main field. Further assessment of the results of both Hibernia reservoirs is continuing.
Husky will pursue a staged development for the West White Rose area, and in November 2009, filed a development plan amendment with the regulator for a two well program drilled from existing infrastructure in the Central Drill Centre. Pending regulatory approval, drilling could commence later in 2010, with first oil in 2011. The information from this well pair will allow Husky to optimize the remaining development strategy.
Page 53
The South White Rose extension, the smallest of the satellite tie-back developments, was approved by the federal and provincial governments in September 2007 and is expected to augment production following completion of the North Amethyst and West White Rose tie-back projects.
Husky has and will continue to consider technical options for the development of natural gas in the Jeanne d’Arc Basin. In parallel and pending rig availability, exploration and delineation drilling will improve estimates of the resource base ahead of any future development.
Terra Nova Oil Field
The Terra Nova oil field is located approximately 350 km southeast of St. John’s, Newfoundland and Labrador, in 91 m to 100m of water. The Terra Nova oil field is divided into three distinct areas known as the Graben, the East Flank and the Far East. Husky’s current pooled interest in the Terra Nova field is 12.51%. This interest is subject to change, pending the completion of a re-determination process which commenced in 2008 and is expected to be finalized before the end of 2010. Production at Terra Nova commenced in January 2002. Husky gross production in 2009 from the Terra Nova field was 3.6 mmbbls or an average of 10.0 mbbls/day.
As at December 31, 2009, there were 14 development wells drilled in the Graben area, eight production wells, three water injection wells and three gas injection wells. In the East Flank area there were eleven development wells including six production wells and five water injection wells. There is one extended reach producer and an extended reach water injection well in the Far East Central area. Terra Nova completed the latest phase of the development drilling program in August 2007. Drilling operations are expected to resume in late 2010 or early 2011 subject to negotiation of a rig sharing agreement.
East Coast Exploration
Husky believes that the areas offshore Canada’s East Coast possess high impact exploration potential and its lands will provide growth opportunities in the medium to long-term. Husky presently holds working interests ranging from 5.8% to 73.125% in 16 SDLs in the Jeanne d’Arc Basin. Husky also holds interests ranging from 17.1% to 19.4% in five SDLs on the Labrador Shelf, a region that could be significant, in the long-term, for natural gas reserves.
As of December 31, 2009, Husky held a working interest in 18 ELs offshore Newfoundland primarily in the Jeanne d’Arc Basin. Husky is the operator of 11 ELs, of which it holds a 100% interest in six. Husky holds working interests ranging from 35% to 72.5% in the remaining four operated and five non-operated ELs. Husky also holds, and is the operator of, two ELs offshore Labrador. In 2009, Husky acquired additional acreage adjacent to the North Amethyst oil field.
In 2008, Husky joined with Suncor (formerly Petro-Canada) and Statoil in a rig sharing agreement that resulted in the return of the Henry Goodrich rig to the Grand Banks region. The Grand Banks rig remains a dedicated White Rose asset. Husky continues to evaluate drilling opportunities in the context of its full portfolio of East Coast land holdings and plans to drill one to two exploration wells in 2010. In late January 2010, exploratory drilling commenced on the Glenwood prospect located northwest of the main White Rose field. In 2009, Husky and Statoil discovered hydrocarbons in the Mizzen exploration well in the Flemish Pass. The companies applied for a SDL in September 2009 and as of December 31, 2009, the request was awaiting a decision from the regulator. Husky holds a 35% working interest in the discovery.
A drilling slot was not available to drill the Primrose prospect on EL 1089 in 2009/2010, so the decision was made to relinquish the licence at the end of the first term (January 15, 2010). A security deposit of $7.0 million ($3.5 million net) will be forfeit for unfulfilled work commitments on EL 1089.
Page 54
In 2009, Husky commenced public consultations in Labrador, southern Newfoundland and Nova Scotia relative to potential seismic acquisition at its land holdings offshore Labrador and in the Sydney Basin. The company could commence seismic acquisition in the region as early as summer 2010, subject to receiving the relevant approvals and securing a suitable seismic vessel.
On the Labrador Shelf, Husky is operator of the Hekja (Husky 42% interest) and Hopedale (Husky 19.4% interest) natural gas discoveries. In 2008, Husky acquired EL 1106 (Husky 100% interest) and EL 1108 (Husky 75% interest). A 2,100 km 2D seismic acquisition program is planned for 2010.
The Sydney Basin is located in the Laurentian Channel south of the island of Newfoundland. In 2008, Husky acquired EL 1115 (Husky 100%) in the very lightly explored Sydney Basin. The licence is being evaluated as a potential go-to drilling location in the event that the bad ice conditions interrupt operations on the Grand Banks. A 2,750 km 2D seismic acquisition program is planned for 2010.
East Coast
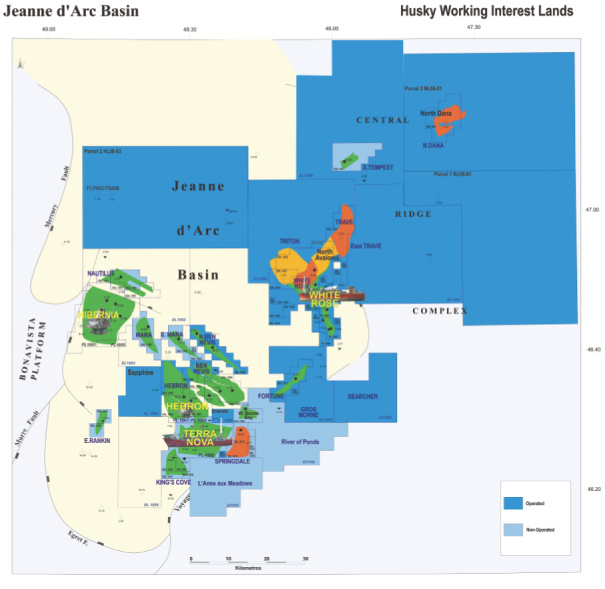
Page 55
International
Husky’s international exploration and development programs are currently located in Southeast Asia and Greenland. In China, the Company has a 40% interest in an offshore oil producing operation at Wenchang and a 100% interest in two exploration blocks in the South China Sea and one in the East China Sea. In Indonesia, the Company currently has a 50% interest in the Madura Strait PSC, 100% interest in the North Sumbawa II exploration block and a 100% interest in the East Bawean II exploration block.

China
South China Sea
Wenchang
The Wenchang field is located in the western Pearl River Mouth Basin, approximately 400 km south of Hong Kong and 100 km east of Hainan Island. Husky holds a 40% working interest in two oil fields, which commenced production in July 2002. The Wenchang 13-1 and 13-2 oil fields are producing from 32 wells in 100 m of water into a floating production, storage and offloading vessel stationed between a fixed platform located in each of the two fields. The blended crude oil from the two fields averages approximately 35° API, similar to the benchmark Minas blend. Husky working interest gross production averaged 11.2 mbbls/day during 2009.
Block 29/26
Husky executed a PSC with CNOOC for the 29/26 exploration block on October 1, 2004. The block is located in the South China Sea approximately 300 km southeast of Hong Kong and 65 km southeast of the Panyu
Page 56
gas discovery. Water depths range from 700 m to 1,700 m and the block currently covers an area of approximately 551,033 acres (2,230 sq km), following 25% relinquishments at the end of Exploration Phase I in 2007 and Exploration Phase 2 in 2009. CNOOC has the right to participate in the development of any discoveries up to a 51% working interest.
Husky drilled the Liwan 3-1-1 natural gas discovery in 2006. The well was drilled in 1,500 m of water to a total depth of 3,843 m on a large structure with up to 14,826 acres (60 sq km) of closure and encountered 56 m of net natural gas pay on logs over four zones. In August 2006, Husky shot a 98,842 acre (400 sq km) 3D seismic survey over the Liwan 3-1 field and the adjacent structures. In January 2007, the Company signed a 3 year contract with Seadrill Offshore AS for the deep water semi-submersible drilling rig,West Hercules. A further 646,180 acres (2,615 sq km) of 3-D seismic data was acquired in 2007 and 2008. TheWest Herculesdrilling rig spud the first appraisal well at Liwan 3-1 on November 20, 2008 and successfully completed a three well delineation program in Q3, 2009.
During 2009, Husky also drilled four exploration wells on Block 29/26, which resulted in the discovery of a significant new gas field at Liuhua 34-2, approximately 23 km to the northeast of the Liwan 3-1 field. Delineation drilling is planned for 2010. The field will be developed in parallel with Liwan 3-1 and will share the planned Liwan 3-1 development infrastructure.
In order to accelerate the Liwan 3-1 development, FEED was initiated in Q2, 2009 and completed in early 2010. The Original Gas In-place Report (“OGIP”) was submitted to the Chinese Government in late December 2009 and approval is expected to be received in Q1, 2010. The preparation of the Overall Development Plan (“ODP”) is at an advanced stage and submission to the Chinese Government is expected to occur in Q2, 2010. First gas production from the Liwan 3-1 and the Liuhua 34-2 fields is expected in the 2013 timeframe.
Block 63/05
Husky executed a PSC with CNOOC for the 63/05 exploration block on June 25, 2008. The block is located in the South China Sea approximately 100 km south of Hainan Island and covers an area of approximately 439,100 acres (1,777 sq km). The 63/05 block is located in the Qiongdongnan Basin in water depth of less than 120 m. The PSC requires the drilling of a single exploration well in the first exploration phase to a depth of 1,500 m and 300 sq km of 3D seismic, with a minimum work commitment of U.S. $10 million. Existing seismic data has been interpreted and Husky plans to acquire 300 sq km of new 3D seismic data in Q2, 2010, with a first exploration planned for drilling in 2011. CNOOC has the right to participate in the development of any discoveries up to a 51% working interest.
Block 39/05 and 29/06
During 2009, an application was made and regulatory approval was obtained to relinquish deepwater Block 29/06 in the Pearl River Mouth Basin, immediately to the east of Block 29/26 together with Block 35/18 and Block 50/14 in the Yinggehai Basin due to higher than acceptable exploration risk.
Block 39/05 in the Pearl River Mouth Basin, immediately southwest of the Wenchang oil fields, was relinquished following the drilling of the QH-29-2-1 exploration well, which was abandoned without testing.
East China Sea
Block 04/35
Husky executed a PSC with CNOOC for the 04/35 exploration block on December 1, 2003. The block is located in the East China Sea approximately 350 km east of the city of Shanghai and covers an area of approximately 979,771 acres (3,965 sq km). The PSC requires the drilling of a single exploration well in the first
Page 57
exploration phase to a depth of 2,500 m and a minimum work commitment of U.S. $3 million. Technical evaluations of the hydrocarbon potential are complete and preparations to drill an exploration well in Q1, 2010 are at an advanced stage. CNOOC has the right to participate in development of any discoveries up to a 51% working interest.
Indonesia
East Bawean II, Indonesia
Husky executed a PSC in September, 2006 with the Government of Indonesia for the East Bawean II block. The block is located in the North East Java Basin, approximately 200 km north of the Madura Strait PSC, where the Company is in the early development phase of the BD gas field and covers an area of 1,051,433 acres (4,255 sq km). All work commitments have been satisfied and the PSC is currently being relinquished following the drilling of two unsuccessful exploration wells in 2009.
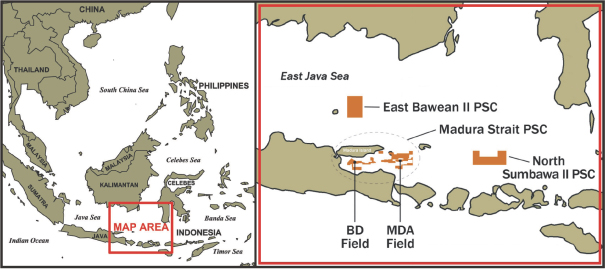
North Sumbawa II, Indonesia
Husky executed a PSC in November 2008 with the Government of Indonesia for the North Sumbawa II block. The block is located in the East Java Basin approximately 300 km east of Madura Strait PSC and covers an area of 1,249,831 acres (5,058 sq km). The PSC requires the acquisition of 2D seismic with a commitment of U.S. $2 million, and the drilling of one exploration well with a commitment of U.S. $10 million within the first three years of contract. Husky satisfied its seismic work commitment by acquiring 1,012 km of 2D seismic in December 2009 and is currently processing this data prior to interpreting and selecting a location for planned drilling in 2011.
Madura Strait, Indonesia
Husky has a 50% interest in approximately 690,412 acres (2,794 sq km) of the Madura Strait block, located offshore East Java, south of Madura Island, Indonesia. There are two discovered natural gas fields on the block. The larger of these is the Madura BD field, which was granted commercial status and had a plan of development approved by the Indonesian state oil company in 1995. The field was to supply natural gas to a new proposed independent power plant, however, construction of the power plant did not proceed due to economic issues that occurred in Indonesia at that time and as a result the BD development was deferred. Current market conditions are favourable for the BD development and Husky expects to proceed with plans to supply gas to meet the demand of the East Java region. Husky has gas sales contracts signed with three gas buyers. The updated
Page 58
development plan was approved in 2008 by the Government of Indonesia and negotiations with the Government of Indonesia to obtain an extension to the PSC are ongoing. FEED is 90% complete, and will be completed in the first quarter of 2010. Extension of the PSC is required to progress development further. Production is expected to come on stream approximately three to four years after all agreements have been approved by the Government of Indonesia.
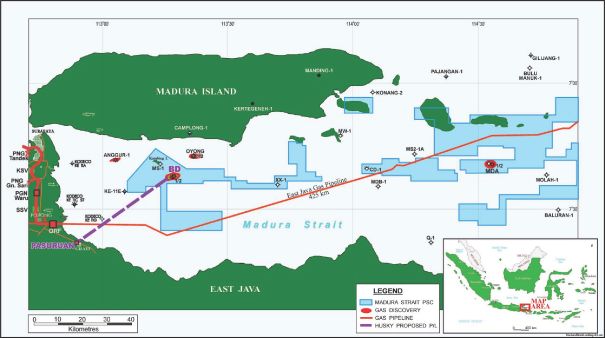
United States
Columbia River Basin (Washington State — USA)
In September 2008, Husky acquired approximately 1.7 million gross acres of undeveloped land in the Columbia River Basin located in the states of Washington and Oregon, for U.S. $42 million. This under explored basin is characterized by tertiary sandstones that lie below a layer of volcanic basalt. The potential exists for modern imaging and drilling and completion techniques to unlock a large gas resource that is located in an area containing existing sales gas pipelines that transport gas to the states of Washington, Oregon and California. In 2009, Husky participated at a 50% working interest in the drilling of an exploration well at Gray 31-23. The well did not encounter commercial volumes of gas, and Husky is currently incorporating the well data into an update of the basin potential to evaluate future drilling prospects.
Greenland
Husky holds three ELs totalling 34,280 sq km offshore the west coast of Disko Island, Greenland. During 2009, Husky acquired 2,200 sq km of 3D seismic over Husky operated Block 5 and Block 7 (HOOL 87.5% working interest). This program was completed on time and on budget and represents the first 3D seismic ever acquired offshore Greenland. In addition, the remaining aerogravity and magnetic survey over Block 7 was completed in the first half of 2009. Husky is participating in ongoing joint environmental impact studies and ice studies. The Greenland Oil Industry Association (“GOIA”) was formed in 2009 and Husky is a founding member. Main objectives of GOIA are to expand the knowledge base required and cooperate to conduct safe and environmentally friendly operations offshore Greenland and to provide a forum for industry communication with stakeholders and authorities. Husky has met its first period work commitments for all three licences; no other activity is planned for 2010.
Page 59
Shatirah, Libya
The Company has a non-operated interest in a small crude oil production operation in the Shatirah field, onshore Libya.
Distribution of Oil and Gas Production
Crude Oil and NGL
Husky provides heavy crude oil feedstock to its upgrader and its asphalt refinery, which are located at Lloydminster, Alberta/Saskatchewan. The combined dry crude feedstock requirements of the upgrader and asphalt refinery are equal to approximately 75% of Husky’s heavy crude oil production from the Lloydminster area. Husky also markets heavy crude oil production directly to refiners located in the mid-west and eastern United States and Canada. Husky markets its light and synthetic crude oil production to third party refiners in Canada, the United States and Asia. NGL are sold to local petrochemical end users, retail and wholesale distributors and to refiners in North America.
Husky markets third party volumes of light crude oil, heavy crude oil and NGL in addition to its own production.
Natural Gas
The following table shows the distribution of Husky gross average daily natural gas production for the years indicated:
| | | | | | |
| | | Years ended December 31, |
| | | 2009 | | 2008 | | 2007 |
| | | (mmcf/day) |
Sales to end users | | | | | | |
United States | | 271 | | 348 | | 338 |
Canada | | 181 | | 201 | | 208 |
| | | | | | |
| | 452 | | 549 | | 546 |
| | | | | | |
Sales to aggregators | | 5 | | 19 | | 21 |
Internal use(1) | | 85 | | 28 | | 56 |
| | | | | | |
| | 542 | | 596 | | 623 |
| | | | | | |
Note:
| (1) | Husky consumes natural gas for fuel at several of its facilities. |
The Company also markets third party natural gas production in addition to its own production.
Delivery Commitments
The following table shows the future commitments to deliver natural gas from Husky reserves. Husky’s proved developed reserves of natural gas in Western Canada are more than adequate to meet future delivery commitments.
| | | | | | |
| | | Fixed Price | | Market Price |
| | | Bcf | | $/mmbtu | | Bcf |
2010 | | 19.5 | | 5.46 | | 0.8 |
2011 | | 19.4 | | 5.77 | | 0.4 |
2012 | | 19.1 | | 6.05 | | — |
2013 | | 17.9 | | 5.85 | | — |
2014 | | 9.6 | | 3.84 | | — |
Page 60
Midstream Operations
Overview
The midstream operations include:
| | • | | Upgrading — the upgrading of heavy crude oil into synthetic light crude oil; |
| | • | | Infrastructure — pipeline transportation and processing of heavy crude oil, storage of crude oil, diluent and natural gas, extraction of NGL from natural gas, cogeneration of electrical and thermal energy; and |
| | • | | Commodity Marketing — the purchase and marketing of Husky’s and other producers’ crude oil, natural gas, NGL, sulphur, petroleum coke and electrical power. |
Upgrading Operations
Husky owns and operates the Husky Lloydminster Upgrader (“Upgrader”), a heavy oil upgrading facility located in Lloydminster, Saskatchewan. The Upgrader is designed to process blended heavy crude oil feedstock into high quality, low sulphur synthetic crude oil. Synthetic crude oil is used as refinery feedstock for the production of premium transportation fuels in Canada and the United States. In addition, the Upgrader recovers the diluent, which is blended with the heavy crude oil prior to pipeline transportation to reduce viscosity and facilitate its movement, and returns it to the field to be reused.
Prior to the Upgrader, the market for heavy crude oil was either as feedstock for asphalt production or it was sold as blended heavy crude oil for feedstock for specific refineries designed to process or upgrade heavier crude. The Upgrader was commissioned in 1992 with an original design capacity of 46 mbbls/day of synthetic crude oil. Actual production is considerably higher than the original design rate capacity as a result of throughput modifications and improved reliability. In 2007, the Upgrader commenced production of off-road diesel for locomotive and other uses. The Upgrader’s current rated production capacity is 82 mbbls/day of synthetic crude oil, diluent and off-road diesel. Production at the Upgrader averaged 61.0 mbbls/day of synthetic crude oil, 11.0 mbbls/day of diluent and 2.5 mbbls/day of low sulphur diesel in 2009. In addition, the Upgrader also produced, as by-products of its upgrading operations, approximately 316 lt/day of sulphur and 408 lt/day of petroleum coke during 2009. These products are sold in local and international markets.
Infrastructure
Husky has been involved in the gathering, transporting and storage of heavy crude oil in the Lloydminster area since the early 1960s. Husky’s crude oil pipeline systems include more than 2,000 km of pipeline and are capable of transporting in excess of 575 mbbls/day of blended heavy crude oil, diluent and synthetic crude oil. The pipeline systems transport blended heavy crude oil to Lloydminster, accessing markets through the Upgrader and Husky’s asphalt refinery in Lloydminster. Blended heavy crude oil from the field and synthetic crude oil from the upgrading operations are moved south to Hardisty, Alberta to a connection with the Enbridge Pipeline, the Kinder Morgan Express Pipeline and the Inter Pipeline Fund systems. The crude oil is transported to eastern and southern markets on these pipelines. Husky’s crude oil pipeline systems also have feeder pipeline interconnections with the Cold Lake, the Echo Pipeline, the Gibsons Terminal, the Enbridge Athabasca Pipeline and the Talisman Chauvin Pipeline.
The following table shows the average daily pipeline throughput for the periods indicated:
| | | | | | |
| | | Years ended December 31, |
| | | 2009 | | 2008 | | 2007 |
| | | (mbbls/day) |
Combined pipeline throughput | | 514 | | 507 | | 501 |
Page 61
In recent years Husky has expanded and expects to further expand its heavy crude pipeline systems to capitalize on anticipated increases in heavy oil production from the Lloydminster and Cold Lake areas.
Husky considers the expansion and optimization of the pipeline systems in the Lloydminster area necessary to further Husky’s development objectives in the area. As a result of recent expansion of the mainline pipeline systems in the area, competition for throughput volumes has increased.
Husky operates 16 heavy crude oil processing facilities located throughout the Lloydminster area. These facilities process Husky’s and other producers’ raw heavy crude oil from the field by removing sand, water and other impurities to produce clean dry heavy crude oil. The heavy crude oil is then blended with a diluent to lower both viscosity and density in order to meet pipeline specifications for transportation.
Page 62
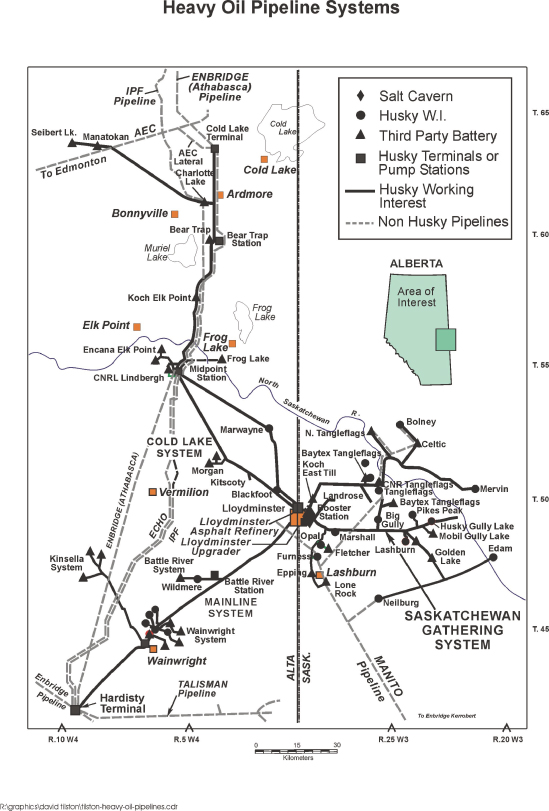
Page 63
Cogeneration
Husky holds a 50% interest in a 215 MW natural gas fired cogeneration facility at the site of the Lloydminster Upgrader. This cogeneration plant was commissioned in December 1999. Electricity produced at the facility is being sold to Saskatchewan Power Corporation under a 25 year power purchase agreement effective in 1999. Thermal energy (steam) is sold to the Upgrader.
The Company also holds a 50% interest in a 90 MW natural gas fired cogeneration facility adjacent to Husky’s Rainbow Lake processing plant. The cogeneration plant produces electricity for the Alberta Power Pool and thermal energy (steam) for the Rainbow Lake processing plant. It provides power directly to the Alberta Power Pool under an agreement with the Alberta Electric System Operator to provide additional electricity generating capacity and system stability for north-western Alberta. The power plant has the capability of being expanded to approximately 110 MW in total. ATCO Power is the operator of the facility, and hands-on operator of the Rainbow #5 electricity generator. Husky contract-operates the Rainbow #4 electricity generator, the Once-Through Steam Generator (“OTSG”) and the Water Treatment Plant. All of this equipment constitutes part of the cogeneration facility.
Natural Gas Storage Facilities
Husky has been operating a natural gas storage facility at Hussar, Alberta since April 2000. The facility has a working storage capacity of 17 bcf of natural gas. Husky also operates and has a 50% interest in a 6 bcf natural gas storage facility at East Cantaur near Swift Creek, Saskatchewan. The Company is continuing to evaluate additional storage opportunities within Western Canada.
Commodity Marketing
Husky is a marketer of both its own and third party production of crude oil, synthetic crude oil, NGL, natural gas and sulphur. The Company also markets petroleum coke, a by-product from the Lloydminster Upgrader.
Husky supplies feedstock to its Upgrader and asphalt refinery from its own and third party heavy oil production sourced from the Lloydminster and Cold Lake areas. The Company also sells blended heavy crude oil directly to refiners based in the United States and Canada. Husky’s extensive infrastructure in the Lloydminster area supports its heavy crude oil refining and marketing operations.
Husky markets light and medium crude oil and NGL sourced from Husky’s own production and third party production. Light crude oil is acquired for processing by third party refiners at Edmonton, Alberta and by its refinery at Prince George, British Columbia. Husky markets the synthetic crude oil produced at the Husky Upgrader in Lloydminster to refiners in Canada and the United States.
Husky markets natural gas sourced from its own production and third party production. The Company is currently committed to gas sales contracts with third parties, which in aggregate do not exceed amounts forecast to be deliverable from Husky reserves. Husky’s contracts are with customers located in eastern Canada/northeastern United States (27.3%), midwestern United States (26.3%), Western Canada (44.3%) and northwestern United States (2.1%). The natural gas sales contracted are primarily at market prices (91%). At December 31, 2009, Husky’s natural gas sales contracts totalled 86.7 bcf over five years. The natural gas is deliverable at the rate of 23% per year in 2010 and 2011, 22% in 2012, 21% in 2013 and 11% in 2014. Husky has acquired rights to firm pipeline capacity to transport the natural gas to most of these markets. The Company manages and trades natural gas in conjunction with Husky owned and operated natural gas storage facilities. Husky also contracts additional natural gas storage under long-term arrangements. At December 31, 2009, Husky managed natural gas storage capacity of 36 bcf.
Page 64
Husky has developed its commodity marketing operations to include the acquisition of third party volumes in order to increase volumes and enhance the value of its midstream assets. The Company plans to expand its marketing operations by continuing to increase marketing activities. The Company believes that this increase will generate synergies with the marketing of its own production volumes and the optimization of its assets. At December 31, 2009, Husky estimated commitments of approximately $452 million in natural gas purchases, 97% of which is to be purchased in 2010. At December 31, 2009, the Company did not have any long-term commitments to purchase crude oil. Husky’s purchases of crude oil primarily involve 30 day evergreen arrangements.
Downstream Operations
Canada
Overview
Husky’s Canadian refined products operations include refining of light crude oil, manufacturing of fuel and industrial grade ethanol, manufacturing of asphalt products from heavy crude oil, acquisition by purchase and exchange of refined petroleum products. Husky’s retail network provides a platform for substantial non-fuel related convenience product businesses.
Light oil refined products are produced at the Husky refinery at Prince George, British Columbia and are also acquired from third party refiners and marketed through Husky and Mohawk branded retail and commercial petroleum outlets and through direct marketing to third party dealers and end users. Asphalt and residual products are produced at Husky’s asphalt refinery at Lloydminster and are marketed directly or through Husky’s eight emulsion plants, five of which are also asphalt terminals located throughout Western Canada.
Branded Petroleum Product Outlets and Commercial Distribution
As of December 31, 2009 there were 473 independently operated Husky and Mohawk branded petroleum product outlets. These petroleum product outlets include service stations, travel centres and bulk distribution facilities located from the Ontario/Quebec border to the West Coast. The travel centre network is strategically located on major highways and serves the retail market and commercial transporters 24 hours per day, 365 days a year with quality products and full service Husky House restaurants. At most locations, the travel centre network also features the proprietary “Route Commander” cardlock system that enables commercial users to purchase products using a card system that will electronically process transactions and provide detailed billing, sales tax and other information. A variety of full and self serve retail locations under the Mohawk and Husky brand names serve urban and rural markets, while Husky and Mohawk bulk distributors offer direct sales to commercial and farm markets in Western Canada.
Husky’s strategy in respect of its petroleum product outlets includes continuing to increase profits and sales through the strategic location of new outlets, the enhancement of ancillary non-fuel income streams, the modernization, automation and upgrading of existing petroleum product outlets, expanding customer loyalty programs and the sale of non-core locations. Husky also plans to enter into strategic alliances with third parties to sell various consumer products at Husky and Mohawk branded petroleum outlets in order to generate revenue and increase demand for other products and services provided at those outlets. The Company continues to pursue acquisitions and joint venture opportunities to further enhance its existing distribution network.
In December of 2009 Husky executed an agreement to purchase 98 retail stations in the Greater Toronto and surrounding area from Suncor as these assets were being sold to comply with a Competition Bureau condition for the amalgamation of Suncor and Petro-Canada. These sites will be converted to the Husky brand. The first site will be transferred to Husky in March 2010, with the remaining sites transferred between April and November 2010. The addition of these sites will result in a 20% increase in Husky’s retail sites, a 30% increase in Husky’s corporately controlled retail sites, Ontario volume market share growth of 5% (3.5 to 8.1%), an additional 520 million lt/year of gasoline and diesel sales and 9,000 bpd propriety retail demand exposure within 400 miles of the Lima Refinery.
Page 65
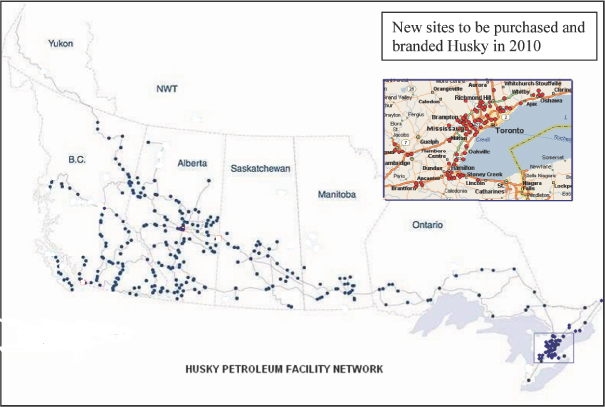
Independent retailers or agents operate all Husky and Mohawk branded petroleum product outlets. Branded outlets feature varying services such as 24 hour service, convenience stores, service bays, car washes, Husky House full service family style restaurants, proprietary and co-branded quick serve restaurants, bank machines and alternate fuels such as propane and compressed natural gas. In addition to conventional gasoline, ethanol blended fuel branded as “Mother Nature’s Fuel” and additive enhanced “Diesel Max” are offered in all markets together with Chevron lubricants. Husky supplies refined petroleum products to its branded independent retailers on an exclusive basis and provides financial and other assistance for location improvements, marketing support and related services. Husky’s brands are promoted through the Husky Snowstars Program, various national and university athletic sponsorships as well as advertising designed to reach both national and regional audiences.
Page 66
The following table shows the number of Husky and Mohawk branded petroleum outlets by class of trade and by province as of December 31, 2009:
| | | | | | | | | | | | | | |
| | | British
Columbia
&
Yukon | | Alberta | | Sask. | | Manitoba | | Ontario | | 2009
Total | | 2008
Total |
Retail Owned Outlets | | | | | | | | | | | | | | |
Travel Centres | | 10 | | 10 | | 4 | | 2 | | 14 | | 40 | | 38 |
Full Serve | | 8 | | 11 | | 1 | | 3 | | 2 | | 25 | | 28 |
Full/Self Serve | | 19 | | 12 | | 6 | | 11 | | 2 | | 50 | | 53 |
Self Serve | | 19 | | 30 | | 2 | | — | | 1 | | 52 | | 47 |
Bulk Distributor | | 1 | | 9 | | 2 | | 1 | | — | | 13 | | 13 |
Other Service Facilities | | 3 | | 6 | | — | | — | | 1 | | 10 | | 11 |
| | | | | | | | | | | | | | |
| | 60 | | 78 | | 15 | | 17 | | 20 | | 190 | | 190 |
| | | | | | | | | | | | | | |
Leased | | | | | | | | | | | | | | |
Travel Centres | | 1 | | — | | — | | — | | — | | 1 | | 1 |
Full Serve | | 3 | | 5 | | 4 | | 5 | | — | | 17 | | 20 |
Full/Self Serve | | 7 | | 14 | | 2 | | 3 | | — | | 26 | | 31 |
Self Serve | | 33 | | 34 | | — | | — | | — | | 67 | | 64 |
Bulk Distributor | | 2 | | — | | 1 | | — | | 1 | | 4 | | 4 |
Other Service Facilities | | 2 | | 4 | | — | | 3 | | 2 | | 11 | | 11 |
| | | | | | | | | | | | | | |
| | 48 | | 57 | | 7 | | 11 | | 3 | | 126 | | 131 |
| | | | | | | | | | | | | | |
Independent Retailers | | | | | | | | | | | | | | |
Travel Centres | | 1 | | 3 | | — | | — | | 4 | | 8 | | 7 |
Full Serve | | 16 | | 3 | | 7 | | 7 | | 5 | | 38 | | 54 |
Full/Self Serve | | 12 | | 11 | | — | | 1 | | — | | 24 | | 23 |
Self Serve | | 25 | | 38 | | 9 | | 2 | | 2 | | 76 | | 73 |
Bulk Distributor | | 1 | | 4 | | 2 | | — | | — | | 7 | | 8 |
Other Service Facilities | | 1 | | 2 | | — | | — | | 1 | | 4 | | 6 |
| | | | | | | | | | | | | | |
| | 56 | | 61 | | 18 | | 10 | | 12 | | 157 | | 171 |
| | | | | | | | | | | | | | |
Total | | | | | | | | | | | | | | |
Travel Centres | | 12 | | 13 | | 4 | | 2 | | 18 | | 49 | | 46 |
Full Serve | | 27 | | 19 | | 12 | | 15 | | 7 | | 80 | | 102 |
Full/Self Serve | | 38 | | 37 | | 8 | | 15 | | 2 | | 100 | | 107 |
Self Serve | | 77 | | 102 | | 11 | | 2 | | 3 | | 195 | | 184 |
Bulk Distributor | | 4 | | 13 | | 5 | | 1 | | 1 | | 24 | | 25 |
Other Service Facilities | | 6 | | 12 | | — | | 3 | | 4 | | 25 | | 28 |
| | | | | | | | | | | | | | |
| | 164 | | 196 | | 40 | | 38 | | 35 | | 473 | | 492 |
| | | | | | | | | | | | | | |
Cardlocks(1) | | 27 | | 32 | | 6 | | 6 | | 23 | | 94 | | 94 |
Convenience Stores(1) | | 97 | | 118 | | 18 | | 24 | | 19 | | 276 | | 431 |
Restaurants | | 12 | | 13 | | 4 | | 2 | | 17 | | 48 | | 46 |
Note:
| (1) | All of these are located at branded petroleum outlets. |
Husky also markets refined petroleum products directly to various commercial markets, including independent dealers, national rail companies and major industrial and commercial customers in Western Canada and the north-western United States.
Page 67
The following table shows average daily sales volumes of light refined petroleum products for the periods indicated:
| | | | | | |
| | | Years ended December 31, |
| | | 2009 | | 2008 | | 2007 |
| | | (mbbls/day) |
Gasoline | | 25.3 | | 25.0 | | 27.8 |
Diesel fuel | | 21.8 | | 23.8 | | 27.4 |
Liquefied petroleum gas | | 0.8 | | 0.9 | | 0.9 |
| | | | | | |
| | 47.9 | | 49.7 | | 56.1 |
| | | | | | |
Supply
Prince George Refinery
The Prince George refinery production is equal to approximately 20% of Husky’s total refined product supply requirements and is the source of its lowest cost refined products. The refinery produces all grades of unleaded gasoline, seasonal diesel fuels, mixed propane and butane stream and heavy oil products.
Lloydminster Asphalt Refinery
Husky’s Lloydminster refinery processes heavy crude into asphalt products used in road construction and maintenance and industrial asphalt products. The refinery has a throughput capacity of 28,500 barrels per day of heavy crude oil. The refinery also produces straight run gasoline, bulk distillates and residuals. The straight run gasoline stream is removed and re-circulated into the heavy oil pipeline network as pipeline diluent and the distillate stream is used by the Upgrader to make low sulphur diesel. The bulk distillates are hydrogen deficient and are transferred directly to the Upgrader and then treated for blending into the Husky Synthetic Blend stream. Residuals are a blend of medium and light distillate and gas oil streams, which are sold directly to customers typically as drilling and well fracturing fluids or used in asphalt cutbacks and emulsions.
Ethanol Manufacturing
In September 2006, Husky commissioned an ethanol facility in Lloydminster, Saskatchewan. This plant has an annual capacity of 130 million litres. In December 2007, the Minnedosa, Manitoba ethanol plant was commissioned also with an annual capacity of 130 million litres.
Husky’s ethanol production supports its “Mother Nature’s Fuel” ethanol-blended gasoline marketing program. When added to gasoline, ethanol improves fuel combustion, raises octane levels, prevents fuel line freezing and reduces carbon monoxide emissions, ozone precursors and net emissions of greenhouse gases. Environment Canada has designated ethanol-blended gasoline as an “Environmental Choice” product.
Husky continued to position its Refined Products business segment as the leader in ethanol blended fuels in Western Canada.
Other Supply Arrangements
In addition to the refined petroleum products supplied by the Prince George refinery of 2.9 mbbls/day, Husky has rack based pricing purchase agreements for refined products with all major Canadian refiners. During 2009, Husky purchased approximately 25.6 mbbls/day of refined petroleum products from refiners and acquired approximately 7.5 mbbls/day of refined petroleum products pursuant to exchange agreements with third party refiners. During 2009, Husky also delivered an average of 12.6 mbbls/day of crude oil to be refined under a processing agreement by another refiner, yielding approximately 11.5 mbbls/day of refined petroleum products.
Page 68
Asphalt Product
Husky produces asphalt and residual products at its 28.5 mbbls/day asphalt refinery in Lloydminster, Alberta and markets these products to customers across Western Canada and the northwestern and midwestern United States.
Husky has 39% of the market for paving asphalt sold in Western Canada. Husky’s Pounder Emulsions division has a 55% market share in Western Canada for road application emulsion products. Additional non-asphalt based road maintenance products are also marketed and distributed through Pounder. The Company’s sales to the United States and Eastern Canada accounted for 36% of asphalt sales in 2009. Exported asphalt products are shipped as far as Texas, Florida and New Brunswick. Husky sells in excess of 5 mmbbls of asphalt cements per year.
Husky’s asphalt distribution network consists of five emulsion/asphalt terminals located at Kamloops, British Columbia; Edmonton and Lethbridge, Alberta; Yorkton, Saskatchewan; and Winnipeg, Manitoba and three emulsion plants located at Watson Lake, Yukon; Lloydminster and Saskatoon, Saskatchewan. Husky also terminals asphalt at its Prince George Refinery and uses an independently operated terminal at Langley, British Columbia.
All of Husky’s asphalt requirements are supplied by the Lloydminster, Alberta asphalt refinery. The refinery had an original design rate throughput capacity of 25 mbbls/day. Debottleneck modifications have allowed Husky to increase that to 28.5 mbbls/day. The crude oil feedstock for the Lloydminster refinery is supplied through Husky’s pipeline systems from the supply of heavy crude oil in the region, including Husky produced heavy crude oil.
The following table shows average daily sales volumes of products produced at the Lloydminster refinery for the years indicated:
| | | | | | |
| | | Years ended December 31, |
| | | 2009 | | 2008 | | 2007 |
| | | (mbbls/day) |
Asphalt | | 13.6 | | 13.6 | | 14.0 |
Residual and other | | 9.0 | | 10.4 | | 7.8 |
| | | | | | |
| | 22.6 | | 24.0 | | 21.8 |
| | | | | | |
Refinery throughput averaged 25.6 mbbls/day of blended heavy crude oil feedstock during 2009. Due to the seasonal demand for asphalt products, most asphalt refineries typically operate at full capacity only during the normal paving season in Canada and the northern United States. Husky has implemented various plans to increase refinery throughput during the other months of the year, such as increasing storage capacity and developing U.S. markets for asphalt products. This allows Husky to run at or near full capacity year round.
Husky’s strategy with respect to its asphalt marketing business is to increase sales volumes by increasing asphalt supply and developing new product streams, to enhance margins by soliciting industry for Husky ideal specifications, to minimize costs and expand income base through new products and new markets and to pursue mergers, acquisitions, brokering and processing opportunities within its niche markets.
In 2010, Husky will direct its efforts to identifying acquisition, merger, brokering, terminalling, and processing opportunities. In addition, Husky is looking at increasing residual sales relative to diluents and bulk distillates to enhance margins, concentrate on sales of higher quality products with larger margins, develop new products and improve existing products.
Page 69
United States
Refining and Marketing
Lima Ohio Refinery
Acquisition of the Lima Refining Company closed on July 3, 2007. The Lima Refinery has an atmospheric crude throughput capacity of 160 mbbls per stream day. The refinery is located in Ohio between Toledo and Dayton and currently processes primarily light sweet crude oil feedstock sourced from the United States and Africa. The refinery produces gasoline, gasoline blend stocks, diesel, jet fuel, petrochemical feedstock and other by-products. The feedstock is received via the Mid-Valley and Marathon pipelines and the refined products are transported via the Buckeye and Inland pipeline systems and by rail car to primary markets in Ohio, Illinois, Indiana and southern Michigan.
During 2009 crude oil feedstock throughput averaged 115 mbbls/day. Production of gasoline averaged 63 mbbls/day, middle distillates averaged 40 mbbls/day and other fuel and feedstock averaged 12 mbbls/day.
Toledo Ohio Refinery
On March 31, 2008, Husky and BP completed a transaction that created an integrated North American oil sands business. The business comprises a 50/50 partnership to develop the Sunrise Oil Sands project, operated by Husky, and a 50/50 limited liability company for the Toledo Ohio Refinery, operated by BP.
The Toledo Refinery has an atmospheric crude throughput capacity of 160 mbbls per stream day. Products include low sulphur gasoline, ultra low sulphur diesel, aviation fuels, propane, kerosene and asphalt. It is located in one of the highest energy consumption regions in the United States.
Husky and BP plan to expand the refinery’s bitumen processing capacity to align with the first two 60 mbbls/day phases of the Sunrise SAGD development. BP currently markets 100% of the refinery’s output; however, upon commencement of bitumen deliveries from Sunrise, Husky will have the right to market its own share of the refined products.
During the twelve months ended December 31, 2009, crude oil feedstock throughput averaged 65 mbbls/day (Husky’s share). Production of gasoline averaged 41 mbbls/day, middle distillates averaged 19 mbbls/day and other fuel and feedstock averaged 5 mbbls/day.
Human Resources
The number of permanent employees was as follows:
| | | | | | |
| | | December 31, |
| | | 2009 | | 2008 | | 2007 |
| | 4,272 | | 4,298 | | 3,682 |
| | | | | | |
DIVIDENDS
The following table shows the aggregate amount of the dividends per common share of the Company paid in respect of its last three years ended December 31:
| | | | | | | | | |
| | | 2009 | | 2008 | | 2007 |
Dividends per common share | | $ | 1.20 | | $ | 1.70 | | $ | 1.16 |
Page 70
Dividend Policy and Restrictions
The Board of Directors of Husky has established a dividend policy that pays quarterly dividends. The dividend was reviewed in July 2006 and was increased to $0.25 ($1.00 annually) per common share and again in October 2007 when it was increased to $0.33 ($1.32 annually). The dividend was again reviewed in April 2008 and was increased to $0.40 ($1.60 annually) per common share and again in July 2008 when it increased to $0.50 ($2.00 annually). In February 2009, the dividend was reviewed and was decreased to $0.30 ($1.20 annually) per common share. The Board declared special dividends in the amount of $0.50 per common share in July 2003 and $0.27 per common share in November 2004. In October 2005, the Board declared a special dividend of $0.50 per common share. In February 2007, the Board declared a special dividend of $0.25 per common share. Husky’s dividend policy will continue to be reviewed and there can be no assurance that further dividends will be declared.
The declaration and payment of dividends will be at the discretion of the Board, which will consider earnings, capital requirements and financial condition of Husky, the satisfaction of the applicable solvency test in Husky’s governing corporate statute, theBusiness Corporations Act(Alberta), and other relevant factors.
DESCRIPTION OF CAPITAL STRUCTURE
Common Shares
Husky is authorized to issue an unlimited number of common shares. Holders of common shares are entitled to one vote per share at meetings of shareholders of Husky, to receive such dividends as declared by the Board of Directors on the common shares and to receive pro-rata the remaining property and assets of Husky upon its dissolution or winding up, subject to any rights having priority over the common shares.
Preferred Shares
Husky is authorized to issue an unlimited number of preferred shares. Holders of preferred shares shall not be entitled to vote at meetings of Husky. There are no preferred shares currently outstanding.
Credit Ratings Summary
| | | | | | |
| | | Rating | | Last Review | | Last Rating Change |
Moody’s: | | | | | | |
Outlook | | Stable | | August 12, 2009 | | — |
Senior Unsecured Debt | | Baa2 | | August 12, 2009 | | April 25, 2001 |
Standard and Poor’s: | | | | | | |
Outlook | | Stable | | December 30, 2009 | | July 27, 2006 |
Senior Unsecured Debt | | BBB+ | | December 30, 2009 | | July 27, 2006 |
Dominion Bond Rating Service: | | | | | | |
Trend | | Stable Positive | | November 26, 2009 | | March 31, 2008 |
Senior Unsecured Debt | | A (low) | | November 26, 2009 | | March 31, 2008 |
Credit ratings are intended to provide investors with an independent measure of credit quality of any issuer of securities. The credit ratings accorded to Husky’s securities by the rating agencies are not recommendations to purchase, hold or sell the securities inasmuch as such ratings do not comment as to market price or suitability for a particular investor. Any rating may not remain in effect for any given period of time or may be revised or withdrawn entirely by a rating agency in the future if in its judgment circumstances so warrant.
Page 71
Moody’s
Moody’s credit rating system ranges from Aaa (highest) to C (lowest). Debt securities rated within the Baa category are considered medium grade debts; they are neither highly protected nor poorly secured. Interest payments and principal security appear to be adequate at the time of the rating; however, they are subject to potential adverse circumstances over time. As a result, these debt securities possess some speculative characteristics. The addition of a 1, 2 or 3 modifier indicates an additional relative standing within the general rating classification. The addition of the modifier 1 indicates the debt is positioned in the top one third of the general rating classification, 2 indicates the mid one third and 3 indicates the bottom one third.
Standard and Poor’s
Standard and Poor’s credit rating system ranges from AAA (highest) to D (lowest). Debt securities rated within the BBB category are considered to possess adequate protection parameters. However, they could potentially change subject to adverse economic conditions or other circumstances that may result in reduced capacity of the debtor to continue to meet principal and interest payments. As a result these debt securities possess some speculative characteristics. The addition of the modifier + or - indicates the debt is positioned above (+) or below (-) the mid range of the general category.
Dominion Bond Rating Service
Dominion Bond Rating Service’s credit rating system ranges from AAA (highest) to D (lowest). Debt securities rated within the A category are considered to be of satisfactory credit quality. Protection of interest and principal is considered acceptable, but the debtor is susceptible to adverse changes in financial and economic conditions, or there may be other adverse conditions present which reduce the strength of the debtor and its rated debt. The addition of the high or low modifier denotes that the rating is either above or below the mid range of the general rating category.
MARKET FOR SECURITIES
Husky’s common shares are listed and posted for trading on the Toronto Stock Exchange under the trading symbol “HSE”.
The following table discloses the trading price range and volume of Husky’s common shares traded on the Toronto Stock Exchange during Husky’s financial year ended December 31, 2009:
| | | | | | |
| | | High | | Low | | Volume
(000’s) |
January | | 34.10 | | 28.28 | | 25,297 |
February | | 31.71 | | 25.01 | | 24,535 |
March | | 28.67 | | 24.78 | | 33,588 |
April | | 30.85 | | 26.36 | | 30,922 |
May | | 34.50 | | 28.91 | | 21,831 |
June | | 36.09 | | 30.10 | | 24,831 |
July | | 34.04 | | 28.29 | | 20,294 |
August | | 32.49 | | 28.97 | | 22,302 |
September | | 31.20 | | 28.33 | | 24,932 |
October | | 33.08 | | 28.11 | | 32,444 |
November | | 29.38 | | 27.34 | | 25,563 |
December | | 30.23 | | 26.44 | | 22,765 |
Page 72
DIRECTORS AND OFFICERS
The following are the names and residences of the directors and officers of Husky as of the date of this Annual Information Form, their positions and offices with Husky and their principal occupations during the past five years.
Directors
| | | | |
Name & Residence | | Officer or Position | | Principal Occupation During Past 5 Years |
Li, Victor T.K. Hong Kong | | Director and Co-Chair | | Mr Li is Managing Director and Deputy Chairman of Cheung Kong (Holdings) Limited (a public investment holding and project management company). |
| | |
| | | | Mr. Li is also Deputy Chairman and Executive Director of Hutchison Whampoa Limited (an investment holding company); Chairman and Executive Director of Cheung Kong Infrastructure Holdings Limited (an infrastructure company) and of CK Life Sciences Int’l., (Holdings) Inc. (a biotechnology company); Executive Director of Hongkong Electric Holdings Limited (a holding company); and a Non-executive Director of The Hongkong and Shanghai Banking Corporation Limited. |
| | |
| | | | Mr. Li is a member of the Standing Committee of the 11th National Committee of the Chinese People’s Political Consultative Conference of the People’s Republic of China and he is also a member of the Commission on Strategic Development, the Greater Pearl River Delta Business Council and the Council for Sustainable Development of the Hong Kong Special Administrative Region and the Vice Chairman of the Hong Kong General Chamber of Commerce. Moreover, Mr Li is the Honorary Consul of Barbados in Hong Kong. |
| | |
| | | | Mr. Li holds a Bachelor of Science degree in Civil Engineering, a Master of Science degree in Structural Engineering and an honorary degree, Doctor of Laws, honoris causa (LL.D). |
| | |
Fok, Canning K.N. Hong Kong | | Director, Co-Chair and Chair of the Compensation Committee | | Mr. Fok is Group Managing Director and Executive Director of Hutchison Whampoa Limited. |
Page 73
| | | | |
Name & Residence | | Officer or Position | | Principal Occupation During Past 5 Years |
| | | | | Mr. Fok is also a director and Chairman of
Hutchison Harbour Ring Limited (an investment
holding company), Hutchison Telecommunications
International Limited (a telecommunications
company), Hutchison Telecommunications Hong
Kong Holdings Limited (a telecommunications
company), Hutchinson Telecommunications
(Australia) Limited (a telecommunications company)
and Hongkong Electric Holdings Limited (a holding
company); a director and Deputy Chairman of
Cheung Kong Infrastructure Holdings Limited (an
infrastructure holding company); and a director of
Cheung Kong (Holdings) Limited (an investment
holding company). Mr. Fok was also a director of
Hanny Holdings Limited from 1992-2005, Panvas
Gas Holdings Limited from 2002-2006 and Partner
Communications Company from 1998 to 2009. |
| | |
| | | | Mr. Fok holds a Bachelor of Arts degree and a Diploma in Financial Management, and is a member of the Australian Institute of Chartered Accountants. |
| | |
Fullerton, R. Donald Ontario, Canada | | Director and Chair of the Audit Committee | | Mr. Fullerton serves as a corporate director of a number of private companies. Mr. Fullerton is also a director of the Li Ka Shing (Canada) Foundation. |
| | |
| | | | Mr. Fullerton was a director of Asia Satellite Telecommunications Holdings Limited from 1996 to 2006; George Weston Limited (a holding company) from 1991 to 2005; Partner Communications Ltd. from 2003 to 2005 and CIBC from 1974 to 2004. |
| | |
| | | | Mr. Fullerton holds a Bachelor of Arts degree. |
| | |
Ghosh, Asim Mumbai, India | | Director and Member of Health, Safety and Environment Committee | | Mr. Ghosh retired from his position as Managing Director and Chief Executive Officer of Vodafone Essar Limited in March 2009. |
| | |
| | | | Mr. Ghosh was Chairman of the Cellular Operators Association of India and of the National Telecom Committee of the Confederation of Indian Industries. |
| | |
| | | | Mr. Ghosh is an independent director of Kotak Bank, a listed India bank and was on the Board of Directors of Vodafone Essar Limited until February, 2010. |
Page 74
| | | | |
Name & Residence | | Officer or Position | | Principal Occupation During Past 5 Years |
| | | | Mr. Ghosh holds a Master’s Degree in Business Administration and a Bachelor’s Degree in Electrical Engineering. |
| | |
Glynn, Martin J.G. British Columbia, Canada | | Director, Chair of the Corporate Governance Committee and a Member of the Audit Committee and of the Compensation Committee | | Mr. Glynn is a director of Hathor Exploration Limited (mining exploration), VinaCapital Vietnam Opportunity Fund Ltd. (investment fund) and MF Global Holdings Ltd. (futures and options broker). |
| | |
| | | | | Mr. Glynn was a director from 2000 to 2006 and
President and Chief Executive Officer of HSBC
Bank USA N.A. from 2003 until his retirement in
2006. Mr. Glynn was a director of HSBC Bank
Canada from 1999 to 2006 and President and Chief
Executive Officer from 1999 to 2003. |
| | |
| | | | Mr. Glynn holds a Bachelor of Arts, Honours degree and a Masters degree in Business Administration. |
| | |
Koh, Poh Chan Hong Kong | | Director | | Ms. Koh is Finance Director, Harbour Plaza Hotel Management (International) Ltd. (a hotel management company). |
| | |
| | | | Ms. Koh is qualified as a Fellow Member (FCA) of the Institute of Chartered Accountants in England and Wales and is an Associate of the Canadian Institute of Chartered Accountants and the Chartered Institute of Taxation in the U.K. |
| | |
Kwok, Eva L. British Columbia, Canada | | Director, Member of the Compensation Committee and the Corporate Governance Committee | | Mrs. Kwok is Chairman, a director and Chief Executive Officer of Amara International Investment Corp. (a private investment holding company). |
| | |
| | | | Mrs. Kwok is also a director of CK Life Sciences Int’l., (Holdings) Inc. and Cheung Kong Infrastructure Holdings Limited. Mrs. Kwok is also a director of the Li Ka Shing (Canada) Foundation. |
| | |
| | | | Mrs. Kwok was a Director of Shoppers Drug Mart Corporation from 2004 to 2006 and of the Bank of Montreal Group of Companies until March, 2009. |
| | |
| | | | Mrs. Kwok holds a Masters degree in Science. |
| | |
Kwok, Stanley T.L. British Columbia, Canada | | Director and Chair of the Health, Safety and Environment Committee | | Mr. Kwok is a director and President of Stanley Kwok Consultants (an architecture, planning and development company). |
| | |
| | | | Mr. Kwok is also a director and President of Amara International Investment Corp. and a director of Cheung Kong (Holdings) Limited. |
Page 75
| | | | |
Name & Residence | | Officer or Position | | Principal Occupation During Past 5 Years |
| | | | Mr. Kwok holds a Bachelor of Science degree (Architecture) and an A.A. Diploma from the Architectural Association School of Architecture in London (England). |
| | |
Lau, John C.S. Alberta, Canada | | Director, President & Chief Executive Officer | | Mr. Lau is the President & Chief Executive Officer of Husky Energy Inc. Prior to joining Husky in 1992, Mr. Lau served in a number of senior executive roles within the Cheung Kong (Holdings) Limited and Hutchison Whampoa Limited group of companies. |
| | |
| | | | | Mr. Lau holds a Bachelor of Economics degree and a
Bachelor of Commerce degree. |
| | |
Russel, Colin S. Gloucestershire, United Kingdom | | Director, Member of the Audit Committee and Health, Safety and Environment Committee | | Mr. Russel is the founder and Managing Director of Emerging Markets Advisory Services Ltd. (a business advisory company). |
| | |
| | | | Mr. Russel is a director of Cheung Kong Infrastructure Holdings Limited, CK Life Sciences Int’l., (Holdings) Inc. and ARA Asset Management Pte. Ltd. |
| | |
| | | | Mr. Russel is a Professional Engineer and Qualified Commercial Mediator. He received his Master’s degree in Business Administration and a degree in electronics engineering from McGill University, Canada. |
| | |
Shaw, Wayne E. Ontario, Canada | | Director, Member of the Corporate Governance Committee and the Health, Safety and Environment Committee | | Mr. Shaw is a Senior Partner with Stikeman Elliott LLP, Barristers and Solicitors. Mr. Shaw is also a director of the Li Ka Shing (Canada) Foundation. |
| | |
| | | | Mr. Shaw holds a Bachelor of Arts degree and a Bachelor of Laws degree. |
| | |
Shurniak, William Saskatchewan, Canada | | Director, Deputy Chair and Member of the Audit Committee | | Mr. Shurniak is a director of Hutchison Whampoa Limited and a director and Chairman of Northern Gas Networks Limited (a private distributor of natural gas in Northern England). |
| | |
| | | | Mr. Shurniak held the following positions until his return to Canada in 2005: Director and Chairman of ETSA Utilities (a utility company) since 2000, Powercor Australia Limited (a utility company) since 2000, CitiPower Pty Ltd. (a utility company) since 2002, and a director of Envestra Limited (a natural gas distributor) since 2000, CrossCity Motorways Pty Ltd. (an infrastructure and transportation company) since 2002 and Lane Cove Tunnel Company Pty Ltd. (an infrastructure and transportation company) since 2004. |
Page 76
| | | | |
Name & Residence | | Officer or Position | | Principal Occupation During Past 5 Years |
| | |
| | | | Mr. Shurniak holds an Honorary Doctor of Laws degree from the University of Saskatchewan and from The University of Western Ontario and in 2009 he was awarded the Saskatchewan Order of Merit. |
| | |
Sixt, Frank J. Hong Kong | | Director & Member of the Compensation Committee | | Mr. Sixt is Group Finance Director and Executive Director of Hutchison Whampoa Limited. |
| | |
| | | | Mr. Sixt is also the Non-executive Chairman and a director of TOM Group Limited; Executive Director of Cheung Kong Infrastructure Holdings Limited (an infrastructure development company) and Hongkong Electric Holdings Limited (a holding company); a director of Cheung Kong (Holdings) Limited (an investment holding company); Hutchison Telecommunications International Limited (a telecommunications company); Hutchison Telecommunications (Australia) Limited (a telecommunications company) and Partner Communications Company Ltd. (a telecommunications company). Mr. Sixt is also a director of the Li Ka Shing (Canada) Foundation. |
| | |
| | | | Mr. Sixt holds a Master’s degree in Arts and a Bachelor’s degree in Civil Law, and is a member of the Bar and of the Law Society of the Provinces of Quebec and Ontario, Canada. |
Page 77
Officers
| | | | |
Name and Residence | | Office or Position | | Principal Occupation During Past 5 Years |
Cowan, Alister Alberta, Canada | | Vice President & Chief Financial Officer | | Vice President & Chief Financial Officer of Husky Energy Inc. since July 2008. He was previously Executive Vice President and Chief Financial Officer, British Columbia Hydro & Power Authority from 2004 to 2008, Vice President, Direct Energy Marketing Limited, from 2003 to 2004 and Vice President and Comptroller, TransAlta Corporation from 2000 to 2003. |
| | |
Peabody, Robert J. Alberta, Canada | | Chief Operating Officer, Operations & Refining | | Chief Operating Officer, Operations and Refining of Husky since January 2006. Prior to joining Husky, Mr. Peabody held the following positions with British Petroleum: Director Innovence Separation & Initial Public Offering Project from 2005 to 2006, President of Global Polymers, Chemicals from 2004 to 2005, Vice President, Polyester and Aromatics Americas from 2002 to 2004 and Vice President, BP Group Strategy & Planning from 1991 to 2001. |
| | |
Girgulis, James D. Alberta, Canada | | Vice President, Legal & Corporate Secretary | | Vice President, Legal & Corporate Secretary of Husky since August 2000. |
As at February 15, 2010, the directors and officers of Husky, as a group, owned or controlled or directed, directly or indirectly, 506,956 common shares of Husky representing less than 1% of the issued and outstanding common shares.
Conflicts of Interest
The officers and directors of Husky may also become officers and/or directors of other companies engaged in the oil and gas business generally and which may own interests in oil and gas properties in which Husky holds or may in future hold an interest. As a result, situations may arise where the interests of such directors and officers conflict with their interests as directors and officers of other companies. In the case of the directors the resolution of such conflicts is governed by applicable corporate laws which require that directors act honestly, in good faith and with a view to the best interests of Husky and, in respect of theBusiness Corporations Act(Alberta), Husky’s governing statute, that directors declare, and refrain from voting on, any matter in which a director may have a conflict of interest.
Corporate Cease Trade Orders or Bankruptcies
None of those persons who are directors or executive officers of Husky is or has been within the past ten years, a director, chief executive officer or chief financial officer of any company, including Husky and any personal holding companies of such person, that, while such person was acting in that capacity, was the subject of a cease trade or similar order or an order that denied the company access to any exemption under securities legislation, for a period of more than 30 consecutive days, or after such persons ceased to be a director, chief executive officer or chief financial officer of the company was the subject of a cease trade or similar order or an order that denied the company access to any exemption under securities legislation, for a period of more than 30 consecutive days, which resulted from an event that occurred while acting in such capacity.
In addition, none of those persons who are directors or executive officers of Husky is, or has been within the past ten years, a director or executive officer of any company, including Husky and any personal holding companies of such persons, that while such person was acting in that capacity, or within a year of that person ceasing to act in that capacity became bankrupt, made a proposal under any legislation relating to bankruptcy or
Page 78
insolvency or was subject to or instituted any proceedings, arrangement or compromise with creditors or had a receiver, receiver manger or trustee appointed to hold its assets, other than as follows. Eva Kwok was a director of Air Canada in 2003 at the time it became subject to creditor protection under theCompanies Creditors Arrangement Act(Canada). Until April 12, 2002, Frank Sixt was a director of vLinx Inc., a private Canadian company which was petitioned into bankruptcy on April 15, 2002. vLinx Inc. developed technology and software to facilitate international trade. Victor Li was a director of Star River Investment Limited, a Hong Kong company, until June 4, 2005, which commenced creditors voluntary winding up on September 28, 2004. The company was subsequently dissolved on June 4, 2005.
Individual Penalties, Sanctions or Bankruptcies
None of the persons who are directors or executive officers of Husky (or any personal holding companies of such persons) have, within the past ten years made a proposal under any legislation relating to bankruptcy or insolvency or was subject to or instituted any proceedings, arrangement or compromise with creditors or had a receiver, receiver manager or trustee appointed to hold his or her assets.
None of the persons who are directors or executive officers of the Company (or any personal holding companies of such persons) have been subject to any penalties or sanctions imposed by a court relating to securities legislation or by a securities regulatory authority or has entered into a settlement agreement with a securities regulatory authority or been subject to any other penalties or sanctions imposed by a court or regulatory body that would likely be considered important to a reasonable investor in making an investment decision.
Page 79
AUDIT COMMITTEE
The members of Husky’s Audit Committee are R.D. Fullerton (Chair), M.J.G. Glynn, W. Shurniak and C.S. Russel. Each of the members of the Company’s Audit Committee (the “Committee”) are independent in that each member does not have a direct or indirect material relationship with the Company. Multilateral Instrument 52-110 — Audit Committees provides that a material relationship is a relationship which could, in the view of the board of directors of Husky (the “Board”), reasonably interfere with the exercise of a member’s independent judgment.
The Committee’s Charter provides that the Committee is to be comprised of at least three (3) members of the Board, all of whom shall be independent and meet the financial literacy requirements of applicable laws and regulations. Each member of the Committee is financially literate in that each has the ability to read and understand a set of financial statements that present a breadth and level of complexity of accounting issues that are generally comparable to the breadth and complexity of the issues that can reasonably be expected to be raised by the Company’s financial statements.
The education and experience of each Audit Committee member that is relevant to the performance of his responsibilities as an Audit Committee member is as follows.
R.D. Fullerton (Chair) — Before his retirement Mr. Fullerton served as Chief Executive Officer of CIBC and also served as a director and/or an Audit Committee member of 16 major domestic and international public companies as well as a director of a number of affiliates of CIBC.
M.J.G. Glynn — Mr. Glynn was a director from 2000 to 2006 and President and Chief Executive Officer of HSBC Bank USA N.A. from 2003 until his retirement in 2006. Mr. Glynn was a director of HSBC Bank Canada from 1999 to 2006 and President and Chief Executive Officer from 1999 to 2003.
W. Shurniak — Mr. Shurniak is a non-executive director and member of the audit committee of Hutchison Whampoa Limited and a director and Chairman of Northern Gas Networks Limited, a private company. He has broad banking experience and prior to his moving back to Canada in 2005, he spent five years in Australia where he was a director of a public company engaged in the distribution of natural gas. He was also a director and member of the Audit Committee of five other private companies, three of which are regulated electricity distribution companies.
C.S. Russel — Mr. Russel is the founder and Managing Director of Emerging Markets Advisory Services Ltd. Mr. Russel is a director and an Audit Committee member of Cheung Kong Infrastructure Holdings Limited, CK Life Sciences Int’l., (Holdings) Inc. and ARA Asset Management Pte. Ltd.
Husky’s Audit Committee Charter is attached hereto as Schedule “A.”
External Auditor Service Fees
The following table provides information about the fees billed to the Company for professional services rendered by KPMG LLP, the Company’s external auditor, during the fiscal years indicated:
| | | | |
| | | Aggregate fees
billed by the
External Auditor |
| | | 2009 | | 2008 |
| | | ($ thousands) |
Audit fees | | 2,278 | | 1,832 |
Audit-related fees | | 639 | | 121 |
Tax fees | | 51 | | 142 |
All other fees | | 132 | | 41 |
| | | | |
| | 3,100 | | 2,136 |
| | | | |
Page 80
Audit Fees. Audit fees consist of fees for the audit of the Company’s annual financial statements or services that are normally provided in connection with statutory and regulatory filings, including the Sarbanes-Oxley Act of 2002.
Audit-Related Fees. Audit-related services included attest services not required by statute or regulation and services with respect to acquisitions and dispositions.
Tax Fees. Tax fees included tax planning and various taxation matters.
All Other Fees. Other services provided by the Company’s external auditor, other than audit, audit-related and tax services.
The audit fees disclosed in the table above reflect amounts billed in the period indicated rather than the period of the audit.
The Company’s Audit Committee has the sole authority to review in advance, and grant any appropriate pre-approvals, of all non-audit services to be provided by the independent auditors and to approve fees, in connection therewith. The Audit Committee approved all of the audit-related, tax and other services provided by KPMG LLP in 2009.
LEGAL PROCEEDINGS
The Company is involved in various claims and litigation arising in the normal course of business. While the outcome of these matters is uncertain and there can be no assurance that such matters will be resolved in the Company’s favour, the Company does not currently believe that the outcome of adverse decisions in any pending or threatened proceedings related to these or other matters or amount which it may be required to pay by reason thereof would have a material adverse impact on its financial position, results of operations or liquidity.
INTEREST OF MANAGEMENT AND OTHERS IN MATERIAL TRANSACTIONS
None of the Company’s directors, executive officers or persons or companies that beneficially own or control or direct, directly or indirectly or a combination of both, more than 10% of Husky’s common shares, or their associates and affiliates, had any material interest, direct or indirect, in any transaction with the Company within the three most recently completed financial years or during the current financial year that has materially affected or would reasonably be expected to materially affect the Company except as follows.
In late 2007, TransAlta Power, L.P. (“TAPLP”) was acquired by an indirect subsidiary of Cheung Kong Infrastructure Holdings Limited, which is majority owned by Hutchinson Whampoa Limited, which owns 100% of UF. Investments (Barbados) Ltd. a 34.55% shareholder in Husky. TAPLP is a 49.99% owner in TransAlta Cogeneration, L.P. (“TACLP”) which is the Company’s joint venture partner for the Meridian cogeneration facility at Lloydminster. The Company sells natural gas to the Meridian cogeneration facility and other cogeneration facilities owned by TACLP. These natural gas sales are related party transactions and have been measured at the exchange amount. For 2009, the total value of natural gas sales to the Meridian and other cogeneration facilities owned by TACLP was $90 million (2008 — $125 million). At December 31, 2009, the total value of accounts receivables related to these transactions was nil (2008 — nil).
On May 11, 2009, the Company issued 5- and 10-year senior notes of U.S. $251 million and U.S. $107 million respectively to certain management, shareholders, affiliates and directors as part of the U.S. $1.5 billion 5 -and 10-year senior notes issued through the existing base shelf prospectus, which was filed in February 2009. (Refer to Note 16 to the Consolidated Financial Statements). Subsequent to this offering, U.S. $22 million of the 5-year senior notes and U.S. $75 million of the 10-year senior notes issued to related parties were sold to third parties. The coupon rates offered were 5.90% and 7.25% for the 5- and 10-year tranches respectively.
Page 81
TRANSFER AGENT AND REGISTRARS
Husky’s transfer agent and registrar is Computershare Trust Company of Canada. In the United States, the transfer agent and registrar is Computershare Trust Company, Inc. The registers for transfers of the Company’s common shares are maintained by Computershare Trust Company of Canada at its principal offices in the cities of Calgary and Toronto. Queries should be directed to Computershare Trust Company at 1-888-267-6555 (toll free in North America).
INTERESTS OF EXPERTS
Certain information relating to the Company’s reserves included in this Annual Information Form has been calculated by the Company and audited and opined upon as of December 31, 2009 by McDaniel & Associates Consultants Ltd. (“McDaniel”), independent petroleum engineering consultants retained by Husky, and has been so included in reliance on the opinion and analysis of McDaniel, given upon the authority of said firm as experts in reserve engineering. The partners of McDaniel as a group beneficially own, directly or indirectly, less than 1% of the Company’s securities of any class.
ADDITIONAL INFORMATION
Additional information, including directors’ and officers’ remuneration, principal shareholders of Husky’s common shares and a description of options to purchase common shares will be contained in Husky’s Management Information Circular to be dated March 1, 2010, prepared in connection with the annual meeting of shareholders to be held on April 20, 2010.
Additional financial information is provided in Husky’s Consolidated Financial Statements and Management’s Discussion and Analysis for the most recently completed fiscal year ended December 31, 2009.
Additional information relating to Husky Energy Inc. is available on SEDAR atwww.sedar.com and on EDGAR atwww.sec.gov.
Page 82
ABBREVIATIONS AND GLOSSARY OF TERMS
As used in this Annual Information Form, the following terms have the meanings indicated:
| | |
Units of
Measure | | |
| bbl | | -barrel |
| bbls | | -barrels |
| mbbls | | -thousand barrels |
| mmbbls | | -million barrels |
| bbls/day | | -barrels per calendar day |
| mbbls/day | | -thousand barrels per calendar day |
| boe | | -barrels of oil equivalent |
| boe/day | | -barrels of oil equivalent per calendar day |
| m | | -metres |
| mcf | | -thousand cubic feet |
| mmcf | | -million cubic feet |
| bcf | | -billion cubic feet |
| mmcf/day | | -million cubic feet per calendar day |
| mcfge | | -thousand cubic feet of gas equivalent |
| lt | | -long ton |
| mlt | | -thousand long tons |
| lt/day | | -long tons per calendar day |
| mlt/day | | -thousand long tons per calendar day |
| mmbtu | | -million British thermal units |
| km | | -kilometres |
| MW | | -megawatts |
| |
Acronyms | | |
| API | | -American Petroleum Institute |
| CNOOC | | -China National Offshore Oil Corporation |
| COGEH | | -Canadian Oil and Gas Evaluation Handbook |
| EIA | | -Energy Information Administration |
| EL | | -Exploration Licence |
| ERCB | | -Energy Resources Conservation Board |
| FAS | | -Financial Accounting Statement |
| FASB | | -Financial Accounting Standards Board |
| FPSO | | -Floating production, storage and offloading vessel |
| LLB | | -Lloydminster Blend |
| NGL | | -Natural gas liquids |
| NWT | | -Northwest Territories |
| NYMEX | | -New York Mercantile Exchange |
| OPEC | | -Organization of Petroleum Exporting Countries |
| PIIP | | -Petroleum initially-in-place |
| PSC | | -Production Sharing Contract |
| SAGD | | -Steam assisted gravity drainage |
| SDL | | -Significant Discovery Licence |
| SEC | | -Securities and Exchange Commission of the United States |
| SEDAR | | -System for Electronic Document Analysis and Retrieval |
| WCSB | | -Western Canada Sedimentary Basin |
| WTI | | -West Texas Intermediate crude oil |
Page 83
API° gravity
Measure of oil density or specific gravity used in the petroleum industry. The American Petroleum Institute (API) scale expresses density such that the greater the density of the petroleum, the lower the degree of API gravity.
Barrel
A unit of volume equal to 42 U.S. gallons.
Bitumen
Bitumen is solid or semi-solid with a viscosity greater than 10,000 centipoise at original temperature in the deposit and atmospheric pressure.
Bulk terminal
A facility used primarily for the storage and/or marketing of petroleum products.
Coal bed methane
The primary energy source of natural gas is methane (CH(4)). Coal bed methane is methane found and recovered from the coal bed seams. The methane is normally trapped in the coal by water that is under pressure. When the water is removed the methane is released.
Cold production
A non-thermal production process for heavy oil in unconsolidated sand formations. During the cold production process, heavy oil and sand are produced simultaneously through the use of progressive cavity pumps, which produce high pressure in the reservoir.
Debottleneck
To remove restrictions thus improving flow rates and productive capacity.
Delineation well
A well in close proximity to an oil or gas well that helps determine the areal extent of the reservoir.
Developed area
A drainage unit having a well completed thereon capable of producing oil or gas in paying quantities.
Development well
A well drilled within the proved area of an oil and gas reservoir to the depth of a stratigraphic horizon known to be productive.
Diluent
A lighter gravity liquid hydrocarbon, usually condensate or synthetic oil, added to heavy oil to improve the transmissibility of the oil through a pipeline.
Page 84
Dry and abandoned well
A well found to be incapable of producing oil or gas in sufficient quantities to justify completion as a producing oil or gas well.
Enhanced recovery
The increased recovery from a crude oil pool achieved by artificial means or by the application of energy extrinsic to the pool, which artificial means or application includes pressuring, cycling, pressure maintenance or injection to the pool of a substance or form of energy but does not include the injection in a well of a substance or form of energy for the sole purpose of aiding in the lifting of fluids in the well, or stimulation of the reservoir at or near the well by mechanical, chemical, thermal or explosive means.
Exploration licence
A licence with respect to the Canadian offshore or the Northwest or Yukon Territories conferring the right to explore for, and the exclusive right to drill and test for, petroleum; the exclusive right to develop the applicable area in order to produce petroleum; and, subject to satisfying the requirements for issuance of a production licence and compliance with the terms of the licence and other provisions of the relevant legislation, the exclusive right to obtain a production licence.
Exploratory well
A well drilled to find a new field or to find a new reservoir in a field previously found to be productive of oil or gas in another reservoir. Generally, an exploratory well is any well that is not a development well, a service well, an extension well, or a stratigraphic test well as those items are defined herein.
Extension well
A well drilled to extend the limits of a known reservoir.
Field
An area consisting of a single reservoir or multiple reservoirs all grouped on or related to the same individual geological structural feature and/or stratigraphic condition. There may be two or more reservoirs in a field which are separated vertically by intervening impervious strata, or laterally by local geologic barriers, or by both.
Gathering system
Pipeline system and associated facilities used to gather natural gas or crude oil from various wells and deliver it to a central point where it can be moved from there by a single pipeline to a processing facility or sales point.
Heavy crude oil
Crude oil measured between 20 API° and 10 API° and is liquid at original temperature in the deposit and atmospheric pressure.
Horizontal drilling
Drilling horizontally rather than vertically through a reservoir, thereby exposing more of the well to the reservoir and increasing production.
Page 85
Hydrogen sulphide
A poisonous gas which is colourless and heavier than air and is found in sour gas.
Infill well
A well drilled on an irregular pattern disregarding normal spacing requirements. These wells are drilled to produce from parts of a reservoir that would otherwise not be recovered through existing wells drilled in accordance with normal spacing.
Light crude oil
Crude oil measured at 30 API° or lighter.
Liquefied petroleum gas
Liquefied propanes and butanes, separately or in mixtures.
Medium crude oil
Crude oil measured between 20 API° and 30 API°.
Metocean data
Meteorological and oceanographic data used for, among other things, the design of marine structures.
Miscible flood
An enhanced recovery method which requires that three fluids exist in the reservoir: the mobile oil to be recovered, a displacing fluid (NGL) injected to move as a bank behind the oil, and a fluid injected to propel the displacing fluid (chase gas) through the reservoir.
Multiple completion well
A well producing from two or more formations by means of separate tubing strings run inside the casing, each of which carry hydrocarbons from a separate and distinct producing formation.
Natural gas liquids
Those hydrocarbon components recovered from raw natural gas as liquids by processing through extraction plants, or recovered from field separators, scrubbers or other gathering facilities. These liquids include the hydrocarbon components ethane, propane, butanes and condensate, or a combination thereof.
Oil battery
An accessible area to accommodate separators, treaters, storage tanks and other equipment necessary to process and store crude oil and other fluids prior to transportation.
Oil sands
Sands and other rock materials which contain crude bitumen and include all other mineral substances in association therewith.
Page 86
Overriding royalty interests
An interest acquired or withheld in the oil and gas produced (or the proceeds from the sale of such oil and gas), received free and clear of all costs of development, operation, or maintenance and in addition to the usual landowner’s royalty reserved to the lessor in an oil and gas lease.
Primary recovery
The oil and gas recovered by any method that may be employed to produce the oil or gas through a single well bore. The fluid enters the well bore by the action of native reservoir energy or gravity.
Production Sharing Contract
A contract for the development of resources under which the contractor’s costs (investment) are recoverable each year out of the production but there is a maximum amount of production which can be applied to the cost recovery in any year. This annual allocation of production is referred to as cost oil; the remainder is referred to as profit oil and is divided in accordance with the contract between the contractor and the host government.
Raw gas
Gas as produced from a well before the separation therefrom liquefiable hydrocarbons or other substances contained therein.
Secondary recovery
Oil or gas recovered by injecting water or gas into the reservoir to force additional oil to the producing wells. Usually, but not necessarily, this is done after the primary recovery phase has passed.
Seismic (survey)
A method by which the physical attributes in the outer rock shell of the earth are determined by measuring, with a seismograph, the rate of transmission of shock waves through the various rock formations. The rate at which the waves are transmitted varies with the medium through which they pass.
Service well
A well drilled or completed for the purpose of supporting production in an existing field. Specific purposes of service wells include gas injection, water injection, steam injection, air injection, saltwater disposal, water supply for injection, observation or injection for in-situ combustion.
Significant Discovery Licence
A licence issued following the declaration of a significant discovery, which is indicated by the first exploration well that demonstrates by flow testing the existence of sufficient hydrocarbons in a particular geological feature to suggest potential for sustained production. A Significant Discovery Licence confers the same rights as that of an Exploration Licence.
Sour gas
Natural gas contaminated with chemical impurities, notably hydrogen sulphide or other sulphur compounds. Such compounds must be removed before the gas can be used for commercial or domestic purposes.
Page 87
Specific gravity
The ratio between the weight of equal volumes of water and another liquid measured at standard temperature, the weight of water is assigned a value of one (1). However, the specific gravity of oil is normally expressed in degrees of API gravity as follows:
| | | | |
Degrees API = | | 141.5 | | -131.5 |
| | Specific gravity @ F60 degrees | |
Spot price
The price for a one-time open market transaction for immediate delivery of a specific quantity of product at a specific location where the commodity is purchased “on the spot” at current market rates.
Steam assisted gravity drainage
A recovery method used to produce heavy crude oil and bitumen in-situ. Steam is injected via a horizontal well along a producing formation. The temperature in the formation increases and lowers the viscosity of the crude oil allowing it to fall to a horizontal production well beneath the steam injection well.
Step-out well
A well drilled adjacent to a proven well but located in an unproven area; a well drilled in an effort to ascertain the extent and boundaries of a producing formation.
Stratigraphic test well
A drilling effort, geologically directed, to obtain information pertaining to a specific geologic condition. Such wells customarily are drilled without the intention of being completed for hydrocarbon production. This classification also includes tests identified as core tests and all types of expendable holes related to hydrocarbon exploration. Stratigraphic test wells are classified as (i) “exploratory-type,” if not drilled in a proved area, or (ii) “development-type,” if drilled in a proved area.
Synthetic oil
A mixture of hydrocarbons derived by upgrading heavy crude oils, including bitumen, through a process that reduces the carbon content and increases the hydrogen content.
Tertiary recovery
The recovery of oil and gas by using exotic or complex recovery schemes involving steam, chemicals, gases or heat. Usually, but not necessarily, this is done after the secondary recovery phase has passed.
Three-D seismic (survey)
Three dimensional seismic imaging which uses a grid of numerous cables rather than a few lines stretched in one line.
Turnaround
Perform maintenance at a plant or facility which requires the plant or facility to be shut completely or partially down for the duration.
Page 88
Undeveloped area
An area in which it has not been established by drilling operations whether oil and/or gas may be found in commercial quantities.
Waterflood
One method of secondary recovery in which water is injected into an oil reservoir for the purpose of forcing oil out of the reservoir and into the bore of a producing well.
Well abandonment costs
Costs of abandoning a well (net of any salvage value) and of disconnecting the well from the surface gathering system.
Wellhead
The structure, sometimes called the “Christmas tree,” that is positioned on the surface over a well that is used to control the flow of oil or gas as it emerges from the subsurface casinghead.
Working interest
An interest in the net revenues of an oil and gas property which is proportionate to the share of exploration and development costs borne until such costs have been recovered, and which entitles the holder to participate in a share of net revenue thereafter.
Page 89
SPECIAL NOTE REGARDING FORWARD-LOOKING STATEMENTS
Certain statements in this Annual Information Form are forward looking statements within the meaning of Section 21E of the United States Securities Exchange Act of 1934, as amended, and Section 27A of the United States Securities Act of 1933, as amended and forward-looking information within the meaning of applicable Canadian securities legislation (collectively “forward-looking statements”). The Company hereby provides cautionary statements identifying important factors that could cause actual results to differ materially from those projected in these forward-looking statements. Any statements that express, or involve discussions as to, expectations, beliefs, plans, objectives, assumptions or future events or performance (often, but not always, through the use of words or phrases such as “will likely result,” “are expected to,” “will continue,” “is anticipated,” “estimated,” “intend,” “plan,” “projection,” “could,” “vision,” “goals,” “objective,” “target,” “schedules” and “outlook”) are not historical facts, are forward-looking and may involve estimates and assumptions and are subject to risks, uncertainties and other factors some of which are beyond the Company’s control and difficult to predict. Accordingly, these factors could cause actual results or outcomes to differ materially from those expressed in the forward-looking statements.
In particular, forward-looking statements in this Annual Information Form include, but are not limited to: the anticipated effect of costs incurred for environmental protection to Husky’s financial condition and results of operations in the long term; reserve and resource estimates; discounted future net cash flows relating to proved oil and gas reserves; future capital expenditures required to gain access to proved undeveloped reserves; planned execution of the agreement to purchase southern Ontario retail outlets; testing and implementation of enhanced recovery techniques; exploration, development and production plans for the Company’s assets throughout the Western Canada Sedimentary Basin; drilling plans for the Tucker Oil Sands Project; anticipated project sanction, development plans and production capacity for the Sunrise Project; exploration and drilling plans for the Company’s undeveloped oil sands assets; exploration, development and production plans for the White Rose oil field; expectations in respect of the timing of the Terra Nova re-determination; drilling plans at Terra Nova; seismic acquisition and exploration plans for Canada’s East Coast; development and production plans for the Liwan discovery; seismic acquisitions, delineation drilling and exploration plans for the South China Sea and the East China Sea; drilling plans for the North Sumbawa II block; receipt of an extension of the PSC and development and production plans for the Madura BD field; evaluation of the Columbia River Basin; future delivery commitments of natural gas; plans to expand the Company’s commodity marketing operations; planned expansion of the Company’s heavy crude pipeline system; evaluation of additional storage opportunities in Western Canada; plans to strategically locate new retail outlets and form strategic alliances in the downstream businesses; the Company’s strategy to grow its asphalt marketing business and plans to capture value through various business opportunities; and plans to reposition and upgrade the Toledo Refinery.
Although the Company believes that the expectations reflected by the forward-looking statements presented in this Annual Information Form are reasonable, Husky’s forward-looking statements have been based on assumptions and factors concerning future events that may prove to be inaccurate. Those assumptions and factors are based on information currently available to the Company about Husky and the businesses in which it operates. Information used in developing forward-looking statements has been acquired from various sources including third party consultants, suppliers, regulators and other sources. The material factors and assumptions used to develop the forward-looking statements include, but are not limited to:
| | • | | no significant adverse changes to energy markets, competitive conditions, the supply and demand for crude oil, natural gas, NGL and refined petroleum products, or the political, economic and social stability of the jurisdictions in which Husky operates; |
| | • | | no significant delays of the development, construction or commissioning of our projects that may result from the inability of suppliers to meet their commitments, lack of regulatory approvals or other governmental actions, harsh weather or other calamitous event; |
| | • | | no significant disruption of operations such as may result from harsh weather, natural disaster, accident, civil unrest or other calamitous event; |
Page 90
| | • | | no significant unexpected technological or commercial difficulties that adversely affect exploration, development, production, processing or transportation; |
| | • | | continuing availability of economical capital resources; |
| | • | | demand for products and cost of operations; |
| | • | | no significant adverse legislative and regulatory changes, in particular changes to the legislation and regulation governing fiscal regimes and environmental issues; |
| | • | | stability of general domestic and global economic, market and business conditions; and |
| | • | | no significant increase in the cost of major growth projects. |
Because actual results or outcomes could differ materially from those expressed in any forward-looking statements, investors should not place undue reliance on any such forward-looking statements. By their nature, forward-looking statements involve numerous assumptions, inherent risks and uncertainties, both general and specific, which contribute to the possibility that the predicted outcomes will not occur. The risks, uncertainties and other factors, many of which are beyond Husky’s control, that could influence actual results include, but are not limited to:
| | • | | the demand for Husky’s products and prices received for crude oil and natural gas production and refined petroleum products; |
| | • | | the economic conditions of the markets in which Husky conducts business; |
| | • | | the exchange rate between the Canadian and U.S. dollar; |
| | • | | the ability to replace reserves of oil and gas, whether sourced from exploration, improved recovery or acquisitions; |
| | • | | the availability of prospective drilling rights; |
| | • | | the costs to acquire exploration rights, undertake geological studies, appraisal drilling and project development; |
| | • | | the availability and cost of labour, material and equipment to efficiently, effectively and safely undertake capital projects; |
| | • | | the costs to operate properties, plants and equipment in an efficient, reliable and safe manner; |
| | • | | potential actions of governments, regulatory authorities and other stakeholders that may impose operating costs or restrictions in the jurisdictions where the Company has operations; |
| | • | | prevailing climatic conditions in the Company’s operating locations; |
| | • | | changes to royalty regimes; |
| | • | | regulations to deal with climate change issues; |
| | • | | changes to government fiscal, monetary and other financial policies; |
| | • | | the competitive actions of other companies, including increased competition from other oil and gas companies; |
| | • | | business interruptions because of unexpected events such as fires, blowouts, freeze-ups, equipment failures and other similar events affecting Husky or other parties whose operations or assets directly or indirectly affect Husky and that may or may not be financially recoverable; |
| | • | | the inability to obtain regulatory approvals to operate existing properties or develop significant growth projects; |
| | • | | the inability to reach estimated production levels from existing and future oil and gas development projects as a result of technological or commercial difficulties or other risk factors; |
Page 91
| | • | | changes in workforce demographics; and |
| | • | | the cost and availability of capital, including access to capital markets at acceptable rates. |
These and other factors are discussed throughout this Annual Information Form and in the “Management’s Discussion and Analysis,” available on SEDAR atwww.sedar.com and on EDGAR at www.sec.gov.
Further, any forward-looking statement speaks only as of the date on which such statement is made, and, except as required by applicable securities laws, the Company undertakes no obligation to update any forward-looking statement or statements to reflect events or circumstances after the date on which such statement is made or to reflect the occurrence of unanticipated events. New factors emerge from time to time, and it is not possible for management to predict all of such factors and to assess in advance the impact of each such factor on the Company’s business or the extent to which any factor, or combination of factors, may cause actual results to differ materially from those contained in any forward-looking statements.
Page 92
Schedule A
Husky Energy Inc.
Audit Committee Charter
The Audit Committee (the “Committee”) of the Board of Directors (the “Board”) of Husky Energy Inc. (the “Company”) will have the oversight responsibility, authority and specific duties as described below.
Composition
The Committee will be comprised of three or more directors as determined by the Board, each of whom shall satisfy the independence and financial literacy requirements of applicable securities regulatory requirements. In addition, one of the members of the Committee will be an audit committee financial expert as defined in applicable securities regulatory requirements. The members of the Committee will be elected annually at the organizational meeting of the full Board on the recommendation of the Corporate Governance Committee to the Co-Chairmen and will be listed in the annual report to shareholders. One of the members of the Committee will be elected Committee Chair by the Board.
Responsibility
The Committee is a part of the Board. Its primary function is to assist the Board in fulfilling its oversight responsibilities with respect to:
| | (i) | the quarterly and annual financial statements and quarterly and annual MD&A be provided to shareholders and the appropriate regulatory agencies; |
| | (ii) | earnings press releases before the Company publicly discloses this information; |
| | (iii) | the system of internal controls that management has established; |
| | (iv) | the internal and external audit process; |
| | (v) | the appointment of qualified reserves evaluators or auditors; and |
| | (vi) | the filing of statements and reports with respect to the Company’s oil and gas reserves. |
In addition, the Committee provides an avenue for communication between the Board and each of internal audit, the external auditors, financial management, external qualified reserves evaluators or auditors and internal qualified reserves evaluators. The Committee should have a clear understanding with the external auditors and the external reserve evaluators or auditors that an open and transparent relationship must be maintained with the Committee.
The Committee will make regular reports to the Board concerning its activities.
While the Audit Committee has the responsibilities and powers set forth in this Charter, the role of the Audit Committee is oversight. The members of the Committee are not full time employees of the Company and may or may not be accountants or auditors by profession or experts in the fields of accounting or auditing and, in any event, do not serve in such capacity. Consequently, it is not the duty of the Audit Committee to plan or conduct audits or to determine that the Company’s financial statements are complete and accurate and are in accordance with generally accepted accounting principles. This is the responsibility of management and the external auditors and, as to reserves, the external reserve evaluators or auditors. Management and the external auditors shall also have the responsibility to conduct investigations and to assure compliance with laws and regulations and the Company’s business conduct guidelines.
Page 93
Authority
Subject to the prior approval of the Board, the Committee is granted the authority to investigate any matter or activity involving financial accounting and financial reporting, the internal controls of the Company and the reporting of the Company’s reserves and oil and gas activities.
The Committee has the authority to engage independent counsel and other advisors as it determines necessary to carry out its duties and to set and pay the compensation for any advisors employed by the Committee.
In recognition of the fact that the independent auditors are ultimately accountable to the Committee, the Committee shall have the authority and responsibility to nominate for shareholder approval, evaluate and, where appropriate, replace the independent auditors and shall approve all audit engagement fees and terms and all non- audit engagements with the independent auditors. The Committee shall consult with management and the internal audit group but shall not delegate these responsibilities.
Meetings
The Committee is to meet at least four times annually and as many additional times as the Committee deems necessary. Committee members will strive to be present at all meetings either in person or by telephone. As necessary or desirable, but in any case at least quarterly, the Committee shall meet with members of management and representatives of the external auditors and internal audit in separate executive sessions to discuss any matters that the Committee or any of these groups believes should be discussed privately. Likewise, as necessary or desirable, but in any case at least annually, the Committee shall meet the management and representatives of the external reserve evaluators or auditors and internal reserves evaluators in separate executive sessions to discuss matters that the Committee or any of these groups believes should be discussed privately.
Specific Duties
In carrying out its oversight responsibilities, the Committee will:
| | 1. | Review and reassess the adequacy of this Charter annually and recommend any proposed changes to the Board for approval. |
| | 2. | (a) Review with the Company’s management, internal audit and external auditors and recommend to the Board for approval the Company’s annual financial statements and annual MD&A which is to be provided to shareholders and the appropriate regulatory agencies, including any financial statement contained in a prospectus, information circular, registration statement or other similar document. |
(b) Review with the Company’s management, internal audit and external auditors and approve the Company’s quarterly financial statements and quarterly MD&A which is to be provided to shareholders and the appropriate regulatory agencies.
| | 3. | Review with the Company’s management and approve earnings press releases before the Company publicly discloses this information. |
| | 4. | Recommend to the Board the external auditors to be nominated for the purpose of preparing or issuing an audit report or performing other audit, review or attest services and the compensation to be paid to the external auditors. The external auditors shall report directly to the Committee. |
| | 5. | Be directly responsible for the oversight of the work of the external auditors, including the resolution of disagreements between management of the Company and the external auditors regarding financial reporting. |
| | 6. | Review with the Company’s management, internal audit and external auditors the Company’s accounting and financial reporting controls. Obtain annually in writing from the external auditors their observations, if any, on significant weaknesses in internal controls as noted during the course of their work. |
Page 94
| | 7. | Review with the Company’s management, internal audit and external auditor’s significant accounting and reporting principles, practices and procedures applied by the Company in preparing its financial statements. Discuss with the external auditors their judgments about the quality, not just the acceptability, of the Company’s accounting principles used in financial reporting. |
| | 8. | Review the scope of internal audit’s work plan for the year and receive a summary report of major findings by internal auditors and how management is addressing the conditions reported. |
| | 9. | Review the scope and general extent of the external auditors’ annual audit. The Committee’s review should include an explanation from the external auditors of the factors considered in determining the audit scope, including the major risk factors. The external auditors should confirm to the Committee whether or not any limitations have been placed on the scope or nature of their audit procedures. |
| | 10. | Inquire as to the independence of the external auditors and obtain from the external auditors, at least annually, a formal written statement delineating all relationships between the external auditors and the Company as contemplated by Independence Standards Board Standard No. 1, Independence Discussions with Audit Committees. |
| | 11. | Have a predetermined arrangement with the external auditors that they will advise the Committee, through its Chair and management of the Company, of any matters identified through procedures followed for the review of interim quarterly financial statements of the Company, and that such notification is to be made prior to the related press release. Also receive a written confirmation provided by the external auditors at the end of each of the first three quarters of the year that they have nothing to report to the Committee, if that is the case, or the written enumeration of required reporting issues. |
| | 12. | At the completion of the annual audit, review with management, internal audit and the external auditors the following: |
| | • | | The annual financial statements and related footnotes and financial information to be included in the Company’s annual report to shareholders. |
| | • | | Results of the audit of the financial statements and the related report thereon and, if applicable, a report on changes during the year in accounting principles and their application. |
| | • | | Significant changes to the audit plan, if any, and any serious disputes or difficulties with management encountered during the audit. Inquire about the cooperation received by the external auditors during their audit, including access to all requested records, data and information. |
| | • | | Inquire of the external auditors whether there have been any material disagreements with management, which, if not satisfactorily resolved, would have caused them to issue a non-standard report on the Company’s financial statements. |
| | 13. | Discuss with the external auditors, without management being present, (a) the quality of the Company’s financial and accounting personnel, and (b) the completeness and accuracy of the Company’s financial statements. Also, elicit the comments of management regarding the responsiveness of the external auditors to the Company’s needs. |
| | 14. | Meet with management, to discuss any relevant significant recommendations that the external auditors may have, particularly those characterized as ‘material’ or ‘serious’. Typically, such recommendations will be presented by the external auditors in the form of a Letter of Comments and Recommendations to the Committee. The Committee should review responses of management to the Letter of Comments and Recommendations from the external auditors and receive follow-up reports on action taken concerning the aforementioned recommendations. |
| | 15. | Have the sole authority to review in advance, and grant any appropriate pre-approvals, of all non-audit services to be provided by the independent auditors and, in connection therewith, to approve all fees and other terms of engagement. The Committee shall also review and approve disclosures required to be included in periodic reports filed with Canadian securities regulators and the Securities and Exchange Commission with respect to non-audit services performed by external auditors. |
Page 95
| | 16. | Be satisfied that adequate procedures are in place for the review of the Company’s disclosure of financial information extracted or derived from the Company’s financial statements, and periodically assess the adequacy of those procedures. |
| | 17. | Establish procedures for (a) the receipt, retention and treatment of complaints received by the Company regarding accounting, internal accounting controls or auditing matter, and (b) the confidential, anonymous submission by employees of the Company of concerns regarding questionable accounting or auditing matters. |
| | 18. | Review and approve the Company’s hiring policies regarding partners, employees and former partners and employees of the present and former external auditors. |
| | 19. | Review the appointment and replacement of the senior internal audit executive. |
| | 20. | Review with management, internal audit and the external auditors the methods used to establish and monitor the Company’s policies with respect to unethical or illegal activities by Company employees that may have a material impact on the financial statements. |
| | 21. | Generally as part of the review of the annual financial statements, receive a report(s), at least annually, from the Company’s general counsel concerning legal, regulatory and compliance matters that may have a material impact on the financial statements. |
| | 22. | Review, with reasonable frequency, the Company’s procedures relating to the disclosure of information with respect to the Company’s oil and gas reserves, including the Company’s procedures for complying with the disclosure requirements and restrictions of applicable regulations. |
| | 23. | Review with management the appointment of external qualified reserves evaluators or auditors, and in the case of any proposed change in such appointment, determine the reasons for the change and whether there have been disputes between the appointed external qualified reserves evaluators or auditors, and management. |
| | 24. | Review, with reasonable frequency, the Company’s procedures for providing information to the external qualified reserves evaluators or auditors who report on reserves and data for the purposes of compliance with applicable securities laws. |
| | 25. | Before the approval and the release of the Company’s reserves data and the report of the qualified reserve evaluators or auditors thereon, meet with management, the external qualified reserves evaluators or auditors and the internal qualified reserves evaluators to determine whether any restrictions affect their ability to report on reserves data without reservation and to review the reserves data and the report of the qualified reserves evaluators. |
| | 26. | Recommend to the Board for approval the content and filing of required statements and reports relating to the Company’s disclosure of reserve data as prescribed by applicable regulations. |
| | 27. | Review and approve (a) any change or waiver in the Company’s Code of Business Conduct for the chief executive officer and senior financial officers and (b) any public disclosure made regarding such change or waiver. |
Calgary, Alberta, Canada
February 16, 2006
Page 96
Schedule B
Husky Energy Inc.
Report on Reserves Data by Qualified Reserves Evaluator
To the Board of Directors of
Husky Energy Inc. (Husky):
| 1. | Our staff has evaluated Husky’s oil and gas reserves data as at December 31, 2009. The reserves data consist of the following: |
| | (a) | proved oil and gas reserve quantities estimated as at December 31, 2009 using constant prices and costs; and |
| | (b) | the related standardized measure of discounted future net cash flows. |
| 2. | The oil and gas reserves data are the responsibility of Husky’s management. As the Corporate Representatives our responsibility is to certify that the reserves data has been properly calculated in accordance with generally accepted procedures for the estimation of reserves data. |
| 3. | We carried out our evaluation in accordance with generally accepted procedures for the estimation of oil and gas reserves data and standards set out in the Canadian Oil and Gas Evaluation Handbook (the “COGEH”) with the necessary modifications to reflect definitions and standards under the applicable U.S. Financial Accounting Standards Board standards (the “FASB Standards” and the legal requirements of the U.S. Securities and Exchange Commission (“SEC Requirements”)). Our internal reserves evaluators are not independent of Husky, within the meaning of the term “independent” under those standards. |
| 4. | Those standards require that we plan and perform an evaluation to obtain reasonable assurance as to whether the oil and gas reserves data are free of material misstatement. An evaluation also includes assessing whether the reserves data are in accordance with principles and definitions presented in the COGEH as modified or replaced by the FASB Standards and SEC Requirements. |
| 5. | The following sets forth the estimated standardized measure of discounted future net cash flows (before deducting income taxes) attributed to proved oil and gas reserve quantities, estimated using constant prices and costs and calculated using a discount rate of 10%, included in the reserves data of Husky evaluated for the year ended December 31, 2009: |
| | |
Location of Reserves | | Discounted Future Net Cash Flows
before income taxes, 10% discount rate |
| | | ($ millions) |
Canada | | 9,108 |
China | | 395 |
Libya | | 1 |
| | |
| | 9,504 |
| | |
We have filed Husky’s oil and gas reserves disclosures in accordance with FASB Standards Statement of FASB Accounting Standards Codification 932, “Extractive activities – Oil and Gas” concurrently with this form.
| 6. | In our opinion, the oil and gas reserves data evaluated by us have, in all material respects, been determined in accordance with principles and definitions presented in the COGEH as modified or replaced by the FASB Standards and SEC Requirements. |
| 7. | We have no responsibility to update our evaluation for events and circumstances occurring after the date of this report. |
Page 97
| 8. | Oil and gas reserves are estimates only, and not exact quantities. Because the reserves data are based on judgments regarding future events, actual results will vary and the variations may be material. However, any variations should be consistent with the fact that reserves are categorized according to the probability of their recovery. |
Calgary, Alberta
January 25, 2010
|
/s/ FREDERICK AU-YEUNG |
| Frederick Au-Yeung, P. Eng |
| Manager of Reservoir Engineering |
Page 98
Schedule C
Husky Energy Inc.
Report of Management and Directors on Reserves Data and Other Information
Management of Husky Energy Inc. (“Husky”) are responsible for the preparation and disclosure of information with respect to Husky’s oil and gas activities in accordance with securities regulatory requirements. This information includes oil and gas reserves data, which consist of the following:
| | (1) | proved oil and gas reserve quantities estimated as at December 31, 2009 using constant prices and costs; and |
| | (2) | the related standardized measure of discounted future net cash flows. |
Husky’s oil and gas reserves evaluation process involves applying generally accepted procedures for the estimation of oil and gas reserves data for the purposes of complying with the legal requirements of the U.S. Securities and Exchange Commission (“SEC”) and the applicable provisions of the U.S. Financial Accounting Standards Board Statement (“FASB”) of FASB Accounting Standards Codification 932, “Extractive Activities – Oil and Gas” (collectively, the “Oil and Gas Reserves Data Process”). Husky’s Internal Qualified Reserves Evaluator is the Manager of Reservoir Engineering, who is an employee of Husky and has evaluated Husky’s oil and gas reserves data and certified that the Reserves Data Process has been followed. The Report on Reserves Data by Husky’s Internal Qualified Reserves Evaluator accompanies this report and will be filed with securities regulatory authorities concurrently with this report.
The Audit Committee of the Board of Directors has:
| | (a) | reviewed Husky’s procedures for providing information to the internal qualified reserves evaluators and the external reserves auditors; |
| | (b) | met with the Internal Qualified Reserves Evaluator and external reserves auditors to determine whether any restrictions placed by management affect the ability of the Internal Qualified Reserves Evaluator and the external reserves auditors to report without reservation; and |
| | (c) | reviewed the reserves data with management, the Internal Qualified Reserves Evaluator and the external reserves auditors. |
The Audit Committee of the Board of Directors has reviewed Husky’s procedures for assembling and reporting other information associated with oil and gas activities and has reviewed that information with management. The Board of Directors has approved, on the recommendation of the Audit Committee:
| | (a) | the content and filing with securities regulatory authorities of Form 51-101F1 containing reserves data and other oil and gas information; |
| | (b) | the filing of Form 51-101F2, which is the Report on Reserves Data of Husky’s Internal Qualified Reserves Evaluator; and |
| | (c) | the content and filing of this report. |
Husky sought and was granted by the Canadian Securities Administrators an exemption from the requirement under National Instrument 51-101 “Standards of Disclosure for Oil and Gas Disclosure” to involve independent qualified reserves evaluators or auditors. Notwithstanding this exemption, we involve independent qualified reserve auditors as part of Husky’s corporate governance practices. Their involvement helps assure that our internal oil and gas reserves estimates are materially correct.
In Husky’s view, the reliability of Husky’s internally generated oil and gas reserves data is not materially different than would be afforded by Husky involving independent qualified reserves evaluators or independent
Page 99
qualified reserves auditors to evaluate or audit and review the reserves data. Husky is therefore relying on an exemption, which it sought and was granted by securities regulatory authorities, from the requirement under securities legislation to involve independent qualified reserves evaluators or independent qualified reserves auditors.
The primary factors supporting the involvement of independent qualified reserves evaluators or independent qualified reserves auditors apply when (i) their knowledge of, and experience with, a reporting issuer’s reserves data are superior to that of the internal evaluators and (ii) the work of the independent qualified reserves evaluator or independent qualified reserves auditors is significantly less likely to be adversely influenced by self-interest or management of the reporting issuer than the work of internal reserves evaluation staff. In Husky’s view, neither of these factors applies in Husky’s circumstances.
Husky’s view is based in large part on the following. Our reserves data were developed in accordance with standards set out in the Canadian Oil and Gas Evaluation Handbook as modified or replaced by the applicable FASB standards and the legal requirements of the SEC. Husky’s procedures, records and controls relating to the accumulation of source data and preparation of reserves data by Husky’s internal reserves evaluation staff have been established, refined and documented over many years. Our internal reserves evaluation staff includes 127 individuals, including support staff, of whom 60 individuals are qualified reserves evaluators as defined in the Canadian Oil and Gas Evaluation Handbook, with an average of 11 years of relevant experience in evaluating reserves. Husky’s internal reserves evaluation management personnel includes 22 individuals with an average of 13 years of relevant experience in evaluating oil and gas and managing the evaluation process.
Reserves data are estimates only, and are not exact quantities. Because the reserves data are based on judgments regarding future events, actual results will vary and the variations may be material. However, any variations should be consistent with the fact that reserves are categorized according to the probability of their recovery.
| | |
/S/ JOHN C.S. LAU | | February 24, 2010 |
| John C. S. Lau | | |
| President & Chief Executive Officer | | |
| |
/S/ JAMES D. GIRGULIS | | February 24, 2010 |
| James D. Girgulis | | |
| Vice President, Legal & Corporate Secretary | | |
| |
/S/ R. DONALD FULLERTON | | February 24, 2010 |
| R. Donald Fullerton | | |
| Director | | |
| |
/S/ WILLIAM SHURNIAK | | February 24, 2010 |
| William Shurniak | | |
| Director | | |
Page 100
Schedule D
Husky Energy Inc.
Independent Engineer’s Audit Opinion
Husky Energy Inc.
707 — 8th Avenue S.W.
Calgary, Alberta
T2P 3G7
Gentlemen:
Pursuant to Husky’s request we have conducted an audit of the reserves estimates and the respective present worth value of these reserves of Husky Energy Inc., as at December 31, 2009. The Company’s detailed reserves information was provided to us for this audit. Our responsibility is to express an independent opinion on the reserves and respective present worth value estimates, in aggregate, based on our audit tests and procedures.
We conducted our audit in accordance with Canadian generally accepted standards as described in the Canadian Oil and Gas Evaluation Handbook (COGEH) and auditing standards generally accepted in the United States of America. Those standards require that we review and assess the policies, procedures, documentation and guidelines of the Company with respect to the estimation, review and approval of Husky’s reserves information. An audit includes examining, on a test basis, to confirm that there is adherence on the part of Husky’s internal reserve evaluators and other employees to the reserves management and administration policies and procedures established by the Company. An audit also includes conducting reserves evaluation on sufficient number of Company properties as considered necessary to express an opinion.
Based on the results of our audit, it is our opinion that Husky’s internally generated proved and probable reserves and net present values based on forecast and constant price assumptions are, in aggregate, reasonable and have been prepared in accordance with generally accepted oil and gas engineering and evaluation practices in the United States and as set out in the Canadian Oil and Gas Evaluation Handbook.
Sincerely,
McDaniel & Associates Consultants Ltd.
|
/S/ P.A. WELCH |
| P.A. Welch, P. Eng. |
| President & Managing Director |
Calgary, Alberta
January 19, 2010
Page 101
Document B
Form 40-F
Consolidated Financial Statements and
Auditor’s Report to Shareholders
For the Year Ended December 31, 2009
MANAGEMENT’S REPORT
The management of Husky Energy Inc. (“the Company”) is responsible for the financial information and operating data presented in this financial document.
The consolidated financial statements have been prepared by management in accordance with Canadian generally accepted accounting principles. When alternative accounting methods exist, management has chosen those it deems most appropriate in the circumstances. Financial statements are not precise as they include certain amounts based on estimates and judgments. Management has determined such amounts on a reasonable basis in order to ensure that the financial statements are presented fairly, in all material respects. Financial information presented elsewhere in this financial document has been prepared on a basis consistent with that in the consolidated financial statements.
Husky Energy Inc. maintains systems of internal accounting and administrative controls. These systems are designed to provide reasonable assurance that the financial information is relevant, reliable and accurate and that the Company’s assets are properly accounted for and adequately safeguarded. Management evaluation concluded that our internal control over financial reporting was effective as of December 31, 2009. The system of internal controls is further supported by an internal audit function.
The Audit Committee of the Board of Directors, composed of independent non-management directors, meets regularly with management, as well as the external auditors, to discuss auditing (external, internal and joint venture), internal controls, accounting policy, financial reporting matters and reserves determination process. The Committee reviews the annual consolidated financial statements with both management and the independent auditors and reports its findings to the Board of Directors before such statements are approved by the Board. The Committee is also responsible for the appointment of the external auditors for the Company.
The consolidated financial statements have been audited by KPMG LLP, the independent auditors, in accordance with Canadian generally accepted auditing standards on behalf of the shareholders. KPMG LLP has full and free access to the Audit Committee.
|
 |
| John C.S. Lau |
| President & Chief Executive Officer |
|
 |
| Alister Cowan |
| Vice President & Chief Financial Officer |
Calgary, Alberta, Canada
February 3, 2010
PAGE 2
AUDITORS’ REPORT TO THE SHAREHOLDERS
We have audited the consolidated balance sheets of Husky Energy Inc. (“the Company”) as at December 31, 2009, 2008 and 2007 and the consolidated statements of earnings and comprehensive income, changes in shareholders’ equity and cash flows for each of the years in the three-year period ended December 31, 2009. These financial statements are the responsibility of the Company’s management. Our responsibility is to express an opinion on these financial statements based on our audits.
We conducted our audits in accordance with Canadian generally accepted auditing standards and the standards of the Public Company Accounting Oversight Board (United States). Those standards require that we plan and perform an audit to obtain reasonable assurance whether the financial statements are free of material misstatement. An audit includes examining, on a test basis, evidence supporting the amounts and disclosures in the financial statements. An audit also includes assessing the accounting principles used and significant estimates made by management, as well as evaluating the overall financial statement presentation.
In our opinion, these consolidated financial statements present fairly, in all material respects, the financial position of the Company as at December 31, 2009, 2008 and 2007 and the results of its operations and its cash flows for each of the years in the three-year period ended December 31, 2009 in accordance with Canadian generally accepted accounting principles.
We also have audited, in accordance with the standards of the Public Company Accounting Oversight Board (United States), the Company’s internal control over financial reporting as of December 31, 2009, based on the criteria established in Internal Control — Integrated Framework issued by the Committee of Sponsoring Organizations of the Treadway Commission (COSO), and our report dated February 3, 2010 expressed an unqualified opinion on the effectiveness of the Company’s internal control over financial reporting.
|
 |
KPMG LLP |
Chartered Accountants |
Calgary, Alberta, Canada |
February 3, 2010 |
Comments by auditors for US readers on Canada — US Reporting Differences
To the Board of Directors of Husky Energy Inc. (the “Company”)
In the United States, reporting standards for auditors require the addition of an explanatory paragraph (following the opinion paragraph) when there is a change in accounting principles that has a material effect on the comparability of the Company’s financial statements, such as the change described in Note 4 (Goodwill and Intangible Assets) to the consolidated financial statements as at December 31, 2009, and for the year then ended. Our report to the shareholders dated February 3, 2010 is expressed in accordance with Canadian reporting standards, which do not require a reference to such a change in accounting principles in the auditors’ report when the change is properly accounted for and adequately disclosed in the financial statements.
|
/s/ KPMG LLP |
KPMG LLP |
Chartered Accountants |
Calgary, Canada |
February 3, 2010 |
PAGE 3
REPORT OF INDEPENDENT REGISTERED PUBLIC ACCOUNTING FIRM
To the Shareholders and Board of Directors of Husky Energy Inc.
We have audited Husky Energy Inc. (“the Company”)’s internal control over financial reporting as of December 31, 2009, based on the criteria established in Internal Control-Integrated Framework issued by the Committee of Sponsoring Organizations of the Treadway Commission (COSO). The Company’s management is responsible for maintaining effective internal control over financial reporting and for its assessment of the effectiveness of internal control over financial reporting. Our responsibility is to express an opinion on the Company’s internal control over financial reporting based on our audit.
We conducted our audit in accordance with the standards of the Public Company Accounting Oversight Board (United States). Those standards require that we plan and perform the audit to obtain reasonable assurance about whether effective internal control over financial reporting was maintained in all material respects. Our audit included obtaining an understanding of internal control over financial reporting, assessing the risk that a material weakness exists and testing and evaluating the design and operating effectiveness of internal control based on the assessed risk. Our audit also included performing such other procedures as we considered necessary in the circumstances. We believe that our audit provides a reasonable basis for our opinion.
A company’s internal control over financial reporting is a process designed to provide reasonable assurance regarding the reliability of financial reporting and the preparation of financial statements for external purposes in accordance with generally accepted accounting principles. A company’s internal control over financial reporting includes those policies and procedures that (1) pertain to the maintenance of records that, in reasonable detail, accurately and fairly reflect the transactions and dispositions of the assets of the company; (2) provide reasonable assurance that transactions are recorded as necessary to permit preparation of financial statements in accordance with generally accepted accounting principles, and that receipts and expenditures of the company are being made only in accordance with authorizations of management and directors of the company; and (3) provide reasonable assurance regarding prevention or timely detection of unauthorized acquisition, use, or disposition of the company’s assets that could have a material effect on the financial statements.
Because of its inherent limitations, internal control over financial reporting may not prevent or detect misstatements. Also, projections of any evaluation of effectiveness to future periods are subject to the risk that controls may become inadequate because of changes in conditions, or that the degree of compliance with the policies or procedures may deteriorate.
In our opinion, the Company maintained, in all material respects, effective internal control over financial reporting as of December 31, 2009, based on the criteria established in Internal Control-Integrated Framework issued by the Committee of Sponsoring Organizations of the Treadway Commission (COSO).
We also have conducted our audits on the consolidated financial statements in accordance with Canadian generally accepted auditing standards and the standards of the Public Company Accounting Oversight Board (United States). Our report dated February 3, 2010 expressed an unqualified opinion on those consolidated financial statements.
|
 |
KPMG LLP |
Chartered Accountants |
Calgary, Alberta, Canada |
February 3, 2010 |
PAGE 4
CONSOLIDATED FINANCIAL STATEMENTS
Consolidated Balance Sheets
| | | | | | | | | | | |
| As at December 31 (millions of dollars) | | 2009 | | | 2008 | | 2007 | |
Assets | | | | | | | | | | | |
Current assets | | | | | | | | | | | |
Cash and cash equivalents | | $ | 392 | | | $ | 913 | | $ | 208 | |
Accounts receivable(notes 7, 23) | | | 987 | | | | 1,344 | | | 1,622 | |
Inventories(note 8) | | | 1,520 | | | | 1,032 | | | 1,190 | |
Prepaid expenses | | | 12 | | | | 11 | | | 14 | |
| | | | | | | | | | | |
| | | 2,911 | | | | 3,300 | | | 3,034 | |
Property, plant and equipment, net(notes 1, 9) | | | 21,254 | | | | 20,839 | | | 17,805 | |
Goodwill(notes 1, 13) | | | 689 | | | | 779 | | | 660 | |
Contribution receivable(notes 11, 23) | | | 1,313 | | | | 1,448 | | | — | |
Other assets | | | 128 | | | | 120 | | | 167 | |
| | | | | | | | | | | |
| | $ | 26,295 | | | $ | 26,486 | | $ | 21,666 | |
| | | | | | | | | | | |
Liabilities and Shareholders’ Equity | | | | | | | | | | | |
Current liabilities | | | | | | | | | | | |
Accounts payable and accrued liabilities(notes 15, 23) | | $ | 2,185 | | | $ | 2,896 | | $ | 2,358 | |
Long-term debt due within one year(notes 16, 23) | | | — | | | | — | | | 741 | |
| | | | | | | | | | | |
| | | 2,185 | | | | 2,896 | | | 3,099 | |
Long-term debt(notes 16, 23) | | | 3,229 | | | | 1,957 | | | 2,073 | |
Contribution payable(notes 11, 23) | | | 1,500 | | | | 1,659 | | | — | |
Other long-term liabilities(note 17) | | | 1,036 | | | | 898 | | | 918 | |
Future income taxes(note 18) | | | 3,932 | | | | 4,713 | | | 3,948 | |
Commitments and contingencies(note 19) | | | | | | | | | | | |
Shareholders’ equity | | | | | | | | | | | |
Common shares(note 20) | | | 3,585 | | | | 3,568 | | | 3,551 | |
Retained earnings | | | 10,832 | | | | 10,436 | | | 8,154 | |
Accumulated other comprehensive income | | | (4 | ) | | | 359 | | | (77 | ) |
| | | | | | | | | | | |
| | | 14,413 | | | | 14,363 | | | 11,628 | |
| | | | | | | | | | | |
| | $ | 26,295 | | | $ | 26,486 | | $ | 21,666 | |
| | | | | | | | | | | |
The accompanying notes to the consolidated financial statements are an integral part of these statements. 2008 and 2007 amounts as restated for the adoption of a new accounting policy. Refer to Note 4.
On behalf of the Board:
| | | | |
 | | | |  |
| John C. S. Lau | | | | R.D. Fullerton |
| Director | | | | Director |
PAGE 5
Consolidated Statements of Earnings and Comprehensive Income
| | | | | | | | | | | | |
| Year ended December 31 (millions of dollars, except per share amounts) | | 2009 | | | 2008 | | | 2007 | |
Sales and operating revenues, net of royalties | | $ | 15,074 | | | $ | 24,701 | | | $ | 15,518 | |
Costs and expenses | | | | | | | | | | | | |
Cost of sales and operating expenses(note 17) | | | 10,865 | | | | 17,706 | | | | 9,314 | |
Selling and administration expenses | | | 265 | | | | 284 | | | | 219 | |
Stock-based compensation(note 20) | | | 1 | | | | (33 | ) | | | 88 | |
Depletion, depreciation and amortization(notes 1, 9) | | | 1,805 | | | | 1,832 | | | | 1,806 | |
Interest — net(note 16) | | | 194 | | | | 147 | | | | 130 | |
Foreign exchange(note 16) | | | (5 | ) | | | (335 | ) | | | (51 | ) |
Other — net(note 23) | | | (8 | ) | | | (45 | ) | | | (97 | ) |
| | | | | | | | | | | | |
| | | 13,117 | | | | 19,556 | | | | 11,409 | |
| | | | | | | | | | | | |
Earnings before income taxes | | | 1,957 | | | | 5,145 | | | | 4,109 | |
| | | | | | | | | | | | |
Income taxes (recoveries)(note 18) | | | | | | | | | | | | |
Current | | | 1,262 | | | | 901 | | | | 347 | |
Future | | | (721 | ) | | | 493 | | | | 561 | |
| | | | | | | | | | | | |
| | | 541 | | | | 1,394 | | | | 908 | |
| | | | | | | | | | | | |
Net earnings | | | 1,416 | | | | 3,751 | | | | 3,201 | |
Other comprehensive income | | | | | | | | | | | | |
Cumulative foreign currency translation adjustment | | | (469 | ) | | | 607 | | | | (175 | ) |
Hedge of net investment, net of tax(note 23) | | | 104 | | | | (165 | ) | | | 102 | |
Derivatives designated as cash flow hedges, net of tax(note 23) | | | 2 | | | | (6 | ) | | | 14 | |
| | | | | | | | | | | | |
| | | (363 | ) | | | 436 | | | | (59 | ) |
| | | | | | | | | | | | |
Comprehensive income | | $ | 1,053 | | | $ | 4,187 | | | $ | 3,142 | |
| | | | | | | | | | | | |
Earnings per share | | | | | | | | | | | | |
Basic and diluted | | $ | 1.67 | | | $ | 4.42 | | | $ | 3.77 | |
Weighted average number of common shares outstanding(millions) | | | | | | | | | | | | |
Basic and diluted | | | 849.7 | | | | 849.2 | | | | 848.8 | |
| | | | | | | | | | | | |
The accompanying notes to the consolidated financial statements are an integral part of these statements. 2008 and 2007 amounts as restated for the adoption of a new accounting policy. Refer to Note 4.
PAGE 6
Consolidated Statements of Changes in Shareholders’ Equity
| | | | | | | | | | | | |
| Year ended December 31 (millions of dollars) | | 2009 | | | 2008 | | | 2007 | |
Common shares | | | | | | | | | | | | |
Beginning of year | | $ | 3,568 | | | $ | 3,551 | | | $ | 3,533 | |
Options exercised | | | 17 | | | | 17 | | | | 18 | |
| | | | | | | | | | | | |
End of year | | | 3,585 | | | | 3,568 | | | | 3,551 | |
| | | | | | | | | | | | |
Retained earnings | | | | | | | | | | | | |
Beginning of year | | | 10,436 | | | | 8,154 | | | | 6,087 | |
Net earnings | | | 1,416 | | | | 3,751 | | | | 3,201 | |
Dividends on common shares(note 20) | | | | | | | | | | | | |
Ordinary | | | (1,020 | ) | | | (1,469 | ) | | | (917 | ) |
Special | | | — | | | | — | | | | (212 | ) |
Adoption of financial instruments | | | — | | | | — | | | | 4 | |
Adoption of intangible assets(note 4) | | | — | | | | — | | | | (9 | ) |
| | | | | | | | | | | | |
End of year | | | 10,832 | | | | 10,436 | | | | 8,154 | |
| | | | | | | | | | | | |
Accumulated other comprehensive income | | | | | | | | | | | | |
Beginning of year | | | 359 | | | | (77 | ) | | | — | |
Adoption of financial instruments | | | — | | | | — | | | | (18 | ) |
Other comprehensive income | | | | | | | | | | | | |
Cumulative foreign currency translation adjustment | | | (469 | ) | | | 607 | | | | (175 | ) |
Hedge of net investment, net of tax(note 23) | | | 104 | | | | (165 | ) | | | 102 | |
Derivatives designated as cash flow hedges, net of tax(note 23) | | | 2 | | | | (6 | ) | | | 14 | |
| | | | | | | | | | | | |
| | | (363 | ) | | | 436 | | | | (59 | ) |
| | | | | | | | | | | | |
End of year | | | (4 | ) | | | 359 | | | | (77 | ) |
| | | | | | | | | | | | |
Shareholders’ equity | | $ | 14,413 | | | $ | 14,363 | | | $ | 11,628 | |
| | | | | | | | | | | | |
The accompanying notes to the consolidated financial statements are an integral part of these statements. 2008 and 2007 amounts as restated for the adoption of a new accounting policy. Refer to Note 4.
PAGE 7
Consolidated Statements of Cash Flows
| | | | | | | | | | | | |
| Year ended December 31 (millions of dollars) | | 2009 | | | 2008 | | | 2007 | |
Operating activities | | | | | | | | | | | | |
Net earnings | | $ | 1,416 | | | $ | 3,751 | | | $ | 3,201 | |
Items not affecting cash | | | | | | | | | | | | |
Accretion(note 17) | | | 48 | | | | 54 | | | | 47 | |
Depletion, depreciation and amortization | | | 1,805 | | | | 1,832 | | | | 1,806 | |
Future income taxes (recoveries) | | | (721 | ) | | | 493 | | | | 561 | |
Foreign exchange | | | (48 | ) | | | (94 | ) | | | (135 | ) |
Other | | | 7 | | | | (90 | ) | | | (92 | ) |
Settlement of asset retirement obligations(note 17) | | | (41 | ) | | | (56 | ) | | | (51 | ) |
Change in non-cash working capital(note 12) | | | (548 | ) | | | 888 | | | | (718 | ) |
| | | | | | | | | | | | |
Cash flow — operating activities | | | 1,918 | | | | 6,778 | | | | 4,619 | |
| | | | | | | | | | | | |
Financing activities | | | | | | | | | | | | |
Long-term debt issue | | | 3,604 | | | | 949 | | | | 7,222 | |
Long-term debt repayment | | | (1,866 | ) | | | (2,205 | ) | | | (5,722 | ) |
Debt issue costs | | | (14 | ) | | | — | | | | (8 | ) |
Proceeds from exercise of stock options | | | 6 | | | | 5 | | | | 5 | |
Proceeds from monetization of financial instruments | | | 41 | | | | 12 | | | | — | |
Dividends on common shares | | | (1,020 | ) | | | (1,469 | ) | | | (1,129 | ) |
Other | | | 10 | | | | 3 | | | | — | |
Change in non-cash working capital(note 12) | | | (167 | ) | | | 146 | | | | 65 | |
| | | | | | | | | | | | |
Cash flow — financing activities | | | 594 | | | | (2,559 | ) | | | 433 | |
| | | | | | | | | | | | |
Available for investing | | | 2,512 | | | | 4,219 | | | | 5,052 | |
| | | | | | | | | | | | |
Investing activities | | | | | | | | | | | | |
Expenditures on property, plant and equipment | | | (2,762 | ) | | | (4,060 | ) | | | (2,931 | ) |
Corporate acquisition(note 10) | | | — | | | | — | | | | (2,589 | ) |
Joint venture arrangement(note 11) | | | — | | | | 127 | | | | — | |
Asset sales | | | 28 | | | | 37 | | | | 333 | |
Other | | | (10 | ) | | | 11 | | | | (6 | ) |
Change in non-cash working capital(note 12) | | | (289 | ) | | | 371 | | | | (93 | ) |
| | | | | | | | | | | | |
Cash flow — investing activities | | | (3,033 | ) | | | (3,514 | ) | | | (5,286 | ) |
| | | | | | | | | | | | |
Increase (decrease) in cash and cash equivalents | | | (521 | ) | | | 705 | | | | (234 | ) |
Cash and cash equivalents at beginning of year | | | 913 | | | | 208 | | | | 442 | |
| | | | | | | | | | | | |
Cash and cash equivalents at end of year | | $ | 392 | | | $ | 913 | | | $ | 208 | |
| | | | | | | | | | | | |
The accompanying notes to the consolidated financial statements are an integral part of these statements. 2008 and 2007 amounts as restated for the adoption of a new accounting policy. Refer to Note 4.
PAGE 8
NOTES TO THE CONSOLIDATED FINANCIAL STATEMENTS
Except where indicated and per share amounts, all dollar amounts are in millions.
NOTE 1 SEGMENTED FINANCIAL INFORMATION
| | | | | | | | | | | | | | | | | | | | | | | | | | | | | | | |
| | | Upstream | | Midstream |
| | | | | Upgrading | | Infrastructure and Marketing |
| Year ended December 31(3) | | 2009 | | | 2008 | | 2007 | | 2009 | | | 2008 | | 2007 | | 2009 | | | 2008 | | | 2007 |
Sales and operating revenues, net of royalties | | $ | 4,452 | | | $ | 7,889 | | $ | 6,222 | | $ | 1,572 | | | $ | 2,435 | | $ | 1,524 | | $ | 6,984 | | | $ | 13,544 | | | $ | 10,217 |
Costs and expenses | | | | | | | | | | | | | | | | | | | | | | | | | | | | | | | |
Operating, cost of sales, selling and general | | | 1,495 | | | | 1,627 | | | 1,308 | | | 1,461 | | | | 2,053 | | | 1,146 | | | 6,669 | | | | 13,192 | | | | 9,838 |
Depletion, depreciation and amortization | | | 1,397 | | | | 1,505 | | | 1,615 | | | 34 | | | | 31 | | | 25 | | | 36 | | | | 31 | | | | 28 |
Interest — net | | | — | | | | — | | | — | | | — | | | | — | | | — | | | — | | | | — | | | | — |
Foreign exchange | | | — | | | | — | | | — | | | — | | | | — | | | — | | | — | | | | — | | | | — |
| | | | | | | | | | | | | | | | | | | | | | | | | | | | | | | |
| | | 2,892 | | | | 3,132 | | | 2,923 | | | 1,495 | | | | 2,084 | | | 1,171 | | | 6,705 | | | | 13,223 | | | | 9,866 |
| | | | | | | | | | | | | | | | | | | | | | | | | | | | | | | |
Earnings (loss) before income taxes | | | 1,560 | | | | 4,757 | | | 3,299 | | | 77 | | | | 351 | | | 353 | | | 279 | | | | 321 | | | | 351 |
Current income taxes | | | 909 | | | | 585 | | | 122 | | | 111 | | | | 84 | | | 10 | | | 101 | | | | 126 | | | | 68 |
Future income taxes | | | (462 | ) | | | 795 | | | 581 | | | (88 | ) | | | 21 | | | 75 | | | (22 | ) | | | (29 | ) | | | 30 |
| | | | | | | | | | | | | | | | | | | | | | | | | | | | | | | |
Net earnings (loss) | | $ | 1,113 | | | $ | 3,377 | | $ | 2,596 | | $ | 54 | | | $ | 246 | | $ | 268 | | $ | 200 | | | $ | 224 | | | $ | 253 |
| | | | | | | | | | | | | | | | | | | | | | | | | | | | | | | |
Property, plant and equipment — As at December 31 | | | | | | | | | | | | | | | | | | | | | | | | | | | | | | | |
Cost | | $ | 27,478 | | | $ | 25,283 | | $ | 23,611 | | $ | 1,774 | | | $ | 1,704 | | $ | 1,607 | | $ | 956 | | | $ | 931 | | | $ | 842 |
Accumulated depletion, depreciation and amortization | | | 12,688 | | | | 11,432 | | | 9,956 | | | 544 | | | | 510 | | | 480 | | | 365 | | | | 330 | | | | 298 |
| | | | | | | | | | | | | | | | | | | | | | | | | | | | | | | |
Net | | $ | 14,790 | | | $ | 13,851 | | $ | 13,655 | | $ | 1,230 | | | $ | 1,194 | | $ | 1,127 | | $ | 591 | | | $ | 601 | | | $ | 544 |
| | | | | | | | | | | | | | | | | | | | | | | | | | | | | | | |
Expenditures on property, plant and equipment — Year ended December 31(2) | | $ | 2,326 | | | $ | 3,580 | | $ | 2,388 | | $ | 69 | | | $ | 99 | | $ | 217 | | $ | 25 | | | $ | 94 | | | $ | 92 |
Goodwill additions — Year ended December 31 | | $ | — | | | $ | — | | $ | — | | $ | — | | | $ | — | | $ | — | | $ | — | | | $ | — | | | $ | — |
Total assets — As at December 31 | | $ | 16,338 | | | $ | 15,653 | | $ | 14,395 | | $ | 1,427 | | | $ | 1,322 | | $ | 1,377 | | $ | 1,712 | | | $ | 1,486 | | | $ | 1,134 |
| | | | | | | | | | | | | | | | | | | | | | | | | | | | | | | |
PAGE 9
| | | | | | | | | | | | | | | | | | | | | | | | | | | | | | | | | | | | | | | | | | | |
| | | Downstream | | Corporate and
Eliminations(1) | | | Total | |
| | | Canadian Refined
Products | | U.S. Refining and
Marketing | | | | | | | | | | | | | | | | | | |
Year ended December 31(3) | | 2009 | | 2008 | | 2007 | | 2009 | | 2008 | | | 2007 | | 2009 | | | 2008 | | | 2007 | | | 2009 | | | 2008 | | | 2007 | |
Sales and operating revenues, net of royalties | | $ | 2,495 | | $ | 3,564 | | $ | 2,916 | | $ | 5,349 | | $ | 7,802 | | | $ | 2,383 | | $ | (5,778 | ) | | $ | (10,533 | ) | | $ | (7,744 | ) | | $ | 15,074 | | | $ | 24,701 | | | $ | 15,518 | |
Costs and expenses | | | | | | | | | | | | | | | | | | | | | | | | | | | | | | | | | | | | | | | | | | | |
Operating, cost of sales, selling and general | | | 2,204 | | | 3,340 | | | 2,607 | | | 4,957 | | | 8,280 | | | | 2,167 | | | (5,663 | ) | | | (10,580 | ) | | | (7,542 | ) | | | 11,123 | | | | 17,912 | | | | 9,524 | |
Depletion, depreciation and amortization | | | 93 | | | 81 | | | 66 | | | 194 | | | 154 | | | | 47 | | | 51 | | | | 30 | | | | 25 | | | | 1,805 | | | | 1,832 | | | | 1,806 | |
Interest — net | | | — | | | — | | | — | | | 3 | | | 3 | | | | 1 | | | 191 | | | | 144 | | | | 129 | | | | 194 | | | | 147 | | | | 130 | |
Foreign exchange | | | — | | | — | | | — | | | — | | | — | | | | — | | | (5 | ) | | | (335 | ) | | | (51 | ) | | | (5 | ) | | | (335 | ) | | | (51 | ) |
| | | | | | | | | | | | | | | | | | | | | | | | | | | | | | | | | | | | | | | | | | | |
| | | 2,297 | | | 3,421 | | | 2,673 | | | 5,154 | | | 8,437 | | | | 2,215 | | | (5,426 | ) | | | (10,741 | ) | | | (7,439 | ) | | | 13,117 | | | | 19,556 | | | | 11,409 | |
| | | | | | | | | | | | | | | | | | | | | | | | | | | | | | | | | | | | | | | | | | | |
Earnings (loss) before income taxes | | | 198 | | | 143 | | | 243 | | | 195 | | | (635 | ) | | | 168 | | | (352 | ) | | | 208 | | | | (305 | ) | | | 1,957 | | | | 5,145 | | | | 4,109 | |
Current income taxes | | | 38 | | | 28 | | | 17 | | | 3 | | | (24 | ) | | | 28 | | | 100 | | | | 102 | | | | 102 | | | | 1,262 | | | | 901 | | | | 347 | |
Future income taxes | | | 19 | | | 11 | | | 33 | | | 68 | | | (208 | ) | | | 35 | | | (236 | ) | | | (97 | ) | | | (193 | ) | | | (721 | ) | | | 493 | | | | 561 | |
| | | | | | | | | | | | | | | | | | | | | | | | | | | | | | | | | | | | | | | | | | | |
Net earnings (loss) | | $ | 141 | | $ | 104 | | $ | 193 | | $ | 124 | | $ | (403 | ) | | $ | 105 | | $ | (216 | ) | | $ | 203 | | | $ | (214 | ) | | $ | 1,416 | | | $ | 3,751 | | | $ | 3,201 | |
| | | | | | | | | | | | | | | | | | | | | | | | | | | | | | | | | | | | | | | | | | | |
Property, plant and equipment — As at December 31 | | | | | | | | | | | | | | | | | | | | | | | | | | | | | | | | | | | | | | | | | | | |
Cost | | $ | 1,767 | | $ | 1,691 | | $ | 1,550 | | $ | 3,875 | | $ | 4,249 | | | $ | 1,459 | | $ | 439 | | | $ | 406 | | | $ | 338 | | | $ | 36,289 | | | $ | 34,264 | | | $ | 29,407 | |
Accumulated depletion, depreciation and amortization | | | 755 | | | 669 | | | 590 | | | 377 | | | 229 | | | | 46 | | | 306 | | | | 255 | | | | 232 | | | | 15,035 | | | | 13,425 | | | | 11,602 | |
| | | | | | | | | | | | | | | | | | | | | | | | | | | | | | | | | | | | | | | | | | | |
Net | | $ | 1,012 | | $ | 1,022 | | $ | 960 | | $ | 3,498 | | $ | 4,020 | | | $ | 1,413 | | $ | 133 | | | $ | 151 | | | $ | 106 | | | $ | 21,254 | | | $ | 20,839 | | | $ | 17,805 | |
| | | | | | | | | | | | | | | | | | | | | | | | | | | | | | | | | | | | | | | | | | | |
Expenditures on property, plant and equipment — Year ended December 31(2) | | $ | 81 | | $ | 155 | | $ | 212 | | $ | 260 | | $ | 133 | | | $ | 21 | | $ | 36 | | | $ | 47 | | | $ | 44 | | | $ | 2,797 | | | $ | 4,108 | | | $ | 2,974 | |
Goodwill additions — Year ended December 31 | | $ | — | | $ | — | | $ | — | | $ | — | | $ | — | | | $ | 536 | | $ | — | | | $ | — | | | $ | — | | | $ | — | | | $ | — | | | $ | 536 | |
Total assets — As at December 31 | | $ | 1,430 | | $ | 1,375 | | $ | 1,332 | | $ | 4,771 | | $ | 5,380 | | | $ | 3,058 | | $ | 617 | | | $ | 1,270 | | | $ | 370 | | | $ | 26,295 | | | $ | 26,486 | | | $ | 21,666 | |
| | | | | | | | | | | | | | | | | | | | | | | | | | | | | | | | | | | | | | | | | | | |
| (1) | Eliminations relate to sales and operating revenues between segments recorded at transfer prices based on current market prices, and to unrealized intersegment profits in inventories. |
| (2) | Excludes capitalized costs related to asset retirement obligations incurred during the period and corporate acquisitions (notes 10 and 11). |
| (3) | 2008 and 2007 amounts as restated for the adoption of a new accounting policy. Refer to Note 4. |
PAGE 10
Geographical Financial Information
| | | | | | | | | | | | | | | | | | |
| | | Canada | | United States |
| | | 2009 | | 2008 | | 2007 | | 2009 | | 2008 | | 2007 |
Year ended December 31 | | | | | | | | | | | | | | | | | | |
Sales and operating revenues, net of royalties | | $ | 8,856 | | $ | 15,213 | | $ | 11,736 | | $ | 5,981 | | $ | 9,172 | | $ | 3,494 |
Expenditures on property, plant and equipment (1) | | | 1,974 | | | 3,685 | | | 2,877 | | | 285 | | | 193 | | | 21 |
As at December 31 | | | | | | | | | | | | | | | | | | |
Property, plant and equipment, net | | $ | 16,624 | | $ | 16,234 | | $ | 16,017 | | $ | 3,587 | | $ | 4,093 | | $ | 1,417 |
Goodwill(2) | | | 160 | | | 160 | | | 160 | | | 529 | | | 619 | | | 500 |
Total assets | | | 20,239 | | | 20,208 | | | 17,952 | | | 5,363 | | | 5,744 | | | 3,240 |
| | | | | | | | | | | | | | | | | | |
| | | | | | | | | | | | | | | | | | |
| | | Other International | | Total |
| | | 2009 | | 2008 | | 2007 | | 2009 | | 2008 | | 2007 |
Year ended December 31 | | | | | | | | | | | | | | | | | | |
Sales and operating revenues, net of royalties | | $ | 237 | | $ | 316 | | $ | 288 | | $ | 15,074 | | $ | 24,701 | | $ | 15,518 |
Expenditures on property, plant and equipment (1) | | | 538 | | | 230 | | | 76 | | | 2,797 | | | 4,108 | | | 2,974 |
As at December 31 | | | | | | | | | | | | | | | | | | |
Property, plant and equipment, net | | $ | 1,043 | | $ | 512 | | $ | 371 | | $ | 21,254 | | $ | 20,839 | | $ | 17,805 |
Goodwill(2) | | | — | | | — | | | — | | | 689 | | | 779 | | | 660 |
Total assets | | | 693 | | | 534 | | | 474 | | | 26,295 | | | 26,486 | | | 21,666 |
| | | | | | | | | | | | | | | | | | |
| (1) | Excludes capitalized costs related to asset retirement obligations incurred during the period and corporate acquisitions (notes 10 and 11). |
| (2) | Goodwill relates to Western Canada in the upstream segment and the Lima Refinery in the downstream segment — U.S. Refining and Marketing. |
PAGE 11
NOTE 2 NATURE OF OPERATIONS AND ORGANIZATION
Husky Energy Inc. (“Husky” or “the Company”) is a publicly traded, integrated energy and energy-related company headquartered in Calgary, Alberta, Canada.
Management has segmented the Company’s business based on differences in products and services and management responsibility. The Company’s business is conducted predominantly through three major business segments — upstream, midstream and downstream.
Upstream includes exploration for, development and production of crude oil, natural gas and natural gas liquids. The Company’s upstream operations are located primarily in Western Canada, offshore Eastern Canada, offshore Greenland, United States, offshore China and offshore Indonesia.
Midstream includes upgrading of heavy crude oil feedstock into synthetic crude oil (upgrading); marketing of the Company’s and other producers’ crude oil, natural gas, natural gas liquids, sulphur and petroleum coke; pipeline transportation and processing of heavy crude oil, storage of crude oil, diluent and natural gas and cogeneration of electrical and thermal energy (infrastructure and marketing).
Downstream includes refining in Canada of crude oil and marketing of refined petroleum products including gasoline, diesel, ethanol blended fuels, asphalt and ancillary products, and production of ethanol (Canadian refined products) and refining in the U.S. of primarily crude oil to produce and market gasoline, jet fuel and diesel fuels that meet U.S. clean fuels standards (U.S. refining and marketing).
NOTE 3 SIGNIFICANT ACCOUNTING POLICIES
a) Principles of Consolidation and the Preparation of Financial Statements
The consolidated financial statements of the Company have been prepared in accordance with Canadian generally accepted accounting principles (“GAAP”).
The consolidated financial statements include the accounts of Husky Energy Inc. and its subsidiaries after the elimination of intercompany balances and transactions. The Company consolidates all investments in which it has either direct or indirect voting ownership in excess of 50%. In addition, the Company consolidates variable interest entities when it is deemed to be the primary beneficiary, and proportionately consolidates joint venture entities.
Substantially all of the Company’s upstream activities are conducted jointly with third parties and accordingly the accounts reflect the Company’s proportionate share of the assets, liabilities, revenues, expenses and cash flow from these activities.
b) Use of Estimates
The preparation of financial statements in conformity with Canadian GAAP requires management to make estimates and assumptions that affect the reported amounts of assets and liabilities and disclosures of contingencies, if any, as at the date of the financial statements and the reported amounts of revenues and expenses during the period. Specifically, amounts recorded for depletion, depreciation, amortization of accretion expense, asset retirement obligations, fair value measurements, management contracts, employee future benefits and amounts used in impairment tests for intangible assets, goodwill, inventory and property, plant and equipment are based on estimates. These estimates include petroleum and natural gas reserves, future petroleum and natural gas prices, future interest rates and future costs required to develop those reserves as well as other fair value assumptions. By their nature, these estimates are subject to measurement uncertainty and changes in such estimates in future years could require a material change on the financial statements.
PAGE 12
c) Cash and Cash Equivalents
Cash and cash equivalents consist of cash on hand less outstanding cheques and deposits with a maturity of less than three months at the time of purchase. When outstanding cheques are in excess of cash on hand, the excess is reported in bank operating loans.
d) Inventories
Crude oil, natural gas, refined petroleum products and purchased sulphur inventories, other than commodity inventory held for trading, are valued at the lower of cost or net realizable value. Cost is determined using average cost or on a first-in, first-out basis, as appropriate. Materials, parts and supplies are valued at the lower of average cost or net realizable value. Cost consists of raw material, labour, direct overhead and transportation. Commodity inventory held for trading purposes are carried at fair value less cost to sell. Any changes in fair value are included as gains or losses in other expenses during the period of change. Previous impairment write-downs are reversed when there is a change in the situation that caused the impairment. Unrealized intersegment profits in inventories are eliminated.
e) Precious Metals
The Company uses precious metals in conjunction with catalyst as part of the downstream U.S. refining process. These precious metals remain intact; however, there is a loss during the reclamation process. The estimated loss is amortized to operating expenses over the period that the precious metal is in use, which is approximately two to five years. After the reclamation process, the actual loss is compared to the estimated loss and any difference is recognized in earnings.
f) Property, Plant and Equipment
i) Oil and Gas
The Company employs the full cost method of accounting for oil and gas interests whereby all costs of acquisition, exploration for and development of oil and gas reserves are capitalized and accumulated within cost centres on a country-by-country basis. Such costs include land acquisition, geological and geophysical activity, drilling of productive and non-productive wells, carrying costs directly related to unproved properties and administrative costs directly related to exploration and development activities.
Depletion of oil and gas properties and depreciation of associated production facilities are calculated using the unit of production method, based on gross proved oil and gas reserves as estimated by the Company’s engineers, for each cost centre. Depreciation of gas plants and certain other oil and gas facilities is provided using the straight-line method based on their estimated useful lives. Costs subject to depletion and depreciation include both the estimated costs required to develop proved undeveloped reserves and the associated addition to the asset retirement obligations. In the normal course of operations, retirements of oil and gas interests are accounted for by charging the asset cost, net of any proceeds, to accumulated depletion or depreciation. Gains or losses on the disposition of oil and gas properties are not recognized unless the gain or loss changes the depletion rate by 20% or more.
Costs of acquiring and evaluating significant unproved oil and gas interests are excluded from costs subject to depletion and depreciation until it is determined that proved oil and gas reserves are attributable to such interests or until impairment occurs. Costs of major development projects are excluded from costs subject to depletion and depreciation until proved developed reserves have been attributed to a portion of the property or the property is determined to be impaired.
Impairment losses are recognized when the carrying amount of a cost centre exceeds the sum of:
| | • | | the undiscounted cash flow expected to result from production from proved reserves based on forecast oil and gas prices and costs; |
| | • | | the costs of unproved properties, less impairment; and |
PAGE 13
| | • | | the costs of major development projects, less impairment. |
The amount of impairment loss is determined to be the amount by which the carrying amount of the cost centre exceeds the sum of:
| | • | | the fair value of proved and probable reserves calculated using a present value technique that uses the cash flows expected to result from production of the proved reserves and a portion of the probable reserves discounted using a risk free rate; and |
| | • | | the cost, less impairment, of unproved properties and major development projects that do not have probable reserves attributed to them. |
ii) Other Plant and Equipment
Depreciation for substantially all other plant and equipment, except upgrading assets, is provided using the straight-line method based on estimated useful lives of assets which range from five to thirty-five years. Depreciation for upgrading assets is provided using the unit of production method, based on the plant’s estimated productive life. Repairs and maintenance costs, other than major turnaround costs, are charged to earnings as incurred. Certain turnaround costs are deferred to other assets when incurred and amortized over the estimated period of time to the next scheduled turnaround. At the time of disposition of plant and equipment, accounts are relieved of the asset values and accumulated depreciation and any resulting gain or loss is reflected in earnings.
iii) Asset Retirement Obligations
The recognition of the fair value of legal obligations associated with the retirement of tangible long-lived assets as calculated using the current estimated costs to retire the asset inflated to the estimated retirement date discounted using a credit-adjusted risk free rate, is recorded in the period that the asset is put into use, with a corresponding increase to the carrying value of the related asset. The obligations recognized are legal obligations. The liability is accreted over time for changes in the fair value of the liability through charges to accretion, which is included in cost of sales and operating expenses. The liability will also be adjusted to reflect revisions to the previous estimates of the undiscounted obligation. The costs capitalized to the related assets are amortized to earnings in a manner consistent with the depletion, depreciation and amortization of the underlying asset. Actual retirement expenditures are charged to the accumulated liability as incurred.
iv) Capitalized Interest
Interest is capitalized on significant major capital projects based on the Company’s long-term cost of borrowing. Capitalization of interest ceases when the capital project is substantially complete and ready for its intended use.
g) Impairment or Disposal of Long-lived Assets
An impairment loss is recognized when the carrying value of a long-lived asset is not recoverable and exceeds its fair value. Testing for recoverability uses the undiscounted cash flows expected from the asset’s use and disposition. To test for and measure impairment, long-lived assets are grouped at the lowest level for which identifiable cash flows are largely independent.
A long-lived asset that meets the conditions as held for sale is measured at the lower of its carrying amount or fair value less costs to sell. Such assets are not amortized while they are classified as held for sale. The results of operations of a component of an entity that has been disposed of, or is classified as held for sale, are reported in discontinued operations if: i) the operations and cash flows of the component have been or will be eliminated as a result of the disposal transaction; and, ii) the entity will not have a significant continuing involvement in the operations of the component after the disposal transaction.
PAGE 14
h) Goodwill
Goodwill is the excess of the purchase price paid over the fair value of net assets acquired. Goodwill is subject to impairment tests on at least an annual basis or sooner if there are indicators of impairment. The Company tests impairment annually in the fourth quarter of each year. To assess impairment, the fair values of the assets and liabilities of the reporting unit are compared to their carrying amounts. If the excess of the reporting unit’s fair value over its carrying amounts is greater than the carrying amount of the goodwill then there is no impairment. Any amount that the carrying amount of the goodwill exceeds the excess of the reporting unit’s fair value over its carrying amount is goodwill impairment. Impairment losses would be recognized in current period earnings.
i) Derivative Financial Instruments and Hedging Activities
i) Financial Instruments
All financial instruments must initially be recognized at fair value on the balance sheet. The Company has classified each financial instrument into the following categories: held for trading financial assets and financial liabilities, loans or receivables, held to maturity investments, available for sale financial assets, and other financial liabilities. Subsequent measurement of the financial instruments is based on their classification. Unrealized gains and losses on held for trading financial instruments are recognized in earnings. Gains and losses on available for sale financial assets are recognized in Other Comprehensive Income (“OCI”) and are transferred to earnings when the asset is derecognized. The other categories of financial instruments are recognized at amortized cost using the effective interest rate method.
A held for trading financial instrument is not a loan or receivable and includes one of the following criteria:
| | • | | is a derivative, except for those derivatives that have been designated as effective hedging instruments; |
| | • | | has been acquired or incurred principally for the purpose of selling or repurchasing in the near future; or |
| | • | | is part of a portfolio of financial instruments that are managed together and for which there is evidence of a recent actual pattern of short-term profit taking. |
For financial assets and financial liabilities that are not classified as held for trading, the transaction costs that are directly attributable to the acquisition or issue of a financial asset or financial liability are added to the fair value initially recognized for that financial instrument. These costs are expensed to earnings using the effective interest rate method.
ii) Derivative Instruments and Hedging Activities
Derivative instruments are utilized by the Company to manage market risk against the volatility in commodity prices, foreign exchange rates and interest rate exposures. The Company’s policy is not to utilize derivative instruments for speculative purposes. The Company may choose to designate derivative instruments as hedges. Hedge accounting continues to be optional.
At the inception of a hedge, if the Company elects to use hedge accounting, the Company formally documents the designation of the hedge, the risk management objectives, the hedging relationships between the hedged items and hedging items and the method for testing the effectiveness of the hedge, which must be reasonably assured over the term of the hedge. This process includes linking all derivatives to specific assets and liabilities on the balance sheet or to specific firm commitments or forecasted transactions. The Company formally assesses, both at the inception of the hedge and on an ongoing basis, whether the derivatives that are used in hedging transactions are highly effective in offsetting changes in fair values or cash flows of hedged items.
PAGE 15
All derivative instruments are recorded on the balance sheet at fair value in accounts receivable, other assets, accounts payable and accrued liabilities, or other long-term liabilities. Freestanding derivative instruments are classified as held for trading financial instruments. Gains and losses on these instruments are recorded in other expenses in the Consolidated Statement of Earnings in the period they occur. Derivative instruments that have been designated and qualify for hedge accounting are classified as either fair value or cash flow hedges. For fair value hedges, the gains or losses arising from adjusting the derivative to its fair value are recognized immediately in earnings along with the gain or loss on the hedged item. For cash flow hedges, the effective portion of the gains and losses is recorded in OCI until the hedged transaction is recognized in earnings. When the earnings impact of the underlying hedged transaction is recognized in the Consolidated Statement of Earnings, the fair value of the associated cash flow hedge is reclassified from OCI into earnings. Any hedge ineffectiveness is immediately recognized in earnings. Hedge accounting is discontinued on a prospective basis when the hedging relationship no longer qualifies for hedge accounting.
The Company may enter into commodity price contracts to hedge anticipated sales of crude oil and natural gas production to manage its exposure to price fluctuations. Gains and losses from these contracts are recognized in upstream oil and gas revenues as the related sales occur.
The Company may enter into commodity price contracts to offset fixed price contracts entered into with customers and suppliers to retain market prices while meeting customer or supplier pricing requirements. Gains and losses from these contracts are recognized in midstream revenues or costs of sales.
The Company may enter into power price contracts to hedge anticipated purchases of electricity to manage its exposure to price fluctuations. Gains and losses from these contracts are recognized in upstream operating expenses as the related purchases occur.
The Company may enter into interest rate swap agreements to hedge its fixed and floating interest rate mix on long-term debt. Gains and losses from these contracts are recognized as an adjustment to the interest expense on the hedged debt instrument.
The Company may enter into foreign exchange contracts to hedge its foreign currency exposures on U.S. dollar denominated long-term debt. Gains and losses on these instruments related to foreign exchange are recorded in foreign exchange expense in the period to which they relate, offsetting the respective foreign exchange gains and losses recognized on the underlying foreign currency long-term debt. The remaining portion of the gain or loss is recorded in Accumulated Other Comprehensive Income and is adjusted for changes in the fair value of the instrument over the life of the debt.
The Company may designate certain U.S. dollar denominated debt as a hedge of its net investment in self-sustaining foreign operations. The unrealized foreign exchange gains and losses arising from the translation of the debt are recorded in OCI, net of tax and are limited to the translation gain or loss on the net investment.
The Company may enter into foreign exchange forwards and foreign exchange collars to hedge anticipated U.S. dollar denominated crude oil and natural gas sales. Gains and losses on these instruments are recognized in upstream oil and gas revenues when the sale is recorded.
The Company may enter into foreign exchange contracts to offset its foreign exchange exposure. Gains and losses on these instruments are recorded at fair value and are recognized in other expense in the Consolidated Statement of Earnings.
For cash flow hedges that have been terminated or cease to be effective, prospective gains or losses on the derivative are recognized in earnings. Any gain or loss that has been included in Accumulated Other Comprehensive Income at the time the hedge is discontinued continues to be deferred in Accumulated Other Comprehensive Income until the original hedged transaction is recognized in earnings. However, if the likelihood of the original hedged transaction occurring is no longer probable, the entire gain or loss in Accumulated Other Comprehensive Income related to this transaction is immediately reclassified to earnings.
PAGE 16
Fair values of the derivatives are based on quoted market prices where available. The fair values of swaps and forward contracts are based on forward market prices. If a forward price is not available for a commodity based forward contract, a forward price is estimated using an existing forward price adjusted for quality or location.
iii) Embedded Derivatives
Embedded derivatives are derivatives embedded in a host contract. They are recorded separately from the host contract when their economic characteristics and risks are not clearly and closely related to those of the host contract, the terms of the embedded derivatives are the same as those of a freestanding derivative and the combined contract is not classified as held for trading or designated at fair value. The Company selected January 1, 2003 as its transition date for accounting for any potential embedded derivatives.
iv) Comprehensive Income
Comprehensive income consists of net earnings and OCI. OCI comprises the change in the fair value of the effective portion of the derivatives used as hedging items in a cash flow hedge or net investment hedge and exchange gains and losses arising from the translation of the financial statements of a self-sustaining foreign operation. Amounts included in OCI are shown net of tax. Accumulated Other Comprehensive Income is an equity category comprised of the cumulative amounts of OCI.
j) Employee Future Benefits
In Canada, the Company provides a defined contribution pension plan and a post-retirement health and dental care plan to qualified employees. The Company also maintains a defined benefit pension plan for a small number of employees who did not choose to join the defined contribution pension plan in 1991. The cost of the pension benefits earned by employees in the defined contribution pension plan is paid and expensed when incurred. The cost of the benefits earned by employees in the post-retirement health and dental care plan and defined benefit pension plan is charged to earnings as services are rendered using the projected benefit method prorated on service. The cost of the post-retirement health and dental care plan and defined benefit pension plan reflects a number of assumptions that affect the expected future benefit payments. These assumptions include, but are not limited to, attrition, mortality, the rate of return on pension plan assets and salary escalations for the defined benefit pension plan and expected health care cost trends for the post-retirement health and dental care plan. The plan assets are valued at fair value for the purposes of calculating the expected return on plan assets.
Adjustments arising out of plan amendments, changes in assumptions and experience gains and losses are normally amortized over the expected remaining average service life of the employee group.
k) Future Income Taxes
The Company follows the liability method of accounting for income taxes. Future income tax assets and liabilities are recognized at expected tax rates in effect when temporary differences between the tax basis and the carrying value of the Company’s assets and liabilities reverse. The effect of a change to the tax rate on the future tax assets and liabilities is recognized in earnings when substantively enacted.
l) Non-monetary Transactions
Non-monetary transactions are measured based on fair value when there is evidence to support the fair value unless the transaction lacks commercial substance or is an exchange of product or property held for sale in the ordinary course of business.
PAGE 17
m) Revenue Recognition
Revenues from the sale of crude oil, natural gas, natural gas liquids, synthetic crude oil, purchased commodities and refined petroleum products are recorded when title passes to an external party and payment has either been received or collection is reasonably certain. Sales between the business segments of the Company are eliminated from sales and operating revenues and cost of sales. Revenues associated with the sale of transportation, processing and natural gas storage services are recognized when the services are provided.
n) Foreign Currency Translation
Results of foreign operations that are considered financially and operationally integrated are translated to Canadian dollars at the monthly average exchange rates for revenue and expenses, except for depreciation and depletion which are translated at the rate of exchange applicable to the related assets. Monetary assets and liabilities are translated at current exchange rates and non-monetary assets and liabilities are translated using historical rates of exchange. Gains or losses resulting from these translation adjustments are included in earnings.
The accounts of self-sustaining foreign operations are translated to Canadian dollars using the current rate method. Assets and liabilities are translated at the period-end exchange rate and revenues and expenses are translated at the average exchange rates for the period. Gains and losses on the translation of self-sustaining foreign operations are included in OCI.
o) Stock-based Compensation
In accordance with the Company’s stock option plan, common share options may be granted to officers and certain other employees. The Company records compensation expense over the vesting period based on the fair value of options granted.
The Company’s stock option plan is a tandem plan that provides the stock option holder with the right to exercise the stock option or surrender the option for a cash payment. A liability for expected cash settlements is accrued over the vesting period of the stock options based on the difference between the exercise price of the stock options and the market price of the Company’s common shares. The liability is revalued to reflect changes in the market price of the Company’s common shares and the net change is recognized in earnings. When stock options are surrendered for cash, the cash settlement paid reduces the outstanding liability. When stock options are exercised for common shares, consideration paid by the stock option holders and the previously recognized liability associated with the stock options are recorded as share capital. Accrued compensation for an option that is forfeited is adjusted to earnings by decreasing the compensation cost in the period of forfeiture.
p) Earnings per Share
Basic common shares outstanding are the weighted average number of common shares outstanding for each period. The calculation of basic earnings per common share is based on net earnings divided by the weighted average number of common shares outstanding.
Diluted common shares outstanding are calculated using the treasury stock method, which assumes that any proceeds received from in-the-money options would be used to buy back common shares at the average market price for the period. However, since the Company has a tandem stock option plan and accrues a liability for expected cash settlements, the potential common shares issuable upon exercise associated with the stock options are not included in diluted common shares outstanding. Shares that were potentially issuable on the settlement of the capital securities were not included in the determination of diluted earnings per common share, as the Company had neither the obligation nor intention to settle amounts due through the issuance of shares.
q) Reclassification
Certain prior years’ amounts have been reclassified to conform with current presentation.
PAGE 18
NOTE 4 CHANGES IN ACCOUNTING POLICIES
a) Goodwill and Intangible Assets
Effective January 1, 2009, the Company retroactively adopted the Canadian Institute of Chartered Accountants (“CICA”) Handbook Section 3064, “Goodwill and Intangible Assets,” which replaced Section 3062 of the same name. As a result of issuing this guidance, Section 3450, “Research and Development Costs,” and Emerging Issues Committee (“EIC”) Abstract No. 27, “Revenues and Expenditures during the Pre-operating Period,” have been withdrawn. This new guidance requires recognizing all goodwill and intangible assets in accordance with Section 1000, “Financial Statement Concepts.” Section 3064 has eliminated the practice of recognizing items as assets that do not meet the Section 1000 definition and recognition criteria. Under this new guidance, fewer items meet the criteria for capitalization. The impact to the Company was as follows:
Consolidated Balance Sheet
| | | | | | | | | | | | | | | | | | | | |
| | | As at Dec. 31, 2008 | | As at Dec. 31, 2007 |
| | | As
Reported | | Change | | | As
Restated | | As
Reported | | Change | | | As
Restated |
Assets | | | | | | | | | | | | | | | | | | | | |
Prepaid expenses | | $ | 33 | | $ | (22 | ) | | $ | 11 | | $ | 28 | | $ | (14 | ) | | $ | 14 |
Other assets | | | 134 | | | (14 | ) | | | 120 | | | 184 | | | (17 | ) | | | 167 |
Liabilities and shareholders’ equity | | | | | | | | | | | | | | | | | | | | |
Future income taxes | | | 4,724 | | | (11 | ) | | | 4,713 | | | 3,957 | | | (9 | ) | | | 3,948 |
Retained earnings | | | 10,461 | | | (25 | ) | | | 10,436 | | | 8,176 | | | (22 | ) | | | 8,154 |
| | | | | | | | | | | | | | | | | | | | |
| | |
Consolidated Statement of Earnings and
Comprehensive Income | | Year ended Dec. 31, 2008 | | Year ended Dec. 31, 2007 |
| | As
Reported | | Change | | | As
Restated | | As
Reported | | Change | | | As
Restated |
Cost of sales and operating expenses | | $ | 17,701 | | $ | 5 | | | $ | 17,706 | | $ | 9,296 | | $ | 18 | | | $ | 9,314 |
Future income taxes | | | 495 | | | (2 | ) | | | 493 | | | 566 | | | (5 | ) | | | 561 |
Net earnings | | | 3,754 | | | (3 | ) | | | 3,751 | | | 3,214 | | | (13 | ) | | | 3,201 |
Comprehensive income | | | 4,190 | | | (3 | ) | | | 4,187 | | | 3,155 | | | (13 | ) | | | 3,142 |
Earnings per share — basic and diluted | | | 4.42 | | | — | | | | 4.42 | | | 3.79 | | | (0.02 | ) | | | 3.77 |
| | | | | | | | | | | | | | | | | | | | |
b) Financial Instruments
Effective July 1, 2009, the Company prospectively adopted the amendments to CICA Handbook Section 3855, “Financial Instruments — Recognition and Measurement.” Amendments to this section have prohibited the reclassification of a financial asset out of the held-for-trading category when the fair value of the embedded derivative in a combined contract cannot be reasonably measured. The adoption of the amendments to this standard did not have an impact on the Company’s financial statements.
Effective September 30, 2009, the Company adopted the amendments to CICA Handbook Section 3855, “Financial Instruments — Recognition and Measurement,” in relation to the impairment of financial assets. Amendments to this section have revised the definition of “loans and receivables” and provided that certain conditions have been met, permits reclassification of financial assets from the held-for-trading and available-for-sale categories into the loans and receivables category. The amendments also provide one method of assessing impairment for all financial assets regardless of classification. These amendments are effective for the Company’s annual financial statements relating to its fiscal year beginning on January 1, 2009. The adoption of the amendments to this standard did not have an impact on the Company’s financial statements.
PAGE 19
Effective December 31, 2009, the Company adopted the amendments to CICA Handbook Section 3862, “Financial Instruments — Disclosures,” to include additional disclosure requirements about fair value measurement for financial instruments and liquidity risk disclosures. These amendments require a three level hierarchy that reflects the significance of the inputs used in making the fair value measurements. Fair value of assets and liabilities included in Level 1 are determined by reference to quoted prices in active markets for identical assets and liabilities. Assets and liabilities in Level 2 include valuations using inputs other than quoted prices for which all significant outputs are observable, either directly or indirectly. Level 3 valuations are based on inputs that are unobservable and significant to the overall fair value measurement. Refer to Note 23 “Financial Instruments and Risk Management” for the additional disclosures under amendments to Section 3862.
NOTE 5 PENDING ACCOUNTING PRONOUNCEMENTS
a) Business Combinations
In January 2009, the CICA issued Section 1582, “Business Combinations,” which will replace CICA Handbook Section 1581 of the same name. Under this guidance, the purchase price used in a business combination is based on the fair value of shares exchanged at the date of the exchange. Currently the purchase price used is based on the market price of the shares for a reasonable period before and after the date the acquisition is agreed upon and announced. This new guidance generally requires all acquisition costs to be expensed, which currently are capitalized as part of the purchase price. Contingent liabilities are to be recognized at fair value at the acquisition date and remeasured at fair value with changes recorded through earnings each period until settled. Currently only contingent liabilities that are resolved and payable are included in the cost to acquire the business. In addition, negative goodwill is required to be recognized immediately in earnings, unlike the current requirement to eliminate it by deducting it from non-current assets in the purchase price allocation. Section 1582 is effective for Husky on January 1, 2011 with prospective application and early adoption permitted.
b) Consolidated Financial Statements
In January 2009, the CICA issued Section 1601, “Consolidated Financial Statements,” which will replace CICA Handbook Section 1600 of the same name. This guidance requires uniform accounting policies to be consistent throughout all consolidated entities and the difference between reporting dates of a parent and a subsidiary to be no longer than three months. These are not explicitly required under the current standard. Section 1601 is effective for Husky on January 1, 2011 with early adoption permitted. This standard will have no impact to the Company.
c) Non-Controlling Interests
In January 2009, the CICA issued Section 1602, “Non-controlling Interests,” which will replace CICA Handbook Section 1600, “Consolidated Financial Statements.” Minority interest is now referred to as non-controlling interest, (“NCI”), and is presented within equity. Under this new guidance, when there is a loss or gain of control, the Company’s previously held interest is revalued at fair value. Currently an increase in an investment is accounted for using the purchase method and a decrease in an investment is accounted for as a sale resulting in a gain or loss in earnings. In addition, NCI may be reported at fair value or at the proportionate share of the fair value of the acquired net assets and allocation of the net income to the NCI will be on this basis. Currently, NCI is recorded at the carrying amount and can only be in a deficit position if the NCI has an obligation to fund the losses. Section 1602 is effective for Husky on January 1, 2011 with early adoption permitted.
NOTE 6 INTERNATIONAL FINANCIAL REPORTING STANDARDS
In January 2006, the Canadian Accounting Standards Board (“AcSB”) adopted a strategic plan for the direction of accounting standards in Canada. In February 2008, as part of its strategic plan, the AcSB confirmed
PAGE 20
that Canadian publicly accountable entities will be required to report under International Financial Reporting Standards (“IFRS”), which will replace Canadian GAAP for years beginning on or after January 1, 2011. An omnibus exposure draft was issued by the AcSB in the second quarter of 2008, which incorporates IFRS into the CICA Handbook and prescribes the transitional provisions for adopting IFRS. In March 2009, the AcSB issued a second omnibus exposure draft on the adoption of IFRS. This exposure draft confirms the IFRS transition date as January 1, 2011 for all Canadian publicly accountable enterprises, incorporates any changes to IFRS since the previous exposure draft was issued and discusses additional key transitional issues. In October 2009, the AcSB issued a third omnibus exposure draft on the adoption of IFRS. This exposure draft incorporates changes to IFRS since the previous exposure draft that will be applicable to Canadian entities.
In July 2009, the International Accounting Standards Board (“IASB”) approved additional IFRS transitional exemptions that will allow entities to allocate their oil and gas asset balance as determined under full cost accounting to the IFRS categories of exploration and evaluation assets and development and producing properties. Under the exemption, exploration and evaluation assets are measured at the amount determined under an entity’s previous GAAP. For assets in the development or production phases, the amount is also measured at the amount determined under an entity’s previous GAAP; however, such values must be allocated to the underlying IFRS transitional assets on a pro-rata basis using either reserve values or reserve volumes as of the entity’s IFRS transition date. This exemption will relieve entities from significant adjustments resulting from retrospective adoption of IFRS. The Company intends to utilize this exemption. Husky is also evaluating other first-time adoption exemptions and elections available upon initial transition that provide relief from retrospective application of IFRS.
The Company has completed the diagnostic assessment phase by performing comparisons of the differences between Canadian GAAP and IFRS and is continuing assessment of the effects of adoption and finalizing its conversion plan. The Company has determined that accounting for property, plant and equipment will be impacted by the conversion to IFRS. The Company currently follows full cost accounting as prescribed in Accounting Guideline (“AcG”) 16, “Oil and Gas Accounting – Full Cost.” Conversion from Canadian GAAP to IFRS may have an impact on how the Company accounts for costs pertaining to oil and gas activities, in particular those related to the pre-exploration and development phases. The conversion to IFRS will also result in other impacts, some of which may be significant in nature.
Assessments of other impacts completed to date include foreign exchange, revenue recognition, provisions and asset retirement obligations. The Company continues to perform assessments on less critical IFRS transition issues and has commenced analysis of IFRS financial statement presentation and disclosure requirements. These assessments will need to be further analyzed and evaluated throughout the implementation phase of the Company’s project. At this time, the impact on Husky’s financial position and results of operations is not reliably determinable or estimable.
In 2009, the Company progressed work on information systems in preparation for the conversion of its balance sheet as at December 31, 2009 and the requirement to report 2010 in compliance with IFRS when reporting in 2011.
The Company will continue to monitor any changes in the adoption of IFRS and will update its plan as necessary.
NOTE 7 ACCOUNTS RECEIVABLE
| | | | | | | | | | | | |
| | | 2009 | | | 2008 | | | 2007 | |
Trade receivables | | $ | 948 | | | $ | 1,135 | | | $ | 1,599 | |
Allowance for doubtful accounts | | | (18 | ) | | | (22 | ) | | | (10 | ) |
Derivatives due within one year | | | 22 | | | | 111 | | | | 22 | |
Income taxes receivable | | | 23 | | | | 106 | | | | — | |
Other | | | 12 | | | | 14 | | | | 11 | |
| | | | | | | | | | | | |
| | $ | 987 | | | $ | 1,344 | | | $ | 1,622 | |
| | | | | | | | | | | | |
PAGE 21
Sale of Accounts Receivable
Husky has chosen not to renew its securitization agreement, which expired on March 31, 2009. No accounts receivable had been sold under the program during 2009 and 2008. During 2007, proceeds from revolving sales between the third party and the Company totalled approximately $3.5 billion. The average effective rate for 2007 was approximately 5.3%.
NOTE 8 INVENTORIES
| | | | | | | | | |
| | | 2009 | | 2008 | | 2007 |
Crude oil | | $ | 812 | | $ | 480 | | $ | 539 |
Natural gas | | | 172 | | | 222 | | | 192 |
Refined petroleum products | | | 451 | | | 263 | | | 409 |
Materials, supplies and other | | | 85 | | | 67 | | | 50 |
| | | | | | | | | |
| | $ | 1,520 | | $ | 1,032 | | $ | 1,190 |
| | | | | | | | | |
Write-downs of inventories to net realizable value in 2009 amounted to $106 million (2008 — $721 million; 2007 — $11 million).
NOTE 9 PROPERTY, PLANT AND EQUIPMENT
Refer to Note 1, “Segmented Financial Information,” which presents the Company’s property, plant and equipment by segment.
Administrative costs related to exploration and development activities capitalized in 2009 were $48 million (2008 — $43 million; 2007 — $48 million).
Costs of oil and gas properties, including major development projects, excluded from costs subject to depletion and depreciation at December 31 were as follows:
| | | | | | | | | |
| | | 2009 | | 2008 | | 2007 |
Canada | | $ | 3,125 | | $ | 2,703 | | $ | 1,954 |
International | | | 827 | | | 485 | | | 243 |
| | | | | | | | | |
| | $ | 3,952 | | $ | 3,188 | | $ | 2,197 |
| | | | | | | | | |
Included in International are costs related to unproved properties incurred in cost centres that are considered to be in the pre-production stage. Currently, there are no proved reserves in these cost centres. All costs, net of any associated revenues, in these cost centres have been capitalized. Ultimate recoverability of these costs will be dependent upon the finding of proved oil and natural gas reserves. For the year ended December 31, 2009, the Company completed its impairment review of pre-production cost centres and determined that there was no impairment required.
The prices used in the ceiling test evaluation of the Company’s crude oil and natural gas reserves at December 31, 2009 were:
| | | | | | | | | | | | | | | | | |
Canada | | 2010 | | 2011 | | 2012 | | 2013 | | 2014 | | Price
increase
2014 to 2029
(percent) |
Crude oil($/bbl) | | $ | 71.53 | | $ | 75.02 | | $ | 75.78 | | $ | 76.85 | | $ | 78.70 | | 2 |
Natural gas($/mcf) | | | 7.04 | | | 7.53 | | | 7.87 | | | 8.30 | | | 8.76 | | 2 |
PAGE 22
NOTE 10 CORPORATE ACQUISITION
In July 2007, the Company acquired a refinery in Lima, Ohio from The Premcor Refining Group Inc., an indirect wholly owned subsidiary of Valero Energy Corporation through the purchase of all of the issued and outstanding shares of Lima Refining Company (“Lima”). The total cash consideration was U.S. $1.9 billion plus U.S. $540 million for the cost of feedstock and product inventory. The results of Lima are included in the consolidated financial statements of the Company from its acquisition date. The Lima operations have been included in the downstream — U.S. Refining and Marketing segment in Note 1, “Segmented Financial Information.” The operations of Lima are a self-sustaining foreign operation for foreign currency translation purposes.
The allocation of the aggregate purchase price based on the estimated fair values of the net assets of Lima on its acquisition date was as follows:
| | | | | | | | |
| | | U.S. $ | | | Cdn $ | |
Net assets acquired | | | | | | | | |
Working capital | | $ | 4 | | | $ | 4 | |
Property, plant and equipment | | | 1,455 | | | | 1,542 | |
Goodwill(1) | | | 506 | | | | 536 | |
Other assets | | | 25 | | | | 26 | |
Other long-term liabilities | | | (86 | ) | | | (91 | ) |
| | | | | | | | |
| | | 1,904 | | | | 2,017 | |
Feedstock and product inventory acquired | | | 540 | | | | 572 | |
| | | | | | | | |
Total | | $ | 2,444 | | | $ | 2,589 | |
| | | | | | | | |
| (1) | Allocated to U.S. Refining and Marketing in the Company’s downstream segment. For U.S. income tax purposes, goodwill is deductible and amortized over a 15-year period. Refer to Note 1, “Segmented Financial Information.” |
NOTE 11 JOINT VENTURES
a) BP Canada Energy Company
On March 31, 2008, the Company completed a transaction with BP Canada Energy Company (“BP”), which resulted in the formation of a 50/50 joint venture upstream entity and a 50/50 joint venture downstream entity.
The upstream entity is a partnership to which Husky has contributed the Sunrise oil sands assets with a fair value of U.S. $2.5 billion as at January 1, 2008, plus capital expenditures for the three-month period ended March 31, 2008 of $15 million. BP’s contribution was U.S. $250 million cash and a contribution receivable for the balance of U.S. $2.25 billion and $15 million. The contribution receivable accretes at a rate of 6% and is payable between December 31, 2009 and December 31, 2015 with the final balance due and payable by December 31, 2015. The upstream entity is included as part of the upstream segment.
PAGE 23
The downstream entity is a limited liability company (“LLC”) to which BP has contributed the Toledo Refinery plus inventories and other net assets, less accounts payable and adjusted net earnings. Husky’s contribution was U.S. $250 million cash and a contribution payable for the balance of U.S. $2.6 billion. Husky’s share of the value of the amounts contributed at March 31, 2008 by both entities to the downstream LLC is described below:
| | | | |
Cash | | $ | 129 | |
Inventory | | | 199 | |
Property, plant and equipment (including adjusted earnings) | | | 1,928 | |
Partner contribution receivable | | | 1,331 | |
Other assets | | | 2 | |
Inventory related payables | | | (12 | ) |
Future income tax liability | | | (658 | ) |
| | | | |
Total contribution to downstream joint venture | | $ | 2,919 | |
| | | | |
The contribution payable accretes at a rate of 6% and is payable between December 31, 2009 and December 31, 2015 with the final balance due and payable by December 31, 2015. The timing of payments during this period will be determined by the capital expenditures made at the refinery during this same period. The downstream entity is included as part of the U.S. Refining and Marketing segment. This entity is a self-sustaining foreign operation.
Summarized below are the results of operations, cash flows and financial position relating to the Company’s proportional interests in its downstream joint venture:
| | | | | | | |
Results of Operations | | 2009 | | 2008 | |
Revenues | | $ | 1,799 | | $ | 1,843 | |
Expenses | | | 1,761 | | | 2,020 | |
| | | | | | | |
Proportionate share of net income (loss) | | $ | 38 | | $ | (177 | ) |
| | | | | | | |
| | | | | | | | |
Cash Flows | | 2009 | | | 2008 | |
Cash flow — operating activities | | $ | 76 | | | $ | (90 | ) |
Cash flow — financing activities | | | — | | | | — | |
Cash flow — investing activities | | | (55 | ) | | | (58 | ) |
| | | | | | | | |
Proportionate share of increase (decrease) in cash and cash equivalents | | $ | 21 | | | $ | (148 | ) |
| | | | | | | | |
| | | | | | | | |
Financial Position | | 2009 | | | 2008 | |
Current assets | | $ | 351 | | | $ | 245 | |
Long-term assets | | | 1,910 | | | | 2,292 | |
Current liabilities | | | (179 | ) | | | (42 | ) |
Long-term liabilities | | | (528 | ) | | | (666 | ) |
| | | | | | | | |
Proportionate share of net assets | | $ | 1,554 | | | $ | 1,829 | |
| | | | | | | | |
Both joint ventures are being accounted for using proportionate consolidation. The amounts recorded in the consolidated financial statements represent the Company’s 50% interest in the joint ventures.
b) CNOOC Southeast Asia Limited
In April 2008, a subsidiary of the Company, Husky Oil Madura Partnership (“HOMP”), entered into an agreement with CNOOC Southeast Asia Limited (“CNOOCSE”), which resulted in the acquisition by
PAGE 24
CNOOCSE of a 50% equity interest in Husky Oil (Madura) Limited, a subsidiary of HOMP, for a consideration of $127 million (U.S. $125 million) resulting in a gain of $69 million included in other — net in the Consolidated Statements of Earnings and Comprehensive Income. Husky Oil (Madura) Limited holds a 100% interest in the Madura Strait Production Sharing Contract. The resulting joint venture arrangement is being accounted for using the proportionate consolidation method.
c) Results of Joint Ventures
The results of Husky’s proportionate share of its downstream joint venture with BP are described in Note 11 a). The results from the upstream joint venture with BP and the joint venture arrangement with CNOOCSE are considered to be in the pre-production phase. As a result, any impact on the financial results of the Company subsequent to entering into these joint ventures is considered immaterial.
NOTE 12 CASH FLOWS — CHANGE IN NON-CASH WORKING CAPITAL
a) Change in non-cash working capital was as follows:
| | | | | | | | | | | |
| | | 2009 | | | 2008 | | 2007 | |
Decrease (increase) in non-cash working capital | | | | | | | | | | | |
Accounts receivable | | $ | 235 | | | $ | 453 | | $ | (345 | ) |
Inventories | | | (651 | ) | | | 522 | | | (212 | ) |
Prepaid expenses | | | — | | | | 2 | | | 1 | |
Accounts payable and accrued liabilities | | | (588 | ) | | | 428 | | | (190 | ) |
| | | | | | | | | | | |
Change in non-cash working capital | | $ | (1,004 | ) | | $ | 1,405 | | $ | (746 | ) |
| | | | | | | | | | | |
Relating to: | | | | | | | | | | | |
Operating activities | | $ | (548 | ) | | $ | 888 | | $ | (718 | ) |
Financing activities | | | (167 | ) | | | 146 | | | 65 | |
Investing activities | | | (289 | ) | | | 371 | | | (93 | ) |
| | | | | | | | | | | |
b) Other cash flow information:
| | | | | | | | | |
| | | 2009 | | 2008 | | 2007 |
Cash taxes paid | | $ | 1,323 | | $ | 615 | | $ | 926 |
Cash interest paid | | $ | 200 | | $ | 159 | | $ | 162 |
| | | | | | | | | |
Cash and cash equivalents at December 31, 2009 included $65 million of cash and $327 million of short-term investments with maturities less than three months.
NOTE 13 GOODWILL
| | | | | | | | | | | |
| | | 2009 | | | 2008 | | 2007 | |
Balance at beginning of year | | $ | 779 | | | $ | 660 | | $ | 160 | |
Acquired during the year | | | — | | | | — | | | 536 | |
Foreign currency translation of goodwill in self-sustaining U.S. operations | | | (90 | ) | | | 119 | | | (36 | ) |
| | | | | | | | | | | |
Balance at end of year | | $ | 689 | | | $ | 779 | | $ | 660 | |
| | | | | | | | | | | |
PAGE 25
NOTE 14 BANK OPERATING LOANS
At December 31, 2009, the Company had unsecured short-term borrowing lines of credit with banks totalling $395 million (2008 — $370 million; 2007 — $270 million). As at December 31, 2009, bank operating loans (excluding reclassified outstanding cheques) were nil (2008 and 2007 — nil) and letters of credit under these lines of credit totalled $133 million (2008 — $166 million; 2007 — $73 million). Interest payable is based on Bankers’ Acceptance, U.S. LIBOR or prime rates. During 2009, the weighted average interest rate on short-term borrowings was approximately 6.5% (2008 — 7.1%; 2007 — 5.8%).
The Sunrise Oil Sands Partnership has an unsecured demand credit facility of $10 million available for general purposes. The Company’s proportionate share is $5 million. As at December 31, 2009, there was no balance outstanding under this credit facility.
NOTE 15 ACCOUNTS PAYABLE AND ACCRUED LIABILITIES
| | | | | | | | | |
| | | 2009 | | 2008 | | 2007 |
Trade payables | | $ | 37 | | $ | 93 | | $ | 23 |
Accrued liabilities | | | 1,545 | | | 1,813 | | | 1,743 |
Dividend payable | | | 255 | | | 425 | | | 280 |
Stock-based compensation | | | 1 | | | 24 | | | 159 |
Current income taxes | | | 270 | | | 419 | | | 36 |
Other | | | 77 | | | 122 | | | 117 |
| | | | | | | | | |
| | $ | 2,185 | | $ | 2,896 | | $ | 2,358 |
| | | | | | | | | |
NOTE 16 LONG-TERM DEBT
| | | | | | | | | | | | | | | | | | | | | | | |
| | | Maturity | | Cdn $ Amount | | | U.S. $ Denominated |
| | | 2009 | | | 2008 | | | 2007 | | | 2009 | | 2008 | | 2007 |
Long-term debt | | | | | | | | | | | | | | | | | | | | | | | |
6.95% medium-term notes — Series E | | | | $ | — | | | $ | — | | | $ | 203 | | | $ | — | | $ | — | | $ | — |
6.25% notes | | 2012 | | | 419 | | | | 490 | | | | 395 | | | | 400 | | | 400 | | | 400 |
5.90% notes | | 2014 | | | 785 | | | | — | | | | — | | | | 750 | | | — | | | — |
7.55% debentures | | 2016 | | | 208 | | | | 245 | | | | 198 | | | | 200 | | | 200 | | | 200 |
6.20% notes | | 2017 | | | 312 | | | | 367 | | | | 296 | | | | 300 | | | 300 | | | 300 |
6.15% notes | | 2019 | | | 314 | | | | 367 | | | | 296 | | | | 300 | | | 300 | | | 300 |
7.25% notes | | 2019 | | | 785 | | | | — | | | | — | | | | 750 | | | — | | | — |
8.90% capital securities | | | | | — | | | | — | | | | 223 | | | | — | | | — | | | 225 |
6.80% notes | | 2037 | | | 405 | | | | 474 | | | | 445 | | | | 387 | | | 387 | | | 450 |
Debt issue costs | | | | | (26 | ) | | | (18 | ) | | | (20 | ) | | | — | | | — | | | — |
Unwound interest rate swaps | | | | | 27 | | | | 32 | | | | 37 | | | | — | | | — | | | — |
| | | | | | | | | | | | | | | | | | | | | | | |
| | | | $ | 3,229 | | | $ | 1,957 | | | $ | 2,073 | | | $ | 3,087 | | $ | 1,587 | | $ | 1,875 |
| | | | | | | | | | | | | | | | | | | | | | | |
Long-term debt due within one year | | | | | | | | | | | | | | | | | | | | | | | |
Bridge financing | | | | $ | — | | | $ | — | | | $ | 741 | | | $ | — | | $ | — | | $ | 750 |
| | | | | | | | | | | | | | | | | | | | | | | |
PAGE 26
Interest — net for the years ended December 31 was as follows:
| | | | | | | | | | | | |
| | | 2009 | | | 2008 | | | 2007 | |
Interest expense | | | | | | | | | | | | |
Long-term debt | | $ | 193 | | | $ | 154 | | | $ | 151 | |
Contribution payable | | | 92 | | | | 63 | | | | — | |
Other | | | 8 | | | | 5 | | | | 6 | |
| | | | | | | | | | | | |
| | | 293 | | | | 222 | | | | 157 | |
Amount capitalized | | | (16 | ) | | | — | | | | (19 | ) |
| | | | | | | | | | | | |
| | | 277 | | | | 222 | | | | 138 | |
Interest income | | | | | | | | | | | | |
Contribution receivable | | | (81 | ) | | | (55 | ) | | | — | |
Other | | | (2 | ) | | | (20 | ) | | | (8 | ) |
| | | | | | | | | | | | |
| | | (83 | ) | | | (75 | ) | | | (8 | ) |
| | | | | | | | | | | | |
| | $ | 194 | | | $ | 147 | | | $ | 130 | |
| | | | | | | | | | | | |
Foreign exchange for the years ended December 31 was as follows:
| | | | | | | | | | | | |
| | | 2009 | | | 2008 | | | 2007 | |
(Gain) loss on translation of U.S. dollar denominated long-term debt | | $ | (327 | ) | | $ | 217 | | | $ | (197 | ) |
(Gain) loss on cross currency swaps | | | 62 | | | | (83 | ) | | | 62 | |
(Gain) loss on contribution receivable | | | 216 | | | | (228 | ) | | | — | |
Other (gains) losses | | | 44 | | | | (241 | ) | | | 84 | |
| | | | | | | | | | | | |
Gain | | $ | (5 | ) | | $ | (335 | ) | | $ | (51 | ) |
| | | | | | | | | | | | |
Other gains and losses include realized and unrealized foreign exchange gains and losses on working capital.
Credit Facilities
The revolving syndicated credit facility allows the Company to borrow up to $1.25 billion in either Canadian or U.S. currency from a group of banks on an unsecured basis. The facility is structured as a five-year committed revolving credit facility. Interest rates vary based on Canadian prime, Bankers’ Acceptance, U.S. LIBOR or U.S. base rate, depending on the borrowing option selected and credit ratings assigned by certain credit rating agencies to the Company’s rated senior unsecured debt.
The Company’s $150 million revolving bilateral credit facilities have substantially the same terms as the syndicated credit facility.
As at December 31, 2009, there were no borrowings under the syndicated credit facility or the bilateral credit facilities. See Note 24 for debt covenants.
In July 2007, the Company obtained U.S. $1.5 billion of short-term bridge financing at an interest rate based on U.S. LIBOR, maturing June 26, 2008, to facilitate closing the acquisition of the Lima, Ohio refinery. On September 11, 2007, the Company refinanced U.S. $750 million with long-term notes. The remaining bridge financing of U.S. $750 million was repaid in June 2008.
Notes and Debentures
Husky filed a debt shelf prospectus with the Alberta Securities Commissions on February 26, 2009 and the U.S. Securities and Exchange Commission on February 27, 2009. The shelf prospectus enables Husky to offer up
PAGE 27
to U.S. $3 billion of debt securities in the United States until March 26, 2011. During the 25-month period that the shelf prospectus is effective, debt securities may be offered in amounts, at prices and on terms to be determined based on market conditions at the time of sale. In 2009, U.S. $1.5 billion of debt securities were issued under this shelf prospectus.
On December 21, 2009, Husky filed an additional debt shelf prospectus with the Alberta Securities Commission that enables Husky to offer up to $1 billion of debt securities in Canada until January 21, 2012. During the 25-month period that the shelf prospectus is effective, debt securities may be offered in amounts, at prices and on terms to be determined based on market conditions at the time of sale. As of December 31, 2009, no debt securities had been issued under this shelf prospectus.
The 6.25% and the 6.15% notes represent unsecured securities under a trust indenture dated June 14, 2002. Interest is payable semi-annually.
The 5.90% and the 7.25% notes, issued in 2009 as described above, represent unsecured securities under a trust indenture dated September 11, 2007. Interest is payable semi-annually.
The 7.55% debentures represent unsecured securities under a trust indenture dated October 31, 1996. Interest is payable semi-annually.
The 6.20% and the 6.80% notes represent unsecured securities under a trust indenture dated September 11, 2007. During 2008, the Company repurchased U.S. $63 million of the 6.80% notes. Interest is payable semi-annually.
The 8.90% capital securities represented unsecured securities under an indenture dated August 10, 1998. On June 12, 2008, the Company initiated a cash tender offer to purchase any and all of the 8.90% capital securities. The tender offer expired on July 11, 2008 at which date U.S. $214 million or 95% of the capital securities had been tendered. The settlement date occurred July 11, 2008. The remaining capital securities were redeemed on August 14, 2008.
The 6.95% medium-term notes Series E represented unsecured securities under a trust indenture dated May 4, 1999 and were redeemed in August 2008 at a redemption price, including accrued interest, of $208 million.
The notes and debentures disclosed above are redeemable (unless otherwise stated) at the option of the Company, at any time, at a redemption price equal to the greater of the par value of the securities and the sum of the present values of the remaining scheduled payments discounted at a rate calculated using a comparable U.S. Treasury Bond rate (for U.S. dollar denominated securities) or Government of Canada Bond rate (for Canadian dollar denominated securities) plus an applicable spread.
The Company’s notes, debentures, credit facilities and short-term lines of credit rank equally.
NOTE 17 OTHER LONG-TERM LIABILITIES
| | | | | | | | | |
| | | 2009 | | 2008 | | 2007 |
Asset retirement obligations | | $ | 793 | | $ | 711 | | $ | 662 |
Cross currency swaps(1) | | | 81 | | | 19 | | | 107 |
Employee future benefits(note 21) | | | 81 | | | 81 | | | 69 |
Capital lease obligations | | | 36 | | | 44 | | | 36 |
Stock-based compensation(note 20) | | | — | | | — | | | 13 |
Other | | | 45 | | | 43 | | | 31 |
| | | | | | | | | |
| | $ | 1,036 | | $ | 898 | | $ | 918 |
| | | | | | | | | |
| (1) | Refer to Note 23, “Financial Instruments and Risk Factors.” |
PAGE 28
Asset Retirement Obligations
At December 31, 2009, the estimated total undiscounted inflation adjusted amount required to settle the asset retirement obligations was $5.9 billion. These obligations will be settled based on the useful lives of the underlying assets, which currently extend an average of 30 years into the future. This amount has been discounted using credit-adjusted risk free rates ranging from 6.2% to 9.6%.
Changes to the asset retirement obligations were as follows:
| | | | | | | | | | | | |
| | | 2009 | | | 2008 | | | 2007 | |
Asset retirement obligations at beginning of year | | $ | 711 | | | $ | 662 | | | $ | 622 | |
Liabilities incurred/acquired | | | 79 | | | | 56 | | | | 57 | |
Liabilities disposed | | | (4 | ) | | | (5 | ) | | | (13 | ) |
Liabilities settled | | | (41 | ) | | | (56 | ) | | | (51 | ) |
Accretion(1) | | | 48 | | | | 54 | | | | 47 | |
| | | | | | | | | | | | |
Asset retirement obligations at end of year | | $ | 793 | | | $ | 711 | | | $ | 662 | |
| | | | | | | | | | | | |
| (1) | Accretion is included in cost of sales and operating expenses. |
NOTE 18 INCOME TAXES
The provision for income taxes in the Consolidated Statements of Earnings and Comprehensive Income reflects an effective tax rate which differs from the expected statutory tax rate. Differences for the years ended December 31 were accounted for as follows:
| | | | | | | | | | | | |
| | | 2009 | | | 2008 | | | 2007 | |
Earnings (loss) before income taxes | | | | | | | | | | | | |
Canada | | $ | 2,195 | | | $ | 5,687 | | | $ | 3,745 | |
United States | | | (51 | ) | | | (820 | ) | | | 95 | |
Other foreign jurisdictions | | | (187 | ) | | | 278 | | | | 269 | |
| | | | | | | | | | | | |
| | | 1,957 | | | | 5,145 | | | | 4,109 | |
Statutory income tax rate(percent) | | | 30.0 | | | | 30.6 | | | | 32.7 | |
| | | | | | | | | | | | |
Expected income tax | | | 587 | | | | 1,574 | | | | 1,344 | |
Effect on income tax of: | | | | | | | | | | | | |
Change in statutory tax rate | | | (1 | ) | | | — | | | | (395 | ) |
Rate benefit on partnership earnings | | | (27 | ) | | | (60 | ) | | | (53 | ) |
Capital gains and losses | | | (11 | ) | | | (19 | ) | | | (24 | ) |
Foreign jurisdictions | | | 19 | | | | (102 | ) | | | 8 | |
Other — net | | | (26 | ) | | | 1 | | | | 28 | |
| | | | | | | | | | | | |
Income tax expense | | $ | 541 | | | $ | 1,394 | | | $ | 908 | |
| | | | | | | | | | | | |
In 2009, a tax rate benefit of approximately $1 million was recognized related to a reduction in the Ontario provincial corporate tax rate. During 2007, a tax benefit of $395 million was recognized as a result of reductions in both federal and provincial tax rates. No similar tax benefit was recognized in 2008.
PAGE 29
The future income tax liabilities at December 31 comprised the tax effect of temporary differences as follows:
| | | | | | | | | |
| | | 2009 | | 2008 | | 2007 |
Future tax liabilities | | | | | | | | | |
Property, plant and equipment | | $ | 4,478 | | $ | 5,226 | | $ | 4,081 |
Foreign exchange gains taxable on realization | | | 81 | | | 92 | | | 131 |
Other temporary differences | | | 23 | | | 2 | | | 1 |
| | | | | | | | | |
| | | 4,582 | | | 5,320 | | | 4,213 |
| | | | | | | | | |
Future tax assets | | | | | | | | | |
Asset retirement obligations | | | 230 | | | 207 | | | 186 |
Loss carry forwards | | | 369 | | | 348 | | | — |
Other temporary differences | | | 51 | | | 52 | | | 79 |
| | | | | | | | | |
| | | 650 | | | 607 | | | 265 |
| | | | | | | | | |
| | $ | 3,932 | | $ | 4,713 | | $ | 3,948 |
| | | | | | | | | |
At December 31, 2009, the Company had $1 billion of U.S. tax losses that will expire between 2028 and 2029.
NOTE 19 COMMITMENTS AND CONTINGENCIES
Certain former owners of interests in the upgrading assets retained a 20-year upside financial interest expiring in 2014 which requires payments to them when the average differential between heavy crude oil feedstock and synthetic crude oil exceeds $6.50 per barrel. The calculation is based on a two-year rolling average of the differential. During 2009, the Company capitalized $12 million (2008 — $73 million; 2007 — $84 million) of payments under this arrangement.
At December 31, 2009, the Company had commitments for non-cancellable operating leases and other long-term agreements that require the following minimum future payments:
| | | | | | | | | | | | | | | | | | | | | |
| | | 2010 | | 2011 | | 2012 | | 2013 | | 2014 | | After
2014 | | Total |
Long-term debt and interest | | $ | 211 | | $ | 211 | | $ | 616 | | $ | 185 | | $ | 945 | | $ | 3,093 | | $ | 5,261 |
Operating leases | | | 102 | | | 93 | | | 77 | | | 64 | | | 59 | | | 162 | | | 557 |
Firm transportation agreements | | | 188 | | | 148 | | | 142 | | | 130 | | | 124 | | | 1,413 | | | 2,145 |
Unconditional purchase obligations | | | 2,701 | | | 1,350 | | | 967 | | | 33 | | | 21 | | | 106 | | | 5,178 |
Lease rentals and exploration work agreements | | | 98 | | | 134 | | | 108 | | | 82 | | | 203 | | | 462 | | | 1,087 |
Asset retirement obligations | | | 29 | | | 35 | | | 31 | | | 30 | | | 30 | | | 5,725 | | | 5,880 |
| | | | | | | | | | | | | | | | | | | | | |
| | $ | 3,329 | | $ | 1,971 | | $ | 1,941 | | $ | 524 | | $ | 1,382 | | $ | 10,961 | | $ | 20,108 |
| | | | | | | | | | | | | | | | | | | | | |
The Company is involved in various claims and litigation arising in the normal course of business. While the outcome of these matters is uncertain and there can be no assurance that such matters will be resolved in the Company’s favour, the Company does not currently believe that the outcome of adverse decisions in any pending or threatened proceedings related to these and other matters or any amount which it may be required to pay by reason thereof would have a material adverse impact on its financial position, results of operations or liquidity.
The Company has income tax filings that are subject to audit and potential reassessment. The findings may impact the tax liability of the Company. The final results are not reasonably determinable at this time and management believes that it has adequately provided for current and future income taxes.
PAGE 30
The Terra Nova oil field is divided into three distinct areas, known as the Graben, the East Flank and the Far East. Husky currently holds a combined 12.51% working interest in the field, subject to redetermination. The process of working interest redetermination is before an arbitrator who is expected to make a decision by the third quarter of 2010. The outcome and impact of the arbitration process is not reasonably determinable at this time.
NOTE 20 SHARE CAPITAL
The Company’s authorized share capital is as follows:
Common shares — an unlimited number of no par value.
Preferred shares — an unlimited number of no par value, with no shares outstanding.
Common Shares
Changes to issued share capital were as follows:
| | | | | |
| | | Number of
Shares | | Amount |
December 31, 2006 | | 848,537,018 | | $ | 3,533 |
Options exercised | | 423,292 | | | 18 |
| | | | | |
December 31, 2007 | | 848,960,310 | | | 3,551 |
Options exercised | | 394,500 | | | 17 |
| | | | | |
December 31, 2008 | | 849,354,810 | | | 3,568 |
Options exercised | | 506,125 | | | 17 |
| | | | | |
December 31, 2009 | | 849,860,935 | | $ | 3,585 |
| | | | | |
Stock Options
At December 31, 2009, 49.2 million common shares were reserved for issuance under the Company stock option plan. The stock option plan is a tandem plan that provides the stock option holder with the right to exercise the option or surrender the option for a cash payment. The exercise price of the option is equal to the weighted average trading price of the Company’s common shares during the five trading days prior to the date of the award. When the option is surrendered for cash, the cash payment is the difference between the weighted average trading price of the Company’s common shares on the trading day prior to the surrender date and the exercise price of the option.
Under the terms of the original stock option plan, the options awarded have a maximum term of five years and vest over three years on the basis of one-third per year. Effective February 26, 2007, the Board of Directors approved amendments to the Company’s stock option plan to also provide for performance vesting of stock options. Shareholder ratification was obtained at the Annual and Special Meeting of Shareholders on April 19, 2007. Performance options granted may vest in up to one-third increments if the Company’s annual total shareholder return (stock price appreciation and cumulative dividends on a reinvested basis) falls within certain percentile ranks relative to its industry peer group. The ultimate number of performance options that vest will depend upon the Company’s performance measured over three calendar years. If the Company’s performance is below the specified level compared with its industry peer group, the performance options awarded will be forfeited. If the Company’s performance is at or above the specified level compared with its industry peer group, the number of performance options exercisable shall be determined by the Company’s relative ranking. Stock compensation expense related to the performance options is accrued based on the price of the common shares at the end of the period and the anticipated performance factor. This expense is recognized over the three-year vesting period of the performance options.
PAGE 31
As a result of the special $0.25 per share dividend that was declared in February 2007, a downward adjustment of $0.175 was made to the exercise price of all outstanding stock options effective February 28, 2007, in accordance with the terms of the stock option plan under which the options were issued.
The following options to purchase common shares have been awarded to officers and certain other employees:
| | | | | | | | | | |
| | | Number of
Options
(thousands) | | | Weighted
Average
Exercise
Prices | | Weighted
Average
Contractual
Life (years) | | Options
Exercisable
(thousands) |
December 31, 2006 | | 11,656 | | | $ | 16.40 | | 3 | | 4,463 |
Granted | | 26,926 | | | $ | 41.65 | | 4 | | |
Exercised for common shares | | (423 | ) | | $ | 11.84 | | 1 | | |
Surrendered for cash | | (5,147 | ) | | $ | 13.40 | | 2 | | |
Forfeited | | (2,881 | ) | | $ | 40.41 | | 4 | | |
| | | | | | | | | | |
December 31, 2007 | | 30,131 | | | $ | 37.18 | | 4 | | 4,494 |
Granted | | 7,596 | | | $ | 41.18 | | 5 | | |
Exercised for common shares | | (395 | ) | | $ | 13.65 | | 1 | | |
Surrendered for cash | | (4,132 | ) | | $ | 22.50 | | 1 | | |
Forfeited | | (2,373 | ) | | $ | 41.58 | | 3 | | |
| | | | | | | | | | |
December 31, 2008 | | 30,827 | | | $ | 40.10 | | 3 | | 7,239 |
Granted | | 1,187 | | | $ | 30.32 | | 4 | | |
Exercised for common shares | | (506 | ) | | $ | 12.57 | | — | | |
Surrendered for cash | | (765 | ) | | $ | 13.16 | | — | | |
Forfeited | | (2,344 | ) | | $ | 41.59 | | 2 | | |
| | | | | | | | | | |
December 31, 2009 | | 28,399 | | | $ | 40.78 | | 3 | | 14,917 |
| | | | | | | | | | |
| | | | | | | | | | | | |
As at December 31, 2009 | | Outstanding Options | | Options Exercisable |
Range of Exercise Price | | Number of
Options
(thousands) | | Weighted
Average
Exercise
Prices | | Weighted
Average
Contractual
Life (years) | | Number of
Options
(thousands) | | Weighted
Average
Exercise
Prices |
$16.41 - $24.99 | | 70 | | $ | 23.65 | | 1 | | 70 | | $ | 23.65 |
$25.00 - $29.99 | | 907 | | $ | 29.62 | | 4 | | 72 | | $ | 27.40 |
$30.00 - $34.99 | | 2,034 | | $ | 31.57 | | 4 | | 772 | | $ | 32.10 |
$35.00 - $39.99 | | 999 | | $ | 38.59 | | 2 | | 660 | | $ | 37.89 |
$40.00 - $42.99 | | 20,733 | | $ | 41.59 | | 2 | | 12,099 | | $ | 41.61 |
$43.00 - $45.02 | | 3,656 | | $ | 45.02 | | 4 | | 1,244 | | $ | 45.02 |
| | | | | | | | | | | | |
| | 28,399 | | $ | 40.78 | | 3 | | 14,917 | | $ | 41.08 |
| | | | | | | | | | | | |
Dividends
During 2009, the Company declared dividends of $1.20 per common share (2008 — $1.73 per common share; 2007 — $1.33 per common share). In 2007, declared dividends included a special dividend of $0.25 per common share.
NOTE 21 EMPLOYEE FUTURE BENEFITS
At December 31, 2009, the accrued benefit liability for the post-retirement health and dental care plan in Canada was $50 million. The accrued benefit liabilities for the defined benefit pension plan and the post-retirement welfare plan in the U.S. were $1 million and $30 million respectively. The total employee future benefits liability for the Company included in other long-term liabilities was $81 million at December 31, 2009.
PAGE 32
Canada
The Company currently provides a defined contribution pension plan for all qualified employees. The Company also maintains a defined benefit pension plan, which is closed to new entrants, and all current participants are vested. The Company also provides certain health and dental coverage to its retirees, which is accrued over the expected average remaining service life of the employees.
a) Defined Benefit Pension Plan
Weighted average long-term assumptions are based on independent historical and projected references and are noted below:
| | | | | | |
| | | 2009 | | 2008 | | 2007 |
Discount rate(percent) | | 5.7 | | 6.3 | | 5.0 |
Long-term rate of increase in compensation levels(percent) | | 5.0 | | 5.0 | | 5.0 |
Long term rate of return on plan assets(percent) | | 7.0 | | 7.0 | | 7.5 |
| | | | | | |
The discount rate used at the end of 2009 to determine the accrued benefit obligation was 5.7%.
The long-term rate of return on the assets was determined based on management’s best estimate and the historical rates of return, adjusted periodically. The rate at the end of 2009 was 7.0%.
The status of the defined benefit pension plan at December 31 was as follows:
Benefit Obligation
| | | | | | | | | | | | |
| | | 2009 | | | 2008 | | | 2007 | |
Benefit obligation, beginning of year | | $ | 132 | | | $ | 150 | | | $ | 149 | |
Current service cost | | | 2 | | | | 2 | | | | 2 | |
Interest cost | | | 8 | | | | 8 | | | | 7 | |
Benefits paid | | | (10 | ) | | | (9 | ) | | | (8 | ) |
Actuarial (gains) losses | | | 9 | | | | (19 | ) | | | — | |
| | | | | | | | | | | | |
Benefit obligation, end of year | | $ | 141 | | | $ | 132 | | | $ | 150 | |
| | | | | | | | | | | | |
Fair Value of Plan Assets
| | | | | | | | | | | | |
| | | 2009 | | | 2008 | | | 2007 | |
Fair value of plan assets, beginning of year | | $ | 110 | | | $ | 141 | | | $ | 132 | |
Contributions | | | 5 | | | | 6 | | | | 10 | |
Benefits paid | | | (10 | ) | | | (9 | ) | | | (8 | ) |
Expected return on plan assets | | | 8 | | | | 10 | | | | 10 | |
Gain (loss) on plan assets | | | 6 | | | | (38 | ) | | | (3 | ) |
| | | | | | | | | | | | |
Fair value of plan assets, end of year | | $ | 119 | | | $ | 110 | | | $ | 141 | |
| | | | | | | | | | | | |
PAGE 33
Funded Status of Plan
| | | | | | | | | | | | |
| | | 2009 | | | 2008 | | | 2007 | |
Fair value of plan assets | | $ | 119 | | | $ | 110 | | | $ | 141 | |
Benefit obligation | | | (141 | ) | | | (132 | ) | | | (150 | ) |
| | | | | | | | | | | | |
Excess obligation | | | (22 | ) | | | (22 | ) | | | (9 | ) |
Unrecognized past service costs | | | 2 | | | | 2 | | | | 3 | |
Unrecognized losses | | | 46 | | | | 50 | | | | 32 | |
| | | | | | | | | | | | |
Accrued benefit asset | | $ | 26 | | | $ | 30 | | | $ | 26 | |
| | | | | | | | | | | | |
Husky adheres to a Statement of Investment Policies and Procedures (the “Policy”). The assets are allocated in accordance with the long-term nature of the obligation and comprise a balanced investment based on interest rate and inflation sensitivities. The Policy explicitly prescribes diversification parameters for all classes of investment.
The Company’s actuaries perform valuations annually as at December 31 for the defined benefit pension plan.
The composition of the defined benefit pension plan assets was as follows:
| | | | | | | | | |
| | | 2009 | | | 2008 | | | 2007 | |
U.S. common equities | | — | % | | 1 | % | | 1 | % |
Canadian common equities | | 32 | | | 26 | | | 30 | |
International equity mutual funds | | 21 | | | 23 | | | 27 | |
Canadian government bonds | | 15 | | | 18 | | | 14 | |
Canadian corporate bonds | | 5 | | | 4 | | | 4 | |
International fixed income | | 1 | | | 1 | | | 2 | |
Canadian fixed income mutual funds | | 25 | | | 25 | | | 20 | |
Cash and receivables | | 1 | | | 2 | | | 2 | |
| | | | | | | | | |
Total | | 100 | % | | 100 | % | | 100 | % |
| | | | | | | | | |
During 2009, Husky contributed $5.4 million to the defined benefit pension plan assets, $3.9 million of which was in respect of additional contributions as a result of the plan’s deficiency. Husky currently plans to contribute $9 million in 2010.
The Company amortizes the portion of the unrecognized actuarial gains or losses that exceed 10% of the greater of the accrued benefit obligation or the market-related value of pension plan assets. The market-related value of pension plan assets is the fair value of the assets. The gains or losses that are in excess of 10% are amortized over the expected future years of service, which is currently seven years.
The past service costs are amortized over the expected future years of service.
b) Post-retirement Health and Dental Care Plan
The discount rate used in the calculation of the benefit obligation was 6.0%. The average health care cost trend used was 9% for 2010 and 2011, which is reduced by 0.5% until 2019. The average dental care cost trend used was 4%, which remains constant.
PAGE 34
The status of the post-retirement health and dental care plan at December 31 was as follows:
Benefit Obligation
| | | | | | | | | | | | |
| | | 2009 | | | 2008 | | | 2007 | |
Benefit obligation, beginning of year | | $ | 53 | | | $ | 54 | | | $ | 49 | |
Current service cost | | | 4 | | | | 4 | | | | 4 | |
Interest cost | | | 4 | | | | 3 | | | | 2 | |
Benefits paid | | | (1 | ) | | | (1 | ) | | | (1 | ) |
Actuarial (gains) losses | | | 5 | | | | (7 | ) | | | — | |
| | | | | | | | | | | | |
Benefit obligation, end of year | | $ | 65 | | | $ | 53 | | | $ | 54 | |
| | | | | | | | | | | | |
Funded Status of Plan
| | | | | | | | | | | | |
| | | 2009 | | | 2008 | | | 2007 | |
Benefit obligation | | $ | (65 | ) | | $ | (53 | ) | | $ | (54 | ) |
Unrecognized losses | | | 15 | | | | 10 | | | | 17 | |
| | | | | | | | | | | | |
Accrued benefit liability | | $ | (50 | ) | | $ | (43 | ) | | $ | (37 | ) |
| | | | | | | | | | | | |
The assumed health care cost trend can have a significant effect on the amounts reported for Husky’s post-retirement health and dental care plan. A one percent increase and decrease in the assumed trend rate would have the following effect:
| | | | | | | |
| | | 1% Increase | | 1% Decrease | |
Effect on total service and interest cost components | | $ | 1.7 | | $ | (1.2 | ) |
Effect on post-retirement benefit obligation | | $ | 11.7 | | $ | (9.4 | ) |
| | | | | | | |
c) Pension Expense and Post-retirement Health and Dental Care Expense
The expenses for the years ended December 31 were as follows:
Benefit Obligation
| | | | | | | | | | | | |
| | | 2009 | | | 2008 | | | 2007 | |
Defined benefit pension plan | | | | | | | | | | | | |
Employer current service cost | | $ | 2 | | | $ | 2 | | | $ | 2 | |
Interest cost | | | 8 | | | | 8 | | | | 7 | |
Expected return on plan assets | | | (8 | ) | | | (10 | ) | | | (10 | ) |
Amortization of net actuarial losses | | | 7 | | | | 3 | | | | 3 | |
| | | | | | | | | | | | |
| | | 9 | | | | 3 | | | | 2 | |
Defined contribution pension plan | | | 21 | | | | 20 | | | | 18 | |
| | | | | | | | | | | | |
Total expense | | $ | 30 | | | $ | 23 | | | $ | 20 | |
| | | | | | | | | | | | |
Post-retirement Health and Dental Care Expense
| | | | | | | | | |
| | | 2009 | | 2008 | | 2007 |
Employer current service cost | | $ | 4 | | $ | 4 | | $ | 4 |
Interest cost | | | 4 | | | 3 | | | 2 |
Amortization of net actuarial losses | | | — | | | 1 | | | 1 |
| | | | | | | | | |
Total expense | | $ | 8 | | $ | 8 | | $ | 7 |
| | | | | | | | | |
PAGE 35
d) Future Benefit Payments
The following table discloses the current estimate of future benefit payments:
| | | | | | |
| | | Defined Benefit Pension Plan | | Post-retirement Health
and Dental Care Plan |
2010 | | $ | 9 | | $ | 1 |
2011 | | | 10 | | | 2 |
2012 | | | 10 | | | 2 |
2013 | | | 10 | | | 2 |
2014 | | | 10 | | | 2 |
2015 - 2019 | | | 54 | | | 16 |
United States
a) Defined Benefit Pension Plan
As at December 31, 2009, the benefit obligation was $8 million (2008 — $5 million; 2007 — $1 million) and the fair value of the plan assets was $5 million (2008 — $4 million; 2007 — $1 million). The discount rate used at the end of 2009 to determine the accrued benefit obligation was 5.4% (2008 — 6.0%; 2007 — 6.1%). During 2009, Husky contributed $2 million to the defined benefit pension plan assets and currently plans to contribute $0.5 million in 2010.
Pension expense for 2009 was $3 million (2008 — $2 million; six months ended December 31, 2007 — $1 million).
b) Defined Contribution Pension Plan
The Company’s contribution to the U.S. 401(k) plan was $3.3 million in 2009 (2008 — $2.6 million; 2007 — $0.9 million).
c) Post-retirement Welfare Plan
As at December 31, 2009, the benefit obligation was $11 million (2008 — $13 million; 2007 — $33 million). The discount rate used at the end of 2009 to determine the accrued benefit obligation was 5.4% (2008 — 6.10%; 2007 — 6.25%).
Post-retirement welfare expense for 2009 was a recovery of $2 million (2008 — $3 million expense; six months ended December 31, 2007 — $1.5 million expense).
NOTE 22 RELATED PARTY TRANSACTIONS
On May 11, 2009, the Company issued 5 and 10-year senior notes of U.S. $251 million and U.S. $107 million respectively to management, shareholders and directors. Subsequent to this offering, U.S. $22 million of the 5-year senior notes and U.S. $75 million of the 10-year senior notes issued to related parties were sold to third parties. These notes were offered through an existing base shelf prospectus, which was filed in February 2009. The coupon rates offered were 5.90% and 7.25% for the 5 and 10-year tranches respectively. These transactions were measured at the exchange amount, which was equivalent to the fair market value at the date of the transaction and have been carried out on the same terms as would apply with unrelated parties. At December 31, 2009, the senior notes were included in long-term debt on the Company’s balance sheet.
TransAlta Power, L.P. (“TAPLP”) is under the indirect control of one of Husky’s principal shareholders. TAPLP is a 49.99% owner in TransAlta Cogeneration, L.P. (“TACLP”) which is the Company’s joint venture
PAGE 36
partner for the Meridian cogeneration facility at Lloydminster. The Company sells natural gas to the Meridian cogeneration facility and other cogeneration facilities owned by TACLP. These natural gas sales are related party transactions and have been measured at the exchange amount. For 2009, the total value of natural gas sales to the Meridian and other cogeneration facilities owned by TACLP was $90 million (2008 — $125 million). At December 31, 2009, the total value of accounts receivables related to these transactions was nil (2008 — nil).
NOTE 23 FINANCIAL INSTRUMENTS AND RISK FACTORS
Details of the Company’s significant accounting policies and risk management for the recognition and measurement of financial instruments and the basis for which income and expense are recognized are disclosed in Note 3, “Significant Accounting Policies.”
Risk Management Overview
The Company is exposed to market risks related to the volatility of commodity prices, foreign exchange rates and interest rates. In certain instances, the Company uses derivative instruments to manage the Company’s exposure to these risks. The Company employs risk management strategies and policies to ensure that any exposures to risk are in compliance with the Company’s business objectives and risk tolerance levels. Risk management is ultimately established by the Company’s Board of Directors and is implemented and monitored by senior management within the Company.
Husky is exposed to risk factors associated with operating in developing countries, political and regulatory instability. The Company maintains close contact with governments in the areas within which it operates.
Fair Value of Financial Instruments
The Company’s financial instruments as at December 31, 2009 included cash and cash equivalents, accounts receivable, contribution receivable, bank operating loans, accounts payable and accrued liabilities, long-term debt, contribution payable, the derivative portion of cash flow hedges, the derivative portion of fair value hedges and freestanding derivatives.
The carrying value of cash and cash equivalents, accounts receivable, bank operating loans, accounts payable and accrued liabilities approximates their fair value due to the short-term maturity of these investments.
At December 31, 2009, the carrying value of the contribution receivable and contribution payable was $1.3 billion and $1.5 billion respectively. The fair value of these financial instruments is not readily determinable due to uncertainties regarding timing of the cash flows. Refer to Note 11, “Joint Ventures.”
The derivative portion of cash flow hedges, fair value hedges, and free standing derivatives that are recorded at fair value on a recurring basis have been categorized into one of three categories based upon fair value hierarchy in accordance with CICA Handbook Section 3862. Fair values of assets and liabilities included in Level 1 are determined by reference to quoted prices in active markets for identical assets and liabilities. Assets and liabilities in Level 2 include valuations using inputs other than quoted prices for which all significant outputs are observable, either directly or indirectly. Level 3 valuations are based on inputs that are unobservable and significant to the overall fair value measurement. All of Husky’s assets and liabilities that are recorded at fair value on a recurring basis are included in Level 2.
The financial instruments recorded at fair value on the balance sheet at December 31 are as follows:
| | | | | | | | | |
| | | 2009 | | 2008 | | 2007 |
Financial assets at fair value | | | | | | | | | |
Trading derivatives | | $ | 22 | | $ | 111 | | $ | 22 |
Financial liabilities at fair value | | | | | | | | | |
Trading derivatives | | | 16 | | | 23 | | | 6 |
Long-term debt designated as a fair value hedge | | | 389 | | | — | | | 203 |
PAGE 37
The estimation of the fair value of commodity derivatives incorporates forward prices and adjustments for quality or location. The estimation of the fair value of interest rate and foreign currency derivatives incorporates forward market prices, which are compared to quotes received from financial institutions to ensure reasonability.
The fair value of long-term debt is the present value of future cash flows associated with the debt. Market information such as treasury rates and credit spreads is used to determine the appropriate discount rates. These fair value determinations are compared to quotes received from financial institutions to ensure reasonability. The estimated fair value of long-term debt at December 31 was as follows:
| | | | | | | | | | | | | | | | | | |
| | | 2009 | | 2008 | | 2007 |
| | | Carrying
Value | | Fair
Value | | Carrying
Value | | Fair
Value | | Carrying
Value | | Fair
Value |
Long-term debt | | $ | 3,229 | | $ | 3,559 | | $ | 1,957 | | $ | 1,739 | | $ | 2,814 | | $ | 2,903 |
Market Risk
Market risk is the risk that the fair value of future cash flows of a financial instrument will fluctuate because of changes in market prices. Market risk is comprised of foreign currency risk, interest rate risk and other price risk, for example, commodity price risk. The objective of market risk management is to manage and control market price exposures within acceptable limits, while maximizing returns.
In certain instances, the Company uses derivative commodity instruments to manage exposure to price volatility on a portion of its oil and gas production and firm commitments for the purchase or sale of crude oil and natural gas.
The Company’s results will also be impacted by a decrease in the price of crude oil. The Company holds crude oil inventories that are feedstock or part of the in-process inventories at its refineries. These inventories are subject to a lower of cost or net realizable value test on a monthly basis and the Company is exposed to declining crude prices.
The Company’s results are affected by the exchange rate between the Canadian and U.S. dollar. The majority of the Company’s revenues are received in U.S. dollars or from the sale of oil and gas commodities that receive prices determined by reference to U.S. benchmark prices. An increase in the value of the Canadian dollar relative to the U.S. dollar will decrease the revenues received from the sale of oil and gas commodities. Correspondingly, a decrease in the value of the Canadian dollar relative to the U.S. dollar will increase the revenues received from the sale of oil and gas commodities. The majority of the Company’s expenditures are in Canadian dollars.
A change in the value of the Canadian dollar against the U.S. dollar will also result in an increase or decrease in the Company’s U.S. dollar denominated debt, as expressed in Canadian dollars, as well as the related interest expense. In order to mitigate the Company’s exposure to long-term debt affected by the U.S./Canadian dollar exchange rate, the Company has entered into cash flow hedges using cross currency debt swaps. In addition, a portion of the Company’s U.S. dollar denominated debt has been designated as a hedge of a net investment in a self-sustaining foreign operation and the unrealized foreign exchange gain is recorded in OCI.
To mitigate risk related to interest rates, the Company may enter into fair value hedges using interest rate swaps. The Company’s objectives, processes and policies for managing market risk have not changed from the previous year.
PAGE 38
Commodity Price Risk Management
a) Natural Gas Contracts
At December 31, 2009, the Company had the following third party offsetting physical purchase and sale natural gas contracts, which met the definition of a derivative instrument:
| | | | | | | |
| | | Volumes
(mmcf) | | | Fair
Value | |
Physical purchase contracts | | 34,250 | | | $ | (2 | ) |
Physical sale contracts | | (34,250 | ) | | $ | 5 | |
These contracts have been recorded at their fair value in accounts receivable and accrued liabilities and the resulting unrealized gain of $1 million has been recorded in other expenses in the Consolidated Statements of Earnings and Comprehensive Income.
b) Natural Gas Storage Contracts
At December 31, 2009, the Company had the following third party physical purchase and sale natural gas storage contracts:
| | | | | | |
| | | Volumes
(mmcf) | | | Fair
Value |
Physical purchase contracts | | 9,826 | | | $ | 5 |
Physical sale contracts | | (37,677 | ) | | $ | 8 |
These contracts have been recorded at their fair value in accounts receivable and accrued liabilities and the resulting unrealized loss of $38 million has been recorded in other expenses in the Consolidated Statements of Earnings and Comprehensive Income. The natural gas inventory held in storage is recorded at fair value. At December 31, 2009, the fair value of the inventory was $173 million, resulting in a $69 million unrealized gain recorded in other expenses in the Consolidated Statements of Earnings and Comprehensive Income.
c) Oil Contracts
On July 1, 2009, the Company designated certain crude oil purchase and sale contracts as fair value hedges against the changes in the fair value of the inventory held in storage. The assessment of effectiveness for the fair value hedges excludes changes between current market prices and market prices on the settlement date in the future.
At December 31, 2009, the Company had the following third party crude oil purchase contracts which have been designated as a fair value hedge:
| | | | | |
| | | Volumes
(bbls) | | Fair
Value |
Physical purchase contracts | | 1,518,765 | | $ | 4 |
These contracts have been recorded at their fair value in accounts receivable and the resulting unrealized gain of $4 million has been recorded in earnings in the Consolidated Statements of Earnings and Comprehensive Income. The crude oil inventory held in storage is recorded at fair value. At December 31, 2009, the fair value of the inventory was $124 million, resulting in a $1 million unrealized loss recorded in earnings in the Consolidated Statements of Earnings and Comprehensive Income.
Prior to July 1, 2009, the Company had entered into contracts for future crude oil purchases, whereby there is a requirement to pay the market difference of the inventory price paid at delivery and the current market price at the settlement date in the future. These contracts have settled and the resulting loss of $30 million has been recorded in other expenses in the Consolidated Statements of Earnings and Comprehensive Income.
PAGE 39
Interest Rate Risk Management
At December 31, 2009, the Company had entered into a fair value hedge using interest rate swap arrangements whereby the fixed interest rate coupon on the long-term debt was swapped to floating rates with the following terms:
| | | | | | | | |
Notional Amount | | Swap Maturity | | Swap Rate | | Fair Value | |
| U.S.$100 | | November 15, 2016 | | LIBOR + 420 bps | | $ | (1 | ) |
| U.S.$100 | | September 15, 2017 | | LIBOR + 272 bps | | $ | (1 | ) |
| U.S.$50 | | September 15, 2017 | | LIBOR + 275 bps | | $ | (1 | ) |
| U.S.$125 | | September 15, 2017 | | LIBOR + 255 bps | | $ | (0.5 | ) |
These contracts have been recorded at fair value in other long-term liabilities. As at December 31, 2009, the Company recognized a loss of less than $1 million on the interest rate swap arrangements recorded in interest expense in the Consolidated Statements of Earnings and Comprehensive Income.
The Company had a freestanding derivative that required the payment of amounts based on a floating interest rate of CDOR + 175 bps in exchange for receipt of payments based on a fixed interest rate of 6.95% on $200 million of long-term debt effective February 8, 2002 that expired on July 14, 2009. In 2008, the interest rate swap was discontinued as a fair value hedge as the underlying debt was redeemed. For the year ended December 31, 2009, the Company recognized a loss of less than $1 million (2008 — $3 million gain recorded in interest income, $1 million gain recorded in other expenses) on the interest swap arrangements recorded in other expenses in the Consolidated Statement of Earnings and Comprehensive Income.
Foreign Currency Risk Management
The Company manages its exposure to foreign exchange fluctuations by balancing the U.S. dollar denominated cash flows with U.S. dollar denominated borrowings and other financial instruments. Husky utilizes spot and forward sales to convert cash flows to or from U.S. or Canadian currency.
At December 31, 2009, the Company had a cash flow hedge using the following cross currency debt swaps:
| | | | | | | | | | | | | | |
Debt | | Swap
Amount | | Canadian
Equivalent | | Swap Maturity | | Interest Rate
(percent) | | Fair Value | |
| 6.25% notes | | U.S. $ | 150 | | $ | 211 | | June 15, 2012 | | 7.41 | | $ | (66 | ) |
| 6.25% notes | | U.S. $ | 75 | | $ | 89 | | June 15, 2012 | | 5.65 | | $ | (11 | ) |
| 6.25% notes | | U.S. $ | 50 | | $ | 59 | | June 15, 2012 | | 5.67 | | $ | (6 | ) |
| 6.25% notes | | U.S. $ | 75 | | $ | 88 | | June 15, 2012 | | 5.61 | | $ | (9 | ) |
These contracts have been recorded at fair value in other long-term liabilities. The portion of the fair value of the derivative related to foreign exchange has been recorded in earnings to offset the foreign exchange on the translation of the underlying debt and the remaining gain has been included in OCI. As at December 31, 2009, the unrealized foreign exchange gain of $2 million (2008 — $6 million loss), net of tax of $1 million (2008 — $2 million) is recorded in OCI. At December 31, 2009, the balance in Accumulated Other Comprehensive Income was $7 million (2008 — $10 million), net of tax of $3 million (2008 — $4 million). For the year ended December 31, 2009, the Company recognized a foreign exchange loss of $62 million (2008 — gain of $83 million) on the cross currency debt swaps.
The Company enters into short-dated foreign exchange contracts to fix the exchange rate for conversion of U.S. dollars to Canadian dollars. For the year ended December 31, 2009, the impact of these contracts was a gain of $16 million (2008 — loss of $34 million) recorded in foreign exchange expense.
PAGE 40
As at December 31, 2009, the Company settled its two remaining forward purchases of U.S. dollars realizing a loss of $9 million recorded in other expenses in the Consolidated Statements of Earnings and Comprehensive Income.
Effective July 1, 2007, the Company’s U.S. $1.5 billion of debt financing related to the Lima acquisition was designated as a hedge of the Company’s net investment in the U.S. refining and marketing operations, which are considered self-sustaining. During 2008, the Company repaid U.S. $750 million of bridge financing and repurchased U.S. $63 million of bonds that were classified as a net investment hedge. As at December 31, 2009, the unrealized foreign exchange gain of $104 million (2008 — $165 million loss), net of tax expense of $18 million (2008 — $27 million recovery), arising from the translation of the debt is recorded in OCI.
Effective December 3, 2009, Husky designated U.S. $300 million of the U.S. $750 million senior notes due December 15, 2019 as a hedge for the Company’s net investment in the U.S. refining operations. In 2009, the unrealized foreign exchange gain arising from the translation of the debt was less than $1 million net of tax, which was recorded in OCI.
Sensitivity Analysis
A sensitivity analysis for foreign currency, commodities and interest rate risks has been calculated by increasing or decreasing the interest rate or foreign currency exchange rate, as appropriate, in the fair value methodologies described in the “Fair Value of Financial Instruments” section of this note. These sensitivities represent the effect resulting from changing the relevant rates with all other variables held constant and have been applied only to financial instruments. The Company’s process for determining these sensitivities has not changed during the year. All calculations are on a pre-tax basis.
The Company is exposed to interest rate risk on its interest rate swaps. As at December 31, 2009, had interest rates been 50 basis points higher and assuming all other variables remained constant, the impact to earnings before tax would have been $12 million lower. Had interest rates been 50 basis points lower and assuming all other variables remained constant, the impact to earnings before tax would have been $14 million higher.
The Company is exposed to interest rate and foreign currency risk on its cross currency debt swaps. As at December 31, 2009, had the Canadian dollar been 1% stronger versus the U.S. dollar and assuming all other variables remained constant, the impact to OCI would have been $5 million lower. Had the Canadian dollar been 1% weaker versus the U.S. dollar and assuming all other variables remained constant, the impact to OCI would have been $5 million higher. As at December 31, 2009, had the interest rates been 50 basis points higher and assuming all other variables remained constant, the impact to OCI would have been $2 million higher. Had the interest rates been 50 basis points lower and assuming all other variables remained constant, the impact to OCI would have been $1 million lower.
The Company is exposed to foreign currency risk on its forward purchases of U.S. dollars. As at December 31, 2009, had the Canadian dollar been 1% stronger relative to the U.S. dollar and assuming all other variables remained constant, the impact to earnings before tax would have been less than $1 million lower. Equal and offsetting impacts would have occurred had the Canadian dollar been 1% weaker relative to the U.S. dollar and assuming all other variables remained constant.
The Company is exposed to commodity price risk on its natural gas storage contracts. As at December 31, 2009, had the forward price been $0.20/mmbtu higher, the impact to earnings before tax would have been $7 million lower. Had the forward price been $0.20/mmbtu lower, the impact to earnings before tax would have been $7 million higher.
PAGE 41
Liquidity Risk
Liquidity risk is the risk that the Company will not be able to meet its financial obligations as they become due. The Company’s processes for managing liquidity risk include ensuring, to the extent possible, that it will have sufficient liquidity to meet its liabilities when they become due. The Company prepares annual capital expenditure budgets, which are monitored and are updated as required. In addition, the Company requires authorizations for expenditures on projects to assist with the management of capital.
Since the Company operates in the upstream oil and gas industry, it requires sufficient cash to fund capital programs necessary to maintain or increase production and develop reserves, to acquire strategic oil and gas assets, to repay maturing debt and to pay dividends. The Company’s upstream capital programs are funded principally by cash provided from operating activities and available credit facilities. During times of low oil and gas prices, a portion of capital programs can generally be deferred. However, due to the long cycle times and the importance to future cash flow in maintaining the Company’s production, it may be necessary to utilize alternative sources of capital to continue the Company’s strategic investment plan during periods of low commodity prices. As a result, the Company frequently evaluates the options available with respect to sources of long and short-term capital resources. Occasionally, the Company will hedge a portion of its production to protect cash flow in the event of commodity price declines.
The Company has the following available credit facilities as at December 31, 2009:
| | | | | | |
Credit Facilities | | Available | | Unused |
Operating facilities | | $ | 395 | | $ | 262 |
Syndicated bank facility | | | 1,250 | | | 1,250 |
Bilateral credit facilities | | | 150 | | | 150 |
| | | | | | |
Total | | $ | 1,795 | | $ | 1,662 |
| | | | | | |
In addition to the credit facilities listed above, the Company has unused capacity under shelf prospectuses of U.S. $1.5 billion and $1.0 billion, the availability of which is dependent on market conditions. The Company believes it has sufficient funding through the use of these facilities to meet its future borrowing requirements.
The following are the contractual maturities of financial liabilities as at December 31, 2009:
| | | | | | | | | | | | |
Financial Liability | | Less than
1 Year | | 1 to less than
2 Years | | 2 to less than
5 Years | | Thereafter |
Accounts payable and accrued liabilities | | $ | 2,185 | | $ | — | | $ | — | | $ | — |
Cross currency swaps | | | — | | | — | | | 447 | | | — |
Long-term debt and interest on fixed rate debt | | | 212 | | | 212 | | | 1,750 | | | 3,122 |
| | | | | | | | | | | | |
Total | | $ | 2,397 | | $ | 212 | | $ | 2,197 | | $ | 3,122 |
| | | | | | | | | | | | |
The Company’s contribution payable to the joint venture with BP (refer to Note 11) is payable between December 31, 2009 and December 31, 2015, with the final balance due and payable by December 31, 2015.
The Company’s objectives, processes and policies for managing liquidity risk have not changed from the previous year.
Credit Risk
Credit risk represents the financial loss that the Company would suffer if the Company’s counterparties to a financial instrument, in owing an amount to the Company, fail to meet or discharge their obligation to the Company. The Company’s accounts receivable are broad based with customers in the energy industry, midstream and end user segment and are subject to normal industry risks. The Company’s policy to mitigate credit risk includes granting credit limits consistent with the financial strength of the counterparties and customers,
PAGE 42
requiring financial reassurances as deemed necessary, reducing the amount and duration of credit exposures and close monitoring of all accounts. The Company did not have any customers that constituted more than 10% of total sales and operating revenues during 2009.
The Company’s objectives, processes and policies for managing credit risk have not changed from the previous year.
Cash and cash equivalents include cash bank balances and short-term deposits maturing in less than 90 days. The Company manages the credit exposure related to short-term investments by monitoring exposures daily on a per issuer basis relative to predefined investment limits.
The carrying amount of accounts receivable and cash and cash equivalents represents the maximum credit exposure.
The Company’s accounts receivable excluding income taxes receivable and doubtful accounts was aged as follows:
| | | |
Aging | | Dec. 31, 2009 |
Current | | $ | 908 |
Past due (1 – 30 days) | | | 44 |
Past due (31 – 60 days) | | | 6 |
Past due (61 – 90 days) | | | 4 |
Past due (more than 90 days) | | | 20 |
| | | |
Total | | $ | 982 |
| | | |
The movement in the Company’s allowance for doubtful accounts for 2009 was as follows:
| | | | |
Balance at January 1, 2009 | | $ | 22 | |
Provisions and revisions | | | (4 | ) |
| | | | |
Balance at December 31, 2009 | | $ | 18 | |
| | | | |
The Company did not write off any uncollectible receivables in 2009.
Held-for-Trading Financial Liabilities
The Company’s cross currency swaps have been designated as a cash flow hedge and the derivative component of the hedge meets the definition of a held-for-trading financial liability. The cross currency swap counterparties’ credit profiles have not materially changed since the past year or since inception. As a result, the amount of change during the period and cumulatively in the fair value of the cross currency swaps has not been materially impacted by changes resulting from credit risk. At December 31, 2009, the amount the Company would be contractually required to pay under the cross currency swaps at maturity was $356 million higher (December 31, 2008 — $414 million higher) than their carrying amount.
Embedded Derivative
During the fourth quarter of 2008, a drilling contract previously treated as an embedded derivative no longer met the criteria and the related accounting treatment was discontinued. A loss of $71 million, after tax, was recorded in 2008 compared with a gain of $71 million, after tax, for the same period in 2007.
PAGE 43
NOTE 24 CAPITAL DISCLOSURES
The Company’s objectives when managing capital are: (i) to maintain a flexible capital structure, which optimizes the cost of capital at acceptable risk; and (ii) to maintain investor, creditor and market confidence to sustain the future development of the business.
The Company manages its capital structure and makes adjustments to it in light of changes in economic conditions and the risk characteristics of its underlying assets. The Company considers its capital structure to include shareholders’ equity and debt. To maintain or adjust the capital structure, the Company may, from time to time, issue shares, raise debt and/or adjust its capital spending to manage its current and projected debt levels.
The Company monitors capital based on the current and projected ratios of debt to cash flow from operations (defined as total debt divided by earnings from operations plus non-cash charges before settlement of asset retirement obligations and change in non-cash working capital) and debt to capital employed (defined as total debt divided by total debt and shareholders’ equity). The Company’s objective is to maintain a debt to cash flow from operations ratio of less than two times and a debt to capital employed target of 30% to 40%. At December 31, 2009, debt to capital employed was 18.3% which was below the long-term range, providing the financial flexibility to fund the Company’s capital program and profitable growth opportunities. At December 31, 2009, debt to cash flow from operations was 1.3 times. The ratio may increase at certain times as a result of acquisitions. To facilitate the management of this ratio, the Company prepares annual budgets, which are updated depending on varying factors such as general market conditions and successful capital deployment. The annual budget is approved by the Board of Directors.
The Company’s share capital is not subject to external restrictions; however the bilateral credit facilities and the syndicated credit facility include a debt to cash flow covenant. The Company was fully compliant with this covenant at December 31, 2009.
There were no changes in the Company’s approach to capital management from the previous year.
NOTE 25 GOVERNMENT ASSISTANCE
Husky has government assistance programs in place where it receives funding based on ethanol production and sales from the Lloydminster and Minnedosa ethanol plants from the Department of Natural Resources and the Government of Manitoba. The programs expire in 2015 and applications for funding are submitted quarterly. During 2009, the Company received $53 million under these programs (2008 — $18 million; 2007 — nil), of which $17 million related to funding requested in 2008. The grants received under these programs have been recorded in cost of sales in the Consolidated Statements of Earnings and Comprehensive Income. Under the terms of the programs, funding accepted by the Company could be required to be repaid if certain conditions are not met.
PAGE 44
Document C
Form 40-F
Reconciliation to Accounting Principles Generally Accepted
in the United States
Report of Independent Registered Public Accounting Firm on Reconciliation
to Accounting Principles Generally Accepted in the United States
To the Board of Directors of Husky Energy Inc.
On February 3, 2010, we reported on the consolidated balance sheets of Husky Energy Inc. (“the Company”) as at December 31, 2009, 2008 and 2007 and the consolidated statements of earnings and comprehensive income, changes in shareholders’ equity and cash flows for each of the years in the three-year period ended December 31, 2009 which are included in the annual report on Form 40-F. In connection with our audits of the aforementioned consolidated financial statements, we also have audited the related supplemental note entitled “Reconciliation to Accounting Principles Generally Accepted in the United States” included in the Form 40-F. This supplemental note is the responsibility of the Company’s management. Our responsibility is to express an opinion on this supplemental note based on our audits.
In our opinion, such supplemental note, when considered in relation to the basic consolidated financial statements taken as a whole, presents fairly, in all material respects, the information set forth therein.
|
/s/ KPMG LLP |
KPMG LLP |
Chartered Accountants |
Calgary, Canada |
February 3, 2010 |
PAGE 2
Document C
Form 40-F
Reconciliation to Accounting Principles Generally Accepted in the United States
The Company’s consolidated financial statements have been prepared in accordance with GAAP (Generally Accepted Accounting Principles) in Canada, which differ in some respects from those in the United States. Any differences in accounting principles as they pertain to the accompanying consolidated financial statements were insignificant except as described below:
Consolidated Statements of Earnings
| | | | | | | | | | | | |
| ($ millions, except per share amounts) | | 2009 | | | 2008 | | | 2007 | |
Net earnings under Canadian GAAP(j) | | $ | 1,416 | | | $ | 3,751 | | | $ | 3,201 | |
Adjustments: | | | | | | | | | | | | |
Full cost accounting(a) | | | (17 | ) | | | 22 | | | | 56 | |
Related income taxes | | | 5 | | | | (6 | ) | | | (17 | ) |
Unrealized (gain)/loss on natural gas inventory(h) | | | (45 | ) | | | — | | | | — | |
Related income taxes | | | 13 | | | | — | | | | — | |
Stock-based compensation(d) | | | 7 | | | | (2 | ) | | | (43 | ) |
Related income taxes | | | (2 | ) | | | — | | | | 13 | |
| | | | | | | | | | | | |
Net earnings under U.S. GAAP | | $ | 1,377 | | | $ | 3,765 | | | $ | 3,210 | |
| | | | | | | | | | | | |
Weighted average number of common shares outstanding under U.S. GAAP(millions) | | | | | | | | | | | | |
Basic and diluted | | | 849.7 | | | | 849.4 | | | | 848.4 | |
Earnings per share under U.S. GAAP | | | | | | | | | | | | |
Basic and diluted | | $ | 1.62 | | | $ | 4.43 | | | $ | 3.78 | |
2008 and 2007 amounts as restated for the adoption of a new (Canadian GAAP) accounting policy. Refer to footnote (j).
PAGE 3
Condensed Consolidated Balance Sheets
| | | | | | | | | | | | | | | | | | | | | | | | |
| | | 2009 | | | 2008 | | | 2007 | |
| ($ millions) | | Canadian
GAAP | | | U.S.
GAAP | | | Canadian
GAAP | | | U.S.
GAAP | | | Canadian
GAAP | | | U.S.
GAAP | |
Current assets(h) | | $ | 2,911 | | | $ | 2,866 | | | $ | 3,300 | | | $ | 3,300 | | | $ | 3,034 | | | $ | 3,034 | |
Property, plant and equipment, net(a) | | | 21,254 | | | | 20,886 | | | | 20,839 | | | | 20,487 | | | | 17,805 | | | | 17,431 | |
Other assets(b)(g) | | | 2,130 | | | | 2,131 | | | | 2,347 | | | | 2,335 | | | | 827 | | | | 821 | |
| | | | | | | | | | | | | | | | | | | | | | | | |
| | $ | 26,295 | | | $ | 25,883 | | | $ | 26,486 | | | $ | 26,122 | | | $ | 21,666 | | | $ | 21,286 | |
| | | | | | | | | | | | | | | | | | | | | | | | |
Current liabilities(d)(g) | | $ | 2,185 | | | $ | 2,219 | | | $ | 2,896 | | | $ | 2,927 | | | $ | 3,099 | | | $ | 3,125 | |
Long-term debt(b) | | | 3,229 | | | | 3,255 | | | | 1,957 | | | | 1,975 | | | | 2,073 | | | | 2,093 | |
Other long-term liabilities(d)(g) | | | 2,536 | | | | 2,549 | | | | 2,557 | | | | 2,566 | | | | 918 | | | | 955 | |
Future income taxes(a)(d)(g)(h) | | | 3,932 | | | | 3,778 | | | | 4,713 | | | | 4,576 | | | | 3,948 | | | | 3,797 | |
Share capital(e)(f) | | | 3,585 | | | | 3,819 | | | | 3,568 | | | | 3,802 | | | | 3,551 | | | | 3,785 | |
Retained earnings | | | 10,832 | | | | 10,297 | | | | 10,436 | | | | 9,940 | | | | 8,154 | | | | 7,644 | |
Accumulated other comprehensive income | | | | | | | | | | | | | | | | | | | | | | | | |
Derivatives designated as cash flow hedges, net of tax | | | (8 | ) | | | (8 | ) | | | (10 | ) | | | (10 | ) | | | (4 | ) | | | (4 | ) |
Cumulative foreign currency translation | | | (37 | ) | | | (37 | ) | | | 432 | | | | 432 | | | | (175 | ) | | | (175 | ) |
Hedge of net investment, net of tax | | | 41 | | | | 41 | | | | (63 | ) | | | (63 | ) | | | 102 | | | | 102 | |
Pension obligation(g) | | | — | | | | (30 | ) | | | — | | | | (23 | ) | | | — | | | | (36 | ) |
| | | | | | | | | | | | | | | | | | | | | | | | |
| | $ | 26,295 | | | $ | 25,883 | | | $ | 26,486 | | | $ | 26,122 | | | $ | 21,666 | | | $ | 21,286 | |
| | | | | | | | | | | | | | | | | | | | | | | | |
2008 and 2007 amounts as restated for the adoption of a new (Canadian GAAP) accounting policy. Refer to footnote (j).
Condensed Consolidated Statements of Retained Earnings and Accumulated Other Comprehensive Income
| | | | | | | | | | | | | | | | | | | | | | | | |
| | | 2009 | | | 2008 | | | 2007 | |
| ($ millions) | | Canadian
GAAP | | | U.S.
GAAP | | | Canadian
GAAP | | | U.S.
GAAP | | | Canadian
GAAP | | | U.S.
GAAP | |
Retained earnings, beginning of year(j) | | $ | 10,436 | | | $ | 9,940 | | | $ | 8,154 | | | $ | 7,644 | | | $ | 6,087 | | | $ | 5,572 | |
Net earnings | | | 1,416 | | | | 1,377 | | | | 3,751 | | | | 3,765 | | | | 3,201 | | | | 3,210 | |
Adoption of financial instruments(b)(c) | | | — | | | | — | | | | — | | | | — | | | | 4 | | | | — | |
Adoption of intangible assets(j) | | | — | | | | — | | | | — | | | | — | | | | (9 | ) | | | (9 | ) |
Dividends on common shares | | | (1,020 | ) | | | (1,020 | ) | | | (1,469 | ) | | | (1,469 | ) | | | (1,129 | ) | | | (1,129 | ) |
| | | | | | | | | | | | | | | | | | | | | | | | |
Retained earnings, end of year | | $ | 10,832 | | | $ | 10,297 | | | $ | 10,436 | | | $ | 9,940 | | | $ | 8,154 | | | $ | 7,644 | |
| | | | | | | | | | | | | | | | | | | | | | | | |
Accumulated other comprehensive income, beginning of year | | $ | 359 | | | $ | 336 | | | $ | (77 | ) | | $ | (113 | ) | | $ | — | | | $ | (56 | ) |
Adoption of financial instruments(b)(c) | | | — | | | | — | | | | — | | | | — | | | | (18 | ) | | | — | |
Derivatives designated as cash flow hedges, net of tax | | | 2 | | | | 2 | | | | (6 | ) | | | (6 | ) | | | 14 | | | | 14 | |
Cumulative foreign currency translation | | | (469 | ) | | | (469 | ) | | | 607 | | | | 607 | | | | (175 | ) | | | (175 | ) |
Hedge of net investment, net of tax | | | 104 | | | | 104 | | | | (165 | ) | | | (165 | ) | | | 102 | | | | 102 | |
Pension obligation(g) | | | — | | | | (7 | ) | | | — | | | | 13 | | | | — | | | | 2 | |
| | | | | | | | | | | | | | | | | | | | | | | | |
Accumulated other comprehensive income, end of year | | $ | (4 | ) | | $ | (34 | ) | | $ | 359 | | | $ | 336 | | | $ | (77 | ) | | $ | (113 | ) |
| | | | | | | | | | | | | | | | | | | | | | | | |
2008 and 2007 amounts as restated for the adoption of a new (Canadian GAAP) accounting policy. Refer to footnote (j).
PAGE 4
Condensed Consolidated Statements of Earnings and Comprehensive Income
| | | | | | | | | | | | | | | | | | | | | | |
| | |
| | | 2009 | | | 2008 | | 2007 | |
| ($ millions) | | Canadian
GAAP | | | U.S.
GAAP | | | Canadian
GAAP | | U.S.
GAAP | | Canadian
GAAP | | | U.S.
GAAP | |
Sales and operating revenues (c) | | $ | 15,074 | | | $ | 13,792 | | | $ | 24,701 | | $ | 21,967 | | $ | 15,518 | | | $ | 14,072 | |
Costs and expenses (excluding depletion, depreciation and amortization)(c) (d) | | | 11,070 | | | | 9,826 | | | | 17,523 | | | 14,791 | | | 9,426 | | | | 8,023 | |
Accretion expense | | | 48 | | | | 48 | | | | 54 | | | 54 | | | 47 | | | | 47 | |
Depletion, depreciation and amortization(a) | | | 1,805 | | | | 1,822 | | | | 1,832 | | | 1,810 | | | 1,806 | | | | 1,750 | |
Interest — net | | | 194 | | | | 194 | | | | 147 | | | 147 | | | 130 | | | | 130 | |
| | | | | | | | | | | | | | | | | | | | | | |
Earnings before income taxes | | | 1,957 | | | | 1,902 | | | | 5,145 | | | 5,165 | | | 4,109 | | | | 4,122 | |
Income taxes(a)(d) | | | 541 | | | | 525 | | | | 1,394 | | | 1,400 | | | 908 | | | | 912 | |
| | | | | | | | | | | | | | | | | | | | | | |
Net earnings | | | 1,416 | | | | 1,377 | | | | 3,751 | | | 3,765 | | | 3,201 | | | | 3,210 | |
Other comprehensive income(g) | | | (363 | ) | | | (370 | ) | | | 436 | | | 449 | | | (59 | ) | | | (57 | ) |
| | | | | | | | | | | | | | | | | | | | | | |
Comprehensive income | | $ | 1,053 | | | $ | 1,007 | | | $ | 4,187 | | $ | 4,214 | | $ | 3,142 | | | $ | 3,153 | |
2008 and 2007 amounts as restated for the adoption of a new (Canadian GAAP) accounting policy. Refer to footnote (j).
The increases or decreases noted above refer to the following differences between U.S. GAAP and Canadian GAAP:
| (a) | Under Canadian GAAP the ceiling test is performed by comparing the carrying value of the cost centre based on the sum of the undiscounted cash flows expected from the cost centre’s use and eventual disposition. If the carrying value is unrecoverable the cost centre is written down to its fair value using the expected present value approach of proved plus probable reserves using future prices. Under U.S. GAAP, companies using the full cost method of accounting for oil and gas producing activities perform a ceiling test on each cost centre using discounted estimated future net revenue from proved oil and gas reserves using a discount factor of 10%. Prices used in the U.S. GAAP ceiling tests performed for this reconciliation were those in effect at the applicable year-end or twelve-month average of the first day of each month (“twelve month average”) commencing December 31, 2009. |
At December 31, 2001, the Company recognized a U.S. GAAP ceiling test write down of $334 million after tax. For the year ended December 31, 2009, depletion expense for U.S. GAAP is reduced by $35 million (2008 — $44 million; 2007 — $52 million), before tax of $10 million (2008 — $13 million; 2007 — $16 million).
Under U.S. GAAP, prices used in the reserve determination were those in effect at the applicable year-end or twelve month average commencing December 31, 2009. For Canadian GAAP, forecast prices are used in the reserve determination. The different prices result in a lower reserve base for U.S. GAAP. Additional depletion of $39 million, net of tax of $14 million, was recorded under U.S. GAAP in December 2004. As of the first quarter of 2005 these reserves became economical again. In 2008, the different prices resulted in a lower reserve base for U.S. GAAP and additional depletion of $25 million, net of tax of $8 million was recorded in 2008. As a result of additional depletion recorded in 2004 and 2008 for lower U.S. GAAP reserve base, depletion expense was reduced by $5 million in 2009 (2008 — $3 million; 2007 — $4 million), before tax of $2 million (2008 and 2007 — $1 million).
In 2009, additional depletion of $57 million, before tax of $17 million was recorded due to a lower U.S. GAAP reserve base at December 31, 2009.
| (b) | Effective January 1, 2007, the Company adopted the new Canadian GAAP standards relating to financial instruments. These standards have been adopted prospectively. This new guidance substantially harmonizes Canadian GAAP with U.S. GAAP, with the exception of the treatment of debt issue costs. Under the new |
PAGE 5
| | Canadian GAAP requirements, unamortized debt issue costs are offset against the related long-term debt. Under U.S. GAAP, debt issue costs are deferred in other assets. At December 31, 2009, $26 million (2008 — $18 million) was reclassified from long-term debt to other assets for U.S. GAAP purposes. |
| (c) | Prior to the adoption of the new Canadian standards for financial instruments in 2007, Canadian GAAP differed from U.S. GAAP with regards to natural gas purchase and sales contracts. Under U.S. GAAP, natural gas purchase and sale contracts related to energy trading activities are recorded at fair value in accordance Financial Accounting Standards Board (“FASB”) Accounting Standards Codification (“ASC”) 815, “Derivatives and Hedging.” Previously under Canadian GAAP, the impact of energy trading contracts was recorded as the contracts settled. |
Upon adoption of the new Canadian standards for financial instruments in 2007, natural gas purchase and sale contracts were required to be recorded at fair value. However under U.S. GAAP, unlike Canadian GAAP, these realized purchases and unrealized gains or losses are presented on a net basis against sales and operating revenues.
| (d) | In January 2006, the Company adopted the fair value accounting provisions under FASB ASC 718, “Compensation-Stock Compensation” and FASB ASC 505, “Equity.” Under FASB ASC 718 and 505 awards that are classified as liabilities are re-measured based on the award’s fair value at each reporting date until settlement. Previously awards classified as liabilities were measured at their intrinsic value. The fair value accounting provisions were adopted using the modified prospective application method. |
At December 31, 2009, for U.S. GAAP purposes, the Company recorded an increase to current liabilities of $23 million (2008 — $28 million; 2007 — $17 million) and an increase to long-term liabilities of $8 million (2008 — $11 million; 2007 — $20 million). The Company also recorded an increase to net earnings of $7 million (2008 – decrease of $2 million; 2007 — decrease of $43 million), before tax of $2 million (2008 — less than $1 million; 2007 — $13 million).
Under FASB ASC 718 and 505, the Company is using the Black-Scholes option pricing model to estimate the fair value of the liability related to the options issued under the Company’s tandem plan. The assumptions used in calculating fair value were:
| | | | | | | | | |
| | | 2009 | | 2008 | | 2007 |
Initial expected life(years) | | | 3.5 | | | 3.3 | | | 3.5 |
Expected annual dividend per share | | $ | 1.20 | | $ | 2.00 | | $ | 1.32 |
Range of expected volatilities used(%) | | | 19.7 – 48.4 | | | 35.3 – 73.6 | | | 21.4 – 27.1 |
Weighted-average expected volatility(%) | | | 38.7 | | | 42.1 | | | 25.5 |
Range of risk-free interest rates used(%) | | | 0.1 – 1.9 | | | 0.7 – 1.3 | | | 3.7 – 3.9 |
At December 31, 2009, the total intrinsic value of options exercised during the year was $10 million (2008 — $12 million; 2007 — $13 million), the share-based liability paid for the year was $14 million (2008 — $101 million; 2007 — $151 million). The total fair value of options vested during the year was $20 million (2008 — $32 million; 2007 — $66 million) and the weighted-average grant-date fair value of options granted during the year was $5.64 (2008 — $4.19; 2007 — $5.17).
The weighted average remaining contractual term of options fully vested and currently exercisable is 2.5 years (2008 — 2.9 years; 2007 — 1.6 years). The aggregate intrinsic value of options fully vested and currently exercisable is $1 million (2008 — $24 million; 2007 — $137 million) and the aggregate intrinsic value of options fully vested and expected to vest is $1 million (2008 — $24 million; 2007 — $181 million). The unrecognized compensation cost for 2009 related to non-vested awards is $12 million (2008 — $17 million; 2007 — $51 million) and the weighted average period that these costs will be recognized over is 1.38 years (2008 — 1.3 years; 2007 — 1.6 years).
| (e) | As a result of the reorganization of the capital structure which occurred in 2000, the deficit of Husky Oil Limited of $160 million was eliminated. Elimination of the deficit would not be permitted under U.S. GAAP. |
PAGE 6
| (f) | Until 1997 the Company recorded interest waived on subordinated shareholders’ loans and dividends waived on Class C shares as a reduction of ownership charges. Under U.S. GAAP, waived interest and dividends in those years would be recorded as interest on subordinated shareholders’ loans and dividends on Class C shares and as capital contributions. |
| (g) | FASB ASC 715, “Compensation-Retirement Benefits” requires the Company to recognize the overfunded or underfunded status of a defined benefit postretirement plan as an asset or liability. The funded status is measured as the difference between the fair value of a plan’s assets and its benefit obligations. Changes in this funded status are recognized through comprehensive income in the year in which the change occurs. The additional minimum liability previously recorded under the former authoritative guidance has been eliminated. There is no impact to earnings recognition under the new requirement. |
At December 31, 2009, the underfunded status of the plan recorded to current and other long-term liabilities was $11 million (2008 — $10 million; 2007 — $9 million) and $90 million (2008 — $79 million; 2007 — $54 million), respectively. Other comprehensive income decreased by $9 million (2008 — $13 million; 2007 — $2 million), net of tax of $2 million (2008 — $7 million; 2007 — $1 million).
| (h) | Under Canadian GAAP, natural gas inventory held in storage is recorded at its fair value. Under U.S. GAAP, inventory is recorded at the lower of cost or market. At December 31, 2009, for U.S. GAAP purposes, the Company recorded a decrease to current assets of $45 million to reverse the upward fair value adjustment to inventory recorded under Canadian GAAP. The Company also recorded a decrease to net earnings of $45 million, net of tax of $13 million. |
| (i) | In January 2007, the Company adopted the authoritative guidance for “Accounting for Uncertainty in Income Taxes.” This standard clarifies the accounting for the uncertainty in income taxes recognized in accordance with FASB ASC 740, “Income Taxes.” This standard establishes a two-step process for the evaluation of a tax position taken or expected to be taken in a tax return. The first step recognizes whether or not a tax position is sustainable based on a “more-likely-than-not” determination. If the tax position meets the more-likely-than-not threshold, the second step measures the amount of tax benefit to recognize in the financial statements. The tax position is measured as the largest amount of benefit that is greater than 50% likely of being realized upon ultimate settlement. Husky’s adoption of this authoritative guidance resulted in no adjustments to its tax provision recorded under Canadian GAAP. |
A reconciliation of the beginning and ending amount of unrecognized tax benefits is as follows:
| | | | | | | | | | | |
| | | 2009 | | | 2008 | | | 2007 |
Balance at January 1 | | $ | 78 | | | $ | 30 | | | $ | — |
Gross increases — prior period tax positions | | | 10 | | | | 3 | | | | — |
Gross decreases — prior period tax positions | | | (5 | ) | | | — | | | | — |
Additions based on tax positions related to the current year | | | — | | | | 50 | | | | 30 |
Settlements | | | — | | | | (5 | ) | | | — |
| | | | | | | | | | | |
Balance at December 31 | | $ | 83 | | | $ | 78 | | | $ | 30 |
| | | | | | | | | | | |
Total amount of unrecognized tax benefits that, if recognized, would affect the effective tax rate is $83 million.
The Company does not expect any significant changes to its unrecognized tax benefits within the next 12 month period at this time.
PAGE 7
The following are the tax years which remain subject to examination by major tax jurisdictions:
| | |
Tax Years | | Jurisdiction |
1998 — 2009 | | Federal – Canada Revenue Agency (Alberta and Ontario) |
1999 — 2009 | | Internal Revenue Service — United States |
| (j) | Effective January 1, 2009, the Company retroactively adopted the Canadian Institute of Chartered Accountants (“CICA”) Handbook Section 3064, “Goodwill and Intangible Assets,” which replaced Section 3062 of the same name. Refer to Note 3 of the Company’s December 31, 2009 consolidated financial statements for details. The adoption of this new Canadian standard does not create a US GAAP difference. |
Additional U.S. GAAP Disclosures
Stock Option Plan
In December 2004, the Financial Accounting Standards Board (“FASB”) issued revisions to FASB ASC 718, “Stock Compensation” and FASB ASC 505, “Equity.” This revision requires compensation cost related to share-based payments be recognized in the financial statements and that the cost must be measured based on the fair value of the equity or liability instruments issued. Under FASB ASC 718, all share-based payment plans must be valued using option-pricing models. For U.S. GAAP, the liability related to the options issued under the Company’s tandem plan is measured at fair value using an option pricing model. Under Canadian GAAP, the liability is measured based on the intrinsic value of the option. Over the life of the option the amount of compensation expense recognized will differ under U.S. and Canadian GAAP, creating a temporary GAAP timing difference. At exercise or surrender of the option, the compensation expense to be recorded will be equal to the cash payment, which will be identical under U.S. and Canadian GAAP and there will no longer be a GAAP difference. This revision was effective January 1, 2006.
Depletion, Depreciation and Amortization
Upstream depletion, depreciation and amortization per gross equivalent barrel is calculated by converting natural gas volumes to a barrel of oil equivalent (“boe”) using the ratio of 6 mcf of natural gas to 1 barrel of crude oil (sulphur volumes have been excluded from the calculation). Depletion, depreciation and amortization per boe as calculated under U.S. GAAP for the years ended December 31 were as follows:
| | | | | | | | | |
| | | 2009 | | 2008 | | 2007 |
Depletion, depreciation and amortization per boe | | $ | 12.64 | | $ | 11.39 | | $ | 11.34 |
Employee Future Benefits
The Company’s overall investment strategy is to achieve a balance of fixed income investments. The investment objective is to achieve a long-term total rate of return equal to the long-term interest rate assumption used for going concern funding actuarial valuation.
The target allocations for plan assets are 60 percent equity securities, 35 percent in fixed income investments, and 5 percent to all other types of investments. Equity securities primarily include investments in large-cap and mid-cap companies primarily located in North America. Fixed income securities include corporate bonds of companies from diversified industries, mortgagebacked securities, and Canadian treasuries. Other types of investments include investments in cash and cash equivalents. Over complete market cycles the allocation is expected to approximate the target allocations.
PAGE 8
The fair values of the Company’s plan assets at December 31, 2009 by asset category are as follows:
| | | | | | | | | | | | |
| | | Total | | Level 1
Quoted prices
in active
markets | | Level 2
Significant
Observable
Inputs | | Level 3
Significant
Unobservable
Inputs |
Canadian Equities | | | 38 | | | 38 | | | — | | | — |
International Mutual Funds | | | 26 | | | — | | | 26 | | | — |
Canada Government Bonds | | | 18 | | | — | | | 18 | | | — |
Canada Fixed Income Mutual Funds | | | 30 | | | — | | | 30 | | | — |
Canada Corporate Bonds | | | 5 | | | — | | | 5 | | | — |
International Fixed Income | | | 1 | | | — | | | 1 | | | — |
Cash and Net Receivables | | | 1 | | | — | | | 1 | | | — |
| | | | | | | | | | | | |
Total balance at December 31, 2009 | | $ | 119 | | $ | 38 | | $ | 81 | | $ | — |
| | | | | | | | | | | | |
The Company’s actuaries perform valuations annually as at December 31, 2009 for the defined benefit pension plan. Plan assets are valued at the year-end quoted market prices where available. Where quoted prices are not available, estimated fair values are calculated using comparable securities.
Business Combinations
Throughout 2009, the Company completed several acquisitions of certain oil and gas properties located in key areas such as Northern Alberta, Southern Alberta, Lloydminster, and Red Deer for an aggregate purchase price of $214 million. The acquisitions were accounted for under the acquisition method of accounting in accordance with the revision of FASB ASC 805, “Business Combinations (Revised 2007)” effective January 1, 2009. Accordingly, the Company conducted individual assessments of oil and gas properties acquired and recognized provisional amounts for identifiable assets acquired at their estimated acquisition date fair values, while transaction and integration costs of less than $1 million associated with the acquisitions are expensed as incurred. The net assets acquired were recorded at fair value in property, plant, and equipment totalling $214 million.
Income Tax
As at December 31, 2009, the Company had available tax loss carryforwards in the U.S. jurisdiction of $822 million expiring in 2028 and $178 million expiring in 2029.
Changes in Accounting Policies
TheFASB Accounting Standards Codification
In June 2009, Financial Accounting Standards Board (“FASB”) issued Statement 168, “The FASB Accounting Standards Codification and the Hierarchy of Generally Accepted Accounting Principles.” It sets the Accounting Standards Codification (“ASC”) as the source of authoritative U.S. generally accepted accounting principles. As a result, FASB Statements, Staff Positions, or Emerging Issues Task Force Abstracts will not be issued and instead, Accounting Standards Updates (“ASU”) will be issued by the Board to supplement existing standards with updates, background information, or provide bases for conclusion. The Statement is effective for interim and annual periods ending after September 15, 2009.
Extractive Activities — Oil and Gas
On December 31, 2009, the Company adopted FASB ASU No. 2010-03, “Extractive Activities — Oil and Gas.” This standard redefines constant pricing which requires the use of constant pricing based on a 12 month
PAGE 9
average as opposed to a single-day end of period price. The standard also expands disclosure requirements for equity method investments. This standard resulted in natural gas reserves to be uneconomical as described in Note (a) and additional depletion of $57 million before tax of $17 million was recorded.
Postretirement Benefit Plan Asset Disclosures
On December 15, 2009, the Company adopted the authoritative guidance for “Employers Disclosure about Postretirement Benefit Plan Assets.” This standard requires more detailed disclosure about employer’s plan assets, including employers’ investment strategies, major categories of plan assets, concentration of risk within plan assets, and valuation techniques used to measure the fair value of plan assets, as described above in the additional US GAAP disclosures. The adoption of this standard does not have a material impact on results of operation or the financial position.
Income Taxes
In September 2009, the Company retrospectively applied FASB ASU No. 2009-06, “Income Taxes,” which was effective for interim and annual periods ending after September 15, 2009. The update clarifies whether income taxes paid by the entity are attributable to the entity or its owners and the applicability of uncertain tax positions to a group of entities that comprise taxable and nontaxable entities. The adoption of this update did not impact results of operation or the financial position.
Measuring Liabilities at Fair Value
In August 2009, the Company prospectively adopted FASB ASU No. 2009-05, “Measuring Liabilities at Fair Value.” This provides guidance on the measurement of a financial liability where observable data is not readily available and specifies permitted valuation techniques for fair value measurements of liabilities. The update was effective for the first interim period after issuance. The adoption of this update did not impact results of operation or the financial position.
Subsequent Events
On April 1, 2009, the Company prospectively adopted FASB ASC 855, “Subsequent Events.” The new standard reflects the existing principles of current subsequent events accounting guidance and retains the notion and definition of “available to be issued” financial statements. The new standard requires disclosure of the date through which subsequent events have been evaluated and clarifies that original issuance of financial statements means both “issued” or “available to be issued”. The adoption of this standard did not have a material impact on results of operation or the financial position. Subsequent events were evaluated February 3, 2010.
Business Combinations and Non-Controlling Interests
On January 1, 2009, the Company adopted revisions to FASB ASC 805, “Business Combinations (Revised 2007)” and FASB ASC 810, “Consolidation.”. These standards require the use of fair value accounting for business combinations and non-controlling interests. Equity securities issued as consideration in a business combination will be recorded at fair value as of the acquisition date as opposed to being valued over a period which includes a few days prior to and after the terms of the business combination have been agreed to and announced. In addition, entities will no longer have the ability to capitalize any direct and incremental costs incurred in the business combination. Instead, these transaction costs are expensed. The period of one year to complete the accounting for a business combination remains unchanged. Non-controlling interests, of which Husky has none, will require initial measurement at fair value and will be classified as a separate component of equity. In 2009, the adoption of this standard resulted in additional disclosures on the acquisition of oil and gas properties and transaction costs of less than $1 million to be expensed to the Statement of Earnings.
PAGE 10
New Accounting Standards not yet Implemented
Fair Value Measurements
In January 2010, FASB issued FASB ASU 2010-06, “Fair Value Measurements.” This accounting update will require additional disclosures for transfers in fair value measurements between Level 1 and Level 2 within the fair value hierarchy. This update will also require incremental disclosures for changes in fair value measurements within Level 3 of the fair value hierarchy. The Statement is effective at the beginning of the first interim and annual reporting period after December 15, 2009. We do not expect the adoption of this statement to have a material impact on our results of operations or financial position.
Consolidation of Variable Interest Entities
In June 2009, FASB issued FASB ASU 2009-17, “Consolidation of Variable Interest Entities,” with the addition of entities previously considered qualifying special-purpose entities and eliminates the previous quantitative approach for a qualitative analysis in determining whether the enterprise’s variable interest or interests give it a controlling financial interest in a variable interest entity. The Statement further amends ASC 810, “Consolidation,” to require ongoing reassessments of whether an enterprise is the primary beneficiary of a variable interest entity and requires enhanced disclosures about an enterprise’s involvement in a variable interest entity. The Statement is effective at the beginning of the first annual reporting period after November 15, 2009. We do not expect the adoption of this statement to have a material impact on our results of operations or financial position.
Accounting for Transfers of Financial Assets
In June 2009, FASB issued FASB ASU 2009-16, “Accounting for Transfers of Financial Assets.” This standard removes the exception provided to special-purpose entities for application of FASB ASC 860, “Transfers and Servicing.” The new standard amends the accounting treatment for transfers of financial assets to qualifying special-purpose entities. This standard is effective for the Company at the beginning of the first annual reporting period after November 15, 2009. We do not expect the adoption of this statement to have a material impact on our results of operations or financial position.
PAGE 11
Document D
Form 40-F
MANAGEMENT’S DISCUSSION AND ANALYSIS
February 24, 2010
1.0 Financial Summary
1.1 FINANCIAL POSITION
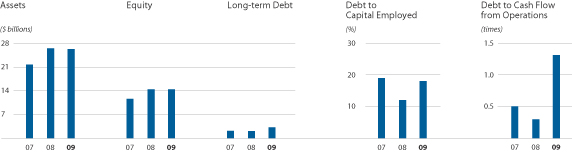
1.2 FINANCIAL PERFORMANCE
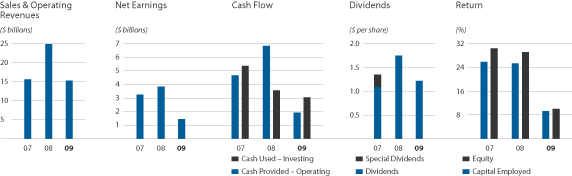
1.3 TOTAL SHAREHOLDER RETURNS
The following table shows the total shareholder returns compared with the Standard and Poor’s and the Toronto Stock Exchange energy and composite indices.
| | | | | | | | | |
| | | Husky
common
shares | | | S&P/
TSX
energy
index | | | S&P/TSX
composite
index | |
2005 | | 77 | % | | 61 | % | | 22 | % |
2006 | | 37 | % | | 3 | % | | 15 | % |
2007 | | 18 | % | | 5 | % | | 7 | % |
2008 | | (28 | )% | | (36 | )% | | (35 | )% |
2009 | | 2 | % | | 35 | % | | 31 | % |
Five year average | | 20 | % | | 14 | % | | 8 | % |
Five year cumulative return | | 102 | % | | 50 | % | | 27 | % |
PAGE 2
1.4 SELECTED ANNUAL INFORMATION
| | | | | | | | | | | | |
($ millions, except where indicated) | | 2009 | | | 2008(1) | | | 2007(1) | |
Sales and operating revenues, net of royalties | | $ | 15,074 | | | $ | 24,701 | | | $ | 15,518 | |
Net earnings by sector | | | | | | | | | | | | |
Upstream | | $ | 1,113 | | | $ | 3,377 | | | $ | 2,596 | |
Midstream | | | 254 | | | | 470 | | | | 521 | |
Downstream | | | 265 | | | | (299 | ) | | | 298 | |
Corporate and eliminations | | | (216 | ) | | | 203 | | | | (214 | ) |
| | | | | | | | | | | | |
Net earnings | | $ | 1,416 | | | $ | 3,751 | | | $ | 3,201 | |
| | | | | | | | | | | | |
Net earnings per share — basic/diluted | | $ | 1.67 | | | $ | 4.42 | | | $ | 3.77 | |
Ordinary dividends per common share | | $ | 1.20 | | | $ | 1.70 | | | $ | 1.16 | |
Cash flow from operations | | $ | 2,507 | | | $ | 5,946 | | | $ | 5,388 | |
Total assets | | $ | 26,295 | | | $ | 26,486 | | | $ | 21,666 | |
Long-term debt including current portion | | $ | 3,229 | | | $ | 1,957 | | | $ | 2,814 | |
Cash and cash equivalents | | $ | 392 | | | $ | 913 | | | $ | 208 | |
Return on equity(percent) | | | 9.8 | | | | 28.9 | | | | 30.1 | |
Return on average capital employed(percent) | | | 9.1 | | | | 25.1 | | | | 25.6 | |
| (1) | 2008 and 2007 amounts as restated for the adoption of a new accounting policy. Refer to Note 4 of the Consolidated Financial Statements. |
2.0 Husky Business Overview
Husky is a Canadian-based international energy and energy-related company with total assets greater than $26 billion and approximately 4,900 staff. Husky is integrated through the three industry sectors: upstream, midstream and downstream.
| | • | | In the upstream sector, the Company explores for, develops and produces crude oil and natural gas(upstream business segment). |
| | • | | In the midstream sector, Husky upgrades heavy crude oil(upgrading business segment), processes and transports via pipeline heavy crude oil, maintains interests in two cogeneration plants as well as markets and operates storage facilities for crude oil and natural gas(infrastructure and marketing business segment). |
| | • | | In the downstream sector, the Company distributes motor fuel and ancillary and convenience products, manufactures and markets asphalt products, produces ethanol and operates two regional refineries in Canada(Canadian refined products business segment) and refines crude oil through interests in two refineries in Ohio and markets refined products in the U.S. Midwest(U.S. refining and marketing business segment). |
3.0 Capability to Deliver Results
Husky’s results are dependent on a number of factors including commodity prices, foreign exchange rates, the Company’s continued success in exploring for oil and natural gas, efficient and safe execution of capital projects and operations, effective marketing, retention of expertise and continued access to the financial markets.
3.1 UPSTREAM
| | • | | Large base of crude oil producing properties in Western Canada that have responded well to the application of increasingly sophisticated exploitation techniques. Enhanced oil recovery (“EOR”) techniques including thermal in-situ recovery methods are extensively used in the mature Western |
PAGE 3
| | Canada Sedimentary Basin to increase recovery rates and stabilize decline rates of heavy and light crude oil. Emerging EOR techniques are being field tested, while techniques that have been in practice for several decades continue to be optimized; |
| | • | | Substantial position in the Alberta oil sands. The initial stages of the development of these assets include the Tucker oil sands project currently in production and the Sunrise project that is in the development phase. The Sunrise project will proceed as a joint 50/50 partnership with BP and is an integral part of a North American oil sands business that includes the BP-Husky Toledo Refinery; |
| | • | | Harsh weather offshore exploration, development and production expertise, as demonstrated by the successful White Rose development and further development of the North Amethyst satellite field offshore Newfoundland. Husky also holds an interest in the Terra Nova field and a large portfolio of significant discovery and exploration licences offshore Newfoundland and Labrador and offshore Greenland; |
| | • | | Increased position in Western Canada gas resource plays with over 925,000 acres associated with several evaluation and development gas resource projects; |
| | • | | Expertise and experience exploring and developing the high impact natural gas potential in the deep basin, foothills, and northwest plains of Alberta and British Columbia; |
| | • | | Large acreage position offshore China that includes a production interest in the Wenchang oil field, natural gas discoveries at the Liwan field in Block 29/26 where development has commenced, significant gas discoveries at the Liuhua 29-1 and 34-2 fields within Block 29/26, and a portfolio of exploration blocks; and |
| | • | | Offshore Indonesia Husky holds two exploration licences. The Madura BD natural gas and natural gas liquids discovery, in which the Company holds a 50% interest, is the current focus for development. |
3.2 MIDSTREAM
| | • | | Reliable heavy oil upgrading facility located in the Lloydminster heavy oil producing region with a throughput capacity of 82 mbbls/day; |
| | • | | Reliable and efficient integrated heavy oil pipeline systems in the Lloydminster producing region; |
| | • | | Participation in two cogeneration power facilities having a combined 295 MW of capacity, both of which are integrated with local plant operations; |
| | • | | Natural gas storage in excess of 33 bcf, owned and leased; |
| | • | | Petroleum marketer balancing the needs of both customers and suppliers; and |
| | • | | Supplier of crude oil and natural gas feedstock for the Company’s plants and facilities. |
3.3 DOWNSTREAM
| | • | | Refinery at Lima, Ohio, and a 50% interest in the BP-Husky Refinery in Toledo, Ohio each with a crude oil throughput capacity of 160 mbbls/day; |
| | • | | Refinery at Prince George, British Columbia with 12 mbbls/day capacity of low sulphur gasoline and ultra low sulphur diesel; |
| | • | | Largest marketer of paving asphalt in Western Canada with a 28 mbbls/day capacity asphalt refinery located at Lloydminster, integrated with the local heavy oil production, transportation and upgrading infrastructure; |
| | • | | Largest producer of ethanol in Western Canada with a combined 260 million litre per year capacity at plants located in Lloydminster, Saskatchewan and Minnedosa, Manitoba; and |
PAGE 4
| | • | | Major regional motor fuel marketer with 473 retail marketing locations including bulk plants and travel centres with strategic land positions in Western Canada and Ontario. Retail outlets include in many cases convenience stores, restaurants, service bays and carwashes. An agreement to purchase 98 retail outlets in 2010 in the southern Ontario region will expand Husky’s retail market. |
3.4 CORPORATE
Husky’s corporate capabilities are discussed in the following sections:
| | • | | Section 8 Liquidity and Capital Resources |
| | • | | Section 11.5 Controls and Procedures |
4.0 Strategic Plan
Husky’s overall strategy is to create superior shareholder value through financial discipline and the development of a quality asset base, including the development of large scale sustainable oil and gas reserves with integration through the value chain.
Husky’s upstream strategy is to exploit oil and gas assets in areas with large scale sustainable growth potential. The Company’s upstream plans include projects in Canada (the Alberta oil sands and the basins offshore Canada’s East Coast), Asia (the South China Sea, the Madura Strait and the East Java Sea), the U.S. Columbia River Basin and offshore Greenland. In addition, the Company will apply enhanced recovery technology to our heavy oil assets as well as continue to expand our exposure to gas resource plays in the Western Canada Sedimentary Basin. In the midstream and downstream sectors, Husky is enhancing performance and maximizing the value chain through integrating its businesses, optimizing plant operations and expanding plant and infrastructure.
Husky’s strategic direction by business segment is as follows:
4.1 UPSTREAM
In Western Canada, Husky will optimize light and medium crude oil production with the application of selected enhanced recovery techniques and continue to focus on selected high impact natural gas plays in the foothills and deep basin portion of Western Canada. The Company is expanding its position in unconventional natural gas exploration and development including shale gas, tight gas, coal bed methane and gas resource plays.
The Company aims to increase heavy oil production through cold production, thermal recovery and other enhanced recovery techniques integrated with downstream processing.
Husky is well positioned in the oil sands with approximately 550,000 net acres of land in the Athabasca and Cold Lake deposits in Alberta, Canada. Husky will continue to optimize and develop the Tucker oil sands project to increase production. The Company, together with its partner BP, is continuing progress on the Sunrise oil sands project with production to be developed in stages; current maximum permitted production being 200 mbbls/day. Husky will continue to evaluate its other oil sands holdings including the Saleski and Caribou projects.
Husky continues to maximize the value of its assets offshore the East Coast of Canada through the development of the White Rose satellite tieback fields and the continuing development of Terra Nova. The Company is also pursuing exploration opportunities and evaluating options to develop natural gas discoveries in the region.
Husky is building a South East Asia business with the development of current resources and a focused exploration plan. The Company has completed a deep water appraisal drilling program at the Liwan natural gas
PAGE 5
discovery offshore China and is proceeding with its development, together with the Liuhua natural gas discoveries. In Indonesia, the Madura BD Indonesia natural gas and natural gas liquids project has completed front end engineering and is awaiting a Production Sharing Contract (“PSC”) extension. Husky will continue exploration in the prospective basins in the South China Sea, the East China Sea and the North East Java Basin.
4.2 MIDSTREAM
Husky will continue to enhance and expand the infrastructure in the Lloydminster area and optimize the integration of the upgrader, pipeline, asphalt refinery, cogeneration and ethanol facilities. Husky will enhance and expand terminalling infrastructure and services to meet the requirements associated with growing bitumen and heavy oil development and will pursue greenhouse gas management strategies including participation in industry initiatives, carbon offset opportunities, sequestration and identification of carbon credit and trading opportunities.
4.3 DOWNSTREAM
Husky will continue to pursue projects to optimize, integrate and reconfigure the Lima, Ohio Refinery for heavy crude oil feedstock and is planning to reconfigure and expand the BP-Husky Toledo, Ohio Refinery to accommodate Sunrise production as its primary feedstock. The Company will also expand terminalling and product storage opportunities.
4.4 FINANCIAL
Husky is committed to maintain its strong financial position to support large capital growth projects and provide shareholders with an enhanced return on their investment. Over the business cycle, the Company intends to maintain a debt to capitalization ratio of less than 40% and maintain debt to cash flow from operations of less than three times. In view of the economic environment, action has been taken to maintain the Company’s strong balance sheet including prudently reduced capital spending in 2009, implementation of cost containment and efficiency programs and managing access to capital markets to enhance liquidity.
5.0 Key Growth Highlights
The 2009 capital program focused mainly on optimizing upstream production, midstream and downstream development and progressing major projects offshore Canada’s East Coast and South East Asia. The 2010 capital budget has been established with the view of maintaining the strength of Husky’s balance sheet and taking advantage of opportunities as economic conditions begin to improve and financial uncertainty abates. Capital expenditures will be focused on those projects offering the highest potential for returns and mid to long-term growth.
5.1 UPSTREAM
East Coast Canada and Greenland
White Rose Development Projects
At the North Amethyst oil field, subsea installation and commissioning commenced on schedule in early June. Modifications to theSea Rose FPSO to accommodate future production from the satellite field were carried out during the vessel’s planned major maintenance turnaround which took place in July and August and development drilling resumed in November 2009. The initial production well and water injection well are expected to be completed and tested during the first quarter of 2010. Production from North Amethyst is targeted to come on stream in the second quarter of 2010.
PAGE 6
Analysis of results from the North Amethyst E-17 exploration well that was drilled in 2008 to the deeper Hibernia formation revealed 55 metres of net oil-bearing reservoir. The resources of the Hibernia formation will be further assessed by reservoir studies and future drilling at both the North Amethyst and White Rose fields.
In November 2009, Husky filed an amended development plan with the Canada-Newfoundland and Labrador Offshore Petroleum Board (“C-NLOPB”) for a two well pilot scheme at the West White Rose field. The proposed staged development plan for West White Rose would initially start with one production well and one water injection well drilled from the existing central drill centre at the main White Rose field. It is expected that this well pair would provide data pertinent to the next phase of the West White Rose development. Subject to receipt of the West White Rose development plan amendment approval, drilling could commence as early as the second quarter of 2010 with completion and first oil by late 2010/early 2011.
East Coast Exploration
Husky continues to evaluate the results of its recently acquired 2,150 square kilometre 3-D seismic program in the Jeanne d’Arc Basin with the objective of identifying additional exploratory well locations that can be drilled in the near-term. During 2009, the Company commenced public consultations on its Environmental Assessment (“EA”) process for future seismic activity offshore Labrador and commenced the EA process for potential seismic acquisition in the Sydney Basin, located between Newfoundland and Cape Breton, Nova Scotia. The programs are planned for the summer/fall of 2010. In January 2010, the Company commenced drilling of the Glenwood exploration prospect (Husky 100%) on Exploration Licence (“EL”) 1090.
Application was made in 2009 for a significant discovery licence based on the results of the December 2008 Mizzen exploration well. Husky has a 35% working interest in the Mizzen well located in the Flemish Pass Basin on EL 1049.
In November 2009, Husky was successful on a bid for the NL09-01 parcel in the Jeanne d’Arc Basin. This parcel consists of approximately 23,600 acres adjacent to the North Amethyst field. Husky is the operator and holds a 72.5% interest in this exploration prospect.
Offshore Greenland
Evaluation of a 7,000 kilometre 2-D seismic program acquired in the third quarter of 2008 on Blocks 5 and 7 is complete. Evaluation of an airborne gravity and magnetics survey that was acquired in the second quarter of 2009 is nearing completion. Husky is the operator and holds an 87.5% interest in these two blocks. Husky also holds a 43.75% working interest in Block 6 where 3,000 kilometres of 2-D seismic was acquired in the third quarter of 2008. In November 2009, Husky completed the acquisition of a 2,200 square kilometre 3-D seismic program over Block 7 and Block 5. This survey is the first 3-D seismic survey conducted offshore Greenland and utilizes a new “Geostreamer” technology.
South East Asia
Offshore China Block 29/26
In 2009, theWest Hercules deep water drilling rig completed drilling and testing three appraisal wells on the Liwan 3-1 field, Block 29/26 in the South China Sea. In November 2009, theWest Hercules drilling rig drilled a significant new natural gas discovery at Liuhua 34-2-1, approximately 20 kilometres to the northeast of the Liwan 3-1 field. The well tested natural gas with high liquids content at an equipment restricted rate of 55 mmcf/day, with indications that future well deliveries could exceed 140 mmcf/day. In February 2010, another significant new gas discovery was confirmed at Liuhua 29-1-1, approximately 43 kilometres to the northeast of the Liwan 3-1 field. The well tested natural gas at an equipment restricted rate of 57 mmcf/day, with indications that future well deliveries could exceed 90 mmcf/day. TheWest Herculesdrilling rig is currently preparing to
PAGE 7
spud the first delineation well on the Liuhua 34-2 discovery. Both Liuhua fields will be tied into the proposed Liwan 3-1 shallow water infrastructure.
The Liwan 3-1 field is the first deep water development in offshore China. Following field delineation of the Liwan 3-1 natural gas field, Husky submitted the Original Gas In-Place (“OGIP”) report to the Government of China in late December and expects to receive approval in early 2010. The Overall Development Plan (“ODP”) is currently being prepared with the aim of submission to the Government of China in the first quarter of 2010. The field, which is located approximately 300 kilometres southeast of Hong Kong, will be developed using a subsea production system connected to a central shallow water platform. A subsea pipeline will transport gas to an onshore gas plant with access to the high demand energy markets of Hong Kong and Guangdong province on the China mainland. Front end engineering design (“FEED”) commenced in the second quarter and was approximately 96% complete at the end of 2009 and is expected to be completed by mid 2010. First production is expected in 2013.
In 2009, theWest Herculesdrilling rig drilled three additional exploration wells on Block 29/26, the Liwan 4-1-1, Liwan 9-1-1 and Liwan 9-1-2, which were abandoned without testing.
Offshore China Exploration
Planning is underway for an exploration well on Block 04/35 in the East China Sea. A rig has been secured and the well is expected to be spud in early 2010. On Block 63/05 in the Qiongdongnan Basin, 50 kilometres south of Hainan Island, existing 2-D seismic has been interpreted and plans are in place to acquire 300 square kilometres of 3-D seismic in the March/April 2010 time frame.
During 2009, an application was made and regulatory approval was obtained to relinquish deepwater Block 29/06 in the Pearl River Mouth Basin, immediately to the east of Block 29/26 together with Blocks 35/18 and 50/14 in the Yinggehai Basin, due to higher than acceptable exploration risk.
Block 39/05 in the Pearl River Mouth Basin, immediately southwest of the Wenchang oil fields, was relinquished following the drilling of the QH-29-2-1 exploration well, which was abandoned without testing.
Indonesia Exploration and Development
The Madura BD field development plan has been approved by the Government of Indonesia and Husky, together with the operator CNOOC, continue to await approval of an extension to the PSC. FEED is 90% complete, and will be completed in the first quarter of 2010. Extension of the PSC is required to further progress development.
During 2009, contracts were awarded for the acquisition and processing of 1,020 kilometres of new 2-D seismic on the North Sumbawa II Block. This data was acquired in December 2009 and will be used to define exploration prospects that are planned for drilling in 2011. Husky holds a 100% interest in the North Sumbawa II Block, comprising 5,000 square kilometres in the East Java Sea.
In the East Bawean II PSC, an application was made to relinquish the block. The application was based on the drilling of two exploration wells, the Adiyasa 1 and Kukura 1, which were abandoned without testing in the third quarter of 2009, and a lack of any other attractive prospects on the block.
Heavy Oil and Oil Sands
Sunrise In-situ Oil Sands Integrated Project
Husky and BP continue to advance the development of the Sunrise project in multiple stages (Husky 50% interest). Bitumen production from phase one (planned at 60 mbbls/day) is expected to commence approximately
PAGE 8
four years after project sanction planned in 2010. Total gross production is currently planned to ramp up to 200 mbbls/day, subject to project sanction and market conditions. Work on optimization to simplify its scope was completed at the end of 2009. With FEED completed and regulatory approval for the amended design in place, Husky is preparing to issue requests for proposals for the central plant and field facilities.
Tucker In-situ Oil Sands Project
Husky continues to pursue operational strategies to achieve full implementation of the SAGD process in this reservoir. The majority of the wells in the project are in steady state SAGD operational mode and production rates were approximately 5 mbbls/day at the end of the year. During the first half of 2009, the full implementation of the steam chamber development plan was delayed due to low oil prices. With improving crude oil prices in the second half of 2009, drilling of three new well pairs commenced in December 2009 and are expected to be injecting steam by the third quarter of 2010. Regulatory applications are proceeding for additional drilling in 2010.
McMullen
Husky’s development of the McMullen property, which is located in the west central region of the Athabasca oil sands of northern Alberta, involves a cold production project and plans for a thermal pilot project. In the fourth quarter of 2009, Husky completed and tied in a 13 well program previously drilled at the cold production project. An additional 13 wells were drilled in the fourth quarter and are being completed and equipped for start up in February 2010.
Pikes Peak South
Husky is progressing with an extension of its Pikes Peak South heavy oil thermal project. Pikes Peak South has a design capacity of 8,000 boe/day with first production planned for 2012.
Non-Thermal EOR
In the Lloydminster heavy oil producing area, Husky continues to test various non-thermal enhanced recovery techniques. Operations continue at the Company’s first cold enhanced pilot project where six successful injection/production cycles have been completed. Husky’s second pilot project, which utilizes CO2, commenced during the second quarter of 2009 and continued to operate to the end of 2009 with promising initial results. Both pilots continue to provide insight into reservoir response and process economics.
Western Canada and USA (excluding Heavy Oil and Oil Sands)
Gas Resource Plays
Husky has increased its exposure to gas resource plays within the Western Canada Sedimentary Basin that have the potential to deliver significant volumes of low cost gas in the coming years. Husky currently has over 925,000 acres associated with several gas resource projects in various stages of evaluation and development. These include established assets at Bivouac (625,000 acres) and Ansell (115,000 acres), in addition to a number of emerging projects including the Montney formation and the Horn River Basin. In 2009, Husky added over 89,000 acres of new lands to its gas resource play portfolio.
In October 2009, Husky acquired a 50% working interest in 36 drilling spacing units with rights in the Doig and Montney formations. With this acquisition, Husky’s combined holdings total approximately 25,000 acres in this resource play located in the Cypress area of Northeast British Columbia, which is largely characterized by shale gas reservoirs. Husky is currently participating in a horizontal exploration well on an adjacent section and further drilling is contingent on the results of this well.
PAGE 9
During 2009, Husky tied in 55 gross (27.5 net) coal bed methane producing wells in the Elnora/Trochu area. Husky intends to continue with its coal bed methane program in 2010 with plans to tie in 8 gross (4 net) wells drilled in the fourth quarter, and recomplete 15 gross (7.5 net) shut-in conventional natural gas wells in the Horseshoe Canyon coal formation.
Northeastern British Columbia & Washington State Exploration
In the Bullmoose — Sukunka region of Northeastern British Columbia, Husky is participating in the Belcourt formation exploration well (42% Working Interest “WI”) that will follow-up the Burnt River c-A61-A (55% WI) and the Sukunka a-27-F (20% WI) wells, which are capable of producing at gross rates in excess of 30 mmcf/day. Both the Burnt River and Sukunka wells were placed on production in early October at a combined rate of 15 to 25 mmcf/day net Husky raw gas rate depending on processing capacity availability.
The drilling of the Grey 31-23 well in the Columbia River Basin in Washington State was completed in 2009. The well yielded fresh water and only minor gas from the Oligocene aged sands. Husky is currently evaluating its Columbia River Basin holding in excess of 1.7 million gross acres of largely gas prone tight sandstone reservoirs to identify further drilling opportunities. The results from the Grey 31-23 well will be incorporated into this study. Husky holds up to a 50% working interest in this area.
Alkaline Surfactant Polymer Floods
Husky’s Alkaline Surfactant Polymer (“ASP”) enhanced oil recovery program continues to advance. Currently the program includes ASP developments at Fosterton and Bone Creek, Saskatchewan and operating ASP projects at Gull Lake, Saskatchewan and Warner and Crowsnest, Alberta. In addition, Husky holds a 20.3% non-operating working interest in the Instow, Saskatchewan ASP flood, in which oil response continues to increase in line with expectations. The Warner chemical injection has been increased following the successful drilling of two infill wells in 2009. The polymer injection is expected to continue through to 2012. Husky completed the Alkaline Surfactant portion of the injection scheme at the Crowsnest project in December 2009. Incremental recovery continues to increase according to plan at both floods. At Gull Lake, the ASP facility is fully operational and the project was completed on schedule. Surfactant was added to the injected fluids in December 2009 and the facility is pumping at full capacity. The Fosterton ASP reservoir and detailed facility design progressed throughout 2009 and is near completion. Upon project approval, the facility long lead equipment will be ordered in 2010. Facility construction will commence in early 2011 with an expected start up in late 2011. Husky is the operator and holds a 62.4% working interest in this project.
5.2 MIDSTREAM
Husky completed construction and commissioning of two 300,000 barrel tanks at Hardisty. Husky also completed connections from the Hardisty terminal to the new Keystone pipeline.
5.3 DOWNSTREAM
Lima, Ohio Refinery
An engineering evaluation has been completed on the reconfiguration of the Lima Refinery that is intended to increase processing capacity of heavier, less costly, crude oil feedstock to enhance margins and increase flexibility in product outputs. Implementation of this project on a phased basis is being evaluated to maximize capital spending efficiency and provide a hedge against uncertain market conditions. As proposed, the project would increase capacity to 170 mbbls/day crude charge, 105 mbbls/day of which would be heavy crude oil. The project is currently on hold pending an improvement in the light/heavy crude oil differential.
PAGE 10
Toledo, Ohio Refinery
Husky and its partner, BP, have announced the sanction of the Continuous Catalyst Regeneration Reformer Project at the Toledo, Ohio refinery. The project will improve the efficiency and competitiveness of the refinery by reducing energy consumption and lowering operating costs with the replacement of two naphtha reformers and one hydrogen plant with one 42,000 bbls/day continuous catalyst regeneration reformer system plant.
An evaluation of the reposition of the refinery to process bitumen from the first two phases of the Sunrise oil sands integrated project is underway. Due to the integrated nature of this project, progress will coincide with the upstream development requirements. The refinery continues to advance a multi-year program to improve operational integrity and plant performance and reduce operating costs and environmental impacts.
Retail
In December 2009, Husky entered into an agreement to purchase 98 retail outlets in the southern Ontario region. The first site will be transferred to Husky in March 2010, with the remaining sites transferred between April and November 2010.
6.0 The 2009 Business Environment
6.1 BUSINESS RISK FACTORS
Husky’s results of operations are significantly influenced by the global and domestic business environment. Some risk factors are entirely beyond the Company’s influence and others can, to some extent, be strategically managed. Husky has implemented appropriate risk management processes to manage these risks. Salient risk factors include:
| | • | | the demand for the Company’s products and the prices the Company receives for crude oil and natural gas production and refined petroleum products; |
| | • | | the economic conditions of the markets in which Husky conducts business; |
| | • | | the exchange rate between the Canadian and U.S. dollar; |
| | • | | the ability to replace reserves of oil and gas, whether sourced from exploration, improved recovery or acquisitions; |
| | • | | the availability of prospective drilling rights; |
| | • | | the costs to acquire exploration rights, undertake geological studies, appraisal drilling and project development; |
| | • | | the availability and cost of labour, material and equipment to efficiently, effectively and safely undertake capital projects; |
| | • | | the costs to operate properties, plants and equipment in an efficient, reliable and safe manner; |
| | • | | potential actions of governments, regulatory authorities and other stakeholders that may impose operating costs or restrictions in the jurisdictions where the Company has operations; |
| | • | | prevailing climatic conditions in the Company’s operating locations; |
| | • | | changes to royalty regimes; |
| | • | | regulations to deal with climate change issues; |
| | • | | changes to government fiscal, monetary and other financial policies; |
| | • | | the competitive actions of other companies, including increased competition from other oil and gas companies; |
PAGE 11
| | • | | business interruptions because of unexpected events such as fires, blowouts, freeze-ups, equipment failures and other similar events affecting Husky or other parties whose operations or assets directly or indirectly affect Husky and that may or may not be financially recoverable; |
| | • | | the inability to obtain regulatory approvals to operate existing properties or develop significant growth projects; |
| | • | | the inability to reach the Company’s estimated production levels from existing and future oil and gas development projects as a result of technological or commercial difficulties or other risk factors; |
| | • | | changes in workforce demographics; |
| | • | | the cost and availability of capital, including access to capital markets at acceptable rates; and |
| | • | | other financial risks as described in Section 8.6. |
6.2 ECONOMIC SENSITIVITIES
Average Benchmarks
| | | | | | | | |
| | | 2009 | | 2008 | | 2007 |
Upstream | | | | | | | | |
WTI crude oil | | (U.S. $/bbl) | | 61.80 | | 99.65 | | 72.31 |
Brent crude oil | | (U.S. $/bbl) | | 61.54 | | 96.99 | | 72.52 |
Canadian light crude 0.3% sulphur | | ($/bbl) | | 66.19 | | 102.84 | | 77.07 |
Lloyd heavy crude oil @ Lloydminster | | ($/bbl) | | 53.60 | | 72.44 | | 40.75 |
NYMEX natural gas | | (U.S. $/mmbtu) | | 3.99 | | 9.04 | | 6.86 |
NIT natural gas | | ($/GJ) | | 3.92 | | 7.70 | | 6.26 |
| | | | |
Midstream heavy crude oil upgrading | | | | | | | | |
WTI/Lloyd crude blend differential | | (U.S. $/bbl) | | 9.93 | | 20.38 | | 23.81 |
| | | | |
Downstream | | | | | | | | |
New York Harbor 3:2:1 crack spread | | (U.S. $/bbl) | | 8.33 | | 9.96 | | 14.15 |
Chicago 3:2:1 crack spread | | (U.S. $/bbl) | | 8.43 | | 11.17 | | 17.68 |
| | | | |
Cross segment | | | | | | | | |
U.S./Canadian dollar exchange rate | | (U.S. $) | | 0.880 | | 0.937 | | 0.931 |
As an integrated producer, Husky’s profitability is largely determined by realized prices for crude oil and natural gas and refinery processing margins including the effect of changes in the U.S./Canadian dollar exchange rate. All of Husky’s crude oil production and the majority of its natural gas production receive the prevailing market price. The price for crude oil is determined largely by global factors and is beyond the Company’s control. The price for natural gas is determined more by the North America fundamentals since virtually all natural gas production in North America is consumed by North American customers, predominantly in the United States. Weather conditions also exert a dramatic effect on short-term supply and demand.
The midstream and downstream segments are also heavily impacted by the price of crude oil and natural gas. The largest cost factor in the midstream — upgrading business segment is the heavy crude oil feedstock, which is processed into light synthetic crude oil. The largest cost factors in the downstream sector are crude oil feedstock and processing costs. Husky’s U.S. refining operations process a mix of different types of crude oil from various sources but are primarily light sweet crude oil at Lima and approximately 60% heavy crude oil feedstock at Toledo. The Company’s refined products business in Canada relies primarily on purchased refined products for resale in the retail distribution network. Refined products are acquired from other Canadian refiners at rack prices or exchanged with production from the Husky Prince George refinery.
PAGE 12
Crude Oil
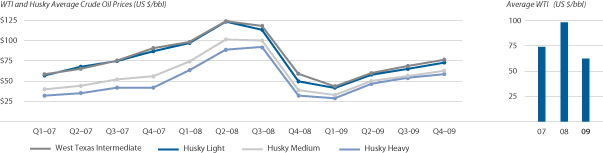
The price Husky receives for production from Western Canada is primarily driven by changes in the price of West Texas Intermediate (“WTI”) while the majority of the Company’s production offshore the East Coast of Canada is referenced to the price of Brent, an imported light sweet benchmark crude oil produced in the North Sea. The price of WTI ended 2009 at U.S. $79.36/bbl recovering from U.S. $44.60/bbl on December 31, 2008, and averaged U.S. $61.80/bbl in 2009 compared with U.S. $99.65/bbl in 2008. In the last three years, WTI peaked to a high of U.S. $145.29/bbl in July 2008 and dropped to a low of U.S. $33.87/bbl in December 2008. The price of Brent ended 2009 at U.S. $77.67/bbl, recovering from U.S. $36.55/bbl on December 31, 2008, and averaged U.S. $61.54/bbl in 2009 compared with U.S. $96.99/bbl in 2008.
A portion of Husky’s crude oil production is classified as either heavy crude oil or bitumen, which trades at a discount to light crude oil. In 2009, 47% of Husky’s crude oil production was heavy crude oil or bitumen compared with 42% in 2008. The light/heavy crude oil differential averaged U.S. $9.93 or 16% of WTI in 2009 compared with U.S. $20.38 or 20% of WTI in 2008.
Natural Gas
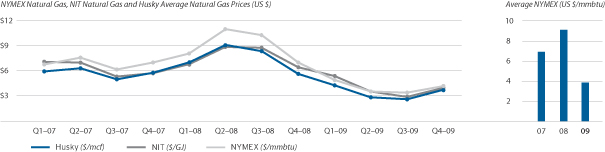
The near-month natural gas prices at NYMEX ended 2008 at U.S. $5.62/mmbtu and subsequently declined to less than U.S. $3.00/mmbtu by the end of August 2009 and then increased to U.S. $5.57/mmbtu at the end of 2009, averaging U.S. $3.99/mmbtu during 2009. In the last three years, natural gas prices peaked to a high of U.S. $13.58/mmbtu in July 2008 and dropped to a low of U.S. $2.51/mmbtu in September 2009. The average in 2008 was U.S. $9.04/mmbtu. During most of 2009, natural gas inventory in underground storage in the United States was higher than historical levels.
PAGE 13
Foreign Exchange
The majority of the Company’s revenues from the sale of oil and gas commodities receive prices determined by reference to U.S. benchmark prices. The majority of the Company’s expenditures are in Canadian dollars. A decrease in the value of the Canadian dollar relative to the U.S. dollar increases the revenues received from the sale of oil and gas commodities. Correspondingly, an increase in the value of the Canadian dollar relative to the U.S. dollar will decrease the revenues received from the sale of oil and gas commodities.
The Canadian dollar ended 2008 at U.S. $0.817 and subsequently strengthened by 17% against the U.S. dollar during 2009, closing at U.S. $0.956 at December 31, 2009. In 2009, the Canadian dollar averaged U.S. $0.880 compared with U.S. $0.937 during 2008.
Refining Crack Spreads
The 3:2:1 refining crack spread is the key indicator for refining margins as refinery gasoline output is approximately twice the distillate output. This crack spread is equal to the price of two-thirds of a barrel of gasoline plus one-third of a barrel of fuel oil (distillate) less one barrel of crude oil. Market crack spreads are based on quoted near-month contracts for WTI and spot prices for gasoline and diesel, and do not necessarily reflect the actual crude purchase costs or product configuration of a specific refinery. Each refinery has a unique crack spread depending on several variables. Realized refining margins are affected by the product configuration of each refinery and by the time lag between the purchase and delivery of crude oil feedstock which is accounted for on a first in first out (“FIFO”) basis in accordance with Canadian Generally Accepted Accounting Principles (“GAAP”).
The New York Harbor 3:2:1 refining crack spread is a benchmark and is calculated as the difference between the price of a barrel of WTI crude oil and the sum of the price of two thirds of a barrel of reformulated gasoline and the price of one third of a barrel of heating oil. The Chicago 3:2:1 refining crack spread is calculated using WTI, regular unleaded gasoline and low sulphur diesel. During 2009, the New York Harbor 3:2:1 refining crack spread averaged U.S. $8.33/bbl compared with U.S. $9.96/bbl in 2008. During 2009, the Chicago crack spread averaged U.S. $8.43/bbl compared with U.S. $11.17/bbl in 2008.
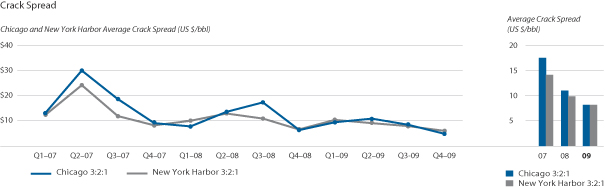
U.S. $8.33/bbl compared with U.S. $9.96/bbl in 2008. During 2009, the Chicago crack spread averaged U.S. $8.43/bbl compared with U.S. $11.17/bbl in 2008.
During 2009, the 3:2:1 crack spreads were lower than 2008 reflecting the continuing weak U.S. economic environment which has resulted in reduced demand for transportation fuels and resulted in high inventory and weak margins.
PAGE 14
Cost Environment
The oil and gas industry experienced an increase in costs in excess of the general rate of inflation during the recent years of increasing energy prices. These increases affect the cost of operating the Company’s oil and gas properties, processing plants and refineries. They also affect capital projects which are susceptible to cost volatility. In the latter half of 2008, the oil and gas industry experienced significant decreases in commodity prices, while the cost environment continued to reflect the previous economic environment. In the third quarter of 2009, the cost environment began to partially reflect the decline in energy commodity prices and the effect of the current economic conditions.
Reserves
The Company’s ability to generate cash flows is dependent, among other factors, on the ability to replace existing reserves. If Husky fails to find or acquire additional crude oil and natural gas reserves, its reserves and production will decline materially from their current levels and, therefore, its cash flows are highly dependent upon successfully exploiting current reserves and acquiring, discovering or developing additional reserves.
Global Economic and Financial Environment
In the wake of the economic downturn, world oil consumption declined and commercial inventories of crude oil are above average historical levels. The Energy Information Administration’s (“EIA”) February 10, 2010 Short-term Energy Outlook(1) indicates that world oil consumption declined by 1.7 mmbbls/day in 2009 compared with the previous year, reflecting 2.15 mmbbls/day in OECD countries partially offset by increased consumption in non-OECD countries, particularly China. The EIA has revised its projected global consumption due to higher than expected Asian consumption in December. The EIA now expects oil consumption to increase in 2010 by 1.2 mmbbls/day and 1.6 mmbbls/day in 2011 compared with 2009. Growth of oil consumption in 2010 is expected to result primarily from resurgence in the global economy. Non-OECD countries are expected to account for most of the increase in 2010. China continues to lead world consumption growth with projected increases of consumption of 0.44 mmbbls/day in 2010 and 0.47 mmbbls/day in 2011. The EIA estimated non-OPEC supply of crude oil averaged 50.2 mmbbls/day in 2009, up approximately 0.58 mmbbls/day compared with 2008. Most of the increase was from the United States, South America and the Former Soviet Union partially offset by lower production from the North Sea and Mexico. OPEC production was 29.1 mmbbls/day in 2009, down 2.2 mmbbls/day from the previous year. OPEC spare productive capacity is currently estimated at 5.0 mmbbls/day, primarily in Saudi Arabia. The EIA expects OPEC supply to trend upward in 2010 to average 29.5 mmbbls/day and 29.9 mmbbls/day in 2011, in line with increased demand.
Demand for natural gas in North American markets has also retracted in line with lower industrial and commercial consumption; as a result, working gas in storage has averaged above five year levels. In its February 12, 2010(2) release the EIA reported that natural gas stocks in 2009 were 2,215 bcf, 8.4% above the previous year and 5.4% above the five year average. The EIA estimates a 1.7% decline in natural gas consumption in 2009 and forecasts a consumption increase of 0.4% in 2010 and 0.4% in 2011 as the industrial sector increases activity. The EIA estimates that natural gas production in 2009 increased by 3.8% compared with the previous year and forecasts a decrease of 2.6% in 2010 followed by an increase of 1.3% in 2011. The EIA estimates pipeline imports declined by 1.1 bcf/day or 11.1% during 2009 due to declining production from Canada and expects this trend to continue with reduced natural gas imports of more than 0.7 bcf/day in 2010. The EIA estimates 2009 liquefied natural gas (“LNG”) imports at 1.3 bcf/day compared with 1.0 bcf/day in 2008 and forecasts 1.8 bcf/day in 2010. The EIA expects U.S. LNG imports will increase as supply increases from Russia, Yemen, Qatar and Indonesia.
In its February 10th outlook the EIA estimates that fuel consumption in the United States in 2009 fell by 820 mbbls/day or 4.2% including 330 mbbls/day or 8.4% of diesel fuel and 130 mbbls/day or 8.6% of jet fuel. Consumption of motor gasoline is expected to increase marginally by 0.1% as lower gasoline prices have
PAGE 15
partially offset the effects of lower economic activity. The EIA’s February 10th outlook expects a 180 mbbls/day or 0.9% increase in fuel consumption in 2010. According to the EIA data released on February 12, 2010, U.S. gasoline stocks were 230.4 mmbbls, 12.8 mmbbls higher than the previous year; U.S. distillate stocks were 156.2 mmbbls, 14.6 mmbbls higher than the previous year.
The current prospect that demand for energy will increase in 2010 depends on a number of assumptions about the timing and sustainability of a global economic recovery.
Companies with low operating costs and flexible capital expenditure plans, strong cash generation from operations, available cash, low debt with long maturities and unused committed credit facilities will be better positioned to manage through adverse economic conditions.
In view of the economic environment, Husky took action in the latter half of 2008 and prudently reduced capital spending in 2009 and continues to review and implement cost containment and efficiency opportunities throughout the organization. Husky’s cash position, credit facilities and access to debt capital markets provide adequate liquidity to meet the Company’s needs at present, and the Company continues to examine ways of enhancing its access to capital on an ongoing basis.
Note:
| (1) | Energy Information Administration, Short-Term Energy Outlook DOE/EIA — February 10, 2010 Release |
| (2) | “This Week in Petroleum”, February 12, 2010, Energy Information Administration U.S. Department of Energy |
6.3 SENSITIVITIES BY SEGMENT FOR 2009 RESULTS
The following table is indicative of the relative annualized effect on pre-tax cash flow and net earnings from changes in certain key variables in 2009. The table below shows what the effect would have been on 2009 financial results had the indicated variable increased by the notional amount. The analysis is based on business conditions and production volumes during 2009. Each separate item in the sensitivity analysis shows the effect of an increase in that variable only; all other variables are held constant. While these sensitivities are applicable for the period and magnitude of changes on which they are based, they may not be applicable in other periods, under other economic circumstances or greater magnitudes of change.
| | | | | | | | | | | | | | | | | | |
Sensitivity Analysis | | 2009
Average | | Increase | | Effect on Pre-tax
Cash Flow(5) | | | Effect on Net Earnings (5) | |
| | | | | | | ($ millions) | | | ($/share) (6) | | | ($ millions) | | | ($/share) (6) | |
Upstream and Midstream | | | | | | | | | | | | | | | | | | |
WTI benchmark crude oil price(1) | | $ | 61.80 | | U.S. $ | 1.00/bbl | | 75 | | | 0.09 | | | 53 | | | 0.06 | |
NYMEX benchmark natural gas price(2) | | $ | 3.99 | | U.S. $ | 0.20/mmbtu | | 25 | | | 0.03 | | | 18 | | | 0.02 | |
WTI/Lloyd crude blend differential(3) | | $ | 9.93 | | U.S. $ | 1.00/bbl | | (13 | ) | | (0.02 | ) | | (10 | ) | | (0.01 | ) |
Downstream | | | | | | | | | | | | | | | | | | |
Canadian light oil margins | | $ | 0.040 | | Cdn $ | 0.005/litre | | 14 | | | 0.02 | | | 10 | | | 0.01 | |
Asphalt margins | | $ | 17.35 | | Cdn $ | 1.00/bbl | | 8 | | | 0.01 | | | 6 | | | 0.01 | |
New York Harbor 3:2:1 crack spread(4) | | $ | 8.33 | | U.S. $ | 1.00/bbl | | 80 | | | 0.09 | | | 51 | | | 0.06 | |
Consolidated | | | | | | | | | | | | | | | | | | |
Exchange rate (U.S. $ per Cdn $)(1) | | $ | 0.880 | | U.S. $ | 0.01 | | (56 | ) | | (0.07 | ) | | (39 | ) | | (0.05 | ) |
Interest rate | | | | | | 100 basis points | | (2 | ) | | — | | | (1 | ) | | — | |
| (1) | Does not include gains or losses on inventory. |
| (2) | Includes decrease in earnings related to natural gas consumption. |
| (3) | Excludes impact on asphalt operations. |
| (4) | Relates to U.S. Refining & Marketing. |
| (5) | Excludes mark to market accounting impacts. |
| (6) | Based on 849.9 million common shares outstanding as of December 31, 2009. |
PAGE 16
7.0 Results of Operations
7.1 SEGMENT EARNINGS
Segment Earnings
| | | | | | | | | | | | | | | | | | | | | | | | | | | | | | | | | |
| | | Earnings (loss) before
income taxes | | | Net Earnings (loss) | | | Capital Expenditures(2) |
| ($ millions) | | 2009 | | | 2008 (1) | | | 2007 (1) | | | 2009 | | | 2008 (1) | | | 2007 (1) | | | 2009 | | 2008 (1) | | 2007 (1) |
Upstream | | $ | 1,560 | | | $ | 4,757 | | | $ | 3,299 | | | $ | 1,113 | | | $ | 3,377 | | | $ | 2,596 | | | $ | 2,326 | | $ | 3,580 | | $ | 2,388 |
Midstream | | | | | | | | | | | | | | | | | | | | | | | | | | | | | | | | | |
Upgrading | | | 77 | | | | 351 | | | | 353 | | | | 54 | | | | 246 | | | | 268 | | | | 69 | | | 99 | | | 217 |
Infrastructure and Marketing | | | 279 | | | | 321 | | | | 351 | | | | 200 | | | | 224 | | | | 253 | | | | 25 | | | 94 | | | 92 |
Downstream | | | | | | | | | | | | | | | | | | | | | | | | | | | | | | | | | |
Canadian Refined Products | | | 198 | | | | 143 | | | | 243 | | | | 141 | | | | 104 | | | | 193 | | | | 81 | | | 155 | | | 212 |
U.S. Refining and Marketing | | | 195 | | | | (635 | ) | | | 168 | | | | 124 | | | | (403 | ) | | | 105 | | | | 260 | | | 133 | | | 21 |
Corporate and Eliminations | | | (352 | ) | | | 208 | | | | (305 | ) | | | (216 | ) | | | 203 | | | | (214 | ) | | | 36 | | | 47 | | | 44 |
| | | | | | | | | | | | | | | | | | | | | | | | | | | | | | | | | |
Total | | | 1,957 | | | | 5,145 | | | | 4,109 | | | | 1,416 | | | | 3,751 | | | | 3,201 | | | | 2,797 | | | 4,108 | | | 2,974 |
| | | | | | | | | | | | | | | | | | | | | | | | | | | | | | | | | |
| (1) | 2008 and 2007 amounts restated for adoption of new accounting policy. Refer to Note 4 to the Consolidated Financial Statements. |
| (2) | Excludes capitalized costs related to asset retirement obligations incurred during the period and the Lima acquisition and the BP joint venture transaction. |
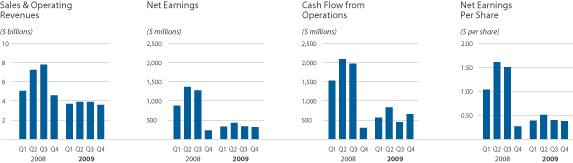
PAGE 17
7.2 SUMMARY OF QUARTERLY RESULTS
7.3 UPSTREAM
2009 Earnings $1,113 Million
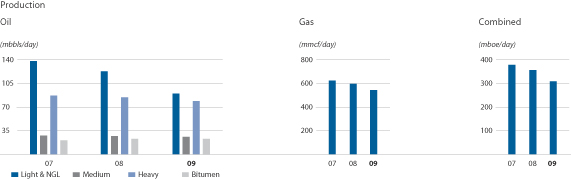
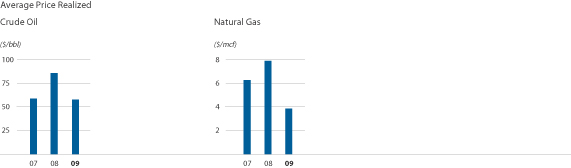
| | | | | | | | | |
Average Sales Prices Realized | | 2009 | | 2008 | | 2007 |
Crude oil($/bbl) | | | | | | | | | |
Light crude oil & NGL | | $ | 62.70 | | $ | 97.28 | | $ | 73.54 |
Medium crude oil | | | 56.37 | | | 81.79 | | | 51.12 |
Heavy crude oil | | | 52.54 | | | 71.98 | | | 40.43 |
Bitumen | | | 51.90 | | | 70.24 | | | 38.96 |
Total average | | | 57.11 | | | 84.96 | | | 58.24 |
Natural gas($/mcf) | | | | | | | | | |
Average | | $ | 3.83 | | $ | 7.94 | | $ | 6.19 |
| | | | | | | | | |
PAGE 18
| | | | | | | | | | |
Upstream Earnings Summary ($ millions) | | 2009 | | 2008 | | 2007 | |
Gross revenues | | $ | 5,313 | | $ | 9,932 | | $ | 7,287 | |
Royalties | | | 861 | | | 2,043 | | | 1,065 | |
| | | | | | | | | | |
Net revenues | | | 4,452 | | | 7,889 | | | 6,222 | |
Operating and administration expenses | | | 1,495 | | | 1,596 | | | 1,409 | |
Depletion, depreciation and amortization | | | 1,397 | | | 1,505 | | | 1,615 | |
Other | | | — | | | 31 | | | (101 | ) |
Income taxes | | | 447 | | | 1,380 | | | 703 | |
| | | | | | | | | | |
Net earnings | | $ | 1,113 | | $ | 3,377 | | $ | 2,596 | |
| | | | | | | | | | |
Upstream earnings were $2,264 million lower in 2009 compared with 2008 primarily as a result of lower production combined with lower average realized prices for commodities. Production declines were primarily due to lower light oil production offshore the East Coast of Canada and lower natural gas production in Western Canada. The decrease in royalties relative to 2008 is a result of lower upstream revenues combined with lower average rates due primarily to price sensitive royalties in both Canada and China.
During 2009, average realized prices declined 33% to $57.11/bbl for crude oil, NGL and bitumen combined compared with $84.96/bbl during 2008. The narrowing light to heavy crude oil differential in 2009 compared with 2008 partially offset the impact on earnings of declining light crude oil prices. Average realized natural gas prices declined 52% to $3.83/mcf in 2009 compared with $7.94/mcf in 2008.
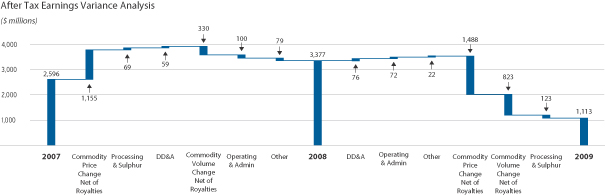
PAGE 19
Daily Gross Production
| | | | | | |
| | | 2009 | | 2008 | | 2007 |
Crude oil(mbbls/day) | | | | | | |
Western Canada | | | | | | |
Light crude oil & NGL | | 22.8 | | 24.6 | | 26.5 |
Medium crude oil | | 25.4 | | 26.9 | | 27.1 |
Heavy crude oil(1) | | 78.6 | | 84.3 | | 86.5 |
Bitumen(1) | | 23.1 | | 22.7 | | 20.4 |
| | | | | | |
| | 149.9 | | 158.5 | | 160.5 |
East Coast Canada | | | | | | |
White Rose — light crude oil | | 45.2 | | 73.2 | | 85.0 |
Terra Nova — light crude oil | | 10.0 | | 12.9 | | 14.5 |
China | | | | | | |
Wenchang — light crude oil & NGL | | 11.1 | | 12.2 | | 12.7 |
| | | | | | |
| | 216.2 | | 256.8 | | 272.7 |
| | | | | | |
Natural gas(mmcf/day) | | 541.7 | | 594.4 | | 623.3 |
| | | | | | |
Total(mboe/day) | | 306.5 | | 355.9 | | 376.6 |
| | | | | | |
| (1) | Restated in accordance with the U.S. Securities and Exchange Commission definition of bitumen, as part of its new requirements for oil and gas reserves disclosure effective December 31, 2009. Under the new definition, a portion of crude oil previously reported as heavy crude oil has now been reclassified as bitumen. The presentation of heavy crude oil and bitumen reported in prior periods has been restated to reflect the new definition. |
Upstream Revenue Mix
| | | | | | | | | |
| Percentage of Upstream Net Revenues | | 2009 | | | 2008 | | | 2007 | |
Crude oil | | | | | | | | | |
Light crude oil & NGL | | 35 | % | | 41 | % | | 51 | % |
Medium crude oil | | 10 | % | | 8 | % | | 7 | % |
Heavy crude oil | | 29 | % | | 24 | % | | 18 | % |
Bitumen | | 9 | % | | 6 | % | | 4 | % |
Natural gas | | 17 | % | | 21 | % | | 20 | % |
| | | | | | | | | |
| | 100 | % | | 100 | % | | 100 | % |
| | | | | | | | | |
In 2009, crude oil and NGL production decreased by 16% compared with the previous year. Production from the White Rose field decreased 28 mbbls/day or 38% due to subsea operational issues during the first half of 2009, and facility throughput restrictions on theSeaRose FPSO in the second quarter of 2009 as a result of heavy iceberg conditions, and in the second half of 2009 by a planned extended shutdown for tie-in work associated with the North Amethyst satellite development and scheduled maintenance combined with general declines in daily production rates post start up. At Terra Nova, scheduled maintenance and facility operational and maintenance issues resulted in reduced production in 2009 relative to the prior year.
During 2009, crude oil and NGL production from Western Canada was down 5% compared with 2008 primarily due to lower capital expenditures, reservoir decline, and shut-in of higher cost facilities as a result of lower commodity prices. Heavy crude oil average production, which excluded production from Lloydminster area thermal projects, was down 7% with normal reservoir decline only partially offset by new drilling. In November, Husky acquired approximately 6,000 boe/day of additional heavy oil production. Bitumen production increased by 2% compared to 2008. Tucker production averaged 5,000 boe/day in December 2009.
PAGE 20
Production from natural gas decreased by 52.7 mmcf/day or 9% in 2009 compared with 2008 due to lower capital expenditures on drilling and tie-ins, and the shut-in of higher cost facilities as a result of lower commodity prices, flowline restrictions and general reservoir decline. Husky drilled 22 net natural gas exploration wells and 61 net gas development wells in 2009 compared with 79 net gas exploration and 270 net gas development wells in 2008 which resulted in fewer additions to producing wells.
2010 Production Guidance and 2009 Actual
| | | | | | |
Gross Production | | Guidance
2010 | | Year ended
December 31
2009 | | Guidance
2009 |
Crude oil & NGL(mbbls/day) | | | | | | |
Light crude oil & NGL | | 90 - 98 | | 89 | | 92 - 109 |
Medium crude oil | | 27 - 30 | | 25 | | 25 - 28 |
Heavy crude oil & bitumen | | 104 - 114 | | 102 | | 95 - 105 |
| | | | | | |
| | 221 - 242 | | 216 | | 212 - 242 |
Natural gas (mmcf/day) | | 510 - 530 | | 542 | | 585 - 620 |
Total barrels of oil equivalent(mboe/day) | | 306 - 330 | | 307 | | 310 - 345 |
| | | | | | |
Husky’s 2010 guidance reflects new production from the North Amethyst satellite tie-back and lower gas production resulting from the strategic decision to reduce natural gas drilling activity in 2009.
Royalties
Royalty rates averaged 16% of gross revenue in 2009 compared with 21% in 2008. Royalty rates in Western Canada averaged 13% compared with 16% in 2008 primarily due to lower average commodity prices in 2009 compared with 2008 which resulted in lower price sensitive rates. Offshore the East Coast of Canada, the average rate was 25% in 2009 compared with 28% in 2008, primarily as a result of the impact of lower production and revenues on the overall royalty rate, which is a combination of royalties based on gross revenues and net cash flow. East Coast royalties were also impacted by positive adjustments to 2008 royalties recorded in 2009 as a result of annual reconciliations filed in accordance with East Coast royalty regulations. The royalty rate for Wenchang has decreased due to the sliding scale royalty clause in the PSC that results in lower rates in lower commodity price environments.
Operating Costs
Total upstream operating costs in 2009 decreased to $1,324 million from $1,428 million. Total upstream unit operating costs in 2009 averaged $11.82/boe compared with $10.93/boe in 2008 as lower costs were offset by lower production. Operating costs in Western Canada decreased to $1,124 million from $1,249 million and averaged $12.83/boe in 2009 compared with $13.16/boe in 2008 primarily as a result of lower energy, servicing, processing, handling and treating costs, slightly offset by higher maintenance, land and labour costs.
Operating costs at the East Coast offshore operations averaged $177 million or $8.73/boe in 2009 compared with $157 million or $4.99/boe in 2008 primarily as a result of lower production and higher maintenance costs.
Operating costs at the South China Sea offshore operations averaged $23 million or $5.35/boe in 2009 compared with $22 million or $4.78/boe in 2008 primarily as a result of lower production.
Depletion, Depreciation and Amortization (“DD&A”)
DD&A under the full cost method of accounting for oil and gas activities is calculated on a country-by-country basis. The DD&A rate is calculated by dividing the capital costs subject to DD&A by the proved oil and gas reserves expressed as equivalent barrels (“boe”). The resultant dollar per boe is assigned to each boe of production to determine the DD&A expense for the period.
PAGE 21
During 2009, total unit DD&A averaged $12.49/boe compared with $11.56/boe during 2008. The higher DD&A rate in 2009 was primarily due to lower oil and gas reserves as a result of commodity price adjustments at December 31, 2008 and a higher full cost base in 2009, partially offset by the effect of the disposition of 50% of the Sunrise oil sands asset on March 31, 2008.
At December 31, 2009, capital costs in respect of unproved properties and major development projects were $4.0 billion compared with $3.2 billion at the end of 2008. These costs are excluded from the Company’s DD&A calculation until the unproved properties are evaluated and proved reserves are attributed to the project or the project is deemed to be impaired.
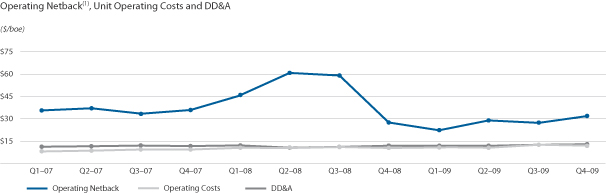
| (1) | Operating netbacks are Husky’s average price less royalties and operating costs on a per unit basis. |
Other Items
In 2008, a drilling contract previously treated as an embedded derivative no longer met the criteria and the related accounting treatment was discontinued. A loss of $101 million ($71 million after tax) was recorded in 2008. This was partially offset by a gain of $69 million on the sale of 50% of the shares of Husky Oil (Madura) Limited to CNOOC Southeast Asia Limited.
Upstream Capital Expenditures
In 2009, upstream capital expenditures were $2,326 million, $1,189 million (51%) in Western Canada, $574 million (25%) offshore the East Coast of Canada, $507 million (22%) in South East Asia, $25 million (1%) in the Northwest United States and $31 million (1%) offshore Greenland.
| | | | | | | | | |
| Upstream Capital Expenditures(1) | | | | | | | | | |
| ($ millions) | | 2009 | | 2008 | | 2007 |
Exploration | | | | | | | | | |
Western Canada | | $ | 266 | | $ | 680 | | $ | 456 |
East Coast Canada and Frontier | | | 64 | | | 160 | | | 84 |
Northwest United States | | | 25 | | | 60 | | | — |
International | | | 526 | | | 225 | | | 70 |
| | | | | | | | | |
| | | 881 | | | 1,125 | | | 610 |
| | | | | | | | | |
Development | | | | | | | | | |
Western Canada | | | 923 | | | 1,881 | | | 1,575 |
East Coast Canada | | | 510 | | | 569 | | | 197 |
International | | | 12 | | | 5 | | | 6 |
| | | | | | | | | |
| | | 1,445 | | | 2,455 | | | 1,778 |
| | | | | | | | | |
| | $ | 2,326 | | $ | 3,580 | | $ | 2,388 |
| | | | | | | | | |
PAGE 22
| (1) | Excludes capitalized costs related to asset retirement obligations incurred during the period and the Lima acquisition and the BP joint venture transaction. |
Western Canada Drilling
| | | | | | | | | | | | |
| | | 2009 | | 2008 | | 2007 |
| (wells) | | Gross | | Net | | Gross | | Net | | Gross | | Net |
Exploration Oil | | 18 | | 9 | | 80 | | 70 | | 79 | | 79 |
Gas | | 37 | | 22 | | 102 | | 79 | | 114 | | 92 |
Dry | | 7 | | 6 | | 27 | | 23 | | 14 | | 12 |
| | | | | | | | | | | | |
| | 62 | | 37 | | 209 | | 172 | | 207 | | 183 |
| | | | | | | | | | | | |
Development Oil | | 315 | | 278 | | 685 | | 578 | | 571 | | 530 |
Gas | | 122 | | 61 | | 435 | | 270 | | 343 | | 251 |
Dry | | 7 | | 7 | | 36 | | 36 | | 31 | | 29 |
| | | | | | | | | | | | |
| | 444 | | 346 | | 1,156 | | 884 | | 945 | | 810 |
| | | | | | | | | | | | |
Total | | 506 | | 383 | | 1,365 | | 1,056 | | 1,152 | | 993 |
| | | | | | | | | | | | |
Western Canada
During 2009, Husky invested $1,189 million on exploration and development throughout the Western Canada Sedimentary Basin compared with $2,561 million in 2008. Of this, $379 million was invested on oil development and $143 million was invested on natural gas development compared with $678 million for oil development and $360 million for natural gas development in 2008. The Company drilled 383 net wells in the basin resulting in 287 net oil wells and 83 net natural gas wells compared with 648 net oil wells and 349 net natural gas wells in 2008. The reduction in capital expenditures, in particular natural gas drilling, reflects the Company’s decision to reduce activity in this area in 2009 due to the low commodity price environment. In addition, $80 million was spent on production optimization and operating cost reduction initiatives. Capital expenditures on facilities, land acquisition and retention and environmental protection amounted to $112 million.
During 2009, $214 million was spent on property acquisitions. Capital expenditures on oil sands projects were $29 million compared with $302 million in the same period of 2008. The decrease in spending at Sunrise was reflective of the Company’s decision to simplify the project scope and delay capital spending until the oil and gas cost environment reflects the decline of the current economic environment.
Husky’s exploration program is conducted along the foothills of Alberta and British Columbia and in the deep basin region of Alberta. In 2009, $169 million was invested in land, seismic and drilling in these regions of which $128 million was spent on gas resource play exploration, including $83 million spent on resource play acquisitions. $63 million was also spent on follow-up development including tie-ins, facility installation and development drilling.
PAGE 23
The following table discloses Husky’s offshore and international drilling activity during 2009:
| | | | | | |
Offshore and International Drilling Activity | | | | | | |
Canada — East Coast | | | | | | |
Mizzen O-16 Flemish Pass | | WI 35% | | Stratigraphic test | | Exploratory |
White Rose J-22-3 | | WI 72.5% | | Gas injection well | | Development |
| | | |
United States — Columbia River Basin | | | | | | |
Grey 31-23 | | WI 50% | | Exploration well | | Exploratory |
| | | |
South East Asia — China | | | | | | |
QH 29-2-1 Block 39/05 | | WI 100%(1) | | Stratigraphic test | | Exploratory |
Liwan 3-1-2 Block 29/26 | | WI 100%(1) | | Stratigraphic test | | Delineation |
Liwan 3-1-3 Block 29/26 | | WI 100%(1) | | Stratigraphic test | | Delineation |
Liwan 3-1-4 Block 29/26 | | WI 100%(1) | | Stratigraphic test | | Delineation |
Liwan 4-1-1 Block 29/26 | | WI 100%(1) | | Stratigraphic test | | Exploratory |
Liwan 9-1-1 Block 29/26 | | WI 100%(1) | | Stratigraphic test | | Exploratory |
Liwan 9-1-2 Block 29/26 | | WI 100%(1) | | Stratigraphic test | | Exploratory |
Liuhua 29-1-1 Block 29/26 | | WI 100%(1) | | Stratigraphic test | | Exploratory |
Liuhua 34-2-1 Block 29/26 | | WI 100%(1) | | Stratigraphic test | | Exploratory |
| | | |
South East Asia — Indonesia | | | | | | |
Adiyasa 1 | | WI 100% | | Stratigraphic test | | Exploratory |
Kukura 1 | | WI 100% | | Stratigraphic test | | Exploratory |
| (1) | CNOOC has the right to participate in development of discoveries up to 51%. |
East Coast Development
During 2009, $510 million was invested for East Coast development projects primarily for the North Amethyst and West White Rose satellite tie-back development projects, including drilling operations at North Amethyst and completion of facilities construction and installation. At West White Rose capital expenditures focused on advancing engineering design and planning.
East Coast Exploration
During 2009, Husky spent $64 million primarily on the Mizzen exploration well in the Flemish Pass off the coast of Newfoundland and geological and geophysical data and studies.
Northwest United States
During 2009, Husky spent $25 million on the Gray 31-23 exploration well in the Columbia River Basin in south Washington State that was abandoned after testing non-commercial quantities of natural gas. Husky has a 50% working interest in this exploration well.
Offshore China and Indonesia
During 2009, $472 million was spent on offshore China projects including the Liwan natural gas discovery delineation program, four exploration wells on the deepwater Block 29/26 and drilling one exploration well on Block 39/05. In Indonesia, capital expenditures during 2009 were $35 million, primarily related to drilling two exploration wells on the East Bawean II PSC.
PAGE 24
Offshore Greenland
During 2009, Husky spent $31 million completing a 2,200 square kilometre 3-D seismic program.
2010 Upstream Capital Program
| | | |
| ($ millions) | | |
Western Canada — oil and gas | | $ | 1,200 |
— oil sands | | | 85 |
East Coast Canada | | | 485 |
International | | | 660 |
| | | |
| | $ | 2,430 |
| | | |
Note: Capital program excludes capitalized administration costs, capitalized interest and asset retirement obligations incurred.
The 2010 capital budget has been established with a view to enable Husky to maintain production levels and support its medium and long-term growth strategies. Capital expenditures are focused on those projects offering the highest potential for returns.
Capital expenditures for Western Canada upstream development and exploration will focus on heavy oil properties, EOR projects and unconventional gas holdings. Capital spending on oil sands is primarily focused on development at Sunrise.
Offshore the East Coast of Canada, spending is concentrated on the drilling of development wells at North Amethyst.
In China and Indonesia, capital spending is focused on continuing the development of the Liwan Gas Project and the recently discovered Liuhua gas field, and offshore exploration and development programs.
PAGE 25
Oil and Gas Reserves
Husky applied for and was granted an exemption from certain of the provisions of Canada’s National Instrument 51-101 “Standards of Disclosure for Oil and Gas Activities” and provides oil and gas reserves disclosures in accordance with the United States Securities and Exchange Commission (“SEC”) guidelines and the United States Financial Accounting Standards Board (“FASB”) disclosure standards. The information disclosed may differ from information prepared in accordance with National Instrument 51-101.
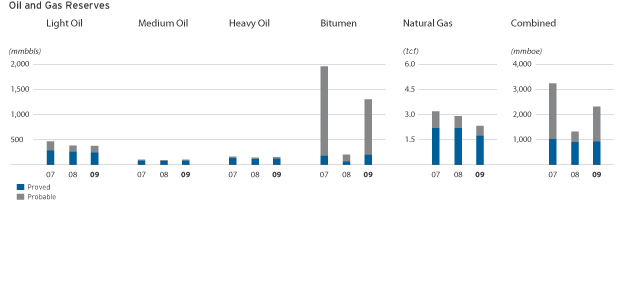
Note: As at December 31 based on prices as per SEC regulations.
For more detail on the Company’s oil and gas reserves and the disclosures with respect to the FASB Accounting Standards Codification 932, “Extractive Activities — Oil and Gas” and the differences between Husky’s disclosures and those prescribed by National Instrument 51-101, refer to Husky’s Annual Information Form available atwww.sedar.com or Husky’s Form 40-F available atwww.sec.gov or on the Company’s website atwww.huskyenergy.com.
McDaniel & Associates Consultants Ltd., an independent firm of oil and gas reserves evaluation engineers, was engaged to conduct an audit of Husky’s crude oil, natural gas and natural gas products reserves. McDaniel & Associates Consultants Ltd. issued an audit opinion stating that Husky’s internally generated proved and probable reserves and net present values are, in aggregate, reasonable, and have been prepared in accordance with generally accepted oil and gas engineering and evaluation practices in the United States and as set out in the Canadian Oil and Gas Evaluation Handbook.
At December 31, 2009, Husky’s proved oil and gas reserves were 933 mmboe, up from 896 mmboe at the end of 2008. The increase in proved reserves represents 133% of 2009 production. A major addition to proved reserves in 2009 was the inclusion of 64 mmboe of proved undeveloped reserves related to the first phase of the Sunrise oil sands project. This addition represents 59% of total additions from discoveries, extensions and improved recovery. Reserves added due to crude oil price recovery totalled 78 mmboe or 92% of the total revision of previous estimate of 85 mmboe.
PAGE 26
Husky’s oil and gas reserves are estimated in accordance with the regulations and guidelines of the SEC, which amended its oil and gas reserves estimation and disclosure requirements effective for annual reporting periods ending on or after December 31, 2009. Compared with the previous rules, only one of the amendments had a significant effect on Husky’s reserves at December 31, 2009. The new requirement to determine reserve quantities based on a 12 month average price resulted in lower prices compared with the prices in effect at December 31, 2009, particularly for natural gas. The lower commodity prices resulted in a reduction of proved oil and gas reserves amounting to 59 mmboe; 53 mmboe or 90% related to lower natural gas prices.
The calculated average price of WTI in 2009 based on the new SEC rules was U.S. $61.18/bbl compared with U.S. $79.36/bbl at December 31, 2009 and U.S. $44.60/bbl at December 31, 2008. Lloydminster heavy crude oil, which trades at a discount to light crude oil, averaged $53.67/bbl in 2009 compared with $65.39/bbl at December 31, 2009 and $34.56/bbl at December 31, 2008. Natural gas averaged $3.57/mcf in 2009 compared with $5.60/mcf at December 31, 2009 and $6.10/mcf at December 31, 2008.
Husky’s probable oil and gas reserves based on the new pricing rules increased by 951 mmboe in 2009 to 1,374 mmboe as at December 31, 2009 compared with 423 mmboe at the end of 2008. The increase in probable reserves in 2009 was primarily due to a positive revision of previously estimated reserves of 1,041 mmboe; 1,012 mmboe or 97% was related to higher average bitumen prices in 2009 compared with bitumen prices at December 31, 2008. Positive revisions to probable reserves were partially offset by transfers to the proved category. The effect of the new SEC pricing rule resulted in a reduction of probable natural gas and natural gas liquids reserves amounting to 34 mmboe.
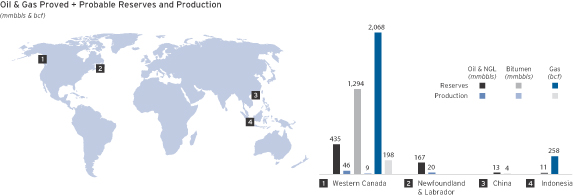
Note: Based on prices as per SEC regulations.
PAGE 27
Reconciliation of Proved Reserves
| | | | | | | | | | | | | | | | | | | | | | | | | | | | | | | | |
| | | Canada | | | International | | | |
| | | Western Canada | | | East
Coast | | | | | | | | Total | |
(constant prices and
costs before royalties) | | Light
Crude
Oil &
NGL | | | Medium
Crude
Oil | | | Heavy
Crude
Oil | | | Bitumen | | | Natural
Gas | | | Light
Crude
Oil | | | Light
Crude
Oil | | | Natural
Gas | | Crude
Oil &
NGL | | | Natural
Gas | | | Equivalent
Units | |
| | | (mmbbls) | | | (mmbbls) | | | (mmbbls) | | | (mmbbls) | | | (bcf) | | | (mmbbls) | | | (mmbbls) | | | (bcf) | | (mmbbls) | | | (bcf) | | | (mmboe) | |
Proved reserves at December 31, 2008 | | 148 | | | 85 | | | 122 | | | 65 | | | 2,190 | | | 104 | | | 7 | | | — | | 531 | | | 2,190 | | | 896 | |
Revision of previous estimate | | 2 | | | 6 | | | 5 | | | 75 | | | (52 | ) | | — | | | 6 | | | — | | 94 | | | (52 | ) | | 85 | |
Purchase of reserves in place | | — | | | — | | | 11 | | | — | | | 18 | | | — | | | — | | | — | | 11 | | | 18 | | | 14 | |
Sale of reserves in place | | — | | | — | | | — | | | — | | | — | | | — | | | — | | | — | | — | | | — | | | — | |
Discoveries, extensions and improved recovery | | 3 | | | 2 | | | 12 | | | 69 | | | 82 | | | 9 | | | — | | | — | | 95 | | | 82 | | | 109 | |
| | | | | | | | | | | | | | | | | | | | | | | | | | | | | | | | |
Production | | (8 | ) | | (9 | ) | | (29 | ) | | (9 | ) | | (198 | ) | | (20 | ) | | (4 | ) | | — | | (79 | ) | | (198 | ) | | (112 | ) |
| | | | | | | | | | | | | | | | | | | | | | | | | | | | | | | | |
Proved reserves at December 31, 2009 (previous pricing rules) | | 145 | | | 84 | | | 121 | | | 200 | | | 2,040 | | | 93 | | | 9 | | | — | | 652 | | | 2,040 | | | 992 | |
Effect of new SEC pricing rules | | (4 | ) | | (2 | ) | | (1 | ) | | — | | | (315 | ) | | — | | | — | | | — | | (7 | ) | | (315 | ) | | (59 | ) |
| | | | | | | | | | | | | | | | | | | | | | | | | | | | | | | | |
Proved reserves at December 31, 2009 | | 141 | | | 82 | | | 120 | | | 200 | | | 1,725 | | | 93 | | | 9 | | | — | | 645 | | | 1,725 | | | 933 | |
| | | | | | | | | | | | | | | | | | | | | | | | | | | | | | | | |
Proved and probable reserves at December 31, 2009 | | 185 | | | 99 | | | 151 | | | 1,294 | | | 2,068 | | | 167 | | | 24 | | | 258 | | 1,920 | | | 2,326 | | | 2,307 | |
At December 31, 2008 | | 195 | | | 99 | | | 147 | | | 204 | | | 2,648 | | | 168 | | | 21 | | | 258 | | 834 | | | 2,906 | | | 1,319 | |
| | | | | | | | | | | | | | | | | | | | | | | | | | | | | | | | |
PAGE 28
Reconciliation of Proved Developed Reserves
| | | | | | | | | | | | | | | | | | | | | | | | | | | | | | | | |
| | | Canada | | | International | | | |
| | Western Canada | | | East
Coast | | | | | Total | |
(constant prices and
costs before royalties) | | Light
Crude
Oil &
NGL | | | Medium
Crude
Oil | | | Heavy
Crude
Oil | | | Bitumen | | | Natural
Gas | | | Light
Crude
Oil | | | Light
Crude
Oil | | | Natural
Gas | | Crude
Oil &
NGL | | | Natural
Gas | | | Equivalent
Units | |
| | | (mmbbls) | | | (mmbbls) | | | (mmbbls) | | | (mmbbls) | | | (bcf) | | | (mmbbls) | | | (mmbbls) | | | (bcf) | | (mmbbls) | | | (bcf) | | | (mmboe) | |
Proved developed reserves at December 31, 2008 | | 128 | | | 79 | | | 93 | | | 25 | | | 1,760 | | | 83 | | | 7 | | | — | | 415 | | | 1,760 | | | 708 | |
Revision of previous estimate | | 1 | | | 8 | | | 10 | | | 51 | | | (5 | ) | | — | | | 6 | | | — | | 76 | | | (5 | ) | | 76 | |
Purchase of reserves in place | | — | | | — | | | 9 | | | — | | | 18 | | | — | | | — | | | — | | 9 | | | 18 | | | 12 | |
Sale of reserves in place | | — | | | — | | | — | | | — | | | — | | | — | | | — | | | — | | — | | | — | | | — | |
Discoveries, extensions and improved recovery | | 1 | | | 1 | | | 4 | | | — | | | 46 | | | 1 | | | — | | | — | | 7 | | | 46 | | | 15 | |
Production | | (8 | ) | | (9 | ) | | (29 | ) | | (9 | ) | | (198 | ) | | (20 | ) | | (4 | ) | | — | | (79 | ) | | (198 | ) | | (112 | ) |
| | | | | | | | | | | | | | | | | | | | | | | | | | | | | | | | |
Proved developed reserves at December 31, 2009 (previous pricing rules) | | 122 | | | 79 | | | 87 | | | 67 | | | 1,621 | | | 64 | | | 9 | | | — | | 428 | | | 1,621 | | | 699 | |
Effect of new SEC pricing rules | | (1 | ) | | (1 | ) | | (1 | ) | | — | | | (169 | ) | | — | | | — | | | — | | (3 | ) | | (169 | ) | | (32 | ) |
| | | | | | | | | | | | | | | | | | | | | | | | | | | | | | | | |
Proved developed reserves at December 31, 2009 | | 121 | | | 78 | | | 86 | | | 67 | | | 1,452 | | | 64 | | | 9 | | | — | | 425 | | | 1,452 | | | 667 | |
| | | | | | | | | | | | | | | | | | | | | | | | | | | | | | | | |
PAGE 29
7.4 MIDSTREAM
2009 Earnings $254 Million
Total midstream earnings in 2009 were $254 million, down from $470 million in 2008. The decrease is primarily due to the lower upgrading differential in 2009 compared to 2008 as well as lower margins realized on crude oil and natural gas trading contracts as a result of lower commodity prices.
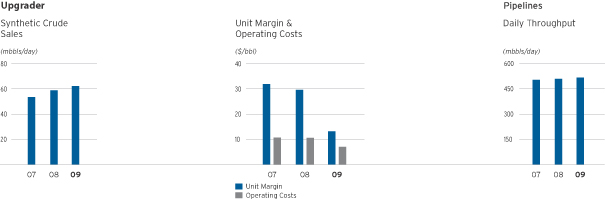
Upgrading Earnings Summary
| | | | | | | | | | | | | | |
| ($ millions, except where indicated) | | 2009 | | | 2008 (1) | | | 2007 (1) | |
Gross revenues | | $ | 1,572 | | | $ | 2,435 | | | $ | 1,524 | |
| | | | | | | | | | | | | | |
Gross margin | | $ | 296 | | | $ | 633 | | | $ | 614 | |
Operating and administration expenses | | | 188 | | | | 255 | | | | 240 | |
Other recoveries | | | (3 | ) | | | (4 | ) | | | (4 | ) |
Depreciation and amortization | | | 34 | | | | 31 | | | | 25 | |
Income taxes | | | 23 | | | | 105 | | | | 85 | |
| | | | | | | | | | | | | | |
Net earnings | | $ | 54 | | | $ | 246 | | | $ | 268 | |
| | | | | | | | | | | | | | |
Upgrader throughput(2) | | (mbbls/day) | | | 74.1 | | | | 71.1 | | | | 61.4 | |
Synthetic crude oil sales | | (mbbls/day) | | | 61.8 | | | | 58.7 | | | | 53.1 | |
Upgrading differential | | ($/bbl) | | $ | 11.89 | | | $ | 28.77 | | | $ | 30.73 | |
Unit margin | | ($/bbl) | | $ | 13.11 | | | $ | 29.48 | | | $ | 31.67 | |
Unit operating cost(3) | | ($/bbl) | | $ | 6.92 | | | $ | 10.54 | | | $ | 10.68 | |
| | | | | | | | | | | | | | |
| (1) | 2008 and 2007 amounts as restated for adoption of a new accounting policy. Refer to Note 4 to the Consolidated Financial Statements. |
| (2) | Throughput includes diluent returned to the field. |
In 2009, upgrading earnings were 78% lower than 2008. The large decline is due to the significant reduction in the upgrading differential realized which is the result of low heavy oil differentials in 2009 compared with 2008 partially offset by higher throughput. In 2008, the upgrader was shutdown for 34 days for scheduled maintenance and a temporary shutdown to replace the hydrogen plant catalyst.
PAGE 30
Unlike heavy crude oil, synthetic crude oil is a higher value feedstock for many refineries in Canada and the United States. During 2009, the price of Husky’s synthetic crude oil averaged $68.92/bbl (2008, $108.73/bbl) compared with the average cost of blended heavy crude oil from the Lloydminster area of $57.03/bbl (2008, $79.96/bbl). This resulted in an average synthetic/heavy crude differential of $11.89/bbl (2008, $28.77/bbl) and a gross unit margin of $13.11/bbl (2008, $29.48/bbl). Gross unit margin includes secondary products. The cost of upgrading averaged $6.92/bbl compared with $10.54/bbl in 2008, which results in a net margin for upgrading Lloydminster heavy crude of $6.19/bbl, down 67% compared with $18.94/bbl in 2008.
Operating costs have decreased in 2009 primarily due to lower energy costs. Depreciation is recorded at the upgrader on a unit of production basis which is the primary driver behind the increase in 2009 compared with 2008 as throughput volumes have increased.
Infrastructure and Marketing Earnings Summary
| | | | | | | | | | | | |
| ($ millions, except where indicated) | | 2009 | | | 2008 | | 2007 |
Gross revenues | | $ | 6,984 | | | $ | 13,544 | | $ | 10,217 |
| | | | | | | | | | | | |
Gross margin | | | | | | | | | | |
Pipeline | | $ | 106 | | | $ | 120 | | $ | 115 |
Other infrastructure and marketing | | | 195 | | | | 249 | | | 278 |
| | | | | | | | | | | | |
| | | 301 | | | | 369 | | | 393 |
Operating and administration expenses | | | 19 | | | | 17 | | | 14 |
Depreciation and amortization | | | 36 | | | | 31 | | | 28 |
Other income | | | (33 | ) | | | — | | | — |
Income taxes | | | | | 79 | | | | 97 | | | 98 |
| | | | | | | | | | | | |
Net earnings | | | | $ | 200 | | | $ | 224 | | $ | 253 |
| | | | | | | | | | | | |
Commodity volumes marketed | | (mboe/day) | | | 912 | | | | 1,103 | | | 1,042 |
Aggregate pipeline throughput | | (mbbls/day) | | | 514 | | | | 507 | | | 501 |
| | | | | | | | | | | | |
Infrastructure and marketing earnings in 2009 decreased by $24 million compared with 2008 due primarily to lower margins on crude and natural gas trading contracts as a result of lower commodity prices. 2009 earnings include unrealized gains of $32 million ($25 million in 2008) on natural gas storage contracts. Pipeline earnings in 2009 decreased relative to 2008 due to lower blending differentials and brokering margins.
Midstream Capital Expenditures
Midstream capital expenditures totalled $94 million in 2009. At the Lloydminster upgrader, Husky spent $62 million, primarily for contingent consideration and facility reliability projects. The remaining $32 million was spent on the construction and commissioning of two new tanks at Hardisty, Alberta; the pipeline extension between Lloydminster and Hardisty, Alberta; tankage upgrades at Hardisty and capital enhancements of the cogeneration plants.
PAGE 31
7.5 DOWNSTREAM
2009 Earnings $265 Million
In 2009, the downstream segment earnings include twelve months (2008 — twelve months) from the Lima, Ohio Refinery, which was acquired on July 1, 2007 and twelve months (2008 — nine months) from the BP-Husky Toledo, Ohio Refinery, 50% of which was acquired on March 31, 2008.
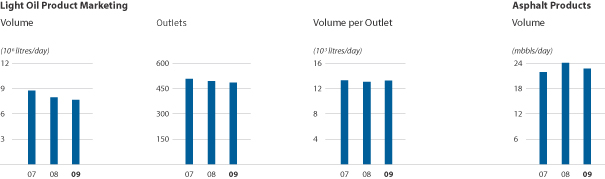
Canadian Refined Products
Canadian Refined Products Earnings Summary
| | | | | | | | | | | |
| ($ millions, except where indicated) | | 2009 | | 2008(1) | | 2007(1) |
Gross revenues | | $ | 2,495 | | $ | 3,564 | | $ | 2,916 |
Gross margin | | | | | | | | | |
Fuel | | $ | 111 | | $ | 96 | | $ | 156 |
Ethanol | | | 62 | | | 26 | | | 32 |
Ancillary | | | 53 | | | 42 | | | 42 |
Asphalt | | | 166 | | | 130 | | | 160 |
| | | | | | | | | | | |
| | | 392 | | | 294 | | | 390 |
Operating and administration expenses | | | 101 | | | 70 | | | 81 |
Depreciation and amortization | | | 93 | | | 81 | | | 66 |
Income taxes | | | 57 | | | 39 | | | 50 |
| | | | | | | | | |
Net earnings | | | | $ | 141 | | $ | 104 | | $ | 193 |
| | | | | | | | | | | |
Number of fuel outlets(2) | | | 482 | | | 492 | | | 505 |
Refined products sales volume | | | | | | | | | |
Light oil products | | (million litres/day) | | | 7.6 | | | 7.9 | | | 8.7 |
Light oil products per outlet | | (thousand litres/day) | | | 13.2 | | | 13.0 | | | 13.2 |
Asphalt products | | (mbbls/day) | | | 22.6 | | | 24.0 | | | 21.8 |
Refinery throughput | | | | | | | | | | | |
Prince George refinery | | (mbbls/day) | | | 10.3 | | | 10.1 | | | 10.5 |
Lloydminster refinery | | (mbbls/day) | | | 24.1 | | | 26.1 | | | 25.3 |
Ethanol production | | (thousand litres/day) | | | 676.9 | | | 627.2 | | | 324.6 |
| | | | | | | | | | | |
| (1) | 2008 and 2007 amounts as restated for adoption of a new accounting policy. Refer to Note 4 to the Consolidated Financial Statements. |
| (2) | Average number of fuel outlets for period indicated. |
PAGE 32
Gross margins on fuel sales were higher in 2009 compared with 2008 due to improved unit margins. Light oil retail sales per outlet were higher due to increased demand as the economy in Western Canada showed signs of recovery in the latter half of 2009 compared with a significant drop in demand in the fourth quarter of 2008.
Asphalt gross margins increased in 2009 compared with 2008 primarily due to the positive impact in early 2009 of consuming low cost feedstock due to the significant drop in crude oil prices at the end of 2008 which continued into the first quarter of 2009.
The higher ethanol gross margin in 2009 was due to higher sales volumes partially offset by lower sales prices resulting primarily from competition with low priced U.S. imported ethanol. Ethanol production in 2009 was higher than in 2008 due to improved operational performance at the Lloydminster plant. Included in ethanol gross margin in 2009 is $53 million related to government assistance grants received compared with $18 million received in 2008.
Operating and administration expenses in 2008 included a $15 million credit resulting from an insurance settlement. The remaining increases are primarily due to higher repair and maintenance costs and property taxes.
U.S. Refining and Marketing
U.S. Refining and Marketing Earnings Summary
| | | | | | | | | | | | |
| ($ millions, except where indicated) | | 2009 | | 2008 (1) | | | 2007 (1) |
Gross revenues | | $ | 5,349 | | $ | 7,802 | | | $ | 2,383 |
| | | | | | | | | | | | |
Gross refining margin | | $ | 852 | | $ | (58 | ) | | $ | 310 |
Processing costs | | | 423 | | | 417 | | | | 93 |
Operating and administration expenses | | | 7 | | | 3 | | | | 1 |
Interest — net | | | 3 | | | 3 | | | | 1 |
Depreciation and amortization | | | 194 | | | 154 | | | | 47 |
Other expense | | | 30 | | | — | | | | — |
Income taxes | | | 71 | | | (232 | ) | | | 63 |
| | | | | | | | | | | | |
Net earnings (loss) | | $ | 124 | | $ | (403 | ) | | $ | 105 |
| | | | | | | | | | | | |
Selected operating data: | | | | | | | | | | |
Lima Refinery throughput(2) | | (mbbls/day) | | | 114.6 | | | 136.6 | | | | 143.8 |
Toledo Refinery throughput(3) | | (mbbls/day) | | | 64.9 | | | 60.6 | | | | — |
Refining margin | | ($/bbl crude throughput) | | $ | 13.12 | | $ | (0.88 | ) | | $ | 12.42 |
Refinery inventory(feedstocks and refined products) | | (mmbbls) | | | 12.3 | | | 11.9 | | | | 7.4 |
| | | | | | | | | | | | |
| (1) | 2008 and 2007 amounts restated for adoption of a new accounting policy. Refer to Note 4 of the Consolidated Financial Statements. |
| (2) | The Lima Refinery operating results are included from July 1, 2007, the date the acquisition was completed. Throughput in 2007 represents six months of operations. |
| (3) | The BP-Husky Toledo Refinery operating results are included from March 31, 2008, the date the acquisition was completed. Throughput in 2008 represents Husky’s share of nine months of operations. |
The U.S. refining and marketing segment commenced operations on July 1, 2007 with the acquisition of the Lima, Ohio Refinery, as a first step in pursuing integration and enhancing the value of heavy oil and bitumen production.
PAGE 33
On March 31, 2008, Husky completed a transaction that resulted in the formation of two joint venture entities forming an integrated oil sands business and a refining joint venture. Husky holds a 50% interest in the BP-Husky Toledo Refinery. Net earnings for 2009 include both the Lima and Toledo refineries whereas the comparative period in 2008 includes the results from the Toledo Refinery for nine months.
U.S. refining and marketing earnings have increased in 2009 compared with 2008 as a result of improved product margins offsetting reduced sales volumes. Margins in 2008 were dramatically impacted by rapidly falling crude oil prices which resulted in significant inventory write downs. Refining margins realized in 2009 reflect the positive benefit of consuming feedstock purchased one to two months prior to production in a rising crude oil price environment compared to the negative impact of falling crude oil prices in late 2008. The Lima Refinery was shutdown on October 2, 2009 for scheduled major turnaround and maintenance work and resumed production on November 20, 2009. Higher refinery throughput at Toledo in 2009 compared with 2008 is the result of improved turnaround efficiency and generally stable operations throughout the year.
Other expenses in 2009 include $30 million of losses on forward contracts for feedstock purchases.
Downstream Capital Expenditures
Downstream capital expenditures totalled $341 million during 2009.
In Canada, capital expenditures totalled $81 million primarily for facility and environmental upgrades at the retail outlets, refineries and ethanol plants.
In the United States, capital expenditures totalled $260 million. At the Lima Refinery, $136 million was spent on various debottleneck projects, optimizations and environmental initiatives and $69 million was spent on the scheduled major turnaround. At the BP-Husky Toledo Refinery, capital expenditures totalled $55 million (Husky’s 50% share) primarily for engineering work on the Continuous Catalyst Regeneration Reformer Project, facility upgrades and environmental protection.
7.6 CORPORATE
2009 Expense $216 Million
Corporate Earnings Summary
| | | | | | | | | | | | |
| ($ millions) income (expense) | | 2009 | | | 2008 | | | 2007 | |
Intersegment eliminations — net | | $ | (44 | ) | | $ | 61 | | | $ | (51 | ) |
Administration expenses | | | (69 | ) | | | (95 | ) | | | (54 | ) |
Other income (expense) | | | (1 | ) | | | 48 | | | | (9 | ) |
Stock-based compensation | | | (1 | ) | | | 33 | | | | (88 | ) |
Depreciation and amortization | | | (51 | ) | | | (30 | ) | | | (25 | ) |
Interest — net | | | (191 | ) | | | (144 | ) | | | (129 | ) |
Foreign exchange | | | 5 | | | | 335 | | | | 51 | |
Income taxes | | | 136 | | | | (5 | ) | | | 91 | |
| | | | | | | | | | | | |
Net earnings (loss) | | $ | (216 | ) | | $ | 203 | | | $ | (214 | ) |
| | | | | | | | | | | | |
The corporate segment reported a loss in 2009 of $216 million compared with earnings of $203 million in 2008. Foreign exchange gains decreased by $330 million in 2009 compared with 2008. In late 2008, the U.S./Canadian exchange rate dropped significantly and Husky’s net U.S. dollar position resulted in a large unrealized gain. In 2009, Husky took steps to manage the impact of the strengthening Canadian dollar compared with the Company’s net U.S. dollar position. The decrease in stock-based compensation recoveries in 2009 is due to the relatively flat share price in 2009 compared with 2008. Administration expense has decreased from the prior year
PAGE 34
due to cost reduction initiatives. The increase in depreciation and amortization is due to adjustments to the book value of legacy sites that have been deemed inactive. The increase in net interest in 2009 is due to higher debt levels compared to 2008. The reduction of other income was a result of lower unrealized gains on forward purchase contracts in 2009 compared to 2008. Intersegment eliminations are profit included in inventory that has not been sold to third parties at the end of the period.
Foreign Exchange Summary
| | | | | | | | | | | | |
| ($ millions) | | 2009 | | | 2008 | | | 2007 | |
(Gain) loss on translation of U.S. dollar denominated long-term debt | | $ | (327 | ) | | $ | 217 | | | $ | (197 | ) |
(Gain) loss on cross currency swaps | | | 62 | | | | (83 | ) | | | 62 | |
(Gain) loss on contribution receivable | | | 216 | | | | (228 | ) | | | — | |
Other (gains) losses | | | 44 | | | | (241 | ) | | | 84 | |
| | | | | | | | | | | | |
| | $ | (5 | ) | | $ | (335 | ) | | $ | (51 | ) |
| | | | | | | | | | | | |
U.S./Canadian dollar exchange rates: | | | | | | | | | | | | |
At beginning of year | | U.S. $ | 0.817 | | | U.S. $ | 1.012 | | | U.S. $ | 0.858 | |
At end of year | | U.S. $ | 0.956 | | | U.S. $ | 0.817 | | | U.S. $ | 1.012 | |
| | | | | | | | | | | | |
Consolidated Income Taxes
Consolidated income taxes decreased in 2009 to $541 million from $1,394 million in 2008, an effective tax rate of 27.6% for 2009 and 27.1% for 2008.
The following table shows the effect of non-recurring tax benefits for the periods noted:
| | | | | | | | | |
| ($ millions) | | 2009 | | 2008 | | 2007 |
Income taxes before tax amendments | | $ | 541 | | $ | 1,394 | | $ | 1,303 |
Canadian federal and provincial tax amendments | | | — | | | — | | | 395 |
| | | | | | | | | |
Income taxes as reported | | $ | 541 | | $ | 1,394 | | $ | 908 |
| | | | | | | | | |
Cash taxes paid | | $ | 1,323 | | $ | 615 | | $ | 926 |
| | | | | | | | | |
Taxable income from Canadian operations is primarily generated through partnerships, with the related income taxes payable in a future period. Accrued liabilities include $530 million of cash tax payable in 2010. In addition, during 2010, cash tax instalments of $310 million are payable in respect of the 2009 reported earnings but which are not taxable until 2010.
Corporate Capital Expenditures
Corporate capital expenditures of $36 million in 2009 were primarily for computer hardware, software, office furniture and renovations and equipment and system upgrades. In 2008, corporate capital expenditures were $47 million.
7.7 FOURTH QUARTER
Consolidated net earnings during the fourth quarter of 2009 were $320 million, an increase of $89 million or 39% compared with the fourth quarter of 2008 as a result of higher crude oil prices, improved U.S. Downstream results and a decline in operating costs, partially offset by lower production and lower natural gas prices.
PAGE 35
After-tax earnings from the upstream sector were $334 million in the fourth quarter of 2009, a decrease of $8 million from the same period in 2008. Lower upstream earnings in the fourth quarter of 2009 were due largely to higher crude oil prices realized offset by a decrease in production and lower natural gas prices relative to the same period in 2008. Production for the fourth quarter of 2009 was 291,500 boe/day compared with 358,400 boe/day in the fourth quarter of 2008 primarily due to lower light oil production off the East Coast of Canada and lower natural gas production in Western Canada. Crude oil prices in the fourth quarter of 2009 averaged $66.65/bbl compared with $49.02/bbl in the fourth quarter of 2008. Natural gas prices in the fourth quarter of 2009 averaged $3.94/mcf compared with $6.84/mcf during the same period in 2008.
Upgrading after-tax earnings were $14 million in the fourth quarter of 2009, a decrease of $33 million compared with the same period in 2008. Lower after-tax earnings from upgrading operations were due to lower average upgrading differentials which resulted from narrowing heavy to light oil differentials. After-tax earnings from infrastructure and marketing were $49 million in the fourth quarter of 2009, an increase of $21 million due to inventory holding gains as a result of rising crude oil prices compared with inventory holding losses as a result of falling prices in the fourth quarter of 2008. Pipeline margins increased primarily due to increases in net broker margins.
Canadian refined products after-tax earnings in the fourth quarter of 2009 were $10 million compared to $15 million in the same period in 2008. The decrease was due to lower margins for asphalt more than offsetting higher sales volume at retail outlets combined with increased demand for the product. In the fourth quarter of 2009, ethanol gross margin increased due to higher sales volumes combined with the receipt of funds earned under government incentive programs designed to offset low market prices resulting primarily from competition from low priced U.S. imported ethanol.
U.S. Refining and Marketing operations recorded a loss of $43 million after-tax in the fourth quarter of 2009 compared to a loss of $535 million after-tax in the same period of 2008. The recovery in the fourth quarter of 2009 was due to improved product margins offset by reduced sales volumes as a result of a 49 day scheduled major turnaround at the Lima Refinery. Margins in the fourth quarter of 2008 were dramatically impacted by rapidly falling crude oil prices.
7.8 RESULTS OF OPERATIONS FOR 2008 COMPARED WITH 2007
Net earnings in 2008 were $3,751 million compared with $3,201 million in 2007. The increase of $550 million was attributable to the following:
Upstream earnings increased by $781 million due to higher crude oil and natural gas prices and lower DD&A, offset by lower crude oil and natural gas production and higher operating costs.
Midstream earnings decreased by $51 million due to lower upgrading differentials, lower marketing earnings due to rapidly declining prices in 2008, and increased operating costs, partially offset by higher upgrading throughput.
Downstream earnings decreased by $597 million due to significantly reduced refining margin and higher processing costs.
Corporate earnings increased by $417 million due to higher intersegment profit eliminations, higher foreign exchange gains, lower administration expenses and an increase in stock-based compensation recovery, partially offset by an increase in interest expense.
PAGE 36
8.0 Liquidity and Capital Resources
8.1 SUMMARY OF CASH FLOW
In 2009, the Company funded its capital programs and dividend payments by cash generated from operating activities, cash on hand and long-term debt issuance. Husky maintained its strong financial position at December 31, 2009, with debt of $3,229 million partially offset by cash on hand of $392 million for $2,837 million of net debt at December 31, 2009. Husky has no long-term debt maturing until 2012. At December 31, 2009 Husky had $1.7 billion in unused short and long-term credit facilities and unused capacity under the new debt shelf prospectuses filed in Canada and the U.S. of $1.0 billion and U.S. $1.5 billion, respectively (refer to Section 8.2).
| | | | | | | | | | | | | | |
| | | | | 2009 | | | 2008(1) | | | 2007(1) | |
Cash flow | | — operating activities($ millions) | | $ | 1,918 | | | $ | 6,778 | | | $ | 4,619 | |
| | — financing activities($ millions) | | $ | 594 | | | $ | (2,559 | ) | | $ | 433 | |
| | — investing activities($ millions) | | $ | (3,033 | ) | | $ | (3,514 | ) | | $ | (5,286 | ) |
Debt to capital employed(percent) | | | 18.3 | | | | 12.0 | | | | 19.5 | |
Debt to cash flow from operations(times) | | | 1.3 | | | | 0.3 | | | | 0.5 | |
Corporate reinvestment ratio(percent) (2) | | | 111 | | | | 66 | | | | 86 | |
Interest coverage ratios on long-term debt only(3) | | | | | | | | | | | | |
Earnings | | | 11.1 | | | | 34.4 | | | | 28.1 | |
Cash Flow | | | 17.4 | | | | 50.9 | | | | 33.8 | |
Interest coverage on ratios of total debt(4) | | | | | | | | | | | | |
Earnings | | | 10.7 | | | | 33.4 | | | | 27.1 | |
Cash flow | | | 16.7 | | | | 49.3 | | | | 32.5 | |
| | | | | | | | | | | | | | |
| (1) | 2008 and 2007 amounts as restated for the adoption of a new accounting policy. Refer to Note 4 of the Consolidated Financial Statements. |
| (2) | Reinvestment ratio is based on net capital expenditures including corporate acquisitions. |
| (3) | Interest coverage on long-term debt on an earnings basis is equal to earnings before interest expense on long-term debt and income taxes divided by interest expense on long-term debt and capitalized interest. Interest coverage on long-term debt on a cash flow basis is equal to cash flow from operating activities before interest expense on long-term debt and current income taxes divided by interest expense on long-term debt and capitalized interest. Long-term debt includes the current portion of long-term debt. |
| (4) | Interest coverage on total debt on an earnings basis is equal to earnings before interest expense on total debt and income taxes divided by interest expense on total debt and capitalized interest. Interest coverage on total debt on a cash flow basis is equal to cash flow from operating activities before interest expense on total debt and current incomes taxes divided by interest expense on total debt and capitalized interest. Total debt includes short and long-term debt. |
Cash Flow from Operating Activities
Cash generated from operating activities totalled $1,918 million in 2009 compared with $6,778 million in 2008. Lower cash flow from operating activities was primarily due to lower commodity prices, lower refining margins, lower crude oil and natural gas production and the payment of current income taxes in 2009 related to 2008 and 2007 earnings, partially offset by a weaker Canadian dollar relative to the U.S. dollar.
Cash Flow from (used for) Financing Activities
Cash provided by financing activities was $594 million in 2009 compared with cash used in financing activities of $2,559 million in 2008. In May 2009, the Company issued U.S. $1.5 billion in long-term bonds, and in 2008, bridge financing related to the Lima acquisition was repaid.
PAGE 37
Cash Flow used for Investing Activities
Cash used in investing activities was $3,033 million for 2009 compared with $3,514 million in 2008. Cash invested in both periods was used primarily for capital expenditures and acquisitions.
8.2 WORKING CAPITAL COMPONENTS
Working capital is the amount by which current assets exceed current liabilities. At December 31, 2009, Husky’s working capital was $726 million compared with $404 million at December 31, 2008. Working capital increased as a result of an increase in inventories of $488 million due to build up of inventory from the turnaround at Lima at the end of 2009; a decrease in accounts payable of $150 million due to lower capital accruals as a result of decreased capital spending; a decrease in other accrued liabilities of $412 million as a result of lower dividends declared and a decrease of income taxes payable of $149 million due to lower taxable income and payments on prior year taxes offset by a decrease in accounts receivable of $357 million due to lower natural gas production and lower joint venture receivables reflecting lower levels of drilling in 2009.
Sources and Uses of Cash
Liquidity describes a company’s ability to access cash. Companies operating in the upstream oil and gas industry require sufficient cash in order to fund capital programs necessary to maintain and increase production and develop reserves, to acquire strategic oil and gas assets, repay maturing debt and pay dividends. Husky’s upstream capital programs are funded principally by cash provided from operating activities and committed credit facilities. During times of low oil and gas prices, part of a capital program can generally be deferred. However, due to the long cycle times and the importance to future cash flow in maintaining production, it may be necessary to utilize alternative sources of capital to continue the Company’s strategic long-term investment plan during periods of low commodity prices. As a result, Husky frequently evaluates its options with respect to sources of long and short-term capital resources. In addition, from time to time the Company engages in hedging a portion of production to protect cash flow in the event of commodity price declines. Corporate acquisitions, such as the Lima Refinery, are financed by issuing investment grade long-term debt.
At December 31, 2009 Husky had the following available credit facilities:
| | | | | | |
Credit Facilities | | Available | | Unused |
Operating facilities | | $ | 395 | | $ | 262 |
Syndicated bank facility | | | 1,250 | | | 1,250 |
Bilateral credit facilities | | | 150 | | | 150 |
| | | | | | |
Total | | $ | 1,795 | | $ | 1,662 |
| | | | | | |
Cash and cash equivalents at December 31, 2009 totalled $392 million compared with $913 million at the beginning of the year.
At December 31, 2009, Husky had unused committed long and short-term borrowing credit facilities totalling $1.5 billion. In addition, a further $195 million of uncommitted short-term borrowing facilities were available of which a total of $41 million were used in support of outstanding letters of credit.
Husky filed a debt shelf prospectus with the Alberta Securities Commission on February 26, 2009 and the U.S. Securities and Exchange Commission on February 27, 2009. The shelf prospectus enables Husky to offer up to U.S. $3 billion of debt securities in the United States until March 26, 2011. During the 25-month period that the shelf prospectus is effective, debt securities may be offered in amounts, at prices and on terms to be determined based on market conditions at the time of sale. As of December 31, 2009, U.S. $1.5 billion of long-term debt securities had been issued under this shelf prospectus. On December 21, 2009, Husky filed an additional debt shelf prospectus with the Alberta Securities Commission that enables Husky to offer up to $1
PAGE 38
billion of medium term notes in Canada until January 21, 2012. During the 25-month period that the shelf prospectus is effective, medium term notes may be offered in amounts, at prices and on terms to be determined based on market conditions at the time of sale. As of December 31, 2009, no medium term notes had been issued under this shelf prospectus (refer to Note 16 to the Consolidated Financial Statements).
The Sunrise Oil Sands Partnership has an unsecured demand credit facility available of $10 million for general purposes. Husky’s proportionate share is $5 million.
In 2008, Husky initiated a cash tender offer to purchase any and all of the U.S. $225 million 8.90% capital securities outstanding. At the time of expiration of the tender offer, U.S. $214 million or 95% of the capital securities had been tendered. The remaining capital securities were redeemed in 2008.
In 2008, Husky redeemed the 6.95% medium-term notes — Series E due July 14, 2009. The principal amount was $200 million and the redemption price, including accrued interest, totalled $208 million.
During 2008, Husky repurchased U.S. $63 million of the outstanding U.S. $450 million 6.80% notes due September 2037.
Quarterly dividends of $0.30 ($1.20 annually) per common share were declared totalling $1.0 billion in 2009. The declaration of dividends will be at the discretion of the Board of Directors, which will consider earnings, capital requirements, the Company’s financial condition and other relevant factors.
Capital Structure
| | | | | | |
| ($ millions) | | December 31, 2009 |
| | Outstanding | | Available |
Total short-term and long-term debt | | $ | 3,229 | | $ | 1,662 |
Common shares, retained earnings and accumulated other comprehensive income | | $ | 14,413 | | | |
| | | | | | |
Credit Ratings
Husky’s senior debt has been rated investment grade by several rating agencies. These ratings are disclosed and explained in detail in Husky’s Annual Information Form.
8.3 CASH REQUIREMENTS
Contractual Obligations and Other Commercial Commitments
In the normal course of business, Husky is obligated to make future payments. These obligations represent contracts and other commitments that are known and non-cancellable.
Contractual Obligations
| | | | | | | | | | | | | | | |
| Payments due by period ($ millions) | | 2010 | | 2011-2012 | | 2013-2014 | | Thereafter | | Total |
Long-term debt and interest on fixed rate debt | | $ | 211 | | $ | 827 | | $ | 1,130 | | $ | 3,093 | | $ | 5,261 |
Operating leases | | | 102 | | | 170 | | | 123 | | | 162 | | | 557 |
Firm transportation agreements | | | 188 | | | 290 | | | 254 | | | 1,413 | | | 2,145 |
Unconditional purchase obligations (1) | | | 2,701 | | | 2,317 | | | 54 | | | 106 | | | 5,178 |
Lease rentals and exploration work agreements | | | 98 | | | 242 | | | 285 | | | 462 | | | 1,087 |
Asset retirement obligations(2) | | | 29 | | | 66 | | | 60 | | | 5,725 | | | 5,880 |
| | | | | | | | | | | | | | | |
| | $ | 3,329 | | $ | 3,912 | | $ | 1,906 | | $ | 10,961 | | $ | 20,108 |
| | | | | | | | | | | | | | | |
PAGE 39
| (1) | Includes purchase of refined petroleum products, processing services, distribution services, insurance premiums, drilling rig services, natural gas purchases and the retail outlets acquisition. |
| (2) | Asset retirement obligations — amounts represent the undiscounted future payments for the estimated cost of abandonment, removal and remediation associated with retiring the Company’s assets. |
Based on Husky’s 2010 commodity price forecast, the Company believes that its non-cancellable contractual obligations, other commercial commitments and 2010 capital program will be funded by cash flow from operating activities and, to the extent required, by available committed credit facilities and the issuance of long-term debt. In the event of significantly lower cash flow, Husky would be able to defer certain projected capital expenditures without penalty.
The Terra Nova oil field is divided into three distinct areas, known as the Graben, the East Flank and the Far East. Husky currently holds a combined 12.51% working interest in the field, subject to redetermination. The process of working interest redetermination is before an arbitrator who is expected to make a decision by the third quarter of 2010. The outcome and impact of the arbitration process is not reasonably determinable at this time.
Estimated Obligations Not Included in the Table
Husky provides a defined contribution plan and a post-retirement health and dental plan for all qualified employees in Canada. The Company also provides a defined benefit pension plan for approximately 119 active employees and 506 retirees and their beneficiaries in Canada. This plan was closed to new entrants in 1991 after the majority of employees transferred to the defined contribution pension plan. Husky provides a defined benefit pension plan for approximately 400 active employees in the United States. This pension plan was established effective July 1, 2007 in conjunction with the acquisition of the Lima Refinery. Husky also assumed a post-retirement welfare plan covering the employees at the Lima Refinery. See Note 21 to the Consolidated Financial Statements.
Husky has an obligation to fund capital expenditures of the BP-Husky Toledo Refinery LLC (refer to Note 11 to the Consolidated Financial Statements) which is payable between December 31, 2009 and December 31, 2015 with the final balance due and payable by December 31, 2015. The timing of payments during this period will be determined by the capital expenditures made at the refinery during this same period. At December 31, 2009, Husky’s share of this obligation was U.S. $1.4 billion including accrued interest.
Other Obligations
Husky is also subject to various contingent obligations that become payable only if certain events or rulings were to occur. The inherent uncertainty surrounding the timing and financial impact of these events or rulings prevents any meaningful measurement, which is necessary to assess impact on future liquidity. Such obligations include environmental contingencies, contingent consideration and potential settlements resulting from litigation.
The Company has a number of contingent environmental liabilities, which individually have been estimated to be immaterial and have not been reflected in the Company’s financial statements beyond the associated asset retirement obligations. These contingent environmental liabilities are primarily related to the migration of contamination at fuel outlets and certain legacy sites where Husky had previously conducted operations. The contingent environmental liabilities involved have been considered in aggregate and based on reasonable estimates the Company does not believe they will result, in aggregate, in a material adverse effect on its financial position, results of operations or liquidity.
PAGE 40
8.4 OFF-BALANCE SHEET ARRANGEMENTS
Accounts Receivable Securitization Program
In the ordinary course of business, Husky engaged in the securitization of accounts receivable. The securitization program permitted the sale of a maximum of $350 million of accounts receivable on a revolving basis. The securitization agreement expired on March 31, 2009 and Husky chose not to renew.
Standby Letters of Credit
In addition, from time to time, Husky issues letters of credit in connection with transactions in which the counterparty requires such security.
Derivative Instruments
Husky utilizes derivative financial instruments in order to manage unacceptable risk. The derivative financial instruments currently outstanding are listed and discussed in Section 8.6, “Financial Risk and Risk Management.”
8.5 TRANSACTIONS WITH RELATED PARTIES AND MAJOR CUSTOMERS
On May 11, 2009, the Company issued 5 and 10-year senior notes of U.S. $251 million and U.S. $107 million respectively to certain management, shareholders, affiliates and directors as part of the U.S. $1.5 billion 5 and 10-year senior notes issued through the existing base shelf prospectus, which was filed in February 2009 (refer to Note 16 to the Consolidated Financial Statements). Subsequent to this offering, U.S. $22 million of the 5-year senior notes and U.S. $75 million of the 10-year senior notes issued to related parties were sold to third parties. The coupon rates offered were 5.90% and 7.25% for the 5 and 10-year tranches respectively. These transactions were measured at the exchange amount, which was equivalent to the fair market value at the date of the transaction and have been carried out on the same terms as would apply with unrelated parties. At December 31, 2009, the senior notes were included in long-term debt on the Company’s balance sheet.
TransAlta Power, L.P. (“TAPLP”) is under the indirect control of one of Husky’s principal shareholders. TAPLP is a 49.99% owner in TransAlta Cogeneration, L.P. (“TACLP”) which is the Company’s joint venture partner for the Meridian cogeneration facility at Lloydminster. The Company sells natural gas to the Meridian cogeneration facility and other cogeneration facilities owned by TACLP. These natural gas sales are related party transactions and have been measured at the exchange amount. For 2009, the total value of natural gas sales to the Meridian and other cogeneration facilities owned by TACLP was $90 million (2008 — $125 million). At December 31, 2009, the total value of accounts receivables related to these transactions was nil (2008 — nil).
Husky did not have any customers that constituted more than 10% of total sales and operating revenues during 2009.
8.6 FINANCIAL RISK AND RISK MANAGEMENT
Husky is exposed to market risks related to the volatility of commodity prices, foreign exchange rates, interest rates, credit risk and changes in fiscal, monetary and other financial policies related to royalties, taxes and others (refer to Section 6, The 2009 Business Environment). From time to time, the Company will use derivative instruments to manage its exposure to these risks.
Husky is exposed to risk factors associated with operating in developing countries, as well as political and regulatory instability. The Company maintains close contact with governments in the areas within which it operates.
PAGE 41
In June 2009, the United States House of Representatives passed the Waxman-Markey American Clean Energy and Security Act, which requires a 17% reduction of greenhouse gas emissions from 2005 levels by 2020 and an 80% reduction by 2050. The bill also sets a system of permitting under which regulated industries would need to acquire sufficient allowances for their emissions. In September 2009, the Kerry-Boxer Clean Energy Jobs and American Power Act, which increases the required reduction of greenhouse gases to 20% by 2020, was introduced in the United States Senate. Each bill requires further legislative approvals before becoming law and their respective scope and requirements could be changed through this process before receiving final approval. Husky’s operations may be impacted by whatever legislation emerges as law. Such legislation could require U.S. refining operations to significantly reduce emissions and/or purchase allowances, which may increase capital and operating expenditures.
Commodity Price Risk Management
Husky uses derivative commodity instruments from time to time to manage exposure to price volatility on a portion of its oil and gas production and firm commitments for the purchase or sale of crude oil and natural gas.
At December 31, 2009, the Company had third party physical purchase and sale natural gas contracts and natural gas storage contracts. These contracts have been recorded at their fair value in accounts receivable and accrued liabilities and the resulting unrealized loss of $37 million has been recorded in other expenses in the Consolidated Statements of Earnings and Comprehensive Income. The natural gas inventory held in storage relating to the natural gas storage contracts is recorded at fair value. At December 31, 2009, the fair value of the inventory was $173 million, resulting in a $69 million unrealized gain recorded in other expenses in the Consolidated Statements of Earnings and Comprehensive Income.
On July 1, 2009, the Company designated certain crude oil purchase and sale contracts as fair value hedges against the changes in the fair value of the inventory held in storage. The assessment of effectiveness for the fair value hedges excludes changes between current market prices and market prices on the settlement date in the future.
These contracts have been recorded at their fair value in accounts receivable and the resulting unrealized gain of $4 million has been recorded in earnings in the Consolidated Statements of Earnings and Comprehensive Income. The crude oil inventory held in storage is recorded at fair value. At December 31, 2009, the fair value of the inventory was $124 million, resulting in a $1 million unrealized loss recorded in earnings in the Consolidated Statements of Earnings and Comprehensive Income.
Prior to July 1, 2009, the Company had entered into contracts for future crude oil purchases, whereby there is a requirement to pay the market difference of the inventory price paid at delivery and the current market price at the settlement date in the future. These contracts have settled and the resulting loss of $30 million has been recorded in other expenses in the Consolidated Statements of Earnings and Comprehensive Income.
Foreign Currency Risk Management
At December 31, 2009, Husky had the following cross currency debt swaps in place:
| | • | | U.S. $150 million at 6.25% swapped at $1.41 to $211 million at 7.41% until June 15, 2012. |
| | • | | U.S. $75 million at 6.25% swapped at $1.19 to $89 million at 5.65% until June 15, 2012. |
| | • | | U.S. $50 million at 6.25% swapped at $1.17 to $59 million at 5.67% until June 15, 2012. |
| | • | | U.S. $75 million at 6.25% swapped at $1.17 to $88 million at 5.61% until June 15, 2012. |
At December 31, 2009, the cost of a U.S. dollar in Canadian currency was $1.0466.
PAGE 42
During 2009, the Company settled its two remaining forward purchases of U.S. dollars realizing a loss of $9 million recorded in other expenses in the Consolidated Statements of Earnings and Comprehensive Income.
Husky’s results are affected by the exchange rate between the Canadian and U.S. dollar. The majority of Husky’s expenditures are in Canadian dollars. The majority of the Company’s revenues are received in U.S. dollars or from the sale of oil and gas commodities that receive prices determined by reference to U.S. benchmark prices. An increase in the value of the Canadian dollar relative to the U.S. dollar will decrease the revenues received from the sale of oil and gas commodities. Correspondingly, a decrease in the value of the Canadian dollar relative to the U.S. dollar will increase the revenues received from the sale of oil and gas commodities.
In addition, a change in the value of the Canadian dollar against the U.S. dollar will result in an increase or decrease in Husky’s U.S. dollar denominated debt, as expressed in Canadian dollars, as well as in the related interest expense. At December 31, 2009, 100% or $3.2 billion of Husky’s outstanding debt was denominated in U.S. dollars (100% or $2.0 billion at December 31, 2008). The percentage of the Company’s debt exposed to the Cdn/ U.S. exchange rate decreases to 88% when cross currency swaps are considered (2008 — 78%).
Effective July 1, 2007, Husky’s U.S. $1.5 billion of debt financing related to the Lima acquisition was designated as a hedge of the Company’s net investment in the U.S. refining operations. During 2008, the Company repaid U.S. $750 million of bridge financing and repurchased U.S. $63 million of bonds that were classified as a net investment hedge. As a result, the Company’s net investment hedge is limited to the remaining U.S. $687 million. For 2009, the unrealized foreign exchange gain arising from the translation of the debt was $104 million, net of tax expense of $18 million, which was recorded in Other Comprehensive Income.
Effective December 3, 2009, Husky designated U.S. $300 million of the U.S. $750 million senior notes due December 15, 2019 as a hedge of the Company’s net investment in the U.S. refining operations. For 2009, unrealized foreign exchange losses arising from the translation of the debt were less than $1 million, net of tax, which was recorded in Other Comprehensive Income.
Including cross-currency swaps and the debt that has been designated as a hedge of a net investment, 57% of long-term debt is exposed to changes in the U.S. / Canadian exchange rate (2008 — 35%).
Husky holds 50% of a contribution receivable which represents BP’s obligation to fund capital expenditures of the Sunrise Oil Sands Partnership and a major portion of this receivable is denominated in U.S. dollars. Related gains and losses from changes in the value of the Canadian dollar versus the U.S. dollar are recorded in foreign exchange in current period earnings. At December 31, 2009, Husky’s share of this receivable was U.S. $1.2 billion including accrued interest. Husky has an obligation to fund capital expenditures of the BP-Husky Toledo Refinery and this contribution payable is denominated in U.S. dollars. Gains and losses from the translation of this obligation are recorded in Other Comprehensive Income as this item relates to a self-sustaining foreign operation. At December 31, 2009 Husky’s share of this obligation was U.S. $1.4 billion including accrued interest.
Liquidity Risk
Liquidity risk is the risk that the Company will not be able to meets its financial obligations as they become due. The Company’s processes for managing liquidity risk include ensuring, to the extent possible, that it will have sufficient liquidity to meets its liabilities when they become due. The Company prepares annual capital expenditure budgets, which are monitored and are updated as required. In addition, the Company requires authorizations for expenditures on projects to assist with the management of capital.
PAGE 43
The following are the contractual maturities of financial liabilities as at December 31, 2009:
| | | | | | | | | | | | |
Financial Liability | | Less than
1 Year | | 1 to less than
2 Years | | 2 to less than
5 Years | | Thereafter |
Accounts payable and accrued liabilities | | $ | 2,185 | | $ | — | | $ | — | | $ | — |
Cross currency swaps | | | — | | | — | | | 447 | | | — |
Long-term debt and interest on fixed rate debt | | | 212 | | | 212 | | | 1,750 | | | 3,122 |
| | | | | | | | | | | | |
Total | | $ | 2,397 | | $ | 212 | | $ | 2,197 | | $ | 3,122 |
| | | | | | | | | | | | |
The Company’s objectives, processes and policies for managing liquidity risk have not changed from the previous year.
Interest Rate Risk Management
In 2009, interest rate risk management activities resulted in a decrease to interest expense of less than $1 million.
At December 31, 2009, Husky had the following interest rate swaps in place:
| | • | | U.S. $100 million of long-term debt whereby a fixed interest rate of 7.55% was swapped for LIBOR + 420 bps until November 15, 2016. |
| | • | | U.S. $275 million of long-term debt whereby a fixed interest rate of 6.20% was swapped for LIBOR + 265 bps blended until September 15, 2017. |
During 2009, these swaps resulted in an offset to interest expense amounting to less than $1 million.
In 2008, interest rate swaps on $200 million of long-term debt were discontinued as a fair value hedge as the $200 million medium-term notes were redeemed. During 2009, a loss of less than $1 million was recognized in other expenses in the Consolidated Statements of Earnings and Comprehensive Income.
The amortization of previous interest rate swap terminations resulted in an additional $3 million offset to interest expense in 2009.
Cross currency swaps resulted in an addition to interest expense of $4 million in 2009.
Credit and Contract Risk
Husky actively manages its exposure to credit and contract execution risk from both a customer and a supplier perspective.
Fair Value of Financial Instruments
The derivative portion of cashflow hedges, fair value hedges, and free standing derivatives that are recorded at fair value on a recurring basis have been categorized into one of three categories based upon fair value hierarchy in accordance with the Canadian Institute of Chartered Accountants (“CICA”) Handbook Section 3862. Fair values of assets and liabilities included in Level 1 are determined by reference to quoted prices in active markets for identical assets and liabilities. Assets and liabilities in Level 2 include valuations using inputs other than quoted prices for which all significant outputs are observable, either directly or indirectly. Level 3 valuations are based on inputs that are unobservable and significant to the overall fair value measurement. All of Husky’s assets and liabilities that are recorded at fair value on a recurring basis are included in Level 2.
PAGE 44
8.7 OUTSTANDING SHARE DATA
Authorized:
| | • | | unlimited number of common shares |
| | • | | unlimited number of preferred shares |
Issued and outstanding: February 23, 2010
| | |
• common shares | | 849,860,935 |
• preferred shares | | none |
• stock options | | 28,281,307 |
• stock options exercisable | | 14,915,410 |
At February 23, 2010, 49.2 million common shares were reserved for issuance under the stock option plan. Other than in respect of the performance based upon, options awarded under the stock option plan have a maximum term of five years and vest evenly over the first three years (refer to Note 20 to the Consolidated Financial Statements).
9.0 Application of Critical Accounting Estimates
Husky’s Consolidated Financial Statements have been prepared in accordance with GAAP. Significant accounting policies are disclosed in Note 3 to the Consolidated Financial Statements. Certain of the Company’s accounting policies require subjective judgment about uncertain circumstances. The following discussion highlights the nature and potential effect of these estimates. The emergence of new information and changed circumstances may result in actual results or changes to estimated amounts that differ materially from current estimates.
Full Cost Accounting for Oil and Gas Activities
The indicated change in the following estimates will result in a corresponding increase in the amount of DD&A expense charged to income in a given period:
An increase in:
| | • | | estimated costs to develop the proved undeveloped reserves; |
| | • | | estimated fair value of the Asset Retirement Obligation (“ARO”) related to the oil and gas properties; and |
| | • | | estimated impairment of costs excluded from the DD&A calculation. |
A decrease in:
| | • | | previously estimated proved oil and gas reserves; and |
| | • | | estimated proved reserves added compared to capital invested. |
Depletion Expense
All costs associated with exploration and development are capitalized on a country-by-country basis. The aggregate of capitalized costs, net of accumulated DD&A, plus the estimated costs required to develop the proved undeveloped reserves, less estimated salvage values, is charged to income over the life of the proved reserves using the unit of production method.
PAGE 45
Withheld Costs
Costs related to unproved properties and major development projects are excluded from costs subject to depletion until proved reserves have been determined or their value is impaired. Impairment is transferred to costs being depleted or, if the properties are located in a cost centre where there is no reserve base, the impairment is charged directly to earnings.
Ceiling Test
Each cost centre’s capitalized costs are tested for recoverability at least yearly. The test compares the estimated undiscounted future net cash flows from proved oil and gas reserves based on forecast prices and costs to the carrying amount of a cost centre. If the future cash flows are lower than the carrying costs, the cost centre is written down to its fair value. Fair value is estimated using present value techniques, which incorporate risks and other uncertainties as well as the future value of reserves when determining estimated cash flows.
Impairment of Long-lived Assets
Impairment is indicated if the carrying value of the long-lived asset or oil and gas cost centre is not recoverable by the future undiscounted cash flows. If impairment is indicated, the amount by which the carrying value exceeds the estimated fair value of the long-lived asset is charged to earnings.
Fair Value of Derivative Instruments
Periodically Husky utilizes financial derivatives to manage market risk. Effective January 1, 2007, Husky adopted CICA Handbook Section 3855, “Financial Instruments—Recognition and Measurement,” Section 3865, “Hedges,” Section 1530, “Comprehensive Income” and Section 3862, “Financial Instruments — Disclosure and Presentation.” These standards provide the recognition, measurement and disclosure requirements for financial instruments and hedge accounting. Refer to Note 23 in the Consolidated Financial Statements.
The estimation of the fair value of commodity derivatives incorporates forward prices and adjustments for quality or location. The estimate of fair value for interest rate and foreign currency hedges is determined primarily through forward market prices and compared with quotes from financial institutions. The estimation of fair value of forward purchases of U.S. dollars is determined using forward market prices.
Asset Retirement Obligation
Husky has significant obligations to remove tangible assets and restore land after operations cease and Husky retires or relinquishes the asset. The Company’s ARO primarily relates to the upstream business. The retirement of upstream assets consists primarily of plugging and abandoning wells, removing and disposing of surface and subsea equipment and facilities and restoration of land to a state required by regulation or contract. Estimating the ARO requires that Husky estimate costs that are many years in the future. Restoration technologies and costs are constantly changing, as are regulatory, political, environmental, safety and public relations considerations.
Inherent in the calculation of the ARO are numerous assumptions and judgments including the ultimate settlement amounts, future third-party pricing, inflation factors, credit adjusted discount rates, timing of settlement and changes in the legal, regulatory, environmental and political environments. Future revisions to these assumptions result in changes to the ARO.
Employee Future Benefits
The determination of the cost of the post-retirement health and dental care plan and defined benefit pension plan reflects a number of assumptions that affect the expected future benefit payments. These assumptions
PAGE 46
include, but are not limited to, attrition, mortality, the rate of return on pension plan assets and salary escalations for the defined benefit pension plan and expected health care cost trends for the post-retirement health and dental care plan. The fair value of the plan assets are used for the purposes of calculating the expected return on plan assets.
Legal, Environmental Remediation and Other Contingent Matters
Husky is required to both determine whether a loss is probable based on judgment and interpretation of laws and regulations and determine that the loss can reasonably be estimated. When the loss is determined it is charged to earnings. Husky must continually monitor known and potential contingent matters and make appropriate provisions by charges to earnings when warranted by circumstances.
Income Tax Accounting
The determination of the Company’s income and other tax liabilities requires interpretation of complex laws and regulations often involving multiple jurisdictions. All tax filings are subject to audit and potential reassessment after the lapse of considerable time. Accordingly, the actual income tax liability may differ significantly from that estimated and recorded by management.
Business Combinations
Under the purchase method, the acquiring company includes the fair value of the various assets and liabilities of the acquired entity on its balance sheet. The determination of fair value necessarily involves many assumptions. In some circumstances the fair value of an asset is determined by estimating the amount and timing of future cash flow associated with that asset. The actual amounts and timing of cash flow may differ materially and may possibly lead to an impairment charged to earnings.
Goodwill
In combination with purchase accounting, any excess of the purchase price over fair value is recorded as goodwill. Since goodwill results from the culmination of purchase accounting, described above, it too is inherently imprecise. Goodwill must be assessed annually for impairment and requires judgment in the determination of the fair value of assets and liabilities.
10.0 New and Pending Accounting Standards
10.1 NEW ACCOUNTING STANDARDS
Goodwill and Intangible Assets
Effective January 1, 2009, the Company retroactively adopted CICA Handbook Section 3064, “Goodwill and Intangible Assets,” which replaced Section 3062 of the same name. As a result of issuing this guidance, Section 3450, “Research and Development Costs,” and Emerging Issues Committee (“EIC”) Abstract No. 27, “Revenues and Expenditures during the Pre-operating Period,” have been withdrawn. This new guidance requires recognizing all goodwill and intangible assets in accordance with Section 1000, “Financial Statement Concepts.” Section 3064 has eliminated the practice of recognizing items as assets that do not meet the Section 1000 definition and recognition criteria. Under this new guidance, fewer items meet the criteria for capitalization.
This adoption has resulted in a reduction of retained earnings at January 1, 2007 of $9 million, a reduction of earnings after tax of $3 million and $13 million for the years ended December 31, 2008 and 2007, respectively, and a reduction to assets of $36 million and $31 million as at December 31, 2008 and 2007, respectively (refer to Note 4 to the Consolidated Financial Statements).
PAGE 47
Financial Instruments
Effective July 1, 2009, the Company prospectively adopted the amendments to CICA Handbook Section 3855, “Financial Instruments — Recognition and Measurement.” Amendments to this section have prohibited the reclassification of a financial asset out of the held-for-trading category when the fair value of the embedded derivative in a combined contract cannot be reasonably measured. The adoption of the amendments to this standard did not have an impact on the Company’s financial statements.
Effective September 30, 2009, the Company adopted the amendments to CICA Handbook Section 3855, “Financial Instruments — Recognition and Measurement,” in relation to the impairment of financial assets. Amendments to this section have revised the definition of “loans and receivables” and provided that certain conditions have been met, permits reclassification of financial assets from the held-for-trading and available-for-sale categories into the loans and receivables category. The amendments also provide one method of assessing impairment for all financial assets regardless of classification. These amendments are effective for the Company’s annual financial statements relating to its fiscal year beginning on January 1, 2009. The adoption of the amendments to this standard did not have an impact on the Company’s financial statements.
Effective December 31, 2009, the Company adopted the amendments to CICA Handbook Section 3862, “Financial Instruments — Disclosures,” to include additional disclosure requirements about fair value measurement for financial instruments and liquidity risk disclosures. These amendments require a three level hierarchy that reflects the significance of the inputs used in making the fair value measurements. Fair values of assets and liabilities included in Level 1 are determined by reference to quoted prices in active markets for identical assets and liabilities. Assets and liabilities in Level 2 include valuations using inputs other than quoted prices for which all significant outputs are observable, either directly or indirectly. Level 3 valuations are based on inputs that are unobservable and significant to the overall fair value measurement. Amendments to this standard are reflected in note disclosures for financial instruments.
10.2 PENDING ACCOUNTING PRONOUNCEMENTS
Business Combinations
In December 2008, the CICA issued Section 1582 “Business Combinations,” which will replace CICA Handbook Section 1581 of the same name. Under this guidance, the purchase price used in a business combination is based on the fair value of shares exchanged at their market price at the date of the exchange. Currently the purchase price used is based on the market price of the shares for a reasonable period before and after the date the acquisition is agreed upon and announced. This new guidance generally requires all acquisition costs to be expensed, which currently are capitalized as part of the purchase price. Contingent liabilities are to be recognized at fair value at the acquisition date and remeasured at fair value through earnings each period until settled. Currently only contingent liabilities that are resolved and payable are included in the cost to acquire the business. In addition, negative goodwill is required to be recognized immediately in earnings, unlike the current requirement to eliminate it by deducting it from non-current assets in the purchase price allocation. Section 1582 will be effective for Husky on January 1, 2011 with prospective application.
Consolidated Financial Statements
In January 2009, the CICA issued Section 1601, “Consolidated Financial Statements,” which will replace CICA Handbook Section 1600 of the same name. This guidance requires uniform accounting policies to be consistent throughout all consolidated entities and the difference between reporting dates of a parent and a subsidiary to be no longer than three months. These are not explicitly required under the current standard. Section 1601 is effective for Husky on January 1, 2011 with early adoption permitted. This standard will have no impact to the Company.
PAGE 48
Non-Controlling Interests
In January 2009, the CICA issued Section 1602, “Non-controlling Interests,” which will replace CICA Handbook Section 1600, “Consolidated Financial Statements.” Minority interest is now referred to as non-controlling interest, (“NCI”), and is presented within equity. Under this new guidance, when there is a loss or gain of control the Company’s previously held interest is revalued at fair value. Currently an increase in an investment is accounted for using the purchase method and a decrease in an investment is accounted for as a sale resulting in a gain or loss in earnings. In addition, NCI may be reported at fair value or at the proportionate share of the fair value of the acquired net assets and allocation of the net income to the NCI will be on this basis. Currently, NCI is recorded at the carrying amount and can only be in a deficit position if the NCI has an obligation to fund the losses. Section 1602 is effective for Husky on January 1, 2011 with early adoption permitted.
International Financial Reporting Standards
In January 2006, the Canadian Accounting Standards Board (“AcSB”) adopted a strategic plan for the direction of accounting standards in Canada. In February 2008, as part of its strategic plan, the AcSB confirmed that Canadian publicly accountable entities will be required to report under International Financial Reporting Standards (“IFRS”), which will replace Canadian GAAP for years beginning on or after January 1, 2011. An omnibus exposure draft was issued by the AcSB in the second quarter of 2008, which incorporates IFRS into the CICA Handbook and prescribes the transitional provisions for adopting IFRS. In March 2009, the AcSB issued a second omnibus exposure draft on the adoption of IFRS. This exposure draft confirms the IFRS transition date as January 1, 2011 for all Canadian publicly accountable enterprises, incorporates any changes to IFRS since the previous exposure draft was issued and discusses additional key transitional issues. In October 2009, the AcSB issued a third omnibus exposure draft on the adoption of IFRS. This exposure draft incorporates changes to IFRS since the previous exposure draft that will be applicable to Canadian entities.
The Company commenced its IFRS transition project in 2008, which includes four key phases:
| | • | | Project awareness and engagement— This phase includes identifying and engaging the appropriate members for the core IFRS transition team, steering committee and other representatives as required. In addition, this phase includes communicating the key project requirements and objectives to the areas of the organization that will be impacted by IFRS conversion, including the Company’s senior executive management team, Board of Directors and Audit Committee. |
| | • | | Diagnostic— This phase includes an assessment of the differences between current Canadian GAAP and IFRS, focusing on the areas which will have the most significant impact to Husky. A preliminary conversion roadmap has been prepared as part of this phase. |
| | • | | Design, planning and solution development— This phase focuses on determining the specific impacts to the Company based on the application of the IFRS requirements. This includes the design and development of detailed solutions and work plans by each key area to address implementation requirements. In addition, impact analysis will be performed on all areas of the business, including tax and information technology systems. Accounting policies will be finalized, first-time adoption exemptions will be considered, draft financial statements and disclosures will be prepared and a detailed implementation plan and timeline will be developed. This phase also includes the development of a training plan. |
| | • | | Implementation— This phase includes implementing the required changes necessary for IFRS compliance. The focus of this phase is the finalization of IFRS conversion impacts, approval and implementation of accounting and tax policies, implementation and testing of new processes, systems and controls, execution of customized training programs and preparation of opening IFRS balances. |
Corporate governance over the project has been established and a steering committee and project team have been formed. This committee is comprised of members of senior executive management and is responsible for
PAGE 49
final approval of project recommendations and deliverables to the Audit Committee and Board. Due to the scope of the IFRS project, the Company ensured that the appropriate stakeholders have been engaged by establishing a project advisory committee, which includes representatives from each area of the organization that will be significantly impacted. Husky has also engaged an external advisor to assist with the IFRS conversion process.
The Company completed the diagnostic assessment phase by performing comparisons of the differences between Canadian GAAP and IFRS. The Company has determined that the most significant impact of IFRS conversion is to property, plant and equipment. IFRS does not prescribe specific oil and gas accounting guidance other than for costs associated with the exploration and evaluation phase. The Company currently follows full cost accounting as prescribed in Accounting Guideline (“AcG”) 16, “Oil and Gas Accounting — Full Cost.” Conversion to IFRS will significantly impact how the Company accounts for costs pertaining to oil and gas activities, in particular those related to the pre-exploration and development phases. In addition, the level at which impairment tests are performed and the impairment testing methodology will differ under IFRS.
In July 2009, the International Accounting Standards Board (“IASB”) approved additional IFRS transitional exemptions that will allow entities to allocate their oil and gas asset balances as determined under full cost accounting to the IFRS categories of exploration and evaluation assets and development and producing properties. This exemption will relieve entities from significant adjustments resulting from retrospective adoption of IFRS. The Company intends to utilize this exemption. Husky is also evaluating other first-time adoption exemptions available upon transition which give relief from retrospective application of IFRS. In 2009, the Company progressed significantly into the implementation phase for key areas including property, plant, and equipment.
The Company completed its most significant IT systems conversion for property, plant, and equipment in the first month of 2010. This IT initiative requires the Company complete its full cost exemption allocation and track assets at the level required for compliance with IFRS while maintaining appropriate asset data for Canadian GAAP reporting. System initiatives for other areas of convergence including asset retirement obligation and foreign exchange are scheduled to be completed in the first half of 2010. The Company intends to quantify the impacts of the IFRS conversion on key areas in 2010 and to focus on creation of 2010 quarterly data in compliance with IFRS.
The Company continues to focus on analyzing and developing implementation strategies and processes for other key IFRS transition issues identified. Assessments of other impacts completed to date include foreign exchange, revenue recognition, provisions and asset retirement obligations. Where applicable, key IFRS transition alternatives have been evaluated and implementation has commenced. The Company continues to perform preliminary accounting assessments on less critical IFRS transition issues and has commenced analysis of IFRS financial statement presentation and disclosure requirements. These assessments will need to be further analyzed and evaluated throughout the implementation phase of the Company’s project and these impacts continue to be assessed by the Company. At this time, the impact on the Company’s financial position and results of operations is not reasonably determinable or estimable for any of the IFRS conversion impacts identified.
As accounting policies are finalized by the Company, initiatives will commence to incorporate conversion impacts into existing internal controls over financial reporting and disclosure controls and procedures. In the first quarter of 2010, the Company will complete its risk assessment of key processes that will be impacted by IFRS. Internal control process documents are expected to be updated and implemented in the second half of 2010.
The Company’s response to the global economic and financial crisis has had no significant impact to its IFRS conversion project plan.
In addition, the Company continues to monitor the IASB’s active projects and all changes to IFRS prior to January 1, 2011 will be incorporated as required.
PAGE 50
11.0 Reader Advisories
11.1 FORWARD-LOOKING STATEMENTS
Certain statements in this MD&A are forward-looking statements within the meaning of Section 21E of the United States Securities Exchange Act of 1934, as amended, and Section 27A of the United States Securities Act of 1933, as amended and forward-looking information within the meaning of applicable Canadian securities legislation (collectively “forward-looking statements”). The Company hereby provides cautionary statements identifying important factors that could cause actual results to differ materially from those projected in these forward-looking statements. Any statements that express, or involve discussions as to, expectations, beliefs, plans, objectives, assumptions or future events or performance (often, but not always, through the use of words or phrases such as “will likely result,” “are expected to,” “will continue,” “is anticipated,” “estimated,” “intend,” “plan,” “projection,” “could,” “vision,” “goals,” “objective,” “target,” “schedules” and “outlook”) are not historical facts, are forward-looking and may involve estimates and assumptions and are subject to risks, uncertainties and other factors some of which are beyond the Company’s control and difficult to predict. Accordingly, these factors could cause actual results or outcomes to differ materially from those expressed in the forward-looking statements.
In particular, forward-looking statements in this MD&A include, but are not limited to: the Company’s general strategic plans; strategic plans for the upstream, midstream and downstream business segments; reserve estimates; development and production plans for the White Rose development projects; exploration plans for Canada’s East Coast; offshore Greenland exploration plans; offshore China exploration plans; exploration and development plans for the Liuhua 34-2 discovery and development and production plans for the Liwan 3-1 discovery; exploration and drilling plans for the North Sumbawa II Block; receipt of an extension of the PSC for the Madura BD field; development plans, anticipated project sanctions, production plans and production capacity for the Sunrise Project; production optimization and drilling plans for the Tucker Oil Sands Project; testing and implementation of various enhanced recovery techniques in Western Canada; production plans for the McMullen property; production plans for the Pikes Peak South project; conventional and shale gas exploration plans for Western Canada; the Company’s coal bed methane program; reconfiguration plans for the Lima Refinery; Continuous Catalyst Regeneration Reformer Project plans; planned execution of the agreement to purchase southern Ontario retail outlets; plans to reposition and upgrade the Toledo Refinery; expectations in respect of the timing of the Terra Nova redetermination; 2010 production guidance; 2010 capital expenditure guidance; and 2010 payments to be made pursuant to existing contractual obligations.
Although the Company believes that the expectations reflected by the forward-looking statements presented in this document are reasonable, the Company’s forward-looking statements have been based on assumptions and factors concerning future events that may prove to be inaccurate. Those assumptions and factors are based on information currently available to the Company about itself and the businesses in which it operates. In addition, information used in developing forward-looking statements has been acquired from various sources including third party consultants, suppliers, regulators and other sources.
The Company’s Annual Information Form filed with securities regulatory authorities (accessible through the SEDAR website www.sedar.com and the EDGAR website www.sec.gov) describes the risks, material assumptions and other factors that could influence actual results and are incorporated herein by reference.
Any forward-looking statement speaks only as of the date on which such statement is made, and, except as required by applicable law, the Company undertakes no obligation to update any forward-looking statement to reflect events or circumstances after the date on which such statement is made or to reflect the occurrence of unanticipated events. New factors emerge from time to time, and it is not possible for management to predict all of such factors and to assess in advance the impact of each such factor on the Company’s business or the extent to which any factor, or combination of factors, may cause actual results to differ materially from those contained in any forward-looking statement.
PAGE 51
11.2 OIL AND GAS RESERVE REPORTING
Disclosure of Oil and Gas Reserves and Other Oil and Gas Information
The Company’s disclosure of proved and probable oil and gas reserves and other information about its oil and gas activities has been made based in reliance on an exemption granted by Canadian Securities Administrators. The exemption permits the Company to make these disclosures in accordance with U.S. requirements relating to the disclosure of oil and gas reserves and other information. These requirements and, consequently, the information presented may differ from Canadian requirements under National Instrument 51-101, “Standards of Disclosure for Oil and Gas Activities.” The reserves estimates and related disclosures presented in this document have been prepared in accordance with the definitions in Regulation S-X and the disclosure requirements in Regulation S-K prescribed by the United States Securities and Exchange Commission. Please refer to “Disclosure of Exemption under National Instrument 51-101” in the Annual Information Form for the year ended December 31, 2009 filed with securities regulatory authorities for further information.
The Company uses the terms barrels of oil equivalent (“boe”) and thousand cubic feet of gas equivalent (“mcfge”), which are calculated on an energy equivalence basis whereby one barrel of crude oil is equivalent to six thousand cubic feet of natural gas. Readers are cautioned that the terms boe and mcfge may be misleading, particularly if used in isolation. This measure is primarily applicable at the burner tip and does not represent value equivalence at the well head.
11.3 NON-GAAP MEASURES
Disclosure of non-GAAP Measurements
Husky uses measurements primarily based on GAAP and also on secondary non-GAAP measurements. The non-GAAP measurements included in this report are: cash flow from operations, operating netback, return on equity, return on capital employed, debt to capitalization and corporate reinvestment ratio. None of these measurements are used to enhance the Company’s reported financial performance or position. These are useful complementary measurements in assessing Husky’s financial performance, efficiency and liquidity. They are common in the reports of other companies but may differ by definition and application. Except as described below, the definitions of these measurements are found in Section 11.4, “Additional Reader Advisories.”
Disclosure of Cash Flow from Operations
Husky uses the term “cash flow from operations,” which should not be considered an alternative to, or more meaningful than “cash flow — operating activities” as determined in accordance with GAAP, as an indicator of financial performance. Cash flow from operations or earnings is presented in the Company’s financial reports to assist management and investors in analyzing operating performance by business in the stated period. Husky’s determination of cash flow from operations may not be comparable to that reported by other companies. Cash flow from operations equals net earnings plus items not affecting cash which include accretion, depletion, depreciation and amortization, future income taxes, foreign exchange and other non-cash items.
The following table shows the reconciliation of cash flow from operations to cash flow — operating activities for the years ended December 31:
| | | | | | | | | | | | |
| ($ millions) | | 2009 | | | 2008 | | | 2007 | |
Non-GAAP Cash flow from operations | | $ | 2,507 | | | $ | 5,946 | | | $ | 5,388 | |
Settlement of asset retirement obligations | | | (41 | ) | | | (56 | ) | | | (51 | ) |
Change in non-cash working capital | | | (548 | ) | | | 888 | | | | (718 | ) |
| | | | | | | | | | | | |
GAAP Cash flow – operating activities | | $ | 1,918 | | | $ | 6,778 | | | $ | 4,619 | |
| | | | | | | | | | | | |
PAGE 52
Disclosure of Operating Netback
Operating netback is a common non-GAAP metric used in the oil and gas industry. This measurement helps management and investors to evaluate the specific operating performance by product at the oil and gas lease level. It is equal to product revenue less transportation costs, royalties and lease operating costs divided by either a barrel of oil equivalent or a mcf of gas equivalent.
11.4 ADDITIONAL READER ADVISORIES
Intention of Management’s Discussion and Analysis
This MD&A is intended to provide an explanation of financial and operational performance compared with prior periods and the Company’s prospects and plans. It provides additional information that is not contained in the Company’s financial statements.
Review by the Audit Committee
This MD&A was reviewed by the Audit Committee and approved by Husky’s Board of Directors on February 24, 2010. Any events subsequent to that date could conceivably materially alter the veracity and usefulness of the information contained in this document.
Additional Husky Documents Filed with Securities Commissions
This MD&A should be read in conjunction with the Consolidated Financial Statements and related notes. The readers are also encouraged to refer to Husky’s interim reports filed in 2009, which contain MD&A and Consolidated Financial Statements, and Husky’s Annual Information Form filed separately with Canadian regulatory agencies and Form 40-F filed with the SEC, the U.S. regulatory agency. These documents are available atwww.sedar.com, atwww.sec.gov andwww.huskyenergy.com.
Use of Pronouns and Other Terms
“Husky” and “the Company” refer to Husky Energy Inc. on a consolidated basis.
Standard Comparisons in this Document
Unless otherwise indicated, comparisons of results are for the years ended December 31, 2009 and 2008 and Husky’s financial position as at December 31, 2009 and at December 31, 2008.
Reclassifications and Materiality for Disclosures
Certain prior year amounts have been reclassified to conform to current year presentation. Materiality for disclosures is determined on the basis of whether the information omitted or misstated would cause a reasonable investor to change their decision to buy, sell or hold the securities of Husky.
Additional Reader Guidance
Unless otherwise indicated:
| | • | | Financial information is presented in accordance with GAAP in Canada. Significant differences between Canadian and United States GAAP are disclosed in the U.S. GAAP reconciliation contained in Form 40-F and available atwww.sec.gov. |
| | • | | Currency is presented in millions of Canadian dollars (“$”). |
| | • | | Gross production and reserves are Husky’s working interest prior to deduction of royalty volume. |
PAGE 53
| | • | | Prices are presented before the effect of hedging. |
| | • | | Light crude oil is 30º API and above. |
| | • | | Medium crude oil is 21º API and above but below 30º API. |
| | • | | Heavy crude oil is above 10º API but below 21º API. |
| | • | | Bitumen is solid or semi-solid with a viscosity greater than 10,000 centipoise at original temperature in the deposit and atmospheric pressure. |
TERMS
| | |
| Bitumen | | Bitumen is petroleum in a solid or semi-solid state in natural deposits with a viscosity greater than 10,000 centipoise measured at original temperature in the deposit and atmospheric pressure, on a gas free basis. In its natural state it usually contains sulphur, metals and other non-hydrocarbons |
| Brent Crude Oil | | Prices which are dated less than 15 days prior to loading for delivery |
| Capital Employed | | Short and long-term debt and shareholders’ equity |
| Capital Expenditures | | Includes capitalized administrative expenses and capitalized interest but does not include proceeds or other assets |
| Capital Program | | Capital expenditures not including capitalized administrative expenses or capitalized interest |
| Cash Flow from Operations | | Earnings from operations plus non-cash charges before settlement of asset retirement obligations and change in non-cash working capital |
| Coal Bed Methane | | Methane (CH4), the principal component of natural gas, is adsorbed in the pores of coal seams |
| Corporate Reinvestment Ratio | | Net capital expenditures (capital expenditures net of proceeds from asset sales) plus corporate acquisitions (net assets acquired) divided by cash flow from operations |
| Debt to Capitalization | | Total debt divided by total debt and shareholders’ equity |
| Design Rate Capacity | | Maximum continuous rated output of a plant based on its design |
| Embedded Derivative | | Implicit or explicit term(s) in a contract that affects some or all of the cash flows or the value of other exchanges required by the contract |
| Feedstock | | Raw materials which are processed into petroleum products |
| Front End Engineering Design | | Preliminary engineering and design planning, which among other things, identifies project objectives, scope, alternatives, specifications, risks, costs, schedule and economics |
| Glory Hole | | An excavation in the seabed where the wellheads and other equipment are situated to protect them from scouring icebergs |
| Gross/Net Acres/Wells | | Gross refers to the total number of acres/wells in which a working interest is owned. Net refers to the sum of the fractional working interests owned by a company |
| Gross Reserves/Production | | A company’s working interest share of reserves/production before deduction of royalties |
| Interest Coverage Ratio | | A calculation of a company’s ability to meet its interest payment obligation. It is equal to earnings before income taxes and interest divided by interest paid before deduction of capitalized interest |
| NOVA Inventory Transfer | | Exchange or transfer of title of gas that has been received into the NOVA pipeline system but not yet delivered to a connecting pipeline |
| Polymer | | A substance which has a molecular structure built up mainly or entirely of many similar units bonded together |
PAGE 54
| | |
| Return on Capital Employed | | Net earnings plus after tax interest expense divided by average capital employed |
| Return on Shareholders’ Equity | | Net earnings divided by average shareholders’ equity |
| Seismic | | A method by which the physical attributes in the outer rock shell of the earth are determined by measuring, with a seismograph, the rate of transmission of shock waves through the various rock formations |
| Shareholders’ Equity | | Shares, retained earnings and accumulated other comprehensive income |
| Total Debt | | Long-term debt including current portion and bank operating loans |
“Proved oil and gas reserves” are those quantities of oil and gas, which, by analysis of geoscience and engineering data, can be estimated with reasonable certainty to be economically producible from a given date forward, from known reservoirs, and under existing economic conditions, operating methods, and government regulations.
“Proved developed oil and gas reserves” are proved reserves that can be expected to be recovered: (i) through existing wells with existing equipment and operating methods or in which the cost of the required equipment is relatively minor compared to the cost of a new well; and (ii) through installed extraction equipment and infrastructure operational at the time of the reserves estimate if the extraction is by means not involving a well.
“Proved Undeveloped” reserves are those reserves that are expected to be recovered from new wells on undrilled acreage, or from existing wells for which a relatively major expenditure is required for recompletion. Inclusion of reserves on undrilled acreage is limited to those drilling units offsetting productive units that are reasonably certain of production when drilled. Undrilled locations are classified as having undeveloped reserves only if a development plan has been adopted indicating that they are scheduled to be drilled within five years. Estimates for proved undeveloped reserves are not attributed to any acreage for which an application of fluid injection or other improved recovery technique is contemplated, unless such techniques have been proved effective by actual tests in the area and in the same reservoir.
“Probable” reserves are those additional reserves that are less certain to be recovered than proved reserves, but which taken together with proved reserves, are as likely as not to be recovered.
ABBREVIATIONS
| | |
| bbls | | barrels |
| bps | | basis points |
| mbbls | | thousand barrels |
| mbbls/day | | thousand barrels per day |
| mmbbls | | million barrels |
| mcf | | thousand cubic feet |
| mmcf | | million cubic fee |
| mmcf/day | | million cubic feet per day |
| bcf | | billion cubic feet |
| tcf | | trillion cubic feet |
| boe | | barrels of oil equivalent |
| mboe | | thousand barrels of oil equivalent |
| mboe/day | | thousand barrels of oil equivalent per day |
| mmboe | | million barrels of oil equivalent |
| mcfge | | thousand cubic feet of gas equivalent |
| GAAP | | Generally Accepted Accounting Principles |
PAGE 55
| | |
| GJ | | gigajoule |
| mmbtu | | million British Thermal Units |
| mmlt | | million long tons |
| MW | | megawatt |
| NGL | | natural gas liquids |
| WTI | | West Texas Intermediate |
| NYMEX | | New York Mercantile Exchange |
| NIT | | NOVA Inventory Transfer |
| LIBOR | | London Interbank Offered Rate |
| CDOR | | Certificate of Deposit Offered Rate |
| SEDAR | | System for Electronic Document Analysis and Retrieval |
| FPSO | | Floating production, storage and offloading vessel |
| FEED | | Front end engineering design |
| OPEC | | Organization of Petroleum Exporting Countries |
| PIIP | | Petroleum initially-in-place |
| SAGD | | Steam assisted gravity drainage |
| MD&A | | Management’s Discussion and Analysis |
| C-NLOPB | | Canada-Newfoundland and Labrador Offshore Petroleum Board |
11.5 Controls and Procedures
Disclosure Controls and Procedures
Husky’s management, with the participation of the Chief Executive Officer and the Chief Financial Officer, have evaluated the effectiveness of Husky’s disclosure controls and procedures (as defined in the rules of the SEC and the Canadian Securities Administrators (“CSA”)) as at December 31, 2009, and have concluded that such disclosure controls and procedures are effective to ensure that information required to be disclosed by Husky in reports that it files or submits under the Securities Exchange Act of 1934 and Canadian securities laws is (i) recorded, processed, summarized and reported within the time periods specified in SEC rules and forms and Canadian securities laws and (ii) accumulated and communicated to Husky’s management, including its principal executive officer and principal financial officer, to allow timely decisions regarding required disclosure.
Management’s Annual Report on Internal Control over Financial Reporting
The following report is provided by management in respect of Husky’s internal controls over financial reporting (as defined in the rules of the SEC and the CSA):
| | 1) | Husky’s management is responsible for establishing and maintaining adequate internal control over financial reporting for Husky. All internal control systems, no matter how well designed, have inherent limitations. Therefore, even those systems determined to be effective can provide only reasonable assurance with respect to financial statement preparation and presentation. |
| | 2) | Husky’s management has used the Committee of Sponsoring Organizations of the Treadway Commission (“COSO”) framework to evaluate the effectiveness of Husky’s internal control over financial reporting. |
| | 3) | As at December 31, 2009, management assessed the effectiveness of Husky’s internal control over financial reporting and concluded that such internal control over financial reporting is effective and that there are no material weaknesses in Husky’s internal control over financial reporting that have been identified by management. |
| | 4) | KPMG LLP, who has audited the Consolidated Financial Statements of Husky for the year ended December 31, 2009, has also issued a report on internal controls over financial reporting under Auditing Standard No. 5 of the Public Company Accounting Oversight Board (United States). |
PAGE 56
Changes in Internal Control over Financial Reporting
There have been no changes in Husky’s internal control over financial reporting during the year ended December 31, 2009, that have materially affected, or are reasonably likely to materially affect its internal control over financial reporting.
12.0 Selected Quarterly Financial & Operating Information
Segmented Operational Information
| | | | | | | | | | | | | | | | | | | | | | | | |
| | | 2009 | | 2008 |
| | | Q4 | | Q3 | | Q2 | | Q1 | | Q4 | | Q3 | | Q2 | | Q1 |
Upstream Daily production, before royalties | | | | | | | | | | | | | | | | | | | | | | | | |
Light crude oil & NGL(mbbls/day) | | | 76.7 | | | 62.5 | | | 99.3 | | | 119.0 | | | 125.9 | | | 121.7 | | | 123.6 | | | 120.5 |
Medium crude oil(mbbls/day) | | | 24.8 | | | 24.8 | | | 25.6 | | | 26.3 | | | 26.6 | | | 26.9 | | | 27.0 | | | 26.9 |
Heavy crude oil(mbbls/day) | | | 78.6 | | | 75.7 | | | 78.1 | | | 82.1 | | | 86.8 | | | 84.4 | | | 83.8 | | | 82.6 |
Bitumen(mbbls/day) | | | 23.3 | | | 24.0 | | | 22.2 | | | 22.7 | | | 23.9 | | | 23.2 | | | 21.7 | | | 21.7 |
| | | | | | | | | | | | | | | | | | | | | | | | |
| | | 203.4 | | | 187.0 | | | 225.2 | | | 250.1 | | | 263.2 | | | 256.2 | | | 256.1 | | | 251.7 |
Natural gas(mmcf/day) | | | 528.7 | | | 535.0 | | | 552.3 | | | 551.2 | | | 571.1 | | | 598.3 | | | 618.0 | | | 590.4 |
Total production(mboe/day) | | | 291.5 | | | 276.2 | | | 317.2 | | | 342.0 | | | 358.4 | | | 355.9 | | | 359.1 | | | 350.1 |
Average sales prices | | | | | | | | | | | | | | | | | | | | | | | | |
Light crude oil & NGL($/bbl) | | $ | 73.98 | | $ | 67.56 | | $ | 65.32 | | $ | 50.42 | | $ | 58.43 | | $ | 114.85 | | $ | 121.71 | | $ | 95.20 |
Medium crude oil($/bbl) | | $ | 65.78 | | $ | 61.28 | | $ | 58.32 | | $ | 40.68 | | $ | 47.02 | | $ | 103.60 | | $ | 101.87 | | $ | 74.30 |
Heavy crude oil($/bbl) | | $ | 61.55 | | $ | 59.21 | | $ | 54.22 | | $ | 35.80 | | $ | 39.08 | | $ | 95.66 | | $ | 89.92 | | $ | 64.30 |
Bitumen($/bbl) | | $ | 60.70 | | $ | 58.44 | | $ | 53.32 | | $ | 34.23 | | $ | 37.93 | | $ | 95.12 | | $ | 87.15 | | $ | 62.44 |
Natural gas($/mcf) | | $ | 3.94 | | $ | 2.84 | | $ | 3.26 | | $ | 5.31 | | $ | 6.84 | | $ | 8.66 | | $ | 9.14 | | $ | 7.04 |
Operating costs($/boe) | | $ | 12.24 | | $ | 13.14 | | $ | 11.05 | | $ | 11.10 | | $ | 10.84 | | $ | 11.20 | | $ | 10.91 | | $ | 10.75 |
Operating netbacks(1) | | | | | | | | | | | | | | | | | | | | | | | | |
Light crude oil($/boe) (2) | | $ | 46.94 | | $ | 38.37 | | $ | 40.58 | | $ | 32.95 | | $ | 39.42 | | $ | 76.03 | | $ | 79.73 | | $ | 65.39 |
Medium crude oil($/boe)(2) | | $ | 39.87 | | $ | 32.47 | | $ | 33.55 | | $ | 17.64 | | $ | 23.95 | | $ | 67.32 | | $ | 65.34 | | $ | 44.88 |
Heavy crude oil($/boe) (2) | | $ | 37.16 | | $ | 37.21 | | $ | 33.85 | | $ | 18.16 | | $ | 19.55 | | $ | 66.12 | | $ | 62.23 | | $ | 41.79 |
Bitumen($/boe) (2) | | $ | 26.59 | | $ | 38.10 | | $ | 33.75 | | $ | 14.54 | | $ | 12.66 | | $ | 47.67 | | $ | 54.48 | | $ | 34.64 |
Natural gas($/mcfge)(3) | | $ | 2.29 | | $ | 1.16 | | $ | 1.73 | | $ | 2.72 | | $ | 3.94 | | $ | 5.33 | | $ | 6.23 | | $ | 4.50 |
Total($/boe)(2) | | $ | 32.02 | | $ | 27.30 | | $ | 29.03 | | $ | 22.44 | | $ | 27.31 | | $ | 58.99 | | $ | 60.85 | | $ | 45.43 |
Net wells drilled(4) | | | | | | | | | | | | | | | | | | | | | | | | |
Exploration Oil | | | 5 | | | 1 | | | 1 | | | 2 | | | 34 | | | 10 | | | 3 | | | 23 |
Gas | | | — | | | 1 | | | 3 | | | 18 | | | 15 | | | 11 | | | 4 | | | 49 |
Dry | | | 1 | | | — | | | — | | | 5 | | | 2 | | | 2 | | | — | | | 19 |
| | | | | | | | | | | | | | | | | | | | | | | | |
| | | 6 | | | 2 | | | 4 | | | 25 | | | 51 | | | 23 | | | 7 | | | 91 |
| | | | | | | | | | | | | | | | | | | | | | | | |
Development Oil | | | 116 | | | 72 | | | 19 | | | 71 | | | 190 | | | 211 | | | 73 | | | 104 |
Gas | | | 8 | | | 2 | | | 2 | | | 49 | | | 78 | | | 88 | | | 17 | | | 87 |
Dry | | | 2 | | | 1 | | | — | | | 4 | | | 20 | | | 13 | | | — | | | 3 |
| | | | | | | | | | | | | | | | | | | | | | | | |
| | | 126 | | | 75 | | | 21 | | | 124 | | | 288 | | | 312 | | | 90 | | | 194 |
| | | | | | | | | | | | | | | | | | | | | | | | |
| | | 132 | | | 77 | | | 25 | | | 149 | | | 339 | | | 335 | | | 97 | | | 285 |
| | | | | | | | | | | | | | | | | | | | | | | | |
Success ratio(percent) | | | 98 | | | 99 | | | 100 | | | 94 | | | 94 | | | 96 | | | 100 | | | 92 |
| | | | | | | | | | | | | | | | | | | | | | | | |
Midstream | | | | | | | | | | | | | | | | | | | | | | | | |
Synthetic crude oil sales(mbbls/day) | | | 64.5 | | | 58.6 | | | 63.1 | | | 61.0 | | | 58.2 | | | 69.1 | | | 51.6 | | | 55.6 |
Upgrading differential($/bbl) | | $ | 13.06 | | $ | 10.16 | | $ | 8.31 | | $ | 16.74 | | $ | 27.48 | | $ | 26.09 | | $ | 30.12 | | $ | 28.53 |
Pipeline throughput(mbbls/day) | | | 498 | | | 498 | | | 534 | | | 529 | | | 493 | | | 494 | | | 539 | | | 504 |
| | | | | | | | | | | | | | | | | | | | | | | | |
Canadian Refined Products | | | | | | | | | | | | | | | | | | | | | | | | |
Refined products sales volumes | | | | | | | | | | | | | | | | | | | | | | | | |
Light oil products(million litres/day) | | | 7.7 | | | 7.8 | | | 7.4 | | | 7.6 | | | 7.5 | | | 8.3 | | | 7.9 | | | 7.9 |
Asphalt products(mbbls/day) | | | 18.9 | | | 32.4 | | | 17.5 | | | 21.7 | | | 21.4 | | | 33.9 | | | 23.0 | | | 17.8 |
Refinery throughput | | | | | | | | | | | | | | | | | | | | | | | | |
Lloydminster refinery(mbbls/day) | | | 22.2 | | | 27.5 | | | 17.8 | | | 28.8 | | | 28.8 | | | 27.3 | | | 26.4 | | | 22.0 |
Prince George refinery(mbbls/day) | | | 10.4 | | | 10.2 | | | 10.0 | | | 10.6 | | | 10.7 | | | 7.9 | | | 10.5 | | | 11.4 |
Refinery utilization(percent) | | | 82 | | | 94 | | | 70 | | | 99 | | | 99 | | | 88 | | | 92 | | | 84 |
| | | | | | | | | | | | | | | | | | | | | | | | |
PAGE 57
| (1) | Operating netbacks are Husky’s average prices less royalties and operating costs on a per unit basis. |
| (2) | Includes associated co-products converted to boe. |
| (3) | Includes associated co-products converted to mcfge. |
Segmented Financial Information
| | | | | | | | | | | | | | | | | | | | | | | | | | | | | | | | | | | | | | | | | | | | | | | | |
| | | Upstream | | | Midstream | |
| | | | | Upgrading | | | Infrastructure and Marketing | |
| ($ millions) | | Q4 | | | Q3 | | | Q2 | | | Q1 | | | Q4 | | | Q3 | | | Q2 | | | Q1 | | | Q4 | | | Q3 | | | Q2 | | | Q1 | |
| | | | | | | | | | | | | | | | | | | | | | | | | | | | | | | | | | | | | | | | | | | | | | | | |
2009 | | | | | | | | | | | | | | | | | | | | | | | | | | | | | | | | | | | | | | | | | | | | | | | | |
Sales and operating revenues, net of royalties | | $ | 1,200 | | | $ | 1,040 | | | $ | 1,167 | | | $ | 1,045 | | | $ | 445 | | | $ | 415 | | | $ | 399 | | | $ | 313 | | | $ | 1,692 | | | $ | 1,497 | | | $ | 1,760 | | | $ | 2,035 | |
Costs and expenses | | | | | | | | | | | | | | | | | | | | | | | | | | | | | | | | | | | | | | | | | | | | | | | | |
Operating, cost of sales, selling and general | | | 372 | | | | 382 | | | | 364 | | | | 377 | | | | 415 | | | | 403 | | | | 389 | | | | 254 | | | | 1,615 | | | | 1,428 | | | | 1,678 | | | | 1,948 | |
Depletion, depreciation and amortization | | | 351 | | | | 327 | | | | 348 | | | | 371 | | | | 9 | | | | 9 | | | | 8 | | | | 8 | | | | 9 | | | | 9 | | | | 9 | | | | 9 | |
Interest — net | | | — | | | | — | | | | — | | | | — | | | | — | | | | — | | | | — | | | | — | | | | — | | | | — | | | | — | | | | — | |
Foreign exchange | | | — | | | | — | | | | — | | | | — | | | | — | | | | — | | | | — | | | | — | | | | — | | | | — | | | | — | | | | — | |
| | | | | | | | | | | | | | | | | | | | | | | | | | | | | | | | | | | | | | | | | | | | | | | | |
| | | 723 | | | | 709 | | | | 712 | | | | 748 | | | | 424 | | | | 412 | | | | 397 | | | | 262 | | | | 1,624 | | | | 1,437 | | | | 1,687 | | | | 1,957 | |
| | | | | | | | | | | | | | | | | | | | | | | | | | | | | | | | | | | | | | | | | | | | | | | | |
Earnings (loss) before income taxes | | | 477 | | | | 331 | | | | 455 | | | | 297 | | | | 21 | | | | 3 | | | | 2 | | | | 51 | | | | 68 | | | | 60 | | | | 73 | | | | 78 | |
Current income taxes | | | 96 | | | | 252 | | | | 270 | | | | 291 | | | | 57 | | | | 18 | | | | 17 | | | | 19 | | | | 26 | | | | 25 | | | | 25 | | | | 25 | |
Future income taxes | | | 47 | | | | (166 | ) | | | (138 | ) | | | (205 | ) | | | (50 | ) | | | (17 | ) | | | (17 | ) | | | (4 | ) | | | (7 | ) | | | (7 | ) | | | (5 | ) | | | (3 | ) |
| | | | | | | | | | | | | | | | | | | | | | | | | | | | | | | | | | | | | | | | | | | | | | | | |
Net earnings (loss) | | $ | 334 | | | $ | 245 | | | $ | 323 | | | $ | 211 | | | $ | 14 | | | $ | 2 | | | $ | 2 | | | $ | 36 | | | $ | 49 | | | $ | 42 | | | $ | 53 | | | $ | 56 | |
| | | | | | | | | | | | | | | | | | | | | | | | | | | | | | | | | | | | | | | | | | | | | | | | |
Capital expenditures(2) | | $ | 841 | | | $ | 412 | | | $ | 405 | | | $ | 668 | | | $ | 20 | | | $ | 17 | | | $ | 12 | | | $ | 19 | | | $ | — | | | $ | 7 | | | $ | 5 | | | $ | 14 | |
Total assets | | $ | 16,338 | | | $ | 15,853 | | | $ | 15,877 | | | $ | 16,025 | | | $ | 1,427 | | | $ | 1,395 | | | $ | 1,429 | | | $ | 1,387 | | | $ | 1,712 | | | $ | 1,193 | | | $ | 1,364 | | | $ | 1,336 | |
| | | | | | | | | | | | | | | | | | | | | | | | | | | | | | | | | | | | | | | | | | | | | | | | |
2008(3) | | | | | | | | | | | | | | | | | | | | | | | | | | | | | | | | | | | | | | | | | | | | | | | | |
Sales and operating revenues, net of royalties | | $ | 1,295 | | | $ | 2,341 | | | $ | 2,424 | | | $ | 1,829 | | | $ | 445 | | | $ | 859 | | | $ | 648 | | | $ | 483 | | | $ | 2,456 | | | $ | 4,077 | | | $ | 3,909 | | | $ | 3,102 | |
Costs and expenses | | | | | | | | | | | | | | | | | | | | | | | | | | | | | | | | | | | | | | | | | | | | | | | | |
Operating, cost of sales, selling and general | | | 455 | | | | 431 | | | | 328 | | | | 413 | | | | 369 | | | | 757 | | | | 554 | | | | 373 | | | | 2,408 | | | | 4,014 | | | | 3,779 | | | | 2,991 | |
Depletion, depreciation and amortization | | | 394 | | | | 369 | | | | 352 | | | | 390 | | | | 9 | | | | 9 | | | | 7 | | | | 6 | | | | 8 | | | | 8 | | | | 7 | | | | 8 | |
Interest — net | | | — | | | | — | | | | — | | | | — | | | | — | | | | — | | | | — | | | | — | | | | — | | | | — | | | | — | | | | — | |
Foreign exchange | | | — | | | | — | | | | — | | | | — | | | | — | | | | — | | | | — | | | | — | | | | — | | | | — | | | | — | | | | — | |
| | | | | | | | | | | | | | | | | | | | | | | | | | | | | | | | | | | | | | | | | | | | | | | | |
| | | 849 | | | | 800 | | | | 680 | | | | 803 | | | | 378 | | | | 766 | | | | 561 | | | | 379 | | | | 2,416 | | | | 4,022 | | | | 3,786 | | | | 2,999 | |
| | | | | | | | | | | | | | | | | | | | | | | | | | | | | | | | | | | | | | | | | | | | | | | | |
Earnings (loss) before income taxes | | | 446 | | | | 1,541 | | | | 1,744 | | | | 1,026 | | | | 67 | | | | 93 | | | | 87 | | | | 104 | | | | 40 | | | | 55 | | | | 123 | | | | 103 | |
Current income taxes | | | 123 | | | | 197 | | | | 99 | | | | 166 | | | | 21 | | | | 27 | | | | 14 | | | | 22 | | | | 37 | | | | 31 | | | | 28 | | | | 30 | |
Future income taxes | | | (19 | ) | | | 265 | | | | 406 | | | | 143 | | | | (1 | ) | | | 1 | | | | 11 | | | | 10 | | | | (25 | ) | | | (14 | ) | | | 9 | | | | 1 | |
| | | | | | | | | | | | | | | | | | | | | | | | | | | | | | | | | | | | | | | | | | | | | | | | |
Net earnings (loss) | | $ | 342 | | | $ | 1,079 | | | $ | 1,239 | | | $ | 717 | | | $ | 47 | | | $ | 65 | | | $ | 62 | | | $ | 72 | | | $ | 28 | | | $ | 38 | | | $ | 86 | | | $ | 72 | |
| | | | | | | | | | | | | | | | | | | | | | | | | | | | | | | | | | | | | | | | | | | | | | | | |
Capital expenditures(2) | | $ | 1,174 | | | $ | 983 | | | $ | 625 | | | $ | 798 | | | $ | 23 | | | $ | 26 | | | $ | 28 | | | $ | 22 | | | $ | 58 | | | $ | 21 | | | $ | 5 | | | $ | 10 | |
Total assets | | $ | 15,653 | | | $ | 14,724 | | | $ | 14,708 | | | $ | 13,114 | | | $ | 1,322 | | | $ | 1,450 | | | $ | 1,462 | | | $ | 1,406 | | | $ | 1,486 | | | $ | 1,802 | | | $ | 1,300 | | | $ | 1,322 | |
| | | | | | | | | | | | | | | | | | | | | | | | | | | | | | | | | | | | | | | | | | | | | | | | |
PAGE 58
Segmented Financial Information
| | | | | | | | | | | | | | | | | | | | | | | | | | | | | | | | | | | | | | | | | | | | | | | | | | | | | | | | | | | | |
| | | Downstream | | | Corporate and Eliminations(1) | | | Total | |
| | | Canadian Refined Products | | U.S. Refining and Marketing | | | | | | | | | | | | | | | | | | | | | | | | | |
| | | Q4 | | | Q3 | | Q2 | | Q1 | | Q4 | | | Q3 | | | Q2 | | Q1 | | | Q4 | | | Q3 | | | Q2 | | | Q1 | | | Q4 | | | Q3 | | | Q2 | | | Q1 | |
2009 | | | | | | | | | | | | | | | | | | | | | | | | | | | | | | | | | | | | | | | | | | | | | | | | | | | | | | | | | | | | |
Sales and operating revenues, net of royalties | | $ | 634 | | | $ | 786 | | $ | 587 | | $ | 488 | | $ | 1,169 | | | $ | 1,555 | | | $ | 1,497 | | $ | 1,128 | | | $ | (1,535 | ) | | $ | (1,390 | ) | | $ | (1,494 | ) | | $ | (1,359 | ) | | $ | 3,605 | | | $ | 3,903 | | | $ | 3,916 | | | $ | 3,650 | |
Costs and expenses | | | | | | | | | | | | | | | | | | | | | | | | | | | | | | | | | | | | | | | | | | | | | | | | | | | | | | | | | | | | |
Operating, cost of sales, selling and general | | | 596 | | | | 680 | | | 506 | | | 422 | | | 1,189 | | | | 1,490 | | | | 1,237 | | | 1,041 | | | | (1,520 | ) | | | (1,405 | ) | | | (1,438 | ) | | | (1,300 | ) | | | 2,667 | | | | 2,978 | | | | 2,736 | | | | 2,742 | |
Depletion, depreciation and amortization | | | 24 | | | | 23 | | | 23 | | | 23 | | | 47 | | | | 48 | | | | 49 | | | 50 | | | | 15 | | | | 14 | | | | 13 | | | | 9 | | | | 455 | | | | 430 | | | | 450 | | | | 470 | |
Interest — net | | | — | | | | — | | | — | | | — | | | 1 | | | | 1 | | | | — | | | 1 | | | | 52 | | | | 52 | | | | 50 | | | | 37 | | | | 53 | | | | 53 | | | | 50 | | | | 38 | |
Foreign exchange | | | — | | | | — | | | — | | | — | | | — | | | | — | | | | — | | | — | | | | (6 | ) | | | — | | | | 34 | | | | (33 | ) | | | (6 | ) | | | — | | | | 34 | | | | (33 | ) |
| | | | | | | | | | | | | | | | | | | | | | | | | | | | | | | | | | | | | | | | | | | | | | | | | | | | | | | | | | | | |
| | | 620 | | | | 703 | | | 529 | | | 445 | | | 1,237 | | | | 1,539 | | | | 1,286 | | | 1,092 | | | | (1,459 | ) | | | (1,339 | ) | | | (1,341 | ) | | | (1,287 | ) | | | 3,169 | | | | 3,461 | | | | 3,270 | | | | 3,217 | |
| | | | | | | | | | | | | | | | | | | | | | | | | | | | | | | | | | | | | | | | | | | | | | | | | | | | | | | | | | | | |
Earnings (loss) before income taxes | | | 14 | | | | 83 | | | 58 | | | 43 | | | (68 | ) | | | 16 | | | | 211 | | | 36 | | | | (76 | ) | | | (51 | ) | | | (153 | ) | | | (72 | ) | | | 436 | | | | 442 | | | | 646 | | | | 433 | |
Current income taxes | | | 9 | | | | 13 | | | 8 | | | 8 | | | 3 | | | | — | | | | — | | | — | | | | 25 | | | | 26 | | | | 25 | | | | 24 | | | | 216 | | | | 334 | | | | 345 | | | | 367 | |
Future income taxes | | | (5 | ) | | | 11 | | | 8 | | | 5 | | | (28 | ) | | | 6 | | | | 77 | | | 13 | | | | (57 | ) | | | (57 | ) | | | (54 | ) | | | (68 | ) | | | (100 | ) | | | (230 | ) | | | (129 | ) | | | (262 | ) |
| | | | | | | | | | | | | | | | | | | | | | | | | | | | | | | | | | | | | | | | | | | | | | | | | | | | | | | | | | | | |
Net earnings (loss) | | $ | 10 | | | $ | 59 | | $ | 42 | | $ | 30 | | $ | (43 | ) | | $ | 10 | | | $ | 134 | | $ | 23 | | | $ | (44 | ) | | $ | (20 | ) | | $ | (124 | ) | | $ | (28 | ) | | $ | 320 | | | $ | 338 | | | $ | 430 | | | $ | 328 | |
| | | | | | | | | | | | | | | | | | | | | | | | | | | | | | | | | | | | | | | | | | | | | | | | | | | | | | | | | | | | |
Capital expenditures(2) | | $ | 38 | | | $ | 18 | | $ | 20 | | $ | 5 | | $ | 137 | | | $ | 54 | | | $ | 43 | | $ | 26 | | | $ | 14 | | | $ | 9 | | | $ | 7 | | | $ | 6 | | | $ | 1,050 | | | $ | 517 | | | $ | 492 | | | $ | 738 | |
Total assets | | $ | 1,430 | | | $ | 1,587 | | $ | 1,624 | | $ | 4,504 | | $ | 4,771 | | | $ | 4,647 | | | $ | 5,081 | | $ | 2,259 | | | $ | 617 | | | $ | 1,478 | | | $ | 1,486 | | | $ | 453 | | | $ | 26,295 | | | $ | 26,153 | | | $ | 26,861 | | | $ | 25,964 | |
| | | | | | | | | | | | | | | | | | | | | | | | | | | | | | | | | | | | | | | | | | | | | | | | | | | | | | | | | | | | |
2008(3) | | | | | | | | | | | | | | | | | | | | | | | | | | | | | | | | | | | | | | | | | | | | | | | | | | | | | | | | | | | | |
Sales and operating revenues, net of royalties | | $ | 673 | | | $ | 1,187 | | $ | 982 | | $ | 722 | | $ | 1,474 | | | $ | 2,446 | | | $ | 2,553 | | $ | 1,329 | | | $ | (1,642 | ) | | $ | (3,195 | ) | | $ | (3,317 | ) | | $ | (2,379 | ) | | $ | 4,701 | | | $ | 7,715 | | | $ | 7,199 | | | $ | 5,086 | |
Costs and expenses | | | | | | | | | | | | | | | | | | | | | | | | | | | | | | | | | | | | | | | | | | | | | | | | | | | | | | | | | | | | |
Operating, cost of sales, selling and general | | | 640 | | | | 1,131 | | | 911 | | | 658 | | | 2,265 | | | | 2,456 | | | | 2,263 | | | 1,296 | | | | (1,788 | ) | | | (3,323 | ) | | | (3,050 | ) | | | (2,419 | ) | | | 4,349 | | | | 5,466 | | | | 4,785 | | | | 3,312 | |
Depletion, depreciation and amortization | | | 20 | | | | 21 | | | 20 | | | 20 | | | 50 | | | | 42 | | | | 43 | | | 19 | | | | 8 | | | | 8 | | | | 7 | | | | 7 | | | | 489 | | | | 457 | | | | 436 | | | | 450 | |
Interest — net | | | — | | | | — | | | — | | | — | | | 1 | | | | 1 | | | | — | | | 1 | | | | 30 | | | | 28 | | | | 41 | | | | 45 | | | | 31 | | | | 29 | | | | 41 | | | | 46 | |
Foreign exchange | | | — | | | | — | | | — | | | — | | | — | | | | — | | | | — | | | — | | | | (275 | ) | | | (76 | ) | | | 6 | | | | 10 | | | | (275 | ) | | | (76 | ) | | | 6 | | | | 10 | |
| | | | | | | | | | | | | | | | | | | | | | | | | | | | | | | | | | | | | | | | | | | | | | | | | | | | | | | | | | | | |
| | | 660 | | | | 1,152 | | | 931 | | | 678 | | | 2,316 | | | | 2,499 | | | | 2,306 | | | 1,316 | | | | (2,025 | ) | | | (3,363 | ) | | | (2,996 | ) | | | (2,357 | ) | | | 4,594 | | | | 5,876 | | | | 5,268 | | | | 3,818 | |
| | | | | | | | | | | | | | | | | | | | | | | | | | | | | | | | | | | | | | | | | | | | | | | | | | | | | | | | | | | | |
Earnings (loss) before income taxes | | | 13 | | | | 35 | | | 51 | | | 44 | | | (842 | ) | | | (53 | ) | | | 247 | | | 13 | | | | 383 | | | | 168 | | | | (321 | ) | | | (22 | ) | | | 107 | | | | 1,839 | | | | 1,931 | | | | 1,268 | |
Current income taxes | | | 8 | | | | 7 | | | 7 | | | 6 | | | (33 | ) | | | (28 | ) | | | 59 | | | (22 | ) | | | 20 | | | | 32 | | | | 27 | | | | 23 | | | | 176 | | | | 266 | | | | 234 | | | | 225 | |
Future income taxes | | | (8 | ) | | | 3 | | | 9 | | | 7 | | | (274 | ) | | | 10 | | | | 29 | | | 27 | | | | 27 | | | | 34 | | | | (125 | ) | | | (33 | ) | | | (300 | ) | | | 299 | | | | 339 | | | | 155 | |
| | | | | | | | | | | | | | | | | | | | | | | | | | | | | | | | | | | | | | | | | | | | | | | | | | | | | | | | | | | | |
Net earnings (loss) | | $ | 13 | | | $ | 25 | | $ | 35 | | $ | 31 | | $ | (535 | ) | | $ | (35 | ) | | $ | 159 | | $ | 8 | | | $ | 336 | | | $ | 102 | | | $ | (223) | | | $ | (12 | ) | | $ | 231 | | | $ | 1,274 | | | $ | 1,358 | | | $ | 888 | |
| | | | | | | | | | | | | | | | | | | | | | | | | | | | | | | | | | | | | | | | | | | | | | | | | | | | | | | | | | | | |
Capital expenditures(2) | | $ | 63 | | | $ | 45 | | $ | 28 | | $ | 19 | | $ | 70 | | | $ | 22 | | | $ | 34 | | $ | 7 | | | $ | 14 | | | $ | 7 | | | $ | 14 | | | $ | 12 | | | $ | 1,402 | | | $ | 1,104 | | | $ | 734 | | | $ | 868 | |
Total assets | | $ | 1,375 | | | $ | 1,560 | | $ | 1,629 | | $ | 1,395 | | $ | 5,380 | | | $ | 5,506 | | | $ | 5,403 | | $ | 6,574 | | | $ | 1,270 | | | $ | 1,216 | | | $ | 757 | | | $ | 551 | | | $ | 26,486 | | | $ | 26,258 | | | $ | 25,259 | | | $ | 24,362 | |
| | | | | | | | | | | | | | | | | | | | | | | | | | | | | | | | | | | | | | | | | | | | | | | | | | | | | | | | | | | | |
| (1) | Eliminations relate to sales and operating revenues between segments recorded at transfer prices based on current market prices, and to unrealized intersegment profits in inventories. |
| (2) | Excludes capitalized costs related to asset retirement obligations incurred during the period and the Lima acquisition and the BP joint venture transaction. |
| (3) | 2008 amounts as restated for adoption of a new accounting policy. Refer to Note 4 to the Consolidated Financial Statements. |
PAGE 59
Segmented Capital Expenditures
| | | | | | | | | | | | | | | | | | | | | | | | |
| | | 2009 | | 2008 |
| ($ millions) | | Q4 | | Q3 | | Q2 | | Q1 | | Q4 | | Q3 | | Q2 | | Q1 |
Upstream | | | | | | | | | | | | | | | | | | | | | | | | |
Western Canada | | $ | 579 | | $ | 152 | | $ | 109 | | $ | 349 | | $ | 815 | | $ | 574 | | $ | 497 | | $ | 675 |
East Coast Canada | | | 95 | | | 111 | | | 160 | | | 208 | | | 237 | | | 306 | | | 93 | | | 93 |
Northwest United States | | | 10 | | | 3 | | | 7 | | | 5 | | | 10 | | | 50 | | | — | | | — |
International | | | 157 | | | 146 | | | 129 | | | 106 | | | 112 | | | 53 | | | 35 | | | 30 |
| | | | | | | | | | | | | | | | | | | | | | | | |
| | | 841 | | | 412 | | | 405 | | | 668 | | | 1,174 | | | 983 | | | 625 | | | 798 |
Midstream | | | | | | | | | | | | | | | | | | | | | | | | |
Upgrader | | | 20 | | | 17 | | | 12 | | | 19 | | | 23 | | | 26 | | | 28 | | | 22 |
Infrastructure and Marketing | | | — | | | 7 | | | 5 | | | 14 | | | 58 | | | 21 | | | 5 | | | 10 |
| | | | | | | | | | | | | | | | | | | | | | | | |
| | | 20 | | | 24 | | | 17 | | | 33 | | | 81 | | | 47 | | | 33 | | | 32 |
Downstream | | | | | | | | | | | | | | | | | | | | | | | | |
Canadian Refined Products | | | 38 | | | 18 | | | 20 | | | 5 | | | 63 | | | 45 | | | 28 | | | 19 |
U.S. Refining and Marketing | | | 137 | | | 54 | | | 43 | | | 26 | | | 70 | | | 22 | | | 34 | | | 7 |
| | | | | | | | | | | | | | | | | | | | | | | | |
| | | 175 | | | 72 | | | 63 | | | 31 | | | 133 | | | 67 | | | 62 | | | 26 |
Corporate | | | 14 | | | 9 | | | 7 | | | 6 | | | 14 | | | 7 | | | 14 | | | 12 |
| | | | | | | | | | | | | | | | | | | | | | | | |
| | $ | 1,050 | | $ | 517 | | $ | 492 | | $ | 738 | | $ | 1,402 | | $ | 1,104 | | $ | 734 | | $ | 868 |
| | | | | | | | | | | | | | | | | | | | | | | | |
Note: Excludes capitalized costs related to asset retirement obligations incurred during the period and the Lima acquisition and the BP joint venture transaction.
PAGE 60
| | |
Exhibit No. | | Description |
| 23.1 | | Consent of KPMG LLP, independent accountants. |
| |
| 23.2 | | Consent of McDaniel and Associates Consultants Ltd., independent engineers. |
| |
| 31.1 | | Certification of Chief Executive Officer pursuant to Rule 13a-14(a) or 15d-14 of the Securities Exchange Act of 1934. |
| |
| 31.2 | | Certification of Chief Financial Officer pursuant to Rule 13a-14(a) or 15d-14 of the Securities Exchange Act of 1934. |
| |
| 32.1 | | Certification of Chief Executive Officer pursuant to Rule 13(a)-14(b) and Section 1350 of Chapter 63 of Title 18 of the United States Code (18 U.S.C. 1350). |
| |
| 32.2 | | Certification of Chief Financial Officer pursuant to Rule 13(a)-14(b) and Section 1350 of Chapter 63 of Title 18 of the United States Code (18 U.S.C. 1350). |