Filed Pursuant to Rule 433
Issuer Free Writing Prospectus
Registration No. 333-174554
June 22, 2011
Corporate Overview – June 2011
Advisories
Additional Information
The Company has filed a registration statement (including a prospectus) with the SEC for the Public Offering. Before persons invest, they should read the prospectus in that registration statement and other documents the Company has filed with the SEC or on SEDAR for more complete information about the Company and the Public Offering. Persons may obtain these documents for free by visiting EDGAR on the SEC Web site at www.sec.gov or SEDAR at www.sedar.com. Alternatively, the issuer, any underwriter or any dealer participating in the offering will arrange to send you the prospectus if you request it by calling toll-free 1-877-822-4089. Also, a copy of the United States preliminary prospectus supplemental and accompanying prospectus may be obtained through this hyperlink: http://www.huskyenergy.com/downloads/investorrelations/2011/HSE_US_Prelim_2011.pdf. Prospective purchasers should consult their own advisers as to whether they are purchasing under the Canadian prospectus or the U.S. prospectus. The Common Shares may not be sold in any jurisdiction in which such offer, solicitation or sale would be unlawful prior to registration or qualification under the securities laws of such jurisdiction.
Forward Looking Statements
Certain statements in this presentation are forward looking statements or information within the meaning of applicable securities legislation (collectively “forward-looking statements”). Any statements that express, or involve discussions as to, expectations, beliefs, plans, objectives, assumptions or future events or performance (often, but not always, through the use of words or phrases such as “will likely result,” “are expected to,” “will continue,” “is anticipated,” “estimated,” “intend,” “plan,” “projection,” “could,” “vision,” “goals,” “objective,” “target,” “schedules” and “outlook”) are not historical facts, are forward-looking and may involve estimates and assumptions and are subject to risks, uncertainties and other factors some of which are beyond the Company’s control and difficult to predict. Accordingly, these factors could cause actual results or outcomes to differ materially from those expressed in the forward-looking statements.
In particular, forward-looking statements in this presentation include, but are not limited to: the Company’s general strategic plans for its core business areas and anticipated outcomes of the Company’s strategic plans; its short, medium, and long-term growth strategies and opportunities in its upstream, midstream and downstream business segments; the Company’s growth strategy; anticipated timing of project milestones; production growth and reserve replacement targets; anticipated return on capital employed; the Company’s financial strategy and anticipated outcomes of the Company’s financial strategy, including dividend sustainability and maintenance of investment grade credit ratings; 2011 capital expenditure and production guidance; intended use of proceeds; 2011 and 2012 drilling plans in Western Canada; development plans and anticipated timing and rates of production for Ansell; development opportunities and potential for oil resource recovery at the Kakwa and Wapiti areas; anticipated impact emerging technologies will have on production; expected rates and timing of production at
South Pikes Peak, Paradise Hill and other heavy oil properties; exploration and development plans for offshore China; development plans, sanctioning process, anticipated timing and rates of production, and anticipated gas sales contracts for the Liwan Gas Project; exploration plans for offshore Indonesia; anticipated timing and rates of production for the Madura BD gas development; cost estimates, anticipated timing and rates of production, project milestone timeline and downstream solution for the Sunrise Energy Project; plans for the West White Rose Extension Pilot including target timing for
first oil; evaluation of the fixed wellhead platform concept; exploration and development plans for the Atlantic Region and offshore Greenland.
Although the Company believes that the expectations reflected by the forward-looking statements in this presentation are reasonable, the Company’s forward-looking statements have been based on assumptions and factors concerning future events that may prove to be inaccurate. Those assumptions and factors are based on information currently available to the Company about itself and the businesses in which it operates. In addition, information used in developing forward-looking statements has been acquired from various sources including third party consultants, suppliers, regulators and other sources.
The Company’s Annual Information Form and other documents filed with securities regulatory authorities (accessible through the SEDAR website www.sedar.com and the EDGAR website www.sec.gov) describes the risks, material assumptions and other factors that could influence actual results and are incorporated herein by reference.
Any forward-looking statement speaks only as of the date on which such statement is made, and, except as required by applicable law, the Company undertakes no obligation to update any forward-looking statement to reflect events or circumstances after the date on which such statement is made or to reflect the occurrence of unanticipated events. New factors emerge from time to time, and it is not possible for management to predict all of such factors and to assess in advance the impact of each such factor on the Company’s business or the extent to which any factor, or combination of factors, may cause actual results to differ materially from those contained in any forward-looking statement.
Advisories
Disclosure of Oil and Gas Reserves and Other Oil and Gas Information
Unless otherwise stated, reserve and resource estimates in this presentation have an effective date of December 31, 2010. Unless otherwise noted, historical production numbers given represent Husky’s share.
The Company uses the terms barrels of oil equivalent (“boe”) and thousand cubic feet of gas equivalent (“mcfge”), which are calculated on an energy equivalence basis whereby one barrel of crude oil is equivalent to six thousand cubic feet of natural gas. Readers are cautioned that the terms boe and mcfge may be misleading, particularly if used in isolation. This measure is primarily applicable at the burner tip and does not represent value equivalence at the wellhead.
The Company has disclosed possible reserves. Possible reserves are those additional reserves that are less certain to be recovered than probable reserves. It is unlikely that the quantities actually recovered will exceed the sum of the proved plus probable plus possible reserves. There is at least a 10% probability that the quantities actually recovered will equal or exceed the sum of proved plus probable plus possible reserves.
The Company has disclosed discovered petroleum initially-in-place. Discovered petroleum initially-in-place is that quantity of petroleum that is estimated, as of a given date, to be contained in known accumulations prior to production. The recoverable portion of discovered petroleum initially-in-place includes production, reserves and contingent resources; the remainder is unrecoverable. A recovery project cannot be defined for these volumes of discovered petroleum initially-in-place at this time. There is no certainty that it will be commercially viable to produce any portion of the resources.
3P reserves for oil sands are disclosed in this presentation (slide 29). This represents the following split for 3P reserves: Sunrise - Proved reserves = 120.0 MMbbl, Probable reserves = 891.4 MMbbl, Possible reserves = 842.5; Tucker – Proved reserves = 61.9 MMbbl, Probable reserves = 103.2 MMbbl, Possible reserves = 121.9 MMbl.
In this presentation on slide 26 and 29, additional drilling will be required to delineate the resources and advance development plans to allow booking of contingent resources and/or reserves in the future.
The Company has disclosed its total reserves in Canada in its 2010 Annual Information Form dated February 28, 2011 which reserves disclosure is incorporated by reference herein. The estimates of reserves and future net revenue for individual properties may not reflect the same confidence level as estimates of reserves and future net revenue for all properties, due to the effects of aggregation.
All currency is expressed in Canadian dollars unless otherwise noted.
Corporate Overview
Financial Overview
Regenerating the Foundation
Pillars of Growth
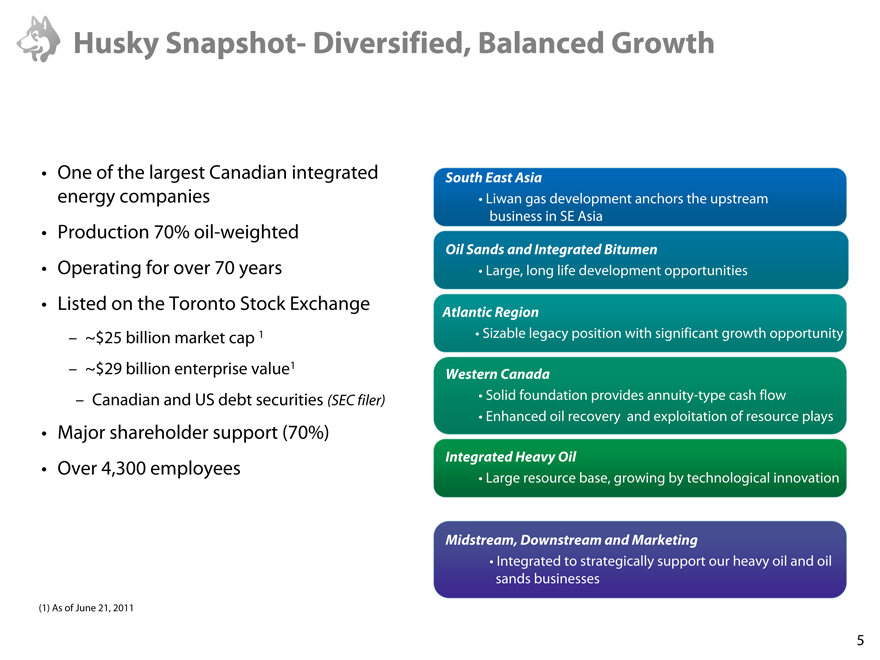
Husky Snapshot- Diversified, Balanced Growth
• One of the largest Canadian integrated energy companies
• Production 70% oil-weighted
• Operating for over 70 years
• Listed on the Toronto Stock Exchange
– ~$25 billion market cap 1
– ~$29 billion enterprise value1
– Canadian and US debt securities (SEC filer)
• Major shareholder support (70%)
• Over 4,300 employees
(1) |
| As of June 21, 2011 |
South East Asia
• Liwan gas development anchors the upstream business in SE Asia
Oil Sands and Integrated Bitumen
• Large, long life development opportunities
Atlantic Region
• Sizable legacy position with significant growth opportunity
Western Canada
• Solid foundation provides annuity-type cash flow
• Enhanced oil recovery and exploitation of resource plays
Integrated Heavy Oil
• Large resource base, growing by technological innovation
Midstream, Downstream and Marketing
• Integrated to strategically support our heavy oil and oil sands businesses
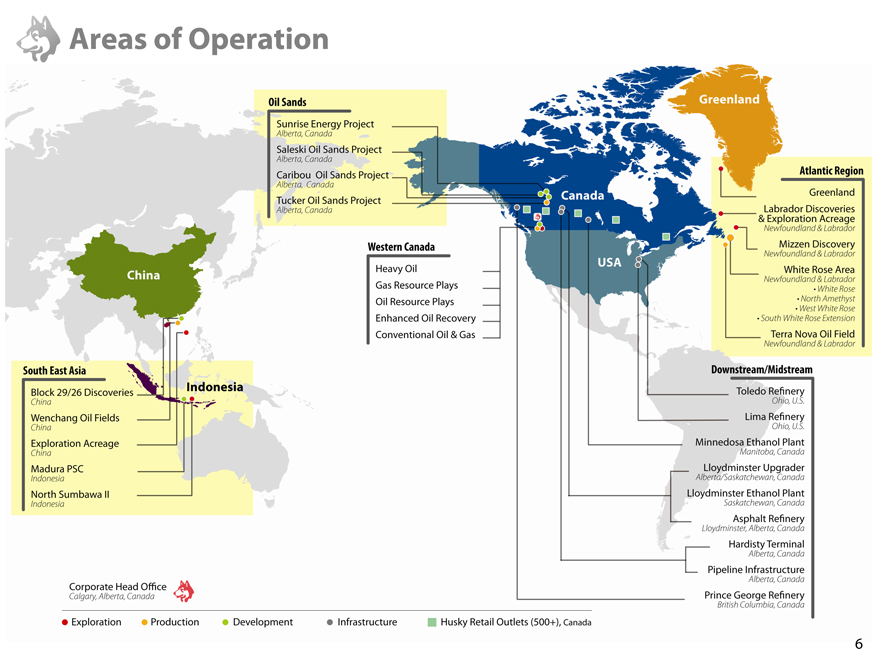
Areas of Operation Oil sands Sunrise Energy Project Alberta, Canada Saleski Oil Sands Project Alberta, Canada
Caribou Oil Sands Project Alberta, Canada Tucker Oil Sands Project Alberta, Canada China Western Canada
Heavy Oil Gas Resource Plays Oil Resource Plays Enhanced Oil Recovery Conventional Oil & Gas South East Asia
Block 29/26 Discoveries China Wenchang Oil Fields China Exploration Acreage
China Madura PSC Indonesia North Sumbawa IIIndonesia Indonesia Corporate Head Office Calgary, Alberta, Canada Canada USA
Downstream/Midstream Toledo Refinery Ohio, U.S. Lima Refinery Ohio, U.S. Minnedosa Ethanol Plant Manitoba, Canada Lloydminster Upgrader Alberta/Saskatchewan, Canada Asphalt Refinery
Lloydminster, Alberta, Canada
Hardisty Terminal
Alberta, Canada
Pipeline George Refinery
Alberta, Canada
Prince George Refinery
British Columbia, Canada
Exploration
Production
Development
Infrastructure
Husky Retail Outlets (500+), Canada
Greenland
Atlantic Region
Greenland
Labrador Discoveries & Exploration Acreage
a
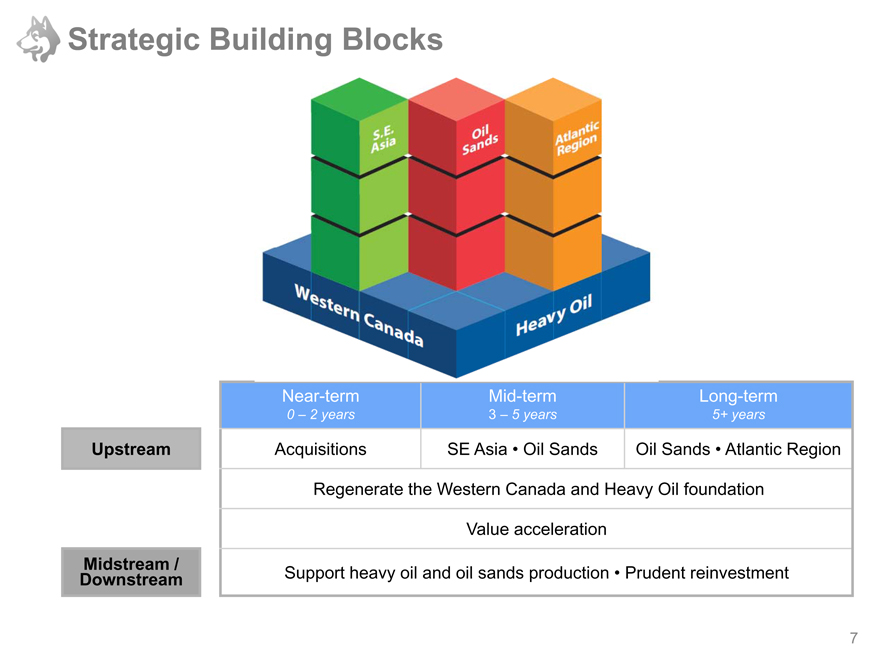
Strategic Building Blocks
S.E. Asia
Oil Sands
Atlantic Region
Western Canada
Heavy Oil
Upstream
Midstream /
Downstream
Near-term
Mid-term
Long-term
0 – 2 years
3 |
| - 5 years |
5+ years
Acquisitions
SE Asia Oil Sands
Oil Sands Atlantic Region
Regenerate the Western Canada and Heavy Oil foundation
Value acceleration
Support heavy oil and oil sands production
Prudent reinvestment
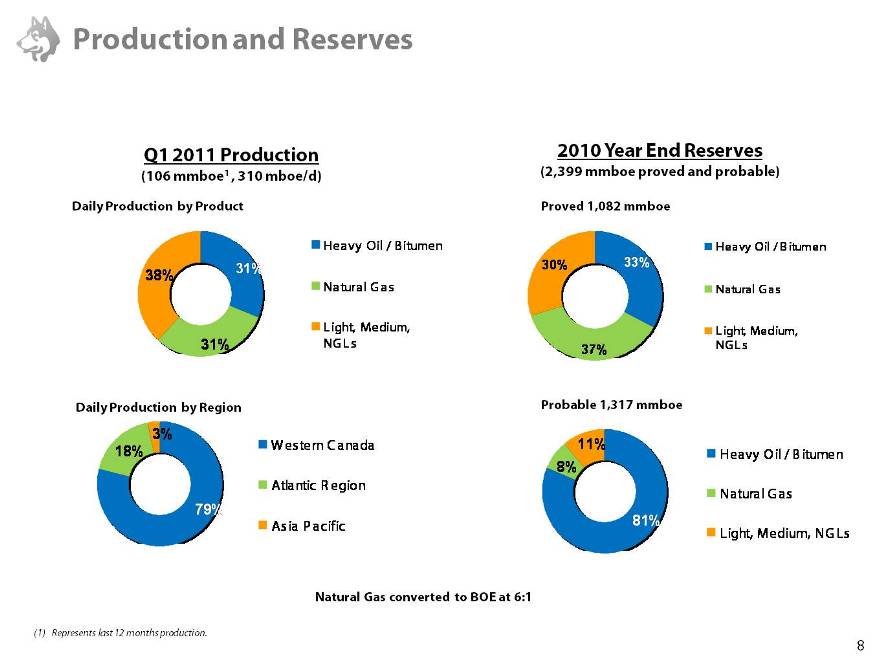
Production and Reserves
Q1 2011 Production
(106 mmboe1 , 310 mboe/d)
Daily Production by Product
38% 31% 31%
Heavy Oil / Bitumen
Natural Gas
Light, Medium, NGLs
Daily Production by Region
3% 79% 18%
Western Canada
Altantic Region
Asia Pacific
2010 Year End Reserves
(2,399 mmboe proved and probable)
Proved 1,082 mmboe
33% 37% 30%
Heavy Oil / Bitumen
Natural Gas
Light, Medium, NGLs
Probable 1,317 mmboe
81% 8% 11%
Heavy Oil / Bitumen
Natural Gas
Light, Medium, NGLs
Natural Gas converted to BOE at 6:1
(1) |
| Represents last 12 months production. |
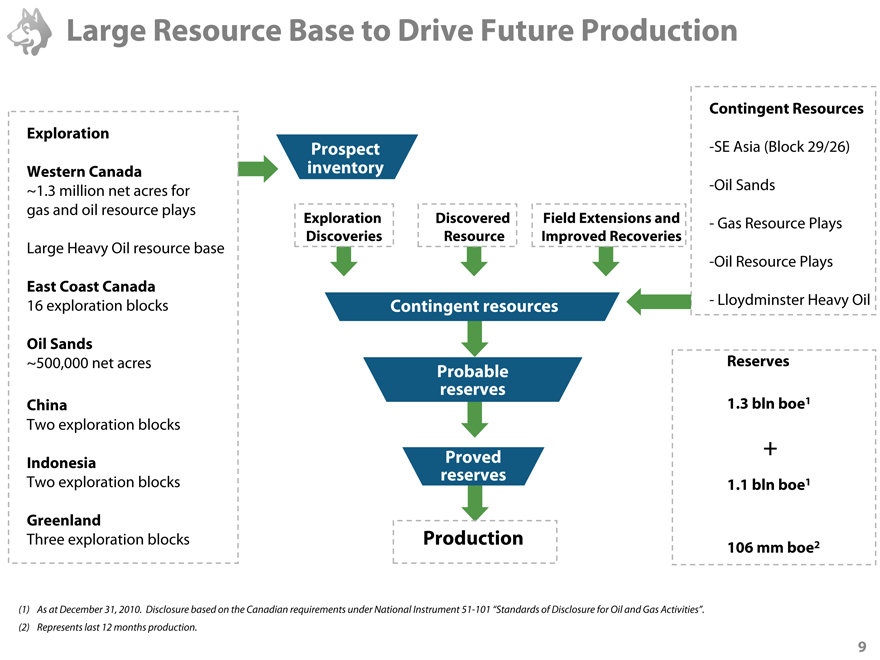
Large Resource Base to Drive Future Production
Exploration
Western Canada
~1.3 million net acres for gas and oil resource plays
Large Heavy Oil resource base
East Coast Canada
16 exploration blocks
Oil Sands
~500,000 net acres
China
Two exploration blocks
Indonesia
Two exploration blocks
Greenland
Three exploration blocks
Prospect inventory
Exploration Discovered Field Extensions Discoveries Resource Improved Recoveries
Contingent resources
Probable reserves
Proved reserves
Production
Contingent Resources
-SE Asia (Block 29/26)
-Oil Sands
- Gas Resource Plays -Oil Resource Plays
- Lloydminster Heavy Oil
Reserves
1.3 bln boe1
+
1.1 bln boe1
106 mm boe2
(1) As at December 31, 2010. Disclosure based on the Canadian requirements under National Instrument 51-101 “Standards of Disclosure for Oil and Gas Activities”.
(2) |
| Represents last 12 months production. |
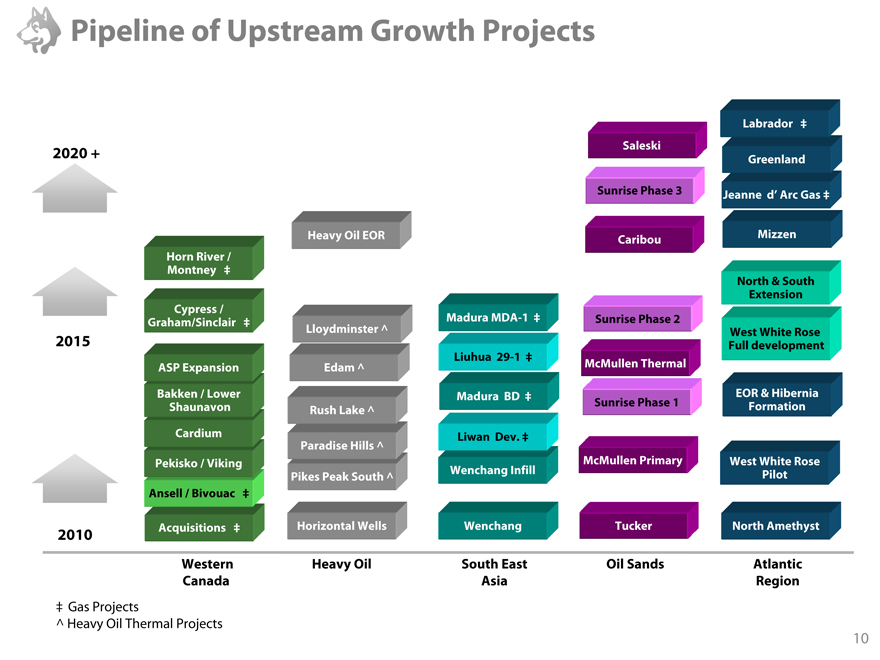
Pipeline of Upstream Growth Projects
Labrador ‡
Saleski
2020 + Greenland
Sunrise Phase 3 Jeanne d’ Arc Gas ‡
Heavy Oil EOR Caribou Mizzen
Horn River /
Montney ‡
North & South
Extension
Cypress /
Graham/Sinclair ‡ Madura MDA-1 ‡ Sunrise Phase 2
Lloydminster ^ West White Rose
2015 Full development
Liuhua 29-1 ‡
ASP Expansion Edam ^ McMullen Thermal
Bakken / Lower Madura BD ‡ EOR & Hibernia
Shaunavon Rush Lake ^ Sunrise Phase 1 Formation
Cardium Liwan Dev. ‡
Paradise Hills ^
Pekisko / Viking McMullen Primary West White Rose
Pikes Peak South ^ Wenchang Infill Pilot
Ansell / Bivouac ‡
2010 Acquisitions ‡ Horizontal Wells Wenchang Tucker North Amethyst
Western Heavy Oil South East Oil Sands Atlantic
Canada Asia Region
‡ Gas Projects
^ Heavy Oil Thermal Projects
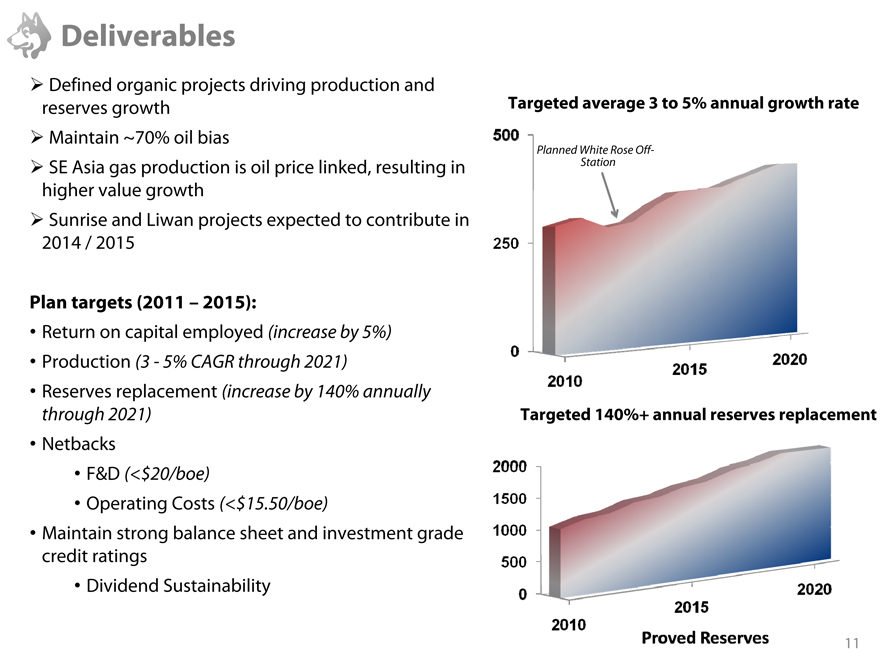
Deliverables
Defined organic projects driving production and reserves growth
Maintain ~70% oil bias
SE Asia gas production is oil price linked, resulting in higher value growth
Sunrise and Liwan projects expected to contribute in 2014 / 2015
Plan targets (2011 – 2015):
Return on capital employed (increase by 5%)
Production (3 – 5% CAGR through 2021)
Reserves replacement (increase by 140% annually through 2021)
Netbacks
F&D (<$20/boe)
Operating Costs (<$15.50/boe)
Maintain strong balance sheet and investment grade credit ratings
Dividend Sustainability
Targeted average 3 to 5% annual growth rate
Planned White Rose Off-Station
500
250
0
2010
2015
2020
Targeted 140%+ annual reserves replacement
2000
1500
1000
500
0
2010
2015
2020
Proved Reserves
Value Proposition – Balanced Growth
Clear strategy with experienced team to deliver
Oil-weighted portfolio leveraged to demand growth
Production and reserves growth through large, organic and diversified project portfolio
Significant Asian portfolio – particularly the world-scale Liwan gas development – offers significant growth opportunities
Top quartile dividend
Solid balance sheet and financial flexibility
Strong support from principal shareholders
Corporate Overview
Financial Overview Regenerating the Foundation
Pillars of Growth
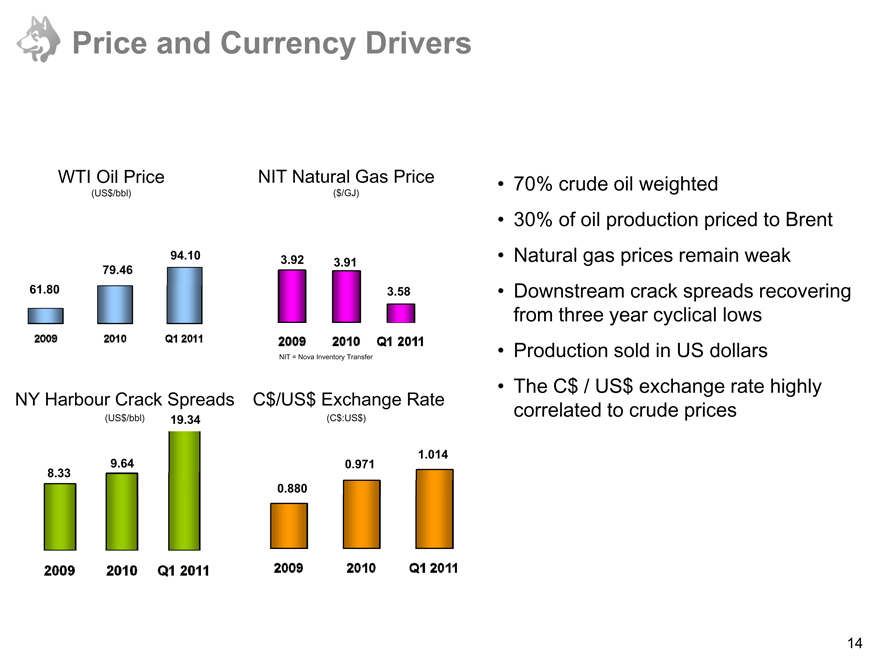
Price and Currency Drivers
WTI Oil Price
(US$/bbl)
NIT Natural Gas Price
($/GJ)
61.80
79.46
94.10
2009
2010
Q1 2011
3.92
3.91
3.58
2009
2010
Q1 2011
NIT = Nova Inventory Transfer
NY Harbour Crack Spreads
(US$/bbl)
19.34
9.64
8.33
2009
2010
Q1 2011
C$/US$ Exchange Rate
(C$:US$)
1.014
0.971
0.880
2009
2010
Q1 2011
70% crude oil weighted
30% of oil production priced to Brent
Natural gas prices remain weak
Downstream crack spreads recovering from three year cyclical lows
Production sold in US dollars
The C$ / US$ exchange rate highly correlated to crude prices
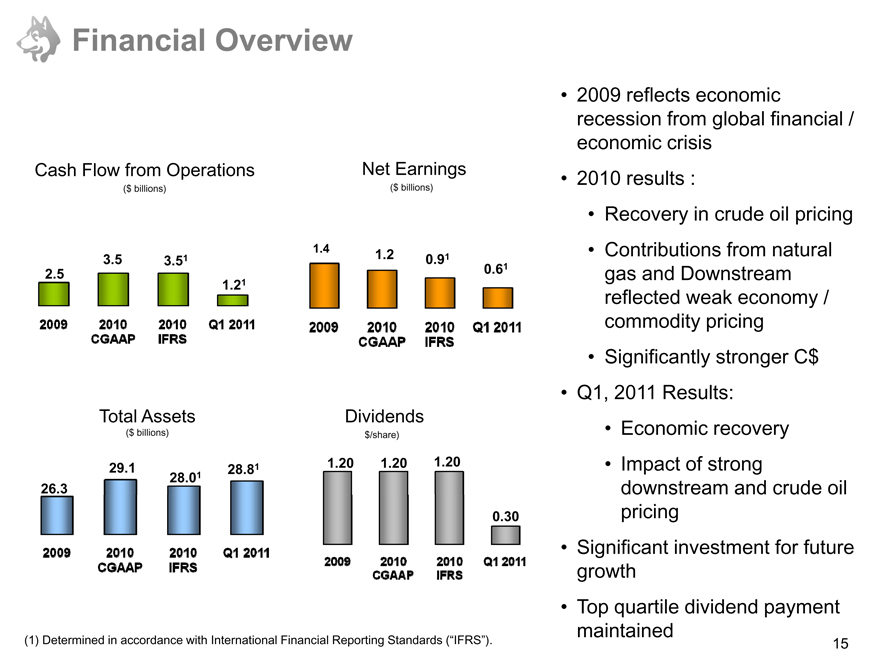
Financial Overview
Cash Flow from Operations
($ billions)
Net Earnings
($ billions)
2.5
1.21
3.5
3.51
2009
2010 CGAAP
2010 IFRS
Q1 2011
1.4
1.2
0.91
0.61
2009
2010 CGAAP
2010 IFRS
Q1 2011
Total Assets
($ billions)
Dividends
$/share)
26.3
29.1
28.0 1
28.8 1
2009
2010 CGAAP
2010 IFRS
Q1 2011
1.20
1.20
1.20
0.30
2009
2010 CGAAP
2010 IFRS
Q1 2011
2009 reflects economic recession from global financial / economic crisis
2010 results :
Recovery in crude oil pricing
Contributions from natural gas and Downstream reflected weak economy / commodity pricing
Significantly stronger C$
Q1, 2011 Results:
Economic recovery
Impact of strong downstream and crude oil pricing
Significant investment for future growth
Top quartile dividend payment maintained
(1) |
| Determined in accordance with International Financial Reporting Standards (“IFRS”). |
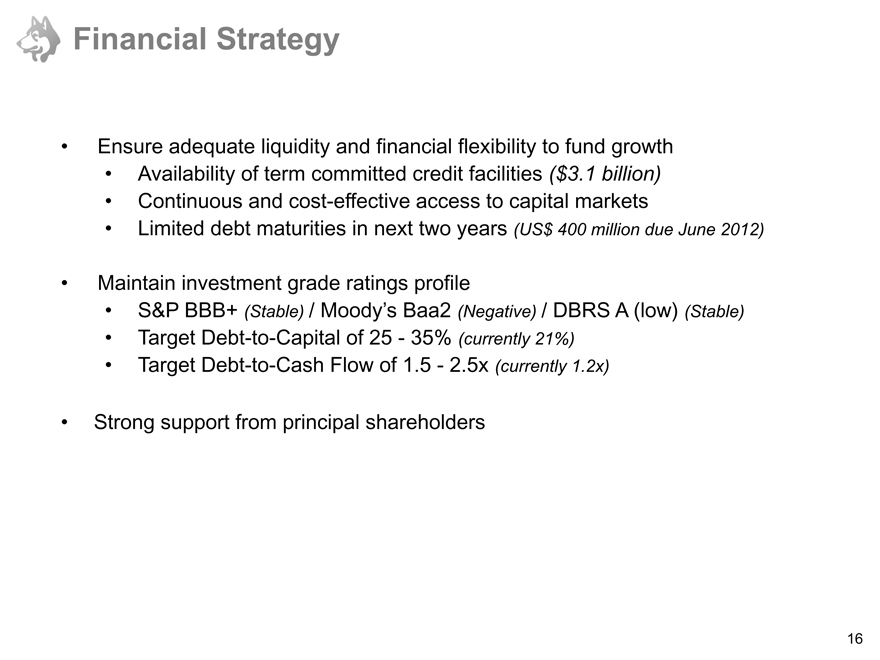
Financial Strategy
Ensure adequate liquidity and financial flexibility to fund growth
Availability of term committed credit facilities ($3.1 billion)
Continuous and cost-effective access to capital markets
Limited debt maturities in next two years (US$ 400 million due June 2012)
Maintain investment grade ratings profile
S&P BBB+ (Stable) / Moody’s Baa2 (Negative) / DBRS A (low) (Stable)
Target Debt-to-Capital of 25—35% (currently 21%)
Target Debt-to-Cash Flow of 1.5—2.5x (currently 1.2x)
Strong support from principal shareholders
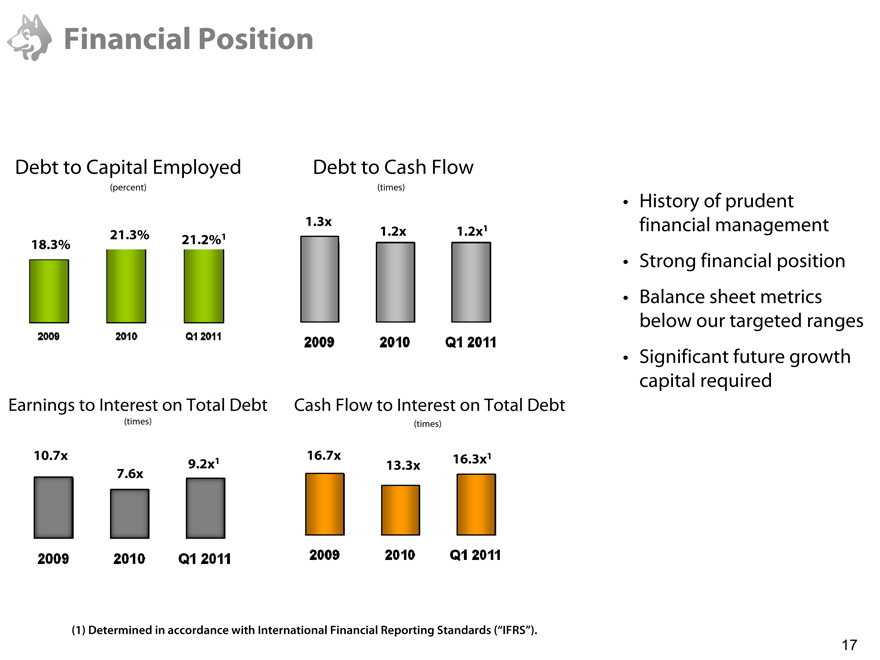
Financial Position
Debt to Capital Employed
(percent)
18.3%
21.3%
2009
2010
Q1 2011
Debt to Cash Flow
(times)
1.3X
1.2X
1.2X1
2009
2010
Q1 2011
Earnings to Interest on Total Debt
(times)
10.7X
7.6X
9.2X1
2009
2010
Q1 2011
Cash Flow to Interest on Total Debt
(times)
16.7X
13.3X
16.3X1
2009
2010
Q1 2011
History of prudent financial management
Strong financial position
Balance sheet metrics below our targeted ranges
Significant future growth capital required
(1) |
| Determined in accordance with International Financial Reporting Standards (“IFRS”). |
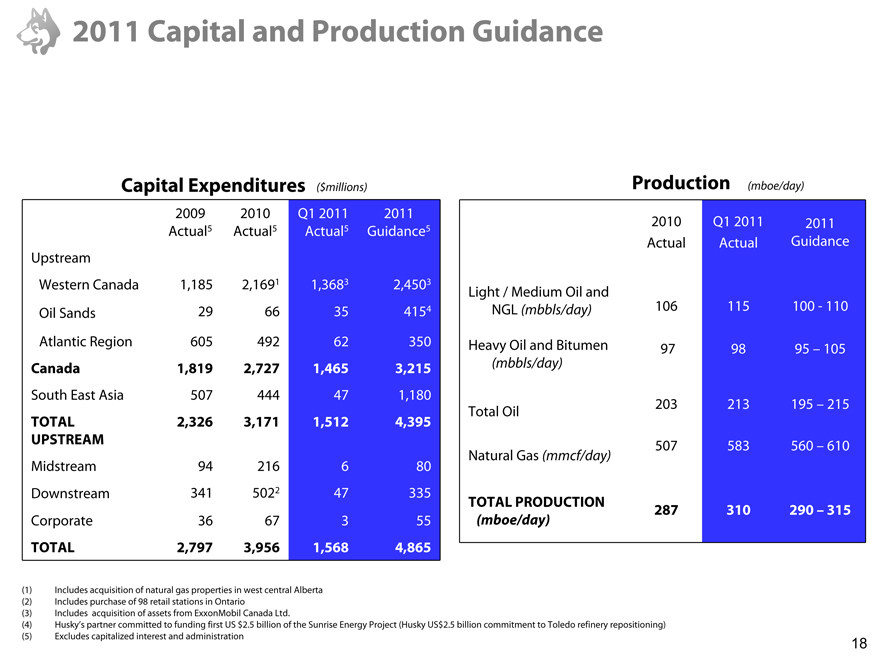
2011 Capital and Production Guidance
Capital Expenditures ($millions)
2009 2010 Q1 2011
Actual 5 Actual5 2011 5 Guidance 5
Actual
Upstream
Western Canada 1,185 2,169 1 1,368 3 2,450 3
Oil Sands 29 66 35 415 4
Atlantic Region 605 492 62 350
Canada 1,819 2,727 1,465 3,215
South East Asia 507 444 47 1,180
TOTAL 2,326 3,171 1,512 4,395
UPSTREAM
Midstream 94 216 6 80
Downstream 341 502 2 47 335
Corporate 36 67 3 55
TOTAL 2,797 3,956 1,568 4,865
Production (mboe/day)
Q1
2010 2011
2011
Actual Guidance
Actual
Light / Medium Oil and
NGL (mbbls/day) 106 115 100 – 110
Heavy Oil and Bitumen 97 98 95 – 105
(mbbls/day)
Total Oil 203 213 195 – 215
Natural Gas 507 583 560 – 610
(mmcf/day)
TOTAL PRODUCTION 287 310 290 – 315
(mboe/day)
(1) Includes acquisition of natural gas properties in west central Alberta
(2) Includes purchase of 98 retail stations in Ontario
(3) Includes acquisition of assets from ExxonMobil Canada Ltd.
(4) Husky’s partner committed to funding first US $2.5 billion of the Sunrise Energy Project (Husky US$2.5 billion commitment to Toledo refinery repositioning)
(5) Excludes capitalized interest and administration
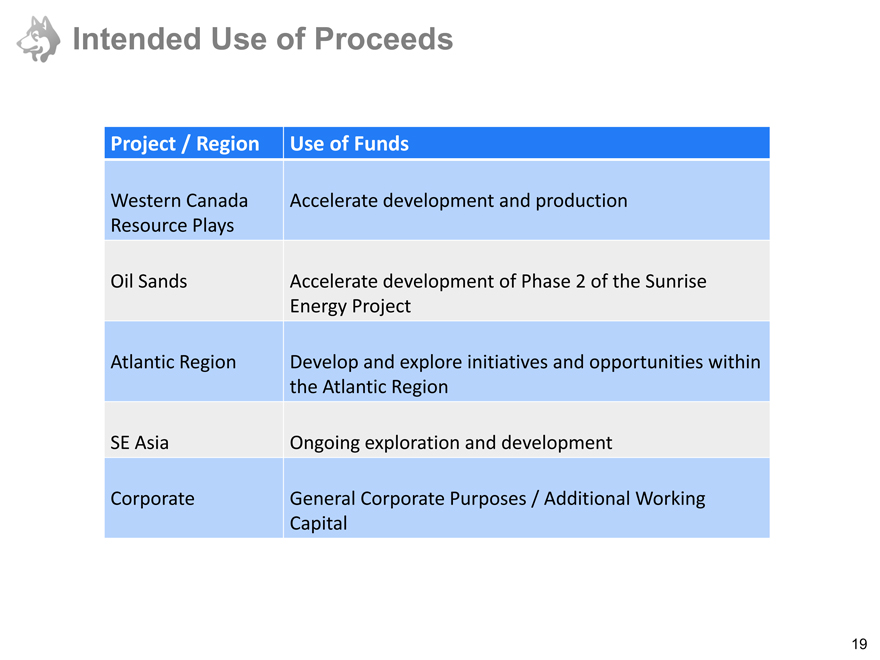
Intended Use of Proceeds
Project / Region Use of Funds
Western Canada Accelerate development and production
Resource Plays
Oil Sands Accelerate development of Phase 2 of the Sunrise
Energy Project
Atlantic Region Develop and explore initiatives and opportunities within
the Atlantic Region
SE Asia Ongoing exploration and development
Corporate General Corporate Purposes / Additional Working
Capital
Corporate Overview
Financial Overview
Regenerating the Foundation
Pillars of Growth
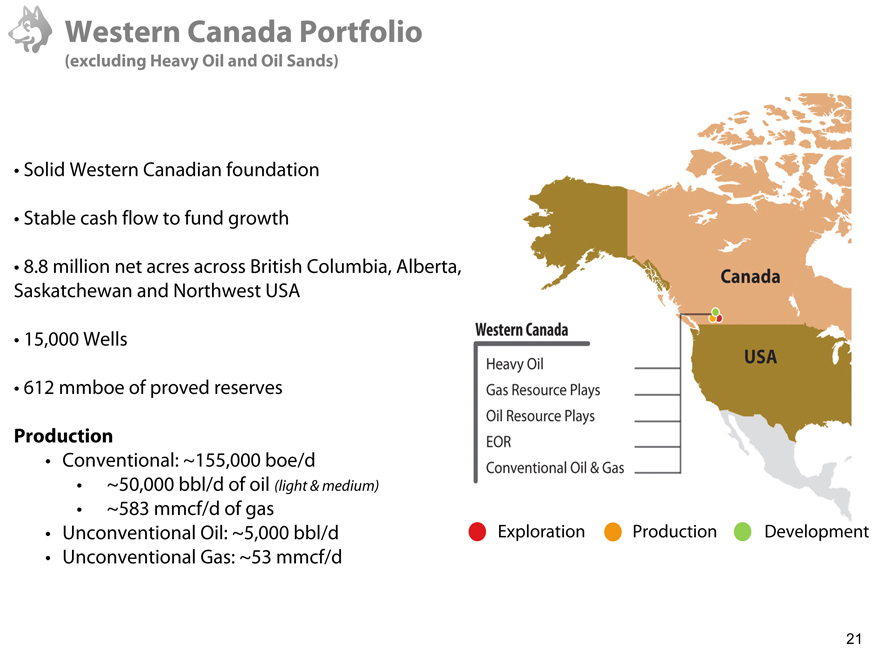
Western Canada Portfolio
(excluding Heavy Oil and Oil Sands)
• Solid Western Canadian foundation
• Stable cash flow to fund growth
• 8.8 million net acres across British Columbia, Alberta, Saskatchewan and Northwest USA
• 15,000 Wells
• 612 mmboe of proved reserves
Production
• Conventional: ~155,000 boe/d
• ~50,000 bbl/d of oil (light & medium)
• ~583 mmcf/d of gas
• Unconventional Oil: ~5,000 bbl/d
• Unconventional Gas: ~53 mmcf/d
Western Canada
Heavy Oil
Gas Resource Plays
Oil Resource Plays
EOR
Conventional Oil & Gas
Exploration Production Development
Canada
USA
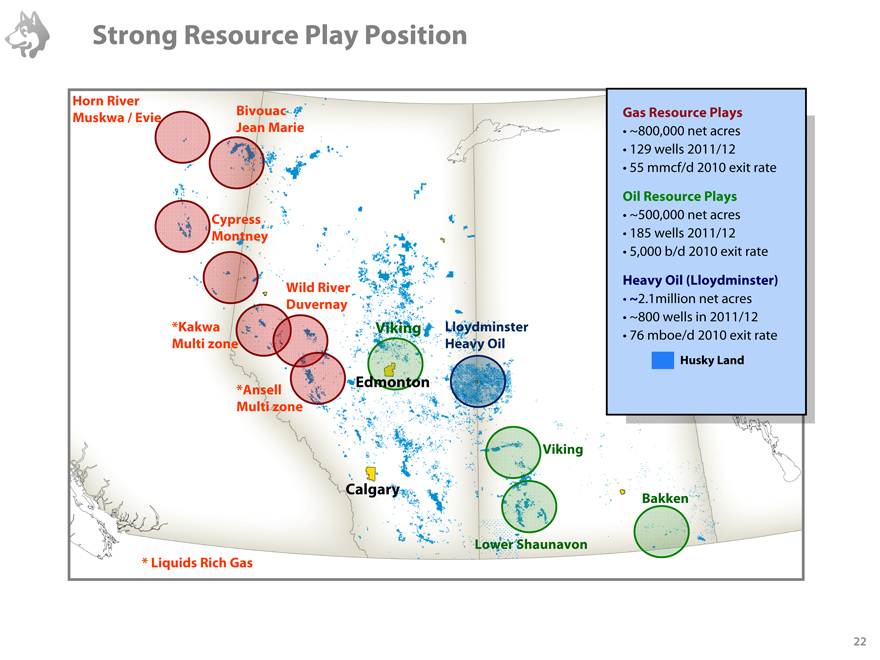
Strong Resource Play Position
Gas Resource Plays
~800,000 net acres
129 wells 2011/12
55 mmcf/d 2010 exit rate
Oil Resource Plays
~500,000 net acres
185 wells 2011/12
5,000 b/d 2010 exit rate
Heavy Oil (Lloydminster)
~2.1million net acres
~800 wells in 2011/12
76 mboe/d 2010 exit rate
Husky Land
Horn River Muskwa / Evie
Bivouac Jean Marie
Cypress Montney
Wild River Duvernay
*Kakwa Multi zone
*Ansell Multi zone
Viking
Edmonton
Lloydminster Heavy Oil
Calgary
Viking
Lower Shaunavon
Bakken
* |
| Liquids Rich Gas |
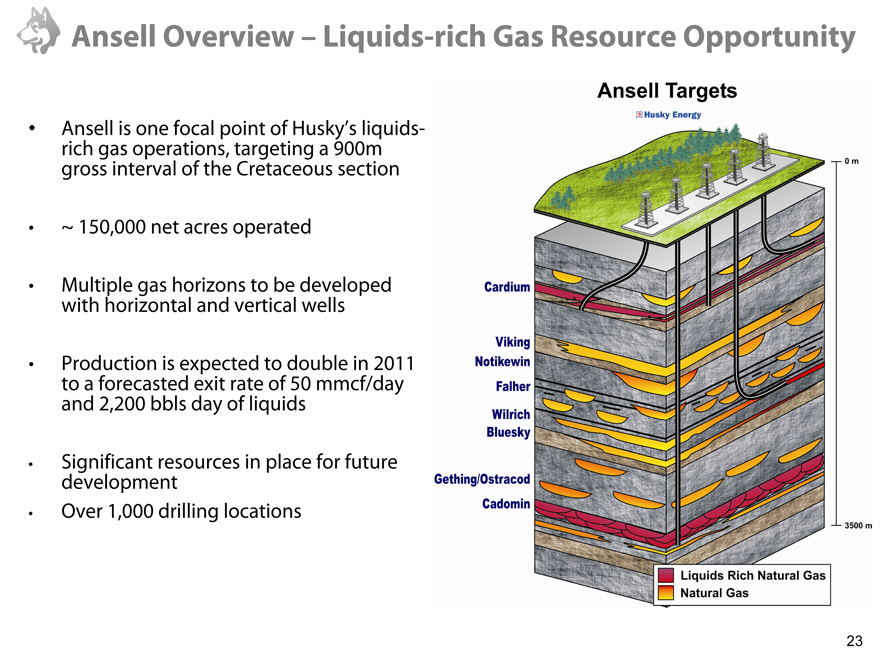
Ansell Overview – Liquids-rich Gas Resource Opportunity
Ansell is one focal point of Husky’s liquids-rich gas operations, targeting a 900m gross interval of the Cretaceous section
~150,000 net acres operated
Multiple gas horizons to be developed with horizontal and vertical wells
Production is expected to double in 2011 to a forecasted exit rate of 50 mmcf/day and 2,200 bbls day of liquids
Significant resources in place for future development
Over 1,000 drilling locations
Ansell Targets
Husky Energy
Cardium
Viking
Notikewin
Falher
Wilrich
Bluesky
Gething/Ostracod
Cadomin
Liquids Rich Natural Gas
Natural Gas
0m 3500m

Kakwa Overview-Oil Resource in Tight Sandstone
Kakwa and Wapiti areas in West Central Alberta, at the northern end of the Cardium trend
Both feature high rock quality and pay thickness with ~ 45° API oil, developable with multi-stage fracturing technology
30,000 net acres operated
Significant resources in place for future development
Over 100 drilling locations
Packers Plus QuickFRAC image
Subsurface Targets
Oilsands
Good Quality Reservoir
Poorer Quality Reservoirs
Tight reservoirs & organic rich shales have become a development target
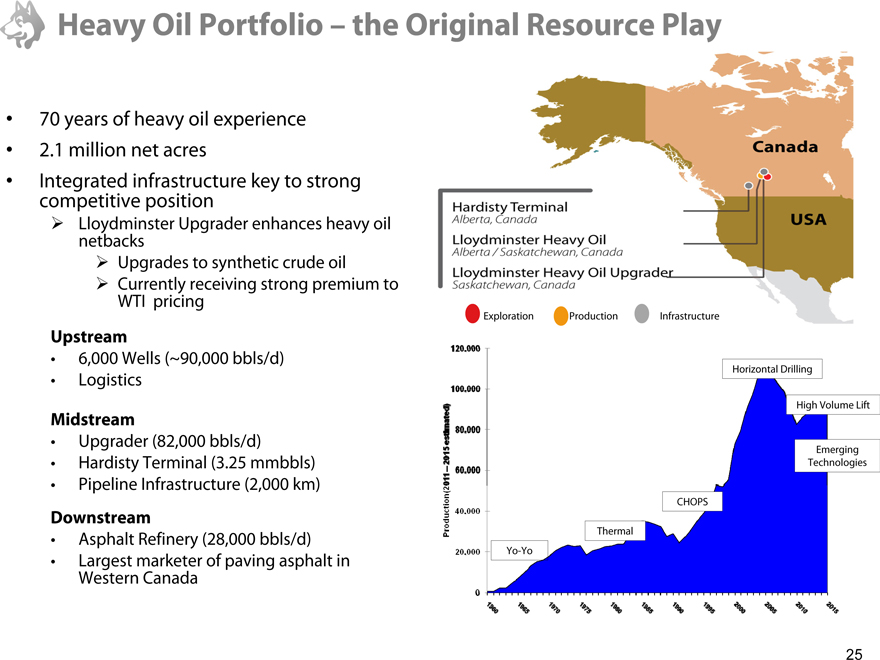
Heavy Oil Portfolio – the Original Resource Play
70 years of heavy oil experience
2.1 million net acres
Integrated infrastructure key to strong competitive position
Lloydminster Upgrader enhances heavy oil netbacks
Upgrades to synthetic crude oil
Currently receiving strong premium to WTI pricing
Upstream
6,000 Wells (~90,000 bbls/d)
Logistics
Midstream
Upgrader (82,000 bbls/d)
Hardisty Terminal (3.25 mmbbls)
Pipeline Infrastructure (2,000 km)
Downstream
Asphalt Refinery (28,000 bbls/d)
Largest marketer of paving asphalt in Western Canada
Canada
USA
Hardisty Terminal
Alberta, Canada
Lloydminster Heavy oil
Alberta/Saskatchewan, Canada
Lloydminster Heavy Oil Upgrader
Saskatchewan, Canada
Exploration
Production
Infrastructure
120,000
100,000
80,000
50,000
40,000
20,000
0
Production(2011-2015 estimated)
Yo-Yo
Thermal
Chops
Horizontal Drilling
High Volume Lift
Emerging Technologies
1960
1965
1970
1975
1980
1985
1990
1995
2000
2005
2010
2015
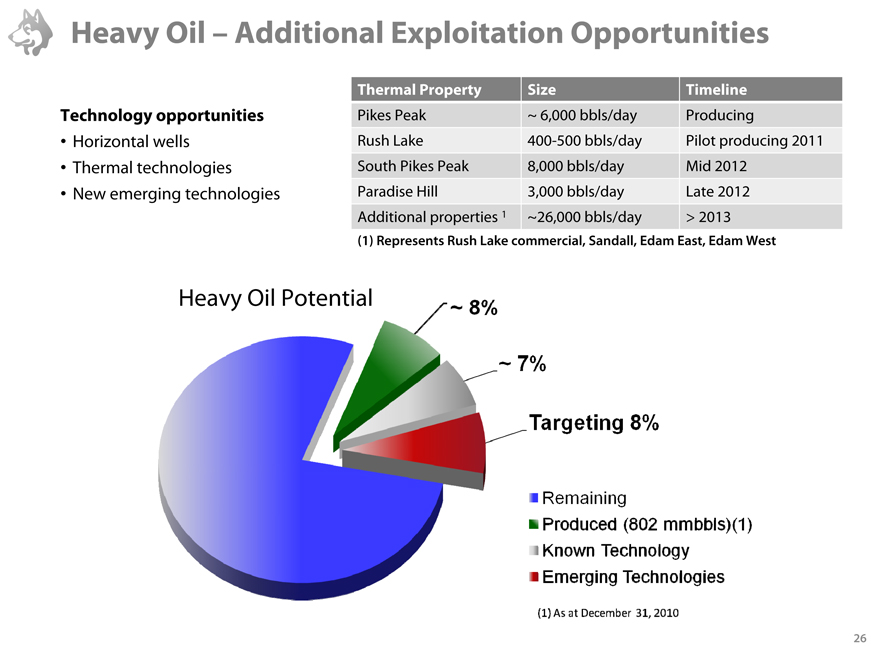
Heavy Oil – Additional Exploitation Opportunities
Technology opportunities
Horizontal wells
Thermal technologies
New emerging technologies
Thermal Property Size Timeline
Pikes Peak ~ 6,000 bbls/day Producing
Rush Lake 400-500 bbls/day Pilot producing 2011 South Pikes Peak 8,000 bbls/day Mid 2012 Paradise Hill 3,000 bbls/day Late 2012 Additional properties 1 ~26,000 bbls/day > 2013
(1) |
| Represents Rush Lake commercial, Sandall, Edam East, Edam West |
Heavy Oil Potential
8%
~7%
Targeting 8%
Remaining
Produced (802 mmbbls)(1)
Emerging Technologies
Corporate Overview
Financial Overview
Regenerating the Foundation
Pillars of Growth
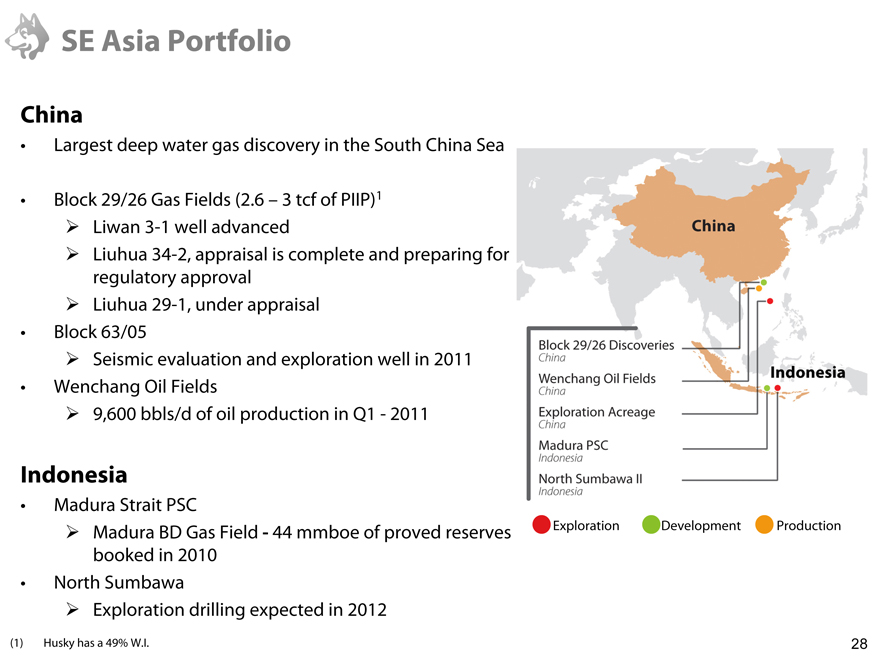
SE Asia Portfolio
China
Largest deep water gas discovery in the South China Sea
Block 29/26 Gas Fields (2.6 – 3 tcf of PIIP)1
Liwan 3-1 well advanced
Liuhua 34-2, appraisal is complete and preparing for regulatory approval
Liuhua 29-1, under appraisal
Block 63/05
Seismic evaluation and exploration well in 2011
Wenchang Oil Fields
9,600 bbls/d of oil production in Q1 - 2011
Indonesia
Madura Strait PSC
Madura BD Gas Field - 44 mmboe of proved reserves booked in 2010
North Sumbawa
Exploration drilling expected in 2012
(1) |
| Husky has a 49% W.I. |
China
Indonesia
Block 29/26 Discoveries
China
Wenchang Oil Fields
China
Exploration Acreage
China
Madura PSC
Indonesia
North Sumbawa II
Indonesia
Exploration
Development
Production
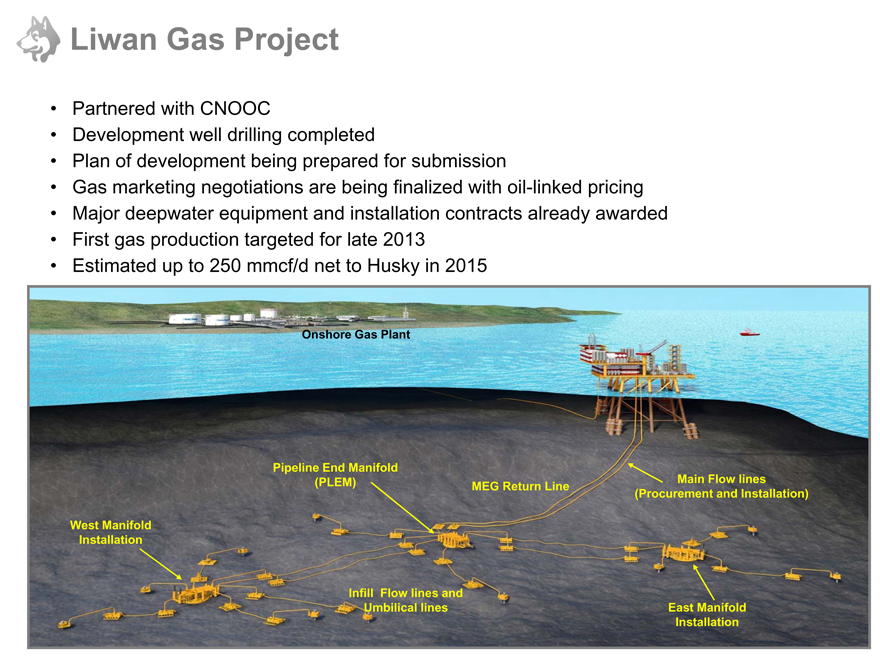
Liwan Gas Project
Partnered with CNOOC
Development well drilling completed
Plan of development being prepared for submission
Gas marketing negotiations are being finalized with oil-linked pricing
Major deepwater equipment and installation contracts already awarded
First gas production targeted for late 2013
Estimated up to 250 mmcf/d net to Husky in 2015
Onshore Gas Plant
West Manifold Installation
Pipeline End Manifold (PLEM)
Infill Flow lines and Umbilical lines
MEG Return Line
Main Flow lines (Procurement and Installation)
East Manifold Installation
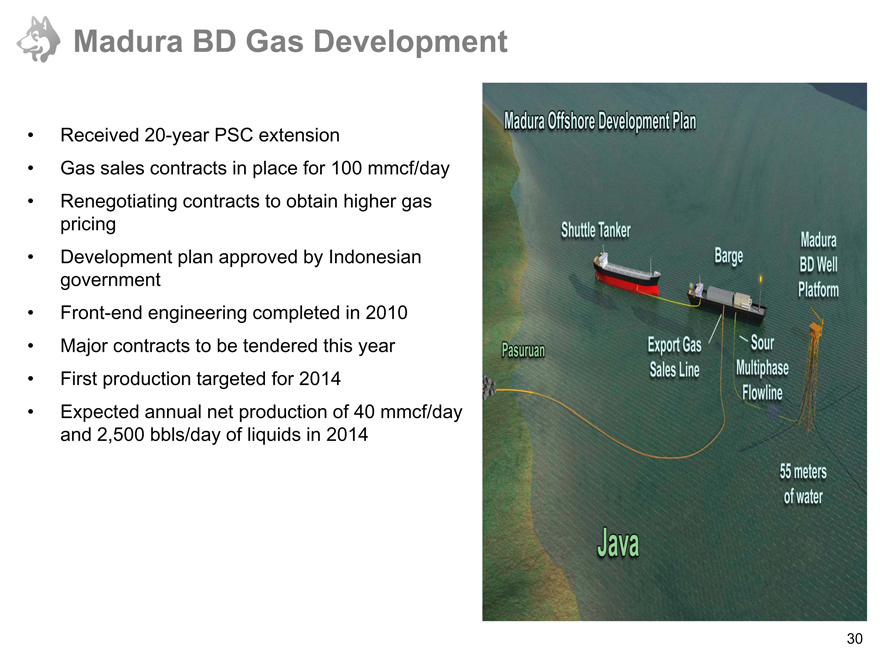
Madura BD Gas Development
Received 20-year PSC extension
Gas sales contracts in place for 100 mmcf/day
Renegotiating contracts to obtain higher gas pricing
Development plan approved by Indonesian government
Front-end engineering completed in 2010
Major contracts to be tendered this year
First production targeted for 2014
Expected annual net production of 40 mmcf/day and 2,500 bbls/day of liquids in 2014
Madura Offshore Development Plan
Pasuruan
Shuttle Tanker
Export Gas Sales Line
Barge
Sour Multiphase Flowline
Madura BD Well Platform
55 meters of water
Java
|
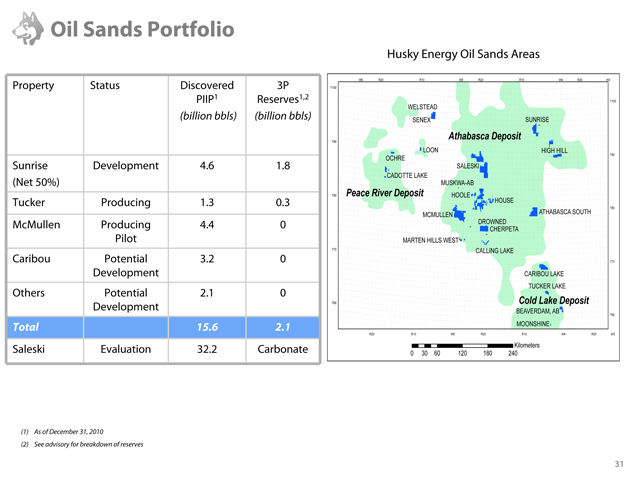
Oil Sands Portfolio
Property Status Discovered 3P
PIIP1 Reserves1,2
(billion bbls) (billion bbls)
Sunrise Development 4.6 1.8
(Net 50%)
Tucker Producing 1.3 0.3
McMullen Producing 4.4 0
Pilot
Caribou Potential 3.2 0
Development
Others Potential 2.1 0
Development
Total 15.6 2.1
Saleski Evaluation 32.2 Carbonate
Husky Energy Oil Sands Areas
(1) |
| As of December 31, 2010 |
(2) |
| See advisory for breakdown of reourses |
WELSTEAD
SENEX
LOON
OCHRE
CADOTTE LAKE
Peace River Deposit
Athabasca Deposit
SALESKI
MUSKWA-AB
HOOLE
MCMULLEN
MARTEN HILLS WEST
SUNRISE
HIGH HILL
ATHABASCA SOUTH
CARIBOU LAKE
TUCKER LAKE
Cold Lake Deposit
BEAVERDAM, AB
MOONSHINE
Kilometers
0
30
60
120
180
HOUSE
DROWNED
CHERPETA
CALLING CAKE
240
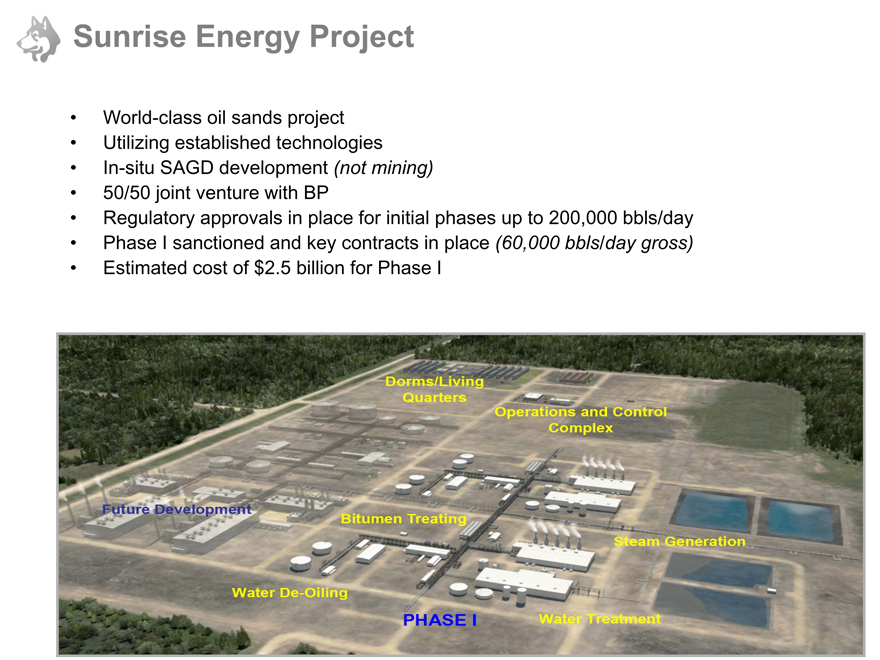
Sunrise Energy Project
World-class oil sands project
Utilizing established technologies
In-situ SAGD development (not mining)
50/50 joint venture with BP
Regulatory approvals in place for initial phases up to 200,000 bbls/day
Phase I sanctioned and key contracts in place (60,000 bbls/day gross)
Estimated cost of $2.5 billion for Phase I
Future Development
Water De-Oiling
Dorms/Living Quarters
Bitumen Treating
PHASE I
Operations and Control Complex
Water Treatment
Steam Generation
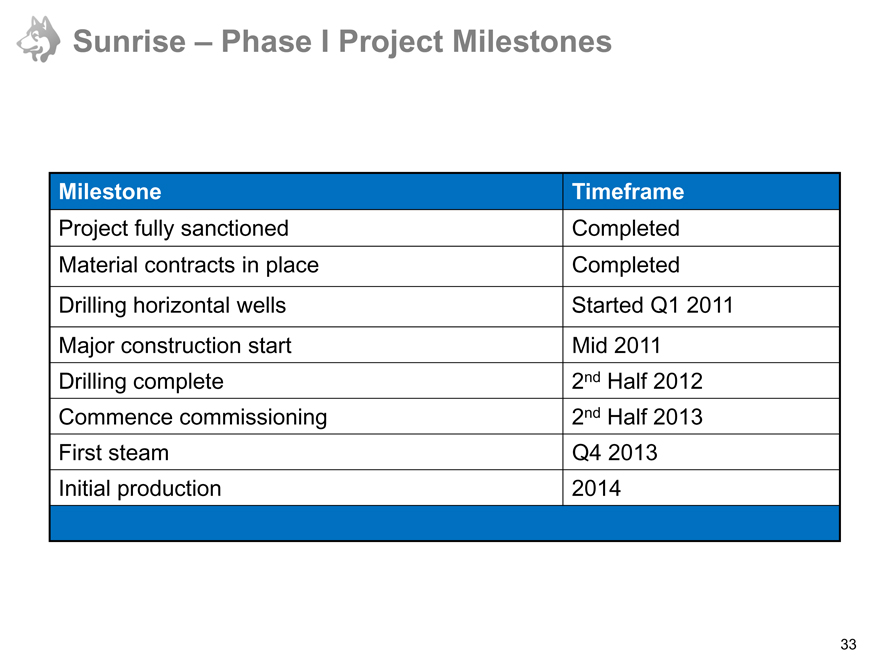
Sunrise – Phase I Project Milestones
Milestone Timeframe
Project fully sanctioned Completed
Material contracts in place Completed
Drilling horizontal wells Started Q1 2011
Major construction start Mid 2011
Drilling complete 2nd Half 2012
Commence commissioning 2nd Half 2013
First steam Q4 2013
Initial production 2014
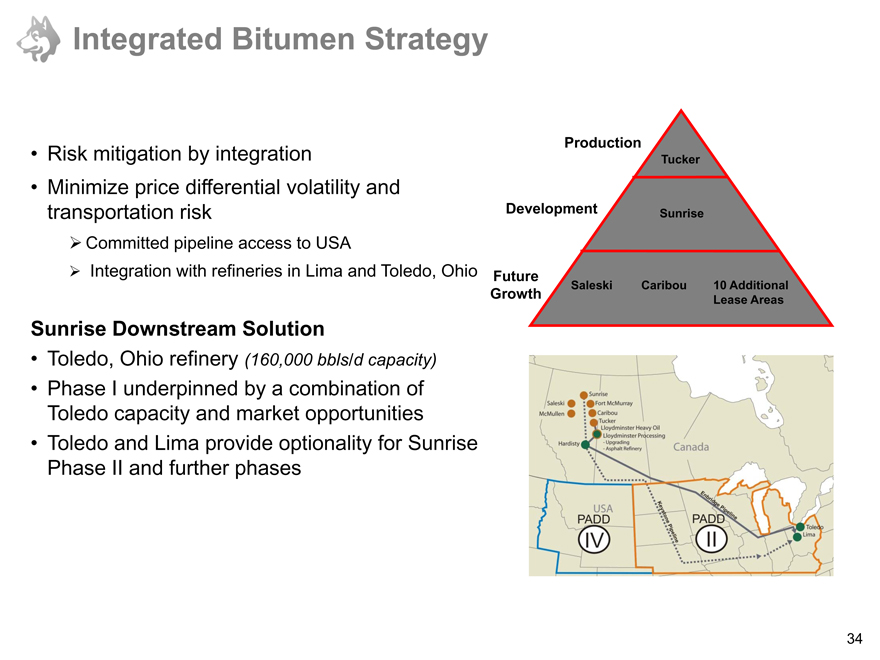
Integrated Bitumen Strategy
Risk mitigation by integration
Minimize price differential volatility and transportation risk
Committed pipeline access to USA
Integration with refineries in Lima and Toledo, Ohio
Sunrise Downstream Solution
Toledo, Ohio refinery (160,000 bbls/d capacity)
Phase I underpinned by a combination of
Toledo capacity and market opportunities
Toledo and Lima provide optionality for Sunrise Phase II and further phases
Production
Development
Future
Saleski
Growth
Tucker
Sunrise
Caribou 10 Additional Lease Areas
Saleski
McMullen
Hardisty
Sunrise
Fort mcMurray
Caribou
Tucker
Lloydminster Heavy Oil
Lloydminster Processing
-Upgrading
-Asphalt Refinery
Canada
USA
PADD
IV
Keystone Pipeline
Enbridge Pipeline
PADD
II
Toledo Lima
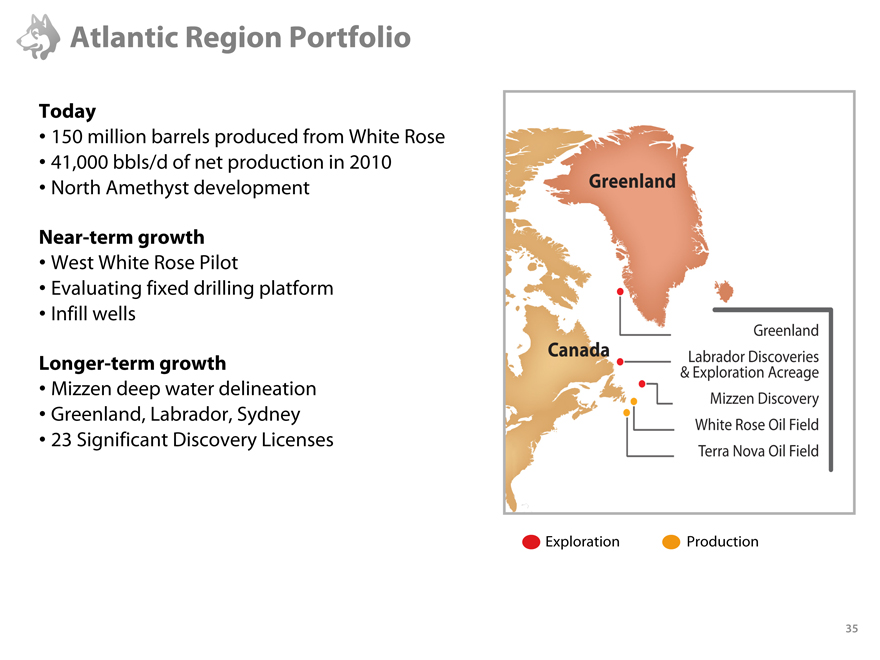
Atlantic Region Portfolio
Today
150 million barrels produced from White Rose
41,000 bbls/d of net production in 2010
North Amethyst development
Near-term growth
West White Rose Pilot
Evaluating fixed drilling platform
Infill wells
Longer-term growth
Mizzen deep water delineation
Greenland, Labrador, Sydney
23 Significant Discovery Licenses
Greenland
Canada
Greenland
Labrador Discoveries & Exploration Acreage
Mizzen Discovery
White Rose Oil Field
Terra Nova Oil Field
Exploration Production
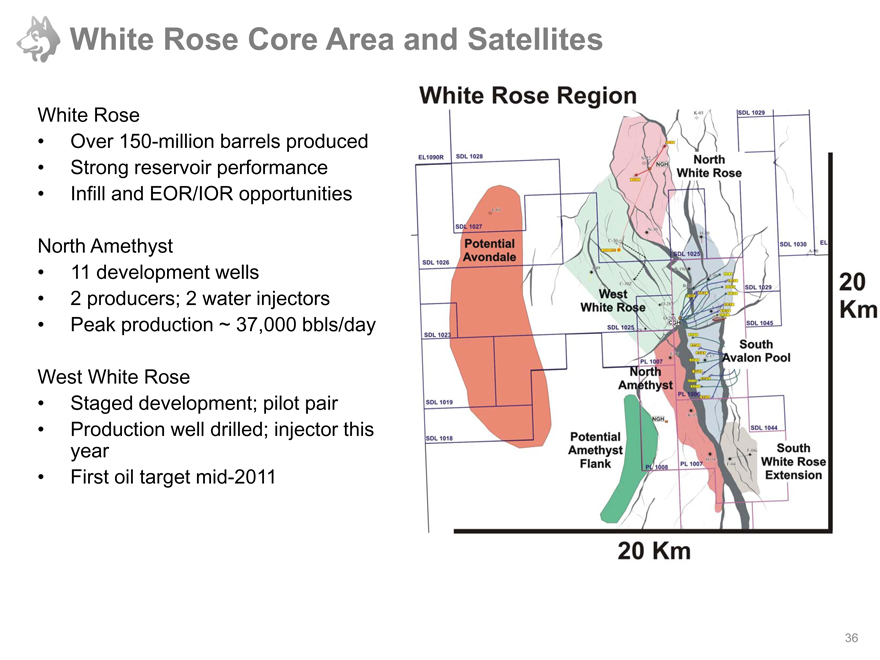
White Rose Core Area and Satellites
White Rose
Over 150-million barrels produced
Strong reservoir performance
Infill and EOR/IOR opportunities
North Amethyst
11 development wells
2 |
| producers; 2 water injectors |
Peak production ~ 37,000 bbls/day
West White Rose
Staged development; pilot pair
Production well drilled; injector this year
First oil target mid-2011
White Rose Region
Potential Avondale
North White Rose
West White Rose
Potential Amethyst Flank
South Avalon Pool
South White Rose Extension
20KM North Amethyst
20KM
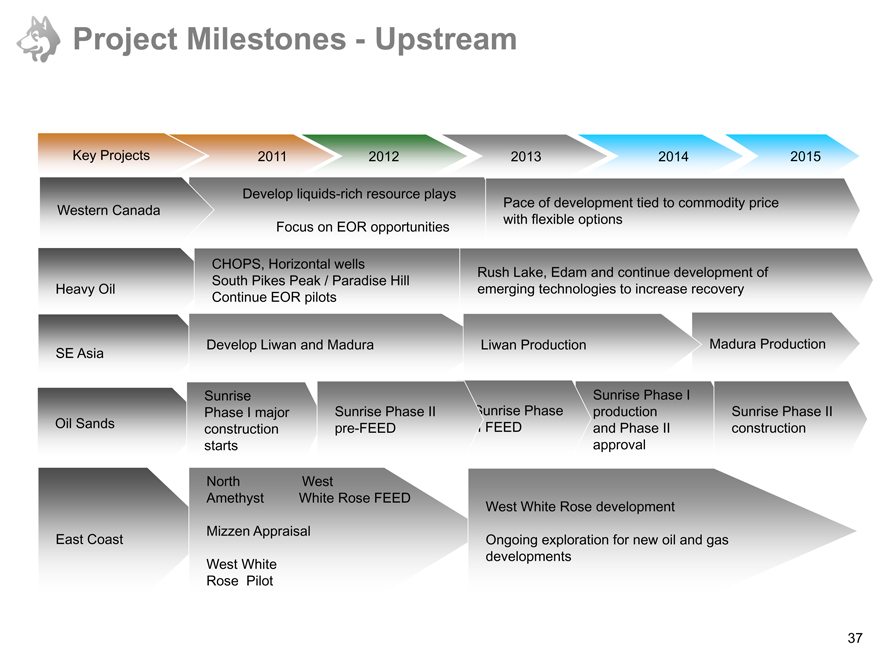
Project Milestones - Upstream
Key Projects 2011 2012 2013 2014 2015
Develop liquids-rich resource plays
Western Canada Pace of development tied to commodity price
Focus on EOR opportunities with flexible options
CHOPS, Horizontal wells Rush Lake, Edam and continue development of
South Pikes Peak / Paradise Hill
Heavy Oil emerging technologies to increase recovery
Continue EOR pilots
SE Asia Develop Liwan and Madura Liwan Production Madura Production
Sunrise Sunrise Phase I
Phase I major Sunrise Phase II Sunrise Phase production Sunrise Phase II
Oil Sands construction pre-FEED II FEED and Phase II construction
starts approval
North West
Amethyst White Rose FEED West White Rose development
Mizzen Appraisal
East Coast Ongoing exploration for new oil and gas
West White developments
Rose Pilot
Competitive Advantages
Large energy company leveraged to oil
Capturing full value for heavy oil and oil sands through focused integrated value chain
Solid foundation in Western Canada, with heavy oil plus a growing position in oil & gas resource plays
Substantial world-class assets which
form strong pillars for growth
Geographically diversified and operating in stable environments
Prudently capitalized and focused on delivering returns to shareholders
Experienced management team with track record of execution
Investor Relations Contacts
Rob McInnis Manager Investor Relations 403-298-6817
Rob.McInnis@HuskyEnergy.com
Jonathan Stringham Investor Relations 403-298-7417
Jon.Stringham@huskyenergy.com
Craig Milligan Investor
Relations 403-750-5044
Craig.Milligan@huskyenergy.com
Husky Energy
Corporate Overview – June 2011
Today we have completed a key element of our financing strategy, which we first shared with you last November.
Through a bought deal common share offering and concurrent private placement, Husky has raised approximately $1.2 billion dollars.
This funding provides us with additional financial flexibility as we continue to advance and accelerate our growth strategy.
Husky is well positioned among its peers in that it is an opportunity-rich Company. We have tremendous growth opportunities, not only in our traditional base here in Western Canada, but also in our growth pillars in the Oil Sands, the Atlantic Region, and in South East Asia.
The challenge for us has been to prioritize those opportunities, and to determine how best to bring forward development so that we can deliver increased value to our shareholders.
Today’s announcement allows us to deliver on those goals.
Let’s take a quick snapshot of Husky:
Husky is one of the largest Canadian integrated energy companies. Our production is weighted at oil (70%) and will remain so. Value proposition is diversified balanced growth. We have significant principal shareholder support for execution our strategy.
We are diversified geographically and by product. We operate in stable geopolitical environments with significant portion of our resource is located in Canada which is a politically stable energy super power with the second largest reserves position in the world.
Last December we unveiled our future business strategy its based on a strong Western Canadian foundation and 3 key growth pillars. The funding we raised today supports our value acceleration strategy.
As I mentioned, Husky has good diversity in our production by product. We have 70% biased towards oil and liquids and we have intent to maintain this product split longer term. Our production is approximately 80% from Western Canada, with 87% of proven
reserves are located in the Western Canadian Sedimentary Basin. Additional upside will come from oil and gas resource plays, oil sands and SE Asia. On the sanction of Liwan, we will also book significant additional reserves
Unlike our peers, Husky doesn’t have an exploration challenge as our “Prospect Inventory” is substantial. We have significant land position. 1.3 million net acres of oil and gas resource plays in Western Canada and sizable Heavy Oil resource base given our long history here. We have 500,000 net acres of oil sands in our portfolio and also extensive exploration portfolio, both in SE Asia and in the Atlantic Region. At current production rate we have over 65 years of production. Our strategy is focused on accelerating development into production to create shareholder value.
Our strategy and commitment to the shareholders is based on clearly defined portfolio of projects. No exploration success is required to achieve our stated growth targets over the next 5 years.
Our clear and deliverable plan provides for:
| (1) | Annual production growth of 3-5% at the high end through 2015 and continues in that range through 2021 |
| (2) | Annual reserve replacement is targeted to be greater than 140% through 2021 |
| (3) | Return On Capital Employed (ROCE) to be increased 5 percentage points over the plan period through 2015 |
| (4) | Underlying all of this will be the maintenance of a strong balance sheet and investment grade rating |
| (5) | and ensuring that we continue to sustain the level of dividend we currently share with our shareholders. |
What is our Value Proposition? It’s clearly balanced growth which will be delivered with a clear strategy and a experienced team. We are Oil-weighted portfolio and are leveraged to demand growth in the market. Our production and reserves growth through large, organic and diversified project portfolio. Our significant Asian portfolio—particularly the world-scale Liwan gas development—offers significant growth opportunities. We will sustain our top quartile dividend. Underpinned by a strong balance sheet and financial flexibility together with strong support from principal shareholders.
The key drivers of our results are:
| • | the oil price |
| • | the gas price |
| • | refining crack spreads in the U.S. |
| • | and of course the U.S. Canadian dollar exchange rate |
And looking at our 2011. Q1 results, we see a strong rebound in oil prices a dissolation between Brent and WTi pricing which is beneficial for Atlantic and China production, 30 percent of our total liquids production. Mid Continent crack spreads have improved significantly, however natural gas remains weak.
And looking at Q1 we achieved earnings of approximately $600 million dollars in the first quarter, compared to $900 million dollars approximately for the whole of 2010.
Our financial strategy that underpins our growth strategy is to ensure adequate liquidity and financial flexibility to fund that growth, but underpinned as I have said before with a Maintenance of investment grade credit ratings, and we continue to receive the strong support from principal shareholders towards execution of our growth plan.
We have a history of prudent financial management. With strong balance sheet metrics that we intend to maintain
Our 2011 guidance for capital expenditures is $4.8 billion, a significant increase from 2009/2010 levels and it is focused on our upstream business. Our Q1 production puts us on track for delivering towards the higher end of our guidance range for 2011.
With our financing strategy in place, we will be able to accelerate exploration and development of our emerging oil and gas resource portfolio which includes our Ansell liquids-rich gas play and Kakwa oil resource plays in west central Alberta.
We also plan to accelerate the development of Phase 2 of the Sunrise Energy Project in northern Alberta. Phase 1 of Sunrise was sanctioned in late 2010 and remains on track for first oil in 2014. The conceptual work on Phase 2 of Sunrise began in the first quarter of 2011, and we now plan to combine pre-FEED and FEED work for a larger scale Phase 2.
The financing also provides additional flexibility as we move forward with the development of the Liwan Gas Project offshore China, and we continue to see tremendous opportunity to build a growth-oriented oil and gas business in the region.
We are also moving forward with exploring options for the next phase of our East Coast White Rose satellite developments. This may include construction of a fixed drilling platform.
Western Canada is a key element of our foundation. Our strategy is to stabilize and maintain production through organic and inorganic means. Pursue high value resource and conventional plays and direct our capital to top-tier assets to deliver top-tier metrics.
We have an extensive land position within Western Canada (approximately 5.7 mm net acres undeveloped).
Included within that we have assembled a large land position (800,000 net acres) in gas resource plays. This includes established liquids rich plays at Ansell and Kakwa as well as a position in the Montney and Horn River plays. We have a large position in the Jean Marie play in Bivouac as well as an emerging position in the Wild River Duvernay play. Our portfolio is diversified in terms of reservoir comprising—tight sands, tight carbonates and shales. In oil resource plays we have approximately 500,000 net acres of land including the Viking, Bakken and Lower Shaunavon formations.
Our overall strategy is to high grade and grow our oil resource plays; in the near term to focus capital into liquids rich gas plays (Ansell & Kakwa) and de risk and maintain our dry gas position.
Ansell is a focal point of Husky’s liquids-rich gas resource development. We have nearly 150,000 net acres at Ansell operated by Husky. Multiple gas horizons to be developed with horizontal and vertical wells. Significant resources is in place for future development.
The Kakwa and Wapiti areas in West Central Alberta, at the northern end of the Cardium trend, are our initial oil resource developments. Both of these plays feature high rock quality and pay thickness with ~45° API oil, developable with multi-stage fracturing technology. We have nearly 30,000 net acres operated by Husky. And significant resources are in place for future development.
Heavy oil has been the historical foundation for Husky and will continue to be an important part of our future with the application of technology.
As I said, Heavy Oil has long been a contributor to our success. To date we have recovered approximately 8% of the resource in place (over the last 70 years). With known technologies, we are confident in our ability to access a further 7%. We have emerging technologies are targeting a further 8% at a sustainable level of production. We will be operating in this business for a long time to come.
Turning now to our Pillars of Growth, South East Asia portfolio comprises world class assets, including the Liwan gas development. And we are targeting production for the region of approximately 50,000 boe per day by 2014.
At the Liwan Gas Project, we are making significant progress in moving towards production in late 2013. Husky’s ownership share of this project is 49% of production We expect our gas contracts to be linked to LNG pricing. First gas is expected to come on stream late 2013 ramping up through 2014. Contract is in place and the project is
anticipated to be one of the fastest deep water developments in the world to go from discovery to production.
In the Madura BD Gas Development, we have moving forward with the Madura BD development following receipt of 20-year PSC extension last year. Gas sales contracts in place for 100 mmcf/day. Development plan had been approved by Indonesian government. Front-end engineering was completed in 2010 and we will be tendering major contracts this year with first production targeted for 2014.
On our Oil Sands portfolio, we have assembled an enviable position Not including Saleski, a carbonate resource, we have more than 15 billion barrels of resource in place. We had Sanctioned Phase I Sunrise Energy Project in 2010 and are looking forward to Phase 2
The Saleski Carbobnate resource is clearly a significant potential for the company going forward, but will take additional technology to develop.
The Sunrise Energy Project is the Crown Jewel in our Oil Sands Portfolio. It is a very high quality reservoir, adjoining Firebag , compared to the lower quality Tucker reservoir. Phase One as I said we sanctioned late last year and is designed to produce 60,000 bbls/day gross, 30,000 bbls/d net Husky’s share with first oil on track for late 2014. The contracting strategy is in place to maintain cost control through significant fixed by lump sum pricing. Sunrise Phase 2 pre-engineering has commenced and is being accelerated. And we certainly believe the development is capable of achieving 400,000 barrels per day.
We set out on this slide the major milestones you can expect to see on the Sunrise Phase I development activity, and as you can see we are well on track to meeting those targets.
Our Integrated Bitumen Strategy is designed to mitigate risk, reduce volatility and to capture value from our heavy oil and bitumen resources. This strategy is borne from a long experience with heavy oil and our Upgrader at Lloydminster area.
Atlantic Region has been a significant contributor to production with over 150 million barrels produced from White Rose to date, all high netback light oil. We have a strong land position in the area for near, mid and long-term growth. We are currently evaluating fixed drilling platform which will reduce F&D costs and increase resource recoverability in the region. This will allows us to regenerate growth in region from 2016.
The Jeanne d’Arc basin has proved to be a prolific basin, but we are not done yet. We have tied in the North Amethyst satellite field. We are in the process of conducting a
pilot at the West White Rose satellite. And as I said we are looking forward to the development of a fix platform to access further resources in the region.
Our strategy and committed outcomes based on a portfolio of identified projects. We are not dependant on exploration success for near term growth. As I said before, our challenge is not an exploration but to accelerate the development and commercialization of a large resource base we currently have.
With the capital raised, Husky is in a solid position to enhance its deliverables. We now project production for the 2011 to 2015 timeframe will be towards the high end of our guidance of three to five percent compound average growth. We also forecast being able to sustain a three to five percent annual growth rate through 2021. With an annual reserves replacement ratio of 140 percent annually over the same period.
We have a tremendous pipeline of growth projects and now we have the financial flexibility to accelerate developments to bring forward shareholder value.
The focus of Husky is now on execution.
Thank you for listening to our Road Show today.