2014
United States
Securities and Exchange Commission
Washington, D.C. 20549
Form 40-F
| ¨ | Registration Statement pursuant to section 12 of the Securities Exchange Act of 1934 |
| þ | Annual report pursuant to section 13(a) or 15(d) of the Securities Exchange Act of 1934 |
For the fiscal year ended December 31, 2014
Commission File Number: 001-04307
Husky Energy Inc.
(Exact name of Registrant as specified in its charter)
| | | | |
| Alberta, Canada | | 1311 | | Not Applicable |
(Province or other jurisdiction of incorporation or organization) | | (Primary Standard Industrial
Classification Code Number (if applicable)) | | (I.R.S. Employer Identification Number (if applicable)) |
707-8th Avenue S.W., P.O. Box 6525 Station D, Calgary, Alberta, Canada T2P 3G7
(403) 298-6111
(Address and telephone number of Registrant’s principal executive office)
CT Corporation System, 111 Eighth Avenue, New York, New York 10011
(877) 467-3525
(Name, address (including zip code) and telephone number (including area code)
of agent for service in the United States)
Securities registered or to be registered pursuant to Section 12(b) of the Act:
Title of Class: None
Securities registered or to be registered pursuant to Section 12(g) of the Act:
Title of Class: None
Securities for which there is a reporting obligation pursuant to Section 15(d) of the Act:
Title of Class: Common Shares
For annual reports, indicate by check mark the information filed with this Form:
| | |
| þ Annual information form | | þ Audited annual financial statements |
Number of outstanding shares of each of the issuer’s classes of capital or common stock as of the close of the period covered by the annual report:
983,738,062 Common Shares outstanding as of December 31, 2014
12,000,000 Cumulative Redeemable Preferred Shares, Series 1 outstanding as of December 31, 2014
10,000,000 Cumulative Redeemable Preferred Shares, Series 3 outstanding as of December 31, 2014
Indicate by check mark whether the Registrant (1) has filed all reports required to be filed by Section 13 or 15(d) of the Exchange Act during the preceding 12 months (or for such shorter period that the Registrant was required to file such reports) and (2) has been subject to such filing requirements for the past 90 days.
þ Yes ¨ No
Indicate by check mark whether the Registrant has submitted electronically and posted on its corporate Website, if any, every Interactive Data File required to be submitted and posted pursuant to Rule 405 of Regulation S-T (s.232.405 of this chapter) during the preceding 12 months (or for such shorter period that the Registrant was required to submit and post such files).
¨ Yes ¨ No
The Annual Report on Form 40-F shall be incorporated by reference into or as an exhibit to, as applicable, the Registrant’s Registration Statement under the Securities Act of 1933: Form F-10 File (No. 333-191849); Form S-8 File No. (333-187135).
Principal Documents
The following documents have been filed as part of this Annual Report on Form 40-F:
| A. | Annual Information Form |
The Annual Information Form of Husky Energy Inc. (“Husky” or “the Company”) for the year ended December 31, 2014 is included as Document A of this Annual Report on Form 40-F.
| B. | Audited Annual Financial Statements |
Husky’s audited consolidated financial statements for the years ended December 31, 2014 and December 31, 2013, including the auditors’ report with respect thereto, is included as Document B of this Annual Report on Form 40-F.
| C. | Management’s Discussion and Analysis |
Husky’s Management’s Discussion and Analysis for the year ended December 31, 2014 is included as Document C of this Annual Report on Form 40-F.
Certifications
See Exhibits 31.1, 31.2, 32.1 and 32.2, which are included as Exhibits to this Annual Report on Form 40-F.
Supplemental Reserves Information
See Exhibit 99.1 for the Supplemental Reserves Information, which is included as an Exhibit to this Annual Report on Form 40-F.
Disclosure Controls and Procedures
See the section “Disclosure Controls and Procedures” in Husky’s Management’s Discussion and Analysis for the year ended December 31, 2014, which is included as Document C of this Annual Report on Form 40-F.
Management’s Annual Report on Internal Control Over Financial Reporting
The section “Management’s Annual Report on Internal Control over Financial Reporting” in Husky’s Management’s Discussion and Analysis, is included as Document C of this Annual Report on Form 40-F.
Attestation Report of the Registered Public Accounting Firm
The required disclosure is included in the “Report of Independent Registered Public Accounting Firm” that accompanies Husky’s audited consolidated financial statements for the year ended December 31, 2014, which is included as Document B of this Annual Report on Form 40-F.
Changes in Internal Control Over Financial Reporting
The required disclosure is included in the section “Disclosure Controls and Procedures” in Husky’s Management’s Discussion and Analysis for the year ended December 31, 2014, which is included as Document C of this Annual Report on Form 40-F.
Notice Pursuant to Regulation BTR
Not Applicable.
Audit Committee Financial Expert
The Board of Directors of Husky has determined that William Shurniak is an “audit committee financial expert” (as defined in paragraph 8(b) of General Instruction B to Form 40-F) serving on its Audit Committee. Pursuant to paragraph 8(a)(2) of General Instruction B to Form 40-F, the Board has applied the definition of independence applicable to the audit committee members of New York Stock Exchange listed companies, although the Company’s securities are not listed on a U.S. stock exchange. Mr. Shurniak is a corporate director and is independent under the New York Stock Exchange standards. For a description of Mr. Shurniak’s relevant experience in financial matters, see Mr. Shurniak’s history in the section “Directors and Officers” and in the section “Audit Committee” in Husky’s Annual Information Form for the year ended December 31, 2014, which is included as Document A of this Annual Report on Form 40-F.
Code of Business Conduct and Ethics
Husky’s Code of Ethics is disclosed in its Code of Business Conduct, which is applicable to its principal executive officer, principal financial officer, principal accounting officer or controller or persons performing similar functions and to all of its other employees, and is posted on its website atwww.huskyenergy.com. A copy of Husky’s Amended Code of Business Conduct is included as Exhibit 99.2 to this Annual Report on Form 40-F. In the fiscal year ended December 31, 2014, Husky has not granted a waiver, including an implicit waiver, from a provision of its Code of Ethics to any of its principal executive officer, principal financial officer, principal accounting officer or
controller or persons performing similar functions that relates to one or more of the items set forth in paragraph (9)(b) of General Instruction B to Form 40-F. In the event that, during Husky’s ensuing fiscal year, Husky:
| | i. | amends any provision of its Code of Business Conduct that applies to its principal executive officer, principal financial officer, principal accounting officer or controller or persons performing similar functions that relates to any element of the code of ethics definition enumerated in paragraph (9)(b) of General Instruction B to Form 40-F; or |
| | ii. | grants a waiver, including an implicit waiver, from a provision of its Code of Business Conduct to any of its principal executive officer, principal financial officer, principal accounting officer or controller or persons performing similar functions that relates to one or more of the items set forth in paragraph (9)(b) of General Instruction B to Form 40-F; |
Husky will promptly disclose such occurrences on its website following the date that such amendment or waiver is granted and will specifically describe the nature of any amendment or waiver, and in the case of a waiver, name the person to whom the waiver was granted and the date of the waiver, in each case as further described in paragraph (9) of General Instruction B to Form 40-F.
Principal Accountant Fees and Services
See the section “External Auditor Service Fees” in the Annual Information Form for the year ended December 31, 2014, which is included as Document A of this Annual Report on Form 40-F.
Off-Balance Sheet Arrangements
See the section “Off-Balance Sheet Arrangements” in Husky’s Management’s Discussion and Analysis for the year ended December 31, 2014, which is included as Document C of this Annual Report on Form 40-F.
Tabular Disclosure of Contractual Obligations
See the section “Cash Requirements” in Husky’s Management’s Discussion and Analysis for the year ended December 31, 2014, which is included as Document C of this Annual Report on Form 40-F.
Interactive Data File
Not applicable.
Mine Safety Disclosure
Not applicable.
Undertaking and Consent to Service of Process
Undertaking
Husky undertakes to make available, in person or by telephone, representatives to respond to inquiries made by the Commission staff, and to furnish promptly, when requested to do so by the Commission staff, information relating to: the securities in relation to which the obligation to file an annual report on Form 40-F arises; or transactions in said securities.
Consent to Service of Process
A Form F-X signed by Husky and its agent for service of process has been filed with the Commission together with Form F-10 (File No. 333-191849) in connection with its common shares registered on such form.
Any change to the name or address of the agent for service of process of Husky shall be communicated promptly to the Commission by an amendment to the Form F-X referencing the file number of Husky.
Signatures
Pursuant to the requirements of the Exchange Act, Husky Energy Inc. certifies that it meets all of the requirements for filing on Form 40-F and has duly caused this Annual Report to be signed on its behalf by the undersigned, thereto duly authorized.
Dated this 27th day of February, 2015
| | |
| | Husky Energy Inc. |
| |
| By: | | /s/ Asim Ghosh |
| | Name: Asim Ghosh |
| | Title: President & Chief Executive Officer |
| |
| By: | | /s/ James D. Girgulis |
| | Name: James D. Girgulis |
| | Title: Senior Vice President, General Counsel & Secretary |
Document A
Form 40-F
Annual Information Form
For the Year Ended December 31, 2014
Husky Energy Inc.
Annual Information Form
For the Year Ended December 31, 2014
February 27, 2015
TABLE OF CONTENTS
ADVISORIES
In this AIF, the terms “Husky” and “the Company” mean Husky Energy Inc. and its subsidiaries and partnership interests on a consolidated basis, including information with respect to predecessor corporations.
Unless otherwise noted, all financial information included and incorporated by reference in this AIF is determined using IFRS as issued by the International Accounting Standards Board.
Except where otherwise indicated, all dollar amounts stated in this AIF are Canadian dollars.
ABBREVIATIONS AND GLOSSARY OF TERMS
When used in this AIF, the following terms have the meanings indicated:
| | |
Units of Measure |
| bbl | | barrel |
| bbls | | barrels |
| bbls/day | | barrels per calendar day |
| bcf | | billion cubic feet |
| boe | | barrels of oil equivalent |
| boe/day | | barrels of oil equivalent per calendar day |
| GJ | | gigajoule |
| lt | | litres |
| lt/day | | litres per day |
| m | | meters |
| mbbls | | thousand barrels |
| mbbls/day | | thousand barrels per calendar day |
| mboe | | thousand barrels of oil equivalent |
| mboe/day | | thousand barrels of oil equivalent per day |
| mcf | | thousand cubic feet |
| mmbbls | | million barrels |
| mmboe | | million barrels of oil equivalent |
| mmbtu | | million British thermal units |
| mmcf | | million cubic feet |
| mmcf/day | | million cubic feet per calendar day |
| MW | | megawatts |
| tpy | | tons per year |
|
Acronyms |
| AER | | Alberta Energy Regulator |
| AIF | | Annual Information Form |
| API | | American Petroleum Institute |
| ARO | | Asset Retirement Obligations |
| ASC | | Alberta Securities Commission |
| ASP | | Alkaline Surfactant Polymer |
| BACT | | Best Available Control Technology |
| CAPP | | Canadian Association of Petroleum Producers |
| CEMA | | Cumulative Environmental Management Association |
| CEPA | | Canadian Energy Pipeline Association |
| CFA | | Canadian Fuels Association |
| CHOPS | | Cold Heavy Oil Production with Sand |
| CNOOC | | China National Offshore Oil Corporation |
| CO2 | | Carbon dioxide |
| CO2e | | Carbon dioxide equivalent |
| COGEH | | Canadian Oil and Gas Evaluation Handbook |
| CPF | | Central Processing Facility |
| CSA | | Canadian Securities Administrators |
| CSS | | Cyclic Steam Stimulation |
| EDGAR | | Electronic Data Gathering, Analysis, and Retrieval system |
| EIA | | Energy Information Administration |
| EL | | Exploration Licence |
| EOR | | Enhanced Oil Recovery |
| | |
| EPA | | Environmental Protection Agency |
| FASB | | Financial Accounting Standards Board |
| FEED | | Front End Engineering Design |
| FPSO | | Floating Production, Storage and Offloading Vessel |
| GHG | | Greenhouse Gas |
| GHGRP | | Greenhouse Gas Reporting Program |
| HOIMS | | Husky Operational Integrity Management System |
| HSB | | Husky Synthetic Blend |
| IFRS | | International Financial Reporting Standards |
| LARP | | Lower Athabasca Regional Plan |
| LNG | | Liquefied Natural Gas |
| MD&A | | Management’s Discussion And Analysis |
| MEG | | Monoethylene Glycol |
| NGL | | Natural Gas Liquids |
| NIT | | NOVA Inventory Transfer |
| NYMEX | | New York Mercantile Exchange |
| OPEC | | Organization of Petroleum Exporting Countries |
| PHMSA | | Pipeline and Hazardous Materials Safety Administration |
| PSC | | Production Sharing Contract |
| PTAC | | Petroleum Technology Alliance Canada |
| SAGD | | Steam Assisted Gravity Drainage |
| SEC | | Securities and Exchange Commission of the United States |
| SEDAR | | System for Electronic Document Analysis and Retrieval |
| UNFCC COP | | United Nations Framework Convention on Climate Change Conference of the Parties |
| U.S. | | United States |
| WCI | | Western Climate Initiative |
| WTI | | West Texas Intermediate |
| 2-D | | two-dimensional |
| 3-D | | three-dimensional |
The Company uses the term boe, which is calculated on an energy equivalence basis whereby one barrel of crude oil is equivalent to six thousand cubic feet of natural gas. Readers are cautioned that the term boe may be misleading, particularly if used in isolation. This measure is primarily applicable at the burner tip and does not represent a value equivalency at the wellhead.
Abandonment costs
Costs of abandoning a well, net of any salvage value, and disconnecting the well from the surface gathering system.
API° gravity
Measure of oil density or specific gravity used in the petroleum industry. The API scale expresses density such that the greater the density of the petroleum, the lower the degree of API gravity.
Barrel
A unit of volume equal to 42 U.S. gallons.
Bitumen
Bitumen is solid or semi-solid with a viscosity greater than 10,000 centipoise at original temperature in the deposit and atmospheric pressure.
Coal bed methane
The primary energy source of natural gas is methane. Coal bed methane is methane found and recovered from the coal bed seams. The methane is normally trapped in coal by water that is under pressure. When the water is removed the methane is released.
Delineation well
A well in close proximity to an oil or gas well that helps determine the aerial extent of the reservoir.
Development well
A well drilled within the proved area of an oil and gas reservoir to the depth of a stratigraphic horizon known to be productive.
Diluent
A lighter gravity liquid hydrocarbon, usually condensate or synthetic oil, added to heavy oil to improve the transmissibility of the oil through a pipeline.
Dry and abandoned well
A well found to be incapable of producing oil or gas in sufficient quantities to justify completion as a producing oil or gas well.
Enhanced oil recovery
The increased recovery from a crude oil pool achieved by artificial means or by the application of energy extrinsic to the pool. An artificial means or application includes pressuring, cycling, pressure maintenance or injection to the pool of a substance or form of energy but does not include the injection in a well of a substance or form of energy for the sole purpose of aiding in the lifting of fluids in the well, or stimulation of the reservoir at or near the well by mechanical, chemical, thermal or explosive means.
Exploration licence
A licence with respect to the Canadian offshore or the Northwest or Yukon Territories conferring the right to explore for, and the exclusive right to drill and test for, petroleum; the exclusive right to develop the applicable area in order to produce petroleum; and, subject to satisfying the requirements for issuance of a production licence and compliance with the terms of the licence and other provisions of the relevant legislation, the exclusive right to obtain a production licence.
Exploratory well
A well drilled to find a new field or to find a new reservoir in a field previously found to be productive of oil or gas, in another reservoir. Generally, an exploratory well is any well that is not a development well, a service well, an extension well, which is a well drilled to extend the limits of a known reservoir, or a stratigraphic test well as those terms are defined herein.
Field
An area consisting of a single reservoir or multiple reservoirs all grouped on or related to the same individual geological structural feature and/or stratigraphic condition. There may be two or more reservoirs in a field which are separated vertically by intervening impervious strata, or laterally by local geologic barriers, or by both.
Heavy crude oil
Crude oil measured between 10 API° and 22.3 API° and is liquid at original temperature in the deposit and atmospheric pressure.
Horizontal drilling
Drilling horizontally rather than vertically through a reservoir, thereby exposing more of the well to the reservoir and increasing production.
Infill well
A well drilled on an irregular pattern disregarding normal spacing requirements. These wells are drilled to produce from parts of a reservoir that would otherwise not be recovered through existing wells drilled in accordance with normal spacing.
Light crude oil
Crude oil measured at 31.1 API° or lighter.
Liquefied petroleum gas
Liquefied propanes and butanes, separately or in mixtures.
Medium crude oil
Crude oil measured between 22.3 API° and 31.1 API°.
Natural gas liquids
Those hydrocarbon components recovered from raw natural gas as liquids by processing through extraction plants, or recovered from field separators, scrubbers or other gathering facilities. These liquids include the hydrocarbon components ethane, propane, butanes and condensate or a combination thereof.
Oil sands
Sands and other rock materials that contain crude bitumen and include all other mineral substances in association therewith.
Production Sharing Contract
A contract for the development of resources under which the contractor’s costs (investment) are recoverable each year out of the production but with a maximum amount of production that can be applied to the cost recovery in any year. This annual allocation of production is referred to as cost oil; the remainder is referred to as profit oil and is divided in accordance with the contract between the contractor and the host government.
Reserve Replacement Ratio
The reserve replacement ratio represents the rate at which the Company replaces reserve volumes realized through current production for a given period. The ratio is calculated as the sum of: closing reserve volumes less opening reserve volumes plus production volumes divided by production volumes.
Secondary recovery
Oil or gas recovered by injecting water or gas into the reservoir to force additional oil or gas to the producing wells. Usually, but not necessarily, this is done after the primary recovery phase has passed.
Seismic survey
A method by which the physical attributes in the outer rock shell of the earth are determined by measuring, with a seismograph, the rate of transmission of shock waves through the various rock formations. The rate at which the waves are transmitted varies with the medium through which they pass.
Service well
A well drilled or completed for the purpose of supporting production in an existing field. Specific purposes of service wells include gas injection, water injection, steam injection, air injection, saltwater disposal, water supply for injection, observation or injection for in-situ combustion.
Significant discovery licence
A licence issued following the declaration of a significant discovery, which is indicated by the first exploration well that demonstrates by flow testing the existence of sufficient hydrocarbons in a particular geological feature to suggest potential for sustained production. A significant discovery licence confers the same rights as that of an exploration licence.
Specific gravity
The ratio between the weight of equal volumes of water and another liquid measured at standard temperature. The weight of water is assigned a value of one. However, the specific gravity of oil is normally expressed in degrees of API gravity as follows:
| | | | |
Degrees API = | | 141.5 | | -131.5 |
| Specific gravity @ F60 degrees | |
Spot price
The price for a one-time open market transaction for immediate delivery of a specific quantity of product at a specific location where the commodity is purchased “on the spot” at current market rates.
Steam assisted gravity drainage
An enhanced oil recovery method used to produce heavy crude oil and bitumen in-situ. Steam is injected via a horizontal well along a producing formation. The temperature in the formation increases and lowers the viscosity of the crude oil allowing it to fall to a horizontal production well beneath the steam injection well.
Stratigraphic test well
A drilling effort, geologically directed, to obtain information pertaining to a specific geologic condition. Such wells customarily are drilled without the intention of being completed for hydrocarbon production. This classification also includes tests identified as core tests and all types of expendable holes related to hydrocarbon exploration. Stratigraphic test wells are classified as (i) “exploratory-type,” if not drilled in a proved area, or (ii) “development-type,” if drilled in a proved area.
Synthetic oil
A mixture of hydrocarbons derived by upgrading heavy crude oils, including bitumen, through a process that reduces the carbon content and increases the hydrogen content.
Three-dimensional seismic survey
Three dimensional seismic imaging which uses a grid of numerous cables rather than a few lines stretched in one line.
Turnaround
Maintenance at a plant or facility which requires the plant or facility to be completely or partially shut down for the duration.
Two-dimensional seismic survey
A vertical section of seismic data consisting of numerous adjacent traces acquired sequentially.
Waterflood
One method of secondary recovery in which water is injected into an oil reservoir for the purpose of forcing oil out of the reservoir and into the bore of a producing well.
Wellhead
The structure, sometimes called the “Christmas tree,” that is positioned on the surface over a well and used to control the flow of oil or gas as it emerges from the subsurface casing head.
Working interest
An interest in the net revenues of an oil and gas property, which is proportionate to the share of exploration and development costs borne until such costs have been recovered, and which entitles the holder to participate in a share of net revenue thereafter.
EXCHANGE RATE INFORMATION
The following table discloses various indicators of the Canadian dollar/U.S. dollar rate of exchange or the cost of a U.S. dollar in Canadian currency for the three years indicated.(1)(2)
| | | | | | | | | | | | |
| | | Year ended December 31, | |
(Cdn $ per U.S. $) | | 2014 | | | 2013 | | | 2012 | |
Year-end | | | 1.160 | | | | 1.064 | | | | 0.995 | |
Low | | | 1.059 | | | | 0.982 | | | | 0.964 | |
High | | | 1.167 | | | | 1.074 | | | | 1.044 | |
Average | | | 1.104 | | | | 1.030 | | | | 0.999 | |
| (1) | The year-end exchange rates were as quoted by the Bank of Canada for the noon buying rate. |
| (2) | The high, low and average rates were either quoted or calculated as at the last day of the relevant period. |
CORPORATE STRUCTURE
Husky Energy Inc.
Husky Energy Inc. was incorporated under theBusiness Corporations Act(Alberta) on June 21, 2000. The Company’s Articles were amended effective February 28, 2011 to permit the issuance of common shares as payment of stock dividends on the common shares and to authorize preferred shares to be issued in one or more series. The Company’s Articles were amended effective March 11, 2011 to create Cumulative Redeemable Preferred Shares, Series 1 (the “Series 1 Preferred Shares”) and Cumulative Redeemable Preferred Shares, Series 2 (the “Series 2 Preferred Shares”); and were amended effective December 4, 2014, to create Cumulative Redeemable Preferred Shares, Series 3 (the “Series 3 Preferred Shares”) and Cumulative Redeemable Preferred Shares, Series 4 (the “Series 4 Preferred Shares”).
Husky has its registered office and its head and principal office at 707, 8th Avenue S.W., P.O. Box 6525, Station D, Calgary, Alberta, T2P 3G7.
Intercorporate Relationships
The following table lists Husky’s significant subsidiaries and jointly controlled entities and their place of incorporation, continuance or organization, as the case may be, as at December 31, 2014.(1) All of the following companies and partnerships, except as otherwise indicated, are 100% beneficially owned or controlled or directed, directly or indirectly by Husky.
| | |
Name | | Jurisdiction |
| Subsidiary of Husky Energy Inc. | | |
| Husky Oil Operations Limited | | Alberta |
| |
| Subsidiaries and jointly controlled entities of Husky Oil Operations Limited | | |
| Husky Oil Limited Partnership | | Alberta |
| Husky Terra Nova Partnership | | Alberta |
| Husky Downstream General Partnership | | Alberta |
| Husky Energy Marketing Partnership | | Alberta |
| Husky Energy International Corporation | | Alberta |
| Sunrise Oil Sands Partnership (50%) | | Alberta |
| BP-Husky Refining LLC (50%) | | Delaware |
| Lima Refining Company | | Delaware |
| Husky Marketing and Supply Company | | Delaware |
| (1) | Principal operating subsidiaries exclusive of intercorporate relationships due to financing related receivables and investments. |
GENERAL DEVELOPMENT OF HUSKY
Three-year History of Husky
2012
On March 22, 2012, the Company issued U.S. $500 million of 3.95% senior unsecured notes due April 15, 2022 pursuant to the universal short form base shelf prospectus filed with the ASC and the SEC on June 13, 2011 and an accompanying prospectus supplement. The notes are redeemable at the option of the Company at a make-whole premium and interest is payable semi-annually. The notes are unsecured and unsubordinated and rank equally with all of the Company’s other unsecured and unsubordinated indebtedness.
On June 15, 2012, Husky repaid the maturing U.S. $400 million of 6.25% notes for U.S. $413 million, including U.S. $13 million of interest. The amount paid to note holders was equivalent to $410 million in Canadian dollars.
On December 14, 2012, Husky amended and restated both of its revolving syndicated credit facilities to allow the Company to borrow up to $1.5 billion and $1.6 billion in either Canadian or U.S. currency from a group of banks on an unsecured basis. The maturity date for the $1.5 billion facility was extended to December 14, 2016 and there was no change to the August 31, 2014 maturity date of the $1.6 billion facility.
On December 31, 2012, Husky filed a universal short form base shelf prospectus (the “Canadian Shelf Prospectus”) with applicable securities regulators in each of the provinces of Canada, other than Quebec, that enabled the Company to offer up to $3.0 billion of common shares, preferred shares, debt securities, subscription receipts, warrants and units in Canada up to and including January 30, 2015. This Canadian Shelf Prospectus replaced the universal short form base shelf prospectus filed in Canada during November 2010 which expired in December 2012.
During 2012, the Company continued to advance exploration and development projects on its oil resource land base. Heavy oil production commenced in the second quarter of 2012 ahead of schedule at both the Pikes Peak South and Paradise Hill heavy oil thermal projects and production ramped up to a combined average of 17,000 bbls/day exceeding the combined 11,500 bbls/day design rates. The Company advanced construction on the 3,500 bbls/day Sandall thermal development project and commenced initial drilling. Design and initial site work continued at the 10,000 bbls/day Rush Lake commercial project. Initial planning continued for three additional commercial thermal projects.
The Overall Development Plan for the Liwan Gas Project on Block 29/26 in the South China Sea was approved by the Government of China. The development project was more than 80% complete at the end of 2012. Approximately 90 kilometers of the two 79-kilometer deep water pipelines connecting the gas field to the central platform had been laid and approximately 190 kilometers out of 261 kilometers of shallow water pipeline had been laid from the central platform to the onshore gas plant. The completed jacket for the shallow water central platform was placed onto the ocean floor on August 30, 2012.
FEED for the development of the Liuhua 29-1 gas field was completed. Planning continued for the development of the single well Liuhua 34-2 field in 2012.
In December 2012, Husky signed a joint venture agreement with CPC Corporation, Taiwan, for an exploration block in the South China Sea. The exploration block is located 100 kilometers southwest of the island of Taiwan and covers approximately 10,000 square kilometers. Husky holds a 75% working interest during exploration, while CPC Corporation has the right to participate in the development program up to a 50% interest.
The 2012 exploration drilling program on the Madura Strait Block concluded in October 2012, with four new discoveries being made as a result of a five well exploration drilling program.
Husky and BP continued to advance the development of the Sunrise Energy Project in multiple stages. During 2012, drilling of the planned steam assisted gravity drainage horizontal well pairs for Phase I was completed and site construction and equipment installations were advanced. Development work continued on the next phase of the project, where regulatory approvals are in place for a total 200,000 bbls/day (100,000 bbls/day net).
Development continued at the White Rose field with the addition of an infill production well which was brought online in August 2012. At the end of 2012, a total of 22 wells, including nine producing wells, 10 water injectors, and three gas injectors were on production. A development plan amendment was filed with the regulator in October 2012 to facilitate development of resources at the South White Rose Extension satellite. At North Amethyst, development continued in 2012 with the addition of the fourth production well. At the end of 2012, four production and three water injection wells were online. An application to develop the deeper Hibernia formation at North Amethyst progressed through the regulatory review process. A water injection well to support the existing producing well for the West White Rose pilot project was completed and brought online during 2012. Evaluation of a wellhead platform to facilitate future development continued during 2012 and supporting regulatory filings were submitted for an environmental assessment of the concept.
Husky and Seadrill entered into a five-year contract for the use of Seadrill’s West Mira rig, a new harsh environment semi-submersible rig currently being built and expected to be completed in late 2015.
Exploration activity in the Atlantic Region included drilling of the Searcher prospect in the southern Jeanne D’Arc Basin. The well did not encounter commercial hydrocarbons and was expensed in 2012.
2013
During February 2013, the limit on the $1.5 billion revolving syndicated credit facility, allowing the Company to borrow in either Canadian or U.S. currency on an unsecured basis, was increased to $1.6 billion. There was no change to the maturity date of the facility. There continues to be no difference between the terms of the Company’s revolving syndicated credit facilities other than their maturity dates.
At the Liwan Gas Project, drilling and completion work continued in 2013, with all nine wells on the Liwan 3-1 gas field completed and made ready for production. During May 2013, the platform topsides were completed and transported approximately 2,500 kilometers from Qingdao, China, to the South China Sea and installed onto the jacket. In addition, the 261 kilometers of shallow water pipeline from the central platform to the gas plant and construction of the onshore gas plant was completed. Five major construction vessels and their support vessels were in operation during 2013, while construction continued on the deep water facilities. Despite encountering unusually difficult weather conditions during an extended typhoon season in late 2013, all piping to connect the individual wells to the manifolds and the manifolds to the connecting infield production flow lines was installed.
On June 5, 2013, Husky received regulatory approval for a development plan amendment for the South White Rose field, the third satellite extension at the White Rose field in the Atlantic Region. The amendment provided for gas injection, which will enhance oil production and provide additional storage for recovered gas. Installation of gas injection equipment to support the South White Rose Extension was completed at the end of 2013.
On October 31, 2013 and November 1, 2013, Husky filed a universal short form base shelf prospectus (the “U.S. Shelf Prospectus”) with the ASC and the SEC, respectively, that enables the Company to offer up to U.S. $3.0 billion of debt securities, common shares, preferred shares, subscription receipts, warrants and units of the Company in the United States up to and including November 30, 2015. The U.S. Shelf Prospectus replaced the shelf prospectus which was filed in June 2011 and expired in July 2013.
Husky and its partner made two significant discoveries in the year of a high-quality, light, sweet crude oil resource in the Flemish Pass Basin. The first discovery was made at the Harpoon O-85 well followed by a second discovery made at the Bay Du Nord prospect, both located approximately 500 kilometers offshore Newfoundland. The evaluation of well results at the Harpoon discovery is ongoing, with further appraisal drilling required to assess the potential of the prospect. The two discoveries made in the year bring the total number of significant discoveries in the region to three. The 2009 Mizzen discovery of slightly heavier oil has best estimate contingent resources estimated by Husky of 130 million barrels on a 100% working interest basis (46.1 million barrels net to Husky) as at December 31, 2014. Husky holds a 35% working interest in all three wells.
For the West White Rose Extension Project, Husky and its joint venture partners concluded a benefits agreement with the Government of Newfoundland and Labrador for the project and a development application to the Canada-Newfoundland and Labrador Offshore Petroleum Board was submitted. Construction of a graving dock commenced in Argentia, Newfoundland and detailed engineering and design in advance of a final investment decision is ongoing.
The North Amethyst G-25-9 multilateral well was completed and brought online in late November 2013, with average gross production of 20,000 bbls/day (14,000 bbls/day net to Husky). In addition, drilling commenced on the North Amethyst Hibernia well in the fourth quarter of 2013, targeting a secondary deeper zone below the main North Amethyst field.
At the 60,000 bbls/day (30,000 bbls/day net to Husky) Sunrise Energy Project, the CPF was more than 75% complete at December 31, 2013 with major equipment installed and field tanks and buildings for Plant 1A in place. Commissioning of the first six well pads commenced in 2013.
At December 31, 2013, construction was substantially complete at the 3,500 bbls/day Sandall heavy oil thermal development project, and steaming was underway.
In 2013, construction work continued at the 10,000 bbls/day Rush Lake commercial project with first production expected in the second half of 2015.
In 2013, the liquids-rich natural gas formations at Ansell in west central Alberta continued to be a key area of focus with 25 wells (gross) drilled and 30 wells (gross) completed. At December 31, 2013, the Company had drilled and completed over 300 (gross) wells at the play, which had an average production of 13,800 boe/day in 2013.
2014
Production commenced in early 2014 ahead of schedule at the Sandall heavy oil development with rates exceeding the 3,500 bbls/day design rate capacity throughout the year. Production at the end of 2014 was approximately 5,700 bbls/day.
On January 9, 2014, the Company sanctioned two new heavy oil thermal projects, Edam East and Vawn, in Saskatchewan, each of which is expected to deliver 10,000 bbls/day of production. Site clearing, detailed engineering and module fabrication work was completed during 2014 with first oil expected in the second half of 2016.
FEED on the feedstock flexibility project at the Company’s Lima Refinery was completed in 2014. The project is expected to give the refinery flexibility to take up to 40,000 bbls/day of Western Canadian heavy oil while overall nameplate capacity would remain unchanged at 160,000 bbls/day. The initial planned completion date has been deferred with the project now expected to be completed in the 2018-2019 time frame.
On March 17, 2014, the Company issued U.S. $750 million of 4.00% notes due April 15, 2024 pursuant to the U.S. Shelf Prospectus. The notes are redeemable at the option of the Company at any time, subject to a make whole premium unless the notes are redeemed in the three month period prior to maturity. Interest is payable semi-annually. The notes are unsecured and unsubordinated and rank equally with all of the Company’s other unsecured and unsubordinated indebtedness.
At the Liwan Gas Project, first gas from the deep water wells on the Liwan 3-1 gas field was achieved on March 30, 2014 with gas sales to the Guangdong market natural gas grid commencing on April 24, 2014. In addition, the tie-in of the Liuhua 34-2 field single production well into the Liwan 3-1 field deep water infrastructure was completed and commissioned with first gas production taking place in December of 2014. Total gas and NGL production averaged approximately 114.2 mmcf/day and 4.2 mbbls/day respectively in 2014.
On May 6, 2014, the Company sanctioned a 3,500 bbls/day thermal project at Edam West with first production expected in the second half of 2016.
On June 15, 2014, the Company repaid the maturing 5.90% notes issued under a trust indenture dated September 11, 2007. The amount paid to noteholders was U.S. $772 million, including U.S. $22 million of interest, equivalent to $839 million in Canadian dollars, including interest of $25 million.
On June 19, 2014, the $1.6 billion revolving syndicated credit facility was increased to $1.63. The maturity, previously set to expire on August 31, 2014, was extended to June 19, 2018. The Company also increased the limit on one of its operating facilities from $50 million to $100 million.
On September 15, 2014, the Company launched a commercial paper program in Canada. The program is supported by the Company’s syndicated credit facilities and the Company is authorized to issue commercial paper up to a maximum of $1.0 billion having a term not to exceed 365 days. The weighted average interest rate for commercial paper outstanding as at December 31, 2014 was 1.24 percent.
On December 9, 2014, the Company issued 10 million Cumulative Redeemable Preferred Shares, Series 3 (the “Series 3 Preferred Shares”) at a price of $25.00 per share for aggregate gross proceeds of $250 million under the Canadian Shelf Prospectus. Holders of the Series 3 Shares are entitled to receive a cumulative quarterly fixed dividend yielding 4.50 percent annually for the initial period ending December 31, 2019 as declared by Husky. Thereafter, the dividend rate will be reset every five years at the rate equal to the five-year Government of Canada bond yield plus 3.13 percent. Holders of Series 3 Preferred Shares will have the right, at their option, to convert their shares into Cumulative Redeemable Preferred Shares, Series 4 (the “Series 4 Preferred Shares”), subject to certain conditions, on December 31, 2019 and on every five years thereafter. Holders of the Series 4 Preferred Shares will be entitled to receive cumulative quarterly floating dividends at a rate equal to the 90-day Government of Canada Treasury Bill rate plus 3.13 percent.
On December 10, 2014, the Company announced the results of an independent assessment of its heavy oil resources in the Lloydminster region. The assessment has increased the Company’s overall working interest of total heavy oil initially in place which is now estimated at 17 billion barrels, of which 16 billion barrels are discovered heavy oil initially in place. The assessment conducted by Sproule Unconventional Limited has also estimated the Company’s working interest of best estimate contingent resources to be 1.9 billion barrels as of December 31, 2013, of which 54 percent, or 1 billion barrels, has the potential to be recovered using thermal technology.
At the Sunrise Energy Project, steaming commenced in December 2014. Phase 1 of the project is being developed with two processing plants. The first 30,000 bbls/day plant is expected to begin production towards the end of the first quarter of 2015. The second 30,000 bbls/day plant is expected to begin steaming in mid-2015, with production commencing in late 2015. Production is expected to ramp up to full capacity over a two-year period. Husky is the operator of the Sunrise Energy Project and has a 50 percent working interest in the project with BP Canada Energy Company, which operates the jointly-owned BP-Husky Toledo refinery.
In the Atlantic Region, development drilling commenced at the South White Rose Extension project with production from the project expected to commence in mid-year 2015. The project is expected to produce peak production volumes of approximately 15,000 bbls/day (net). The Company also commenced drilling in 2014 at the North Amethyst Hibernia formation which will target a secondary deeper zone below the main North Amethyst producing field. Production from the Hibernia formation is expected to start up in the second half of 2015 with peak production volumes expected to reach 5,000 bbls/day (net). In addition, the Company and its partner commenced an 18-month appraisal and exploration drilling program in the Flemish Pass offshore Newfoundland and Labrador, including the area of the Bay Du Nord discovery. Husky holds a 35 percent working interest in the Bay Du Nord discovery. Hearings for the public review of the application for a wellhead platform to facilitate full field development at West White Rose were held during 2014. Construction continued on the dry-dock in Argentia, Newfoundland and early site preparation was advanced, including construction of a graving dock. Husky has deferred a final investment decision on the project.
The liquids-rich gas formations at Ansell in west central Alberta continue to be a key area of focus, with 31 wells (gross) drilled and 23 wells (gross) completed in 2014. To date, the Company has drilled and completed over 350 (gross) wells at the play with average production of 17,500 boe/day in 2014, an increase of 27 percent when compared to 2013.
Husky completed a two-well pad in 2014 at the Duvernay liquids-rich natural gas resource play at Kaybob, Alberta. Results from the four-well pad drilled and completed in 2013 and the two-well pad completed in 2014 continue to be in-line with expectations.
Construction work continued at the 10,000 bbls/day Rush Lake heavy oil thermal development with first production expected in the third quarter of 2015. Site clearing, detailed engineering and module fabrication commenced at the two 10,000 bbls/day Edam East and Vawn developments in 2014 with first production expected in the second half of 2016.
Progress continued on the shallow water gas developments in the Madura Strait Block during 2014. Work related to the BD field engineering, procurement, installation and construction contract is ongoing and approximately 29 percent complete. The contract for the construction and lease of a FPSO vessel received final approval in the second quarter of 2014 and was signed in December 2014.
Tender plans for the MDA and MBH development projects were approved by SKK Migas, the Indonesia oil and gas regulator, and the tendering process is in progress. The Gas Sales Agreement for the first tranche of gas from this development is complete and awaiting final approval from the regulator. The development plan for the MDK field to tie into the MDA/MBH combined development was approved by SKK Migas in July 2014.
During 2014, Husky signed a PSC for the Anugerah contract area. The contract area covers approximately 8,215 square kilometres and is primarily offshore East Java, Indonesia, with water depths of up to 1,400 metres. The main prospective locations are in water depths of 800 to 1,300 metres. The contract area is located approximately 150 kilometres east of the Madura Strait Block. Under the PSC, Husky has an obligation to carry out seismic surveys to assess the petroleum potential of the exploration block within the first three years. Exploration work, including planning for a 3-D seismic survey covering the contract area, is in progress.
DESCRIPTION OF HUSKY’S BUSINESS
General
Husky is a publicly traded international integrated energy company headquartered in Calgary, Alberta, Canada.
Management has identified segments for the Company’s business based on differences in products, services and management responsibility. The Company’s business is conducted predominantly through two major business segments—Upstream and Downstream.
Upstream includes exploration for, and development and production of, crude oil, bitumen, natural gas and NGL (Exploration and Production) and marketing of the Company’s and other producers’ crude oil, natural gas, NGL, sulphur and petroleum coke, pipeline transportation, the blending of crude oil and natural gas, and storage of crude oil, diluent and natural gas (Infrastructure and Marketing). The Company’s Upstream operations are located primarily in Western Canada, offshore East Coast of Canada, offshore China and offshore Indonesia.
Downstream includes upgrading of heavy crude oil feedstock into synthetic crude oil (Upgrading), refining in Canada of crude oil and marketing of refined petroleum products including gasoline, diesel, ethanol blended fuels, asphalt and ancillary products, and production of ethanol (Canadian Refined Products) and refining in the U.S. of primarily crude oil to produce and market gasoline, jet fuel and diesel fuels that meet U.S. clean fuels standards (U.S. Refining and Marketing).
Social and Environmental Policy
Husky has a Health, Safety and Environment Policy that affirms its commitment to operational integrity. Operational integrity at Husky means conducting all activities safely and reliably so that the public is protected, impact to the environment is minimized, the health and wellbeing of employees are safeguarded, contractors and customers are safe, and physical assets (such as facilities and equipment) are protected from damage or loss.
The Health, Safety and Environment Committee of the Board of Directors is responsible for oversight of health, safety and environment policy, audit results and for monitoring compliance with the Company’s environmental policies, key performance indicators and regulatory requirements. The mandate of the Health, Safety and Environment Committee is available on the Husky website atwww.huskyenergy.com.
Husky Operational Integrity Management System
Husky approaches social responsibility and sustainable development by seeking a balance among economic, environmental and social factors while maintaining growth. Husky strives to find solutions to issues that do not compromise the needs of future generations. In 2008, Husky implemented HOIMS, which is followed by all Husky businesses. HOIMS is a systematic approach to anticipating, identifying and mitigating hazardous situations within the Company’s operations. The implementation of HOIMS has produced tangible business results, including improved performance, fewer incidents and enhanced business value. It incorporates best practices from across the industry, consistent with Husky’s commitment to excellence in operational integrity. HOIMS includes 14 fundamental elements; each element contains well defined objectives and expectations that guide Husky to continuously improve operational integrity. Resources are dedicated to the continued implementation and execution of HOIMS, and audits are conducted to help ensure that HOIMS is effectively integrated into daily operations.
The fundamental elements of HOIMS are:
| | 1. | Ensure all levels of management demonstrate leadership and commitment to operational integrity. Define and ensure appropriate accountability for HOIMS throughout the organization. |
| | 2. | Prevent incidents by identifying and minimizing workplace and personal health risks. Promote and reinforce all safe behaviours. |
| | 3. | Manage risks by performing comprehensive risk assessments to provide essential decision-making information. Develop and implement plans to manage significant risks and impacts to as low as reasonably practical levels. |
| | 4. | Be prepared for an emergency or security threat. Identify all necessary actions to be taken to protect people, the environment, the organization’s assets and reputation in the event of an emergency or security threat. |
| | 5. | Maintain operations reliability and integrity by use of clearly defined and documented operational, maintenance, inspection and corrosion programs. Seek improvements in process and equipment dependability by systematically eliminating defects and sources of loss. |
| | 6. | Provide assurance that personnel possess the necessary competencies, knowledge, abilities and behaviours to perform and demonstrate designated tasks and responsibilities effectively, efficiently and safely. |
| | 7. | Report and investigate all incidents. Learn from incidents and use the information to take corrective action and prevent recurrence. |
| | 8. | Operate responsibly to minimize the environmental impact of operations. Leave a positive legacy behind when operations cease. |
| | 9. | Ensure that risks and exposures from proposed changes are identified, evaluated and managed to remain at an acceptable level. |
| | 10. | Identify, maintain and safeguard important information. Ensure personnel can readily access and retrieve information. Promote and encourage constructive dialogue within the organization to share industry recommended practices and acquired knowledge. |
| | 11. | Ensure conformance with corporate policies and compliance with all relevant government regulations. Work constructively to influence proposed laws and regulations, and debate on emerging issues. |
| | 12. | Design, construct, commission, operate and decommission all assets in a healthy, safe, secure, environmentally sound, reliable and efficient manner. |
| | 13. | Ensure contractors and suppliers perform in a manner that is consistent and compatible with Husky’s policies and business performance standards. Ensure contracted services and procured materials meet the requirements and expectations of Husky’s standards. |
| | 14. | Confirm that HOIMS processes are implemented and assess whether they are working effectively. Measure progress and continually improve towards meeting HOIMS objectives, targets, and key performance indicators. |
Environmental Protection
Husky’s operations are subject to various environmental requirements under federal, provincial, state and local laws and regulations, as well as international conventions. These laws and regulations cover matters such as air emissions, wastewater discharge, non-saline water use, land disturbances and handling and disposal of waste materials. These regulatory requirements have grown in number and complexity over time, covering a broader scope of industry operations and products. In addition to existing requirements, Husky recognizes that there are emerging regulatory frameworks that may have a financial impact on the Company’s operations, including pending legislation on criteria regarding air contaminants and GHG emissions.
Husky is required by the Government of Canada to report GHG emissions for facilities that emit more than 50,000 tonnes of CO2e per year. Husky has implemented an Environmental Performance Reporting System that gathers, consolidates, and calculates information, generates reports and identifies trends regarding GHG and other air emissions, water use, as well as other environmental factors such as ARO.
Husky recognizes that the intensity of its GHG emissions is increasing driven by growth in the Company’s thermal oil business. As part of its efforts to manage GHG emissions performance, the Company is investing in technology to capture and utilize CO2 from its operations for EOR. The Company currently captures CO2 from its Lloydminster Ethanol Plant and is testing multiple commercial technologies for exhaust gas CO2 capture from steam generators at a thermal oil production facility. The captured CO2 is then injected into reservoirs in the Lloydminster area of Saskatchewan for EOR purposes. Husky is also focused on steam to oil ratio optimization, which impacts the GHG emissions intensity of thermal operations and has invested in vacuum insulated tubing as an example to reduce steam consumption. The Company has dedicated resources to identifying new ways of managing GHG emissions performance through technology and process improvements.
Directly and through joint venture partnerships, Husky is a member of several industry associations that collaborate to identify and implement best practices on environmental performance. IPIECA, the global oil and gas industry association for environmental and social issues, produces guidelines that Husky uses to improve its environmental practices, enhance its strategic planning, engage with regulators and enhance operations. Husky is also a member of the Integrated CO2 Action Network, which is working to improve deployment of carbon capture and storage technologies in Canada. As a member of Petroleum Technology Alliance Canada, Husky participates in technology research for energy efficiency and emissions reduction. In addition, as an active member of the In-situ Water Technology Development Centre, Husky is developing new technologies to reduce energy and water use. Husky dedicates teams to water management issues, with expertise in hydrogeology, surface water aquatics, hydrology, water treatment and drilling waste management. Husky continues to seek ways to conserve and recycle water, including looking at alternative water sources, recycling produced water and the use of ASP to increase water efficiency. At the Tucker Thermal Facility, produced water is recycled and make up water is sourced from very saline, non-potable groundwater. The Sunrise Energy Project will also recycle produced water, and will use process-affected water from a nearby oil sands operation, after it has been treated, to generate steam for oil recovery.
Ongoing remediation and reclamation work is occurring at approximately 5,300 well sites and facilities. In 2014, Husky spent approximately $167.4 million on ARO, and the Company expects to spend approximately $97.3 million in 2015 on environmental site closure activities, including abandonment, decommissioning, reclamation and remediation.
The Company completed a review of its ARO provisions, including estimated costs and projected timing of performing the abandonment and retirement operations. The results of this review have been incorporated into the estimated liability as disclosed in Note 16 of the Company’s 2014 audited consolidated financial statements.
At December 31, 2014, Husky had 490 retail locations in its light refined products operations, which consisted of 333 Husky controlled, owned or leased locations and 157 independent retailer locations. Husky is continually monitoring the owned and leased locations for environmental compliance and, where required, performing remediation including routine underground tank replacements. Husky has several “legacy” (inactive facility) sites which require remediation. These legacy sites range from refinery sites to retail locations.
It is not possible to predict with certainty the amount of additional investment in new or existing facilities required to be incurred in the future for environmental protection or to address regulatory compliance requirements, such as reporting. Although these costs may be significant, Husky does not expect that they will have a material adverse effect on liquidity and financial position over the long-term.
Upstream Operations
Description of Major Properties and Facilities
Husky’s portfolio of Upstream assets includes properties with reserves of light crude oil, medium crude oil, heavy crude oil, bitumen, NGL, natural gas and sulphur.
China
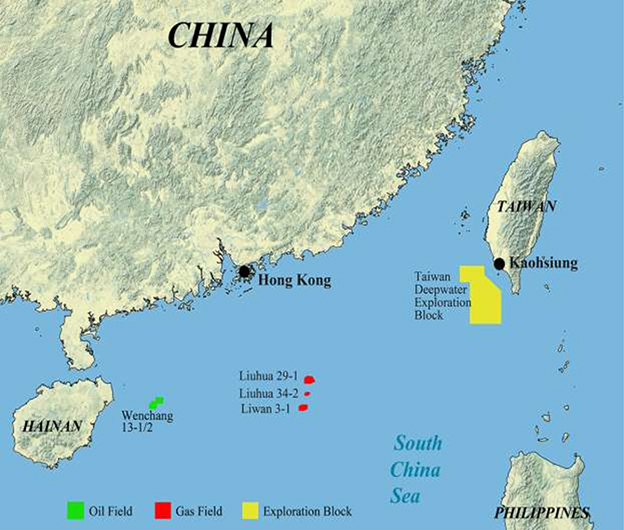
Liwan Gas Project
The Liwan Gas Project includes the natural gas discoveries at the Liwan 3-1, Liuhua 34-2 and Liuhua 29-1 fields within the Contract Area 29/26 exploration block located in the Pearl River Mouth Basin of the South China Sea, approximately 300 kilometers southeast of the Hong Kong Special Administrative Region.
In late 2010, Husky Oil China Ltd. signed a Heads of Agreement with CNOOC, which specified CNOOC’s election to participate in the development of the Block 29/26 discoveries to its maximum 51% working interest and key principles to fund, develop and operate the Liwan 3-1 deep water gas field. It was agreed that the project would be separated into deep water and shallow water development projects, with Husky acting as deep water operator and CNOOC acting as shallow water operator. The development plan includes tie-in of the Liuhua 34-2 and Liuhua 29-1 fields into the shallow water infrastructure and the three fields will share a subsea production system, subsea pipeline transportation and onshore gas processing infrastructure.
In 2013, Husky completed the deep water development of the Liwan 3-1 field. During the same period, CNOOC completed the shallow water central platform standing in approximately 120 meters of water. The CNOOC-operated shallow water development also includes a 261 kilometer 30 inch diameter pipeline running from the central platform to the onshore Gaolan Gas Plant. The gas plant includes liquids separation facilities, ten spherical NGL storage tanks, an export jetty, control facilities, as well as administrative and accommodation buildings.
The Liwan 3-1 field commenced production at the end of March 2014. The gas field is currently producing from 9 wells to the central platform and on through to the onshore Gaolan Gas Plant. The single production well, Liuhua 34-2 field was tied into the deep water facilities of the Liwan 3-1 field and commenced production in December 2014. Gas sales from Liwan were in the range of 180 to 250 mmcf/day (gross) in 2014. Husky’s share of natural gas production was 114.2 mmcf/day representing its 49% working interest share plus production allocated to Husky to recover past exploration costs. Husky’s share of production from the two fields including NGL was 23.3 mboe/day. Negotiations for the sale of the gas from the Liuhua 29-1 field are ongoing.
Wenchang
The Wenchang field is located in the western Pearl River Mouth Basin, approximately 400 kilometers south of the Hong Kong Special Administrative Region and 100 kilometers east of Hainan Island. Husky holds a 40% working interest in two oil fields, which commenced production in July 2002. The Wenchang 13-1 and 13-2 oil fields are currently producing from 32 wells in 100 meters of water into an FPSO stationed between fixed platforms located in each of the two fields. Husky’s share of production averaged 4.8 mbbls/day during 2014. The PSC is due to expire in 2017.
Taiwan
In December 2012, Husky signed a joint venture agreement with CPC Corporation, Taiwan, for an exploration block in the South China Sea. The exploration block is located 100 kilometers southwest of the island of Taiwan and covers approximately 10,000 square kilometers. Husky holds a 75% working interest during exploration, while CPC Corporation has the right to participate in the development program up to a 50% interest.
In 2013 and 2014, Husky completed the minimum 2-D seismic survey obligation required in the joint venture agreement and is currently processing the survey data to identify geological structures for 3-D seismic surveying to be considered in 2016. Husky has options to carry out three-dimensional seismic surveys and to drill at least one exploration well in subsequent exploration periods.
Indonesia
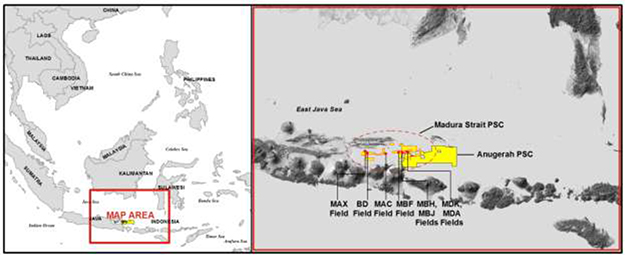
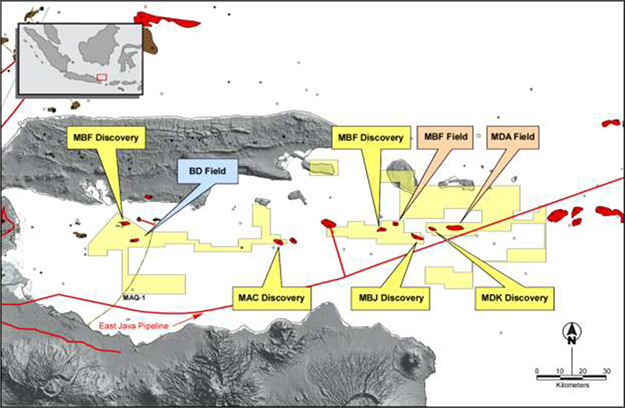
Madura Strait
Husky has a 40% interest in approximately 621,700 acres (2,516 square kilometers) of the Madura Strait Block, located offshore East Java, south of Madura Island, Indonesia. Husky’s two partners are CNOOC, which is the operator and has a 40% working interest, and Samudra Energy Ltd., which holds the remaining 20% interest through its affiliate, SMS Development Ltd.
The BD gas field was granted commercial status and the Plan of Development was approved by the Indonesian state oil company in 1995. The field was to supply natural gas to a proposed independent power plant; however, construction of the power plant did not proceed due to economic issues that occurred in Indonesia at that time and as a result, the BD development was deferred. Market conditions became more favourable for the BD development to supply gas to meet the demand of the East Java region and an updated development plan was approved in 2008 by the Government of Indonesia.
In October 2010, the Government of Indonesia approved an extension of the PSC that was originally awarded in 1982. The approval provided a 20-year extension to the contract, which now runs until 2032. The BD field FEED was completed in the second quarter of 2010.
In 2011, CNOOC drilled an appraisal well that confirmed commercial quantities of hydrocarbons in the MDA field. An exploration well was also drilled in 2011 on the MBH field and a new gas field was discovered. The gas sales contracts for the BD field previously signed in 2010 with three gas buyers were amended in 2011. In November 2012, the functions of BP Migas, the then Indonesian oil and gas regulator, were temporarily transferred to the Energy and Mineral Resources Ministry and subsequently, a new body, SKK Migas, was established as the new industry regulator. As discussed and agreed with the new regulator, a re-tender for the BD field FPSO commenced.
In 2012, the exploration drilling program resulted in discoveries on the MAC, MAX, MDK and MBJ fields. The fields are being evaluated for commercial development potential.
In January 2013, the plan of development for a combined MDA and MBH development project was approved by SKK Migas. In July 2013, the BD field engineering, procurement, installation and commissioning contract was awarded and engineering/construction work under the contract commenced. The Government of Indonesia appointed a lead distributor for the major portion of the gas from the MDA and MBH fields and a Heads of Agreement has been signed. The Gas Sales Agreement for the first tranche of gas from this development is complete and awaiting final approval from the regulator. Exploration drilling on the block in 2013 resulted in an additional discovery at the MBF field.
In 2014, the tender plans for the combined development project for the MDA and MBH fields were approved by SKK Migas. The development plan for the MDK field to tie into the MDA/MBH combined development was approved by SKK Migas in July 2014. A contract for the lease of an FPSO for the BD field was signed in December.
First gas from the Madura Strait Block is anticipated in mid-2017.
North Sumbawa II
Husky executed a PSC in November 2008 with the Government of Indonesia for the North Sumbawa II contract area. Husky holds a 100% interest in the North Sumbawa II Block, which is located in the East Java Basin approximately 300 kilometers east of the Madura Strait block and covers an area of 937,300 acres (3,793 square kilometers). In August 2014, Husky gave notice to the Government of Indonesia of its intention to relinquish the PSC.
Anugerah
Husky executed a PSC in February 2014 with the Government of Indonesia for the Anugerah contract area. Husky holds a 100% interest in the Anugerah Block, which is located in the East Java Basin approximately 150 kilometers east of the Madura Strait Block and 220 km west of the North Sumbawa II Block. The block covers an area of 2,030,000 acres (8,215 square kilometers) with main prospective locations in water depths of 800 to 1,300 meters. The PSC requires the acquisition of 2-D and 3-D seismic data during the first three years of the contract. Planning is in progress for the seismic acquisition program to be carried out in 2015.
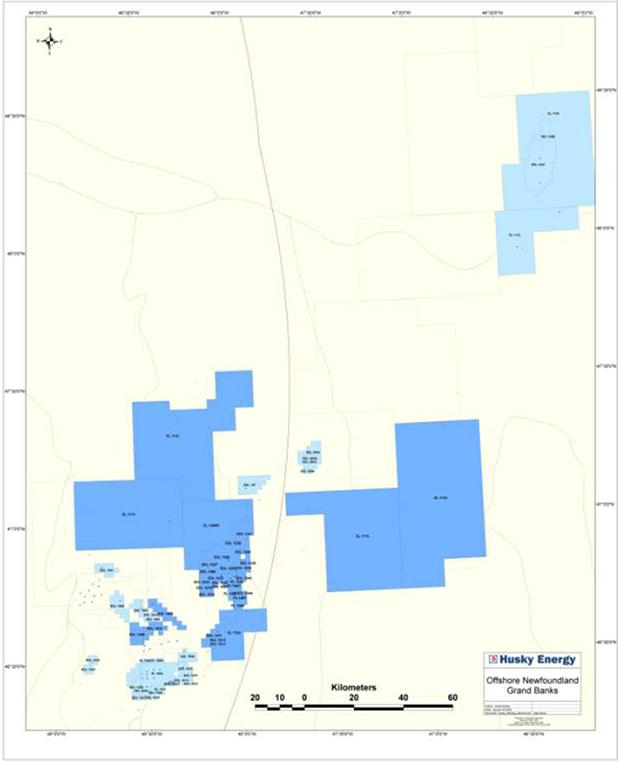
Atlantic Region
Husky’s offshore East Coast exploration and development program is focused in the Jeanne d’Arc Basin on the Grand Banks, which contains the Hibernia and Terra Nova fields, the White Rose field and satellite extensions, including North Amethyst, West White Rose and the South White Rose Extensions; and the Flemish Pass Basin, which contains the Mizzen, Bay du Nord and Harpoon discoveries. Husky is the operator of the White Rose field and satellite extensions, and holds an ownership interest in the Terra Nova field as well as in a number of smaller undeveloped fields. Husky also holds significant exploration acreage offshore Newfoundland and a portfolio of ELs offshore Greenland.
White Rose Oil Field
The White Rose oil field is located 354 kilometers off the coast of Newfoundland and Labrador and approximately 48 kilometers east of the Hibernia oil field on the eastern section of the Jeanne d’Arc Basin. Husky is the operator of the White Rose field and satellite tiebacks, including the North Amethyst, West White Rose and South White Rose Extensions. The Company has a 72.5% working interest in the core field and a 68.875% working interest in the satellite fields.
First oil was achieved at White Rose in November 2005. The White Rose field was the third oil field developed offshore Newfoundland and currently has nine production wells, 10 water injectors, and three gas injectors. During 2014, Husky’s production from the White Rose field was 6.5 mmbbls (17.7 mbbls/day).
On May 31, 2010, first oil was achieved from North Amethyst, the first satellite field extension for the White Rose field. The field is located approximately six kilometers southwest of the SeaRose FPSO. Production flows from North Amethyst to the SeaRose FPSO through a series of subsea flow lines. During 2014, Husky’s production from North Amethyst was 5.6 mmbbls (15.3 mbbls/day). As of December 31, 2014, the field had five production wells and four water injection wells, which completes the base plan for the field. A development plan amendment was approved by regulators in June 2013. In October 2013, Husky received regulatory approval to develop a second, deeper formation at North Amethyst utilizing existing infrastructure. A supporting water injector is already in place. The Company commenced drilling in 2014 at the North Amethyst Hibernia formation which will target a secondary deeper zone below the main North Amethyst producing field. Production from the Hibernia formation is expected to start up in the second half of 2015.
Initial production from West White Rose was achieved in September 2011 through a two-well pilot project. These wells have helped provide further information on the reservoir to refine development plans for the full West White Rose field. Husky’s share of production from this satellite field was 2.0 mmbbls (5.6 mbbls/day) during 2014.
Hearings for the public review of the application for a wellhead platform to facilitate full field development at West White Rose were held during 2014. Construction on the dry-dock in Argentia, Newfoundland and early site preparation was advanced, including construction of a graving dock. Husky has deferred a final investment decision on the White Rose Extension Project while it re-evaluates concept development plans.
Gas injection at the South White Rose Extension commenced in the first quarter of 2014, with oil production equipment installed in summer 2014. Drilling of the first oil production well is underway with production anticipated in mid-2015.
Terra Nova Oil Field
The Terra Nova oil field is located approximately 350 kilometers southeast of St. John’s, Newfoundland in 91 to 100 metres of water. The Terra Nova oil field is divided into three distinct areas, known as the Graben, the East Flank and the Far East. Production at Terra Nova commenced in January 2002. Husky’s working interest in the field increased to 13% effective December 1, 2010.
As at December 31, 2014, there were 14 development wells drilled in the Graben area, consisting of eight production wells, three water injection wells and three gas injection wells. In the East Flank area there were 14 development wells, consisting of eight production wells and six water injection wells. There is one extended reach producer and an extended reach water injection well in the Far East area. The Operator continues to progress delineation and development opportunities at Terra Nova.
Husky’s share of production in 2014 from the Terra Nova field was 2.2 mmbbls (6.0 mbbls/day). Production at Terra Nova was impacted by a 25-day turnaround associated with scheduled maintenance on the FPSO and coincided with the 2014 subsea program to replace a water injection tee and reinstate the second production flowline to the Northwest Drill Centre. Production from the field resumed on August 31, 2014.
East Coast Exploration
Husky believes that the Atlantic Region has exploration potential, and that the Company’s position there will provide growth opportunities for light crude oil and natural gas development in the medium to long-term. Husky presently holds working interests ranging from 5.8% to 73.125% in 23 significant discovery areas in the Jeanne d’Arc Basin, Flemish Pass Basin, offshore Newfoundland and Labrador and Baffin Island.
In November 2014, following the major discoveries made, Husky and its partner commenced an 18-month appraisal drilling program in the Northern Flemish Pass, beginning in the Bay du Nord area. Evaluation of well results at Bay du Nord have confirmed significant quantities of hydrocarbons with best estimate economic contingent resources estimated by Husky at 400 million barrels of crude oil on a 100% working interest basis (141.2 million net to Husky) as at December 31, 2014. The Bay du Nord prospect is south of the Mizzen discovery and west of the Harpoon discovery. Mizzen, discovered in 2009, holds best estimate economic contingent resources estimated by Husky at 130 million barrels of crude oil on a 100% working interest basis (46.1 million net to Husky) as at December 31, 2014. Evaluation of well results at Harpoon continues. Husky holds a 35% working interest in all three wells.
The Company plans to participate in additional exploration and delineation wells during 2015 in the southern Flemish Pass Basin and the Jeanne d’Arc Basin. Drilling of an exploration well on the Aster prospect in the Flemish Pass Basin commenced on December 19, 2014, and results are currently being evaluated.
Greenland
Husky is the operator of two ELs offshore the west coast of Disko Island, Greenland. Husky continues to evaluate its opportunities in the region.
Oil Sands
Sunrise Energy Project
On March 31, 2008, Husky and BP completed a transaction that created an integrated North American oil sands business. The business is comprised of a 50/50 partnership to develop the Sunrise Energy Project, operated by Husky, and a 50/50 limited liability company for the BP-Husky Toledo Refinery, operated by BP.
The Sunrise Energy Project is an in-situ SAGD oil sands project located in the Athabasca region of northern Alberta. The project will be developed in multiple phases with Phase 1 consisting of two 30,000 bbls/day steam plants (Plants 1A and 1B). The project was sanctioned in 2010 and Husky awarded major engineering and construction contracts for the central processing and field facilities and the partnership reached an agreement on the movement of diluted bitumen to market and transportation of diluent to the Sunrise oil sands site. Development drilling of all planned SAGD horizontal well pairs for Phase 1 was completed in 2012. Construction of the central processing facilities and field facilities was substantially completed in 2014 and steaming from Plant 1A commenced in December 2014. First oil is expected towards the end of the first quarter of 2015. Plant 1B is scheduled to be completed and commence steaming in mid-2015.
Undeveloped Oil Sands Assets
Husky holds in excess of 550,000 acres in undeveloped oil sands leases and has a 100% working interest in all leases except in Athabasca South, in which it has a 50% working interest. The undeveloped oil sands leases include the Saleski asset covering more than 241,000 acres located north of Wabasca, Alberta. Saleski contains a best estimate economic contingent resource of 10 billion barrels of bitumen.
Tucker Oil Sands Project
Tucker is an in-situ SAGD oil sands project located 30 kilometers northwest of Cold Lake, Alberta that commenced production at the end of 2006. Husky has expanded the project through the development of the overlying Lower Grand Rapids formation with an initial six well pairs. Production at Tucker in 2014 was 10.8 mbbls/day. Several applications to the AER have been approved or are proceeding for additional drilling and field development through 2015.
Heavy Oil
Lloydminster Heavy Oil and Gas
The majority of Husky’s heavy oil assets are located in the Lloydminster region of Alberta and Saskatchewan, with lands consisting of approximately two million acres. This extensive land position spans most of the productive oil fields in the area, all within 100 kilometers of the City of Lloydminster. The Company operates over 4,500 wells in the area, with a 100% working interest in the majority of these wells. Husky’s operations are supported by a network of Husky owned oil treating facilities and pipelines that transport heavy crude oil from the field locations to the Husky Lloydminster asphalt refinery, the Husky Lloydminster Upgrader and the third-party pipeline systems at Hardisty, Alberta, providing full integration with the Company’s Upstream Infrastructure and Marketing and Downstream businesses.
Production of heavy oil from the Lloydminster area uses a variety of techniques, including production methods, horizontal well technology, CSS and SAGD. Husky’s gross heavy and medium crude oil production from the area averaged 107.4 mbbls/day in 2014. Of the total crude oil produced, 61.8 mbbls/day was production of heavy crude oil, using CHOPS and horizontal technologies, 43.8 mbbls/day was from Husky’s thermal operations and 1.8 mbbls/day was from the medium gravity waterflooded fields in the Wainwright and Wildmere areas. Husky also produces natural gas from numerous small shallow pools in the Lloydminster region and recovers solution gas produced from heavy oil wells. During 2014, Husky’s gross natural gas production from the Lloydminster region averaged 17.7 mmcf/day.
Construction was completed at the 3,500 bbls/day Sandall thermal development project in the first quarter of 2014. Production commenced ahead of schedule and continues to be strong with oil rates averaging 5,600 bbls/day in the fourth quarter of 2014.
Design and construction is continuing at the 10,000 bbls/day Rush Lake commercial project with first production expected in the third quarter of 2015. Production performance from the two well pair pilot is in line with expectations.
Site clearing, detailed engineering and module fabrication continued at the two 10,000 bbls/day Edam East and Vawn thermal development projects and at the 3,500 bbls/day Edam West thermal development project with production from all three projects expected in second half of 2016.
The Company advanced its horizontal drilling program in 2014 with the completion of 94 wells. Based on the positive performance of previous horizontal drilling programs, Husky is continuing this program and is planning to drill approximately eight wells in 2015, and continuing to implement waterflooding in selected pools. The Company also drilled 153 gross CHOPS wells during 2014. In 2015, ten CHOPS wells are planned. Development activity in these areas has been reduced in 2015 in response to market conditions.
McMullen Thermal Development
Husky completed a successful winter delineation program at the McMullen thermal development property, in the first half of 2014, which consisted of drilling 40 stratigraphic wells, the acquisition of 25 square kilometers of 3-D seismic survey data and the completion of environmental field study work. Additional drilling commenced at McMullen in December 2014 which continued into the first quarter of 2015 to further progress the play.
Non-Thermal Enhanced Oil Recovery
Husky operated five solvent EOR pilot programs in 2014 and a CO2 capture and liquefaction plant at the Lloydminster Ethanol Plant. This liquefied CO2 is used in the ongoing EOR piloting program.
Western Canada (excluding Heavy Oil and Oil Sands)
Northwest
Western Canada northwest development operations are located primarily in north and central Alberta from the foothills in western Alberta to Slave Lake and Grande Prairie in northern Alberta. Husky operates 85 facilities in the area, including the Ram River Gas Plant in which the Company has an average 85% working interest. Production for 2014 from northwest operations averaged 59.0 mboe/day. Production consisted of approximately 240.0 mmcf/day of natural gas and 19.0 mbbls/day of crude oil and NGL.
The area is heavily weighted to natural gas production at approximately 67%. Husky is pursuing liquids-rich natural gas and crude oil development opportunities within the existing asset portfolio including oil developments at McMullen and Wapiti along with emerging liquids-rich gas plays in the Strachan and Kakwa areas.
Conventional crude oil development primarily centers around heavy oil at McMullen which is located approximately 40 kilometers southwest of Wabasca, Alberta. The McMullen conventional development is currently producing approximately 5.0 mboe/day. Development in 2014 included drilling one development pad and completing a total of three pads that were put on production for total incremental volumes of 700 bbls/day.
The Company continued to develop a resource cardium oil play in the Wapiti area south of the city of Grand Prairie, Alberta utilizing horizontal well and multi-stage fracturing technology to unlock crude oil reserves in the Cardium zone. The 2014 drilling program was reduced to six wells and ten completions. Production from the area has grown to approximately 3.5 mboe/day.
Husky also progressed development of two major liquids rich gas resource plays. Production from the Strachan Cardium play near Rocky Mountain House was increased from 1.0 to 5.0 mboe/day during the year with four new horizontal wells drilled and eight new wells coming on production in 2014. There are plans for six additional wells to be drilled in 2015 to maintain production.
The Kakwa Wilrich liquids rich gas resource play south of Grande Prairie is a non-operated asset with Conoco Phillips, (Husky working interest 50%). This is a new development play where seven wells were drilled and completed with four coming on production by year end for a net Husky production rate of approximately 4.0 mboe/day. Plans for 2015 include drilling four additional wells to grow production to 8.0 mboe/day.
Southeast
Husky’s Western Canada southeast development operations are located primarily in southern Alberta and southern Saskatchewan. Husky operates 68 crude oil and 27 gas facilities in the area. Production in 2014 from these operations averaged 63.0 mmcf/day of natural gas and 36.0 mbbls/day of crude oil and NGL.
Husky’s resource oil drilling programs target medium productivity reservoirs enhanced by utilizing horizontal drilling and multiple-stage fracturing treatments. The Company currently has approximately 100 wells producing from the plays.
Husky applies the ASP EOR process at Warner in southern Alberta and at Gull Lake and Fosterton in southern Saskatchewan. In addition, Husky holds a 20.3% non-operating working interest in the Instow, Saskatchewan ASP flood. Production in December 2014 for this ASP EOR program was approximately 3.0 mbbls/day.
Development of the Bakken and Torquay formations continued in southeast Saskatchewan. In 2014, Husky drilled seven oil wells, brought seven wells on production, acquired 6.25 sections at Oungre East, expanded the facility with a gas injection pilot and treater and began construction of infrastructure at Oungre East to support continued development. Production from the Oungre property in December 2014 was approximately 2.0 mboe/day.
Conventional oil development in southern Alberta and Saskatchewan will focus on the Mannville and Paleozoic reservoirs where the Company has a large inventory of locations to drill.
Gas Resource Development
Gas resource development operations are located primarily in northern Alberta in the Edson and Grande Prairie regions and include Husky’s two primary assets: the Ansell/Galloway area and the Duvernay formation at Kaybob. Husky’s production in 2014 from Ansell/Galloway averaged 2.4 mbbls/day of natural gas liquids and 90.3 mmcf/day of natural gas. To date, the Company has drilled and completed over 350 (gross) wells at the Ansell project including 24 (gross) wells in 2014. In the Kaybob area, production averaged 0.8 mbbls/day of natural gas liquids and 4.2 mmcf/day of natural gas in 2014. Husky drilled and completed a two-well pad in 2014 at the Duvernay liquids-rich natural gas resource play at Kaybob, Alberta.
Rainbow Development
Rainbow Lake, located approximately 700 kilometers northwest of Edmonton, Alberta, is the site of Husky’s largest light oil production operation in Western Canada. Husky’s production for 2014 from the Rainbow Lake district averaged 8.4 mbbls/day of light crude oil and NGL and 80.6 mmcf/day of natural gas.
The Company holds a 50% interest in a 90 MW natural gas fired cogeneration facility adjacent to Husky’s Rainbow Lake processing plant. The cogeneration facility produces electricity for the Power Pool of Alberta and thermal energy, or steam, for the Rainbow Lake processing plant. Results from this joint venture are included in Upstream Exploration and Production.
Northwest Territories
Husky holds two ELs acquired in 2011 in the Northwest Territories at the Slater River Canol shale play. Two vertical pilot wells were drilled, completed and flow tested in 2012. These wells satisfied the requirements to extend the term of both the ELs to the full nine year term. The Company acquired a 220 square kilometer multi-component 3D seismic survey in 2012, and construction of an all season access road was completed in 2014. Husky withdrew an application to drill four horizontal wells originally planned in 2015.
Distribution of Oil and Gas Production
Crude Oil and NGL
Husky provides heavy crude oil feedstock to its Upgrader and its asphalt refinery, which are located at Lloydminster, Alberta/Saskatchewan. The combined dry crude feedstock requirements of the Upgrader and asphalt refinery are approximately equal to Husky’s heavy crude oil production from the Lloydminster area. Husky also purchases third-party volumes. Husky markets heavy crude oil production directly to refiners located in the mid-west and eastern United States and Canada. Husky markets its light and synthetic crude oil production to third-party refiners in Canada, the United States and Asia in addition to Husky’s Lima Refinery. NGL is sold to local petrochemical end users, retail and wholesale distributors, and refiners in North America.
Husky markets third-party volumes of crude oil, synthetic crude oil and NGL in addition to its own production. For a discussion of Husky’s distribution methods associated with crude oil and NGL, see “Commodity Marketing”.
Natural Gas
The following table shows the distribution of Husky’s gross average daily natural gas production for the years indicated. The Company markets third-party natural gas production in addition to its own production.
| | | | | | | | | | | | |
| | | Years Ended December 31, | |
| | | 2014 | | | 2013 | | | 2012 | |
| | | | | | | (mmcf/day | ) | | | | |
Sales Distribution | | | | | | | | |
United States | | | 183 | | | | 141 | | | | 154 | |
Canada | | | 138 | | | | 198 | | | | 242 | |
| | | | | | | | | | | | |
| | | 321 | | | | 339 | | | | 396 | |
| | | | | | | | | | | | |
Sales to Aggregators | | | — | | | | 2 | | | | 4 | |
Internal Use(1) | | | 186 | | | | 172 | | | | 154 | |
| | | | | | | | | | | | |
| | | 507 | | | | 513 | | | | 554 | |
| | | | | | | | | | | | |
| (1) | Husky consumes natural gas for fuel at several of its facilities. |
Fixed Price Contracts
The following table shows the future commitments to deliver natural gas from Husky reserves. Husky’s proved developed reserves of natural gas in Western Canada are more than adequate to meet future delivery commitments.
| | | | | | | | |
| | | | | | Fixed Price | |
| | | bcf | | | $/mmbtu | |
2015 | | | 3.8 | | | | 4.34 | |
2016 | | | — | | | | — | |
2017 | | | — | | | | — | |
Disclosures of Oil and Gas Activities
Production History
| | | | | | | | | | | | | | | | | | | | |
| | | Year Ended | | | Three Months Ended | |
Average Gross Daily Production | | Dec 31, 2014 | | | Dec 31, 2014 | | | Sep 30, 2014 | | | Jun 30, 2014 | | | Mar 31, 2014 | |
Canada—Western Canada | | | | | | | | | | | | | | | | | | | | |
Light Crude Oil and NGL (mbbls/day) | | | 30.1 | | | | 31.2 | | | | 30.3 | | | | 27.7 | | | | 31.4 | |
Medium Crude Oil (mbbls/day) | | | 21.5 | | | | 19.7 | | | | 20.2 | | | | 22.4 | | | | 23.7 | |
Heavy Crude Oil (mbbls/day) | | | 76.8 | | | | 77.5 | | | | 76.1 | | | | 78.1 | | | | 75.5 | |
Bitumen (mbbls/day) | | | 54.6 | | | | 55.7 | | | | 56.2 | | | | 54.6 | | | | 52.0 | |
Natural Gas (mmcf/day) | | | 506.8 | | | | 521.3 | | | | 509.3 | | | | 490.6 | | | | 505.9 | |
Canada—Atlantic Region | | | | | | | | | | | | | | | | | | | | |
Light Crude Oil (mbbls/day) | | | 44.6 | | | | 43.4 | | | | 37.3 | | | | 47.6 | | | | 50.3 | |
Asia Pacific Region(1) | | | | | | | | | | | | | | | | | | | | |
Light Crude Oil and NGL (mbbls/day) | | | 9.0 | | | | 15.2 | | | | 9.3 | | | | 2.6 | | | | 8.7 | |
Natural Gas (mmcf/day) | | | 114.2 | | | | 180.2 | | | | 161.0 | | | | 113.0 | | | | — | |
| | | | | | | | | | | | | | | | | | | | |
Total Gross Production (mboe/day) | | | 340.1 | | | | 359.6 | | | | 341.1 | | | | 333.6 | | | | 325.9 | |
| | | | | | | | | | | | | | | | | | | | |
| | |
| | | Year Ended | | | Three Months Ended | |
Average Gross Daily Production | | Dec 31, 2013 | | | Dec 31, 2013 | | | Sep 30, 2013 | | | Jun 30, 2013 | | | Mar 31, 2013 | |
Canada—Western Canada | | | | | | | | | | | | | | | | | | | | |
Light Crude Oil and NGL (mbbls/day) | | | 29.7 | | | | 30.2 | | | | 29.2 | | | | 28.6 | | | | 30.7 | |
Medium Crude Oil (mbbls/day) | | | 23.2 | | | | 23.4 | | | | 23.2 | | | | 22.9 | | | | 23.0 | |
Heavy Crude Oil (mbbls/day) | | | 74.5 | | | | 75.9 | | | | 75.3 | | | | 72.3 | | | | 74.4 | |
Bitumen (mbbls/day) | | | 47.7 | | | | 46.7 | | | | 48.0 | | | | 48.3 | | | | 47.9 | |
Natural Gas (mmcf/day) | | | 512.7 | | | | 503.8 | | | | 505.5 | | | | 504.7 | | | | 537.3 | |
Canada—Atlantic Region | | | | | | | | | | | | | | | | | | | | |
Light Crude Oil (mbbls/day) | | | 44.1 | | | | 40.8 | | | | 41.7 | | | | 46.1 | | | | 47.9 | |
Asia Pacific Region | | | | | | | | | | | | | | | | | | | | |
Light Crude Oil and NGL (mbbls/day) | | | 7.3 | | | | 7.3 | | | | 6.8 | | | | 7.6 | | | | 7.8 | |
| | | | | | | | | | | | | | | | | | | | |
Total Gross Production (mboe/day) | | | 312.0 | | | | 308.3 | | | | 308.5 | | | | 309.9 | | | | 321.3 | |
| | | | | | | | | | | | | | | | | | | | |
| | |
| | | Year Ended | | | Three Months Ended | |
Average Gross Daily Production | | Dec 31, 2012 | | | Dec 31, 2012 | | | Sep 30, 2012 | | | Jun 30, 2012 | | | Mar 31, 2012 | |
Canada—Western Canada | | | | | | | | | | | | | | | | | | | | |
Light Crude Oil and NGL (mbbls/day) | | | 30.1 | | | | 31.9 | | | | 29.0 | | | | 29.4 | | | | 30.5 | |
Medium Crude Oil (mbbls/day) | | | 24.1 | | | | 23.2 | | | | 23.9 | | | | 24.1 | | | | 24.9 | |
Heavy Crude Oil (mbbls/day) | | | 76.9 | | | | 76.0 | | | | 77.1 | | | | 78.1 | | | | 76.2 | |
Bitumen (mbbls/day) | | | 35.9 | | | | 46.7 | | | | 37.8 | | | | 29.6 | | | | 29.6 | |
Natural Gas (mmcf/day) | | | 554.0 | | | | 523.7 | | | | 544.9 | | | | 559.5 | | | | 588.3 | |
Canada—Atlantic Region | | | | | | | | | | | | | | | | | | | | |
Light Crude Oil (mbbls/day) | | | 33.8 | | | | 45.7 | | | | 18.5 | | | | 19.0 | | | | 52.1 | |
Asia Pacific Region | | | | | | | | | | | | | | | | | | | | |
Light Crude Oil and NGL (mbbls/day) | | | 8.4 | | | | 8.5 | | | | 7.9 | | | | 8.4 | | | | 8.6 | |
| | | | | | | | | | | | | | | | | | | | |
Total Gross Production (mboe/day) | | | 301.5 | | | | 319.3 | | | | 285.0 | | | | 281.9 | | | | 319.9 | |
| | | | | | | | | | | | | | | | | | | | |
| (1) | Reported production volumes include Husky’s net working interest production from the Liwan Gas Project (49%) and an incremental share of production volumes which are allocated to Husky until full project exploration cost recovery is attained. |
Netback Analysis
The following tables show Husky’s netback analysis by product and area:
| | | | | | | | | | | | | | | | | | | | |
| | | Year Ended | | | Three Months Ended | |
Average Per Unit Amounts | | Dec 31, 2014 | | | Dec 31, 2014 | | | Sept 30, 2014 | | | June 30, 2014 | | | Mar 31, 2014 | |
Light Crude Oil and NGL ($/bbl) | | | | | | | | | | | | | | | | | | | | |
Canada—Western Canada | | | | | | | | | | | | | | | | | | | | |
Price Received | | $ | 82.53 | | | $ | 65.00 | | | $ | 84.95 | | | $ | 89.96 | | | $ | 91.42 | |
Royalties | | $ | 12.78 | | | $ | 8.99 | | | $ | 13.78 | | | $ | 13.34 | | | $ | 15.16 | |
Production Costs | | $ | 25.75 | | | $ | 23.50 | | | $ | 25.63 | | | $ | 26.96 | | | $ | 27.15 | |
| | | | | | | | | | | | | | | | | | | | |
Netback | | $ | 44.00 | | | $ | 32.51 | | | $ | 45.53 | | | $ | 49.67 | | | $ | 49.11 | |
| | | | | | | | | | | | | | | | | | | | |
Canada—Atlantic Canada | | | | | | | | | | | | | | | | | | | | |
Price Received | | $ | 107.50 | | | $ | 77.49 | | | $ | 105.24 | | | $ | 122.62 | | | $ | 121.27 | |
Royalties | | $ | 18.43 | | | $ | 6.17 | | | $ | 18.28 | | | $ | 25.15 | | | $ | 22.88 | |
Production Costs | | $ | 13.38 | | | $ | 13.55 | | | $ | 17.86 | | | $ | 10.52 | | | $ | 12.59 | |
Transportation Costs (1) | | $ | 2.49 | | | $ | 2.27 | | | $ | 3.32 | | | $ | 2.48 | | | $ | 2.07 | |
| | | | | | | | | | | | | | | | | | | | |
Netback | | $ | 73.20 | | | $ | 55.50 | | | $ | 65.78 | | | $ | 84.47 | | | $ | 83.74 | |
| | | | | | | | | | | | | | | | | | | | |
Canada—Total | | | | | | | | | | | | | | | | | | | | |
Price Received (1) | | $ | 95.95 | | | $ | 70.94 | | | $ | 94.32 | | | $ | 109.03 | | | $ | 108.51 | |
Royalties | | $ | 16.14 | | | $ | 7.35 | | | $ | 16.27 | | | $ | 20.80 | | | $ | 19.91 | |
Production Costs | | $ | 18.38 | | | $ | 17.70 | | | $ | 21.34 | | | $ | 16.57 | | | $ | 18.19 | |
| | | | | | | | | | | | | | | | | | | | |
Netback | | $ | 61.43 | | | $ | 45.89 | | | $ | 56.72 | | | $ | 71.66 | | | $ | 70.41 | |
| | | | | | | | | | | | | | | | | | | | |
China(2) | | | | | | | | | | | | | | | | | | | | |
Price Received | | $ | 95.99 | | | $ | 67.56 | | | $ | 102.57 | | | $ | 115.85 | | | $ | 117.00 | |
Royalties | | $ | 18.83 | | | $ | 4.30 | | | $ | 29.07 | | | $ | 21.26 | | | $ | 28.02 | |
Production Costs | | $ | 13.15 | | | $ | 12.81 | | | $ | 14.61 | | | $ | 88.07 | | | $ | 10.56 | |
| | | | | | | | | | | | | | | | | | | | |
Netback | | $ | 64.01 | | | $ | 50.45 | | | $ | 58.89 | | | $ | 6.52 | | | $ | 78.41 | |
| | | | | | | | | | | | | | | | | | | | |
Company Total | | | | | | | | | | | | | | | | | | | | |
Price Received (1) | | $ | 95.96 | | | $ | 70.64 | | | $ | 94.65 | | | $ | 109.07 | | | $ | 109.33 | |
Royalties | | $ | 16.32 | | | $ | 7.08 | | | $ | 16.77 | | | $ | 20.81 | | | $ | 20.69 | |
Production Costs | | $ | 18.05 | | | $ | 17.27 | | | $ | 21.07 | | | $ | 16.93 | | | $ | 17.45 | |
| | | | | | | | | | | | | | | | | | | | |
Netback | | $ | 61.60 | | | $ | 46.29 | | | $ | 56.80 | | | $ | 71.33 | | | $ | 71.18 | |
| | | | | | | | | | | | | | | | | | | | |
Medium Crude Oil ($/bbl) | | | | | | | | | | | | | | | | | | | | |
Canada—Western Canada | | | | | | | | | | | | | | | | | | | | |
Price Received | | $ | 80.69 | | | $ | 64.60 | | | $ | 83.35 | | | $ | 89.67 | | | $ | 83.47 | |
Royalties | | $ | 13.54 | | | $ | 12.00 | | | $ | 15.42 | | | $ | 14.40 | | | $ | 12.44 | |
Production Costs | | $ | 23.49 | | | $ | 23.32 | | | $ | 25.64 | | | $ | 24.29 | | | $ | 20.99 | |
| | | | | | | | | | | | | | | | | | | | |
Netback | | $ | 43.66 | | | $ | 29.28 | | | $ | 42.29 | | | $ | 50.99 | | | $ | 50.04 | |
| | | | | | | | | | | | | | | | | | | | |
Heavy Crude Oil ($/bbl) | | | | | | | | | | | | | | | | | | | | |
Canada—Western Canada | | | | | | | | | | | | | | | | | | | | |
Price Received | | $ | 71.82 | | | $ | 58.78 | | | $ | 77.34 | | | $ | 79.44 | | | $ | 72.18 | |
Royalties | | $ | 8.98 | | | $ | 7.65 | | | $ | 9.84 | | | $ | 9.87 | | | $ | 8.59 | |
Production Costs | | $ | 20.89 | | | $ | 19.43 | | | $ | 21.50 | | | $ | 20.03 | | | $ | 22.70 | |
| | | | | | | | | | | | | | | | | | | | |
Netback | | $ | 41.95 | | | $ | 31.70 | | | $ | 46.00 | | | $ | 49.54 | | | $ | 40.90 | |
| | | | | | | | | | | | | | | | | | | | |
Bitumen ($/bbl) | | | | | | | | | | | | | | | | | | | | |
Canada—Western Canada | | | | | | | | | | | | | | | | | | | | |
Price Received | | $ | 70.57 | | | $ | 58.21 | | | $ | 75.50 | | | $ | 77.97 | | | $ | 70.78 | |
Royalties | | $ | 6.30 | | | $ | 5.39 | | | $ | 6.85 | | | $ | 6.93 | | | $ | 6.03 | |
Production Costs | | $ | 13.10 | | | $ | 12.11 | | | $ | 12.64 | | | $ | 12.71 | | | $ | 15.07 | |
| | | | | | | | | | | | | | | | | | | | |
Netback | | $ | 51.17 | | | $ | 40.71 | | | $ | 56.00 | | | $ | 58.33 | | | $ | 49.68 | |
| | | | | | | | | | | | | | | | | | | | |
Natural gas ($/mcf) | | | | | | | | | | | | | | | | | | | | |
Canada—Western Canada(3) | | | | | | | | | | | | | | | | | | | | |
Price Received | | $ | 4.41 | | | $ | 3.98 | | | $ | 4.00 | | | $ | 4.86 | | | $ | 4.82 | |
Royalties | | $ | 0.21 | ) | | $ | 0.11 | | | $ | 0.19 | | | $ | 0.39 | | | $ | 0.18 | |
Production Costs | | $ | 2.07 | | | $ | 2.08 | | | $ | 2.02 | | | $ | 2.17 | | | $ | 2.03 | |
| | | | | | | | | | | | | | | | | | | | |
Netback | | $ | 2.12 | | | $ | 1.79 | | | $ | 1.79 | | | $ | 2.30 | | | $ | 2.62 | |
| | | | | | | | | | | | | | | | | | | | |
| | | | | | | | | | | | | | | | | | | | |
| | | Year Ended | | | Three Months Ended | |
Average Per Unit Amounts | | Dec 31, 2014 | | | Dec 31, 2014 | | | Sept 30, 2014 | | | June 30, 2014 | | | Mar 31, 2014 | |
Natural gas ($/mcf) | | | | | | | | | | | | | | | | | | | | |
China(2) | | | | | | | | | | | | | | | | | | | | |
Price Received | | $ | 13.03 | | | $ | 13.18 | | | $ | 12.78 | | | $ | 13.04 | | | | — | |
Royalties | | $ | 0.64 | | | $ | 0.69 | | | $ | 0.55 | | | $ | 0.68 | | | | — | |
Production Costs | | $ | 1.21 | | | $ | 1.30 | | | $ | 1.49 | | | $ | 0.58 | | | | — | |
| | | | | | | | | | | | | | | | | | | | |
Netback | | $ | 11.19 | | | $ | 11.19 | | | $ | 10.74 | | | $ | 11.79 | | | | — | |
| | | | | | | | | | | | | | | | | | | | |
| (1) | Transportation costs are shown separately from price in Canada—Atlantic Region. This cost category is netted against price when calculating Canada Total and Company Total balances. |
| (2) | Reported production volumes include Husky Liwan Gas Project (49%) and an incremental share of production volumes which are allocated to Husky until full project exploration cost recovery is attained. |
| | | | | | | | | | | | | | | | | | | | |
| | | Year Ended | | | Three Months Ended | |
Average Per Unit Amounts | | Dec 31, 2013 | | | Dec 31, 2013 | | | Sept 30, 2013 | | | June 30, 2013 | | | Mar 31, 2013 | |
Light Crude Oil and NGL ($/bbl) | | | | | | | | | | | | | | | | | | | | |
Canada—Western Canada | | | | | | | | | | | | | | | | | | | | |
Price Received | | $ | 82.73 | | | $ | 78.42 | | | $ | 91.80 | | | $ | 80.54 | | | $ | 80.33 | |
Royalties | | $ | 12.87 | | | $ | 12.57 | | | $ | 10.94 | | | $ | 13.96 | | | $ | 14.00 | |
Production Costs | | $ | 23.63 | | | $ | 21.59 | | | $ | 26.84 | | | $ | 23.87 | | | $ | 22.54 | |
| | | | | | | | | | | | | | | | | | | | |
Netback | | $ | 46.23 | | | $ | 44.26 | | | $ | 54.02 | | | $ | 42.71 | | | $ | 43.79 | |
| | | | | | | | | | | | | | | | | | | | |
Canada—Atlantic Canada | | | | | | | | | | | | | | | | | | | | |
Price Received | | $ | 114.60 | | | $ | 117.87 | | | $ | 117.84 | | | $ | 106.28 | | | $ | 116.93 | |
Royalties | | $ | 14.65 | | | $ | 15.98 | | | $ | 14.23 | | | $ | 12.92 | | | $ | 15.50 | |
Production Costs | | $ | 12.47 | | | $ | 15.19 | | | $ | 13.31 | | | $ | 12.16 | | | $ | 9.98 | |
Transportation Costs(1) | | $ | 2.62 | | | $ | 2.80 | | | $ | 3.16 | | | $ | 2.54 | | | $ | 2.08 | |
| | | | | | | | | | | | | | | | | | | | |
Netback | | $ | 84.86 | | | $ | 83.90 | | | $ | 87.14 | | | $ | 78.66 | | | $ | 89.37 | |
| | | | | | | | | | | | | | | | | | | | |
Canada—Total | | | | | | | | | | | | | | | | | | | | |
Price Received(1) | | $ | 100.22 | | | $ | 99.50 | | | $ | 105.26 | | | $ | 94.86 | | | $ | 101.40 | |
Royalties | | $ | 13.93 | | | $ | 14.54 | | | $ | 12.88 | | | $ | 13.33 | | | $ | 14.93 | |
Production Costs | | $ | 16.96 | | | $ | 17.91 | | | $ | 18.88 | | | $ | 16.64 | | | $ | 15.03 | |
| | | | | | | | | | | | | | | | | | | | |
Netback | | $ | 69.33 | | | $ | 67.05 | | | $ | 73.50 | | | $ | 64.89 | | | $ | 71.44 | |
| | | | | | | | | | | | | | | | | | | | |
China | | | | | | | | | | | | | | | | | | | | |
Price Received | | $ | 107.95 | | | $ | 110.17 | | | $ | 115.30 | | | $ | 94.26 | | | $ | 112.95 | |
Royalties | | $ | 26.23 | | | $ | 26.19 | | | $ | 27.98 | | | $ | 21.46 | | | $ | 29.52 | |
Production Costs | | $ | 11.39 | | | $ | 13.63 | | | $ | 12.72 | | | $ | 10.28 | | | $ | 9.97 | |
| | | | | | | | | | | | | | | | | | | | |
Netback | | $ | 70.33 | | | $ | 70.35 | | | $ | 74.60 | | | $ | 62.52 | | | $ | 73.46 | |
| | | | | | | | | | | | | | | | | | | | |
Company Total | | | | | | | | | | | | | | | | | | | | |
Price Received(1) | | $ | 100.87 | | | $ | 100.49 | | | $ | 106.13 | | | $ | 94.80 | | | $ | 102.43 | |
Royalties | | $ | 15.00 | | | $ | 15.62 | | | $ | 14.19 | | | $ | 14.08 | | | $ | 16.22 | |
Production Costs | | $ | 16.45 | | | $ | 17.51 | | | $ | 18.34 | | | $ | 16.05 | | | $ | 14.44 | |
| | | | | | | | | | | | | | | | | | | | |
Netback | | $ | 69.42 | | | $ | 67.36 | | | $ | 73.60 | | | $ | 64.67 | | | $ | 71.77 | |
| | | | | | | | | | | | | | | | | | | | |
Medium Crude Oil ($/bbl) | | | | | | | | | | | | | | | | | | | | |
Canada—Western Canada | | | | | | | | | | | | | | | | | | | | |
Price Received | | $ | 76.31 | | | $ | 67.86 | | | $ | 93.67 | | | $ | 73.62 | | | $ | 61.74 | |
Royalties | | $ | 14.25 | | | $ | 11.06 | | | $ | 16.23 | | | $ | 10.80 | | | $ | 10.78 | |
Production Costs | | $ | 20.53 | | | $ | 20.23 | | | $ | 23.45 | | | $ | 24.09 | | | $ | 22.19 | |
| | | | | | | | | | | | | | | | | | | | |
Netback | | $ | 41.53 | | | $ | 36.57 | | | $ | 53.99 | | | $ | 38.73 | | | $ | 28.77 | |
| | | | | | | | | | | | | | | | | | | | |
Heavy Crude Oil ($/bbl) | | | | | | | | | | | | | | | | | | | | |
Canada—Western Canada | | | | | | | | | | | | | | | | | | | | |
Price Received | | $ | 63.44 | | | $ | 56.51 | | | $ | 84.45 | | | $ | 66.77 | | | $ | 45.67 | |
Royalties | | $ | 8.20 | | | $ | 7.69 | | | $ | 10.93 | | | $ | 8.06 | | | $ | 6.03 | |
Production Costs | | $ | 20.63 | | | $ | 20.16 | | | $ | 21.82 | | | $ | 20.73 | | | $ | 20.15 | |
| | | | | | | | | | | | | | | | | | | | |
Netback | | $ | 34.61 | | | $ | 28.66 | | | $ | 51.70 | | | $ | 37.98 | | | $ | 19.49 | |
| | | | | | | | | | | | | | | | | | | | |
Bitumen ($/bbl) | | | | | | | | | | | | | | | | | | | | |
Canada—Western Canada | | | | | | | | | | | | | | | | | | | | |
Price Received | | $ | 61.68 | | | $ | 54.08 | | | $ | 83.17 | | | $ | 65.71 | | | $ | 43.12 | |
Royalties | | $ | 5.37 | | | $ | 6.63 | | | $ | 6.64 | | | $ | 4.94 | | | $ | 3.25 | |
Production Costs | | $ | 12.39 | | | $ | 12.80 | | | $ | 11.83 | | | $ | 13.61 | | | $ | 11.61 | |
| | | | | | | | | | | | | | | | | | | | |
Netback | | $ | 43.92 | | | $ | 34.65 | | | $ | 64.70 | | | $ | 47.16 | | | $ | 28.26 | |
| | | | | | | | | | | | | | | | | | | | |
Natural Gas ($/mcf) | | | | | | | | | | | | | | | | | | | | |
Canada—Western Canada(2) | | | | | | | | | | | | | | | | | | | | |
Price Received | | $ | 3.19 | | | $ | 3.30 | | | $ | 2.66 | | | $ | 3.72 | | | $ | 3.08 | |
Royalties | | ($ | 0.01 | ) | | ($ | 0.08 | ) | | ($ | 0.09 | ) | | $ | 0.11 | | | $ | 0.02 | |
Production Costs | | $ | 2.14 | | | $ | 2.09 | | | $ | 2.25 | | | $ | 2.30 | | | $ | 2.02 | |
| | | | | | | | | | | | | | | | | | | | |
Netback | | $ | 1.06 | | | $ | 1.29 | | | $ | 0.50 | | | $ | 1.31 | | | $ | 1.04 | |
| | | | | | | | | | | | | | | | | | | | |
| (1) | Transportation costs are shown separately from price in Canada—Atlantic Region. This cost category is netted against price when calculating Canada Total and Company Total balances. |
Producing and Non-Producing Wells(1)(2)(3)
Producing Wells
| | | | | | | | | | | | | | | | | | | | | | | | |
| | | Oil Wells | | | Natural Gas Wells | | | Total | |
| | | Gross | | | Net | | | Gross | | | Net | | | Gross | | | Net | |
Canada | | | | | | | | | | | | | | | | | | | | | | | | |
Alberta | | | 4,208 | | | | 3,444 | | | | 5,312 | | | | 3,846 | | | | 9,520 | | | | 7,290 | |
Saskatchewan | | | 6,273 | | | | 5,356 | | | | 1,345 | | | | 1,220 | | | | 7,618 | | | | 6,576 | |
British Columbia | | | 199 | | | | 57 | | | | 296 | | | | 260 | | | | 495 | | | | 317 | |
Newfoundland | | | 21 | | | | 6 | | | | — | | | | — | | | | 21 | | | | 6 | |
| | | | | | | | | | | | | | | | | | | | | | | | |
| | | 10,701 | | | | 8,863 | | | | 6,953 | | | | 5,326 | | | | 17,654 | | | | 14,189 | |
| | | | | | | | | | | | | | | | | | | | | | | | |
International | | | | | | | | | | | | | | | | | | | | | | | | |
China | | | 28 | | | | 11 | | | | 10 | | | | 5 | | | | 38 | | | | 16 | |
Libya | | | 3 | | | | 1 | | | | — | | | | — | | | | 3 | | | | 1 | |
| | | | | | | | | | | | | | | | | | | | | | | | |
| | | 31 | | | | 12 | | | | 10 | | | | 5 | | | | 41 | | | | 17 | |
| | | | | | | | | | | | | | | | | | | | | | | | |
As at December 31, 2014 | | | 10,732 | | | | 8,875 | | | | 6,963 | | | | 5,331 | | | | 17,695 | | | | 14,206 | |
| | | | | | | | | | | | | | | | | | | | | | | | |
Canada | | | | | | | | | | | | | | | | | | | | | | | | |
Alberta | | | 4,236 | | | | 3,475 | | | | 5,445 | | | | 3,968 | | | | 9,681 | | | | 7,443 | |
Saskatchewan | | | 6,683 | | | | 5,744 | | | | 1,374 | | | | 1,249 | | | | 8,057 | | | | 6,993 | |
British Columbia | | | 198 | | | | 56 | | | | 304 | | | | 266 | | | | 502 | | | | 322 | |
Newfoundland | | | 21 | | | | 6 | | | | — | | | | — | | | | 21 | | | | 6 | |
| | | | | | | | | | | | | | | | | | | | | | | | |
| | | 11,138 | | | | 9,281 | | | | 7,123 | | | | 5,483 | | | | 18,261 | | | | 14,764 | |
| | | | | | | | | | | | | | | | | | | | | | | | |
International | | | | | | | | | | | | | | | | | | | | | | | | |
China | | | 29 | | | | 11 | | | | — | | | | — | | | | 29 | | | | 11 | |
Libya | | | 3 | | | | 1 | | | | — | | | | — | | | | 3 | | | | 1 | |
| | | | | | | | | | | | | | | | | | | | | | | | |
| | | 32 | | | | 12 | | | | — | | | | — | | | | 32 | | | | 12 | |
| | | | | | | | | | | | | | | | | | | | | | | | |
As at December 31, 2013 | | | 11,170 | | | | 9,293 | | | | 7,123 | | | | 5,483 | | | | 18,293 | | | | 14,776 | |
| | | | | | | | | | | | | | | | | | | | | | | | |
Canada | | | | | | | | | | | | | | | | | | | | | | | | |
Alberta | | | 4,341 | | | | 3,575 | | | | 5,732 | | | | 4,221 | | | | 10,073 | | | | 7,796 | |
Saskatchewan | | | 6,941 | | | | 6,000 | | | | 1,373 | | | | 1,256 | | | | 8,314 | | | | 7,256 | |
British Columbia | | | 199 | | | | 57 | | | | 311 | | | | 270 | | | | 510 | | | | 327 | |
Newfoundland | | | 30 | | | | 12 | | | | — | | | | — | | | | 30 | | | | 12 | |
| | | | | | | | | | | | | | | | | | | | | | | | |
| | | 11,511 | | | | 9,644 | | | | 7,416 | | | | 5,747 | | | | 18,927 | | | | 15,391 | |
| | | | | | | | | | | | | | | | | | | | | | | | |
International | | | | | | | | | | | | | | | | | | | | | | | | |
China | | | 32 | | | | 13 | | | | — | | | | — | | | | 32 | | | | 13 | |
Libya | | | — | | | | — | | | | — | | | | — | | | | — | | | | — | |
| | | | | | | | | | | | | | | | | | | | | | | | |
| | | 32 | | | | 13 | | | | — | | | | — | | | | 32 | | | | 13 | |
| | | | | | | | | | | | | | | | | | | | | | | | |
As at December 31, 2012 | | | 11,543 | | | | 9,657 | | | | 7,416 | | | | 5,747 | | | | 18,959 | | | | 15,404 | |
| | | | | | | | | | | | | | | | | | | | | | | | |
Non-Producing Wells
| | | | | | | | | | | | | | | | | | | | | | | | |
| | | 2014 | |
| | | Oil Wells | | | Natural Gas Wells | | | Total | |
| | | Gross | | | Net | | | Gross | | | Net | | | Gross | | | Net | |
Canada | | | 6,722 | | | | 6,068 | | | | 1,854 | | | | 1,513 | | | | 8,576 | | | | 7,581 | |
| | | | | | | | | | | | | | | | | | | | | | | | |
| (1) | The number of gross wells is the total number of wells in which Husky owns a working interest. The number of net wells is the sum of the fractional interests owned in the gross wells. Productive wells are those producing or capable of producing at December 31, 2014. |
| (2) | The above table does not include producing wells in which Husky has no working interest but does have a royalty interest. At December 31, 2014, Husky had a royalty interest in 4,193 wells, of which 1,528 were oil producers and 2,665 were gas producers. |
| (3) | For purposes of the table, multiple completions are counted as a single well. Where one of the completions in a given well is an oil completion, the well is classified as an oil well. In 2014, there were 1,347 gross and 1,219 net oil wells and 313 gross and 207 net natural gas wells that were completed in two or more formations and from which production is not commingled. |
Landholdings—Developed Acreage
| | | | | | | | |
(thousands of acres) | | Gross | | | Net | |
As at December 31, 2014 | | | | | | | | |
Western Canada | | | | | | | | |
Alberta | | | 4,574 | | | | 2,924 | |
Saskatchewan | | | 806 | | | | 638 | |
British Columbia | | | 185 | | | | 145 | |
Manitoba | | | 3 | | | | — | |
| | | | | | | | |
| | | 5,568 | | | | 3,707 | |
Atlantic Region | | | 57 | | | | 20 | |
| | | | | | | | |
| | | 5,625 | | | | 3,727 | |
China | | | 17 | | | | 7 | |
Libya | | | 7 | | | | 2 | |
| | | | | | | | |
Total | | | 5,649 | | | | 3,736 | |
| | | | | | | | |
As at December 31, 2013 | | | | | | | | |
Western Canada | | | | | | | | |
Alberta | | | 4,554 | | | | 2,917 | |
Saskatchewan | | | 818 | | | | 648 | |
British Columbia | | | 187 | | | | 146 | |
Manitoba | | | 3 | | | | — | |
| | | | | | | | |
| | | 5,562 | | | | 3,711 | |
Atlantic Region | | | 57 | | | | 20 | |
| | | | | | | | |
| | | 5,619 | | | | 3,731 | |
China | | | 17 | | | | 7 | |
Libya | | | 7 | | | | 2 | |
| | | | | | | | |
Total | | | 5,643 | | | | 3,740 | |
| | | | | | | | |
As at December 31, 2012 | | | | | | | | |
Western Canada | | | | | | | | |
Alberta | | | 4,590 | | | | 2,912 | |
Saskatchewan | | | 871 | | | | 700 | |
British Columbia | | | 187 | | | | 147 | |
Manitoba | | | 2 | | | | — | |
| | | | | | | | |
| | | 5,650 | | | | 3,759 | |
Atlantic Region | | | 57 | | | | 20 | |
| | | | | | | | |
| | | 5,707 | | | | 3,779 | |
China | | | 17 | | | | 7 | |
Libya | | | 7 | | | | 2 | |
| | | | | | | | |
Total | | | 5,731 | | | | 3,788 | |
| | | | | | | | |
Landholdings—Undeveloped Acreage
| | | | | | | | |
(thousands of acres) | | Gross | | | Net | |
As at December 31, 2014 | | | | | | | | |
Western Canada | | | | | | | | |
Alberta | | | 4,529 | | | | 3,247 | |
Saskatchewan | | | 1,708 | | | | 1,550 | |
British Columbia | | | 743 | | | | 583 | |
Manitoba | | | 3 | | | | 1 | |
| | | | | | | | |
| | | 6,983 | | | | 5,381 | |
Northwest Territories and Arctic | | | 483 | | | | 466 | |
Atlantic Region | | | 2,698 | | | | 1,295 | |
| | | | | | | | |
| | | 10,164 | | | | 7,142 | |
United States | | | 89 | | | | 29 | |
China | | | 56 | | | | 27 | |
Indonesia | | | 1,559 | | | | 1,186 | |
Greenland | | | 5,205 | | | | 4,555 | |
Taiwan | | | 2,545 | | | | 1,909 | |
| | | | | | | | |
Total | | | 19,618 | | | | 14,848 | |
| | | | | | | | |
As at December 31, 2013 | | | | | | | | |
Western Canada | | | | | | | | |
Alberta | | | 4,694 | | | | 3,422 | |
Saskatchewan | | | 1,567 | | | | 1,403 | |
British Columbia | | | 826 | | | | 634 | |
Manitoba | | | 3 | | | | 1 | |
| | | | | | | | |
| | | 7,090 | | | | 5,460 | |
Northwest Territories and Arctic | | | 483 | | | | 466 | |
Atlantic Region | | | 5,500 | | | | 3,269 | |
| | | | | | | | |
| | | 13,073 | | | | 9,195 | |
United States | | | 110 | | | | 74 | |
China | | | 56 | | | | 27 | |
Indonesia | | | 1,559 | | | | 937 | |
Greenland | | | 8,471 | | | | 5,983 | |
Taiwan | | | 2,545 | | | | 1,909 | |
| | | | | | | | |
Total | | | 25,814 | | | | 18,125 | |
| | | | | | | | |
As at December 31, 2012 | | | | | | | | |
Western Canada | | | | | | | | |
Alberta | | | 5,022 | | | | 3,683 | |
Saskatchewan | | | 1,602 | | | | 1,431 | |
British Columbia | | | 950 | | | | 709 | |
Manitoba | | | 3 | | | | 1 | |
| | | | | | | | |
| | | 7,577 | | | | 5,824 | |
Northwest Territories and Arctic | | | 483 | | | | 466 | |
Atlantic Region | | | 5,046 | | | | 3,124 | |
| | | | | | | | |
| | | 13,106 | | | | 9,414 | |
United States | | | 616 | | | | 259 | |
China | | | 495 | | | | 243 | |
Indonesia | | | 1,559 | | | | 937 | |
Greenland | | | 8,471 | | | | 5,983 | |
Taiwan | | | 2,545 | | | | 1,909 | |
| | | | | | | | |
Total | | | 26,792 | | | | 18,745 | |
| | | | | | | | |
Significant Factors or Uncertainties Relevant to Properties with No Attributed Reserves
The Company does not have any material work commitments associated with its undeveloped land.
Approximately 752,580 acres, or less than 11% of the Company’s net undeveloped landholdings in Canada, will be subject to expiry in 2015.
Husky holds interests in a diverse portfolio of undeveloped petroleum assets in Western Canada, the Atlantic Region, offshore Greenland, China, Taiwan and Indonesia, the United States, the Canadian Northwest Territories and the Arctic. As part of its active portfolio management, Husky continually reviews the economic viability of its undeveloped properties using industry standard economic evaluation techniques and pricing and economic environment assumptions. Each year, as part of this active management process, some properties are selected for further development activities, while others are held in abeyance, sold, swapped or relinquished back to the mineral rights owner. There is no guarantee that commercial reserves will be discovered or developed on these properties.
Drilling Activity—Number of Wells Drilled
| | | | | | | | | | | | | | | | | | | | | | | | |
| | | Year Ended December 31, | |
| | | 2014 | | | 2013 | | | 2012 | |
| | | Gross | | | Net | | | Gross | | | Net | | | Gross | | | Net | |
Canada—Western Canada | | | | | | | | | | | | | | | | | | | | | | | | |
Exploration | | | | | | | | | | | | | | | | | | | | | | | | |
Oil | | | 53 | | | | 44 | | | | 39 | | | | 24 | | | | 47 | | | | 30 | |
Gas | | | 9 | | | | 6 | | | | 19 | | | | 14 | | | | 19 | | | | 12 | |
Dry | | | 3 | | | | 3 | | | | — | | | | — | | | | — | | | | — | |
| | | | | | | | | | | | | | | | | | | | | | | | |
| | | 65 | | | | 53 | | | | 58 | | | | 38 | | | | 66 | | | | 42 | |
| | | | | | | | | | | | | | | | | | | | | | | | |
Development | | | | | | | | | | | | | | | | | | | | | | | | |
Oil | | | 469 | | | | 419 | | | | 768 | | | | 709 | | | | 775 | | | | 715 | |
Gas | | | 78 | | | | 68 | | | | 68 | | | | 41 | | | | 23 | | | | 17 | |
Dry | | | 3 | | | | 3 | | | | 1 | | | | — | | | | 5 | | | | 4 | |
| | | | | | | | | | | | | | | | | | | | | | | | |
| | | 550 | | | | 490 | | | | 837 | | | | 750 | | | | 803 | | | | 736 | |
| | | | | | | | | | | | | | | | | | | | | | | | |
| | | 615 | | | | 543 | | | | 895 | | | | 788 | | | | 869 | | | | 778 | |
| | | | | | | | | | | | | | | | | | | | | | | | |
Canada—Atlantic Region | | | | | | | | | | | | | | | | | | | | | | | | |
Development | | | | | | | | | | | | | | | | | | | | | | | | |
Oil | | | 1 | | | | 0.1 | | | | 2 | | | | 1.1 | | | | 2 | | | | 1.4 | |
| | | | | | | | | | | | | | | | | | | | | | | | |
China | | | | | | | | | | | | | | | | | | | | | | | | |
Development | | | | | | | | | | | | | | | | | | | | | | | | |
Oil | | | — | | | | — | | | | 3 | | | | 1.2 | | | | — | | | | — | |
Gas | | | — | | | | — | | | | — | | | | — | | | | — | | | | — | |
| | | | | | | | | | | | | | | | | | | | | | | | |
| | | — | | | | — | | | | 3 | | | | 1.2 | | | | — | | | | — | |
| | | | | | | | | | | | | | | | | | | | | | | | |
Service/Stratigraphic Test Wells
| | | | | | | | | | | | | | | | | | | | | | | | |
| | | 2014 | | | 2013 | | | 2012 | |
| | | Gross | | | Net | | | Gross | | | Net | | | Gross | | | Net | |
Canada- Western Canada | | | 127 | | | | 127 | | | | 130 | | | | 106 | | | | 116 | | | | 95 | |
Canada- Atlantic Region | | | 4 | | | | 1.9 | | | | 8 | | | | 3.9 | | | | 2 | | | | 1.7 | |
China | | | — | | | | — | | | | — | | | | — | | | | — | | | | — | |
Indonesia | | | 1 | | | | 0.4 | | | | 2 | | | | 0.9 | | | | 5 | | | | 2 | |
Costs Incurred
| | | | | | | | | | | | | | | | | | | | | | | | | | | | | | | | |
| | | Total | | | Western
Canada | | | Atlantic Region | | | Total
Canada | | | United States | | | China | | | Indonesia | | | Libya | |
| | | ($ millions) | |
Property acquisition | | | | | | | | | | | | | | | | | | | | | | | | | | | | | | | | |
Unproven | | | — | | | | — | | | | — | | | | — | | | | — | | | | — | | | | — | | | | — | |
Proven | | | 51 | | | | 51 | | | | — | | | | 51 | | | | — | | | | — | | | | — | | | | — | |
Exploration | | | 375 | | | | 260 | | | | 98 | | | | 358 | | | | — | | | | 12 | | | | 5 | | | | — | |
Development | | | 3,940 | | | | 2,785 | | | | 752 | | | | 3,537 | | | | — | | | | 380 | | | | 23 | | | | — | |
| | | | | | | | | | | | | | | | | | | | | | | | | | | | | | | | |
2014 | | | 4,366 | | | | 3,096 | | | | 850 | | | | 3,946 | | | | — | | | | 392 | | | | 28 | | | | — | |
| | | | | | | | | | | | | | | | | | | | | | | | | | | | | | | | |
| | | | | | | | |
| | | Total | | | Western
Canada | | | Atlantic Region | | | Total
Canada | | | United States | | | China | | | Indonesia | | | Libya | |
| | | ($ millions) | |
Property acquisition | | | | | | | | | | | | | | | | | | | | | | | | | | | | | | | | |
Unproven | | | 1 | | | | 1 | | | | — | | | | 1 | | | | — | | | | — | | | | — | | | | — | |
Proven | | | 37 | | | | 37 | | | | — | | | | 37 | | | | — | | | | — | | | | — | | | | — | |
Exploration | | | 601 | | | | 357 | | | | 223 | | | | 580 | | | | — | | | | 5 | | | | 16 | | | | — | |
Development | | | 3,722 | | | | 2,655 | | | | 402 | | | | 3,057 | | | | — | | | | 665 | | | | — | | | | — | |
| | | | | | | | | | | | | | | | | | | | | | | | | | | | | | | | |
2013 | | | 4,361 | | | | 3,050 | | | | 625 | | | | 3,675 | | | | — | | | | 670 | | | | 16 | | | | — | |
| | | | | | | | | | | | | | | | | | | | | | | | | | | | | | | | |
| | | | | | | | |
| | | Total | | | Western
Canada | | | Atlantic Region | | | Total
Canada | | | United States | | | China | | | Indonesia | | | Libya | |
| | | ($ millions) | |
Property acquisition | | | | | | | | | | | | | | | | | | | | | | | | | | | | | | | | |
Unproven | | | 15 | | | | 15 | | | | — | | | | 15 | | | | — | | | | — | | | | — | | | | — | |
Proven | | | 6 | | | | 6 | | | | — | | | | 6 | | | | — | | | | — | | | | — | | | | — | |
Exploration | | | 363 | | | | 247 | | | | 92 | | | | 339 | | | | — | | | | — | | | | 25 | | | | — | |
Development | | | 4,908 | | | | 3,527 | | | | 547 | | | | 4,074 | | | | — | | | | 833 | | | | 1 | | | | — | |
| | | | | | | | | | | | | | | | | | | | | | | | | | | | | | | | |
2012 | | | 5,293 | | | | 3,795 | | | | 639 | | | | 4,434 | | | | — | | | | 833 | | | | 26 | | | | — | |
| | | | | | | | | | | | | | | | | | | | | | | | | | | | | | | | |
Oil and Gas Reserves Disclosures
Husky’s oil and gas reserves are estimated in accordance with the standards contained in the COGEH, and the reserves data disclosed conforms with the requirements of National Instrument 51-101 “Standards of Disclosure for Oil and Gas Activities” (“NI 51-101”). The majority of Husky’s oil and gas reserves are prepared by internal reserves evaluation staff using a formalized process for determining, approving and booking reserves, with the remainder evaluated by Sproule Unconventional Limited (“Sproule”). This process requires all reserves evaluations to be done on a consistent basis using established definitions and guidelines. Approval of individually significant reserves changes requires review by an internal panel of qualified reserves evaluators. The Audit Committee of the Board of Directors has examined Husky’s procedures for assembling and reporting reserves data and other information associated with oil and gas activities and has reviewed that information with management. The Board of Directors has approved, on the recommendation of the Audit Committee, the content of Husky’s disclosure of its reserves data and other oil and gas information.
The following oil and gas reserves disclosure has been prepared in accordance with NI 51-101 effective December 31, 2014. Husky received approval from the CSA to also disclose its reserves using the rules of the United States FASB and the SEC (the “U.S. Rules”) as supplementary disclosure to the reserves and oil and gas activities disclosure required by NI 51-101. The reserves information prepared in accordance with the U.S. Rules is included in the Company’s Form 40-F, which is available atwww.sec.gov or on the Company’s website atwww.huskyenergy.com. The material differences between reserves quantities disclosed under NI 51-101 and those disclosed under the U.S. Rules is that NI 51-101 requires the determination of reserves quantities to be based on forecast pricing assumptions whereas the U.S. Rules require the determination of reserves quantities to be based on constant price assumptions calculated using a 12 month average price for the year (sum of the benchmark price on the first calendar day of each month in the year divided by 12).
Note that the numbers in each column of the tables throughout this section may not add due to rounding. Unless otherwise noted in this document, all provided reserves estimates have an effective date of December 31, 2014.
Independent Audit or Evaluation of Oil and Gas Reserves
McDaniel & Associates Consultants Ltd. (“McDaniel”), an independent firm of qualified oil and gas reserves evaluation engineers, was engaged to conduct an audit of the Company’s internally evaluated crude oil, natural gas, NGL and the Tucker property reserves estimates, other than for the Company’s Heavy Oil and Gas business unit. McDaniel issued an audit opinion stating that the Company’s internally generated proved and probable reserves and net present values based on forecast and constant price assumptions are, in aggregate, reasonable, and have been prepared in accordance with generally accepted oil and gas engineering and evaluation practices as set out in the COGEH.
Sproule, an independent firm of oil and gas reserves evaluation engineers, was engaged to conduct a full evaluation of Husky’s crude oil, natural gas and natural gas products reserves for the Company’s Heavy Oil and Gas business unit, excluding the Tucker property.
Disclosure of Oil and Gas Information
Unless otherwise noted in this document, all provided reserves estimates have an effective date of December 31, 2014 and are Husky’s total reserves including those prepared by internal reserves revaluation staff and those evaluated by Sproule for the Company’s Heavy Oil and Gas business unit, excluding the Tucker property. Gross reserves or gross production are reserves or production attributable to Husky’s interest prior to deduction of royalties; net reserves or net production are reserves or production net of such royalties. Gross or net production reported refers to sales volume, unless otherwise indicated. Unless otherwise noted, production and reserves figures are stated on a gross basis. Unless otherwise indicated, oil and gas commodity prices are quoted after the effect of hedging gains and losses. Unless otherwise indicated, all financial information is in accordance with IFRS as issued by the International Accounting Standards Board.
The estimates of reserves and future net revenue for individual properties may not reflect the same confidence level as estimates of reserves and future net revenue for all properties, due to the effects of aggregation.
Disclosure of Exemption Under National Instrument 51-101
Husky sought and was granted by the CSA an exemption from the requirement under NI 51-101 to involve independent qualified oil and gas reserves evaluators or auditors. Notwithstanding this exemption, the Company involves independent qualified reserves auditors as part of Husky’s corporate governance practices. Their involvement helps assure that the Company’s internal oil and gas reserves estimates are materially correct. In addition, Husky engaged Sproule to evaluate Husky’s reserves for its Heavy Oil and Gas business unit, excluding the Tucker property.
In Husky’s view, the reliability of Husky’s internally generated oil and gas reserves data is not materially less than would be afforded by Husky involving independent qualified reserves evaluators to evaluate and review the reserves data. The primary factors supporting the involvement of independent qualified reserves evaluators apply when (i) their knowledge of, and experience with, a reporting issuer’s reserves data are superior to that of the internal reserves evaluators and (ii) the work of the independent qualified reserves evaluators is significantly less likely to be adversely influenced by self-interest or management of the reporting issuer than the work of internal reserves evaluation staff. In Husky’s view, neither of these factors applies in Husky’s circumstances.
Summary of Oil and Natural Gas Reserves
As at December 31, 2014
Forecast Prices and Costs
Canada
| | | | | | | | | | | | | | | | | | | | | | | | | | | | | | | | |
| | | Light Crude Oil
(mmbbls) | | | Medium Crude Oil
(mmbbls) | | | Heavy Crude Oil
(mmbbls) | | | Bitumen
(mmbbls) | |
| | | Gross | | | Net | | | Gross | | | Net | | | Gross | | | Net | | | Gross | | | Net | |
Proved | | | | | | | | | | | | | | | | | | | | | | | | | | | | | | | | |
Developed Producing | | | 107.6 | | | | 87.1 | | | | 78.0 | | | | 69.4 | | | | 77.7 | | | | 70.8 | | | | 56.4 | | | | 52.4 | |
Developed Non-producing | | | 2.4 | | | | 2.1 | | | | 1.5 | | | | 1.4 | | | | 11.6 | | | | 10.5 | | | | 64.8 | | | | 60.2 | |
Undeveloped | | | 22.4 | | | | 18.8 | | | | 5.5 | | | | 4.8 | | | | 16.7 | | | | 15.6 | | | | 299.0 | | | | 249.2 | |
| | | | | | | | | | | | | | | | | | | | | | | | | | | | | | | | |
Total Proved | | | 132.3 | | | | 107.9 | | | | 85.0 | | | | 75.6 | | | | 106.0 | | | | 96.8 | | | | 420.2 | | | | 361.8 | |
Probable | | | 136.7 | | | | 106.1 | | | | 22.2 | | | | 19.0 | | | | 55.5 | | | | 50.8 | | | | 1,497.2 | | | | 1,183.7 | |
| | | | | | | | | | | | | | | | | | | | | | | | | | | | | | | | |
Total Proved Plus Probable | | | 269.1 | | | | 214.0 | | | | 107.2 | | | | 94.7 | | | | 161.5 | | | | 147.7 | | | | 1,917.4 | | | | 1,545.6 | |
| | | | | | | | | | | | | | | | | | | | | | | | | | | | | | | | |
| | | | |
| | | Coal Bed Methane
(bcf) | | | Natural Gas
(bcf) | | | NGL
(mmbbls) | | | Total
(mmboe) | |
| | | Gross | | | Net | | | Gross | | | Net | | | Gross | | | Net | | | Gross | | | Net | |
Proved | | | | | | | | | | | | | | | | | | | | | | | | | | | | | | | | |
Developed Producing | | | 19.3 | | | | 18.2 | | | | 1,573.0 | | | | 1,371.7 | | | | 53.6 | | | | 38.3 | | | | 638.7 | | | | 549.7 | |
Developed Non-producing | | | — | | | | — | | | | 79.8 | | | | 72.5 | | | | 1.0 | | | | 0.8 | | | | 94.6 | | | | 87.0 | |
Undeveloped | | | — | | | | — | | | | 481.5 | | | | 473.5 | | | | 13.4 | | | | 11.0 | | | | 437.1 | | | | 378.3 | |
| | | | | | | | | | | | | | | | | | | | | | | | | | | | | | | | |
Total Proved | | | 19.3 | | | | 18.2 | | | | 2,134.3 | | | | 1,917.6 | | | | 67.9 | | | | 50.1 | | | | 1,170.4 | | | | 1,015.0 | |
Probable | | | 3.0 | | | | 2.8 | | | | 480.8 | | | | 439.6 | | | | 16.4 | | | | 12.5 | | | | 1,808.7 | | | | 1,445.8 | |
| | | | | | | | | | | | | | | | | | | | | | | | | | | | | | | | |
Total Proved Plus Probable | | | 22.3 | | | | 21.0 | | | | 2,615.1 | | | | 2,357.2 | | | | 84.3 | | | | 62.6 | | | | 2,979.1 | | | | 2,460.8 | |
| | | | | | | | | | | | | | | | | | | | | | | | | | | | | | | | |
| | | | | | | | |
China | | | | | | | | | | | | | | | | | | | | | | | | | | | | | | | | |
| | | | |
| | | Light Crude Oil
(mmbbls) | | | Medium Crude Oil
(mmbbls) | | | Heavy Crude Oil
(mmbbls) | | | Bitumen
(mmbbls) | |
| | | Gross | | | Net | | | Gross | | | Net | | | Gross | | | Net | | | Gross | | | Net | |
Proved | | | | | | | | | | | | | | | | | | | | | | | | | | | | | | | | |
Developed Producing | | | 6.3 | | | | 5.7 | | | | — | | | | — | | | | — | | | | — | | | | — | | | | — | |
Developed Non-producing | | | — | | | | — | | | | — | | | | — | | | | — | | | | — | | | | — | | | | — | |
Undeveloped | | | — | | | | — | | | | — | | | | — | | | | — | | | | — | | | | — | | | | — | |
| | | | | | | | | | | | | | | | | | | | | | | | | | | | | | | | |
Total Proved | | | 6.3 | | | | 5.7 | | | | — | | | | — | | | | — | | | | — | | | | — | | | | — | |
Probable | | | 0.7 | | | | 0.6 | | | | — | | | | — | | | | — | | | | — | | | | — | | | | — | |
| | | | | | | | | | | | | | | | | | | | | | | | | | | | | | | | |
Total Proved Plus Probable | | | 7.0 | | | | 6.3 | | | | — | | | | — | | | | — | | | | — | | | | — | | | | — | |
| | | | | | | | | | | | | | | | | | | | | | | | | | | | | | | | |
| | | | |
| | | Coal Bed Methane
(bcf) | | | Natural Gas
(bcf) | | | NGL
(mmbbls) | | | Total
(mmboe) | |
| | | Gross | | | Net | | | Gross | | | Net | | | Gross | | | Net | | | Gross | | | Net | |
Proved | | | | | | | | | | | | | | | | | | | | | | | | | | | | | | | | |
Developed Producing | | | — | | | | — | | | | 341.0 | | | | 335.1 | | | | 10.2 | | | | 10.2 | | | | 73.3 | | | | 71.7 | |
Developed Non-producing | | | — | | | | — | | | | — | | | | — | | | | — | | | | — | | | | — | | | | — | |
Undeveloped | | | — | | | | — | | | | — | | | | — | | | | — | | | | — | | | | — | | | | — | |
| | | | | | | | | | | | | | | | | | | | | | | | | | | | | | | | |
Total Proved | | | — | | | | — | | | | 341.0 | | | | 335.1 | | | | 10.2 | | | | 10.2 | | | | 73.3 | | | | 71.7 | |
Probable | | | — | | | | — | | | | 171.9 | | | | 162.3 | | | | 4.8 | | | | 4.5 | | | | 34.1 | | | | 32.1 | |
| | | | | | | | | | | | | | | | | | | | | | | | | | | | | | | | |
Total Proved Plus Probable | | | — | | | | — | | | | 512.9 | | | | 497.5 | | | | 14.9 | | | | 14.7 | | | | 107.4 | | | | 103.9 | |
| | | | | | | | | | | | | | | | | | | | | | | | | | | | | | | | |
Indonesia(1)
| | | | | | | | | | | | | | | | | | | | | | | | | | | | | | | | |
| | | Light Crude Oil
(mmbbls) | | | Medium Crude Oil
(mmbbls) | | | Heavy Crude Oil
(mmbbls) | | | Bitumen
(mmbbls) | |
| | | Gross | | | Net | | | Gross | | | Net | | | Gross | | | Net | | | Gross | | | Net | |
Proved | | | | | | | | | | | | | | | | | | | | | | | | | | | | | | | | |
Developed Producing | | | — | | | | — | | | | — | | | | — | | | | — | | | | — | | | | — | | | | — | |
Developed Non-producing | | | — | | | | — | | | | — | | | | — | | | | — | | | | — | | | | — | | | | — | |
Undeveloped | | | — | | | | — | | | | — | | | | — | | | | — | | | | — | | | | — | | | | — | |
| | | | | | | | | | | | | | | | | | | | | | | | | | | | | | | | |
Total Proved | | | — | | | | — | | | | — | | | | — | | | | — | | | | — | | | | — | | | | — | |
Probable | | | — | | | | — | | | | — | | | | — | | | | — | | | | — | | | | — | | | | — | |
| | | | | | | | | | | | | | | | | | | | | | | | | | | | | | | | |
Total Proved Plus Probable | | | — | | | | — | | | | — | | | | — | | | | — | | | | — | | | | — | | | | — | |
| | | | | | | | | | | | | | | | | | | | | | | | | | | | | | | | |
| | | | |
| | | Coal Bed Methane
(bcf) | | | Natural Gas
(bcf) | | | NGL
(mmbbls) | | | Total
(mmboe) | |
| | | Gross | | | Net | | | Gross | | | Net | | | Gross | | | Net | | | Gross | | | Net | |
Proved | | | | | | | | | | | | | | | | | | | | | | | | | | | | | | | | |
Developed Producing | | | — | | | | — | | | | — | | | | — | | | | — | | | | — | | | | — | | | | — | |
Developed Non-producing | | | — | | | | — | | | | — | | | | — | | | | — | | | | — | | | | — | | | | — | |
Undeveloped | | | — | | | | — | | | | 167.2 | | | | 123.4 | | | | 7.2 | | | | 4.5 | | | | 35.0 | | | | 25.1 | |
| | | | | | | | | | | | | | | | | | | | | | | | | | | | | | | | |
Total Proved | | | — | | | | — | | | | 167.2 | | | | 123.4 | | | | 7.2 | | | | 4.5 | | | | 35.0 | | | | 25.1 | |
Probable | | | — | | | | — | | | | 155.8 | | | | 104.8 | | | | 1.7 | | | | 0.3 | | | | 27.6 | | | | 17.7 | |
| | | | | | | | | | | | | | | | | | | | | | | | | | | | | | | | |
Total Proved Plus Probable | | | — | | | | — | | | | 323.0 | | | | 228.1 | | | | 8.8 | | | | 4.8 | | | | 62.7 | | | | 42.8 | |
| | | | | | | | | | | | | | | | | | | | | | | | | | | | | | | | |
| (1) | Husky’s beneficial interest in the Madura Strait Block is held by way of a 40% interest in Husky—CNOOC Madura Limited (“HCML”), an entity that is party to a PSC with the Government of Indonesia. Husky has entered into a unanimous shareholder agreement dated April 8, 2008 with the other shareholders of HCML that provides for joint control of HCML. International Financial Reporting Standard 11, “Joint Arrangements” (“IFRS 11”), requires Husky to follow the equity method of accounting for its investment in the Madura Strait Block. IFRS 11 focuses on the legal form of the corporate structure in which Husky’s Madura assets are held. Husky holds its interest in the Madura Strait Block through HCML and accordingly is required to use the equity method to account for this interest. As a consequence, Husky sought and was granted by the Canadian Securities Administrators an exemption from the provisions in NI 51-101 which would have otherwise required Husky to exclude the reserves allocated to the Madura Strait Block from the total disclosed reserves and future net revenue of Husky and to only disclose those reserves separately because the Madura Strait Block is accounted for by the equity method of accounting. |
Libya
| | | | | | | | | | | | | | | | | | | | | | | | | | | | | | | | |
| | | Light Crude Oil
(mmbbls) | | | Medium Crude Oil
(mmbbls) | | | Heavy Crude Oil
(mmbbls) | | | Bitumen
(mmbbls) | |
| | | Gross | | | Net | | | Gross | | | Net | | | Gross | | | Net | | | Gross | | | Net | |
Proved | | | | | | | | | | | | | | | | | | | | | | | | | | | | | | | | |
Developed Producing | | | — | | | | — | | | | — | | | | — | | | | — | | | | — | | | | — | | | | — | |
Developed Non-producing | | | 0.1 | | | | 0.1 | | | | — | | | | — | | | | — | | | | — | | | | — | | | | — | |
Undeveloped | | | — | | | | — | | | | — | | | | — | | | | — | | | | — | | | | — | | | | — | |
| | | | | | | | | | | | | | | | | | | | | | | | | | | | | | | | |
Total Proved | | | 0.1 | | | | 0.1 | | | | — | | | | — | | | | — | | | | — | | | | — | | | | — | |
Probable | | | — | | | | — | | | | — | | | | — | | | | — | | | | — | | | | — | | | | — | |
| | | | | | | | | | | | | | | | | | | | | | | | | | | | | | | | |
Total Proved Plus Probable | | | 0.1 | | | | 0.1 | | | | — | | | | — | | | | — | | | | — | | | | — | | | | — | |
| | | | | | | | | | | | | | | | | | | | | | | | | | | | | | | | |
| | | | |
| | | Coal Bed Methane
(bcf) | | | Natural Gas
(bcf) | | | NGL
(mmbbls) | | | Total
(mmboe) | |
| | | Gross | | | Net | | | Gross | | | Net | | | Gross | | | Net | | | Gross | | | Net | |
Proved | | | | | | | | | | | | | | | | | | | | | | | | | | | | | | | | |
Developed Producing | | | — | | | | — | | | | — | | | | — | | | | — | | | | — | | | | — | | | | — | |
Developed Non-producing | | | — | | | | — | | | | — | | | | — | | | | — | | | | — | | | | 0.1 | | | | 0.1 | |
Undeveloped | | | — | | | | — | | | | — | | | | — �� | | | | — | | | | — | | | | — | | | | — | |
| | | | | | | | | | | | | | | | | | | | | | | | | | | | | | | | |
Total Proved | | | — | | | | — | | | | — | | | | — | | | | — | | | | — | | | | 0.1 | | | | 0.1 | |
Probable | | | — | | | | — | | | | — | | | | — | | | | — | | | | — | | | | — | | | | — | |
| | | | | | | | | | | | | | | | | | | | | | | | | | | | | | | | |
Total Proved Plus Probable | | | — | | | | — | | | | — | | | | — | | | | — | | | | — | | | | 0.1 | | | | 0.1 | |
| | | | | | | | | | | | | | | | | | | | | | | | | | | | | | | | |
Total
| | | | | | | | | | | | | | | | | | | | | | | | | | | | | | | | |
| | | Light Crude Oil
(mmbbls) | | | Medium Crude Oil
(mmbbls) | | | Heavy Crude Oil
(mmbbls) | | | Bitumen
(mmbbls) | |
| | | Gross | | | Net | | | Gross | | | Net | | | Gross | | | Net | | | Gross | | | Net | |
Proved | | | | | | | | | | | | | | | | | | | | | | | | | | | | | | | | |
Developed Producing | | | 113.9 | | | | 92.8 | | | | 78.0 | | | | 69.4 | | | | 77.7 | | | | 70.8 | | | | 56.4 | | | | 52.4 | |
Developed Non-producing | | | 2.4 | | | | 2.1 | | | | 1.5 | | | | 1.4 | | | | 11.6 | | | | 10.5 | | | | 64.8 | | | | 60.2 | |
Undeveloped | | | 22.4 | | | | 18.8 | | | | 5.5 | | | | 4.8 | | | | 16.7 | | | | 15.6 | | | | 299.0 | | | | 249.2 | |
| | | | | | | | | | | | | | | | | | | | | | | | | | | | | | | | |
Total Proved | | | 138.7 | | | | 113.6 | | | | 85.0 | | | | 75.6 | | | | 106.0 | | | | 96.8 | | | | 420.2 | | | | 361.8 | |
Probable | | | 137.4 | | | | 106.6 | | | | 22.2 | | | | 19.0 | | | | 55.5 | | | | 50.8 | | | | 1,497.2 | | | | 1,183.7 | |
| | | | | | | | | | | | | | | | | | | | | | | | | | | | | | | | |
Total Proved Plus Probable | | | 276.1 | | | | 220.3 | | | | 107.2 | | | | 94.7 | | | | 161.5 | | | | 147.7 | | | | 1,917.4 | | | | 1,545.6 | |
| | | | | | | | | | | | | | | | | | | | | | | | | | | | | | | | |
| | | | |
| | | Coal Bed Methane
(bcf) | | | Natural Gas
(bcf) | | | NGL
(mmbbls) | | | Total
(mmboe) | |
| | | Gross | | | Net | | | Gross | | | Net | | | Gross | | | Net | | | Gross | | | Net | |
Proved | | | | | | | | | | | | | | | | | | | | | | | | | | | | | | | | |
Developed Producing | | | 19.3 | | | | 18.2 | | | | 1,914.0 | | | | 1,706.8 | | | | 63.7 | | | | 48.5 | | | | 712.0 | | | | 621.4 | |
Developed Non-producing | | | — | | | | — | | | | 79.8 | | | | 72.5 | | | | 1.0 | | | | 0.8 | | | | 94.7 | | | | 87.0 | |
Undeveloped | | | — | | | | — | | | | 648.7 | | | | 596.8 | | | | 20.6 | | | | 15.6 | | | | 472.2 | | | | 403.4 | |
| | | | | | | | | | | | | | | | | | | | | | | | | | | | | | | | |
Total Proved | | | 19.3 | | | | 18.2 | | | | 2,642.5 | | | | 2,376.1 | | | | 85.3 | | | | 64.8 | | | | 1,278.8 | | | | 1,111.9 | |
Probable | | | 3.0 | | | | 2.8 | | | | 808.6 | | | | 706.7 | | | | 22.8 | | | | 17.2 | | | | 1,870.4 | | | | 1,495.7 | |
| | | | | | | | | | | | | | | | | | | | | | | | | | | | | | | | |
Total Proved Plus Probable | | | 22.3 | | | | 21.0 | | | | 3,451.0 | | | | 3,082.8 | | | | 108.1 | | | | 82.0 | | | | 3,149.2 | | | | 2,607.5 | |
| | | | | | | | | | | | | | | | | | | | | | | | | | | | | | | | |
Summary of Net Present Values of Future Net Revenue—Before Income Taxes and Discounted
As at December 31, 2014
Forecast Prices and Costs
Canada
| | | | | | | | | | | | | | | | |
| | | Before Income Taxes and Discounted at (%/year) | |
($ millions) | | 5% | | | 10% | | | 15% | | | 20% | |
Proved | | | | | | | | | | | | | | | | |
Developed Producing | | | 6,552 | | | | 5,982 | | | | 5,379 | | | | 4,873 | |
Developed Non-producing | | | 1,888 | | | | 1,419 | | | | 1,100 | | | | 872 | |
Undeveloped | | | 6,051 | | | | 3,509 | | | | 2,150 | | | | 1,337 | |
| | | | | | | | | | | | | | | | |
Total Proved | | | 14,491 | | | | 10,910 | | | | 8,629 | | | | 7,082 | |
Probable | | | 26,101 | | | | 13,541 | | | | 8,408 | | | | 5,740 | |
| | | | | | | | | | | | | | | | |
Total Proved Plus Probable | | | 40,592 | | | | 24,451 | | | | 17,037 | | | | 12,822 | |
| | | | | | | | | | | | | | | | |
| | | | |
China | | | | | | | | | | | | | | | | |
| |
| | | Before Income Taxes and Discounted at (%/year) | |
($ millions) | | 5% | | | 10% | | | 15% | | | 20% | |
Proved | | | | | | | | | | | | | | | | |
Developed Producing | | | 3,654 | | | | 3,318 | | | | 3,032 | | | | 2,790 | |
Developed Non-producing | | | — | | | | — | | | | — | | | | — | |
Undeveloped | | | — | | | | — | | | | — | | | | — | |
| | | | | | | | | | | | | | | | |
Total Proved | | | 3,654 | | | | 3,318 | | | | 3,032 | | | | 2,790 | |
Probable | | | 1,608 | | | | 1,173 | | | | 881 | | | | 679 | |
| | | | | | | | | | | | | | | | |
Total Proved Plus Probable | | | 5,262 | | | | 4,491 | | | | 3,913 | | | | 3,469 | |
| | | | | | | | | | | | | | | | |
| | | | |
Indonesia | | | | | | | | | | | | | | | | |
| |
| | | Before Income Taxes and Discounted at (%/year) | |
($ millions) | | 5% | | | 10% | | | 15% | | | 20% | |
Proved | | | | | | | | | | | | | | | | |
Developed Producing | | | — | | | | — | | | | — | | | | — | |
Developed Non-producing | | | — | | | | — | | | | — | | | | — | |
Undeveloped | | | 296 | | | | 184 | | | | 109 | | | | 57 | |
| | | | | | | | | | | | | | | | |
Total Proved | | | 296 | | | | 184 | | | | 109 | | | | 57 | |
Probable | | | 260 | | | | 154 | | | | 88 | | | | 47 | |
| | | | | | | | | | | | | | | | |
Total Proved Plus Probable | | | 556 | | | | 338 | | | | 197 | | | | 103 | |
| | | | | | | | | | | | | | | | |
| | | | |
Libya | | | | | | | | | | | | | | | | |
| |
| | | Before Income Taxes and Discounted at (%/year) | |
($ millions) | | 5% | | | 10% | | | 15% | | | 20% | |
Proved | | | | | | | | | | | | | | | | |
Developed Producing | | | — | | | | — | | | | — | | | | — | |
Developed Non-producing | | | 2 | | | | 2 | | | | 1 | | | | 1 | |
Undeveloped | | | — | | | | — | | | | — | | | | — | |
| | | | | | | | | | | | | | | | |
Total Proved | | | 2 | | | | 2 | | | | 1 | | | | 1 | |
Probable | | | — | | | | — | | | | — | | | | — | |
| | | | | | | | | | | | | | | | |
Total Proved Plus Probable | | | 2 | | | | 2 | | | | 2 | | | | 2 | |
| | | | | | | | | | | | | | | | |
Total
| | | | | | | | | | | | | | | | |
| | | Before Income Taxes and Discounted at (%/year) | |
($ millions) | | 5% | | | 10% | | | 15% | | | 20% | |
Proved | | | | | | | | | | | | | | | | |
Developed Producing | | | 10,206 | | | | 9,300 | | | | 8,411 | | | | 7,663 | |
Developed Non-producing | | | 1,890 | | | | 1,420 | | | | 1,101 | | | | 873 | |
Undeveloped | | | 6,347 | | | | 3,693 | | | | 2,259 | | | | 1,394 | |
| | | | | | | | | | | | | | | | |
Total Proved | | | 18,443 | | | | 14,414 | | | | 11,771 | | | | 9,930 | |
Probable | | | 27,969 | | | | 14,868 | | | | 9,377 | | | | 6,466 | |
| | | | | | | | | | | | | | | | |
Total Proved Plus Probable | | | 46,412 | | | | 29,282 | | | | 21,149 | | | | 16,396 | |
| | | | | | | | | | | | | | | | |
Summary of Net Present Values of Future Net Revenue—After Income Taxes and Discounted
As at December 31, 2014
Forecast Prices and Costs
Canada
| | | | | | | | | | | | | | | | |
| | | After Income Taxes and Discounted at (%/year) | |
($ millions) | | 5% | | | 10% | | | 15% | | | 20% | |
Proved | | | | | | | | | | | | | | | | |
Developed Producing | | | 4,774 | | | | 4,348 | | | | 3,901 | | | | 3,528 | |
Developed Non-producing | | | 1,490 | | | | 1,119 | | | | 867 | | | | 687 | |
Undeveloped | | | 4,354 | | | | 2,389 | | | | 1,340 | | | | 713 | |
| | | | | | | | | | | | | | | | |
Total Proved | | | 10,618 | | | | 7,856 | | | | 6,108 | | | | 4,928 | |
Probable | | | 18,942 | | | | 9,546 | | | | 5,740 | | | | 3,784 | |
| | | | | | | | | | | | | | | | |
Total Proved Plus Probable | | | 29,560 | | | | 17,402 | | | | 11,847 | | | | 8,712 | |
| | | | | | | | | | | | | | | | |
| | | | |
China | | | | | | | | | | | | | | | | |
| |
| | | After Income Taxes and Discounted at (%/year) | |
($ millions) | | 5% | | | 10% | | | 15% | | | 20% | |
Proved | | | | | | | | | | | | | | | | |
Developed Producing | | | 3,197 | | | | 2,894 | | | | 2,640 | | | | 2,424 | |
Developed Non-producing | | | — | | | | — | | | | — | | | | — | |
Undeveloped | | | — | | | | — | | | | — | | | | — | |
| | | | | | | | | | | | | | | | |
Total Proved | | | 3,197 | | | | 2,894 | | | | 2,640 | | | | 2,424 | |
Probable | | | 1,309 | | | | 952 | | | | 711 | | | | 545 | |
| | | | | | | | | | | | | | | | |
Total Proved Plus Probable | | | 4,506 | | | | 3,846 | | | | 3,351 | | | | 2,969 | |
| | | | | | | | | | | | | | | | |
| | | | |
Indonesia | | | | | | | | | | | | | | | | |
| |
| | | After Income Taxes and Discounted at (%/year) | |
($ millions) | | 5% | | | 10% | | | 15% | | | 20% | |
Proved | | | | | | | | | | | | | | | | |
Developed Producing | | | — | | | | — | | | | — | | | | — | |
Developed Non-producing | | | — | | | | — | | | | — | | | | — | |
Undeveloped | | | 192 | | | | 110 | | | | 54 | | | | 15 | |
| | | | | | | | | | | | | | | | |
Total Proved | | | 192 | | | | 110 | | | | 54 | | | | 15 | |
Probable | | | 176 | | | | 97 | | | | 48 | | | | 16 | |
| | | | | | | | | | | | | | | | |
Total Proved Plus Probable | | | 368 | | | | 206 | | | | 101 | | | | 31 | |
| | | | | | | | | | | | | | | | |
| | | | |
| Libya | | | | | | | | | | | | | | | | |
| |
| | | After Income Taxes and Discounted at (%/year) | |
($ millions) | | 5% | | | 10% | | | 15% | | | 20% | |
Proved | | | | | | | | | | | | | | | | |
Developed Producing | | | — | | | | — | | | | — | | | | — | |
Developed Non-producing | | | 2 | | | | 2 | | | | 1 | | | | 1 | |
Undeveloped | | | — | | | | — | | | | — | | | | — | |
| | | | | | | | | | | | | | | | |
Total Proved | | | 2 | | | | 2 | | | | 1 | | | | 1 | |
Probable | | | — | | | | — | | | | — | | | | — | |
| | | | | | | | | | | | | | | | |
Total Proved Plus Probable | | | 2 | | | | 2 | | | | 2 | | | | 2 | |
| | | | | | | | | | | | | | | | |
Total
| | | | | | | | | | | | | | | | |
| | | After Income Taxes and Discounted at (%/year) | |
($ millions) | | 5% | | | 10% | | | 15% | | | 20% | |
Proved | | | | | | | | | | | | | | | | |
Developed Producing | | | 7,971 | | | | 7,243 | | | | 6,540 | | | | 5,953 | |
Developed Non-producing | | | 1,491 | | | | 1,121 | | | | 868 | | | | 688 | |
Undeveloped | | | 4,546 | | | | 2,499 | | | | 1,393 | | | | 728 | |
| | | | | | | | | | | | | | | | |
Total Proved | | | 14,009 | | | | 10,862 | | | | 8,802 | | | | 7,369 | |
Probable | | | 20,428 | | | | 10,594 | | | | 6,499 | | | | 4,345 | |
| | | | | | | | | | | | | | | | |
Total Proved Plus Probable | | | 34,437 | | | | 21,456 | | | | 15,301 | | | | 11,714 | |
| | | | | | | | | | | | | | | | |
Total Future Net Revenue for Total Proved Plus Probable Reserves—Undiscounted
As at December 31, 2014
Forecast Prices and Costs
| | | | | | | | | | | | | | | | | | | | | | | | | | | | | | | | |
($ millions) | | Revenue | | | Royalties | | | Operating
Costs | | | Development
Costs(1) | | | Abandonment
and
Reclamation
Costs(1) | | | Future Net
Revenue
Before
Income
Taxes | | | Income
Taxes | | | Future Net
Revenue
After
Income
Taxes | |
Canada | | | | | | | | | | | | | | | | | | | | | | | | | | | | | | | | |
Proved | | | | | | | | | | | | | | | | | | | | | | | | | | | | | | | | |
Developed Producing | | | 38,899 | | | | 6,221 | | | | 15,707 | | | | 1,374 | | | | 10,183 | | | | 5,414 | | | | 1,482 | | | | 3,932 | |
Developed Non-producing | | | 5,661 | | | | 531 | | | | 2,018 | | | | 485 | | | | — | | | | 2,627 | | | | 556 | | | | 2,071 | |
Undeveloped | | | 31,100 | | | | 5,309 | | | | 7,385 | | | | 6,515 | | | | 306 | | | | 11,586 | | | | 2,952 | | | | 8,634 | |
| | | | | | | | | | | | | | | | | | | | | | | | | | | | | | | | |
Total Proved | | | 75,660 | | | | 12,061 | | | | 25,110 | | | | 8,374 | | | | 10,489 | | | | 19,627 | | | | 4,990 | | | | 14,637 | |
Probable | | | 172,268 | | | | 38,141 | | | | 37,218 | | | | 25,341 | | | | 669 | | | | 70,899 | | | | 18,165 | | | | 52,733 | |
| | | | | | | | | | | | | | | | | | | | | | | | | | | | | | | | |
Total Proved Plus Probable | | | 247,929 | | | | 50,202 | | | | 62,328 | | | | 33,715 | | | | 11,158 | | | | 90,525 | | | | 23,155 | | | | 67,370 | |
| | | | | | | | | | | | | | | | | | | | | | | | | | | | | | | | |
China | | | | | | | | | | | | | | | | | | | | | | | | | | | | | | | | |
Proved | | | | | | | | | | | | | | | | | | | | | | | | | | | | | | | | |
Developed Producing | | | 5,748 | | | | — | | | | 1,134 | | | | 241 | | | | 326 | | | | 4,046 | | | | 491 | | | | 3,555 | |
Developed Non-producing | | | — | | | | — | | | | — | | | | — | | | | — | | | | — | | | | — | | | | — | |
Undeveloped | | | — | | | | — | | | | — | | | | — | | | | — | | | | — | | | | — | | | | — | |
| | | | | | | | | | | | | | | | | | | | | | | | | | | | | | | | |
Total Proved | | | 5,748 | | | | — | | | | 1,134 | | | | 241 | | | | 326 | | | | 4,046 | | | | 491 | | | | 3,555 | |
Probable | | | 2,689 | | | | — | | | | 412 | | | | — | | | | — | | | | 2,277 | | | | 419 | | | | 1,858 | |
| | | | | | | | | | | | | | | | | | | | | | | | | | | | | | | | |
Total Proved Plus Probable | | | 8,436 | | | | — | | | | 1,546 | | | | 241 | | | | 326 | | | | 6,323 | | | | 910 | | | | 5,412 | |
| | | | | | | | | | | | | | | | | | | | | | | | | | | | | | | | |
Indonesia | | | | | | | | | | | | | | | | | | | | | | | | | | | | | | | | |
Proved | | | | | | | | | | | | | | | | | | | | | | | | | | | | | | | | |
Developed Producing | | | — | | | | — | | | | — | | | | — | | | | — | | | | — | | | | — | | | | — | |
Developed Non-producing | | | — | | | | — | | | | — | | | | — | | | | — | | | | — | | | | — | | | | — | |
Undeveloped | | | 1,381 | | | | — | | | | 701 | | | | 211 | | | | — | | | | 468 | | | | 151 | | | | 318 | |
| | | | | | | | | | | | | | | | | | | | | | | | | | | | | | | | |
Total Proved | | | 1,381 | | | | — | | | | 701 | | | | 211 | | | | — | | | | 468 | | | | 151 | | | | 318 | |
Probable | | | 1,149 | | | | — | | | | 559 | | | | 147 | | | | — | | | | 443 | | | | 132 | | | | 311 | |
| | | | | | | | | | | | | | | | | | | | | | | | | | | | | | | | |
Total Proved Plus Probable | | | 2,529 | | | | — | | | | 1,260 | | | | 358 | | | | — | | | | 912 | | | | 283 | | | | 629 | |
| | | | | | | | | | | | | | | | | | | | | | | | | | | | | | | | |
Libya | | | | | | | | | | | | | | | | | | | | | | | | | | | | | | | | |
Proved | | | | | | | | | | | | | | | | | | | | | | | | | | | | | | | | |
Developed Producing | | | — | | | | — | | | | — | | | | — | | | | — | | | | — | | | | — | | | | — | |
Developed Non-producing | | | 4 | | | | — | | | | 2 | | | | 1 | | | | — | | | | 2 | | | | — | | | | 2 | |
Undeveloped | | | — | | | | — | | | | — | | | | — | | | | — | | | | — | | | | — | | | | — | |
| | | | | | | | | | | | | | | | | | | | | | | | | | | | | | | | |
Total Proved | | | 4 | | | | — | | | | 2 | | | | 1 | | | | — | | | | 2 | | | | — | | | | 2 | |
Probable | | | — | | | | — | | | | — | | | | — | | | | — | | | | — | | | | — | | | | — | |
| | | | | | | | | | | | | | | | | | | | | | | | | | | | | | | | |
Total Proved Plus Probable | | | 5 | | | | — | | | | 2 | | | | 1 | | | | — | | | | 2 | | | | — | | | | 2 | |
| | | | | | | | | | | | | | | | | | | | | | | | | | | | | | | | |
Total | | | | | | | | | | | | | | | | | | | | | | | | | | | | | | | | |
Proved | | | | | | | | | | | | | | | | | | | | | | | | | | | | | | | | |
Developed Producing | | | 44,647 | | | | 6,221 | | | | 16,841 | | | | 1,615 | | | | 10,509 | | | | 9,460 | | | | 1,973 | | | | 7,487 | |
Developed Non-producing | | | 5,665 | | | | 531 | | | | 2,020 | | | | 486 | | | | — | | | | 2,628 | | | | 556 | | | | 2,072 | |
Undeveloped | | | 32,481 | | | | 5,309 | | | | 8,086 | | | | 6,726 | | | | 306 | | | | 12,054 | | | | 3,102 | | | | 8,952 | |
| | | | | | | | | | | | | | | | | | | | | | | | | | | | | | | | |
Total Proved | | | 82,793 | | | | 12,061 | | | | 26,947 | | | | 8,827 | | | | 10,815 | | | | 24,143 | | | | 5,632 | | | | 18,511 | |
Probable | | | 176,106 | | | | 38,141 | | | | 38,189 | | | | 25,488 | | | | 669 | | | | 73,619 | | | | 18,717 | | | | 54,902 | |
| | | | | | | | | | | | | | | | | | | | | | | | | | | | | | | | |
Total Proved Plus Probable | | | 258,899 | | | | 50,202 | | | | 65,136 | | | | 34,316 | | | | 11,484 | | | | 97,762 | | | | 24,348 | | | | 73,414 | |
| | | | | | | | | | | | | | | | | | | | | | | | | | | | | | | | |
Future Net Revenue by Production Group
As at December 31, 2014
Forecast Prices and Costs
| | | | | | | | | | | | | | | | | | | | | | | | | | | | | | | | | | | | | | | | |
| | | Future Net Revenue Before Income Taxes (discounted at 10%/year) | |
| | | Canada | | | China | | | Indonesia | | | Libya | | | Total | |
| | | ($ millions) | | | ($/boe) | | | ($ millions) | | | ($/boe) | | | ($ millions) | | | ($/boe) | | | ($ millions) | | | ($/boe) | | | ($ millions) | | | ($/boe) | |
Proved | | | | | | | | | | | | | | | | | | | | | | | | | | | | | | | | | | | | | | | | |
Developed Producing | | | | | | | | | | | | | | | | | | | | | | | | | | | | | | | | | | | | | |
Light Crude Oil & NGL | | | 1,367 | | | | 13 | | | | 302 | | | | 19 | | | | — | | | | — | | | | — | | | | — | | | | 1,668 | | | | 14 | |
Medium Crude Oil | | | 1,606 | | | | 23 | | | | — | | | | — | | | | — | | | | — | | | | — | | | | — | | | | 1,606 | | | | 23 | |
Heavy Crude Oil | | | 584 | | | | 8 | | | | — | | | | — | | | | — | | | | — | | | | — | | | | — | | | | 584 | | | | 8 | |
Natural Gas | | | 1,234 | | | | 5 | | | | 3,016 | | | | 53 | | | | — | | | | — | | | | — | | | | — | | | | 4,250 | | | | 14 | |
Coal Bed Methane | | | 15 | | | | 5 | | | | — | | | | — | | | | — | | | | — | | | | — | | | | — | | | | 15 | | | | 5 | |
Bitumen | | | 1,177 | | | | 22 | | | | — | | | | — | | | | — | | | | — | | | | — | | | | — | | | | 1,177 | | | | 22 | |
Developed Non-producing | | | | | | | | | | | | | | | | | | | | | | | | | | | | | | | | | | | | | |
Light Crude Oil & NGL | | | 76 | | | | 37 | | | | — | | | | — | | | | — | | | | — | | | | 2 | | | | 30 | | | | 77 | | | | 37 | |
Medium Crude Oil | | | 25 | | | | 18 | | | | — | | | | — | | | | — | | | | — | | | | — | | | | — | | | | 25 | | | | 18 | |
Heavy Crude Oil | | | 278 | | | | 26 | | | | — | | | | — | | | | — | | | | — | | | | — | | | | — | | | | 278 | | | | 26 | |
Natural Gas | | | 78 | | | | 6 | | | | — | | | | — | | | | — | | | | — | | | | — | | | | — | | | | 78 | | | | 6 | |
Coal Bed Methane | | | — | | | | — | | | | — | | | | — | | | | — | | | | — | | | | — | | | | — | | | | — | | | | — | |
Bitumen | | | 963 | | | | 16 | | | | — | | | | — | | | | — | | | | — | | | | — | | | | — | | | | 963 | | | | 16 | |
Undeveloped | | | | | | | | | | | | | | | | | | | | | | | | | | | | | | | | | | | | | |
Light Crude Oil & NGL | | | 226 | | | | 12 | | | | — | | | | — | | | | — | | | | — | | | | — | | | | — | | | | 226 | | | | 12 | |
Medium Crude Oil | | | 82 | | | | 17 | | | | — | | | | — | | | | — | | | | — | | | | — | | | | — | | | | 82 | | | | 17 | |
Heavy Crude Oil | | | 145 | | | | 9 | | | | — | | | | — | | | | — | | | | — | | | | — | | | | — | | | | 145 | | | | 9 | |
Natural Gas | | | 214 | | | | 2 | | | | — | | | | — | | | | 184 | | | | 7 | | | | — | | | | — | | | | 398 | | | | 3 | |
Coal Bed Methane | | | — | | | | — | | | | — | | | | — | | | | — | | | | — | | | | — | | | | — | | | | — | | | | — | |
Bitumen | | | 2,842 | | | | 11 | | | | — | | | | — | | | | — | | | | — | | | | — | | | | — | | | | 2,842 | | | | 11 | |
Total Proved | | | | | | | | | | | | | | | | | | | | | | | | | | | | | | | | | | | | | |
Light Crude Oil & NGL | | | 1,669 | | | | 13 | | | | 302 | | | | 19 | | | | — | | | | — | | | | 2 | | | | 30 | | | | 1,972 | | | | 14 | |
Medium Crude Oil | | | 1,712 | | | | 23 | | | | — | | | | — | | | | — | | | | — | | | | — | | | | — | | | | 1,712 | | | | 23 | |
Heavy Crude Oil | | | 1,006 | | | | 10 | | | | — | | | | — | | | | — | | | | — | | | | — | | | | — | | | | 1,006 | | | | 10 | |
Natural Gas | | | 1,526 | | | | 4 | | | | 3,016 | | | | 53 | | | | 184 | | | | 7 | | | | — | | | | — | | | | 4,726 | | | | 11 | |
Coal Bed Methane | | | 15 | | | | 5 | | | | — | | | | — | | | | — | | | | — | | | | — | | | | — | | | | 15 | | | | 5 | |
Bitumen | | | 4,983 | | | | 14 | | | | — | | | | — | | | | — | | | | — | | | | — | | | | — | | | | 4,983 | | | | 14 | |
Probable | | | | | | | | | | | | | | | | | | | | | | | | | | | | | | | | | | | | | |
Light Crude Oil & NGL | | | 3,398 | | | | 30 | | | | 46 | | | | 9 | | | | — | | | | — | | | | — | | | | 76 | | | | 3,443 | | | | 29 | |
Medium Crude Oil | | | 415 | | | | 22 | | | | — | | | | — | | | | — | | | | — | | | | — | | | | — | | | | 415 | | | | 22 | |
Heavy Crude Oil | | | 1,162 | | | | 23 | | | | — | | | | — | | | | — | | | | — | | | | — | | | | — | | | | 1,162 | | | | 23 | |
Natural Gas | | | 578 | | | | 7 | | | | 1,128 | | | | 39 | | | | 154 | | | | 9 | | | | — | | | | — | | | | 1,859 | | | | 15 | |
Coal Bed Methane | | | 3 | | | | 6 | | | | — | | | | — | | | | — | | | | — | | | | — | | | | — | | | | 3 | | | | 6 | |
Bitumen | | | 7,985 | | | | 7 | | | | — | | | | — | | | | — | | | | — | | | | — | | | | — | | | | 7,985 | | | | 7 | |
Total Proved Plus Probable | | | | | | | | | | | | | | | | | | | | | | | | | | | | | | | | | | | | | |
Light Crude Oil & NGL | | | 5,066 | | | | 21 | | | | 347 | | | | 17 | | | | — | | | | — | | | | 2 | | | | 33 | | | | 5,415 | | | | 21 | |
Medium Crude Oil | | | 2,127 | | | | 22 | | | | — | | | | — | | | | — | | | | — | | | | — | | | | — | | | | 2,127 | | | | 22 | |
Heavy Crude Oil | | | 2,169 | | | | 15 | | | | — | | | | — | | | | — | | | | — | | | | — | | | | — | | | | 2,169 | | | | 15 | |
Natural Gas | | | 2,104 | | | | 5 | | | | 4,144 | | | | 48 | | | | 338 | | | | 8 | | | | — | | | | — | | | | 6,585 | | | | 12 | |
Coal Bed Methane | | | 18 | | | | 5 | | | | — | | | | — | | | | — | | | | — | | | | — | | | | — | | | | 18 | | | | 5 | |
Bitumen | | | 12,968 | | | | 8 | | | | — | | | | — | | | | — | | | | — | | | | — | | | | — | | | | 12,968 | | | | 8 | |
Pricing Assumptions
The pricing assumptions disclosed in the table below were derived using the industry averages prescribed by McDaniel, Sproule and GLJ Petroleum Consultants Ltd.
| | | | | | | | | | | | | | | | | | | | | | | | |
| | | Crude Oil | | | Natural Gas | | | | |
| | | WTI
(USD $/bbl) | | | Brent
(USD $/bbl) | | | NYMEX
(USD $/mmbtu) | | | NIT
(Cdn $/GJ) | | | Inflation
rates(1) | | | Exchange
rates(2) | |
Historical | | | | | | | | | | | | | | | | | | | | | | | | |
2010 | | | 79.46 | | | | 79.42 | | | | 4.39 | | | | 3.91 | | | | — | | | | 0.971 | |
2011 | | | 95.12 | | | | 111.27 | | | | 4.04 | | | | 3.48 | | | | — | | | | 1.011 | |
2012 | | | 94.21 | | | | 111.54 | | | | 2.79 | | | | 2.28 | | | | — | | | | 1.001 | |
2013 | | | 97.97 | | | | 107.91 | | | | 3.65 | | | | 3.00 | | | | — | | | | 0.971 | |
2014 | | | 93.04 | | | | 99.52 | | | | 4.32 | | | | 4.47 | | | | — | | | | 0.905 | |
| | | | | | | | | | | | | | | | | | | | | | | | |
Forecast | | | | | | | | | | | | | | | | | | | | | | | | |
2015 | | | 64.17 | | | | 68.50 | | | | 3.29 | | | | 3.38 | | | | 1.833 | | | | 0.853 | |
2016 | | | 76.67 | | | | 81.03 | | | | 3.77 | | | | 3.83 | | | | 1.833 | | | | 0.868 | |
2017 | | | 83.33 | | | | 87.70 | | | | 4.02 | | | | 4.06 | | | | 1.833 | | | | 0.868 | |
2018 | | | 87.08 | | | | 90.67 | | | | 4.35 | | | | 4.41 | | | | 1.833 | | | | 0.868 | |
2019 | | | 90.67 | | | | 94.27 | | | | 4.68 | | | | 4.76 | | | | 1.833 | | | | 0.868 | |
| (1) | Inflation rates for forecasting prices and costs. |
| (2) | Exchange rate used to generate the benchmark reference prices. |
Reconciliation of Gross Proved Reserves
| | | | | | | | | | | | | | | | | | | | | | | | |
| | | Light
Crude Oil &
NGL
(mmbbls) | | | Medium
Crude Oil
(mmbbls) | | | Heavy
Crude Oil
(mmbbls) | | | Natural Gas
(bcf) | | | Bitumen
(mmbbls) | | | Total
(mmboe) | |
Canada—Western Canada | | | | | | | | | | | | | | | | | | | | | | | | |
End of 2013 | | | 166.0 | | | | 90.7 | | | | 113.5 | | | | 2,174.9 | | | | 359.1 | | | | 1,091.7 | |
Revisions—Technical | | | (29.2 | ) | | | (0.1 | ) | | | 22.5 | | | | 64.5 | | | | (6.3 | ) | | | (2.4 | ) |
Revisions—Economic | | | (0.1 | ) | | | 0.5 | | | | (1.2 | ) | | | (22.7 | ) | | | 0.1 | | | | (4.5 | ) |
Purchases | | | — | | | | — | | | | 1.9 | | | | 0.4 | | | | 0.8 | | | | 2.8 | |
Sales | | | (0.1 | ) | | | — | | | | (6.7 | ) | | | (1.4 | ) | | | — | | | | (7.1 | ) |
Discoveries | | | 0.1 | | | | — | | | | — | | | | — | | | | 4.0 | | | | 4.1 | |
Extensions | | | 11.1 | | | | 1.7 | | | | 15.8 | | | | 122.6 | | | | 55.1 | | | | 104.1 | |
Improved Recovery | | | 0.5 | | | | — | | | | 4.4 | | | | 0.2 | | | | 11.3 | | | | 16.1 | |
Production | | | (11.0 | ) | | | (7.8 | ) | | | (44.0 | ) | | | (185.0 | ) | | | (4.0 | ) | | | (97.6 | ) |
| | | | | | | | | | | | | | | | | | | | | | | | |
End of 2014 | | | 137.1 | | | | 85.0 | | | | 106.0 | | | | 2,153.5 | | | | 420.2 | | | | 1,107.3 | |
| | | | | | | | | | | | | | | | | | | | | | | | |
Canada—Atlantic Region | | | | | | | | | | | | | | | | | | | | | | | | |
End of 2013 | | | 74.5 | | | | — | | | | — | | | | — | | | | — | | | | 74.5 | |
Revisions—Technical | | | 4.9 | | | | — | | | | — | | | | — | | | | — | | | | 4.9 | |
Revisions—Economic | | | — | | | | — | | | | — | | | | — | | | | — | | | | — | |
Purchases | | | — | | | | — | | | | — | | | | — | | | | — | | | | — | |
Sales | | | — | | | | — | | | | — | | | | — | | | | — | | | | — | |
Discoveries | | | — | | | | — | | | | — | | | | — | | | | — | | | | — | |
Extensions | | | — | | | | — | | | | — | | | | — | | | | — | | | | — | |
Improved Recovery | | | — | | | | — | | | | — | | | | — | | | | — | | | | — | |
Production | | | (16.3 | ) | | | — | | | | — | | | | — | | | | — | | | | (16.3 | ) |
| | | | | | | | | | | | | | | | | | | | | | | | |
End of 2014 | | | 63.1 | | | | — | | | | — | | | | — | | | | — | | | | 63.1 | |
| | | | | | | | | | | | | | | | | | | | | | | | |
China | | | | | | | | | | | | | | | | | | | | | | | | |
End of 2013 | | | 16.0 | | | | — | | | | — | | | | 284.7 | | | | — | | | | 63.4 | |
Revisions—Technical | | | 2.8 | | | | — | | | | — | | | | 98.0 | | | | — | | | | 19.1 | |
Revisions—Economic | | | — | | | | — | | | | — | | | | — | | | | — | | | | — | |
Purchases | | | — | | | | — | | | | — | | | | — | | | | — | | | | — | |
Sales | | | — | | | | — | | | | — | | | | — | | | | — | | | | — | |
Discoveries | | | — | | | | — | | | | — | | | | — | | | | — | | | | — | |
Extensions | | | 1.0 | | | | — | | | | — | | | | — | | | | — | | | | 1.0 | |
Improved Recovery | | | — | | | | — | | | | — | | | | — | | | | — | | | | — | |
Production | | | (3.3 | ) | | | — | | | | — | | | | (41.7 | ) | | | — | | | | (10.3 | ) |
| | | | | | | | | | | | | | | | | | | | | | | | |
End of 2014 | | | 16.5 | | | | — | | | | — | | | | 341.0 | | | | — | | | | 73.3 | |
| | | | | | | | | | | | | | | | | | | | | | | | |
Indonesia | | | | | | | | | | | | | | | | | | | | | | | | |
End of 2013 | | | 7.2 | | | | — | | | | — | | | | 167.2 | | | | — | | | | 35.0 | |
Revisions—Technical | | | — | | | | — | | | | — | | | | — | | | | — | | | | — | |
Revisions—Economic | | | — | | | | — | | | | — | | | | — | | | | — | | | | — | |
Purchases | | | — | | | | — | | | | — | | | | — | | | | — | | | | — | |
Sales | | | — | | | | — | | | | — | | | | — | | | | — | | | | — | |
Discoveries | | | — | | | | — | | | | — | | | | — | | | | — | | | | — | |
Extensions | | | — | | | | — | | | | — | | | | — | | | | — | | | | — | |
Improved Recovery | | | — | | | | — | | | | — | | | | — | | | | — | | | | — | |
Production | | | — | | | | — | | | | — | | | | — | | | | — | | | | — | |
| | | | | | | | | | | | | | | | | | | | | | | | |
End of 2014 | | | 7.2 | | | | — | | | | — | | | | 167.2 | | | | — | | | | 35.0 | |
| | | | | | | | | | | | | | | | | | | | | | | | |
| | | | | | | | | | | | | | | | | | | | | | | | |
| | | Light
Crude Oil &
NGL
(mmbbls) | | | Medium
Crude Oil
(mmbbls) | | | Heavy
Crude Oil
(mmbbls) | | | Natural Gas
(bcf) | | | Bitumen
(mmbbls) | | | Total
(mmboe) | |
Libya | | | | | | | | | | | | | | | | | | | | | | | | |
End of 2013 | | | 0.1 | | | | — | | | | — | | | | — | | | | — | | | | 0.1 | |
Revisions—Technical | | | — | | | | — | | | | — | | | | — | | | | — | | | | — | |
Revisions—Economic | | | — | | | | — | | | | — | | | | — | | | | — | | | | — | |
Purchases | | | — | | | | — | | | | — | | | | — | | | | — | | | | — | |
Sales | | | — | | | | — | | | | — | | | | — | | | | — | | | | — | |
Discoveries | | | — | | | | — | | | | — | | | | — | | | | — | | | | — | |
Extension | | | — | | | | — | | | | — | | | | — | | | | — | | | | — | |
Improved Recovery | | | — | | | | — | | | | — | | | | — | | | | — | | | | — | |
Production | | | — | | | | — | | | | — | | | | — | | | | — | | | | — | |
| | | | | | | | | | | | | | | | | | | | | | | | |
End of 2014 | | | 0.1 | | | | — | | | | — | | | | — | | | | — | | | | 0.1 | |
| | | | | | | | | | | | | | | | | | | | | | | | |
| | | | | | |
| | | Light
Crude Oil &
NGL
(mmbbls) | | | Medium
Crude Oil
(mmbbls) | | | Heavy
Crude Oil
(mmbbls) | | | Natural Gas
(bcf) | | | Bitumen
(mmbbls) | | | Total
Company
(mmboe) | |
Total | | | | | | | | | | | | | | | | | | | | | | | | |
End of 2013 | | | 263.6 | | | | 90.7 | | | | 113.5 | | | | 2,626.8 | | | | 359.1 | | | | 1,264.7 | |
Revisions—Technical | | | (21.5 | ) | | | (0.1 | ) | | | 22.5 | | | | 162.5 | | | | (6.3 | ) | | | 21.7 | |
Revisions—Economic | | | (0.1 | ) | | | 0.5 | | | | (1.2 | ) | | | (22.7 | ) | | | 0.1 | | | | (4.5 | ) |
Purchases | | | — | | | | — | | | | 1.9 | | | | 0.4 | | | | 0.8 | | | | 2.8 | |
Sales | | | (0.1 | ) | | | — | | | | (6.7 | ) | | | (1.4 | ) | | | — | | | | (7.1 | ) |
Discoveries | | | 0.1 | | | | — | | | | — | | | | — | | | | 4.0 | | | | 4.1 | |
Extensions | | | 12.1 | | | | 1.7 | | | | 15.8 | | | | 122.6 | | | | 55.1 | | | | 105.2 | |
Improved Recovery | | | 0.5 | | | | — | | | | 4.4 | | | | 0.2 | | | | 11.3 | | | | 16.1 | |
Production | | | (30.6 | ) | | | (7.8 | ) | | | (44.0 | ) | | | (226.7 | ) | | | (4.0 | ) | | | (124.2 | ) |
| | | | | | | | | | | | | | | | | | | | | | | | |
End of 2014 | | | 223.9 | | | | 85.0 | | | | 106.0 | | | | 2,661.8 | | | | 420.2 | | | | 1,278.8 | |
| | | | | | | | | | | | | | | | | | | | | | | | |
Major additions to proved reserves in 2014 include:
| | • | | the extension through additional drilling locations at Sunrise in the Oil Sands that resulted in the booking of an additional 40 mmbbls of bitumen in proved undeveloped reserves; |
| | • | | extensions, improved recovery and strong performance in heavy oil and gas thermal projects that resulted in the booking of an additional 36 mmboe of bitumen in proved reserves; |
| | • | | strong performance from Liwan 3-1 that resulted in an additional 19 mmboe of natural gas and NGL in proved developed producing reserves; and |
| | • | | the extension through additional drilling locations at the Ansell liquids-rich natural gas resource play in the Alberta Deep Basin that resulted in the booking of an additional 10 mmboe of natural gas and NGL in proved undeveloped reserves. |
Reconciliation of Gross Probable Reserves
| | | | | | | | | | | | | | | | | | | | | | | | |
| | | Light
Crude Oil &
NGL
(mmbbls) | | | Medium
Crude Oil
(mmbbls) | | | Heavy
Crude Oil
(mmbbls) | | | Natural Gas
(bcf) | | | Bitumen
(mmbbls) | | | Total
(mmboe) | |
Canada—Western Canada | | | | | | | | | | | | | | | | | | | | | | | | |
End of 2013 | | | 57.2 | | | | 20.9 | | | | 62.5 | | | | 494.1 | | | | 1,511.4 | | | | 1,734.4 | |
Revisions—Technical | | | (16.2 | ) | | | 0.2 | | | | (6.8 | ) | | | (40.3 | ) | | | 5.8 | | | | (23.7 | ) |
Revisions—Economic | | | — | | | | (0.1 | ) | | | 1.1 | | | | 1.0 | | | | 4.0 | | | | 5.3 | |
Revisions—Transfer to Proved | | | (8.0 | ) | | | (0.2 | ) | | | (2.0 | ) | | | (49.5 | ) | | | (65.5 | ) | | | (83.9 | ) |
Purchases | | | — | | | | — | | | | 0.6 | | | | 0.1 | | | | 2.7 | | | | 3.3 | |
Sales | | | — | | | | — | | | | (11.1 | ) | | | (0.2 | ) | | | — | | | | (11.1 | ) |
Discoveries | | | — | | | | — | | | | — | | | | — | | | | — | | | | — | |
Extensions | | | 4.9 | | | | 1.3 | | | | 8.4 | | | | 78.2 | | | | 0.2 | | | | 27.9 | |
Improved Recovery | | | 1.1 | | | | — | | | | 2.8 | | | | 0.4 | | | | 38.6 | | | | 42.6 | |
Production | | | — | | | | — | | | | — | | | | — | | | | — | | | | — | |
| | | | | | | | | | | | | | | | | | | | | | | | |
End of 2014 | | | 39.1 | | | | 22.2 | | | | 55.5 | | | | 483.8 | | | | 1,497.2 | | | | 1,694.6 | |
| | | | | | | | | | | | | | | | | | | | | | | | |
Canada—Atlantic Region | | | | | | | | | | | | | | | | | | | | | | | | |
End of 2013 | | | 50.2 | | | | — | | | | — | | | | — | | | | — | | | | 50.2 | |
Revisions—Technical | | | 12.9 | | | | — | | | | — | | | | — | | | | — | | | | 12.9 | |
Revisions—Economic | | | — | | | | — | | | | — | | | | — | | | | — | | | | — | |
Revisions—Transfer to Proved | | | (0.4 | ) | | | — | | | | — | | | | — | | | | — | | | | (0.4 | ) |
Purchases | | | — | | | | — | | | | — | | | | — | | | | — | | | | — | |
Sales | | | — | | | | — | | | | — | | | | — | | | | — | | | | — | |
Discoveries | | | — | | | | — | | | | — | | | | — | | | | — | | | | — | |
Extensions | | | 51.4 | | | | — | | | | — | | | | — | | | | — | | | | 51.4 | |
Improved Recovery | | | — | | | | — | | | | — | | | | — | | | | — | | | | — | |
Production | | | — | | | | — | | | | — | | | | — | | | | — | | | | — | |
| | | | | | | | | | | | | | | | | | | | | | | | |
End of 2014 | | | 114.1 | | | | — | | | | — | | | | — | | | | — | | | | 114.1 | |
| | | | | | | | | | | | | | | | | | | | | | | | |
China | | | | | | | | | | | | | | | | | | | | | | | | |
End of 2013 | | | 8.0 | | | | — | | | | — | | | | 254.7 | | | | — | | | | 50.5 | |
Revisions—Technical | | | (0.5 | ) | | | — | | | | — | | | | — | | | | — | | | | (0.5 | ) |
Revisions—Economic | | | — | | | | — | | | | — | | | | — | | | | — | | | | — | |
Revisions—Transfer to Proved | | | (2.3 | ) | | | — | | | | — | | | | (82.8 | ) | | | — | | | | (16.1 | ) |
Purchases | | | — | | | | — | | | | — | | | | — | | | | — | | | | — | |
Sales | | | — | | | | — | | | | — | | | | — | | | | — | | | | — | |
Discoveries | | | — | | | | — | | | | — | | | | — | | | | — | | | | — | |
Extensions | | | 0.2 | | | | — | | | | — | | | | — | | | | — | | | | 0.2 | |
Improved Recovery | | | — | | | | — | | | | — | | | | — | | | | — | | | | — | |
Production | | | — | | | | — | | | | — | | | | — | | | | — | | | | — | |
| | | | | | | | | | | | | | | | | | | | | | | | |
End of 2014 | | | 5.4 | | | | — | | | | — | | | | 171.9 | | | | — | | | | 34.1 | |
| | | | | | | | | | | | | | | | | | | | | | | | |
Indonesia | | | | | | | | | | | | | | | | | | | | | | | | |
End of 2013 | | | 1.7 | | | | — | | | | — | | | | 152.0 | | | | — | | | | 27.0 | |
Revisions—Technical | | | — | | | | — | | | | — | | | | 3.8 | | | | — | | | | 0.6 | |
Revisions—Economic | | | — | | | | — | | | | — | | | | — | | | | — | | | | — | |
Revisions—Transfer to Proved | | | — | | | | — | | | | — | | | | — | | | | — | | | | — | |
Purchases | | | — | | | | — | | | | — | | | | — | | | | — | | | | — | |
Sales | | | — | | | | — | | | | — | | | | — | | | | — | | | | — | |
Discoveries | | | — | | | | — | | | | — | | | | — | | | | — | | | | — | |
Extension | | | — | | | | — | | | | — | | | | — | | | | — | | | | — | |
Improved Recovery | | | — | | | | — | | | | — | | | | — | | | | — | | | | — | |
Production | | | — | | | | — | | | | — | | | | — | | | | — | | | | — | |
| | | | | | | | | | | | | | | | | | | | | | | | |
End of 2014 | | | 1.7 | | | | — | | | | — | | | | 155.8 | | | | — | | | | 27.6 | |
| | | | | | | | | | | | | | | | | | | | | | | | |
| | | | | | | | | | | | | | | | | | | | | | | | |
| | | Light
Crude Oil &
NGL
(mmbbls) | | | Medium
Crude Oil
(mmbbls) | | | Heavy
Crude Oil
(mmbbls) | | | Natural Gas
(bcf) | | | Bitumen
(mmbbls) | | | Total
(mmboe) | |
Libya | | | | | | | | | | | | | | | | | | | | | | | | |
End of 2013 | | | — | | | | — | | | | — | | | | — | | | | — | | | | — | |
Revisions—Technical | | | — | | | | — | | | | — | | | | — | | | | — | | | | — | |
Revisions—Economic | | | — | | | | — | | | | — | | | | — | | | | — | | | | — | |
Revisions—Transfer to Proved | | | — | | | | — | | | | — | | | | — | | | | — | | | | — | |
Purchases | | | — | | | | — | | | | — | | | | — | | | | — | | | | — | |
Sales | | | — | | | | — | | | | ��� | | | | — | | | | — | | | | — | |
Discoveries | | | — | | | | — | | | | — | | | | — | | | | — | | | | — | |
Extension | | | — | | | | — | | | | — | | | | — | | | | — | | | | — | |
Improved Recovery | | | — | | | | — | | | | — | | | | — | | | | — | | | | — | |
Production | | | — | | | | — | | | | — | | | | — | | | | — | | | | — | |
| | | | | | | | | | | | | | | | | | | | | | | | |
End of 2014 | | | — | | | | — | | | | — | | | | — | | | | — | | | | — | |
| | | | | | | | | | | | | | | | | | | | | | | | |
| | | | | | |
| | | Light
Crude Oil &
NGL
(mmbbls) | | | Medium
Crude Oil
(mmbbls) | | | Heavy
Crude Oil
(mmbbls) | | | Natural Gas
(bcf) | | | Bitumen
(mmbbls) | | | Total
Company
(mmboe) | |
Total | | | | | | | | | | | | | | | | | | | | | | | | |
End of 2013 | | | 117.1 | | | | 20.9 | | | | 62.5 | | | | 900.8 | | | | 1,511.4 | | | | 1,862.0 | |
Revisions—Technical | | | (3.8 | ) | | | 0.2 | | | | (6.8 | ) | | | (36.5 | ) | | | 5.8 | | | | (10.6 | ) |
Revisions—Economic | | | | | | | (0.1 | ) | | | 1.1 | | | | 1.0 | | | | 4.0 | | | | 5.3 | |
Revisions—Transfer to Proved | | | (10.7 | ) | | | (0.2 | ) | | | (2.0 | ) | | | (132.3 | ) | | | (65.5 | ) | | | (100.4 | ) |
Purchases | | | — | | | | — | | | | 0.6 | | | | 0.1 | | | | 2.7 | | | | 3.3 | |
Sales | | | — | | | | — | | | | (11.1 | ) | | | (0.2 | ) | | | — | | | | (11.1 | ) |
Discoveries | | | — | | | | — | | | | — | | | | — | | | | — | | | | — | |
Extension | | | 56.5 | | | | 1.3 | | | | 8.4 | | | | 78.2 | | | | 0.2 | | | | 79.5 | |
Improved Recovery | | | 1.1 | | | | — | | | | 2.8 | | | | 0.4 | | | | 38.6 | | | | 42.6 | |
Production | | | — | | | | — | | | | — | | | | — | | | | — | | | | — | |
| | | | | | | | | | | | | | | | | | | | | | | | |
End of 2014 | | | 160.2 | | | | 22.2 | | | | 55.5 | | | | 811.6 | | | | 1,497.2 | | | | 1,870.4 | |
| | | | | | | | | | | | | | | | | | | | | | | | |
Major changes to probable reserves in 2014 include:
| | • | | initial booking of the wellhead drilling platform in the West White Rose Extension that resulted in the booking of 52 mmbbls of light oil in probable reserves; and |
| | • | | extensions, improved recovery and strong performance in heavy oil thermal developments resulted in the booking of an additional 45 mmbbls of bitumen in probable reserves. |
Reconciliation of Gross Proved Plus Probable Reserves
| | | | | | | | | | | | | | | | | | | | | | | | |
| | | Light
Crude Oil &
NGL
(mmbbls) | | | Medium
Crude Oil
(mmbbls) | | | Heavy
Crude Oil
(mmbbls) | | | Natural Gas
(bcf) | | | Bitumen
(mmbbls) | | | Total
(mmboe) | |
Canada—Western Canada | | | | | | | | | | | | | | | | | | | | | | | | |
End of 2013 | | | 223.2 | | | | 111.6 | | | | 176.0 | | | | 2,699.0 | | | | 1,870.4 | | | | 2,826.1 | |
Revisions—Technical | | | (45.4 | ) | | | 0.2 | | | | 15.7 | | | | 24.1 | | | | (0.5 | ) | | | (26.1 | ) |
Revisions—Economic | | | (0.1 | ) | | | 0.4 | | | | (0.1 | ) | | | (21.7 | ) | | | 4.1 | | | | 0.8 | |
Revisions—Transfer to Proved | | | (8.0 | ) | | | (0.2 | ) | | | (2.0 | ) | | | (49.5 | ) | | | (65.5 | ) | | | (83.9 | ) |
Purchases | | | — | | | | — | | | | 2.4 | | | | 0.6 | | | | 3.5 | | | | 6.0 | |
Sales | | | (0.1 | ) | | | — | | | | (17.8 | ) | | | (1.6 | ) | | | — | | | | (18.2 | ) |
Discoveries | | | 0.1 | | | | — | | | | — | | | | — | | | | 4.0 | | | | 4.1 | |
Extensions | | | 16.0 | | | | 3.0 | | | | 24.2 | | | | 200.8 | | | | 55.4 | | | | 132.0 | |
Improved Recovery | | | 1.6 | | | | — | | | | 7.1 | | | | 0.6 | | | | 49.9 | | | | 58.7 | |
Production | | | (11.0 | ) | | | (7.8 | ) | | | (44.0 | ) | | | (185.0 | ) | | | (4.0 | ) | | | (97.6 | ) |
| | | | | | | | | | | | | | | | | | | | | | | | |
End of 2014 | | | 176.2 | | | | 107.2 | | | | 161.5 | | | | 2,637.4 | | | | 1,917.4 | | | | 2,801.9 | |
| | | | | | | | | | | | | | | | | | | | | | | | |
Canada—Atlantic Region | | | | | | | | | | | | | | | | | | | | | | | | |
End of 2013 | | | 124.6 | | | | — | | | | — | | | | — | | | | — | | | | 124.6 | |
Revisions—Technical | | | 17.9 | | | | — | | | | — | | | | — | | | | — | | | | 17.9 | |
Revisions—Economic | | | — | | | | — | | | | — | | | | — | | | | — | | | | — | |
Revisions—Transfer to Proved | | | (0.4 | ) | | | — | | | | — | | | | — | | | | — | | | | (0.4 | ) |
Purchases | | | — | | | | — | | | | — | | | | — | | | | — | | | | — | |
Sales | | | — | | | | — | | | | — | | | | — | | | | — | | | | — | |
Discoveries | | | — | | | | — | | | | — | | | | — | | | | — | | | | — | |
Extensions | | | 51.4 | | | | — | | | | — | | | | — | | | | — | | | | 51.4 | |
Improved Recovery | | | — | | | | — | | | | — | | | | — | | | | — | | | | — | |
Production | | | (16.3 | ) | | | — | | | | — | | | | — | | | | — | | | | (16.3 | ) |
| | | | | | | | | | | | | | | | | | | | | | | | |
End of 2014 | | | 177.2 | | | | — | | | | — | | | | — | | | | — | | | | 177.2 | |
| | | | | | | | | | | | | | | | | | | | | | | | |
China | | | | | | | | | | | | | | | | | | | | | | | | |
End of 2013 | | | 24.0 | | | | — | | | | — | | | | 539.4 | | | | — | | | | 113.9 | |
Revisions—Technical | | | 2.3 | | | | — | | | | — | | | | 98.0 | | | | — | | | | 18.7 | |
Revisions—Economic | | | — | | | | — | | | | — | | | | — | | | | — | | | | — | |
Revisions—Transfer to Proved | | | (2.3 | ) | | | — | | | | — | | | | (82.8 | ) | | | — | | | | (16.1 | ) |
Purchases | | | — | | | | — | | | | — | | | | — | | | | — | | | | — | |
Sales | | | — | | | | — | | | | — | | | | — | | | | — | | | | — | |
Discoveries | | | — | | | | — | | | | — | | | | — | | | | — | | | | — | |
Extensions | | | 1.2 | | | | — | | | | — | | | | — | | | | — | | | | 1.2 | |
Improved Recovery | | | — | | | | — | | | | — | | | | — | | | | — | | | | — | |
Production | | | (3.3 | ) | | | — | | | | — | | | | (41.7 | ) | | | — | | | | (10.3 | ) |
| | | | | | | | | | | | | | | | | | | | | | | | |
End of 2014 | | | 21.9 | | | | — | | | | — | | | | 512.9 | | | | — | | | | 107.4 | |
| | | | | | | | | | | | | | | | | | | | | | | | |
Indonesia | | | | | | | | | | | | | | | | | | | | | | | | |
End of 2013 | | | 8.8 | | | | — | | | | — | | | | 319.2 | | | | — | | | | 62.1 | |
Revisions—Technical | | | — | | | | — | | | | — | | | | 3.8 | | | | — | | | | 0.6 | |
Revisions—Economic | | | — | | | | — | | | | — | | | | — | | | | — | | | | — | |
Revisions—Transfer to Proved | | | — | | | | — | | | | — | | | | — | | | | — | | | | — | |
Purchases | | | — | | | | — | | | | — | | | | — | | | | — | | | | — | |
Sales | | | — | | | | — | | | | — | | | | — | | | | — | | | | — | |
Discoveries | | | — | | | | — | | | | — | | | | — | | | | — | | | | — | |
Extensions | | | — | | | | — | | | | — | | | | — | | | | — | | | | — | |
Improved Recovery | | | — | | | | — | | | | — | | | | — | | | | — | | | | — | |
Production | | | — | | | | — | | | | — | | | | — | | | | — | | | | — | |
| | | | | | | | | | | | | | | | | | | | | | | | |
End of 2014 | | | 8.8 | | | | — | | | | — | | | | 323.0 | | | | — | | | | 62.7 | |
| | | | | | | | | | | | | | | | | | | | | | | | |
| | | | | | | | | | | | | | | | | | | | | | | | |
| | | Light
Crude Oil &
NGL
(mmbbls) | | | Medium
Crude Oil
(mmbbls) | | | Heavy
Crude Oil
(mmbbls) | | | Natural Gas
(bcf) | | | Bitumen
(mmbbls) | | | Total
(mmboe) | |
Libya | | | | | | | | | | | | | | | | | | | | | | | | |
End of 2013 | | | 0.1 | | | | — | | | | — | | | | — | | | | — | | | | 0.1 | |
Revisions—Technical | | | — | | | | — | | | | — | | | | — | | | | — | | | | — | |
Revisions—Economic | | | — | | | | — | | | | — | | | | — | | | | — | | | | — | |
Revisions—Transfer to Proved | | | — | | | | — | | | | — | | | | — | | | | — | | | | — | |
Purchases | | | — | | | | — | | | | — | | | | — | | | | — | | | | — | |
Sales | | | — | | | | — | | | | — | | | | — | | | | — | | | | — | |
Discoveries | | | — | | | | — | | | | — | | | | — | | | | — | | | | — | |
Extensions | | | — | | | | — | | | | — | | | | — | | | | — | | | | — | |
Improved Recovery | | | — | | | | — | | | | — | | | | — | | | | — | | | | — | |
Production | | | — | | | | — | | | | — | | | | — | | | | — | | | | — | |
| | | | | | | | | | | | | | | | | | | | | | | | |
End of 2014 | | | 0.1 | | | | — | | | | — | | | | — | | | | — | | | | 0.1 | |
| | | | | | | | | | | | | | | | | | | | | | | | |
| | | | | | |
| | | Light
Crude Oil &
NGL
(mmbbls) | | | Medium
Crude Oil
(mmbbls) | | | Heavy
Crude Oil
(mmbbls) | | | Natural Gas
(bcf) | | | Bitumen
(mmbbls) | | | Total
Company
(mmboe) | |
Total | | | | | | | | | | | | | | | | | | | | | | | | |
End of 2013 | | | 380.7 | | | | 111.6 | | | | 176.0 | | | | 3,527.6 | | | | 1,870.4 | | | | 3,126.7 | |
Revisions—Technical | | | (25.3 | ) | | | 0.2 | | | | 15.7 | | | | 125.9 | | | | (0.5 | ) | | | 11.1 | |
Revisions—Economic | | | (0.1 | ) | | | 0.4 | | | | (0.1 | ) | | | (21.7 | ) | | | 4.1 | | | | 0.8 | |
Revisions—Transfer to Proved | | | (10.7 | ) | | | (0.2 | ) | | | (2.0 | ) | | | (132.3 | ) | | | (65.5 | ) | | | (100.4 | ) |
Purchases | | | — | | | | — | | | | 2.4 | | | | 0.6 | | | | 3.5 | | | | 6.0 | |
Sales | | | (0.1 | ) | | | — | | | | (17.8 | ) | | | (1.6 | ) | | | — | | | | (18.2 | ) |
Discoveries | | | 0.1 | | | | — | | | | — | | | | — | | | | 4.0 | | | | 4.1 | |
Extensions | | | 68.6 | | | | 3.0 | | | | 24.2 | | | | 200.8 | | | | 55.4 | | | | 184.6 | |
Improved Recovery | | | 1.6 | | | | — | | | | 7.1 | | | | 0.6 | | | | 49.9 | | | | 58.7 | |
Production | | | (30.6 | ) | | | (7.8 | ) | | | (44.0 | ) | | | (226.7 | ) | | | (4.0 | ) | | | (124.2 | ) |
| | | | | | | | | | | | | | | | | | | | | | | | |
End of 2014 | | | 384.2 | | | | 107.2 | | | | 161.5 | | | | 3,473.3 | | | | 1,917.4 | | | | 3,149.2 | |
| | | | | | | | | | | | | | | | | | | | | | | | |
Undeveloped Reserves
Undeveloped reserves are attributed internally in accordance with standards and procedures contained in the COGEH. Proved undeveloped oil and gas reserves are those reserves that can be estimated with a high degree of certainty to be recovered from new wells on undrilled acreage, or from existing wells where a relatively major expenditure is required for recompletion. Probable undeveloped oil and gas reserves are those reserves that are less certain to be recovered than proved reserves and are expected to be recovered from known accumulations where a significant expenditure is required to render them capable of production. There are numerous uncertainties inherent in estimating quantities of crude oil and natural gas reserves. Classifications of reserves as proved or probable are only attempts to define the degree of uncertainty associated with the estimates. In addition, whereas proved reserves are those reserves that can be estimated with a high degree of certainty to be economically producible, probable reserves are those reserves that are as likely as not to be recovered. Therefore, probable reserves estimates, by definition, have a higher degree of uncertainty than proved reserves.
Husky funds capital programs by cash generated from operating activities, cash on hand, equity issuances, and short-term and long-term debt. Decisions to develop proved undeveloped and probable undeveloped reserves are based on various factors including economic conditions, technical performance and size of the development program. Approximately 45% of Husky’s gross proved undeveloped reserves are assigned to the Sunrise Energy Project. Steaming on Phase I of the project started in mid-December 2014. Approximately 16% of Husky’s gross proved undeveloped reserves are assigned to the liquids-rich Ansell area. This project has ongoing drilling with the recent acquisition of gas plant capacity. Approximately 7% of Husky’s gross proved undeveloped reserves are assigned to the Madura BD project.
As at December 31, 2014, there were no material proved undeveloped reserves that have remained undeveloped for greater than five years.
Proved Undeveloped Reserves
| | | | | | | | | | | | | | | | | | | | | | | | |
First attributed | | Light Crude
Oil & NGL
(mmbbls) | | | Medium
Crude Oil
(mmbbls) | | | Heavy
Crude Oil
(mmbbls) | | | Bitumen
(mmbbls) | | | Natural Gas
(bcf) | | | Total Oil &
NGL
(mmbbls) | |
Year Prior | | | 79.1 | | | | 20.3 | | | | 65.3 | | | | 272.2 | | | | 853.9 | | | | 436.8 | |
2012 | | | 16.6 | | | | 3.7 | | | | 8.1 | | | | 12.3 | | | | 399.4 | | | | 40.7 | |
2013 | | | 16.2 | | | | 1.7 | | | | 13.0 | | | | 41.3 | | | | 216.5 | | | | 72.3 | |
2014 | | | 6.9 | | | | 0.9 | | | | 8.9 | | | | 70.8 | | | | 104.0 | | | | 87.5 | |
Probable Undeveloped Reserves
| | | | | | | | | | | | | | | | | | | | | | | | |
First attributed | | Light Crude
Oil & NGL
(mmbbls) | | | Medium
Crude Oil
(mmbbls) | | | Heavy
Crude Oil
(mmbbls) | | | Bitumen
(mmbbls) | | | Natural Gas
(bcf) | | | Total Oil &
NGL
(mmbbls) | |
Year Prior | | | 145.7 | | | | 13.5 | | | | 62.2 | | | | 2,160.1 | | | | 330.9 | | | | 2,381.5 | |
2012 | | | 11.5 | | | | 0.7 | | | | 5.9 | | | | 12.3 | | | | 299.0 | | | | 30.4 | |
2013 | | | 11.6 | | | | 3.1 | | | | 18.1 | | | | 134.8 | | | | 216.3 | | | | 167.5 | |
2014 | | | 56.6 | | | | 1.0 | | | | 7.6 | | | | 41.5 | | | | 71.6 | | | | 106.8 | |
Future Development Costs
The Company expects to fund its future development costs by cash generated from operating activities, cash on hand, and short and long-term debt. In addition, the Company has access to additional funding through credit facilities and the issuance of equity through shelf prospectuses, subject to market conditions. The cost associated with this funding would not affect reserves and would not be material in comparison with future net revenues.
The following tables include estimates of the forecasted costs of developing the Company’s proved and proved plus probable reserves as at December 31, 2014:
| | | | | | | | | | | | | | | | | | | | | | | | | | | | | | | | |
| | | Canada | | | China | | | Indonesia | | | Libya | |
Year | | Proved
Reserves
($ millions) | | | Proved Plus
Probable
Reserves
($ millions) | | | Proved
Reserves
($ millions) | | | Proved Plus
Probable
Reserves
($ millions) | | | Proved
Reserves
($ millions) | | | Proved Plus
Probable
Reserves
($ millions) | | | Proved
Reserves
($ millions) | | | Proved Plus
Probable
Reserves
($ millions) | |
2015 | | | 2,148 | | | | 2,853 | | | | 45 | | | | 45 | | | | 104 | | | | 123 | | | | — | | | | — | |
2016 | | | 1,597 | | | | 2,355 | | | | 35 | | | | 35 | | | | 96 | | | | 182 | | | | 1 | | | | 1 | |
2017 | | | 1,223 | | | | 2,397 | | | | 161 | | | | 161 | | | | 10 | | | | 53 | | | | — | | | | — | |
2018 | | | 872 | | | | 2,622 | | | | 126 | | | | 126 | | | | — | | | | — | | | | — | | | | — | |
2019 | | | 854 | | | | 2,150 | | | | — | | | | — | | | | — | | | | — | | | | — | | | | — | |
Remaining | | | 12,169 | | | | 32,497 | | | | 200 | | | | 200 | | | | — | | | | — | | | | — | | | | — | |
| | | | | | | | | | | | | | | | | | | | | | | | | | | | | | | | |
Total | | | 18,863 | | | | 44,873 | | | | 567 | | | | 567 | | | | 211 | | | | 358 | | | | 1 | | | | 1 | |
| | | | | | | | | | | | | | | | | | | | | | | | | | | | | | | | |
| | | | | | | | |
| | | Total
($ millions) | |
Year | | Proved Reserves | | | Proved Plus Probable Reserves | |
2014 | | | 2,298 | | | | 3,022 | |
2015 | | | 1,729 | | | | 2,572 | |
2016 | | | 1,395 | | | | 2,610 | |
2017 | | | 998 | | | | 2,748 | |
2018 | | | 854 | | | | 2,150 | |
Remaining | | | 12,369 | | | | 32,697 | |
| | | | | | | | |
Total | | | 19,642 | | | | 45,799 | |
| | | | | | | | |
Additional Information Concerning Abandonment and Reclamation Costs
The Company estimates the costs associated with abandonment and reclamation costs for surface leases, wells, facilities, and pipelines through its previous experience, where available, or by estimating such costs. With respect to abandonment and reclamation costs for surface leases, wells, facilities, and pipelines, net of estimated salvage value, the Company expects to incur these costs for a total undiscounted amount of $10.5 billion. Discounted at 10% per year, the total abandonment costs, net of estimated salvage value, for wells is $3.3 billion. This amount was deducted in estimating the future net revenue. Of the undiscounted portion of the total abandonment and reclamation costs, $758 million is expected to be paid in the next three years.
Production Estimates
Yearly Production Estimates for 2015
| | | | | | | | | | | | | | | | | | | | |
| | | Light
Crude Oil
(mmbbls) | | | Medium
Crude Oil
(mmbbls) | | | Heavy
Crude Oil
(mmbbls) | | | Bitumen
(mmbbls) | | | Natural Gas
(bcf) | |
Canada | | | | | | | | | | | | | | | | | | | | |
Total Gross Proved | | | 24.5 | | | | 8.0 | | | | 23.9 | | | | 18.5 | | | | 166.3 | |
Total Gross Probable | | | 4.2 | | | | 0.4 | | | | 3.7 | | | | 3.5 | | | | 6.4 | |
| | | | | | | | | | | | | | | | | | | | |
Total Gross Proved Plus Probable | | | 28.8 | | | | 8.4 | | | | 27.7 | | | | 22.0 | | | | 172.7 | |
| | | | | | | | | | | | | | | | | | | | |
International | | | | | | | | | | | | | | | | | | | | |
Total Gross Proved | | | 4.8 | | | | — | | | | — | | | | — | | | | 54.4 | |
Total Gross Probable | | | 0.3 | | | | — | | | | — | | | | — | | | | — | |
| | | | | | | | | | | | | | | | | | | | |
Total Gross Proved Plus Probable | | | 5.1 | | | | — | | | | — | | | | — | | | | 54.4 | |
| | | | | | | | | | | | | | | | | | | | |
Total | | | | | | | | | | | | | | | | | | | | |
Total Gross Proved | | | 29.3 | | | | 8.0 | | | | 23.9 | | | | 18.5 | | | | 220.7 | |
Total Gross Probable | | | 4.5 | | | | 0.4 | | | | 3.7 | | | | 3.5 | | | | 6.4 | |
| | | | | | | | | | | | | | | | | | | | |
Total Gross Proved Plus Probable | | | 33.9 | | | | 8.4 | | | | 27.7 | | | | 22.0 | | | | 227.1 | |
| | | | | | | | | | | | | | | | | | | | |
No individual property accounts for 20% or more of the estimated production disclosed.
Infrastructure and Marketing
The Infrastructure and Marketing business is comprised of the marketing of the Company’s and other producers’ crude oil, natural gas, NGL, sulphur and petroleum coke, pipeline transportation, the blending of crude oil and natural gas, and the storage of crude oil, diluent and natural gas.
Infrastructure
Husky has been involved in the gathering, transporting and storage of heavy crude oil in the Lloydminster area since the early 1960s. Husky’s crude oil pipeline systems include more than 2,000 kilometers of pipeline capable of transporting up to 710 mbbls/day of blended heavy crude oil, diluent and synthetic crude oil when the systems are fully powered. The pipeline systems transport blended heavy crude oil to Lloydminster, accessing markets through Husky’s Upgrader and asphalt refinery in Lloydminster. Blended heavy crude oil from the field and synthetic crude oil from the upgrading operations are transported south to Hardisty, Alberta to a connection with the major export trunk pipelines: Enbridge Pipeline multi-line system, Spectra Express Pipeline, TransCanada’s Keystone pipeline and the smaller Inter Pipeline. The blended crude oil is transported to eastern and southern markets on these pipelines. Husky’s crude oil pipeline systems also have feeder pipeline interconnections with the Inter Pipeline at Cold Lake, the Echo Pipeline at Hardisty, the Gibsons Hardisty Terminal, the Enbridge Hardisty Caverns and Merchant Terminal and the Talisman Chauvin Pipeline.
The following table shows the average daily pipeline throughput for the periods indicated:
| | | | | | | | | | | | |
| | | Years Ended December 31, | |
(mbbls/day) | | 2014 | | | 2013 | | | 2012 | |
Combined Pipeline Throughput(1) | | | 531 | | | | 557 | | | | 581 | |
| (1) | Throughput includes the Husky internal and third-party volumes. |
In recent years, Husky has completed a number of expansions on its pipeline system and Hardisty terminal facilities to capitalize on anticipated increases in heavy oil production from the Lloydminster and Cold Lake areas and to service the new incremental take-away capacity from the Keystone pipeline. In May 2012, a new 300,000-barrel tank at the Hardisty terminal was placed in service. Construction of the two 300,000-barrel storage tanks and the expanded piping and blending infrastructure is complete. The project is now in the commissioning phase with start-up expected in the first quarter of 2015.
Husky’s heavy crude oil processing facilities are located throughout the Lloydminster area and are connected to Husky’s pipeline system. These facilities process Husky’s and other producers’ raw heavy crude oil from the field production by removing sand, water and other impurities to produce clean dry heavy crude oil. There are also third-party processing facilities connected to Husky’s pipeline. The heavy crude oil is blended with a diluent to reduce both viscosity and density in order to meet pipeline specifications for transportation.
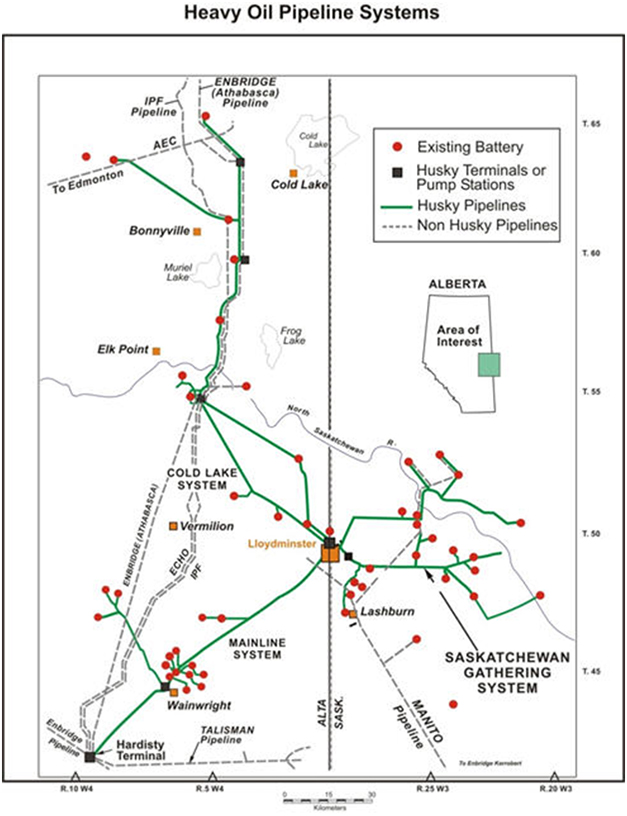
In 2010, Husky commenced its pipeline commitment on the Keystone pipeline system, which ships Canadian crude oil from Hardisty, Alberta to Patoka, Illinois. This commitment was part of a strategy, commenced in 2006, to expand the market for Husky’s crude oil into the Midwest United States. This strategy was further supported through the acquisition of the Lima Refinery in 2007, which now enables Husky’s Canadian synthetic crude oil production (along with additional third-party purchases) to be processed at the refinery.
Due to Husky’s ongoing Keystone pipeline commitment, the Lima Refinery has the option, depending on the economics, to access a significant amount of Canadian crude oil as part of its crude feedstock requirements. The Keystone pipeline has also enabled Husky to sell heavy crude oil through interconnecting pipeline systems to the Lima, Ohio Refinery and into Cushing, Oklahoma.
Since 2012, the pipeline systems leaving Canada have been subject to significant apportionment, affecting both Canadian export volumes and crude oil prices in Western Canada. Husky has to a large extent been insulated from these effects through the reliability of its proprietary pipeline system, its firm capacity on Keystone and through Husky’s demand for Canadian crude feedstocks to its upgrading and refining assets. To date, Husky has been able to avoid any production shut ins. As a seller and buyer of crude oils, Husky has a relatively balanced exposure to many location and grade differentials.
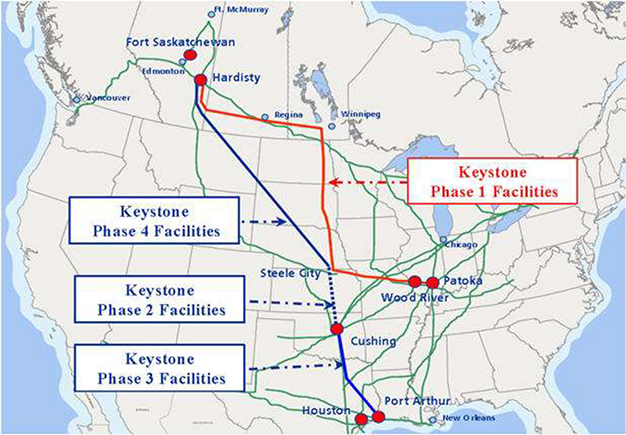
Husky has been carefully monitoring opportunities to participate in growing crude oil markets accessed by rail, which have developed due to refiners’ desire for inland crude oil, priced at significant discounts to ocean imports. Husky has made opportunistic crude oil deliveries to rail loading facilities via trucks where netbacks can be increased relative to pipeline alternatives. While Husky’s primary focus is on low cost pipeline transportation options, it intends to develop a flexible crude delivery strategy to use rail transport to a variety of crude oil markets.
Results from Husky’s third-party pipeline and infrastructure businesses are included in Upstream Infrastructure and Marketing and results associated with Husky’s internal production volumes are included in Upstream Exploration and Production.
Natural Gas Storage Facilities
Husky has operated a 19 bcf natural gas storage facility at Hussar, Alberta since 2000. Results from Husky’s natural gas storage business are included in Upstream Infrastructure and Marketing.
Commodity Marketing
Husky is a marketer of both its own and third-party production of crude oil, synthetic crude oil, NGL, natural gas and sulphur. The Company also markets petroleum coke, a by-product from the Lloydminster Upgrader. Husky supplies feedstock to its Lloydminster Upgrader and asphalt refinery from its own and third-party heavy oil production sourced from the Lloydminster and Cold Lake areas. The Company also sells blended heavy crude oil directly to refiners based in the United States and Canada. Husky’s extensive infrastructure in the Lloydminster area supports its heavy crude oil refining and marketing operations.
Husky markets light and medium crude oil and NGL sourced from Husky’s own production and third-party production. Light crude oil is acquired for processing by third-party refiners at Edmonton, Alberta and by Husky’s refinery at Prince George, British Columbia. Husky markets the synthetic crude oil produced at its Upgrader in Lloydminster to refiners in Canada and the United States, including the Lima Refinery and other refineries in the Midwest of the United States.
Husky markets natural gas sourced from its own production and third-party production. The Company is currently committed to gas sales contracts with third parties, which in the aggregate do not exceed amounts forecast to be deliverable from Husky’s reserves. The natural gas sales contracted are primarily at market prices. At December 31, 2014, Husky’s long-term fixed price natural gas sales contracts totalled approximately 4 bcf to be delivered in full until expiry in April 2015. The Company trades natural gas to generate revenue from assets managed, including transportation and natural gas storage facilities.
Husky has developed its commodity marketing operations to include the acquisition of third-party volumes to increase volumes and enhance the value of its midstream assets. The Company plans to expand its marketing operations by continuing to increase marketing activities. The Company believes that this increase will generate synergies with the marketing of its own production volumes and the optimization of its assets. Results from Husky’s commodity marketing business are included in Upstream Infrastructure and Marketing.
Downstream Operations
U.S. Refining and Marketing
Lima, Ohio Refinery
The Lima Refinery, located in Ohio between Toledo and Dayton, has an atmospheric crude throughput capacity of 160 mbbls/day. The Lima Refinery currently processes both light sweet crude oil feedstock sourced from the United States and Africa and, since 2010 with the commissioning of the Keystone Pipeline system, Canadian synthetic crudes, including HSB produced by the Lloydminster Upgrader. The Lima Refinery produces gasoline, gasoline blend stocks, diesel, jet fuel, petrochemical feedstock and other by-products. The feedstock is received via the Mid-Valley and Marathon Pipelines, and the refined products are transported via the Buckeye and Inland pipeline systems and by rail car to primary markets in Ohio, Illinois, Indiana, Pennsylvania, and southern Michigan.
During 2014, crude oil feedstock throughput at the Lima Refinery averaged 132 mbbls/day. Production of gasoline averaged 68 mbbls/day, total distillates averaged 56 mbbls/day and total other products averaged 17 mbbls/day.
The Lima Refinery continues to progress reliability and profitability improvement projects. Construction of the 20 mbbls/day kerosene hydrotreater, which increased on-road diesel and jet fuel production volumes, was completed and brought on-line in early 2013. In addition, FEED commenced in the second half of 2013 to revamp existing refinery process units and add new equipment to allow the refinery to process up to 40,000 bbls/day of Western Canadian heavy crude oil while maintaining the capability and flexibility to refine existing light crude oil. Regulatory approval was granted by the U.S. EPA. This project is ongoing and anticipated to be completed in the 2018-2019 timeframe.
BP-Husky Toledo, Ohio Refinery
The BP-Husky Toledo Refinery, in which Husky holds a 50% interest, has a name plate capacity of 160 mbbls/day and an operating capacity of 135 to 145 mbbls/day on its current crude slate. Products include low sulphur gasoline, ultra-low sulphur diesel, aviation fuels, propane and asphalt. The BP-Husky Toledo Refinery is located in one of the highest energy consumption regions in the United States.
Husky, together with its partner BP, plan to expand the BP-Husky Toledo Refinery’s bitumen processing capacity to handle production from the Sunrise Energy Project development. BP currently markets 100% of the refinery’s output; however, once Sunrise Phase I reaches design production rates, Husky will have the right to market its own share of the refined products.
In 2010, Husky and BP announced the sanction of the Continuous Catalyst Regeneration Reformer Project at the BP-Husky Toledo Refinery. Project construction formally commenced in August 2010 and was completed in March 2013. This project improved the efficiency and competitiveness of the refinery by reducing energy consumption, lowering operating costs and safety concerns with the replacement of two naphtha reformers and one hydrogen plant with a 42,000 bbls/day continuous catalyst regeneration reformer system plant.
The Company and its partner initiated the Hydrotreater Recycle Gas Compressor Project in 2013, which was completed in the fourth quarter of 2014. The installation of the new recycle gas compressor in the existing hydrotreater is expected to improve operational integrity and plant performance.
During the year ended December 31, 2014, Husky’s share of crude oil feedstock throughput averaged 63 mbbls/day, production of gasoline averaged 39 mbbls/day, middle distillates averaged 18 mbbls/day and other fuel and feedstock averaged 8 mbbls/day.
Upgrading Operations
Husky owns and operates the Husky Lloydminster Upgrader, a heavy oil upgrading facility located in Lloydminster, Saskatchewan. The Upgrader is designed to process blended heavy crude oil feedstock into high quality, low sulphur synthetic crude oil. Synthetic crude oil is used as refinery feedstock for the production of premium transportation fuels in Canada and the United States. In addition, the Upgrader recovers the diluent, which is blended with the heavy crude oil prior to pipeline transportation to reduce viscosity and facilitate its movement, and returns it to the field to be reused.
The Upgrader was commissioned in 1992 with an original design capacity of 46 mbbls/day of synthetic crude oil. Current production is considerably higher than the original design rate capacity as a result of throughput modifications and improved reliability. In 2007, the Upgrader commenced production of transportation grade diesel. The Upgrader’s current rated production capacity is 82 mbbls/day of synthetic crude oil, diluents, and ultra low sulphur diesel.
Production at the Upgrader averaged 54 mbbls/day of synthetic crude oil, 14 mbbls/day of diluent and 5 mbbls/day of ultra low sulphur diesel in 2014. In addition, the Upgrader also produced, as by-products of its upgrading operations, approximately 341 lt/day of sulphur and 893 lt/day of petroleum coke during 2014. These products are sold in Canadian and international markets.
Canadian Refined Products
Husky’s Canadian Refined Products operations include refining of light crude oil, manufacturing of fuel and fuel grade ethanol, manufacturing of asphalt products from heavy crude oil and acquisition by purchase and exchange of refined petroleum products. Husky’s retail distribution network includes the wholesale, commercial and retail marketing of refined petroleum products and provides a platform for non-fuel related convenience product businesses.
Light oil refined products are produced at the Husky refinery at Prince George, British Columbia and are also acquired from third-party refiners and marketed through Husky and Mohawk branded retail and commercial petroleum outlets and through direct marketing to third-party dealers and end users. Asphalt and residual products are produced at Husky’s asphalt refinery at Lloydminster, Alberta and are marketed directly or through Husky’s eight emulsion plants, five of which are also asphalt terminals located throughout Western Canada.
Prince George Refinery
Husky’s light oil refinery in Prince George, British Columbia, provides refined products to Husky and third-party retail outlets in the central and northern regions of the province. Feedstock is delivered to the refinery by pipeline from northeastern British Columbia. Prince George Refinery production is equal to approximately 18% of Husky’s total refined product supply requirements.
The refinery produces all grades of unleaded gasoline, seasonal diesel fuels, mixed propane and butane, and heavy fuel oil. In 2014, refinery throughput averaged 11.7 mbbls/day.
Lloydminster Asphalt Refinery
Husky’s Lloydminster Asphalt Refinery processes heavy crude oil into asphalt products used in road construction and maintenance and industrial asphalt products. The refinery has a throughput capacity of 29.0 mbbls/day of heavy crude oil. The refinery also produces straight run gasoline, bulk distillates and residuals. The straight run gasoline stream is removed and re-circulated into the heavy oil pipeline network as pipeline diluent and the distillate stream is used by the Upgrader to make ultra low sulphur diesel fuel. The bulk distillates are hydrogen deficient and are transferred directly to the Upgrader and then treated for blending into the HSB stream. Residuals are a blend of medium and light distillate and gas oil streams, which are sold directly to customers typically as drilling and well fracturing fluids or used in asphalt cutbacks and emulsions.
Refinery throughput averaged 28.8 mbbls/day of blended heavy crude oil feedstock during 2014. In 2014, daily sales volumes of asphalt averaged 16.0 mbbls/day and daily sales volumes of residual and other products averaged 14.0 mbbls/day. Due to the seasonal demand for asphalt products, most Canadian asphalt refineries typically operate at full capacity only during the normal paving season in Canada and the northern United States. Husky has implemented various plans to increase refinery throughput during the other months of the year, such as increasing storage capacity and developing U.S. markets for asphalt products. This is intended to allow Husky to run at or near full capacity year round.
Asphalt Distribution Network
Husky’s Pounder Emulsions division has a significant market share in Western Canada for road application emulsion products. Additional non-asphalt based road maintenance products are also marketed and distributed through Pounder Emulsions. The Company’s sales to the United States and eastern Canada accounted for over 50% of its total asphalt sales in 2014. Exported asphalt products are shipped as far as California and New York in the United States and Quebec in Canada. Husky typically sells in excess of 5.4 mmbbls of asphalt cement each year. All of Husky’s asphalt requirements are supplied by Husky’s asphalt refinery.
Husky’s asphalt distribution network consists of emulsion plants and asphalt terminals located at Kamloops, British Columbia, Edmonton and Lethbridge, Alberta, Saskatchewan and Winnipeg, Manitoba and three emulsion plants located at Watson Lake, Yukon and Lloydminster and Saskatoon, Saskatchewan. Husky also terminals asphalt at its Prince George Refinery and uses an independently operated terminal in Vancouver, British Columbia.
In 2015, Husky plans to increase retail capacity in U.S. markets, expand market access for drilling and completion products, implement safety and reliability improvements and develop new products, markets and specifications.
Ethanol Plants
In September 2006, Husky commissioned an ethanol plant in Lloydminster, Saskatchewan. This plant has an annual nameplate capacity of 130 million litres. In December 2007, the Minnedosa, Manitoba ethanol plant was commissioned also with an annual nameplate capacity of 130 million litres. The plant is operating above that capacity. In 2014, ethanol production averaged 780,656 lt/day.
Husky’s ethanol production supports its ethanol-blended gasoline marketing program. When added to gasoline, ethanol promotes more complete fuel combustion, prevents fuel line freezing and reduces carbon monoxide emissions, ozone precursors and net emissions of GHGs. Environment Canada has designated ethanol blended gasoline as an “Environmental Choice” product. Husky sells a large portion of its production to other major oil companies for their ethanol blending requirements in Western Canada.
During 2012, the Lloydminster plant commissioned a CO2 capture facility. The plant is currently capturing CO2 for use in Husky’s heavy oil reservoir enhancement project.
Other Supply Arrangements
In addition to the refined petroleum products supplied by the Prince George Refinery of 3.0 mbbls/day and by the Husky Lloydminster Upgrader of 5.2 mbbls/day in 2014, Husky has rack-based pricing purchase agreements for refined products with all major Canadian refiners. During 2014, Husky purchased approximately 31.5 mbbls/day of refined petroleum products from refiners and acquired approximately 8.7 mbbls/day of refined petroleum products pursuant to exchange agreements with third-party refiners.
Branded Petroleum Product Outlets and Commercial Distribution
As at December 31, 2014, there were 490 independently operated Husky-branded petroleum product outlets. These outlets include travel centres, convenience stores, cardlock operations and bulk distribution facilities located from the Ontario/Quebec border to the West Coast. Most travel centres also feature a proprietary cardlock system that enables commercial users to purchase products using a sophisticated card system that processes transactions and provides detailed billing, fuel and sales tax information. Husky also recently launched a new commercial card program that delivers universal card accepted, advanced online fuel management functionality and state-of-the-art fraud protection. A variety of full and self-serve retail locations serve urban and rural markets across the network, while Husky’s bulk distributors offer direct sales to commercial and farm markets in Western Canada.
Independent retailers or agents operate all Husky-branded petroleum product outlets. Retail outlets feature varying services, such as convenience stores, service bays, 24-hour service, car washes, Husky House restaurants, proprietary and co-branded quick serve restaurants and ATM machines. In addition to ethanol-blended gasoline, Husky offers DieselMax and propane services together with Chevron lubricants. Husky supplies refined petroleum products to its branded independent retailers on an exclusive basis and provides financial and other assistance for location improvements, marketing support and related services.
The following table shows the number of Husky-branded petroleum outlets by province as of December 31, 2014:
| | | | | | | | | | | | | | | | | | | | | | | | | | | | |
| | | British
Columbia | | | Alberta | | | Saskatchewan | | | Manitoba | | | Ontario | | | 2014
Total | | | 2013
Total | |
Branded Petroleum Outlets | | | | | | | | | | | | | | | | | | | | | | | | | | | | |
Retail Owned Outlets | | | 52 | | | | 63 | | | | 12 | | | | 15 | | | | 73 | | | | 215 | | | | 222 | |
Leased | | | 35 | | | | 36 | | | | 4 | | | | 11 | | | | 32 | | | | 118 | | | | 126 | |
Independent Retailers | | | 50 | | | | 71 | | | | 13 | | | | 6 | | | | 17 | | | | 157 | | | | 155 | |
| | | | | | | | | | | | | | | | | | | | | | | | | | | | |
Total | | | 137 | | | | 170 | | | | 29 | | | | 32 | | | | 122 | | | | 490 | | | | 503 | |
| | | | | | | | | | | | | | | | | | | | | | | | | | | | |
Cardlocks(1) | | | 22 | | | | 31 | | | | 5 | | | | 7 | | | | 19 | | | | 84 | | | | 81 | |
Convenience Stores(1) | | | 82 | | | | 91 | | | | 15 | | | | 23 | | | | 104 | | | | 315 | | | | 334 | |
Restaurants | | | 9 | | | | 12 | | | | 4 | | | | 2 | | | | 13 | | | | 40 | | | | 41 | |
| (1) | Located at branded petroleum outlets. |
Husky also markets refined petroleum products directly to various commercial markets, including independent dealers, national rail companies and major industrial and commercial customers in Western Canada and the northwestern United States. In 2014, daily sales volumes of gasoline, diesel fuel and liquefied petroleum gas were 24.7 mbbls/day, 24.9 mbbls/day, and 0.2 mbbls/day, respectively.
The following table shows average daily sales volumes of light refined petroleum products for the periods indicated:
| | | | | | | | | | | | |
| | | Years ended December 31, | |
(mbbls/day) | | 2014 | | | 2013 | | | 2012 | |
Gasoline | | | 24.8 | | | | 25.0 | | | | 26.2 | |
Diesel fuel | | | 24.9 | | | | 25.5 | | | | 27.2 | |
Liquefied Petroleum Gas | | | 0.1 | | | | 0.4 | | | | 0.8 | |
| | | | | | | | | | | | |
| | | 49.8 | | | | 50.9 | | | | 54.2 | |
| | | | | | | | | | | | |
INDUSTRY OVERVIEW
The operations of the oil and gas industry are governed by a considerable number of laws and regulations mandated by multiple levels of government and regulatory authorities in Canada, the United States and other foreign jurisdictions. These laws and regulations, along with global economic conditions, have shaped the developing trends of the industry. The following discussion summarizes the trends, legislation and regulations that have the most significant impact on the short and long-term operations of the oil and gas industry.
Crude Oil and Natural Gas Production
Global crude oil production continued to increase during 2014 and the U.S. EIA forecasts global fuels supply to outpace consumption in 2015 by approximately 0.6 mmbbls/day compared to 0.9 mmbbls/day in 2014. Total U.S. crude oil production, resulting from continued growth in U.S. shale and tight oil formations, increased to approximately 9.2 mmbbls/day in December 2014 and is forecast to average 9.3 mmbbls/day in 2015 and 9.5 mmbbls/day in 2016. 1
In Canada, production from oil sands projects is expected to continue increasing in the decades to come. In the CAPP June 2014 publication, production of bitumen from both mining and in-situ operations was forecast to increase by 9.5 percent in 2015 compared with 2014, however the impact from falling commodity prices and project delays is expected to have an impact on CAPP’s forecast. Of the remaining established oil sands reserves in Alberta, 134 billion barrels or 80 percent is considered recoverable by in-situ techniques and 33 billion barrels is considered recoverable by mining.2
In its June 2014 forecast, CAPP projected total Canadian crude oil production to increase by approximately 73 percent to 6.4 mmbbls/day by 2030, compared to 3.7 mmbbls/day in 2014. This growth forecast is 0.3 mmbbls/day lower when compared to CAPP’s projection from 2013 as higher forecast production from liquids rich plays is offset by lower forecast production from the oil sands. Oil sands production is forecast to increase by approximately 129 percent to 4.8 mmbbls/day by 2030, compared to 2.1 mmbbls/day in 2014. Conventional crude oil production, representing approximately 42 percent of current Canadian production, is forecast to increase by 3 percent to 1.6 mmbbls/day and is expected to represent 25 percent of total Canadian production by 2030 resulting from significant increases in oil sands production.2
Total Canadian natural gas production increased by 3.3 percent in 2014 compared with 2013 primarily reflecting higher North American benchmark natural gas prices.3 Total U.S. natural gas production increased by approximately 5.9 percent in 2014 compared to 2013 and is forecast to increase by an additional 3.2 percent in 2015. At the same time, total U.S. consumption of natural gas increased by 3.4 percent in 2014 compared to 2013 and is expected to increase by 0.2 percent in 2015.2
Commodity Pricing
Crude oil and natural gas producers negotiate purchase and sale contracts directly with respective buyers and these contracts are typically based on the prevailing market price of the commodity. The market price for crude oil is determined largely by global factors and the contract price considers oil quality, transportation and other terms of the agreement. The price for natural gas in Canada is determined primarily by North America fundamentals because virtually all natural gas production in North America is consumed by North American customers, predominantly in the United States. Commodity prices are based on supply and demand which may fluctuate due to market uncertainty and other factors beyond the control of entities operating in the industry.
The significant decline in benchmark oil prices around the globe during the second half of 2014, primarily related to the increasing production and inventory levels, along with increased volatility has created significant uncertainty with respect to forecast of oil prices into 2015. The EIA projects that the spot price of Brent, an imported light sweet benchmark crude oil produced in the North Sea will average U.S. $58/bbl in 2015 compared to an average price of U.S. $99/bbl and U.S. $108/bbl in 2014 and 2013, respectively. Similarly, the EIA projects that the spot price of WTI will average U.S. $55/bbl in 2015 compared to an average price of U.S. $93/bbl and U.S. $98/bbl in 2014 and 2013, respectively. The EIA expects the discount of the WTI crude oil price to Brent to average $3/bbl through 2015.1
Market Access
Transportation and market access in North America for crude oil emerged as a major issue in 2012, and continued to be a significant challenge for the industry during 2014. The industry continues to seek alternative forms of transportation to supplement the use of pipelines, such as railways, barges and marine tankers to ensure that Western Canada’s crude oil maintains access to world markets. Constraints on transportation and market access will continue to be a challenge for the industry.
Current pipeline capacity exiting Western Canada totals 3.7 mmbbls/day; however a number of proposed crude oil pipelines could increase capacity by an additional 3.4 mmbbls/day between 2015 and 2018. The proposed pipeline projects are the Keystone XL to the U.S. Gulf Coast, the Alberta Clipper Expansion to Superior, Wisconsin, the Trans Mountain Expansion to Burnaby, British Columbia, the Enbridge Northern Gateway to Kitimat, British Columbia and the TransCanada Energy East to the east coast of Canada. Considerable uncertainty exists around if and when each of these will be in service.2
CAPP forecasts that crude oil volumes transported by rail will increase to approximately 700 mbbls/day in 2016 from approximately 200 mbbls/day in 2013.2
Royalties, Incentives and Income Taxes
Canada
The amount of royalties payable on production from privately owned lands is negotiated between the mineral freehold owner and the lessee, and this production may also be subject to certain provincial taxes and royalties. Royalty rates for production from Crown lands are determined by provincial governments. When setting royalty rates, commodity prices, levels of production and operating and capital costs are considered. Royalties payable are generally calculated as a percentage of the value of gross production and generally depend on prescribed reference prices, well productivity, geographical location, field discovery date, method of recovery, depth of well, and the type or quality of the petroleum product produced. Other royalties and royalty-like interests are, from time to time, carved out of the owner’s working interest through non-public transactions. These are often referred to as overriding royalties, gross overriding royalties, net profits interests or net carried interests.
Royalty rates pertaining to Husky operations in Western Canada averaged 12 percent of gross revenues in both 2014 and 2013. In the Company’s Atlantic Region, the average royalty rate was 17 percent in 2014 compared with 13 percent in 2013 due to Tier 1 and super royalty rates being reached at the North Amethyst and West White Rose Satellite Extensions.
The Canadian federal corporate income tax rate was 15 percent in 2014 and 2013. Provincial rates ranged between 11 percent and 16 percent in 2014 and 2013.
Other Jurisdictions
Royalty rates in the Company’s Asia Pacific Region averaged 8 percent in 2014 compared to 24 percent 2013 with the reduction due to production from the Liwan Gas Project which commenced at the end of the first quarter of 2014.
Operations in the U.S are subject to the U.S. federal tax rate of 35 percent and various state-level taxes. Operations in China are subject to the Chinese tax rate of 25 percent. Operations in Indonesia are subject to tax at a rate of 40 percent as governed by each project’s PSC.
The Company’s consolidated effective tax rate was 29 percent for 2014 and 30 percent for 2013. Royalty rates averaged 12 percent of gross revenue in both 2014 and 2013.
Land Tenure Regulation
In Canada, rights to natural resources are largely owned by the provincial and federal governments. Rights are granted to explore for and produce oil and natural gas subject to shared jurisdiction agreements, ELs, significant discovery and production licenses, leases, permits, and provincial legislation which may include contingencies such as obligations to perform work or make payments.
For international jurisdictions, rights to natural resources are largely owned by national governments that grant rights in forms such as ELs and permits, production licenses, and PSCs. Companies in the oil and gas industry are subject to ongoing compliance with the regulatory requirements established by the relevant country for the right to explore, develop and produce petroleum and natural gas in that particular jurisdiction.
Environmental Regulations
All phases of the oil and natural gas business are subject to environmental regulation pursuant to a variety of federal, provincial, state and local laws and regulations, as well as international conventions (collectively, “environmental regulations”).
Environmental regulations impose, among other things, restrictions, liabilities and obligations in connection with the generation, handling, storage, transportation, treatment and disposal of hazardous substances and waste and in connection with spills, releases and emissions of various substances to the environment. Environmental regulations also require that wells, facilities and other properties associated with Husky’s operations be constructed, operated, maintained, abandoned and reclaimed to the satisfaction of applicable regulatory authorities. In addition, certain types of operations, including exploration and development projects and significant changes to certain existing projects, may require the submission and approval of environmental impact assessments.
The oil and gas industry has already generally adapted to current environmental regulations and initiatives including but not limited to, water, emissions performance, climate change mitigation and adaptation, pipeline integrity management, reclamation, hydraulic fracturing and land use.
Water
Extensive regulations are imposed on Husky’s operations to ensure surface water and fresh groundwater is protected. These include guidelines dictating aspects including:
| | • | | well, pipeline, and facility offsets from fresh surface water bodies and domestic water wells; |
| | • | | drilling fluids, well construction materials, and methods to ensure isolation of fresh groundwater aquifers from resource exploration and extraction activities; |
| | • | | downhole offsets for completions operations to ensure isolation from fresh groundwater aquifers, with specific risk mitigation expectations for hydraulic fracturing; |
| | • | | monitoring of fresh groundwater aquifers at major operating facilities; |
| | • | | water discharge criteria for onshore and offshore facilities; and, |
| | • | | fluid transport, handling, and storage. |
Water withdrawals, in particular freshwater withdrawals, are regulated in all of the jurisdictions in which Husky has operations. Husky has reporting requirements relating to most licenced water withdrawals to support operations. Guidelines dictate water source selection and management. Water withdrawals are further governed by local watershed and/or industry water management plans.
Husky recognizes the importance of water security to the success of its operations, and engages in dialogue on proposed water regulatory changes, both directly and through industry associations, to ensure the Company’s interests are recognized and Husky is sufficiently prepared to fully comply when new water regulations come into force.
Climate Change
Husky operates in many jurisdictions that regulate or have proposed to regulate industrial GHG emissions. GHG regulations can be categorized as
| | • | | intensity or absolute based GHG compliance costs; |
| | • | | tax and cap-and-trade hybrid systems; and |
| | • | | other regulatory measures including low carbon fuel and renewable fuel standards. |
Husky engages in consultations for the design of proposed regulations and supports efforts to harmonize regulations across jurisdictions, both directly with regulators and through industry associations.
International Climate Change Agreements
In 2010, as part of the Copenhagen Accord at the UNFCC COP held in Copenhagen, Denmark in 2009, Canada committed to reducing its greenhouse gas emissions by 17% below 2005 levels by 2020, which is aligned with the U.S. target. The Accord includes non-binding commitments from all the major emitters including the United States, China, India and Brazil, and provides for international review of both developed and developing countries’ targets and actions, but does not discuss any compliance mechanisms. In 2014, the U.S. and China jointly announced significant GHG emissions targets that are in part designed to inject momentum into the global climate negotiations with an eye toward reaching a successful climate change agreement at the 21st UNFCC COP in Paris, France, in 2015. Canada responded to this development by pledging increased aid to the United Nations’ Green Climate Fund. In addition, the UNFCC COP met in Lima, Peru in 2014 to continue negotiations in preparation for the meeting in Paris.
Canadian Federal Greenhouse Gas Regulations
The Canadian federal government has begun addressing emissions of specific sectors of the economy, including working closely with the U.S. government to establish common North American vehicle emissions standards, as well as performance standards for thermal electricity generation. Also, in line with the United States, Canada has adopted renewable fuels regulations, requiring fuel producers and importers to have an average of at least 5% of their gasoline supply come from renewable sources (such as ethanol) and to have an average of at least 2% of their diesel supply come from renewable sources (such as bio-diesel).
The Canadian federal government continues to engage with the Canadian oil and gas industry and chemical industry (including ethanol producers) on proposed regulations for these sectors, seeking to balance emissions performance and global competitiveness.
Canadian Provincial Greenhouse Gas Regulations
Regulations have been enforced in Alberta since 2007 that require facilities that emit more than 100,000 tonnes of CO2e in a year to reduce their emissions intensity by up to 12% below an established baseline emissions intensity, or pay $15/tonne for CO2e that does not meet the target.
In British Columbia, regulations in force since 2008 targeted a provincial reduction in GHG emissions of at least 33% below 2007 levels by 2020. In October 2014, British Columbia introduced Bill 2, the Greenhouse Gas Industrial Reporting and Control Act which, if put into force by regulation, will limit the emissions from LNG facilities to 0.16 tonnes of GHG emissions for each 1 tonne of LNG processed by the operator.
During 2007 and 2008, Ontario, British Columbia, Quebec and Manitoba committed, as partners, to move forward with a cap-and-trade system designed under the WCI, while Nova Scotia, Saskatchewan and the Yukon Territory signed on as observers of the WCI. The WCI initiative was designed to reduce greenhouse gas emissions at the regional level to 15% below 2005 levels by 2020. The cap-and-trade system is intended to limit the allowable emissions for each partner, allocate them to large industrial facilities, and create an international market where emissions could be traded among participants.
In November 2011, the WCI formed WCI, Inc., a non-profit corporation, to provide administrative and technical services to support the implementation of state and provincial GHG emission trading programs. As WCI jurisdictions begin to implement cap-and-trade programs, WCI, Inc. will develop a compliance tracking system that tracks both allowances and offset certificates, administer allowance auctions and conduct market monitoring of allowance auctions and allowance and offset certificate trading. California and Quebec moved forward with cap-and-trade in 2012, with compliance requirements beginning in 2013. Ontario, British Columbia, and Manitoba have indicated that they are committed to implementing programs in the near future as well.
U.S. Greenhouse Gas Regulations
The U.S. does not have federal legislation establishing targets for the reduction of or limits on the emission of GHGs. However, the U.S. EPA has and may continue to promulgate regulations concerning the reporting and control of GHG emissions. In 2009, the U.S. EPA enacted the GHGRP, which requires any facility releasing more than 25,000 tpy of CO2e emissions to report those emissions on an annual basis, beginning with calendar year 2010. In addition to reporting direct CO2e emissions, the GHGRP requires refineries to estimate the CO2e emissions from the potential subsequent combustion of the refinery’s products.
In May 2010, the U.S. EPA finalized the Greenhouse Gas Tailoring Rule. This rule “tailored” the Clean Air Act by phasing in permitting requirements for GHG emissions, including BACT requirements for new and modified sources of air emissions emitting more than a threshold quantity of GHGs. In June 2014, the U.S. Supreme Court issued its opinion in Utility Air Regulatory Group v. EPA. The Court invalidated portions of the Tailoring Rule but upheld the EPA’s authority to require BACT for GHG emissions associated with sources that must obtain Prevention of Significant Deterioration permits based on their non-GHG emissions. Based on the Court’s opinion, it is possible that the U.S. EPA will amend the Tailoring Rule in a way that imposes additional GHG requirements on Husky’s U.S. operations.
In September 2013, the U.S. EPA issued proposed standards for GHG emissions from new coal- and oil-fired power plants. In June 2014, the EPA issued the “Clean Power Plan,” which is a proposed set of rules to significantly reduce CO2e emissions from existing power plants. The U.S. EPA has issued standards for oil and gas production and transmission sector that, among other requirements, mandates the use of “Reduced Emission Completions” for hydraulically fractured natural gas wells. In January 2015, the U.S. EPA announced that it will release proposed methane emissions standard for the upstream oil and gas sector by the summer of 2015. The U.S. EPA has not yet issued proposed or final GHG emissions standards for new or existing refineries but could do so in the future. These and other U.S. EPA regulations regarding GHG emissions are subject to judicial challenges and could be modified by congressional legislation.
Pipeline Integrity
Recent high-profile oil spill events have led to a review by industry regulators. In 2012, the AER hired Group 10 Engineering Ltd., a third-party consultant, to review the industry’s pipeline requirements and industry best practices for public safety and response to pipeline incidents, pipeline integrity management, and the safety of pipelines at, or near, water crossings. Husky participated in the interview process. The final report was released in August 2013 and included 17 recommendations to improve pipeline safety that were accepted by the province of Alberta.
The British Columbia Oil and Gas Commission is currently conducting a review of all pipeline segments, and the B.C. Ministry of Environment has recently issued a land based spill preparedness and response policy intentions paper for comment on the Government of B.C. website.
In 2012, CEPA announced CEPA Integrity First, an industry-wide initiative to improve the industry’s pipeline safety, environmental and socio-economic performance. The program is based on sharing best practices and applying advanced technology, and highlights pipeline incident prevention, emergency response, reclamation and education. The prevention section focuses on programs and processes related to pipeline integrity. The emergency response section concentrates on programs CEPA members have in place. The reclamation section addresses the quality of post-incident activities, and the education section provides additional information about pipelines in Canada. CEPA is taking the lead with CAPP, providing support and context around pipelines owned and operated by producing companies, as well as emphasizing the importance of reliable and safe energy infrastructure to the oil and gas industry.
Abandonment Liability
In early 2013, the AER made significant changes to its abandonment liability program and licence transfer process. These changes were implemented on May 1, 2013 under Directive 006:Licensee Liability Rating Program and Licence Transfer Process(“Directive 6”) and effected important changes to the Licensee Liability Rating Program. The Licensee Liability Rating Program is designed to prevent Alberta taxpayers from incurring costs to suspend, abandon, remediate, and reclaim a well, facility or pipeline. Under the Licensee Liability Rating Program, each licensee is assigned a Liability Management Rating. Liability Management Rating is the ratio of a licensee’s eligible deemed assets under the Licensee Liability Rating Program, the Large Facility Liability Management Program and the Oilfield Waste Liability Program to its deemed liabilities in these programs. The Liability Management Rating assessment is designed to assess a licensee’s ability to address its suspension, abandonment, remediation and reclamation liabilities. This assessment is conducted monthly and on receipt of a licence transfer application in which the licensee is the transferor or transferee.
Directive 6 requires oil and gas operators in Alberta to pay higher security deposits to maintain the required Liability Management Rating with the AER. The changes will be implemented over a three-year period. If a licensee fails to post security, if required, then the AER may take a number of steps to enforce these provisions, which include non-compliance fees, partial or full suspension of operations, suspension and/or cancellation of a permit, licence or approval, and prevention of the transfer of licences held by licensees that do not meet the new requirements.
Hydraulic Fracturing
Hydraulic fracturing is a method of increasing well production by injecting fluid under high pressure down a well, which causes the surrounding rock to crack or fracture. The fluid typically consists of water, sand, chemicals and other additives and flows into the cracks where the sand remains to keep the cracks open and enable natural gas or liquids to be recovered. Fracturing fluids are produced back to the surface through the wellbore and are stored for reuse or future disposal in accordance with regional regulations, which may include injection into underground wells. The design of the well bores protects groundwater aquifers from the fracturing process.
The Government of Canada manages use of chemicals through its Chemical Management Plan and New Substances Program. Some provinces require the details of fracturing fluids to be submitted to regulators. In Alberta, the AER requires that all fracturing operations submit reports regarding the quantity of fluids and additives. In the U.S., the process is regulated by state and local governments. However, the EPA is considering undertaking a broad study as it pertains to the national Clean Water Act which may or may not result in future federal regulations.
Land Use
In 2012, the Government of Alberta approved the LARP, which covers the lower Athabasca region and includes Husky’s oil sands assets and major projects. The LARP was developed to manage cumulative effects within the region using three formal management frameworks; Air Quality, Surface Water Quality and Groundwater Quality. The use of each framework establishes approaches to ensure trends are identified and assessed, regional limits are not exceeded and that air and water remain healthy for the region’s residents and ecosystems during oil sands development.
Industry Collaboration Initiatives
Husky participates in a number of industry associations and sustainability groups to better understand environmental, safety and social issues while benefitting from and contributing to industry innovation and good management practices.
In early 2012, Husky joined IPIECA, the global oil and gas industry association for environmental and social issues, and is participating in its Water Task Force and Climate Change Working Group as well as other topic focused groups. The Company is also a member of Oil Spill Response Limited, an international industry-owned cooperative which exists to respond effectively to oil spills wherever in the world they may occur. Husky also participates in industry reporting through CAPP and CFA.
Husky participated in a two-year (2013-2014) joint industry study to characterize water sources and water disposal zones in West Central Alberta, an area of increasing multi-stage hydraulic fracturing for development of shale and tight gas resources. Husky is committed to adhering to the CAPP Guiding Principles for Hydraulic Fracturing and Hydraulic Fracturing Operating Practices for shale and tight gas development.
As a member of the In-situ industry Water Technology Development Centre, Husky is collaborating with other major oil and gas companies and is committed to developing technologies that will reduce water and energy use for the thermal heavy oil industry. Husky also collaborates through involvement in numerous industry water committees, including the CAPP Water Task Group and its specialty sub-committees, the PTAC Water Innovation and Planning Committee, the CEMA Water Working Group and supporting technical groups, and the IPIECA Water Working Group; and, through involvement in watershed committees including the North Saskatchewan Watershed Alliance and the Beaver River Watershed Alliance.
Husky pursues memberships with the following sustainability groups and industry associations to better understand environmental, safety and social issues while benefitting and contributing to industry innovation and best practices: Alberta Biodiversity Monitoring Institute, Alberta Industrial Fire Protection Association, Beaver River Watershed Alliance, Calgary Region Airshed Zone, CAPP, CFA, Canadian Land Reclamation Association, CDP, China Offshore Environmental Services, China Offshore Oil Operation Safety Office, Clearwater Mutual Aid CO-OP, Conference Board of Canada – Council on Emergency Management, CEMA, Decentralized Energy Canada, Eastern Canada Response Corporation, Environmental Citizens Action Committee, Environmental Services Association of Alberta, Foothills Land Management Forum, Hardisty Air Management Zone Association, Indonesian Petroleum Association, Integrated CO2 Network, International Oil & Gas Producers Association, IPIECA, Lakeland Industry and Community Association, LPG Emergency Response Corporation, Lloydminster Emergency Preparedness Stakeholder Group, Mackenzie Delta Spill Response Corporation, Marine Pollution Control, Mutual Aid Alberta, North Saskatchewan Watershed Alliance, Ohio Chemistry Trade Council, Oil Spill Response Limited, One Ocean, Orphan Well Association, Ottawa River Coalition, Parkland Airshed Management Zone, PTAC, Plains CO2
Reduction Partnership, Prince George Air Improvement Roundtable, Prince George Industrial Mutual Aid Committee, Regional Aquatics Monitoring Program, Saskatchewan Petroleum Industry Government Environmental Committee, Southeast Saskatchewan Airshed Association, China’s State Oceanic Administration, Upstream Saskatchewan Spill Response Co-op Area 2, 3 & 4 Spill Response Cooperatives, Water Technology Development Centre – joint industry project, Western Canadian Spill Services, Western Yellowhead Air Management Zone and Wood Buffalo Environmental Association, Peach Airshed Zone Association, Fort Air Partnership, West Central Airshed Society, Alberta Capital Airshed Alliance, Palliser Airshed Society.
Husky’s Sustainability Commitment
Husky’s sustainability is a key pillar of the financial well-being of the Company. At the end of 2010, the Company presented its business strategy and set out a five-year plan with clearly defined financial goals and performance targets. Four years into that plan, the Company is meeting or exceeding its key performance indicators. While sustainability begins with a strong financial foundation, success is directly linked to how the Company conducts its business, whether it is by improving safety, enhancing environmental performance through innovative ways to protect the environment, or in delivering lasting benefits to the communities.
| (1) | “Short-Term Energy Outlook”, January 2015, U.S. Energy Information Administration |
| (2) | “Crude Oil Forecast, Markets and Pipelines”, June 2014, Canadian Association of Petroleum Producers |
| (3) | “Marketable Natural Gas production in Canada”, January 12, 2015, National Energy Board |
RISK FACTORS
The following summarizes the most significant risks relating to Husky and its operations that should be considered when purchasing securities of Husky. Husky has developed an enterprise risk matrix to identify risks to its people, the environment, its assets and its reputation, and to systematically mitigate these risks to an acceptable level. The risk matrix and associated mitigation strategies are reviewed quarterly by senior management and semi-annually by the Audit Committee of the Board of Directors.
Operational, Environmental and Safety Incidents
The Company’s businesses are subject to inherent operational risks in respect to safety and the environment that require continuous vigilance. The Company seeks to minimize these operational risks by carefully designing and building its facilities and conducting its operations in a safe and reliable manner using its integrated management system that considers the environmental requirements and process and occupational safety HOIMS. Failure to manage the risks effectively could result in potential fatalities, serious injury, asset damage or environmental impact. Enterprise risk management, emergency preparedness, business continuity and security policies and programs are in place for all operating areas and are adhered to on an ongoing basis. The Company, in accordance with industry practice, maintains insurance coverage against losses from certain of these risks. Nonetheless, insurance proceeds may not be sufficient to cover all losses, and insurance coverage may not be available for all types of operational risks.
Commodity Price Volatility
Husky’s results of operations and financial condition are dependent on the prices received for its crude oil and natural gas production. Lower prices for crude oil and natural gas could adversely affect the value and quantity of Husky’s oil and gas reserves. Husky’s reserves include significant quantities of heavier grades of crude oil that trade at a discount to light crude oil. Heavier grades of crude oil are typically more expensive to produce, process, transport and refine into high value refined products. Refining and transportation capacity for heavy crude oil is limited and planned increases of North American heavy crude oil production may create the need for additional heavy oil refining and transportation capacity. As a result, wider price differentials could have adverse effects on Husky’s financial performance and condition, reduce the value and quantities of Husky’s heavier crude oil reserves and delay or cancel projects that involve the development of heavier crude oil resources. There is no guarantee that planned pipeline development projects will provide sufficient transportation capacity and access to refining capacity to accommodate expected increases in North American heavy crude oil production.
Prices for crude oil are based on world supply and demand. Supply and demand can be affected by a number of factors including, but not limited to, actions taken by OPEC, non-OPEC crude oil supply, social conditions in oil producing countries, the occurrence of natural disasters, general and specific economic conditions, prevailing weather patterns and the availability of alternate sources of energy.
Husky’s natural gas production is currently located in Western Canada and Asia Pacific. Western Canada is subject to North American market forces. North American natural gas supply and demand is affected by a number of factors including, but not limited to, the amount of natural gas available to specific market areas either from the well head or from storage facilities, prevailing weather patterns, the price of crude oil, the U.S. and Canadian economies, the occurrence of natural disasters and pipeline restrictions.
In Asia or in North America, the crude oil price is based on the balance of supply and demand. Natural gas price in North America is affected primarily by supply and demand, as well as by prices for alternative energy sources. The natural gas Husky produces in the Asia Pacific Region is sold to specific buyers with long-term contracts. The price is fixed for the initial 5 years for the Liwan 3-1 gas field and then linked to city-gas pricing adjustment. For Liuhua 34-2, the price is fixed during the delivery period.
In certain instances, the Company uses derivative commodity instruments to manage exposure to price volatility on a portion of its oil and gas production and firm commitments for the purchase or sale of crude oil and natural gas.
The fluctuations in crude oil and natural gas prices are beyond the Company’s control and could have a material adverse effect on the Company’s business, financial condition and cash flow. For information on 2014 commodity price sensitivities, refer to Section 3.0 of the 2014 Annual MD&A.
Reservoir Performance Risk
Lower than projected reservoir performance on the Company’s key growth projects could have a material impact on the Company’s financial position, medium to long-term business strategy and cash flow. Inaccurate appraisal of large project reservoirs could result in missed production, revenue and earnings targets and negatively affect the Company’s reputation, investor confidence and the Company’s ability to deliver on its growth strategy.
In order to maintain the Company’s future production of crude oil, natural gas and NGL and maintain the value of the reserves portfolio, additional reserves must be added through discoveries, extensions, improved recovery, performance related revisions and acquisitions. The production rate of oil and gas properties tends to decline as reserves are depleted while the associated unit operating costs increase. In order to mitigate the effects of this, the Company must undertake successful exploration and development programs, increase the recovery factor from existing properties through applied technology and identify and execute strategic acquisitions of proved developed and undeveloped properties and unproved prospects. Maintaining an inventory of developable projects depends on, among other things, obtaining and renewing rights to explore, develop and produce oil and natural gas, drilling success, completing long-lead time capital intensive projects on budget and on schedule and the application of successful exploitation techniques on mature properties.
Restricted Market Access and Pipeline Interruptions
Husky’s results depend upon the Company’s ability to deliver products to the most attractive markets. The Company’s results could be impacted by restricted market access resulting from a lack of pipeline or other transportation alternatives to attractive markets as well as regulatory and/or other marketplace barriers. The interruptions and restrictions may be caused by the inability of a pipeline to operate, or they can be related to capacity constraints as the supply of feedstock into the system exceeds the infrastructure capacity. With growing conventional and oil sands production across North America and limited availability of infrastructure to carry the Company’s products to the marketplace, oil and natural gas transportation capacity is expected to be restricted in the next few years. Restricted market access may potentially have a material impact on the Company’s financial position, medium to long-term business strategy, cash flow and corporate reputation. Unplanned shutdowns and closures of its refineries and or upgrader may limit Husky’s ability to deliver product with negative implications on sales and results from operating activities.
Security and Terrorist Threats
Security threats and terrorist or activist activities may impact the Company’s personnel, which could result in injury, death, extortion, hostage and/or kidnapping, including unlawful confinement. A security threat, terrorist attack or activist incident targeted at a facility, office or offshore vessel/installation owned or operated by the Company could result in the interruption or cessation of key elements of the Company’s operations. Outcomes of such incidents could have a material impact on the Company’s financial position, business strategy and cash flow.
A cyber incident may impact the operational state and/or cause physical damage to the Company’s assets, along with potential health and safety risks or loss of intellectual property.
International Operations
International operations can expose the Company to uncertain political, economic and other risks. The Company’s operations in certain jurisdictions may be adversely affected by political, economic or social instability or events. These events may include, but are not limited to, onerous fiscal policy, renegotiation or nullification of agreements, imposition of onerous regulation, changes in laws governing existing operations, financial constraints, including currency and exchange rate fluctuations, and unreasonable taxation. This could adversely affect the Company’s interest in its foreign operations and future profitability.
Gas Storage
The potential inability to deliver an effective gas storage solution as inventories grow over the life of the White Rose field may potentially result in prolonged shutdown of these operations, which may have a material impact on the Company’s financial position, medium to long-term business strategy and cash flow.
Skills and Human Resource Shortage
The Company recognizes that a robust, productive and healthy workforce drives efficiency, effectiveness and financial performance. Attracting and retaining qualified and skilled labour is critical to the successful execution of the Company’s current and future business strategies. A tight labour market, an insufficient number of qualified candidates and an aging workforce are factors that can precipitate a human resource risk for the Company if not properly managed. Failure to retain current employees and attract new skilled employees could materially affect the Company’s ability to conduct its business.
Major Project Execution
The Company manages a variety of oil and gas projects ranging from Upstream to Downstream assets. The risks associated with project development and execution, as well as the risks involved in commissioning and integration of new assets with existing facilities, can impact the economic feasibility of the Company’s projects. These risks can result in, among other things, cost overruns, schedule delays and a decline in the market value of the Company’s oil and gas products. These risks can also impact the Company’s safety and environmental performance, which could negatively affect the Company’s reputation.
Partner Misalignment
Joint venture partners operate a portion of Husky’s assets in which the Company has an ownership interest. Husky is at times dependent upon its partners for the successful execution of various projects. If a dispute with partners were to occur over the development and operation of a project or if partners were unable to fund their contractual share of the capital expenditures, a project may be delayed and the Company may be partially or totally liable for its partner’s share of the project.
Reserves Data, Future Net Revenue and Resource Estimates
The reserves and resource data contained or referenced in this AIF represent estimates only. The accurate assessment of oil and gas reserves and resources is critical to the continuous and effective management of the Company’s Upstream assets. Reserves and resources estimates support various investment decisions about the development and management of resource plays. In general, estimates of economically recoverable crude oil and gas reserves and resources and the future net cash flow therefrom are based upon a number of variable factors and assumptions, such as product prices, future operating and capital costs, historical production from the properties and the assumed effects of regulation by governmental agencies, including with respect to royalty payments, all of which may vary considerably from actual results. All such estimates are to some degree uncertain, and classifications of reserves and resources are only attempts to define the degree of uncertainty involved. For those reasons, estimates of the economically recoverable oil and gas reserves and resources attributable to any particular group of properties, classification of such reserves and resources based on risk of recovery and estimates of future net revenues expected therefrom may differ substantially from actual results. The data may be prepared by different engineers or by the same engineers at different times. These factors may cause the estimates to vary substantially over time. All reserves and resources estimates involve a degree of ambiguity and, at times, rely on indirect measurement techniques to estimate the size and recoverability of the resource. While new technologies have increased the accuracy and efficacy of these techniques, there remains the potential for human or systemic error in recording and reporting the magnitude of the Company’s oil and gas reserves and resources. Inaccurate appraisal of large project reservoirs could result in missed production, revenue and earnings targets and could negatively affect the Company’s reputation, investor confidence and the Company’s ability to deliver on its growth strategy.
Government Regulation
Given the scope and complexity of Husky’s operations, the Company is subject to regulation and intervention by governments at the federal, provincial, state and municipal levels in the countries in which it conducts its operations or exploratory activities. As these governments continually balance competing demands from different interest groups and stakeholders, the Company recognizes that the magnitude of regulatory risks has the potential to change over time. Changes in government policy, legislation or regulation could impact the Company’s existing and planned projects as well as impose costs of compliance, increase capital expenditures and operating expenses. Examples of the Company’s regulatory risks include, but are not limited to, uncertain or negative interactions with governments, uncertain energy policies, uncertain environmental and safety policies, penalties, taxes, royalties, government fees, reserves access, limitations or increases in costs relating to the exportation of commodities, restrictions on the acquisition of exploration and production rights and land tenure, expropriation or cancellation of contract rights, limitations on control over the development and abandonment of fields, and loss of licenses to operate.
Environmental Regulation
Changes in environmental regulation could have a material adverse effect on Husky’s financial condition and results of operations by requiring increased capital expenditures and operating costs or by impacting the quality, formulation or demand of products, which may or may not be offset through market pricing. The scope and complexity of changes in environmental regulation make it challenging to forecast the potential impact to Husky. Husky engages in the dialogue on proposed changes, both directly and through industry associations, to ensure the Company’s interests are recognized and Husky is sufficiently prepared to fully comply when new regulations come into force.
Husky anticipates further changes in environmental legislation could occur, which may result in stricter standards and enforcement, larger fines and liabilities, increased compliance costs and approval delays for critical licences and permits, which could have a material adverse effect on Husky’s financial condition and results of operations through increased capital and operating costs.
Some of the topics that are or could in the future be subject to new or enhanced environmental regulation include:
| | • | | water use, withdrawals and discharges; |
| | • | | the use of hydraulic fracturing to aid in oil and gas production; |
| | • | | targets for reduced purchases of unconventional oils, such as bitumen; |
| | • | | new GHG regulations in jurisdictions where the Company has operations; |
| | • | | jurisdictional calculation and regulation of fuel life-cycle carbon content; |
| | • | | fuel reformulation to support reduced combustion emissions; |
| | • | | new regulations for managing air pollutants at facility and equipment levels; and |
| | • | | regulations affecting the transportation of product by rail. |
Transportation of Dangerous Goods Regulation
The transportation of flammable liquids (crude, ethanol, gasoline, etc.) by rail is an emerging issue for the petroleum industry. Throughout 2014, Transport Canada and the PHMSA in the United States issued a series of orders and directives that are intended to enhance the safe transport of flammable liquids. Among these changes is greater oversight by the regulators, enhancements to emergency preparedness and response requirements, rail car design, testing and classification practices as well as discussions on a federal rail liability and compensation regime. Some of the enhancements came into effect in 2014, however the details of the other measures are still being worked on by CAPP, Canadian Fuels and other trade associations. On August 1, 2014, PHMSA published a Notice of Proposed Rulemaking concerning more stringent standards and operational controls for trains transporting high volumes of crude oil and other flammable materials and an Advance Notice of Proposed Rulemaking for oil spill response plans for these trains. If finalized, the rules would require the replacement of existing railcars and the implementation of other compliance measures. The final impact to the Company and the industry due to additional transportation costs imposed by the PHMSA rules and other developing standards has yet to be determined.
Climate Change Regulation
The Company continues to monitor the international and domestic efforts to address climate change, including international low carbon fuel standards and regulations and emerging regulations in the jurisdictions in which the Company operates.
Existing regulations in Alberta require facilities that emit more than 100,000 tonnes of CO2e in a year to reduce their emissions intensity by up to 12 percent below an established baseline emissions intensity. These regulations currently affect the Company’s Ram River Gas Plant and Tucker Thermal Facility and are expected to affect the Sunrise Energy Project when it starts production.
The Saskatchewan government is currently in the process of developing such regulations. These regulations may impact the Company’s current and future operations in that province.
British Columbia currently has a $30 per tonne carbon tax that is placed on fuel the Company uses and purchases in that jurisdiction, which affects all of the Company’s operations in British Columbia. Additionally, British Columbia has a Low Carbon Fuel Standard in place that requires a reduction in the allowable carbon intensities of all fuels, with penalties applied after 2016 for intensities that do not meet targets. Due to the geographical location of the Company’s Prince George Refinery, the Company is already at the blend-wall as the cloud point of the Company’s produced diesel has to meet the requirements for vehicle engines operating at low temperatures. These regulations may impact the Company’s current and future operations in that province.
The Federal Government of Canada has announced its intention to take a sector based approach to future climate change regulations although it is not clear how new regulations will be structured or what compliance mechanisms will be available for the Company’s affected operations. Climate change regulations may become more onerous over time as public and political pressures increase to implement initiatives that further reduce GHG emissions. Although the impact of emerging regulations is uncertain, they may have a material adverse effect on the Company’s financial condition and results of operations through increased capital and operating costs.
The Company’s U.S. refining business may be materially impacted by implementation of the EPA’s climate change rules or by future U.S. GHG legislation that applies to the oil and gas industry or the consumption of petroleum products. Such legislation or regulation could require the Company’s U.S. refining operations to significantly reduce emissions and/or purchase allowances, which may have a material adverse effect on the Company’s financial condition and results of operations through increased capital and operating costs.
Financial Risks
The Company’s financial risks are largely related to commodity price risk, foreign currency risk, interest rate risk, credit risk and liquidity risk. From time to time, the Company uses derivative financial instruments to manage its exposure to these risks. These derivative financial instruments are not intended for trading or speculative purposes.
Foreign Currency Risk
The Company’s results are affected by the exchange rates between various currencies including the Canadian and U.S. dollars. The majority of the Company’s expenditures are in Canadian dollars while the majority of the Company’s revenues are received in U.S. dollars from the sale of oil and gas commodities that receive prices determined by reference to U.S. benchmark prices. An increase in the value of the Canadian dollar relative to the U.S. dollar will decrease the revenues received from the sale of oil and gas commodities. Correspondingly, a decrease in the value of the Canadian dollar relative to the U.S. dollar will increase the revenues received from the sale of oil and gas commodities. In addition, a change in the value of the Canadian dollar against the U.S. dollar will result in an increase or decrease in the Company’s U.S. dollar denominated debt and related interest expense, as expressed in Canadian dollars. The fluctuations in exchange rates are beyond the Company’s control and could have a material adverse effect on the Company’s business, financial condition and cash flow.
The Company enters into short-dated foreign exchange contracts to fix the exchange rate for conversion of U.S. revenue dollars to hedge against these potential fluctuations. The Company also designates a portion of its U.S debt as a hedge of the Company’s net investment in the U.S. refining operations which are considered as a foreign functional currency. At December 31, 2014, the amount that the Company designated was U.S. $2.9 billion (December 31, 2013—U.S. $3.2 billion).
Interest Rate Risk
Interest rate risk is the impact of fluctuating interest rates on earnings, cash flows and valuations. In order to manage interest rate risk and the resulting interest expense, the Company mitigates some of its exposure to interest rate changes by maintaining a mix of both fixed and floating rate debt through the use of its credit facilities and various financial instruments. The optimal mix maintained will depend on market conditions. The Company may also enter into interest rate swaps from time to time as an additional means of managing current and future interest rate risk.
Credit Risk
Credit risk represents the financial loss that the Company would suffer if the Company’s counterparties in a transaction fail to meet or discharge their obligation to the Company. The Company actively manages this exposure to credit and contract execution risk from both a customer and a supplier perspective. Internal credit policies govern the Company’s credit portfolio and limit transactions according to a counterparty’s and a supplier’s credit quality. Counterparties for all financial derivatives transacted by the Company are major financial institutions or counterparties with investment grade credit ratings.
Liquidity Risk
Liquidity risk is the risk that the Company will not be able to meet its financial obligations as they become due. Liquidity risk also includes the risk of not being able to liquidate assets in a timely manner at a reasonable price. The Company’s process for managing liquidity risk includes ensuring, to the extent possible, that it has access to multiple sources of capital including: cash and cash equivalents, cash from operating activities, undrawn credit facilities and the availability to raise capital from various debt capital markets, including under its shelf prospectuses. The availability of capital under its shelf prospectuses is dependent on market conditions.
Competition
The energy industry is highly competitive with respect to gaining access to the resources required to increase oil and gas reserves and production and gain access to markets. The Company competes with others to acquire prospective lands, retain drilling capacity and field operating and construction services obtain sufficient pipeline and other transportation capacity, gain access to and retain adequate markets for its products and services and gain access to capital markets. The Company’s ability to successfully complete development projects could be adversely affected if it is unable to acquire economic supplies and services due to competition. Subsequent increases in the cost of or delays in acquiring supplies and services could result in uneconomic projects. The Company’s competitors comprise all types of energy companies, some of which have greater resources.
Internal Credit Risk
Credit ratings affect Husky’s ability to obtain short-term and long-term financing and the cost of such financing. Additionally, the ability of Husky to engage in ordinary course derivative or hedging transactions and maintain ordinary course contracts with customers and suppliers on acceptable terms depends on Husky’s credit ratings. A reduction in the current rating on Husky’s debt by one or more of its rating agencies, particularly a downgrade below investment grade ratings, or a negative change in Husky’s ratings outlook could adversely affect Husky’s cost of financing and its access to sources of liquidity and capital. Credit ratings are intended to provide investors with an independent measure of credit quality of any issuer of securities. The credit ratings accorded to Husky’s securities by the rating agencies are not recommendations to purchase, hold or sell the securities in as much as such ratings do not comment as to market price or suitability for a particular investor. Any rating may not remain in effect for any given period of time or may be revised or withdrawn entirely by a rating agency in the future if in its judgment circumstances so warrant.
General Economic Conditions
General economic conditions may have a material adverse effect on the Company’s results of operations, liquidity and financial condition. A decline in economic activity will reduce demand for petroleum products and adversely affect the price the Company receives for its commodities. The Company’s cash flow could decline, assets could be impaired, future access to capital could be restricted and major development projects could be delayed or abandoned.
Cost or Availability of Oil and Gas Field Equipment
The cost or availability of oil and gas field equipment may adversely affect the Company’s ability to undertake exploration, development and construction projects. The oil and gas industry is cyclical in nature and is prone to shortages of supply of equipment and services including land and offshore drilling rigs, land and offshore geological and geophysical services, engineering and construction services and construction materials. These materials and services may not be available when required at reasonable prices.
Climatic Conditions
Extreme climatic conditions may have significant adverse effects on operations. The predictability of the demand for energy is affected to a large degree by the predictability of weather and climate. In addition, the Company’s exploration, production and construction operations, or disruptions to the operations of major customers or suppliers, can be affected by extreme weather. This may result in cessation or diminishment of production, delay of exploration and development activities or delay of plant construction. All of these could potentially cause adverse financial impacts.
The Company operates in some of the harshest environments in the world, including offshore in the Atlantic Region. Climate change is expected to increase severe weather conditions in these locations including winds, flooding and variable temperatures, which are contributing to the melting of Northern ice and increased creation of icebergs. Icebergs off the coast of Newfoundland and Labrador may threaten offshore oil production facilities, causing damage to equipment and possible production disruptions, spills, asset damage and human impacts. The Company has in place a number of policies to protect people, equipment and the environment in the event of extreme weather conditions and ice melt conditions.
The Company’s Atlantic Region business unit has a robust ice management program which uses a range of resources including a dedicated ice surveillance aircraft, as well as synergistic relationships with government agencies including Environment Canada, the Coast Guard and Canadian Ice Service. Regular ice surveillance flights commence in February and continue until the threat has abated. In addition, Atlantic Region operators employ a series of supply and support vessels to actively manage ice and icebergs. These vessels are equipped with a variety of ice management tools including towing ropes, towing nets and water cannons. The Company also maintains a series of ad-hoc relationships with contractors, allowing the quick mobilization of additional resources as required. In 2008, three additional vessels were hired for ice management, bringing the total number of available vessels to 10.
HUSKY EMPLOYEES
The number of Husky’s permanent employees was as follows:
| | | | | | | | | | | | |
| | | As at December 31, | |
| | | 2014 | | | 2013 | | | 2012 | |
| | | 5,774 | | | | 5,479 | | | | 5,178 | |
DIVIDENDS
The following table shows the aggregate amount of the dividends per common share, Series 1 Preferred Shares and Series 3 Preferred Shares of the Company declared payable in respect of its last three years ended December 31:
| | | | | | | | | | | | |
| | | 2014 | | | 2013 | | | 2012 | |
Dividends per Common Share | | $ | 1.20 | | | $ | 1.20 | | | $ | 1.20 | |
Dividends per Series 1 Preferred Share | | $ | 1.11 | | | $ | 1.11 | | | $ | 1.11 | |
Dividends per Series 3 Preferred Share | | | — | | | | — | | | | — | |
Dividend Policy and Restrictions
Common Share Dividends
The Board of Directors has established a dividend policy that pays quarterly dividends of $0.30 ($1.20 annually) per common share. The declaration and payment of dividends are at the discretion of the Board of Directors, which will consider earnings, capital requirements and financial condition of Husky, the satisfaction of the applicable solvency test in Husky’s governing corporate statute, theBusiness Corporations Act (Alberta), and other relevant factors.
Shareholders have the ability to receive dividends in common shares or in cash. Quarterly dividends are declared in an amount expressed in dollars per common share and can be paid by way of issuance of a fraction of a common share per outstanding common share determined by dividing the dollar amount of the dividend by the volume weighted average trading price of the common shares on the principal stock exchange on which the common shares are traded. The volume weighted average trading price of the common shares is calculated by dividing the total value by the total volume of common shares traded over the five trading day period immediately prior to the payment date of the dividend on the common shares. The Board of Directors discontinued the payment of dividends by way of the issuance of common shares on November 15, 2013 and reinstated it on May 6, 2014.
Husky’s dividend policy will continue to be reviewed and there can be no assurance that further dividends will be declared or the amount of any future dividend.
Series 1 Preferred Share Dividends
Holders of Series 1 Preferred Shares are entitled to receive a cumulative quarterly fixed dividend, payable on the last day of March, June, September and December in each year, yielding 4.45% annually for the initial period ending March 31, 2016, as and when declared by the Board of Directors. Thereafter, the dividend rate will be reset every five years at a rate equal to the 5-year Government of Canada bond yield plus 1.73%. Holders of Series 1 Preferred Shares will have the right, at their option, to convert their shares into Series 2 Preferred Shares, subject to certain conditions, on March 31, 2016 and on March 31 every five years thereafter. Holders of the Series 2 Preferred Shares are entitled to receive a cumulative quarterly floating rate dividend at a rate equal to the three-month Government of Canada Treasury Bill yield plus 1.73% as and when declared by the Board of Directors.
Series 3 Preferred Share Dividends
Holders of the Series 3 Shares are entitled to receive a cumulative quarterly fixed dividend yielding 4.50% annually for the initial period ending December 31, 2019 as declared by Husky. Thereafter, the dividend rate will be reset every five years at the rate equal to the five-year Government of Canada bond yield plus 3.13%. Holders of Series 3 Shares will have the right, at their option, to convert their shares into Series 4 Shares, subject to certain conditions, on December 31, 2019 and on December 31 every five years thereafter. Holders of the Series 4 Shares will be entitled to receive cumulative quarterly floating dividends at a rate equal to the 90-day Government of Canada Treasury Bill yield plus 3.13%.
DESCRIPTION OF CAPITAL STRUCTURE
Common Shares
Husky is authorized to issue an unlimited number of no par value common shares. The holders of common shares are entitled to receive notice of and attend all meetings of shareholders, except meetings at which only holders of a specified class or series of shares are entitled to vote, and are entitled to one vote per common share held. Holders of common shares are also entitled to receive dividends as declared by the Board of Directors on the common shares payable in whole or in part as a stock dividend in fully paid and non-assessable common shares or by the payment of cash. Holders are also entitled to receive the remaining property of Husky upon dissolution in equal rank with the holders of all other common shares.
If the Board of Directors declares a dividend on the common shares payable in whole or in part as a stock dividend, unless otherwise determined by the Board of Directors of Husky in respect of a particular dividend, the value of the common shares for purposes of each stock dividend declared by the Board of Directors of Husky shall be deemed to be the volume weighted average trading price of the common shares on the principal stock exchange on which the common shares are traded, calculated by dividing the total value by the total volume of common shares traded over the 5 trading day period immediately prior to the payment date of the dividend on the common shares. In such event, shareholders of record wishing to accept a payment of the stock dividend, and of future stock dividends declared by the Board of Directors in the form of common shares, are required to complete and deliver to Husky’s transfer agent a Stock Dividend Confirmation Notice at least five business days prior to the record date of a declared dividend. The Stock Dividend Confirmation Notice permits shareholders to confirm that they will accept common shares as payment of the dividend on all or a stated number of their common shares. A Stock Dividend Confirmation Notice will remain in effect for all stock dividends on the common shares to which it relates and which are held by the shareholder unless the shareholder delivers a revocation notice to Husky’s transfer agent, in which case the Stock Dividend Confirmation Notice will not be effective for any dividends having a declaration date that is more than five business days following receipt of the revocation notice by Husky’s transfer agent. In the event a shareholder fails to deliver a Stock Dividend Confirmation Notice at least five business days prior to the record date of a declared dividend, or delivers a Stock Dividend Confirmation Notice confirming that the holder of common shares accepts the common shares as payment of the dividend on some but not all of the holder’s common shares, the dividend on common shares for which no Stock Dividend Confirmation Notice was delivered or the dividend on those of the holder’s common shares in respect of which the holder did not deliver a Stock Dividend Confirmation Notice, will be paid in cash. See “Dividends—Dividend Policy and Restrictions.”
Preferred Shares
Husky is authorized to issue an unlimited number of no par value preferred shares. The preferred shares as a class have attached thereto the rights, privileges, restrictions and conditions set forth below.
The preferred shares may from time to time be issued in one or more series, and the Board of Directors may fix from time to time before such issue the number of preferred shares which is to comprise each series and the designation, rights, privileges, restrictions and conditions attached to each series of preferred shares including, without limiting the generality of the foregoing, any voting rights, the rate or amount of dividends or, the method of calculating dividends, the dates of payment thereof, the terms and conditions of redemption, purchase and conversion if any, and any sinking fund or other provision.
The preferred shares of each series shall, with respect to the payment of dividends and the distribution of assets or return of capital in the event of liquidation, dissolution or winding up of Husky, whether voluntary or involuntary, or any other return of capital or distribution of assets of Husky amongst its shareholders for the purpose of winding up its affairs, be entitled to preference over the common shares of Husky and over any other shares of Husky ranking by their terms junior to the preferred shares of that series. The preferred shares of any series may also be given such other preferences over the common shares of Husky and any other such preferred shares.
If any cumulative dividends or amounts payable on the return of capital in respect of a series of preferred shares are not paid in full, all series of preferred shares shall participate ratably in respect of accumulated dividends and return of capital.
In 2011, Husky issued 12 million Series 1 Preferred Shares and authorized the issuance of 12 million Series 2 Preferred Shares. In 2014, Husky issued 10 million Series 3 Preferred Shares. See “Dividends—Dividend Policy and Restrictions—Series 1 Preferred Share Dividends” and “Dividends—Dividend Policy and Restrictions—Series 3 Preferred Share Dividends.”
Liquidity Summary
The following information relating to Husky’s credit ratings is provided as it relates to Husky’s financing costs, liquidity and operations. Specifically, credit ratings affect Husky’s ability to obtain short-term and long-term financing and the cost of such financing. Additionally, the ability of Husky to engage in certain collateralized business activities on a cost effective basis depends on Husky’s credit ratings. A reduction in the current rating on Husky’s debt by one or more of its rating agencies, particularly a downgrade below investment grade ratings, or a negative change in Husky’s ratings outlook could adversely affect Husky’s cost of financing and its access to sources of liquidity and capital. In addition, changes in credit ratings may affect Husky’s ability to enter, and the associated costs of entering, (i) into ordinary course derivative or hedging transactions, which may require Husky to post additional collateral under certain of its contracts, and (ii) into and maintaining ordinary course contracts with customers and suppliers on acceptable terms.
| | | | | | | | |
| | | Outlook | | | Rating | |
Moody’s | | | | | | | | |
Senior Unsecured Debt | | | Stable | | | | Baa2 | |
Standard and Poor’s | | | | | | | | |
Senior Unsecured Debt | | | Stable | | | | BBB+ | |
Series 1 Preferred Shares | | | Stable | | | | P-2 (low) | |
Series 3 Preferred Shares | | | Stable | | | | P-2 (low) | |
Dominion Bond Rating Service | | | | | | | | |
Senior Unsecured Debt | | | Stable | | | | A (low) | |
Series 1 Preferred Shares | | | Stable | | | | Pfd-2 (low) | |
Series 3 Preferred Shares | | | Stable | | | | Pfd-2 (low) | |
Commercial Paper | | | Stable | | | | R-1 (low) | |
Credit ratings are intended to provide investors with an independent measure of credit quality of any issuer of securities. The credit ratings accorded to Husky’s securities by the rating agencies are not recommendations to purchase, hold or sell the securities inasmuch as such ratings do not comment as to market price or suitability for a particular investor. Any rating may not remain in effect for any given period of time or may be revised or withdrawn entirely by a rating agency in the future, if in its judgment, circumstances so warrant.
Moody’s
Moody’s long-term credit ratings are on a rating scale that ranges from Aaa (highest) to C (lowest). A rating of Baa2 by Moody’s is within the fourth highest of nine categories and is assigned to debt securities which are considered medium-grade (i.e., they are subject to moderate credit risk). Such debt securities may possess certain speculative characteristics. The addition of a 1, 2 or 3 modifier after a rating indicates the relative standing within a particular rating category. The modifier 1 indicates that the issue ranks in the higher end of its generic rating category, the modifier 2 indicates a mid-range ranking and the modifier 3 indicates a ranking in the lower end of that generic rating category.
Standard and Poor’s
Standard and Poor’s long-term credit ratings are on a rating scale that ranges from AAA (highest) to D (lowest). A rating of BBB+ by Standard & Poor’s is within the fourth highest of ten categories and indicates that the obligation exhibits adequate protection parameters. However, adverse economic conditions or changing circumstances are more likely to lead to a weakened capacity of the obligor to meet its financial commitment on the obligation. The addition of a plus (+) or minus (-) designation after a rating indicates the relative standing within the major rating categories.
Standard and Poor’s began rating Husky’s Series 1 Preferred Shares and Series 3 Preferred Shares on its Canadian preferred share scale on March 11, 2011 and December 9, 2014, respectively. Preferred share ratings are a forward-looking opinion about the creditworthiness of an issuer with respect to a specific preferred share obligation. There is a direct correspondence between the ratings assigned on the preferred share scale and Standard & Poor’s ratings scale for long-term credit ratings. According to Standard and Poor’s ratings system, a P-2 (low) rating on the Canadian preferred share rating scale is equivalent to a BBB- rating on the long-term credit rating scale.
Dominion Bond Rating Service
Dominion Bond Rating Service’s long-term credit ratings are on a rating scale that ranges from AAA (highest) to D (lowest). A rating of A (low) by Dominion Bond Rating Service is within the third highest of ten categories and is assigned to debt securities considered to be of good credit quality. The capacity for payment of financial obligations is substantial, but of lesser credit quality than that of higher rated securities. Entities in the A category may be vulnerable to future events, but qualifying negative factors are considered manageable. The assignment of a “(high)” or “(low)” modifier within each rating category indicates relative standing within such category.
Dominion Bond Rating Service began rating Husky’s Series 1 Preferred Shares and Series 3 Preferred Shares on its Canadian preferred share scale on March 10, 2011 and December 9, 2014, respectively. Preferred share ratings are meant to give an indication of the risk that an issuer will not fulfill its full obligations in a timely manner, with respect to both dividend and principal commitments. Dominion Bond Rating Service preferred share ratings range from Pdf-1 (highest) to D (lowest). According to the Dominion Bond Rating Service ratings system, preferred shares rated Pfd-2 are of satisfactory credit quality where protection of dividends and principal is still substantial, but earnings, the balance sheet and coverage ratios are not as strong as Pfd-1 rated companies.
Dominion Bond Rating Service began rating Husky’s commercial paper on September 4, 2014. Credit ratings on commercial paper are on a short-term debt rating scale that ranges from R-1 (high) to D1 representing the range of such securities rated from highest to lowest qualify. A rating of R-1 (low) by Dominion Bond Rating Service is the third highest of 10 categories and is assigned to debt securities considered to be of good credit quality. The capacity for the payment of short-term financial obligations as they become due is substantial with overall strength not as favourable as higher rating categories. Entities in this category may be vulnerable to future events, but qualifying negative factors are considered manageable. The R-1 and R-2 commercial paper categories are denoted by (high), (middle), and (low) designations.
MARKET FOR SECURITIES
Husky’s common shares, Series 1 Preferred Shares and Series 3 Preferred Shares are listed and posted for trading on the Toronto Stock Exchange under the respective trading symbols “HSE”, “HSE.PR.A” and “HSE.PR.C”. The Series 1 Preferred Shares began trading on the Toronto Stock Exchange on March 18, 2011. The Series 3 Preferred Shares began trading on the Toronto Stock Exchange on December 9, 2014.
The following table discloses the trading price range and volume of Husky’s common shares traded on the Toronto Stock Exchange during Husky’s financial year ended December 31, 2014:
| | | | | | | | | | | | |
| | | High | | | Low | | | Volume
(000’s) | |
January | | | 33.84 | | | | 32.24 | | | | 14,898 | |
February | | | 33.98 | | | | 31.70 | | | | 20,593 | |
March | | | 34.28 | | | | 32.29 | | | | 14,578 | |
April | | | 37.31 | | | | 33.24 | | | | 22,044 | |
May | | | 37.09 | | | | 35.22 | | | | 12,830 | |
June | | | 37.28 | | | | 34.06 | | | | 18,104 | |
July | | | 34.83 | | | | 32.91 | | | | 18,131 | |
August | | | 33.39 | | | | 32.05 | | | | 14,043 | |
September | | | 33.62 | | | | 30.55 | | | | 17,897 | |
October | | | 30.74 | | | | 26.41 | | | | 29,044 | |
November | | | 27.57 | | | | 24.11 | | | | 29,257 | |
December | | | 27.93 | | | | 21.39 | | | | 35,153 | |
The following table discloses the trading price range and volume of the Series 1 Preferred Shares traded on the Toronto Stock Exchange during Husky’s financial year ended December 31, 2014:
| | | | | | | | | | | | |
| | | High | | | Low | | | Volume
(000’s) | |
January | | | 23.21 | | | | 22.58 | | | | 118 | |
February | | | 23.11 | | | | 22.32 | | | | 199 | |
March | | | 23.22 | | | | 22.55 | | | | 1,148 | |
April | | | 23.24 | | | | 22.85 | | | | 248 | |
May | | | 23.65 | | | | 22.86 | | | | 343 | |
June | | | 23.12 | | | | 22.57 | | | | 108 | |
July | | | 23.45 | | | | 22.93 | | | | 364 | |
August | | | 23.39 | | | | 22.84 | | | | 108 | |
September | | | 23.11 | | | | 22.86 | | | | 210 | |
October | | | 23.00 | | | | 22.48 | | | | 395 | |
November | | | 23.30 | | | | 22.47 | | | | 250 | |
December | | | 22.79 | | | | 18.75 | | | | 534 | |
The following table discloses the trading price range and volume of the Series 3 Preferred Shares traded on the Toronto Stock Exchange during Husky’s financial year ended December 31, 2014:
| | | | | | | | | | | | | | | | |
| | | High | | | Low | | | Volume
(000’s) | |
December | | | 25.73 | | | | 24.7 | | | | 0 | | | | 1,005 | |
DIRECTORS AND OFFICERS
The following are the names and residences of the directors and officers of Husky as of the date of this AIF, their positions and offices with Husky and their principal occupations for at least the five preceding years. Each director will hold office until the Company’s next annual meeting or until his or her successor is appointed or elected. In addition, Cheung Kong (Holdings) Limited announced in January 2015 a reorganization and combination of the businesses of Cheung Kong (Holdings) Limited and its subsidiaries and Hutchison Whampoa Limited and its subsidiaries to create two new Hong Kong listed companies: (i) CK Hutchison Holdings Limited; and (ii) Cheung Kong Property Holdings Limited. It is expected that effective March 18, 2015 each of Messrs. Li, Fok, Kwok, Magnus and Sixt will become directors of CK Hutchison Holdings Limited and cease to be directors of Cheung Kong (Holdings) Limited.
Directors
| | | | |
Name & Residence | | Office or Position | | Principal Occupation During Past Five Years |
| | |
Li, Victor T.K. Hong Kong Special Administrative Region | | Co-Chair Director of Husky since August 2000 | | Mr. Li is Managing Director, Deputy Chairman and Chairman of the Executive Committee of Cheung Kong (Holdings) Limited (a public investment holding and project management company). He is also the Managing Director and Deputy Chairman of CK Hutchison Holdings Limited (which is proposed to be listed on the Main Board of The Stock Exchange of Hong Kong Limited in March 2015 as the new holding company of the Cheung Kong Group). He is also a Director of Cheung Kong Property Holdings Limited (which is proposed to be listed on the Main Board of The Stock Exchange of Hong Kong Limited around the end of the first half of 2015). |
| | |
| | | | Mr. Li is also Deputy Chairman and Executive Director of Hutchison Whampoa Limited (an investment holding company); Chairman and Executive Director of Cheung Kong Infrastructure Holdings Limited (an infrastructure company) and of CK Life Sciences Int’l, (Holdings) Inc. (a biotechnology company); a Non-Executive Director of Power Assets Holdings Limited (a holding company); a Non-Executive Director and the Deputy Chairman of HK Electric Investments Limited (an investment holding company); a Non-Executive Director of HK Electric Investments Manager Limited (the trustee-manager of HK Electric Investments); and a non-executive Director of The Hongkong and Shanghai Banking Corporation Limited. Mr. Li is also the Deputy Chairman of Li Ka Shing Foundation Limited, Li Ka Shing (Overseas) Foundation and Li Ka Shing (Canada) Foundation. |
| | |
| | | | Mr. Li is a member of the Standing Committee of the 12th National Committee of the Chinese People’s Political Consultative Conference of the People’s Republic of China and he is also a member of the Council for Sustainable Development of the Hong Kong Special Administrative Region, a member of the Commission on Strategic Development and Vice Chairman of the Hong Kong General Chamber of Commerce. Mr. Li is also the Honorary Consul of Barbados in Hong Kong. |
| | | | |
| | |
| | | | Mr. Li holds a Bachelor of Science degree in Civil Engineering and a Master of Science degree in Structural Engineering, both received from Stanford University in 1987. He obtained an honorary degree, Doctor of Laws, honoris causa (LL.D.) from The University of Western Ontario in 2009. |
| | |
Fok, Canning K.N. Hong Kong Special Administrative Region | | Co-Chair and Chair of the Compensation Committee Director of Husky since August 2000 | | Mr. Fok is Group Managing Director and an Executive Director of Hutchison Whampoa Limited. He is also a Non-Executive Director of CK Hutchison Holdings Limited (which is proposed to be listed on the Main Board of The Stock Exchange of Hong Kong Limited in March 2015 as new holding company of the Cheung Kong Group). |
| | |
| | | | Mr. Fok is Chairman and a Director of Hutchison Harbour Ring Limited, Hutchison Telecommunications Hong Kong Holdings Limited, Hutchison Telecommunications (Australia) Limited, Hutchison Port Holdings Management Pte. Limited as the trustee-manager of Hutchison Port Holdings Trust, Power Assets Holdings Limited, HK Electric Investments Manager Limited as the trustee-manager of HK Electric Investments, and HK Electric Investments Limited. Mr. Fok is Deputy Chairman and an Executive Director of Cheung Kong Infrastructure Holdings Limited, a Non-Executive Director of Cheung Kong (Holdings) Limited and Alternate Director to a Director of Hutchison Telecommunications Hong Kong Holdings Limited. Mr. Fok was also Chairman and a Director of Partner Communications Company Ltd. from 1998 to 2009 and Chairman and Non-Executive Director of Hutchison Telecommunications International Limited from 2004 to 2010. |
| | |
| | | | Mr. Fok obtained a Bachelor of Arts degree from St. John’s University, Minnesota in 1974 and a Diploma in Financial Management from the University of New England, Australia in 1976. He has been a member of the Institute of Chartered Accountants in Australia since 1979. |
| | |
Bradley, Stephen E. Beijing, People’s Republic of China | | Member of the Audit Committee and the Corporate Governance Committee Director of Husky since July 2010 | | Mr. Bradley is a Director of Broadlea Group Ltd., Vice Chairman, Beijing Uni-Alliance Property Development Co. Ltd., Senior Consultant, ICAP (Asia Pacific) Ltd. and a Director of Swire Properties Ltd. (Hong Kong). |
| | | Mr. Bradley entered the British Diplomatic Service in 1981 and served in various capacities, including Director of Trade & Investment Promotions (Paris) from 1999 to 2002; Minister, Deputy Head of Mission & Consul-General (Beijing) from 2002 to 2003 and HM Consul-General (Hong Kong) from 2003 to 2008. Mr. Bradley also worked in the private sector as Marketing Director, Guinness Peat Aviation (Asia) from 1987 to 1988 and Associate Director, Lloyd George Investment Management (now part of BMO Global Asset Management) from 1993 to 1995. Mr. Bradley retired from the Diplomatic Service in 2009. |
| | |
| | | | Mr. Bradley obtained a Bachelor of Arts degree from Balliol College, Oxford University in 1980 and a post-graduate diploma from Fudan University, Shanghai in 1981. Mr.Bradley is a Member of the Hong Kong Securities and Investment Institute and an ICD.D with the Institute of Corporate Directors of Canada |
| | | | |
| | |
Ghosh, Asim Alberta, Canada | | President & Chief Executive Officer Director of Husky since May 2009 | | Mr. Ghosh was appointed the President & Chief Executive Officer of Husky on June 1, 2010. Prior thereto Mr. Ghosh was the Managing Director and Chief Executive Officer of Vodafone India Limited (formerly Vodafone Essar Limited) (a telecommunications company) until March 2009. |
| | |
| | | | Mr. Ghosh began his career with Procter & Gamble in Canada in 1971 and subsequently worked with Rothmans International in what was then its Carling O’Keefe subsidiary from 1980 to 1988, his last position being Senior Vice President of the brewery operations. In 1989, Mr. Ghosh moved to India as the Chief Executive Officer of the Pepsi Foods (Frito Lay) start up in India. From 1991 to 1998 he held senior executive positions and then the position of Chief Executive Officer of the A S Watson Industries subsidiary (a manufacturer of consumer goods) of Hutchison Whampoa Limited. In August 1998, he became Managing Director and Chief Executive Officer of the company that would become Vodafone India Limited. |
| | |
| | | | Mr. Ghosh was Chairman of the Cellular Operators Association of India and of the National Telecom Committee of the Confederation of Indian Industries. He is an independent director of Kotak Mahindra Bank Limited, a listed bank in India, and was on the Board of Directors of Vodafone India Limited until February 2010. Mr. Ghosh is also a director of the Li Ka Shing (Canada) Foundation and a member of the Board of Directors of the Canadian Council of Chief Executives. |
| | |
| | | | Mr. Ghosh obtained an undergraduate degree in Electrical Engineering from the Indian Institute of Technology in 1969 and received a Master’s degree in Business Administration from the Wharton School, University of Pennsylvania in 1971. |
| | |
Glynn, Martin J.G. British Columbia, Canada | | Chair of the Corporate Governance Committee and a Member of the Compensation Committee Director of Husky since August 2000 | | Mr. Glynn is a Director of Public Sector Pension Investment Board (PSP Investments), Sun Life Financial Inc., Sun Life Assurance Company of Canada and Chair of UBC Investment Management Trust Inc. |
| | | Mr. Glynn was a Director from 2000 to 2006 and President and Chief Executive Officer of HSBC Bank USA N.A. from 2003 until his retirement in 2006. Mr. Glynn was a Director of HSBC Bank Canada from 1999 to 2006 and President and Chief Executive Officer from 1999 to 2003. |
| | |
| | | | Mr. Glynn obtained a Bachelor of Arts, Honours degree from Carleton University, Canada in 1974 and a Master’s degree in Business Administration from University of British Columbia in 1976. |
| | | | |
| | |
Koh, Poh Chan Hong Kong Special Administrative Region | | Director of Husky since August 2000 | | Ms. Koh is Finance Director of Harbour Plaza Hotel Management (International) Ltd. (a hotel management company). |
| | Ms. Koh is qualified as a Fellow Member (FCA) of the Institute of Chartered Accountants in England and Wales and is an Associate of the Canadian Institute of Chartered Accountants (CPA, CA) and the Chartered Institute of Taxation in the U.K. (CTA). |
| | |
| | | | Ms. Koh graduated from the London School of Accountancy in 1971 and was admitted to the Institute of Chartered Accountants in England and Wales in 1973, to the Chartered Institute of Taxation in the UK in 1976 as well as the Institute of Chartered Accountants of Ontario, Canada in 1980. |
| | |
Kwok, Eva L. British Columbia, Canada | | Member of the Compensation Committee and the Corporate Governance Committee Director of Husky since August 2000 | | Mrs. Kwok is Chairman, a Director and Chief Executive Officer of Amara Holdings Inc. (a private investment holding company). Mrs. Kwok is also a Director of CK Life Sciences Int’l., (Holdings) Inc. and Cheung Kong Infrastructure Holdings Limited. Mrs. Kwok is also a director of the Li Ka Shing (Canada) Foundation. |
| | | Mrs. Kwok was a Director of Shoppers Drug Mart Corporation from 2004 to 2006 and of the Bank of Montreal Group of Companies until March 2009. |
| | |
| | | | Mrs. Kwok obtained a Master’s degree in Science from the University of London in 1967. |
| | |
Kwok, Stanley T.L. British Columbia, Canada | | Chair of the Health, Safety and Environment Committee Director of Husky since August 2000 | | Mr. Kwok is a Director and President of Stanley Kwok Consultants (a planning and development company). Mr. Kwok is also a Director and President of Amara Holdings Inc. and a Director of Cheung Kong (Holdings) Limited and CTC Bank of Canada. He is also a Director of CK Hutchison Holdings Limited (which is proposed to be listed on the Main Board of The Stock Exchange of Hong Kong Limited in March 2015 as new holding company of the Cheung Kong Group). |
| | |
| | | | Mr. Kwok obtained a Bachelor of Science degree (Architecture) from St. John’s University, Shanghai in 1949 and an A.A. Diploma from the Architectural Association School of Architecture in London, England in 1954. |
| | |
Ma, Frederick S. H. Hong Kong Special Administrative Region | | Member of the Audit Committee and the Health, Safety and Environment Committee Director of Husky since July 2010 | | Mr. Ma has held senior management positions in international financial institutions and Hong Kong Special Administrative Region publicly listed companies in his career. He was also a former Principal Official with the Hong Kong Special Administrative Region (SAR) Government. |
| | | | |
| | |
| | | | In addition to being a Director of Husky Energy Inc., he is currently an independent Non-Executive Director and Chairman of the Audit Committee of Agricultural Bank of China Limited and Aluminum Corporation of China Limited and an independent Non-Executive Director of Hutchison Port Holdings Management Pte. Limited and Mass Transit Railway Corporation Limited. Mr. Ma is also a Non-Executive Director of COFCO Corporation, China Mobile Communications Corporation and FWD Group Management Holdings Limited. |
| | |
| | | | In July 2002, Mr. Ma joined the Government of the Hong Kong Special Administrative Region as the Secretary for Financial Services and the Treasury. He assumed the post of Secretary for Commerce and Economic Development in July 2007, but resigned from the Government in July 2008 due to medical reasons. Mr. Ma was appointed as a member of the International Advisory Council of China Investment Corporation in July 2009. In January 2013, he was appointed as a member of the Global Advisory Council of Bank of America. Mr. Ma was appointed as an Honorary Professor of the School of Economics and Finance at the University of Hong Kong in October 2008 and as a Professor of Finance Practice of the Institute of Advanced Executive Education at the Hong Kong Polytechnic University in July 2012. In August 2013, he was appointed as an Honorary Professor of the Faculty of Business Administration at the Chinese University of Hong Kong. |
| | |
| | | | Mr. Ma obtained a Bachelor of Arts (Honours) degree in Economics and History from the University of Hong Kong in 1973 and an Honorary Doctor of Social Sciences in October 2014 from Lingnan University. |
| | |
Magnus, George C. Hong Kong Special Administrative Region | | Member of the Audit Committee Director of Husky since July 2010 | | Mr. Magnus is a Non-Executive Director of Cheung Kong (Holdings) Limited since November 2005. He is a Non-Executive Director of Hutchison Whampoa Limited and Cheung Kong Infrastructure Holdings Limited and an Independent Non-Executive Director of HK Electric Investments Limited. He is also a Non-Executive Director of CK Hutchison Holdings Limited (which is proposed to be listed on the Main Board of The Stock Exchange of Hong Kong Limited in March 2015 as new holding company of the Cheung Kong Group).. |
| | |
| | | | Mr. Magnus acted as an Executive Director of Cheung Kong (Holdings) Limited from 1980 and as Deputy Chairman from 1985 until his retirement from these positions in October 2005. He served as Deputy Chairman of Hutchison Whampoa Limited from 1985 to 1993 and as Executive Director from 1993 to 2005. He also served as Chairman of Hongkong Electric Holdings Limited (now known as Power Assets Holdings Limited) from 1993 to 2005. He was Non-Executive Director of Power Assets Holdings Limited from 2005 to 2012 and then an Independent Non-Executive Director until January 2014. |
| | |
| | | | Mr. Magnus obtained a Bachelor of Arts degree in 1959. He obtained a Master’s degree in Economics from King’s College, Cambridge University in 1963. |
| | | | |
| | |
McGee, Neil D. Luxembourg | | Member of the Health, Safety and Environment Committee Director of Husky since November 2012 | | Mr. McGee is the Managing Director of Hutchison Whampoa Europe Investments S.à r.l. He is an Executive Director of Power Assets Holdings Limited. Prior to his joining Hutchison Whampoa Europe Investments S.à r.l., he served as Group Finance Director of Power Assets Holdings Limited from 2006 to 2012, Chief Financial Officer of Husky Oil Limited from 1998 to 2000 and Chief Financial Officer of Husky Energy Inc. from 2000 to 2005. |
| | |
| | | | Prior to joining Husky Oil Limited in 1998, Mr. McGee held various financial, legal and corporate secretarial positions within the Hutchison Whampoa Group. Mr. McGee holds a Bachelor of Arts degree and a Bachelor of Laws degree from the Australian National University. |
| | |
Russel, Colin S. Gloucestershire, United Kingdom | | Member of the Audit Committee and the Health, Safety and Environment Committee Director of Husky since February 2008 | | Mr. Russel is the founder and Managing Director of Emerging Markets Advisory Services Ltd. (a business advisory company). Mr. Russel is a Director of Cheung Kong Infrastructure Holdings Limited, CK Life Sciences Int’l., (Holdings) Inc. and ARA Asset Management Pte. Ltd. Mr. Russel was the Canadian Ambassador to Venezuela, Consul General for Canada in Hong Kong, Director for China of the Department of Foreign Affairs, Ottawa, Director for East Asian Trade in Ottawa, Senior Trade Commissioner for Canada in Hong Kong, Director for Japan Trade in Ottawa and was in the Trade Commissioner Service for Canada in Spain, Hong Kong, Morocco, the Philippines, London and India. Previously, Mr. Russel was an international project manager with RCA Ltd., Canada and development engineer with AEI Ltd., UK. |
| | |
| | | | Mr. Russel is a Professional Engineer and Qualified Commercial Mediator. He received his degree in Electrical Engineering in 1962 and a Master’s degree in Business Administration in 1971 both from McGill University, Canada. |
| | |
Shaw, Wayne E. Ontario, Canada | | Member of the Corporate Governance Committee and the Health, Safety and Environment Committee Director of Husky since August 2000 | | Mr. Shaw is the President of Imperial Valley Holdings Ltd. Prior to his retirement in April 2013, he was a Senior Partner with Stikeman Elliott LLP, Barristers and Solicitors. Mr. Shaw is also a Director of the Li Ka Shing (Canada) Foundation. Mr. Shaw holds a Bachelor of Arts degree and a Bachelor of Laws degree, both received from the University of Alberta in 1967. He is a member of the Law Society of Upper Canada. |
| | | | |
| | |
Shurniak, William Saskatchewan, Canada | | Deputy Chair and Chair of the Audit Committee Director of Husky since August 2000 | | Mr. Shurniak is an independent Non-Executive Director of Hutchison Whampoa Limited and from May 2005 to June 2011 he was a Director and Chairman of Northern Gas Networks Limited (a private distributor of natural gas in Northern England). |
| | |
| | | | Mr. Shurniak also held the following positions until his return to Canada in 2005: Director and Chairman of ETSA Utilities (a utility company) since 2000, Powercor Australia Limited (a utility company) since 2000, CitiPower Pty Ltd. (a utility company) since 2002, and a director of Envestra Limited (a natural gas distributor) since 2000, CrossCity Motorways Pty Ltd. (an infrastructure and transportation company) since 2002 and Lane Cove Tunnel Company Pty Ltd. (an infrastructure and transportation company) since 2004. |
| | |
| | | | Mr. Shurniak obtained an Honorary Doctor of Laws degree from the University of Saskatchewan in May 1998 and from The University of Western Ontario in October 2000. On July 30, 2005, he was a recipient of the Saskatchewan Centennial Medal from the Lieutenant Governor of Saskatchewan. In 2009 he was awarded the Saskatchewan Order of Merit by the government of the Province of Saskatchewan. In December 2012 Mr. Shurniak was a recipient of The Queen Elizabeth II Diamond Jubilee Medal from the Lieutenant Governor of Saskatchewan. On June 4, 2014, the University of Regina conferred an Honorary Doctor of Laws degree on Mr. Shurniak. |
| | |
Sixt, Frank J. Hong Kong Special Administrative Region | | Member of the Compensation Committee Director of Husky since August 2000 | | Mr. Sixt is Group Finance Director and Executive Director of Hutchison Whampoa Limited. He is also Group Finance Director and a Non-Executive Director of CK Hutchison Holdings Limited (which is proposed to be listed on the Main Board of The Stock Exchange of Hong Kong Limited in March 2015 as new holding company of the Cheung Kong Group). |
| | |
| | | | Mr. Sixt is also a Non-Executive Chairman of TOM Group Limited, an Executive Director of Cheung Kong Infrastructure Holdings Limited, a Non-Executive Director of Cheung Kong (Holdings) Limited, Hutchison Telecommunications Hong Kong Holdings Limited, Hutchison Port Holdings Management Pte. Limited as the trustee-manager of Hutchison Port Holdings Trust, and Power Assets Holdings Limited and a Director of Hutchison Telecommunications (Australia) Limited. Mr. Sixt is also a Director of the Li Ka Shing (Canada) Foundation. He was previously a Director of Partner Communications Company Ltd. from 1998 to 2009 and a Non-Executive Director of Hutchison Telecommunications International Limited from 2004 to 2010. |
| | |
| | | | Mr. Sixt obtained a Master’s degree in Arts from McGill University, Canada in 1978 and a Bachelor’s degree in Civil Law from Université de Montréal in 1978. He is a member of the Bar and of the Law Society of the Provinces of Quebec and Ontario, Canada. |
Officers
| | | | |
Name and Residence | | Office or Position | | Principal Occupation During Past Five Years |
Andruko, Darren R. Alberta, Canada | | Acting Chief Financial Officer | | Acting Chief Financial Officer of Husky since July 2014. Vice President & Treasurer of Husky Oil Operations Limited (HOOL)1 since April 2012. Treasurer of HOOL since 2009. |
| | |
Peabody, Robert J. Alberta, Canada | | Chief Operating Officer | | Chief Operating Officer of Husky since January 2006. |
| | |
Girgulis, James D. Alberta, Canada | | Senior Vice President, General Counsel & Secretary | | Vice President, Legal & Corporate Secretary of Husky since August 2000. Senior Vice President, General Counsel & Secretary since April 2012. |
| (1) | See “Intercorporate Relationships”. |
As at February 26, 2015, the directors and officers of Husky, as a group, beneficially owned or controlled or directed, directly or indirectly, 805,399 common shares of Husky, representing less than 1% of the issued and outstanding common shares.
Conflicts of Interest
The officers and directors of Husky may also become officers and/or directors of other companies engaged in the oil and gas business generally and which may own interests in oil and gas properties in which Husky holds or may in the future, hold an interest. As a result, situations may arise where the interests of such directors and officers conflict with their interests as directors and officers of other companies. In the case of the directors, the resolution of such conflicts is governed by applicable corporate laws that require that directors act honestly, in good faith and with a view to the best interests of Husky and, in respect of theBusiness Corporations Act(Alberta), Husky’s governing statute that directors declare, and refrain from voting on, any matter in which a director may have a conflict of interest.
Corporate Cease Trade Orders or Bankruptcies
None of those persons who are directors or executive officers of Husky is or have been within the past ten years, a director, chief executive officer or chief financial officer of any company, including Husky and any personal holding companies of such person that, while such person was acting in that capacity, was the subject of a cease trade or similar order or an order that denied the company access to any exemption under securities legislation, for a period of more than 30 consecutive days, or after such persons ceased to be a director, chief executive officer or chief financial officer of the company was the subject of a cease trade or similar order or an order that denied the company access to any exemption under securities legislation, for a period of more than 30 consecutive days, which resulted from an event that occurred while such person was acting in such capacity.
In addition, none of those persons who are directors or executive officers of Husky is, or has been within the past ten years, a director or executive officer of any company, including Husky and any personal holding companies of such persons, that while such person was acting in that capacity, or within a year of that person ceasing to act in that capacity became bankrupt, made a proposal under any legislation relating to bankruptcy or insolvency or was subject to or instituted any proceedings, arrangement or compromise with creditors or had a receiver, receiver manger or trustee appointed to hold its assets, other than as follows. Victor T. K. Li was a director of Star River Investment Limited, a Hong Kong Special Administrative Region company, until June 4, 2005, which commenced creditors voluntary wind up on September 28, 2004. Star River Investments Limited was owned as to 50% by Cheung Kong (Holdings) Limited and a wholly owned subsidiary of Cheung Kong (Holdings) Limited was the petitioning creditor. The company was subsequently dissolved on June 4, 2005. Mr. Glynn was director of MF Global Holdings Ltd. when it filed for Chapter 11 bankruptcy in the United States on October 31, 2011. Mr. Glynn is no longer a director of MF Global Holdings Ltd.
Individual Penalties, Sanctions or Bankruptcies
None of the persons who are directors or executive officers of Husky (or any personal holding companies of such persons) have, within the past ten years become bankrupt, made a proposal under any legislation relating to bankruptcy or insolvency or were subject to or instituted any proceedings, arrangement or compromise with creditors or had a receiver, receiver manager or trustee appointed to hold his or her assets.
None of the persons who are directors or executive officers of the Company (or any personal holding companies of such persons) have been subject to any penalties or sanctions imposed by a court relating to securities legislation or by a securities regulatory authority or have entered into a settlement agreement with a securities regulatory authority or been subject to any other penalties or sanctions imposed by a court or regulatory body that would likely be considered important to a reasonable investor in making an investment decision.
AUDIT COMMITTEE
The members of Husky’s Audit Committee (the “Committee”) are William Shurniak (Chair), Stephen E. Bradley, Colin S. Russel, Frederick S.H. Ma and George C. Magnus. Each of the members of the Committee is independent in that each member does not have a direct or indirect material relationship with the Company. Multilateral Instrument 52-110—“Audit Committees” provides that a material relationship is a relationship which could, in the view of the Company’s Board of Directors, reasonably interfere with the exercise of a member’s independent judgment.
The Committee’s Mandate provides that the Committee is to be comprised of at least three members of the Board, all of whom shall be independent and meet the financial literacy requirements of applicable laws and regulations. Each member of the Committee is financially literate in that each has the ability to read and understand a set of financial statements that present a breadth and level of complexity of accounting issues that are generally comparable to the breadth and complexity of the issues that can reasonably be expected to be raised by the Company’s financial statements.
The education and experience of each Audit Committee member that is relevant to the performance of his responsibilities as an Audit Committee member is as follows.
William Shurniak (Chair)—Mr. Shurniak is an independent, non-executive director and member of the audit committee of Hutchison Whampoa Limited and, from May 2005 to June 2011, a director and Chairman of Northern Gas Networks Limited, a private company in the U.K.. He has broad banking experience, and prior to his moving back to Canada in 2005, he spent five years in Australia where he was a director of a public company engaged in the distribution of natural gas. He was also a director and member of the audit committees of five other private companies, three of which are regulated electricity distribution companies.
Stephen E. Bradley—Mr. Bradley is a Director of Broadlea Group Ltd., Senior Representative (China), Grosvenor Ltd., Vice Chairman, ICAP (Asia Pacific) and a Director of Swire Properties Ltd. (Hong Kong).
Colin S. Russel—Mr. Russel is the founder and Managing Director of Emerging Markets Advisory Services Ltd. Mr. Russel is a director and an audit committee member of Cheung Kong Infrastructure Holdings Limited, CK Life Sciences Int’l., (Holdings) Inc. and ARA Asset Management Pte. Ltd.
Frederick S.H. Ma—Mr. Ma has served in senior positions in the private sector and has held Principal Official positions (minister equivalent) with the Hong Kong Special Administrative Region Government. Mr. Ma is currently a member of the International Advisory Council of China Investment Corporation, China’s Sovereign Fund, as well as an Honorary Professor of the University of Hong Kong.
George C. Magnus—Mr. Magnus has been a non-executive Director of Cheung Kong (Holdings) Limited since November 2005. He is also a non-executive Director of Hutchison Whampoa Limited, Cheung Kong Infrastructure Holdings Limited and Power Assets Holdings Limited (formerly Hongkong Electric Holdings Limited).
Husky’s Audit Committee Mandate is attached hereto as Schedule “A”.
External Auditor Service Fees
The following table provides information about the fees billed to the Company for professional services rendered by KPMG LLP, the Company’s external auditor, during the fiscal years indicated:
| | | | | | | | |
($ thousands) | | 2014 | | | 2013 | |
Audit Fees | | | 3,771 | | | | 3,218 | |
Audit-related Fees | | | 282 | | | | 158 | |
Tax Fees | | | 266 | | | | 134 | |
All Other Fees | | | — | | | | — | |
| | | | | | | | |
| | | 4,319 | | | | 3,510 | |
| | | | | | | | |
Audit fees consist of fees for the audit of the Company’s annual financial statements or services that are normally provided in connection with statutory and regulatory filings, including the Sarbanes-Oxley Act of 2002. Audit-related fees included fees for attest services not required by statute or regulation. Tax fees included fees for tax planning and various taxation matters.
The Company’s Audit Committee has the sole authority to review in advance, and grant any appropriate pre-approvals, of all non-audit services to be provided by the independent auditors and to approve fees, in connection therewith. The Audit Committee pre-approved all of the audit-related and tax services provided by KPMG LLP in 2014.
LEGAL PROCEEDINGS
The Company is involved in various claims and litigation arising in the normal course of business. While the outcome of these matters is uncertain and there can be no assurance that such matters will be resolved in the Company’s favour, the Company does not currently believe that the outcome of adverse decisions in any pending or threatened proceedings related to these or other matters or amount which it may be required to pay by reason thereof would have a material adverse impact on its financial position, results of operations or liquidity.
INTEREST OF MANAGEMENT AND OTHERS
IN MATERIAL TRANSACTIONS
None of the Company’s directors, executive officers or persons or companies that beneficially own or control or direct, directly or indirectly or a combination of both, more than 10% of Husky’s common shares, or their associates and affiliates, had any material interest, direct or indirect, in any transaction with the Company within the three most recently completed financial years or during the current financial year that has materially affected or would reasonably be expected to materially affect the Company.
TRANSFER AGENTS
AND REGISTRARS
Husky’s transfer agent and registrar is Computershare Trust Company of Canada. In the United States, the transfer agent and registrar is Computershare Trust Company, Inc. The registers for transfers of the Company’s common and preferred shares are maintained by Computershare Trust Company of Canada at its principal offices in the cities of Calgary, Alberta and Toronto, Ontario. Queries should be directed to Computershare Trust Company at 1-888-564-6253 or 1-514-982-7555.
INTERESTS OF EXPERTS
Excluding the reserves attributed to the Heavy Oil and Gas business unit, other than the Tucker property, certain information relating to the Company’s reserves included in this AIF has been calculated by the Company and audited and opined upon as at December 31, 2014 by McDaniel. Sproule evaluated and reported on the reserves attributed to the Company’s Heavy Oil and Gas business unit, excluding the Tucker property, as at December 31, 2014, and that reserves information is included in this AIF. Both McDaniel and Sproule are independent petroleum engineering consultants retained by Husky, and such reserves information has been so included in reliance on the opinion and analysis of McDaniel and Sproule, respectively, given upon the authority of said firms as experts in reserves engineering. The partners, employees and consultants of McDaniel and Sproule, respectively, as a group beneficially own, directly or indirectly, less than 1% of the Company’s securities of any class.
KPMG LLP are the auditors of the Company and have confirmed that they are independent with respect to the Company within the meaning of the relevant rules and related interpretations prescribed by the relevant professional bodies in Canada and any applicable legislation or regulations and also that they are independent accountants with respect to the Company under all relevant U.S. professional and regulatory standards.
ADDITIONAL INFORMATION
Additional information, including directors’ and officers’ remuneration, principal shareholders of Husky’s common shares and a description of options to purchase common shares will be contained in Husky’s Management Information Circular prepared in connection with the annual meeting of shareholders to be held on May 6, 2015.
Additional financial information is provided in Husky’s audited consolidated financial statements and Management’s Discussion and Analysis for the most recently completed fiscal year ended December 31, 2014.
Additional information relating to Husky Energy Inc. is available on SEDAR at www.sedar.com and on EDGAR atwww.sec.gov.
READER ADVISORIES
Special Note Regarding Forward-Looking Statements
Certain statements in this AIF are forward-looking statements within the meaning of Section 21E of the United States Securities Exchange Act of 1934, as amended, and Section 27A of the United States Securities Act of 1933, as amended, and forward-looking information within the meaning of applicable Canadian securities legislation (collectively “forward-looking statements”). The Company hereby provides cautionary statements identifying important factors that could cause actual results to differ materially from those projected in these forward-looking statements. Any statements that express, or involve discussions as to, expectations, beliefs, plans, objectives, assumptions or future events or performance (often, but not always, through the use of words or phrases such as “will likely,” “are expected to,” “will continue,” “is anticipated,” “is targeting,” “estimated,” “intend,” “plan,” “projection,” “could,” “aim,” “vision,” “goals,” “objective,” “target,” “schedules” and “outlook”) are not historical facts, are forward-looking and may involve estimates and assumptions and are subject to risks, uncertainties and other factors some of which are beyond the Company’s control and difficult to predict. Accordingly, these factors could cause actual results or outcomes to differ materially from those expressed in the forward-looking statements.
In particular, forward-looking statements in this AIF include, but are not limited to, references to:
| | • | | With respect to the business, operations and results of the Company generally: the Company’s general strategic plans and growth strategies, anticipated 2015 expenditures on environmental site closure activities; forecasted future development costs and anticipated sources of funding for such costs; and estimated abandonment and reclamation costs; |
| | • | | with respect to the Company’s Asia Pacific Region: expected timing of tie-in of the Liuhua 29-1 gas field; potential 3-D seismic work to be carried out on the Company’s Taiwan exploration block; anticipated timing of first gas from the Madura Strait Block; and planned timing of seismic work in the Anugerah contract area; |
| | • | | with respect to the Company’s Atlantic Region: expected timing of start-up of production from the Company’s South White Rose Extension project; expected peak production volumes from South White Rose; anticipated timing of production from the North Amethyst Hibernia Formation; expected peak production volumes from the North Amethyst Hibernia Formation; anticipated timing of completion of Seadrill’s West Mira rig; medium to long-term growth opportunities for light crude oil and natural gas development in the region; and the Company’s plans to participate in additional exploration and delineation wells in the region in 2015; |
| | • | | with respect to the Company’s Oil Sands properties: anticipated timing of first oil and volume of production at Plant 1A at the Company’s Sunrise Energy Project; expected timing of completion, commencement of steaming, anticipated timing of first oil and volume of production at Plant 1B of the Company’s Sunrise Energy Project; anticipated time frame for ramping up to full production capacity at the Sunrise Energy Project; and drilling and development plans at the Company’s Tucker Oil Sands Project; |
| | • | | with respect to the Company’s Heavy Oil properties: expected timing of first production and anticipated volumes of production at the Company’s Rush Lake heavy oil thermal development project; scheduled timing of construction and first production, and anticipated volumes of production, at the Company’s Edam East, Edam West and Vawn heavy oil thermal developments; 2015 drilling plans, including CHOPS drilling plans, in the region; |
| | • | | with respect to the Company’s Western Canadian oil and gas resource plays: 2015 drilling plans in the region; anticipated ability of drilling plans to grow production; and areas of focus for conventional oil development in Southern Alberta and Saskatchewan; |
| | • | | with respect to the Company’s Infrastructure and Marketing operations: anticipated timing of start-up of two 300,000 barrel tanks currently under construction at the Hardisty terminal; and the Company’s plans to expand its marketing operations by continuing to increase marketing activities; and |
| | • | | with respect to the Company’s Downstream operating segment: the anticipated timing of completion and benefits from the Lima, Ohio Refinery feedstock flexibility project and the anticipated processing capacity of Western Canadian heavy oil once reconfiguration is complete; plans to expand the bitumen processing capacity of the BP-Husky Toledo Refinery; and anticipated benefits from the recent installation of the Hydrotreater Recycle Gas Compressor Project at the BP-Husky Toledo Refinery; and 2015 plans with respect to the Company’s asphalt distribution network. |
In addition, statements relating to “reserves” and “resources” are deemed to be forward-looking statements as they involve the implied assessment based on certain estimates and assumptions that the reserves or resources described can be profitably produced in the future. There are numerous uncertainties inherent in estimating quantities of reserves and resources and in projecting future rates of production and the timing of development expenditures. The total amount or timing of actual future production may vary from reserve, resource and production estimates.
Although the Company believes that the expectations reflected by the forward-looking statements presented in this AIF are reasonable, the Company’s forward-looking statements have been based on assumptions and factors concerning future events that may prove to be inaccurate. Those assumptions and factors are based on information currently available to the Company about itself and the businesses in which it operates. Information used in developing forward-looking statements has been acquired from various sources including third party consultants, suppliers, regulators and other sources. The material factors and assumptions used to develop the forward-looking statements include, but are not limited to:
| | • | | with respect to the business, operations and results of the Company generally: the absence of significant adverse changes to commodity prices, interest rates, applicable royalty rates and tax laws, and foreign exchange rates; the absence of significant adverse changes to energy markets, competitive conditions, the supply and demand for crude oil, natural gas, NGL and refined petroleum products, or the political, economic and social stability of the jurisdictions in which the Company operates; continuing availability of economical capital resources, labour and services; demand for products and cost of operations; the absence of significant adverse legislative and regulatory changes, in particular changes to the legislation and regulation governing fiscal regimes and environmental issues; and stability of general domestic and global economic, market and business conditions; |
| | • | | with respect to the Company’s Asia Pacific Region, Atlantic Region, Oil Sands properties, Heavy Oil properties, Western Canadian oil and gas resource plays and Infrastructure and Marketing operations: the accuracy of future production rates and reserve and resource estimates; the securing of sales agreements to underpin the commercial development and regulatory approvals for the development of the Company’s properties; the absence of significant delays of the procurement, development, construction or commissioning of the Company’s projects, for which the Company or a third party is the designated operator, that may result from the inability of suppliers to meet their commitments, lack of regulatory or third-party approvals or other governmental actions, harsh weather or other calamitous event; the absence of significant disruption of operations such as may result from harsh weather, natural disaster, accident, civil unrest or other calamitous event; the absence of significant unexpected technological or commercial difficulties that adversely affect exploration, development, production, processing or transportation; the sufficiency of budgeted capital expenditures in carrying out planned activities; and the absence of significant increases in the cost of major growth projects; and |
| | • | | with respect to the Company’s Downstream operating segment: the absence of significant delays of the development, construction or commissioning of the Company’s projects that may result from the inability of suppliers to meet their commitments, lack of regulatory or third-party approvals or other governmental actions, harsh weather or other calamitous event; the absence of significant disruption of operations such as may result from harsh weather, natural disaster, accident, civil unrest or other calamitous event; the absence of significant unexpected technological or commercial difficulties that adversely affect processing or transportation; the sufficiency of budgeted capital expenditures in carrying out planned activities; and the absence of significant increase in the cost of major growth projects. |
Because actual results or outcomes could differ materially from those expressed in any forward-looking statements, investors should not place undue reliance on any such forward-looking statements. By their nature, forward-looking statements involve numerous assumptions, inherent risks and uncertainties, both general and specific, which contribute to the possibility that the predicted outcomes will not occur. Some of these risks, uncertainties and other factors are similar to those faced by other oil and gas companies and some are unique to Husky. The risks, uncertainties and other factors, many of which are beyond Husky’s control, that could cause actual results to differ (potentially significantly) from those expressed in the forward-looking statements include, but are not limited to:
| | • | | with respect to the business, operations and results of the Company generally: those risks, uncertainties and other factors described under “Risk Factors” in this AIF and throughout the Company’s Management’s Discussion and Analysis for the year ended December 31, 2014; the demand for the Company’s products and prices received for crude oil and natural gas production and refined petroleum products; the economic |
| | conditions of the markets in which the Company conducts business; the exchange rate between the Canadian and U.S. dollar; the ability to replace reserves of oil and gas, whether sourced from exploration, improved recovery or acquisitions; potential actions of governments, regulatory authorities and other stakeholders that may impose operating costs or restrictions in the jurisdictions where the Company has operations; changes to royalty regimes; changes to government fiscal, monetary and other financial policies; changes in workforce demographics; and the cost and availability of capital, including access to capital markets at acceptable rates; |
| | • | | with respect to the Company’s Asia Pacific Region, Atlantic Region, Oil Sands properties, Heavy Oil properties, Western Canadian oil and gas resource plays and the Infrastructure and Marketing operations: the availability of prospective drilling rights; the costs to acquire exploration rights, undertake geological studies, appraisal drilling and project development; the availability and cost of labour, technical expertise, material and equipment to efficiently, effectively and safely undertake capital projects; the costs to operate properties, plants and equipment in an efficient, reliable and safe manner; prevailing climatic conditions in the Company’s operating locations; regulations to deal with climate change issues; the competitive actions of other companies, including increased competition from other oil and gas companies; business interruptions because of unexpected events such as fires, blowouts, freeze-ups, equipment failures and other similar events affecting the Company or other parties whose operations or assets directly or indirectly affect the Company and that may or may not be financially recoverable; the co-operation of business partners especially where the Company is not operator of production projects or developments in which it has an interest; the inability to obtain regulatory approvals to operate existing properties or develop significant growth projects; risk associated with transportation of production or product to market or transportation of feedstock to processing facilities resulting from an interruption in pipeline and other transportation services both owned and contracted, due to calamitous event or regulatory obligation; and the inability to reach estimated production levels from existing and future oil and gas development projects as a result of technological or commercial difficulties; and |
| | • | | with respect to the Company’s Downstream operating segment: the costs to operate properties, plants and equipment in an efficient, reliable and safe manner; prevailing climatic conditions in the Company’s operating locations; regulations to deal with climate change issues; the competitive actions of other companies, including increased competition from other oil and gas companies; business interruptions because of unexpected events such as fires, blowouts, freeze-ups, equipment failures and other similar events affecting Husky or other parties whose operations or assets directly or indirectly affect the Company and that may or may not be financially recoverable; risk associated with transportation of production or product to market or transportation of feedstock to processing facilities resulting from an interruption in pipeline and other transportation services both owned and contracted, due to calamitous event or regulatory obligation; and the inability to obtain regulatory approvals to operate existing properties or develop significant growth projects. |
These and other factors are discussed throughout this AIF and in the Management’s Discussion and Analysis for the year ended December 31, 2014 available on SEDAR at www.sedar.com and on EDGAR at www.sec.gov.
In the discussions above, the Company has categorized the material factors and assumptions used to develop the forward-looking statements, and the risks, uncertainties and other factors that could influence actual results, by region, properties, plays and segments. These categories reflect the Company’s current views regarding the factors, assumptions, risks and uncertainties most relevant to the particular region, property, play or segment. Other factors, assumptions, risks or uncertainties could impact a particular region, property, play or segment, and a factor, assumption, risk or uncertainty categorized under a particular region, property, play or segment could also influence results with respect to another region, property, play or segment.
Any forward-looking statement speaks only as of the date on which such statement is made and, except as required by applicable securities laws, the Company undertakes no obligation to update any forward-looking statement to reflect events or circumstances after the date on which such statement is made or to reflect the occurrence of unanticipated events. New factors emerge from time to time, and it is not possible for management to predict all of such factors and to assess in advance the impact of each such factor on the Company’s business or the extent to which any factor, or combination of factors, may cause actual results to differ materially from those contained in any forward-looking statement. The impact of any one factor on a particular forward-looking statement is not determinable with certainty as such factors are dependent upon other factors, and the Company’s course of action would depend upon its assessment of the future considering all information then available.
Disclosure of Oil and Gas Information
Unless otherwise stated, reserve and resource estimates in this document have an effective date of December 31, 2014 and represent Husky’s share. Unless otherwise noted, historical production numbers given represent Husky’s share.
The estimate of reserves and future net revenue for individual properties may not reflect the same confidence level as estimates of reserves and future net revenue for all properties, due to the effects of aggregation.
The Company has disclosed best estimate contingent resources of 12.1 billion boe, which is comprised of 2.1 billion boe of crude oil and 10.0 billion boe of bitumen. Of the total 10.2 billion boe is economic at year-end 2014. Contingent resources are reported as Husky’s working interest in the following properties, Lloydminster heavy oil projects, Saleski oil sands project and the Bay du Nord and Mizzen discoveries in the Atlantic Region.
The Company has disclosed best-estimate contingent resources in this document. Contingent resources are those quantities of petroleum estimated, as of a given date, to be potentially recoverable from known accumulations using established technology or technology under development, but which are not currently considered to be commercially recoverable due to one or more contingencies. Contingencies may include factors such as economic, legal, environmental, political and regulatory matters, or a lack of markets. There is no certainty that it will be commercially viable to produce any portion of the contingent resources.
Best estimate as it relates to resources is considered to be the best estimate of the quantity that will actually be recovered. It is equally likely that the actual remaining quantities recovered will be greater or less than the best estimate. There is no certainty as to the timing of such development.
Specific contingencies preventing the classification of contingent resources at the Company’s Oil Sands properties as reserves include further reservoir studies, delineation drilling, facility design, preparation of firm development plans, regulatory applications and company approvals. Development is also contingent upon successful application of steam-assisted gravity drainage and/or Cyclic Steam Stimulation. Positive and negative factors relevant to the estimate of oil sands resources include a higher level of uncertainty in the estimates as a result of lower core-hole drilling density.
Specific contingencies preventing the classification of contingent resources at the Company’s Lloydminster Heavy Oil discoveries as reserves include: it may not be viable to develop the estimated volumes in an economic manner; the formulation of concrete development plans to pursue development of the large inventory of primary and EOR opportunities; Company commitment to dedicate the required capital to develop the inventory of opportunities; large inventory of contingent resource opportunities would likely necessitate development over a time frame much greater than the five-year reserve timing window; regulatory submissions and approval would be required for the thermal and major EOR projects to proceed; and verification of sustained economic productivity using CHOPS from zones with limited tests to date and zones with higher viscosity as well as verification of sub-zone continuity and quality that would enable feasible implementation of an EOR scheme. An economic evaluation has not been conducted on the contingent resource.
The Company has disclosed total heavy oil initially in place in this document. Total petroleum initially in place is that quantity of petroleum that is estimated to exist originally in naturally occurring accumulations. It includes that quantity of petroleum that is estimated, as of a given date, to be contained in known accumulations, prior to production, plus those estimated quantities in accumulations yet to be discovered. There is no certainty that any portion of the undiscovered petroleum initially in place will be discovered. If discovered, there is no certainty that it will be commercially viable to produce any portion of the undiscovered petroleum initially in place.
The Company has disclosed discovered heavy oil initially in place in this document. Discovered petroleum initially-in-place is that quantity of petroleum that is estimated, as of a given date, to be contained in known accumulations prior to production. The recoverable portion of discovered petroleum initially in place includes production, reserves, and contingent resources; the remainder is unrecoverable. There is no certainty that it will be commercially viable to produce any portion of the resources.
Positive and negative factors relevant to the estimation of Lloydminster Heavy Oil total heavy oil initially in place, discovered heavy oil initially in place and best estimate contingent resources include extensive well control, limited demonstrated sustained production in certain zones, potential reservoir heterogeneity in sub-zones which may limit the applicability of EOR schemes and current lack of development plans.
Specific contingencies preventing the classification of contingent resources at the Company’s Atlantic Region discoveries as reserves include additional exploration and delineation drilling, well testing, facility design, preparation of firm development plans, regulatory applications, and company and partner approvals. Positive and negative factors relevant to the estimate of Atlantic Region resources include water depth and distance from existing infrastructure.
Note to U.S. Readers
The Company reports its reserves and resources information in accordance with Canadian practices and specifically in accordance with National Instrument 51-101, “Standards of Disclosure for Oil and Gas Disclosure”, adopted by the Canadian securities regulators. Because the Company is permitted to prepare its reserves and resources information in accordance with Canadian disclosure requirements, it uses certain terms in this document, such as “possible reserves”, “best estimate contingent resources” and “heavy oil initially in place” that U.S. oil and gas companies generally do not include or may be prohibited from including in their filings with the SEC.
Schedule A
Husky Energy Inc.
Audit Committee Mandate
Purpose
The Audit Committee (the “Committee”) is a committee of the Board of Directors (the “Board”) of Husky Energy Inc. (the “Corporation”). The Committee’s primary function is to assist the Board in carrying out its responsibilities with respect to:
| | 1. | the quarterly and annual financial statements and quarterly and annual MD&A, which are to be provided to shareholders and the appropriate regulatory agencies; |
| | 2. | earnings press releases before the Corporation publicly discloses this information; |
| | 3. | the system of internal controls that management has established; |
| | 4. | the internal and external audit process; |
| | 5. | the appointment of external auditors; |
| | 6. | the appointment of qualified reserves evaluators or auditors; |
| | 7. | the filing of statements and reports with respect to the Corporation’s oil and gas reserves; and |
| | 8. | the identification, management and mitigation of major financial risk exposures of the Corporation. |
In addition, the Committee provides an avenue for communication between the Board and each of the Chief Financial Officer of the Corporation and other senior financial management, internal audit, the external auditors, external qualified reserves evaluators or auditors and internal qualified reserves evaluators. It is expected that the Committee will have a clear understanding with the external auditors and the external reserve evaluators or auditors that an open and transparent relationship must be maintained with the Committee.
While the Committee has the responsibilities and powers set forth in this Mandate, the role of the Committee is oversight. The members of the Committee are not full time employees of the Corporation and may or may not be accountants or auditors by profession or experts in the fields of accounting, or auditing and, in any event, do not serve in such capacity. Consequently, it is not the duty of the Committee to plan or conduct financial audits or reserve audits or evaluations, or to determine that the Corporation’s financial statements are complete, accurate and are in accordance with applicable accounting or reserve principles.
This is the responsibility of management and the external auditors and, as to reserves, the external reserve evaluators or auditors. Management and the external auditors will also have the responsibility to conduct investigations and to assure compliance with laws and regulations and the Corporation’s business conduct guidelines.
Composition
The Committee will consist of not less than three directors, all of whom will be independent and will satisfy the financial literacy requirements of securities regulatory requirements.
One of the members of the Committee will be an audit committee financial expert as defined in applicable securities regulatory requirements.
Members of the Committee will be appointed annually at a meeting of the Board, on the recommendation of the Corporate Governance Committee to the Co-Chairs of the Board and will be listed in the annual report to shareholders.
Committee members may be removed or replaced at any time by the Board, and will, in any event, cease to be a member of the Committee upon ceasing to be a member of the Board. Where a vacancy occurs at any time in the membership of the Committee, it may be filled by the Board.
The Committee Chair will be appointed by the Board, on the recommendation of the Corporate Governance Committee to the Co-Chairs of the Board.
Meetings
The Committee will meet at least four times annually on dates determined by the Chair or at the call of the Chair or any other Committee member, and as many additional times as the Committee deems necessary.
Committee members will strive to be present at all meetings either in person, by telephone or other communications facilities as permit all persons participating in the meeting to hear each other.
A majority of Committee members, present in person, by telephone, or by other permissible communication facilities will constitute a quorum.
The Committee will appoint a secretary, who need not be a member of the Committee, or a director of the Corporation. The secretary will keep minutes of the meetings of the Committee. Minutes will be sent to all Committee members, on a timely basis.
As necessary or desirable, but in any case at least quarterly, the Committee shall meet with members of management and representatives of the external auditors and internal audit in separate executive sessions to discuss any matters that the Committee or any of these groups believes should be discussed privately.
As necessary or desirable, but in any case at least annually, the Committee will meet the management and representatives of the external reserves evaluators or auditors and internal reserves evaluators in separate executive sessions to discuss matters that the Committee or any of these groups believes should be discussed privately.
Authority
Subject to any prior specific directive by the Board, the Committee is granted the authority to investigate any matter or activity involving financial accounting and financial reporting, the internal controls of the Corporation and the reporting of the Corporation’s reserves and oil and gas activities.
The Committee has the authority to engage and set the compensation of independent counsel and other advisors, at the Corporation’s expense, as it determines necessary to carry out its duties.
In recognition of the fact that the external auditors are ultimately accountable to the Committee, the Committee will have the authority and responsibility to recommend to the Board the external auditors that will be proposed for nomination at the annual general meeting. The external auditors will report directly to the Committee, and the Committee will evaluate and, where appropriate, replace the external auditors. The Committee will approve the fees and terms for all audit engagements and all non-audit engagements with the external auditors. The Committee will consult with management and the internal audit group regarding the engagement of the external auditors but will not delegate these responsibilities.
The external qualified reserves evaluators or auditors will report directly to the Committee, and the Committee will evaluate and, where appropriate, replace the external qualified reserves evaluators or auditors. The Committee will approve the fees and terms for all reserves evaluators or audit engagements. The Committee will consult with management and the internal qualified reserves evaluators group regarding the engagement of the external qualified reserves evaluators or auditors but will not delegate these responsibilities.
Specific Duties & Responsibilities
The Committee will have the oversight responsibilities and specific duties as described below.
Audit
| | 1. | Review and reassess the adequacy of this Mandate annually and recommend any proposed changes to the Corporate Governance Committee and the Board for approval. |
| | 2. | Review with the Corporation’s management, internal audit and the external auditors and recommend to the Board for approval the Corporation’s annual financial statements and annual MD&A which is to be provided to shareholders and the appropriate regulatory agencies and any financial statement contained in a prospectus, information circular, registration statement or other similar document. |
| | 3. | Review with the Corporation’s management, internal audit and the external auditors and approve the Corporation’s quarterly financial statements and quarterly MD&A which is to be provided to shareholders and the appropriate regulatory agencies. |
| | 4. | Review with the Corporation’s management and approve earnings press releases before the Corporation publicly discloses this information. |
| | 5. | Be responsible for the oversight of the work of the external auditors, including the resolution of disagreements between management of the Corporation and the external auditors regarding financial reporting. |
| | 6. | Review with the Corporation’s management, internal audit and the external auditors the Corporation’s accounting and financial reporting controls and obtain annually, in writing from the external auditors their observations, if any, on material weaknesses in internal controls over financial reporting as noted during the course of their work. |
| | 7. | Review with the Corporation’s management, internal audit and the external auditors significant accounting and reporting principles, practices and procedures applied by the Corporation in preparing its financial statements, and discuss with the external auditors their judgments about the quality (not just the acceptability) of the Corporation’s accounting principles used in financial reporting. |
| | 8. | Review the scope of internal audit’s work plan for the year and receive a summary report of major findings by internal audit and how management is addressing the conditions reported. |
| | 9. | Review the scope and general extent of the external auditors’ annual audit, such review to include an explanation from the external auditors of the factors considered in determining the audit scope, including the major risk factors, and the external auditor’s confirmation whether or not any limitations have been placed on the scope or nature of their audit procedures. |
| | 10. | Inquire as to the independence of the external auditors and obtain from the external auditors, at least annually, a formal written statement delineating all relationships between the external auditors and the Corporation as contemplated by Independence Standards Board Standard No. 1, Independence Discussions with Audit Committees. |
| | 11. | Arrange with the external auditors that (a) they will advise the Committee, through its Chair and management of the Corporation, of any matters identified through procedures followed for the review of interim quarterly financial statements of the Corporation, such notification is to be made prior to the related press release and (b), for written confirmation at the end of each of the first three quarters of the year, that they have nothing to report to the Committee, if that is the case, or the written enumeration of required reporting issues. |
| | 12. | Review at the completion of the annual audit, with senior management, internal audit and the external auditors the following: |
| | i. | the annual financial statements and related footnotes and financial information to be included in the Corporation’s annual report to shareholders; |
| | ii. | results of the audit of the financial statements and the related report thereon and, if applicable, a report on changes during the year in accounting principles and their application; |
| | iii. | significant changes to the audit plan, if any, and any serious disputes or difficulties with management encountered during the audit; |
| | iv. | inquire about the cooperation received by the external auditors during their audit, including access to all requested records, data and information; and |
| | v. | inquire of the external auditors whether there have been any material disagreements with management, which, if not satisfactorily resolved, would have caused them to issue a non-standard report on the Corporation’s financial statements. |
| | 13. | Discuss (a) with the external auditors, without management being present, (i) the quality of the Corporation’s financial and accounting personnel, and (ii) the completeness and accuracy of the Corporation’s financial statements, and (b) elicit the comments of senior management regarding the responsiveness of the external auditors to the Corporation’s needs. |
| | 14. | Meet with management to discuss any relevant significant recommendations that the external auditors may have, particularly those characterized as ‘material’ or ‘serious’ (typically, such recommendations will be presented by the external auditors in the form of a Letter of Comments and Recommendations to the Committee) and review the responses of management to the Letter of Comments and Recommendations and receive follow-up reports on action taken concerning the aforementioned recommendations. |
| | 15. | Review and approve disclosures required to be included in periodic reports filed with Canadian and U.S. securities regulators with respect to non-audit services performed by the external auditors. |
| | 16. | Establish adequate procedures for the review of the Corporation’s disclosure of financial information extracted or derived from the Corporation’s financial statements, and periodically assess the adequacy of those procedures. |
| | 17. | Establish procedures for (a) the receipt, retention and treatment of complaints received by the Corporation regarding accounting, internal accounting controls or auditing matters, and (b) the confidential, anonymous submission by employees of the Corporation of concerns regarding questionable accounting or auditing matters. |
| | 18. | Review and approve the Corporation’s hiring policies regarding partners, employees and former partners and employees of the present and former external auditors. |
| | 19. | Review the appointment and replacement of the senior internal audit executive. |
| | 20. | Review with management, internal audit and the external auditors the methods used to establish and monitor the Corporation’s policies with respect to unethical or illegal activities by the Corporation’s employees that may have a material impact on the financial statements or other reporting of the Corporation. |
| | 21. | Reviewing generally, as part of the review of the annual financial statements, a report, from the Corporation’s general counsel concerning legal, regulatory and compliance matters that may have a material impact on the financial statements or other reporting of the Corporation. |
| | 22. | Review and discuss with management, on a regular basis, the identification, management and mitigation of major financial risk exposures across the Corporation. In addition, the Committee oversees the Corporation’s risk management framework and related processes. |
Reserves
| | 23. | Review, with reasonable frequency, the Corporation’s procedures relating to the disclosure of information with respect to the Corporation’s oil and gas reserves, including the Corporation’s procedures for complying with the disclosure requirements and restrictions of applicable regulatory requirements. |
| | 24. | Review with management the appointment of the external qualified reserves evaluators or auditors, and in the case of any proposed change in such appointment, determine the reasons for the change and whether there have been disputes between management and the appointed external qualified reserves evaluators or auditors. |
| | 25. | Review, with reasonable frequency, the Corporation’s procedures for providing information to the external qualified reserves evaluators or auditors who report on reserves and data for the purposes of compliance with applicable securities regulatory requirements. |
| | 26. | Meet, before the approval and release of the Corporation’s reserves data and the report of the qualified reserve evaluators or auditors thereon, with senior management, the external qualified reserves evaluators or auditors and the internal qualified reserves evaluators to determine whether any restrictions affect their ability to report on reserves data without reservation and to review the reserves data and the report of the qualified reserves evaluators or auditors. |
| | 27. | Recommend to the Board for approval of the content and filing of required statements and reports relating to the Corporation’s disclosure of reserves data as prescribed by applicable regulatory requirements. |
Miscellaneous
| | 28. | Review and approve (a) any change or waiver in the Corporation’s Code of Business Conduct for the President and Chief Executive Officer and senior financial officers and (b) any public disclosure made regarding such change or waiver and, if satisfied, refer the matter to the Board for approval. |
| | 29. | Act in an advisory capacity to the Board. |
| | 30. | Carry out such other responsibilities as the Board may, from time to time, set forth. |
| | 31. | Advise and report to the Co-Chairs of the Board and the Board, relative to the duties and responsibilities set out above, from time to time, and in such details as is reasonably appropriate. |
Effective Date: May 6, 2014
Schedule B
Husky Energy Inc.
Report on Reserves Data by Internal Qualified Reserves Evaluator
To the Board of Directors of Husky Energy Inc. (“Husky”):
| 1. | Other than the reserves data attributed to the Heavy Oil and Gas business unit (excluding the Tucker property), which was evaluated and reported on by an external independent reserves evaluator as at December 31, 2014, our staff has evaluated all remaining Husky reserves data as at December 31, 2014. Husky’s staff has also reviewed the external independent reserves evaluation. The reserves data are estimates of proved reserves and probable reserves and related future net revenue as at December 31, 2014, estimated using forecast prices and costs. |
| 2. | The reserves data are the responsibility of Husky’s management. As the Internal Qualified Reserves Evaluator our responsibility is to certify that the reserves data has been properly calculated in accordance with generally accepted procedures for the estimation of reserves data. |
We carried out our evaluation in accordance with generally accepted procedures for the estimation of oil and gas reserves data and standards set out in the Canadian Oil and Gas Evaluation Handbook (the “COGE Handbook”) prepared jointly by the Society of Petroleum Evaluation Engineers (Calgary Chapter) and the Canadian Institute of Mining, Metallurgy & Petroleum (Petroleum Society). Our internal reserves evaluators are not independent of Husky, within the meaning of the term “independent” under those standards.
| 3. | Those standards require that we plan and perform an evaluation to obtain reasonable assurance as to whether the reserves data are free of material misstatement. An evaluation also includes assessing whether the reserves data are in accordance with the principles and definitions presented in the COGE Handbook. |
| 4. | The following table sets forth the evaluated estimated future net revenue (before deducting income taxes) attributed to proved plus probable reserves, estimated using forecast prices and costs and calculated using a discount rate of 10 percent, included in the reserves data of Husky evaluated for the year ended December 31, 2014 and reported to the Audit Committee of the Board of Directors. |
| | | | |
Location of Reserves (Country or Foreign Geographic Area) | | Proved Plus Probable
Net Present Value of
Future Net Revenue
(Before Income Taxes,
10% Discount Rate) | |
Canada | | $ | 24,451 million | |
China | | $ | 4,491 million | |
Indonesia | | $ | 338 million | |
Libya | | $ | 2 million | |
| | | | |
| | $ | 29,282 million | |
| 5. | In our opinion, the reserves data evaluated by us have, in all material respects, been determined in accordance with the principles and definitions presented in the COGE Handbook. |
| 6. | We have no responsibility to update our evaluation for events and circumstances occurring after the date of this report. |
| 7. | Because, the reserves data are based on judgments regarding future events, actual results will vary and the variations may be material. |
| 8. | I have signed this report in my capacity as an employee of Husky and not in my personal capacity. |
|
| /s/ Richard Leslie |
Richard Leslie, P. Eng Manager, Reserves Calgary, Alberta January 28, 2015 |
Husky Energy Inc.
Report on Reserves Data by Independent Qualified Reserves Evaluator or Auditor
Report on Reserves Data
To the Board of Directors of Husky Energy Inc. (the “Company”):
| 1. | We have evaluated the Company’s reserves data as at December 31, 2014. The reserves data are estimates of proved reserves and probable reserves and related future net revenue as at December 31, 2014, attributed to the Company’s Lloydminster Heavy Oil Group (excluding the Tucker property), estimated using forecast prices and costs. |
| 2. | The reserves data are the responsibility of the Company’s management. Our responsibility is to express an opinion on the reserves data based on our evaluation. |
| | We carried out our evaluation in accordance with standards set out in the Canadian Oil and Gas Evaluation Handbook as amended from time to time (the “COGE Handbook”), maintained by the Society of Petroleum Evaluation Engineers (Calgary Chapter). |
| 3. | Those standards require that we plan and perform an evaluation to obtain reasonable assurance as to whether the reserves data are free of material misstatement. An evaluation also includes assessing whether the reserves data are in accordance with principles and definitions presented in the COGE Handbook. |
| 4. | The following table sets forth the estimated future net revenue (before deduction of income taxes) attributed to proved plus probable reserves, estimated using forecast prices and costs and calculated using a discount rate of 10 percent, included in the reserves data of the Company evaluated by us for the year ended December 31, 2014, and identifies the respective portions thereof that we have audited, evaluated and reviewed and reported on to the Company’s management and Board of Directors: |
| | | | | | | | | | | | | | | | | | | | | | |
Independent Qualified Reserves Evaluator or Auditor | | Description and Preparation Date of Evaluation Report | | Location
of
Reserves
(Country) | | | Net Present Value of Future Net Revenue
Before Income Taxes (10% Discount Rate) | |
| | | | Audited
(MM$) | | | Evaluated
(MM$) | | | Reviewed
(MM$) | | | Total
(MM$) | |
| Sproule | | Evaluation of the P&NG Reserves of Husky Energy Inc. in the Lloydminster Heavy Oil Group (excluding the Tucker property), As of December 31, 2014, prepared June 2014 to January 2015 | | | Canada | | | | | | | | | | | | | | | | | |
| | | | | | | | | | | | | | | | | | | | | | |
Total | | | | | | | | | Nil | | | | 8,765 | | | | Nil | | | | 8,765 | |
| | | | | | | | | | | | | | | | | | | | | | |
| 5. | In our opinion, the reserves data respectively evaluated by us have, in all material respects, been determined and are in accordance with the COGE Handbook, consistently applied. We express no opinion on the reserves data that we reviewed but did not audit or evaluate. |
| 6. | We have no responsibility to update our report referred to in paragraph 4 for events and circumstances occurring after the effective date of our report(s). |
| 7. | Because the reserves data are based on judgments regarding future events, actual results will vary and the variations may be material. |
Executed as to our report referred to above:
Sproule Unconventional Limited
|
| /s/ James A. Chisholm,P.Eng. |
| James A. Chisholm, P.Eng. |
| Manager, Engineering and Partner |
|
| /s/ Alec Kovaltchouk, P.Geo. |
| Alec Kovaltchouk, P.Geo. |
| Manager, Geoscience and Partner |
|
| /s/ Cameron P. Six, P.Eng. |
| Cameron P. Six, P.Eng. |
| Senior Vice-President, Unconventional and Director |
Calgary, Alberta
January 22, 2015
Schedule C
Husky Energy Inc.
Report of Management and Directors on Oil and Gas Disclosure
Management of Husky Energy Inc. (“Husky”) are responsible for the preparation and disclosure of information with respect to Husky’s oil and gas activities in accordance with securities regulatory requirements. This information includes reserves data which are estimates of proved reserves and probable reserves and related future net revenue as at December 31, 2014, estimated using forecast prices and costs.
Husky’s oil and gas reserves evaluation process involves applying generally accepted procedures for the estimation of oil and gas reserves data for the purposes of complying with the legal requirements of NI 51-101. Husky’s Internal Qualified Reserves Evaluator is the Manager of Reserves, who is an employee of Husky and has evaluated Husky’s oil and gas reserves data and certified that Husky’s Reserves Data Process has been followed. The Report on Reserves Data by Husky’s Internal Qualified Reserves Evaluator accompanies this report and will be filed with securities regulatory authorities concurrently with this report.
The Audit Committee of the Board of Directors has:
| | (a) | reviewed Husky’s procedures for providing information to the Internal Qualified Reserves Evaluator and the external reserves auditors; |
| | (b) | met with the Internal Qualified Reserves Evaluator, the external reserves auditors and the external reserves evaluator to determine whether any restrictions placed by management affected the ability of the Internal Qualified Reserves Evaluator, the external reserves auditors and the external reserves evaluator to report without reservation; and |
| | (c) | reviewed the reserves data with management, the Internal Qualified Reserves Evaluator, the external reserves auditors and the external reserves evaluator. |
The Audit Committee of the Board of Directors has reviewed Husky’s procedures for assembling and reporting other information associated with oil and gas activities and has reviewed that information with management. The Board of Directors has approved, on the recommendation of the Audit Committee:
| | (a) | the content and filing with securities regulatory authorities of Form 51-101F1 containing reserves data and other oil and gas information; |
| | (b) | the filing of Form 51-101F2, which is the Report on Reserves Data of Husky’s Internal Qualified Reserves Evaluator; and |
| | (c) | the content and filing of this report. |
Husky sought and was granted by the Canadian Securities Administrators an exemption from the requirement under National Instrument 51-101 “Standards of Disclosure for Oil and Gas Disclosure” to involve independent qualified oil and gas reserve evaluators or auditors. Notwithstanding this exemption, we involve independent qualified reserve auditors as part of Husky’s corporate governance practices. Their involvement helps assure that our internal oil and gas reserve estimates are materially correct.
In Husky’s view, the reliability of Husky’s internally generated oil and gas reserves data is not materially less than would be afforded by Husky involving independent qualified reserves evaluators or independent qualified reserves auditors to evaluate or audit and review the reserves data. The primary factors supporting the involvement of independent qualified reserves evaluators or independent qualified reserves auditors apply when (i) their knowledge of, and experience with, a reporting issuer’s reserves data are superior to that of the internal evaluators and (ii) the work of the independent qualified reserves evaluator or independent qualified reserves auditors is significantly less likely to be adversely influenced by self-interest or management of the reporting issuer than the work of internal reserves evaluation staff. In Husky’s view, neither of these factors applies in Husky’s circumstances.
Because the reserves data are based on judgments regarding future events, actual results will vary and the variations may be material.
| | |
| |
/s/ Asim Ghosh | | February 27, 2015 |
| Asim Ghosh | | |
| President & Chief Executive Officer | | |
| |
/s/ Robert J. Peabody | | February 27, 2015 |
| Robert J. Peabody | | |
| Chief Operating Officer | | |
| |
/s/ William Shurniak | | February 27, 2015 |
| William Shurniak | | |
| Director | | |
| |
/s/ Colin S. Russel | | February 27, 2015 |
| Colin S. Russel | | |
| Director | | |
Schedule D
Husky Energy Inc.
Independent Engineer’s Audit Opinion
Husky Energy Inc.
707 - 8th Avenue S.W.
Calgary, Alberta
T2P 3G7
To Whom It May Concern:
Pursuant to Husky’s request we have conducted an audit of the Husky internally generated reserves estimates and the respective net present values as at December 31, 2014. Husky internally evaluates all their properties with the exception of the Lloydminster business unit. The Tucker Property is internally evaluated. Husky’s detailed reserves information were provided to us for this audit. Our responsibility is to express an independent opinion on the reserves and the respective present worth value estimates, in the aggregate, based on our audit tests and procedures.
We conducted our audit in accordance with generally accepted audit standards as recommended by the Society of Petroleum Engineers and as recommended in the Canadian Oil and Gas Evaluation Handbook (COGEH) Volume 1 Section 12. Those standards require that we review and assess the policies, procedures, documentation and guidelines of the company with respect to the estimation, review and approval of Husky’s reserves information. An audit includes examining, on test basis, to confirm that there is adherence on the part of Husky’s internal reserve evaluators and other employees to the reserves management and administration policies and procedures established by the company. An audit also includes conducting reserves evaluation on a sufficient number of the company’s internally evaluated properties as considered necessary in order to express an opinion.
Based on the results of our audit, it is our opinion that Husky’s internally generated proved and probable reserves and net present values based on forecast and constant price assumptions are, in aggregate, reasonable, and have been prepared in accordance with generally accepted oil and gas engineering and evaluation practices as set out in the Canadian Oil and Gas Evaluation Handbook.
The results of the Husky internally generated reserves and net present values (based on forecast prices) supplied to us as part of the audit process are summarized below:
Husky Energy
Internally Evaluated Reserves and Net Present Values
Forecast Prices and Costs as of December 31st, 2014
| | | | | | | | |
| | | Company Share of
Remaining Reserves
(mmboe) | | | Company Share of
Net Present Value
Remaining Reserves
Before Income Tax
(MM$) @ 10% | |
Total Proved | | | 1,094 | | | | 10,875 | |
Total Proved Plus Probable | | | 2,697 | | | | 20,517 | |
Sincerely,
|
| McDaniel & Associates Consultants Ltd. |
|
| /s/ B. J. Wurster, P. Eng. |
| B. J. Wurster, P. Eng. |
| Vice President |
| Calgary, Alberta |
| January 16, 2015 |
Document B
Form 40-F
Consolidated Financial Statements and
Auditors’ Report to Shareholders
For the Year Ended December 31, 2014
INDEPENDENT AUDITORS’ REPORT OF
REGISTERED PUBLIC ACCOUNTING FIRM
To the Shareholders and Board of Directors of Husky Energy Inc.
We have audited the accompanying consolidated financial statements of Husky Energy Inc., which comprise the consolidated balance sheets as at December 31, 2014 and December 31, 2013, the consolidated statements of income, comprehensive income, changes in shareholders’ equity and cash flows for the years then ended, and notes, comprising a summary of significant accounting policies and other explanatory information.
Management’s Responsibility for the Consolidated Financial Statements
Management is responsible for the preparation and fair presentation of these consolidated financial statements in accordance with International Financial Reporting Standards as issued by the International Accounting Standards Board, and for such internal control as management determines is necessary to enable the preparation of consolidated financial statements that are free from material misstatement, whether due to fraud or error.
Auditors’ Responsibility
Our responsibility is to express an opinion on these consolidated financial statements based on our audits. We conducted our audits in accordance with Canadian generally accepted auditing standards and the standards of the Public Company Accounting Oversight Board (United States). Those standards require that we comply with ethical requirements and plan and perform the audit to obtain reasonable assurance about whether the consolidated financial statements are free from material misstatement.
An audit involves performing procedures to obtain audit evidence about the amounts and disclosures in the consolidated financial statements. The procedures selected depend on our judgment, including the assessment of the risks of material misstatement of the consolidated financial statements, whether due to fraud or error. In making those risk assessments, we consider internal control relevant to the entity’s preparation and fair presentation of the consolidated financial statements in order to design audit procedures that are appropriate in the circumstances.
An audit also includes evaluating the appropriateness of accounting policies used and the reasonableness of accounting estimates made by management, as well as evaluating the overall presentation of the consolidated financial statements.
We believe that the audit evidence we have obtained in our audits is sufficient and appropriate to provide a basis for our audit opinion.
Opinion
In our opinion, the consolidated financial statements present fairly, in all material respects, the consolidated financial position of Husky Energy Inc. as at December 31, 2014 and December 31, 2013, and its consolidated financial performance and its consolidated cash flows for the years then ended in accordance with International Financial Reporting Standards as issued by the International Accounting Standards Board.
Other Matter
We also have audited, in accordance with the standards of the Public Company Accounting Oversight Board (United States), Husky Energy Inc.’s internal control over financial reporting as of December 31, 2014, based on the criteria established in Internal Control—Integrated Framework (2013) issued by the Committee of Sponsoring Organizations of the Treadway Commission (COSO), and our report dated February 23, 2015 expressed an unmodified (unqualified) opinion on the effectiveness of Husky Energy Inc.’s internal control over financial reporting.
|
| /s/ KPMG LLP |
| KPMGLLP |
| Chartered Accountants |
Calgary, Canada
February 23, 2015
REPORT OF INDEPENDENT REGISTERED PUBLIC ACCOUNTING FIRM
To the Shareholders and Board of Directors of Husky Energy Inc.
We have audited Husky Energy Inc.’s (“the Company”) internal control over financial reporting as of December 31, 2014, based on the criteria established in Internal Control—Integrated Framework (2013) issued by the Committee of Sponsoring Organizations of the Treadway Commission (COSO). The Company’s management is responsible for maintaining effective internal control over financial reporting and for its assessment of the effectiveness of internal control over financial reporting, included in Management’s Annual Report on Internal Control Over Financial Reporting. Our responsibility is to express an opinion on the Company’s internal control over financial reporting based on our audit.
We conducted our audit in accordance with the standards of the Public Company Accounting Oversight Board (United States). Those standards require that we plan and perform the audit to obtain reasonable assurance about whether effective internal control over financial reporting was maintained in all material respects. Our audit included obtaining an understanding of internal control over financial reporting, assessing the risk that a material weakness exists, and testing and evaluating the design and operating effectiveness of internal control based on the assessed risk. Our audit also included performing such other procedures as we considered necessary in the circumstances. We believe that our audit provides a reasonable basis for our opinion.
A company’s internal control over financial reporting is a process designed to provide reasonable assurance regarding the reliability of financial reporting and the preparation of financial statements for external purposes in accordance with generally accepted accounting principles. A company’s internal control over financial reporting includes those policies and procedures that (1) pertain to the maintenance of records that, in reasonable detail, accurately and fairly reflect the transactions and dispositions of the assets of the company; (2) provide reasonable assurance that transactions are recorded as necessary to permit preparation of financial statements in accordance with generally accepted accounting principles, and that receipts and expenditures of the company are being made only in accordance with authorizations of management and directors of the company; and (3) provide reasonable assurance regarding prevention or timely detection of unauthorized acquisition, use, or disposition of the company’s assets that could have a material effect on the financial statements.
Because of its inherent limitations, internal control over financial reporting may not prevent or detect misstatements. Also, projections of any evaluation of effectiveness to future periods are subject to the risk that controls may become inadequate because of changes in conditions, or that the degree of compliance with the policies or procedures may deteriorate.
In our opinion, the Company maintained, in all material respects, effective internal control over financial reporting as of December 31, 2014, based on the criteria established inInternal Control—Integrated Framework (2013) issued by the Committee of Sponsoring Organizations of the Treadway Commission (COSO).
We also have audited, in accordance with Canadian generally accepted auditing standards and the standards of the Public Company Accounting Oversight Board (United States), the consolidated balance sheets of the Company as of December 31, 2014 and December 31, 2013, and the related consolidated statements of income, comprehensive income, changes in shareholders’ equity and cash flows for each of the years in the two-year period ended December 31, 2014, and our report dated February 23, 2015 expressed an unmodified (unqualified) opinion on those consolidated financial statements.
|
| /s/ KPMG LLP |
| KPMGLLP |
| Chartered Accountants |
Calgary, Canada
February 23, 2015
MANAGEMENT’S REPORT
The management of Husky Energy Inc. (“the Company”) is responsible for the financial information and operating data presented in this financial document.
The consolidated financial statements have been prepared by management in accordance with International Financial Reporting Standards as issued by the International Accounting Standards Board. When alternative accounting methods exist, management has chosen those it deems most appropriate in the circumstances. Financial statements are not precise as they include certain amounts based on estimates and judgments. Management has determined such amounts on a reasonable basis in order to ensure that the financial statements are presented fairly, in all material respects. Financial information presented elsewhere in this financial document has been prepared on a basis consistent with that in the consolidated financial statements.
The Company maintains systems of internal accounting and administrative controls. These systems are designed to provide reasonable assurance that the financial information is relevant, reliable and accurate and that the Company’s assets are properly accounted for and adequately safeguarded. Management’s evaluation concluded that the Company’s internal control over financial reporting was effective as of December 31, 2014. The system of internal controls is further supported by an internal audit function.
The Audit Committee of the Board of Directors, composed of independent non-management directors, meets regularly with management, internal auditors as well as the external auditors, to discuss audit (external, internal and joint venture), internal controls, accounting policy and financial reporting matters as well as the reserves determination process. The Committee reviews the annual consolidated financial statements with both management and the independent auditors and reports its findings to the Board of Directors before such statements are approved by the Board. The Committee is also responsible for the appointment of the external auditors for the Company.
The consolidated financial statements have been audited by KPMG LLP, the independent auditors, in accordance with Canadian Auditing Standards and the standards of the Public Company Accounting Oversight Board (United States) on behalf of the shareholders. KPMG LLP has full and free access to the Audit Committee.
|
 |
|
| Asim Ghosh |
|
| President & Chief Executive Officer |
|
| “Darren Andruko” |
|
| Darren Andruko |
|
| Acting Chief Financial Officer |
|
| Calgary, Canada |
|
| February 23, 2015 |
Consolidated Financial Statements 1
INDEPENDENT AUDITORS’ REPORT
To the Shareholders and Board of Directors of Husky Energy Inc.
We have audited the accompanying consolidated financial statements of Husky Energy Inc., which comprise the consolidated balance sheets as at December 31, 2014 and December 31, 2013, the consolidated statements of income, comprehensive income, changes in shareholders’ equity and cash flows for the years then ended, and notes, comprising a summary of significant accounting policies and other explanatory information.
Management’s Responsibility for the Consolidated Financial Statements
Management is responsible for the preparation and fair presentation of these consolidated financial statements in accordance with International Financial Reporting Standards as issued by the International Accounting Standards Board, and for such internal control as management determines is necessary to enable the preparation of consolidated financial statements that are free from material misstatement, whether due to fraud or error.
Auditors’ Responsibility
Our responsibility is to express an opinion on these consolidated financial statements based on our audits. We conducted our audits in accordance with Canadian generally accepted auditing standards and the standards of the Public Company Accounting Oversight Board (United States). Those standards require that we comply with ethical requirements and plan and perform the audit to obtain reasonable assurance about whether the consolidated financial statements are free from material misstatement.
An audit involves performing procedures to obtain audit evidence about the amounts and disclosures in the consolidated financial statements. The procedures selected depend on our judgment, including the assessment of the risks of material misstatement of the consolidated financial statements, whether due to fraud or error. In making those risk assessments, we consider internal control relevant to the entity’s preparation and fair presentation of the consolidated financial statements in order to design audit procedures that are appropriate in the circumstances. An audit also includes evaluating the appropriateness of accounting policies used and the reasonableness of accounting estimates made by management, as well as evaluating the overall presentation of the consolidated financial statements.
We believe that the audit evidence we have obtained in our audits is sufficient and appropriate to provide a basis for our audit opinion.
Opinion
In our opinion, the consolidated financial statements present fairly, in all material respects, the consolidated financial position of Husky Energy Inc. as at December 31, 2014 and December 31, 2013, and its consolidated financial performance and its consolidated cash flows for the years then ended in accordance with International Financial Reporting Standards as issued by the International Accounting Standards Board.
|
 |
|
| KPMG LLP |
|
| Chartered Accountants |
|
| Calgary, Canada |
|
| February 23, 2015 |
Consolidated Financial Statements 2
CONSOLIDATED FINANCIAL STATEMENTS
Consolidated Balance Sheets
| | | | | | | | |
(millions of Canadian dollars) | | December 31, 2014 | | | December 31, 2013 | |
Assets | | | | | | | | |
Current assets | | | | | | | | |
Cash and cash equivalents (note 9) | | | 1,267 | | | | 1,097 | |
Accounts receivable (notes 4, 22) | | | 1,324 | | | | 1,458 | |
Income taxes receivable | | | 353 | | | | 461 | |
Inventories (note 5) | | | 1,385 | | | | 1,812 | |
Prepaid expenses | | | 166 | | | | 89 | |
| | | | | | | | |
| | | 4,495 | | | | 4,917 | |
Exploration and evaluation assets (note 6) | | | 1,149 | | | | 1,144 | |
Property, plant and equipment, net (note 7) | | | 31,987 | | | | 29,750 | |
Goodwill (note 10) | | | 746 | | | | 698 | |
Contribution receivable (note 8) | | | — | | | | 136 | |
Investment in joint ventures (note 8) | | | 237 | | | | 153 | |
Other assets | | | 234 | | | | 106 | |
| | | | | | | | |
Total Assets | | | 38,848 | | | | 36,904 | |
| | | | | | | | |
Liabilities and Shareholders’ Equity | | | | | | | | |
Current liabilities | | | | | | | | |
Accounts payable and accrued liabilities (note 12) | | | 2,989 | | | | 3,155 | |
Asset retirement obligations (note 16) | | | 97 | | | | 210 | |
Short-term debt (note 13) | | | 895 | | | | — | |
Contribution payable due within one year (notes 8, 26) | | | 1,528 | | | | — | |
Long-term debt due within one year (note 13) | | | 300 | | | | 798 | |
| | | | | | | | |
| | | 5,809 | | | | 4,163 | |
Long-term debt (note 13) | | | 4,097 | | | | 3,321 | |
Other long-term liabilities (note15) | | | 585 | | | | 271 | |
Contribution payable (notes 8, 22, 26) | | | — | | | | 1,421 | |
Deferred tax liabilities (note 17) | | | 4,814 | | | | 4,942 | |
Asset retirement obligations (note 16) | | | 2,968 | | | | 2,708 | |
Commitments and contingencies (note 20) | | | | | | | | |
| | | | | | | | |
Total Liabilities | | | 18,273 | | | | 16,826 | |
| | | | | | | | |
Shareholders’ equity | | | | | | | | |
Common shares (note 18) | | | 6,986 | | | | 6,974 | |
Preferred shares (note 18) | | | 534 | | | | 291 | |
Retained earnings | | | 12,666 | | | | 12,615 | |
Other reserves | | | 389 | | | | 198 | |
| | | | | | | | |
Total Shareholders’ Equity | | | 20,575 | | | | 20,078 | |
| | | | | | | | |
Total Liabilities and Shareholders’ Equity | | | 38,848 | | | | 36,904 | |
| | | | | | | | |
The accompanying notes to the consolidated financial statements are an integral part of these statements.
On behalf of the Board:
| | | | |
 | | | |  |
| | |
| Asim Ghosh | | | | William Shurniak |
| Director | | | | Director |
Consolidated Financial Statements 3
Consolidated Statements of Income
| | | | | | | | |
| | | Year ended December 31, | |
(millions of Canadian dollars, except share data) | | 2014 | | | 2013 | |
Gross revenues | | | 25,052 | | | | 23,869 | |
Royalties | | | (1,030 | ) | | | (864 | ) |
Marketing and other | | | 70 | | | | 312 | |
| | | | | | | | |
Revenues, net of royalties | | | 24,092 | | | | 23,317 | |
| | | | | | | | |
Expenses | | | | | | | | |
Purchases of crude oil and products | | | 14,409 | | | | 14,067 | |
Production and operating expenses | | | 3,119 | | | | 2,845 | |
Selling, general and administrative expenses | | | 462 | | | | 506 | |
Depletion, depreciation, amortization and impairment(note 7) | | | 4,010 | | | | 3,005 | |
Exploration and evaluation expenses(note 6) | | | 214 | | | | 246 | |
Other – net | | | (56 | ) | | | (87 | ) |
| | | | | | | | |
| | | 22,158 | | | | 20,582 | |
| | | | | | | | |
Earnings from operating activities | | | 1,934 | | | | 2,735 | |
| | | | | | | | |
Share of equity investment(note 8) | | | (6 | ) | | | (10 | ) |
| | | | | | | | |
Financial items (note 14) | | | | | | | | |
Net foreign exchange gains | | | 81 | | | | 21 | |
Finance income | | | 8 | | | | 51 | |
Finance expenses | | | (233 | ) | | | (169 | ) |
| | | | | | | | |
| | | (144 | ) | | | (97 | ) |
| | | | | | | | |
Earnings before income taxes | | | 1,784 | | | | 2,628 | |
| | | | | | | | |
Provisions for (recovery of) income taxes(note 17) | | | | | | | | |
Current | | | 717 | | | | 589 | |
Deferred | | | (191 | ) | | | 210 | |
| | | | | | | | |
| | | 526 | | | | 799 | |
| | | | | | | | |
Net earnings | | | 1,258 | | | | 1,829 | |
| | | | | | | | |
Earnings per share(note 18) | | | | | | | | |
Basic | | | 1.26 | | | | 1.85 | |
Diluted | | | 1.20 | | | | 1.85 | |
Weighted average number of common shares outstanding (note 18) | | | | | | | | |
Basic(millions) | | | 983.6 | | | | 983.0 | |
Diluted(millions) | | | 985.3 | | | | 983.6 | |
| | | | | | | | |
The accompanying notes to the consolidated financial statements are an integral part of these statements.
Consolidated Financial Statements 4
Consolidated Statements of Comprehensive Income
| | | | | | | | |
| | | Year ended December 31, | |
(millions of Canadian dollars) | | 2014 | | | 2013 | |
Net earnings | | | 1,258 | | | | 1,829 | |
Other comprehensive income (loss) | | | | | | | | |
Items that will not be reclassified into earnings, net of tax: | | | | | | | | |
Remeasurements of pension plans, net of tax (note 19) | | | (14 | ) | | | 20 | |
Items that may be reclassified into earnings, net of tax: | | | | | | | | |
Derivatives designated as cash flow hedges(note 22) | | | (14 | ) | | | 36 | |
Exchange differences on translation of foreign operations | | | 465 | | | | 361 | |
Hedge of net investment(note 22) | | | (260 | ) | | | (180 | ) |
| | | | | | | | |
Other comprehensive income | | | 177 | | | | 237 | |
| | | | | | | | |
Comprehensive income | | | 1,435 | | | | 2,066 | |
| | | | | | | | |
The accompanying notes to the consolidated financial statements are an integral part of these statements.
Consolidated Financial Statements 5
Consolidated Statements of Changes in Shareholders’ Equity
| | | | | | | | | | | | | | | | | | | | | | | | |
| | | Attributable to Equity Holders | |
| | | | | | | | | | | | Other Reserves | | | | |
(millions of Canadian dollars) | | Common
Shares | | | Preferred
Shares | | | Retained
Earnings | | | Foreign
Currency
Translation | | | Hedging | | | Total
Shareholders’
Equity | |
Balance as at December 31, 2012 | | | 6,939 | | | | 291 | | | | 11,950 | | | | (20 | ) | | | 1 | | | | 19,161 | |
| | | | | | | | | | | | | | | | | | | | | | | | |
Net earnings | | | — | | | | — | | | | 1,829 | | | | — | | | | — | | | | 1,829 | |
Other comprehensive income (loss) | | | | | | | | | | | | | | | | | | | | | | | | |
Remeasurements of pension plans (net of tax of $7 million)(note 19) | | | — | | | | — | | | | 20 | | | | — | | | | — | | | | 20 | |
Derivatives designated as cash flow hedges (net of tax of $13 million)(note 22) | | | — | | | | — | | | | — | | | | — | | | | 36 | | | | 36 | |
Exchange differences on translation of foreign operations (net of tax of $58 million) | | | — | | | | — | | | | — | | | | 361 | | | | — | | | | 361 | |
Hedge of net investment (net of tax of $27 million)(note 22) | | | — | | | | — | | | | — | | | | (180 | ) | | | — | | | | (180 | ) |
| | | | | | | | | | | | | | | | | | | | | | | | |
Total comprehensive income (loss) | | | — | | | | — | | | | 1,849 | | | | 181 | | | | 36 | | | | 2,066 | |
Transactions with owners recognized directly in equity: | | | | | | | | | | | | | | | | | | | | | | | | |
Stock dividends paid(note 18) | | | 8 | | | | — | | | | — | | | | — | | | | — | | | | 8 | |
Stock options exercised(note 18) | | | 27 | | | | — | | | | — | | | | — | | | | — | | | | 27 | |
Dividends declared on common shares(note 18) | | | — | | | | — | | | | (1,180 | ) | | | — | | | | — | | | | (1,180 | ) |
Dividends declared on preferred shares(note 18) | | | — | | | | — | | | | (13 | ) | | | — | | | | — | | | | (13 | ) |
Change in accounting policy | | | — | | | | — | | | | 9 | | | | — | | | | — | | | | 9 | |
| | | | | | | | | | | | | | | | | | | | | | | | |
Balance as at December 31, 2013 | | | 6,974 | | | | 291 | | | | 12,615 | | | | 161 | | | | 37 | | | | 20,078 | |
| | | | | | | | | | | | | | | | | | | | | | | | |
Net earnings | | | — | | | | — | | | | 1,258 | | | | — | | | | — | | | | 1,258 | |
Other comprehensive income (loss) | | | | | | | | | | | | | | | | | | | | | | | | |
Remeasurements of pension plans (net of tax of $4 million)(note 19) | | | — | | | | — | | | | (14 | ) | | | — | | | | — | | | | (14 | ) |
Derivatives designated as cash flow hedges (net of tax of $5 million)(note 22) | | | — | | | | — | | | | — | | | | — | | | | (14 | ) | | | (14 | ) |
Exchange differences on translation of foreign operations (net of tax of $109 million) | | | — | | | | — | | | | — | | | | 465 | | | | — | | | | 465 | |
Hedge of net investment (net of tax of $39 million)(note 22) | | | — | | | | — | | | | — | | | | (260 | ) | | | — | | | | (260 | ) |
| | | | | | | | | | | | | | | | | | | | | | | | |
Total comprehensive income (loss) | | | — | | | | — | | | | 1,244 | | | | 205 | | | | (14 | ) | | | 1,435 | |
Transactions with owners recognized directly in equity: | | | | | | | | | | | | | | | | | | | | | | | | |
Preferred shares issuance(note 18) | | | — | | | | 250 | | | | — | | | | — | | | | — | | | | 250 | |
Share issue costs(note 18) | | | — | | | | (7 | ) | | | — | | | | — | | | | — | | | | (7 | ) |
Stock dividends paid(note 18) | | | 11 | | | | — | | | | — | | | | — | | | | — | | | | 11 | |
Stock options exercised(note 18) | | | 1 | | | | — | | | | — | | | | — | | | | — | | | | 1 | |
Dividends declared on common shares(note 18) | | | — | | | | — | | | | (1,180 | ) | | | — | | | | — | | | | (1,180 | ) |
Dividends declared on preferred shares(note 18) | | | — | | | | — | | | | (13 | ) | | | — | | | | — | | | | (13 | ) |
| | | | | | | | | | | | | | | | | | | | | | | | |
Balance as at December 31, 2014 | | | 6,986 | | | | 534 | | | | 12,666 | | | | 366 | | | | 23 | | | | 20,575 | |
| | | | | | | | | | | | | | | | | | | | | | | | |
The accompanying notes to the consolidated financial statements are an integral part of these statements.
Consolidated Financial Statements 6
Consolidated Statements of Cash Flows
| | | | | | | | |
| | | Year ended December 31, | |
(millions of Canadian dollars) | | 2014 | | | 2013 | |
Operating activities | | | | | | | | |
Net earnings | | | 1,258 | | | | 1,829 | |
Items not affecting cash: | | | | | | | | |
Accretion(note 14) | | | 134 | | | | 125 | |
Depletion, depreciation, amortization and impairment(note 7) | | | 4,010 | | | | 3,005 | |
Inventory write-down to net realizable value(note 5) | | | 211 | | | | — | |
Exploration and evaluation expenses(note 6) | | | 6 | | | | 10 | |
Deferred income taxes(note 17) | | | (191 | ) | | | 210 | |
Foreign exchange | | | 71 | | | | 11 | |
Stock-based compensation(note 18) | | | (17 | ) | | | 105 | |
Gain on sale of assets | | | (36 | ) | | | (27 | ) |
Other | | | 89 | | | | (46 | ) |
Settlement of asset retirement obligations(note 16) | | | (167 | ) | | | (142 | ) |
Income taxes paid | | | (661 | ) | | | (433 | ) |
Interest received | | | 7 | | | | 19 | |
Change in non-cash working capital(note 9) | | | 871 | | | | (21 | ) |
| | | | | | | | |
Cash flow – operating activities | | | 5,585 | | | | 4,645 | |
| | | | | | | | |
Financing activities | | | | | | | | |
Long-term debt issuance(note 13) | | | 829 | | | | — | |
Long-term debt repayment(note 13) | | | (814 | ) | | | — | |
Settlement of interest rate swaps | | | 33 | | | | — | |
Commercial paper issuance(note 13) | | | 895 | | | | — | |
Proceeds from preferred share issuance, net of share issue costs(note 18) | | | 243 | | | | — | |
Proceeds from exercise of stock options(note 18) | | | 1 | | | | 27 | |
Dividends on common shares(note 18) | | | (1,169 | ) | | | (1,171 | ) |
Dividends on preferred shares(note 18) | | | (13 | ) | | | (13 | ) |
Interest paid | | | (284 | ) | | | (243 | ) |
Contribution receivable receipt(note 8) | | | 143 | | | | 520 | |
Other | | | 97 | | | | 53 | |
Change in non-cash working capital(note 9) | | | 33 | | | | (19 | ) |
| | | | | | | | |
Cash flow – financing activities | | | (6 | ) | | | (846 | ) |
| | | | | | | | |
Investing activities | | | | | | | | |
Capital expenditures | | | (5,023 | ) | | | (5,028 | ) |
Proceeds from asset sales | | | 66 | | | | 37 | |
Contribution payable payment(note 8) | | | (106 | ) | | | (87 | ) |
Other | | | (27 | ) | | | (8 | ) |
Change in non-cash working capital(note 9) | | | (333 | ) | | | 364 | |
| | | | | | | | |
Cash flow – investing activities | | | (5,423 | ) | | | (4,722 | ) |
| | | | | | | | |
Increase (decrease) in cash and cash equivalents | | | 156 | | | | (923 | ) |
Effect of exchange rates on cash and cash equivalents | | | 14 | | | | (5 | ) |
Cash and cash equivalents at beginning of year | | | 1,097 | | | | 2,025 | |
| | | | | | | | |
Cash and cash equivalents at end of year | | | 1,267 | | | | 1,097 | |
| | | | | | | | |
The accompanying notes to the consolidated financial statements are an integral part of these statements.
Consolidated Financial Statements 7
NOTES TO THE CONSOLIDATED FINANCIAL STATEMENTS
| Note 1 | Description of Business and Segmented Disclosures |
Husky Energy Inc. (“Husky” or “the Company”) is an international integrated energy company incorporated under the Business Corporations Act (Alberta). The Company’s common shares are listed on the Toronto Stock Exchange (“TSX”) under the symbol “HSE” and the Cumulative Redeemable Preferred Shares, Series 1 and Cumulative Redeemable Preferred Shares, Series 3 shares are listed under the symbols, “HSE.PR.A” and “HSE.PR.C”, respectively. The registered office is located at 707, 8th Avenue S.W., PO Box 6525, Station D, Calgary, Alberta, T2P 3G7.
Management has identified segments for the Company’s business based on differences in products, services and management responsibility. The Company’s business is conducted predominantly through two major business segments – Upstream and Downstream.
Upstreamincludes exploration for, and development and production of, crude oil, bitumen, natural gas and natural gas liquids (Exploration and Production) and marketing of the Company’s and other producers’crude oil, natural gas, natural gas liquids, sulphur and petroleum coke, pipeline transportation, the blending of crude oil and natural gas, and storage of crude oil, diluent and natural gas (Infrastructure and Marketing). The Company’s Upstream operations are located primarily in Western Canada, offshore East Coast of Canada, offshore China and offshore Indonesia.
Downstream includes upgrading of heavy crude oil feedstock into synthetic crude oil (Upgrading), refining in Canada of crude oil and marketing of refined petroleum products including gasoline, diesel, ethanol blended fuels, asphalt and ancillary products and production of ethanol (Canadian Refined Products) and refining in the U.S. of primarily crude oil to produce and market gasoline, jet fuel and diesel fuels that meet U.S. clean fuels standards (U.S. Refining and Marketing).
Consolidated Financial Statements 8
Segmented Financial Information
| | | | | | | | | | | | | | | | | | | | | | | | |
| | | Upstream | |
($ millions) | | Exploration and
Production(1) | | | Infrastructure
and Marketing | | | Total | |
Year ended December 31, | | 2014 | | | 2013 | | | 2014 | | | 2013 | | | 2014 | | | 2013 | |
Gross revenues | | | 8,634 | | | | 7,333 | | | | 2,202 | | | | 2,134 | | | | 10,836 | | | | 9,467 | |
Royalties | | | (1,030 | ) | | | (864 | ) | | | — | | | | — | | | | (1,030 | ) | | | (864 | ) |
Marketing and other | | | — | | | | — | | | | 70 | | | | 312 | | | | 70 | | | | 312 | |
| | | | | | | | | | | | | | | | | | | | | | | | |
Revenues, net of royalties | | | 7,604 | | | | 6,469 | | | | 2,272 | | | | 2,446 | | | | 9,876 | | | | 8,915 | |
| | | | | | | | | | | | | | | | | | | | | | | | |
Expenses | | | | | | | | | | | | | | | | | | | | | | | | |
Purchases of crude oil and products | | | 96 | | | | 91 | | | | 2,056 | | | | 2,004 | | | | 2,152 | | | | 2,095 | |
Production and operating expenses | | | 2,172 | | | | 2,016 | | | | 32 | | | | 21 | | | | 2,204 | | | | 2,037 | |
Selling, general and administrative expenses | | | 253 | | | | 240 | | | | 8 | | | | 12 | | | | 261 | | | | 252 | |
Depletion, depreciation, amortization and impairment | | | 3,434 | | | | 2,515 | | | | 25 | | | | 20 | | | | 3,459 | | | | 2,535 | |
Exploration and evaluation expenses | | | 214 | | | | 246 | | | | — | | | | — | | | | 214 | | | | 246 | |
Other – net | | | (60 | ) | | | (35 | ) | | | (2 | ) | | | (3 | ) | | | (62 | ) | | | (38 | ) |
| | | | | | | | | | | | | | | | | | | | | | | | |
Earnings (loss) from operating activities | | | 1,495 | | | | 1,396 | | | | 153 | | | | 392 | | | | 1,648 | | | | 1,788 | |
| | | | | | | | | | | | | | | | | | | | | | | | |
Share of equity investment | | | (6 | ) | | | (10 | ) | | | — | | | | — | | | | (6 | ) | | | (10 | ) |
| | | | | | | | | | | | | | | | | | | | | | | | |
Financial items | | | | | | | | | | | | | | | | | | | | | | | | |
Net foreign exchange gains | | | — | | | | — | | | | — | | | | — | | | | — | | | | — | |
Finance income | | | (1 | ) | | | 4 | | | | — | | | | — | | | | (1 | ) | | | 4 | |
Finance expenses | | | (151 | ) | | | (107 | ) | | | — | | | | — | | | | (151 | ) | | | (107 | ) |
| | | | | | | | | | | | | | | | | | | | | | | | |
Earnings (loss) before income taxes | | | 1,337 | | | | 1,283 | | | | 153 | | | | 392 | | | | 1,490 | | | | 1,675 | |
| | | | | | | | | | | | | | | | | | | | | | | | |
Provisions for (recovery of) income taxes | | | | | | | | | | | | | | | | | | | | | | | | |
Current | | | 386 | | | | 162 | | | | 99 | | | | 222 | | | | 485 | | | | 384 | |
Deferred | | | (41 | ) | | | 169 | | | | (60 | ) | | | (122 | ) | | | (101 | ) | | | 47 | |
| | | | | | | | | | | | | | | | | | | | | | | | |
Total income tax provision (recovery) | | | 345 | | | | 331 | | | | 39 | | | | 100 | | | | 384 | | | | 431 | |
| | | | | | | | | | | | | | | | | | | | | | | | |
Net earnings (loss) | | | 992 | | | | 952 | | | | 114 | | | | 292 | | | | 1,106 | | | | 1,244 | |
| | | | | | | | | | | | | | | | | | | | | | | | |
Intersegment revenues | | | 2,229 | | | | 1,714 | | | | — | | | | — | | | | 2,229 | | | | 1,714 | |
Other non-cash items | | | | | | | | | | | | | | | | | | | | | | | | |
Gain (loss) on sale of assets | | | 39 | | | | 19 | | | | — | | | | — | | | | 39 | | | | 19 | |
| | | | | | | | | | | | | | | | | | | | | | | | |
| (1) | Includes allocated depletion, depreciation, amortization and impairment related to assets in Infrastructure and Marketing, as these assets provide a service to Exploration and Production. |
| (2) | Eliminations relate to sales and operating revenues between segments recorded at transfer prices based on current market prices |
Consolidated Financial Statements 9
| | | | | | | | | | | | | | | | | | | | | | | | | | | | | | | | | | | | | | | | | | | | | | |
| Downstream | | | Corporate and
Eliminations(2) | | | Total | |
| Upgrading | | | Canadian Refined
Products | | | U.S. Refining
and Marketing | | | Total | | | | | | | |
| 2014 | | | 2013 | | | 2014 | | | 2013 | | | 2014 | | | 2013 | | | 2014 | | | 2013 | | | 2014 | | | 2013 | | | 2014 | | | 2013 | |
| | 2,212 | | | | 2,023 | | | | 4,020 | | | | 3,737 | | | | 10,663 | | | | 10,728 | | | | 16,895 | | | | 16,488 | | | | (2,679 | ) | | | (2,086 | ) | | | 25,052 | | | | 23,869 | |
| | — | | | | — | | | | — | | | | — | | | | — | | | | — | | | | — | | | | — | | | | — | | | | — | | | | (1,030 | ) | | | (864 | ) |
| | — | | | | — | | | | — | | | | — | | | | — | | | | — | | | | — | | | | — | | | | — | | | | — | | | | 70 | | | | 312 | |
| | | | | | | | | | | | | | | | | | | | | | | | | | | | | | | | | | | | | | | | | | | | | | |
| | 2,212 | | | | 2,023 | | | | 4,020 | | | | 3,737 | | | | 10,663 | | | | 10,728 | | | | 16,895 | | | | 16,488 | | | | (2,679 | ) | | | (2,086 | ) | | | 24,092 | | | | 23,317 | |
| | | | | | | | | | | | | | | | | | | | | | | | | | | | | | | | | | | | | | | | | | | | | | |
| | | | | | | | | | | | | | | | | | | | | | | | | | | | | | | | | | | | | | | | | | | | | | |
| | 1,676 | | | | 1,378 | | | | 3,319 | | | | 3,134 | | | | 9,941 | | | | 9,546 | | | | 14,936 | | | | 14,058 | | | | (2,679 | ) | | | (2,086 | ) | | | 14,409 | | | | 14,067 | |
| | 180 | | | | 161 | | | | 263 | | | | 227 | | | | 472 | | | | 420 | | | | 915 | | | | 808 | | | | — | | | | — | | | | 3,119 | | | | 2,845 | |
| | 9 | | | | 7 | | | | 44 | | | | 26 | | | | 9 | | | | 4 | | | | 62 | | | | 37 | | | | 139 | | | | 217 | | | | 462 | | | | 506 | |
| | 108 | | | | 96 | | | | 102 | | | | 90 | | | | 268 | | | | 233 | | | | 478 | | | | 419 | | | | 73 | | | | 51 | | | | 4,010 | | | | 3,005 | |
| | — | | | | — | | | | — | | | | — | | | | — | | | | — | | | | — | | | | — | | | | — | | | | — | | | | 214 | | | | 246 | |
| | 11 | | | | (27 | ) | | | — | | | �� | (5 | ) | | | — | | | | — | | | | 11 | | | | (32 | ) | | | (5 | ) | | | (17 | ) | | | (56 | ) | | | (87 | ) |
| | | | | | | | | | | | | | | | | | | | | | | | | | | | | | | | | | | | | | | | | | | | | | |
| | 228 | | | | 408 | | | | 292 | | | | 265 | | | | (27 | ) | | | 525 | | | | 493 | | | | 1,198 | | | | (207 | ) | | | (251 | ) | | | 1,934 | | | | 2,735 | |
| | | | | | | | | | | | | | | | | | | | | | | | | | | | | | | | | | | | | | | | | | | | | | |
| | — | | | | — | | | | — | | | | — | | | | — | | | | — | | | | — | | | | — | | | | — | | | | — | | | | (6 | ) | | | (10 | ) |
| | | | | | | | | | | | | | | | | | | | | | | | | | | | | | | | | | | | | | | | | | | | | | |
| | | | | | | | | | | | | | | | | | | | | | | | | | | | | | | | | | | | | | | | | | | | | | |
| | — | | | | — | | | | — | | | | — | | | | — | | | | — | | | | — | | | | — | | | | 81 | | | | 21 | | | | 81 | | | | 21 | |
| | — | | | | — | | | | — | | | | — | | | | — | | | | — | | | | — | | | | — | | | | 9 | | | | 47 | | | | 8 | | | | 51 | |
| | (1 | ) | | | (7 | ) | | | (5 | ) | | | (5 | ) | | | (3 | ) | | | (3 | ) | | | (9 | ) | | | (15 | ) | | | (73 | ) | | | (47 | ) | | | (233 | ) | | | (169 | ) |
| | | | | | | | | | | | | | | | | | | | | | | | | | | | | | | | | | | | | | | | | | | | | | |
| | 227 | | | | 401 | | | | 287 | | | | 260 | | | | (30 | ) | | | 522 | | | | 484 | | | | 1,183 | | | | (190 | ) | | | (230 | ) | | | 1,784 | | | | 2,628 | |
| | | | | | | | | | | | | | | | | | | | | | | | | | | | | | | | | | | | | | | | | | | | | | |
| | | | | | | | | | | | | | | | | | | | | | | | | | | | | | | | | | | | | | | | | | | | | | |
| | 47 | | | | 19 | | | | 80 | | | | 65 | | | | 1 | | | | 18 | | | | 128 | | | | 102 | | | | 104 | | | | 103 | | | | 717 | | | | 589 | |
| | 12 | | | | 85 | | | | (7 | ) | | | 1 | | | | (12 | ) | | | 165 | | | | (7 | ) | | | 251 | | | | (83 | ) | | | (88 | ) | | | (191 | ) | | | 210 | |
| | | | | | | | | | | | | | | | | | | | | | | | | | | | | | | | | | | | | | | | | | | | | | |
| | 59 | | | | 104 | | | | 73 | | | | 66 | | | | (11 | ) | | | 183 | | | | 121 | | | | 353 | | | | 21 | | | | 15 | | | | 526 | | | | 799 | |
| | | | | | | | | | | | | | | | | | | | | | | | | | | | | | | | | | | | | | | | | | | | | | |
| | 168 | | | | 297 | | | | 214 | | | | 194 | | | | (19 | ) | | | 339 | | | | 363 | | | | 830 | | | | (211 | ) | | | (245 | ) | | | 1,258 | | | | 1,829 | |
| | | | | | | | | | | | | | | | | | | | | | | | | | | | | | | | | | | | | | | | | | | | | | |
| | 249 | | | | 172 | | | | 201 | | | | 200 | | | | — | | | | — | | | | 450 | | | | 372 | | | | — | | | | — | | | | 2,679 | | | | 2,086 | |
| | | | | | | | | | | | | | | | | | | | | | | | | | | | | | | | | | | | | | | | | | | | | | |
| | — | | | | — | | | | 1 | | | | 8 | | | | (4 | ) | | | — | | | | (3 | ) | | | 8 | | | | — | | | | — | | | | 36 | | | | 27 | |
| | | | | | | | | | | | | | | | | | | | | | | | | | | | | | | | | | | | | | | | | | | | | | |
Consolidated Financial Statements 10
Segmented Financial Information
| | | | | | | | | | | | | | | | | | | | | | | | |
| | | Upstream | |
($ millions) | | Exploration and
Production(1) | | | Infrastructure
and Marketing | | | Total | |
Year ended December 31, | | 2014 | | | 2013 | | | 2014 | | | 2013 | | | 2014 | | | 2013 | |
Expenditures on exploration and evaluation assets(2) | | | 326 | | | | 575 | | | | — | | | | — | | | | 326 | | | | 575 | |
Expenditures on property, plant and equipment(2) | | | 3,863 | | | | 3,689 | | | | 211 | | | | 96 | | | | 4,074 | | | | 3,785 | |
| | | | | | | | | | | | | | | | | | | | | | | | |
As at December 31, | | | | | | | | | | | | | | | | | | | | | | | | |
Exploration and evaluation assets | | | 1,149 | | | | 1,144 | | | | — | | | | — | | | | 1,149 | | | | 1,144 | |
Developing and producing assets at cost | | | 47,969 | | | | 43,128 | | | | — | | | | — | | | | 47,969 | | | | 43,128 | |
Accumulated depletion, depreciation, amortization and impairment | | | (23,686 | ) | | | (20,439 | ) | | | — | | | | — | | | | (23,686 | ) | | | (20,439 | ) |
Other property, plant and equipment at cost | | | 48 | | | | — | | | | 1,250 | | | | 1,033 | | | | 1,298 | | | | 1,033 | |
Accumulated depletion, depreciation and amortization | | | (34 | ) | | | — | | | | (495 | ) | | | (448 | ) | | | (529 | ) | | | (448 | ) |
| | | | | | | | | | | | | | | | | | | | | | | | |
Total exploration and evaluation assets and property, plant and equipment, net | | | 25,446 | | | | 23,833 | | | | 755 | | | | 585 | | | | 26,201 | | | | 24,418 | |
Total assets | | | 26,035 | | | | 24,653 | | | | 1,969 | | | | 1,670 | | | | 28,004 | | | | 26,323 | |
| | | | | | | | | | | | | | | | | | | | | | | | |
| (1) | Includes allocated depletion, depreciation, amortization and impairment related to assets in Infrastructure and Marketing, as these assets provide a service to Exploration and Production. |
| (2) | Excludes capitalized costs related to asset retirement obligations and capitalized interest incurred during the year. Includes assets acquired through acquisitions. |
Geographical Financial Information
| | | | | | | | |
($ millions) | | Canada | |
Year ended December 31, | | 2014 | | | 2013 | |
Gross revenues(1) | | | 12,484 | | | | 11,926 | |
Royalties | | | (964 | ) | | | (794 | ) |
Marketing and other | | | 70 | | | | 316 | |
| | | | | | | | |
Revenue, net of royalties | | | 11,590 | | | | 11,448 | |
| | | | | | | | |
As at December 31, | | | | | | | | |
Exploration and evaluation assets | | | 876 | | | | 855 | |
Property, plant and equipment, net | | | 23,900 | | | | 22,928 | |
Goodwill | | | 160 | | | | 160 | |
Total non-current assets | | | 25,129 | | | | 24,152 | |
| | | | | | | | �� |
| (1) | Based on the geographical location of legal entities. |
Consolidated Financial Statements 11
| | | | | | | | | | | | | | | | | | | | | | | | | | | | | | | | | | | | | | | | | | | | | | |
| Downstream | | | Corporate and
Eliminations | | | Total | |
| Upgrading | | | Canadian Refined
Products | | | U.S. Refining and
Marketing | | | Total | | | | | | | | | | | | | |
| 2014 | | | 2013 | | | 2014 | | | 2013 | | | 2014 | | | 2013 | | | 2014 | | | 2013 | | | 2014 | | | 2013 | | | 2014 | | | 2013 | |
| | — | | | | — | | | | — | | | | — | | | | — | | | | — | | | | — | | | | — | | | | — | | | | — | | | | 326 | | | | 575 | |
| | 50 | | | | 205 | | | | 86 | | | | 109 | | | | 374 | | | | 220 | | | | 510 | | | | 534 | | | | 113 | | | | 134 | | | | 4,697 | | | | 4,453 | |
| | | | | | | | | | | | | | | | | | | | | | | | | | | | | | | | | | | | | | | | | | | | | | |
| | | | | | | | | | | | | | | | | | | | | | | | | | | | | | | | | | | | | | | | | | | | | | |
| | — | | | | — | | | | — | | | | — | | | | — | | | | — | | | | — | | | | — | | | | — | | | | — | | | | 1,149 | | | | 1,144 | |
| | — | | | | — | | | | — | | | | — | | | | — | | | | — | | | | — | | | | — | | | | — | | | | — | | | | 47,969 | | | | 43,128 | |
| | — | | | | — | | | | — | | | | — | | | | — | | | | — | | | | — | | | | — | | | | — | | | | — | | | | (23,686 | ) | | | (20,439 | ) |
| | 2,274 | | | | 2,221 | | | | 2,433 | | | | 2,332 | | | | 5,874 | | | | 5,020 | | | | 10,581 | | | | 9,573 | | | | 889 | | | | 775 | | | | 12,768 | | | | 11,381 | |
| | (1,154 | ) | | | (1,046 | ) | | | (1,144 | ) | | | (1,046 | ) | | | (1,641 | ) | | | (1,257 | ) | | | (3,939 | ) | | | (3,349 | ) | | | (596 | ) | | | (523 | ) | | | (5,064 | ) | | | (4,320 | ) |
| | | | | | | | | | | | | | | | | | | | | | | | | | | | | | | | | | | | | | | | | | | | | | |
| | | | | | | | | | | |
| | 1,120 | | | | 1,175 | | | | 1,289 | | | | 1,286 | | | | 4,233 | | | | 3,763 | | | | 6,642 | | | | 6,224 | | | | 293 | | | | 252 | | | | 33,136 | | | | 30,894 | |
| | 1,243 | | | | 1,355 | | | | 1,676 | | | | 1,788 | | | | 5,788 | | | | 5,537 | | | | 8,707 | | | | 8,680 | | | | 2,137 | | | | 1,901 | | | | 38,848 | | | | 36,904 | |
| | | | | | | | | | | | | | | | | | | | | | | | | | | | | | | | | | | | | | | | | | | | | | |
| | | | | | | | | | | | | | | | | | | | | | |
| United States | | | Other International | | | Total | |
| 2014 | | | 2013 | | | 2014 | | | 2013 | | | 2014 | | | 2013 | |
| | 11,725 | | | | 11,663 | | | | 843 | | | | 280 | | | | 25,052 | | | | 23,869 | |
| | — | | | | — | | | | (66 | ) | | | (70 | ) | | | (1,030 | ) | | | (864 | ) |
| | — | | | | (4 | ) | | | — | | | | — | | | | 70 | | | | 312 | |
| | | | | | | | | | | | | | | | | | | | | | |
| | 11,725 | | | | 11,659 | | | | 777 | | | | 210 | | | | 24,092 | | | | 23,317 | |
| | | | | | | | | | | | | | | | | | | | | | |
| | | | | | | | | | | | | | | | | | | | | | |
| | — | | | | — | | | | 273 | | | | 289 | | | | 1,149 | | | | 1,144 | |
| | 4,233 | | | | 3,764 | | | | 3,854 | | | | 3,058 | | | | 31,987 | | | | 29,750 | |
| | 586 | | | | 538 | | | | — | | | | — | | | | 746 | | | | 698 | |
| | 4,838 | | | | 4,320 | | | | 4,386 | | | | 3,515 | | | | 34,353 | | | | 31,987 | |
| | | | | | | | | | | | | | | | | | | | | | |
Consolidated Financial Statements 12
| Note 2 | Basis of Presentation |
| a) | Basis of Measurement and Statement of Compliance |
The consolidated financial statements have been prepared by management on a historical cost basis with some exceptions, as detailed in the accounting policies set out below in accordance with International Financial Reporting Standards (“IFRS”), as issued by the International Accounting Standards Board (“IASB”). These accounting policies have been applied consistently for all periods presented in these consolidated financial statements.
These consolidated financial statements were approved and signed by the Chair of the Audit Committee and the Chief Executive Officer on February 23, 2015 having been duly authorized to do so by the Board of Directors.
Certain prior years’ amounts have been recast to conform with current presentation.
| b) | Principles of Consolidation |
The consolidated financial statements include the accounts of Husky Energy Inc. and its subsidiaries. Subsidiaries are defined as any entities, including unincorporated entities such as partnerships, for which the Company has the power to govern their financial and operating policies to obtain benefits from their activities. Substantially all of the Company’s Upstream activities are conducted jointly with third parties, and accordingly, the accounts reflect the Company’s proportionate share of the assets, liabilities, revenues, expenses and cash flows from these activities. Intercompany balances, net earnings and unrealized gains and losses arising from intercompany transactions are eliminated in preparing the consolidated financial statements.
| c) | Use of Estimates, Judgments and Assumptions |
The timely preparation of the consolidated financial statements requires management to make estimates, judgments and assumptions that affect the reported amounts of assets and liabilities and disclosures of contingencies, if any, as at the date of the financial statements and the reported amounts of revenue and expenses during the period. Actual results may differ from these estimates, judgments and assumptions.
Estimates and underlying assumptions are reviewed on an ongoing basis. Revisions to accounting estimates are recognized in the period in which the estimates are revised and on a prospective basis. By their nature, estimates are subject to measurement uncertainty and changes in such estimates in future years could require a material change in the consolidated financial statements. These underlying assumptions are based on historical experience and other factors that management believes to be reasonable under the circumstances, and are subject to change as new events occur, as more industry experience is acquired, as additional information is obtained and as the Company’s operating environment changes. Specifically, amounts recorded for depletion, depreciation, amortization and impairment, asset retirement obligations, assets and liabilities measured at fair value, employee future benefits, income taxes and contingencies are based on estimates.
Management makes judgments regarding the application of IFRS for each accounting policy. Critical judgments that have the most significant effect on the amounts recognized in the consolidated financial statements include exploration and evaluation costs, impairment assessments, the determination of cash generating units (“CGUs”), the determination of a joint arrangement and the designation of the Company’s functional currency.
Significant estimates, judgments and assumptions made by management in the preparation of these consolidated financial statements are outlined in detail in Note 3.
| d) | Functional and Presentation Currency |
The consolidated financial statements are presented in Canadian dollars, which is the Company’s functional currency. All financial information is presented in millions of Canadian dollars, except per share amounts and unless otherwise stated.
The designation of the Company’s functional currency is a management judgment based on the currency of the primary economic environment in which the Company operates.
Consolidated Financial Statements 13
| Note 3 | Significant Accounting Policies |
| a) | Cash and Cash Equivalents |
Cash and cash equivalents consist of cash on hand less outstanding cheques and deposits with an original maturity of less than three months at the time of purchase. When outstanding cheques are in excess of cash on hand and short-term deposits, and the Company has the ability to net settle, the excess is reported in bank operating loans.
Crude oil, natural gas, refined petroleum products and sulphur inventories are valued at the lower of cost or net realizable value. Cost is determined using average cost or on a first-in, first-out basis, as appropriate. Materials, parts and supplies are valued at the lower of average cost or net realizable value. Cost consists of raw material, labour, direct overhead and transportation. Commodity inventories held for trading purposes are carried at fair value and measured at fair value less costs to sell based on Level 2 observable inputs. Any changes in commodity inventory fair value are included as gains or losses in marketing and other in the consolidated statements of income, during the period of change. Previous inventory impairment provisions are reversed when there is a change in the condition that caused the impairment. Unrealized intersegment net earnings on inventory sales are eliminated.
The Company uses precious metals in conjunction with a catalyst as part of the downstream upgrading and refining processes. These precious metals remain intact; however, there is a loss during the reclamation process. The estimated loss is amortized to production and operating expenses over the period that the precious metal is in use, which is approximately two to five years. After the reclamation process, the actual loss is compared to the estimated loss and any difference is recognized in net earnings. Precious metals are included in property, plant and equipment on the balance sheet.
| d) | Exploration and Evaluation Assets and Property, Plant and Equipment |
Oil and gas properties and other property, plant and equipment are recorded at cost, including expenditures that are directly attributable to the purchase or development of an asset. Borrowing costs directly attributable to the acquisition, construction or production of a qualifying asset are included in the asset cost. Capitalization ceases when substantially all activities necessary to prepare the qualifying asset for its intended use are complete.
The appropriate accounting treatment of costs incurred for oil and natural gas exploration, evaluation and development is determined by the classification of the underlying activities as either exploratory or developmental. The results from an exploration drilling program can take considerable time to analyze, and the determination that commercial reserves have been discovered requires both judgment and industry experience. Exploration activities can fluctuate from year to year, due to such factors as the level of exploratory spending, the level of risk sharing with third parties participating in exploratory drilling and the degree of risk associated with drilling in particular areas. Properties that are assumed to be productive may, over a period of time, actually deliver oil and gas in quantities different than originally estimated because of changes in reservoir performance.
Consolidated Financial Statements 14
| ii) | Exploration and evaluation costs |
Costs incurred after the legal right to explore an area has been obtained and before technical feasibility and commercial viability of the area have been established are capitalized as exploration and evaluation assets. These costs include costs to acquire acreage and exploration rights, legal and other professional fees and land brokerage fees. Pre-license costs and geological and geophysical costs associated with exploration activities are expensed in the period incurred. Costs directly associated with an exploration well are initially capitalized as an exploration and evaluation asset until the drilling of the well is complete and the results have been evaluated. If extractable hydrocarbons are found and are likely to be developed commercially, but are subject to further appraisal activity, which may include the drilling of wells, the costs continue to be carried as an exploration and evaluation asset while sufficient and continued progress is made in assessing the commercial viability of the hydrocarbons. Capitalized exploration and evaluation costs or assets are not depreciated and are carried forward until technical feasibility and commercial viability of the area is determined or the assets are determined to be impaired. Management uses judgment to determine when exploration and evaluation assets are reclassified to property, plant and equipment. This decision considers several factors, including the existence of reserves, establishing commercial and technical feasibility and whether the asset can be developed using a proved development concept and has received internal approval. Upon the determination of technical feasibility and commercial viability, capitalized exploration and evaluation assets are then transferred to property, plant and equipment. All such carried costs are subject to technical, commercial and management review, as well as review for impairment indicators, at least every reporting period to confirm the continued intent to develop or otherwise extract value from the discovery. These costs are also tested for impairment when transferred to property, plant and equipment. Capitalized exploration and evaluation expenditures related to wells that do not find reserves, or where no future activity is planned, are expensed as exploration and evaluation expenses.
The application of the Company’s accounting policy for exploration and evaluation costs requires judgment in determining whether it is likely that future economic benefit exists when activities have not reached a stage where technical feasibility and commercial viability can be reasonably determined. Judgments may change as new information becomes available.
Expenditures, including borrowing costs, on the construction, installation and completion of infrastructure facilities, such as platforms, pipelines and the drilling of development wells, including unsuccessful development or delineation wells, are capitalized as oil and gas properties. Costs incurred to operate and maintain wells and equipment to lift oil and gas to the surface are expensed as production and operating expenses.
| iv) | Other property, plant and equipment |
Repair and maintenance costs, other than major turnaround costs, are expensed as incurred. Major turnaround costs are capitalized as part of property, plant and equipment when incurred and are amortized over the estimated period of time to the anticipated date of the next turnaround.
| v) | Depletion, depreciation and amortization |
Oil and gas properties are depleted on a unit-of-production basis over the proved developed reserves of the particular field, except in the case of assets whose useful life is shorter or longer than the lifetime of the proved developed reserves of that field, in which case the straight-line method or a unit-of-production method based on total recoverable reserves is applied. Rights and concessions are depleted on a unit-of-production basis over the total proved reserves of the relevant area. The unit-of-production rate for the depletion of oil and gas properties related to total proved reserves takes into account expenditures incurred to date together with sanctioned future development expenditures required to develop the field.
Oil and gas reserves are evaluated internally and audited by independent qualified reserve engineers, with the exception of certain Heavy Oil properties that are evaluated by independent qualified reserve engineers. The estimation of reserves is an inherently complex process and involves the exercise of professional judgment. Estimates are based on projected future rates of production, estimated commodity prices, engineering data and the timing of future expenditures, all of which are subject to uncertainty. Changes in reserve estimates can have an impact on reported net earnings through revisions to depletion, depreciation and amortization expense, in addition to determining possible impairments of property, plant and equipment.
Net reserves represent the Company’s undivided gross working interest in total reserves after deducting crown, freehold and overriding royalty interests. Assumptions reflect market and regulatory conditions, as applicable, as at the balance sheet date and could differ significantly from other points in time throughout the year or future periods. Changes in market and regulatory conditions and assumptions can materially impact the estimation of net reserves.
Depreciation for substantially all other property, plant and equipment is provided using the straight-line method based on the estimated useful lives of assets, which range from five to forty-five years, less any estimated residual value. The useful lives of assets are estimated based upon the period the asset is expected to be available for use by the Company. Residual values are based upon the estimated amount that would be obtained on disposal, net of any costs associated with the disposal. Other property, plant and equipment held under finance leases are depreciated over the shorter of the lease term and the estimated useful life of the asset.
Consolidated Financial Statements 15
Depletion, depreciation and amortization rates for all capitalized costs associated with the Company’s activities are reviewed at least annually, or when events or conditions occur that impact capitalized costs, reserves and estimated service lives.
Any gain or loss arising on disposal of exploration and evaluation assets or property, plant and equipment is included in other - net in the consolidated statements of income in the period of disposal.
Finance leases, which transfer substantially all of the risks and rewards incidental to ownership of the leased item to the Company, are capitalized at the commencement of the lease term at the fair value of the lease property or, if lower, at the present value of the minimum lease payments. Capitalized leased assets are depreciated over the shorter of the estimated useful life of the asset or the lease term.
All other leases are accounted for as operating leases and the lease costs are expensed as incurred.
Joint arrangements represent activities where the Company has joint control established by a contractual agreement. Joint control requires unanimous consent for financial and operational decisions. A joint arrangement is either a joint operation, whereby the parties have rights to the assets and obligations for the liabilities, or a joint venture, whereby the parties have rights to the net assets.
For a joint operation, the consolidated financial statements include the Company’s proportionate share of the assets, liabilities, revenues, expenses and cash flows of the joint arrangement. The Company reports items of a similar nature to those on the financial statements of the joint arrangement, on a line-by-line basis, from the date that joint control commences until the date that joint control ceases.
Joint ventures are accounted for using the equity method of accounting and recognized at cost and adjusted thereafter for the post-acquisition change in the Company’s share of the joint venture’s net assets. The Company’s consolidated financial statements include its share of the joint venture’s profit or loss and other comprehensive income (“OCI”) included in investment in joint ventures, until the date that joint control ceases.
Determining the type of joint arrangement as either joint operation or joint venture is based on management’s assumptions of whether it has joint control over another entity. The considerations include, but are not limited to, determining if the arrangement is structured through a separate vehicle and whether the legal form and contractual arrangements give the entity direct rights to the assets and obligations for the liabilities within the normal course of business. Other facts and circumstances are also assessed by management, including the entity’s rights to the economic benefits of assets and its involvement and responsibility for settling liabilities associated with the arrangement.
| f) | Investments in Associates |
An associate is an entity for which the Company has significant influence and thereby has the power to participate in the financial and operational decisions but does not control or jointly control the investee. Investments in associates are accounted for using the equity method of accounting and are recognized at cost and adjusted thereafter for the post-acquisition change in the Company’s share of the investee’s net assets. The Company’s consolidated financial statements include its share of the investee’s profit or loss and OCI until the date that significant influence ceases.
Business combinations are accounted for using the acquisition method. Determining whether an acquisition meets the definition of a business combination or represents an asset purchase requires judgment on a case-by-case basis. If the acquisition meets the definition of a business combination, the assets and liabilities are recognized based on the contractual terms, economic conditions, the Company’s operating and accounting policies and other factors that exist on the acquisition date, which is the date on which control is transferred to the Company. The identifiable assets and liabilities are measured at their fair values on the acquisition date with limited exceptions. Any additional consideration payable, contingent upon the occurrence of a future event, is recognized at fair value on the acquisition date; subsequent changes in the fair value of the liability are recognized in net earnings. Acquisition costs incurred are expensed and included in other - net in the consolidated statements of income.
Consolidated Financial Statements 16
Goodwill is the excess of the purchase price paid over the recognized amount of net assets acquired, which is inherently imprecise as judgment is required in the determination of the fair value of assets and liabilities. Goodwill, which is not amortized, is assigned to appropriate CGUs or groups of CGUs. Goodwill is tested for impairment annually and when circumstances indicate that the carrying value may be impaired. Impairment losses are recognized in net earnings and are not subject to reversal. On the disposal or termination of a previously acquired business, any remaining balance of associated goodwill is included in the determination of the gain or loss on disposal.
| i) | Impairment of Non-Financial Assets |
The carrying amounts of the Company’s non-financial assets, other than inventories and deferred tax assets, are reviewed at the end of each reporting period to determine whether there is any indication of impairment. If such indication exists, the recoverable amount is estimated.
Determining whether there are any indications of impairment requires significant judgment of external factors, such as an extended decrease in prices or margins for oil and gas commodities or products, a significant decline in an asset’s market value, a significant downward revision of estimated volumes, an upward revision of future development costs, a decline in the entity’s market capitalization or significant changes in the technological, market, economic or legal environment that would have an adverse impact on the entity. If any indication of impairment exists, an estimate of the asset’s recoverable amount is calculated as the higher of the fair value less costs to sell (“FVLCS”) and the asset’s value in use (“VIU”) for an individual asset or CGU. If the asset does not generate cash inflows that are largely independent of those from other assets or groups of assets, the asset is tested as part of a CGU, which is the smallest identifiable group of assets, liabilities and associated goodwill that generates cash inflows that are largely independent of the cash inflows from other assets or groups of assets. Determination of the Company’s CGUs is subject to management’s judgment.
FVLCS is the amount that would be obtained from the sale of a CGU in an arm’s length transaction between knowledgeable and willing parties. The FVLCS is generally determined as the net present value of the estimated future cash flows expected to arise from the continued use of the CGU, including any expansion prospects, and its eventual disposal, using assumptions that an independent market participant may take into account. These cash flows are discounted using a rate that would be applied by a market participant to arrive at a net present value of the CGU.
VIU is the net present value of the estimated future cash flows expected to arise from the continued use of the asset in its present form and its eventual disposal. VIU is determined by applying assumptions specific to the Company’s continued use and can only take into account sanctioned future development costs. Estimates of future cash flows used in the evaluation of impairment of assets are made using management’s forecasts of commodity prices, marketing supply and demand, product margins and, in the case of oil and gas properties, expected production volumes. Expected production volumes take into account assessments of field reservoir performance and include expectations about proved and probable volumes, which are risk-weighted utilizing geological, production, recovery, market price and economic projections. Either the cash flow estimates or the discount rate is risk-adjusted to reflect local conditions as appropriate.
Given that the calculations for recoverable amounts require the use of estimates and assumptions, including forecasts of commodity prices, marketing supply and demand, product margins and in the case of oil and gas properties, expected production volumes, it is possible that the assumptions may change, which may impact the estimated life of the CGU and may require a material adjustment to the carrying value of goodwill and non-financial assets.
An impairment loss is recognized if the carrying amount of an asset or its CGU exceeds its estimated recoverable amount. Impairment losses recognized with respect to CGUs are allocated first to reduce the carrying amount of any goodwill allocated to the units and then to reduce the carrying amounts of the other assets in the CGU or group of CGUs on a pro rata basis. Impairment losses are recognized in depletion, depreciation, amortization and impairment in the consolidated statements of income.
Impairment losses recognized for other assets in prior years are assessed at the end of each reporting period for any indications that the impairment condition has decreased or no longer exists. An impairment loss is reversed only to the extent that the carrying amount of the asset or CGU does not exceed the carrying amount that would have been determined, net of depletion, depreciation and amortization, if no impairment loss had been recognized.
Consolidated Financial Statements 17
| j) | Asset Retirement Obligations (“ARO”) |
A liability is recognized for future legal or constructive retirement obligations associated with the Company’s assets. The Company has significant obligations to remove tangible assets and restore land after operations cease and the Company retires or relinquishes the asset. The retirement of Upstream and Downstream assets consists primarily of plugging and abandoning wells, removing and disposing of surface and subsea plant and equipment and facilities and restoring land to a state required by regulation or contract. The amount recognized is the net present value of the estimated future expenditures determined in accordance with local conditions, current technology and current regulatory requirements. The obligation is calculated using the current estimated costs to retire the asset inflated to the estimated retirement date and then discounted using a credit-adjusted risk-free discount rate. The liability is recorded in the period in which an obligation arises with a corresponding increase to the carrying value of the related asset. The liability is progressively accreted over time as the effect of discounting unwinds, creating an expense recognized in finance expenses. The costs capitalized to the related assets are amortized in a manner consistent with the depletion, depreciation and amortization of the underlying assets. Actual retirement expenditures are charged against the accumulated liability as incurred.
Liabilities for ARO are adjusted every reporting period for changes in estimates. These adjustments are accounted for as a change in the corresponding capitalized cost, except where a reduction in the provision is greater than the undepreciated capitalized cost of the related assets, in which case the capitalized cost is reduced to nil and the remaining adjustment is recognized in net earnings. In the case of closed sites, changes to estimated costs are recognized immediately in net earnings. Changes to the amount of capitalized costs will result in an adjustment to future depletion, depreciation and amortization, and to finance expenses.
Estimating the ARO requires significant judgment as restoration technologies and costs are constantly changing, as are regulatory, political, environmental and safety considerations. Inherent in the calculation of the ARO are numerous assumptions including the ultimate settlement amounts, future third-party pricing, inflation factors, risk-free discount rates, credit risk, timing of settlement and changes in the legal, regulatory, environmental and political environments. Future revisions to these assumptions may result in material changes to the ARO liability. Adjustments to the estimated amounts and timing of future ARO cash flows are a regular occurrence in light of the significant judgments and estimates involved.
| k) | Legal and Other Contingent Matters |
Provisions and liabilities for legal and other contingent matters are recognized in the period when the circumstance becomes probable that a future cash outflow resulting from past operations or events will occur and the amount of the cash outflow can be reasonably estimated. The timing of recognition and measurement of the provision requires the application of judgment to existing facts and circumstances, which can be subject to change, and the carrying amounts of provisions and liabilities are reviewed regularly and adjusted accordingly. The Company is required to both determine whether a loss is probable based on judgment and interpretation of laws and regulations, and determine that the loss can be reasonably estimated. When a loss is recognized, it is charged to net earnings. The Company continually monitors known and potential contingent matters and makes appropriate provisions when warranted by the circumstances present.
Preferred shares are classified as equity since they are cancellable and redeemable only at the Company’s option and dividends are discretionary and payable only if declared by the Board of Directors. Incremental costs directly attributable to the issuance of shares and stock options are recognized as a deduction from equity, net of tax. Common share dividends are paid out in common shares, or in cash, and preferred share dividends are paid in cash. Both common and preferred share dividends are recognized as distributions within equity.
Financial instruments are any contracts that give rise to a financial asset of one entity and a financial liability or equity instrument of another entity. Financial instruments are initially recognized at fair value, and subsequently measured based on classification in one of the following categories: loans and receivables, held to maturity investments, other financial liabilities, fair value through profit or loss (“FVTPL”) or available-for-sale (“AFS”) financial assets.
Financial instruments classified as FVTPL or AFS are measured at fair value at each reporting date; any transaction costs associated with these types of instruments are expensed as incurred. Unrealized gains and losses on AFS financial assets are recognized in OCI (see policy note o) and transferred to net earnings when the asset is derecognized. Unrealized gains and losses on FVTPL financial instruments related to trading activities are recognized in marketing and other in the consolidated statements of income, and unrealized gains and losses on all other FVTPL financial instruments are recognized in other - net.
Consolidated Financial Statements 18
Financial instruments classified as loans or receivables, held to maturity investments and other financial liabilities are initially measured at fair value and subsequently carried at amortized cost using the effective interest rate method. Transaction costs that are directly attributable to the acquisition or issue of a financial instrument measured at amortized cost are added to the fair value initially recognized.
Financial instruments subsequently revalued at fair value are further categorized using a three-level hierarchy that reflects the significance of the inputs used in determining fair value. Level 1 fair value is determined by reference to quoted prices in active markets for identical assets and liabilities. Level 2 fair value is based on inputs that are independently observable for similar assets or liabilities. Level 3 fair value is not based on independently observable market data. The disclosure of the fair value hierarchy excludes financial assets and liabilities where book value approximates fair value.
| n) | Derivative Instruments and Hedging Activities |
Derivatives are financial instruments for which the fair value changes in response to market risks, require little or no initial investment and are settled at a future date. Derivative instruments are utilized by the Company to manage various market risks including volatility in commodity prices, foreign exchange rates and interest rate exposures. The Company’s policy is not to utilize derivative instruments for speculative purposes. The Company may enter into swap and other derivative transactions to hedge or mitigate the Company’s commercial risk, including derivatives that reduce risks that arise in the ordinary course of the Company’s business. The Company may choose to apply hedge accounting to derivative instruments.
The fair values of derivatives are determined using valuation models that require assumptions concerning the amount and timing of future cash flows and discount rates. These estimates are also subject to change with fluctuations in commodity prices, interest rates, foreign currency exchange rates and estimates of non-performance. The actual settlement of a derivative instrument could differ materially from the fair value recorded and could impact future results.
All derivative instruments, other than those designated as effective hedging instruments, are classified as held for trading and are recorded at fair value. Gains and losses on these instruments are recorded in the consolidated statements of income in the period they occur.
The Company may enter into commodity price contracts in order to offset fixed or floating prices with market rates to manage exposures to fluctuations in commodity prices. The estimation of the fair value of commodity derivatives incorporates forward prices and adjustments for quality or location. The related inventory is measured at fair value based on exit prices. Gains and losses from these derivative contracts, which are not designated as effective hedging instruments, are recognized in revenues or purchases of crude oil and products and are initially recorded at settlement date. Derivative instruments that have been designated as effective hedging instruments are further classified as either fair value or cash flow hedges (see “Hedging Activities”).
Derivatives embedded in a host contract are recorded separately when the economic characteristics and risks of the embedded derivative are not clearly and closely related to those of the host contract and the host contract is not measured at FVTPL. The definition of an embedded derivative is the same as other freestanding derivatives. Embedded derivatives are measured at fair value with gains and losses recognized in net earnings.
At the inception of a derivative transaction, if the Company elects to use hedge accounting, formal designation and documentation is required. The documentation must include: identification of the hedged item or transaction, the hedging instrument, the nature of the risk being hedged, the Company’s risk management objective and strategy for undertaking the hedge and how the Company will assess the hedging instrument’s effectiveness in offsetting the exposure to changes in the hedged item.
A hedge is assessed at inception and at the end of each reporting period to ensure that it is highly effective in offsetting changes in fair values or cash flows of the hedged item. For a fair value hedge, the gain or loss from remeasuring the hedging instrument at fair value is recognized immediately in net earnings with the offsetting gain or loss on the hedged item. When fair value hedge accounting is discontinued, the carrying amount of the hedging instrument is deferred and amortized to net earnings over the remaining maturity of the hedged item.
For a cash flow hedge, the effective portion of the gain or loss is recorded in OCI. Any hedge or portion of a hedge that is ineffective is immediately recognized in net earnings. Hedge accounting is discontinued on a prospective basis when the hedging relationship no longer qualifies for hedge accounting. Any gain or loss on the hedging instrument resulting from the discontinuation of a cash flow hedge is deferred in OCI until the forecasted transaction date. If the forecasted transaction date is no longer expected to occur, the gain or loss is recognized in net earnings in the period of discontinuation.
Consolidated Financial Statements 19
A net investment hedge of a foreign operation is accounted for similarly to a cash flow hedge. The Company may designate certain U.S. dollar denominated debt as a hedge of its net investment in foreign operations for which the U.S. dollar is the functional currency. The unrealized foreign exchange gains and losses arising from the translation of the debt are recorded in OCI, net of tax, and are limited to the translation gain or loss on the net investment.
Comprehensive income consists of net earnings and OCI. OCI is comprised of the change in the fair value of the effective portion of the derivatives used as hedging items in a cash flow hedge or net investment hedge, the unrealized gains and losses on AFS financial assets, the exchange gains and losses arising from the translation of foreign operations with a functional currency that is not Canadian dollars and the actuarial gains and losses on defined benefit pension plans. Amounts included in OCI are shown net of tax. Other reserves is an equity category comprised of the cumulative amounts of OCI, relating to foreign currency translation and hedging.
| p) | Impairment of Financial Assets |
A financial asset is assessed at the end of each reporting period to determine whether it is impaired, based on objective evidence indicating that one or more events have had a negative effect on the estimated future cash flows of that asset. Objective evidence used by the Company to assess impairment of financial assets includes quoted market prices for similar financial assets and historical collection rates for loans and receivables.
An impairment loss with respect to a financial asset measured at amortized cost is calculated as the difference between its carrying amount and the net present value of the estimated future cash flows discounted at the original effective interest rate. A revaluation with respect to an AFS financial asset is calculated by reference to its fair value and any amounts in OCI are transferred to net earnings.
Significant financial assets are tested for impairment on an individual basis. The remaining financial assets are assessed collectively in groups that share similar credit risk characteristics.
All impairment losses are recognized in net earnings. An impairment loss is reversed if the reversal can be related objectively to an event occurring after the impairment loss was recognized.
Given that the calculations for the net present value of estimated future cash flows related to derivative financial assets require the use of estimates and assumptions, including forecasts of commodity prices, marketing supply and demand, product margins and expected production volumes, it is possible that the assumptions may change, which may require a material adjustment to the carrying value of financial assets.
| q) | Pensions and Other Post-employment Benefits |
In Canada, the Company provides a defined contribution pension plan and other post-retirement benefits to qualified employees. The Company also maintains a defined benefit pension plan for a small number of employees who did not choose to join the defined contribution pension plan in 1991. In the United States, the Company provides two defined contribution pension plans (401(k)) and one other post-retirement benefits plan.
The cost of the pension benefits earned by employees in the defined contribution pension plans is expensed as incurred. The cost of the benefits earned by employees in the defined benefit pension plans is determined using the projected unit credit funding method. Actuarial gains and losses are recognized in retained earnings as incurred.
The defined benefit asset or liability is comprised of the fair value of plan assets from which the obligations are to be settled and the present value of the defined benefit obligation. Plan assets are measured at fair value based on the closing bid price when there is a quoted price in an active market. Plan assets are assets that are held by a long-term employee benefit fund or qualifying insurance policies. Plan assets are not available to the Company’s creditors. The value of any defined benefit asset is restricted to the sum of any past service costs and the present value of refunds from and reductions in future contributions to the plan. Defined benefit obligations are estimated by discounting expected future payments using the year-end market rate of interest for high-quality corporate debt instruments with cash flows that match the timing and amount of expected benefit payments.
Post-retirement medical benefits are also provided to qualifying retirees. In some cases the benefits are provided through medical care plans to which the Company, the employees, the retirees and covered family members contribute. In some plans there is no funding of the benefits before retirement. These plans are recognized on the same basis as described above for the defined benefit pension plan.
Consolidated Financial Statements 20
The determination of the cost of the defined benefit pension plan and the other post-retirement benefit plans reflects a number of assumptions that affect the expected future benefit payments. The valuation of these plans is prepared by an independent actuary engaged by the Company. These assumptions include, but are not limited to, the estimate of expected plan investment performance, salary escalation, retirement age, attrition, future health care costs and mortality. The fair value of the plan assets is used for the purposes of calculating the expected return on plan assets.
Mortality rates are based on the latest available standard mortality tables for the individual countries concerned. The assumptions for each country are reviewed each year and are adjusted where necessary to reflect changes in fund experience and actuarial recommendations. The rate of return on pension plan assets is based on a projection of real long-term bond yields and an equity risk premium, which are combined with local inflation assumptions and applied to the actual asset mix of each plan. The amount of the expected return on plan assets is calculated using the expected rate of return for the year and the fair value of assets at the beginning of the year. Future salary increases are based on expected future inflation rates for the individual countries.
Current income taxes are recognized in net earnings, except when they relate to equity, which includes OCI, and are recognized directly in equity. Management periodically evaluates positions taken in the Company’s tax returns with respect to situations in which applicable tax regulations are subject to interpretation and reassessment and establishes provisions where appropriate.
Deferred tax is measured using the liability method on temporary differences at the reporting date between the tax bases of assets and liabilities and their carrying amounts for financial reporting purposes.
Deferred tax assets and liabilities are recognized at expected tax rates in effect in the year when the asset is expected to be realized or the liability settled, based on tax rates and tax laws that have been enacted or substantively enacted at the reporting date. Deferred income tax balances are adjusted to reflect changes in income tax rates that are substantively enacted with the adjustment being recognized in net earnings in the period that the change occurs unless it relates to items recognized directly to equity, including OCI, in which case the deferred income tax is also recorded in equity. Deferred tax assets and deferred tax liabilities are offset if a legally enforceable right exists to set off current tax assets against current income tax liabilities and the deferred taxes relate to the same taxable entity and the same taxation authority.
The determination of the Company’s income and other tax liabilities requires interpretation of complex laws and regulations often involving multiple jurisdictions. Estimates that require significant judgments are also made with respect to the timing of temporary difference reversals, the realizability of tax assets and in circumstances where the transaction and calculations for which the ultimate tax determination are uncertain. All tax filings are subject to audit and potential reassessment after the lapse of considerable time. Accordingly, the actual income tax liability may differ significantly from that estimated and recorded by management.
| s) | Asset Exchange Transactions |
Asset exchange transactions are measured at cost if the transaction lacks commercial substance or the fair value of neither the asset received nor the asset given up is reliably measurable. Otherwise, asset exchange transactions are measured at the fair value of the asset given up, unless the fair value of the asset received is more clearly evident. If the acquired item is not measured at fair value, its cost is measured at the carrying amount of the asset given up. Gains and losses are recorded in other - net in the consolidated statements of income in the period they occur.
Revenue from the sale of goods is recognized when the significant risks and rewards of ownership have passed to the buyer and it can be reliably measured. Revenues associated with the sale of crude oil, natural gas, natural gas liquids, synthetic crude oil, purchased commodities and refined petroleum products are recognized when the title passes to the customer. Revenues associated with the sale of transportation, processing and natural gas storage services are recognized when the services are provided.
Revenue is measured at the fair value of the consideration received or receivable and represents amounts receivable for goods or services provided in the normal course of business, net of discounts, customs duties and sales taxes. Crude oil and natural gas sold below or above the Company’s working interest share of production results in production underlifts or overlifts. Underlifts are recorded as a receivable at cost with a corresponding decrease to production and operating expense, while overlifts are recorded as a payable at fair value with a corresponding increase to production and operating expense.
Consolidated Financial Statements 21
Physical exchanges of inventory are reported on a net basis for swaps of similar items, as are sales and purchases made with a common counterparty as part of an arrangement similar to a physical exchange.
Finance income is recognized as the interest accrues using the effective interest rate, which is the rate that exactly discounts estimated future cash receipts through the expected life of the financial instrument to the net carrying amount of the financial asset.
Functional currency is the currency of the primary economic environment in which the Company and its subsidiaries operate and is normally the currency in which the entity primarily generates and expends cash. The financial statements of Husky’s subsidiaries are translated into Canadian dollars, which is the presentation and functional currency of the Company. The assets and liabilities of subsidiaries whose functional currencies are other than Canadian dollars are translated into Canadian dollars at the foreign exchange rate at the balance sheet date, while revenues and expenses of such subsidiaries are translated using average monthly foreign exchange rates, which approximate the foreign exchange rates on the dates of the transactions. Foreign exchange differences arising on translation are included in OCI.
The Company’s transactions in foreign currencies are translated to the appropriate functional currency at the foreign exchange rate on the dates of the transactions. Monetary assets and liabilities denominated in foreign currencies are translated to the functional currency at the foreign exchange rate at the balance sheet date and differences arising on translation are recognized in net earnings. Non-monetary assets that are measured in terms of historical cost in a foreign currency are translated using the exchange rate at the dates of the transactions.
In accordance with the Company’s stock option plan, stock options to acquire common shares may be granted to officers and certain other employees. The Company records compensation expense over the vesting period based on the fair value of options granted. Compensation expense is recorded in net earnings as part of selling, general and administrative expenses.
The Company’s stock option plan is a tandem plan that provides the stock option holder with the right to exercise the stock option or surrender the option for a cash payment. A liability for the stock options is accrued over their vesting period and measured at fair value using the Black-Scholes option pricing model. The liability is revalued each reporting period until it is settled to reflect changes in the fair value of the options. The net change is recognized in net earnings. When stock options are surrendered for cash, the cash settlement paid reduces the outstanding liability. When stock options are exercised for common shares, consideration paid by the stock option holders and the previously recognized liability associated with the stock options are recorded as share capital.
The Company’s Performance Share Unit Plan provides a time-vested award to certain officers and employees of the Company. Performance Share Units (“PSU”) entitle participants to receive cash based on the Company’s share price at the time of vesting. The amount of cash payment is contingent on the Company’s total shareholder return relative to a peer group of companies and achieving certain corporate performance targets. A liability for expected cash payments is accrued over the vesting period of the PSUs and is revalued at each reporting date based on the market price of the Company’s common shares and the expected vesting percentage. Upon vesting, a cash payment is made to the participants and the outstanding liability is reduced by the payment amount.
The number of basic common shares outstanding is the weighted average number of common shares outstanding for each period. Shares issued during the period are included in the weighted average number of shares from the date consideration is receivable. The calculation of basic earnings per common share is based on net earnings attributable to common shareholders divided by the weighted average number of common shares outstanding.
The number of diluted common shares outstanding is calculated using the treasury stock method, which assumes that any proceeds received from in-the-money stock options would be used to buy back common shares at the average market price for the period. The calculation of diluted earnings per share is based on net earnings attributable to common shareholders divided by the weighted average number of common shares outstanding adjusted for the effects of all dilutive potential common shares, which are comprised of stock options granted to employees. Stock options granted to employees provide the holder with the ability to settle in cash or equity. For the purposes of the diluted earnings per share calculation, the Company must adjust the numerator for the more dilutive effect of cash-settlement versus equity-settlement despite how the stock options are accounted for in net earnings. As a result, net earnings reported based on accounting of cash-settled stock options may be adjusted for the results of equity-settlements for the purposes of determining the numerator for the diluted earnings per share calculation.
Consolidated Financial Statements 22
Government grants are recognized when there is reasonable assurance that the grant will be received and all attached conditions will be complied with. If a grant is received but reasonable assurance and compliance with conditions is not achieved, the grant is recognized as a deferred liability until such conditions are fulfilled. When the grant relates to an expense item, it is recognized as income in the period in which the costs are incurred. Where the grant relates to an asset, it is recognized as a reduction to the net book value of the related asset and recognized in net earnings in equal amounts over the expected useful life of the related asset through lower depletion, depreciation and amortization.
| y) | Recent Accounting Standards |
In July 2014, the IASB issued IFRS 9, “Financial Instruments” to replace IAS 39 which provides a logical model for classification and measurement, a single, forward-looking ‘expected loss’ impairment model and a substantially-reformed approach to hedge accounting. The standard is effective for the Company for annual periods beginning on January 1, 2018, with required retrospective application and early adoption permitted. The Company intends to retrospectively adopt the standard on January 1, 2018. The adoption of the standard is not expected to have a material impact on the Company’s annual consolidated financial statements.
| ii) | Revenue from Contracts with Customers |
In May 2014, the IASB issued IFRS 15, “Revenue from Contracts with Customers” to replace IAS 18 which establishes principles for reporting useful information to users of financial statements about the nature, amount, timing and uncertainty of revenue and cash flows arising from an entity’s contracts with customers. The standard is effective for the Company for annual periods beginning on January 1, 2017, with required retrospective application and early adoption permitted. The Company intends to retrospectively adopt the standard on January 1, 2017. The company is assessing the impact of this standard and does not expect it to have a material impact on the Company’s annual consolidated financial statements.
| z) | Change in Accounting Policy |
The IASB issued amendments to IAS 36, “Impairment of Assets” which was adopted by the Company on January 1, 2014. The amendments require disclosure of information about the recoverable amount of impaired assets. The adoption of this amended standard had no impact on the Company’s consolidated financial statements.
The IASB issued International Financial Reporting Interpretations Committee Interpretation (“IFRIC”) 21, “Levies” which was adopted by the Company on January 1, 2014. The IFRIC clarifies that an entity should recognize a liability for a levy when the activity that triggers payment occurs. The adoption of this interpretation had no impact on the Company’s consolidated financial statements.
| Note 4 | Accounts Receivable |
| | | | | | | | |
| Accounts Receivable | | | | | | |
($ millions) | | December 31, 2014 | | | December 31, 2013 | |
Trade receivables | | | 1,282 | | | | 1,383 | |
Allowance for doubtful accounts | | | (29 | ) | | | (27 | ) |
Derivatives due within one year | | | 53 | | | | 22 | |
Other | | | 18 | | | | 80 | |
| | | | | | | | |
| | | 1,324 | | | | 1,458 | |
| | | | | | | | |
Consolidated Financial Statements 23
| | | | | | | | |
| Inventories | | | | | | |
($ millions) | | December 31, 2014 | | | December 31, 2013 | |
Crude oil, natural gas and sulphur (1) | | | 419 | | | | 634 | |
Refined petroleum products(1) | | | 522 | | | | 608 | |
Trading inventories measured at fair value | | | 286 | | | | 421 | |
Materials, supplies and other | | | 158 | | | | 149 | |
| | | | | | | | |
| | | 1,385 | | | | 1,812 | |
| | | | | | | | |
| (1) | Prior year amounts have been reclassified to conform with current year presentation |
Impairment of inventory to net realizable value for the year ended December 31, 2014 was $211 million (December 31, 2013 – $1 million), as a result of declining market benchmark prices. During 2014, there were no inventory impairment reversals (2013 – nil).
Trading inventories measured at fair value less costs to sell consist of natural gas inventories and crude oil inventories. The fair value measurement incorporates exit commodity prices and adjustments for quality and location. Refer to Note 22.
| Note 6 | Exploration and Evaluation Costs |
| | | | | | | | |
| Exploration and Evaluation Assets | | | | | | |
($ millions) | | 2014 | | | 2013 | |
Beginning of year | | | 1,144 | | | | 773 | |
Additions | | | 341 | | | | 574 | |
Acquisitions | | | — | | | | 1 | |
Transfers to oil and gas properties(note 7) | | | (352 | ) | | | (209 | ) |
Expensed exploration expenditures previously capitalized | | | (6 | ) | | | (10 | ) |
Exchange adjustments | | | 22 | | | | 15 | |
| | | | | | | | |
End of year | | | 1,149 | | | | 1,144 | |
| | | | | | | | |
The following exploration and evaluation expenses for the years ended December 31, 2014 and 2013 relate to activities associated with the exploration for and evaluation of oil and natural gas resources and were recorded in the Upstream segment:
| | | | | | | | |
| Exploration and Evaluation Expense Summary | | | | | | |
($ millions) | | 2014 | | | 2013 | |
Seismic, geological and geophysical | | | 111 | | | | 133 | |
Expensed drilling | | | 45 | | | | 104 | |
Expensed land | | | 58 | | | | 9 | |
| | | | | | | | |
| | | 214 | | | | 246 | |
| | | | | | | | |
Consolidated Financial Statements 24
| Note 7 | Property, Plant and Equipment |
| | | | | | | | | | | | | | | | | | | | | | | | |
Property, Plant and Equipment ($ millions) | | Oil and Gas
Properties | | | Processing,
Transportation
and Storage | | | Upgrading | | | Refining | | | Retail and
Other | | | Total | |
Cost | | | | | | | | | | | | | | | | | | | | | | | | |
December 31, 2012 | | | 38,781 | | | | 981 | | | | 2,006 | | | | 5,094 | | | | 2,225 | | | | 49,087 | |
Additions | | | 3,890 | | | | 93 | | | | 206 | | | | 282 | | | | 179 | | | | 4,650 | |
Acquisitions | | | 38 | | | | — | | | | — | | | | — | | | | — | | | | 38 | |
Transfers from exploration and evaluation (note 6) | | | 209 | | | | — | | | | — | | | | — | | | | — | | | | 209 | |
Transfers between categories | | | — | | | | — | | | | — | | | | (27 | ) | | | 27 | | | | — | |
Changes in asset retirement obligations | | | 68 | | | | 17 | | | | 9 | | | | 12 | | | | 35 | | | | 141 | |
Disposals and derecognition | | | (66 | ) | | | (11 | ) | | | — | | | | (1 | ) | | | (16 | ) | | | (94 | ) |
Exchange adjustments | | | 161 | | | | — | | | | — | | | | 316 | | | | — | | | | 477 | |
| | | | | | | | | | | | | | | | | | | | | | | | |
December 31, 2013 | | | 43,081 | | | | 1,080 | | | | 2,221 | | | | 5,676 | | | | 2,450 | | | | 54,508 | |
Additions | | | 4,274 | | | | 216 | | | | 50 | | | | 413 | | | | 163 | | | | 5,116 | |
Acquisitions | | | 123 | | | | — | | | | — | | | | — | | | | — | | | | 123 | |
Transfers from exploration and evaluation (note 6) | | | 352 | | | | — | | | | — | | | | — | | | | — | | | | 352 | |
Transfers between categories | | | (3 | ) | | | 2 | | | | — | | | | 1 | | | | — | | | | — | |
Changes in asset retirement obligations | | | 128 | | | | (2 | ) | | | 3 | | | | 15 | | | | 23 | | | | 167 | |
Disposals and derecognition | | | (281 | ) | | | — | | | | — | | | | (13 | ) | | | (4 | ) | | | (298 | ) |
Exchange adjustments | | | 300 | | | | — | | | | — | | | | 469 | | | | — | | | | 769 | |
| | | | | | | | | | | | | | | | | | | | | | | | |
December 31, 2014 | | | 47,974 | | | | 1,296 | | | | 2,274 | | | | 6,561 | | | | 2,632 | | | | 60,737 | |
| | | | | | | | | | | | | | | | | | | | | | | | |
| | | | | | |
Accumulated depletion, depreciation, amortization and impairment | | | | | | | | | | | | | | | | | | | | | | | | |
December 31, 2012 | | | (17,947 | ) | | | (443 | ) | | | (950 | ) | | | (1,260 | ) | | | (1,133 | ) | | | (21,733 | ) |
Depletion, depreciation, amortization and impairment(1) | | | (2,501 | ) | | | (36 | ) | | | (96 | ) | | | (255 | ) | | | (119 | ) | | | (3,007 | ) |
Transfers between categories | | | — | | | | — | | | | — | | | | 12 | | | | (12 | ) | | | — | |
Disposals and derecognition | | | 55 | | | | — | | | | — | | | | 1 | | | | 13 | | | | 69 | |
Exchange adjustments | | | (15 | ) | | | — | | | | — | | | | (72 | ) | | | — | | | | (87 | ) |
| | | | | | | | | | | | | | | | | | | | | | | | |
December 31, 2013 | | | (20,408 | ) | | | (479 | ) | | | (1,046 | ) | | | (1,574 | ) | | | (1,251 | ) | | | (24,758 | ) |
Depletion, depreciation, amortization and impairment(1) | | | (3,400 | ) | | | (47 | ) | | | (108 | ) | | | (288 | ) | | | (145 | ) | | | (3,988 | ) |
Transfers between categories | | | 2 | | | | (1 | ) | | | — | | | | (1 | ) | | | — | | | | — | |
Disposals and derecognition | | | 176 | | | | — | | | | — | | | | 10 | | | | 2 | | | | 188 | |
Exchange adjustments | | | (57 | ) | | | — | | | | — | | | | (135 | ) | | | — | | | | (192 | ) |
| | | | | | | | | | | | | | | | | | | | | | | | |
December 31, 2014 | | | (23,687 | ) | | | (527 | ) | | | (1,154 | ) | | | (1,988 | ) | | | (1,394 | ) | | | (28,750 | ) |
| | | | | | | | | | | | | | | | | | | | | | | | |
| | | | | | |
Net book value | | | | | | | | | | | | | | | | | | | | | | | | |
December 31, 2013 | | | 22,673 | | | | 601 | | | | 1,175 | | | | 4,102 | | | | 1,199 | | | | 29,750 | |
December 31, 2014 | | | 24,287 | | | | 769 | | | | 1,120 | | | | 4,573 | | | | 1,238 | | | | 31,987 | |
| | | | | | | | | | | | | | | | | | | | | | | | |
| (1) | Depletion, depreciation, amortization and impairment for the year ended December 31, 2014 does not include an amortization recovery of research and development assets of nil (2013 – recovery of $1 million), and an exchange adjustment of $22 million (2013 – $1 million). |
Included in depletion, depreciation, amortization and impairment expense in the fourth quarter of 2014 is a non-cash impairment charge of $838 million (2013 - $275 million) on conventional oil and natural gas assets located in Western Canada in the Upstream segment. The impairment charge, attributed to the Rainbow Development and Northern cash generating units, was the result of declines in estimated short and long-term crude oil and natural gas prices. The recoverable amount was $1,630 million for the Rainbow Development and $131 million for Northern as at December 31, 2014 and was estimated based on value-in-use methodology using estimated discounted cash flows based on proved plus probable reserves and discounted using an average pre-tax discount rate of 8% (2013 - 8%).
Consolidated Financial Statements 25
Costs of property, plant and equipment, including major development projects, excluded from costs subject to depletion, depreciation and amortization as at December 31, 2014 were $5.7 billion (December 31, 2013 – $7.1 billion) including undeveloped land assets of $115 million as at December 31, 2014 (December 31, 2013 – $408 million).
The net book values of assets held under finance lease within property, plant and equipment are as follows:
| | | | | | | | | | | | |
Assets Under Finance Lease ($ millions) | | Refining | | | Oil and Gas
Properties | | | Total | |
December 31, 2013 | | | 29 | | | | — | | | | 29 | |
December 31, 2014 | | | 27 | | | | 256 | | | | 283 | |
| | | | | | | | | | | | |
Joint Operations
BP-Husky Refining LLC
The Company holds a 50% ownership interest in BP-Husky Refining LLC, which owns and operates the BP-Husky Toledo Refinery in Ohio. On March 31, 2008, the Company completed a transaction with BP whereby BP contributed the BP-Husky Toledo Refinery plus inventories and other related net assets and the Company contributed U.S. $250 million in cash and a contribution payable of U.S. $2.6 billion.
The Company’s proportionate share of the contribution payable included in the consolidated balance sheets is as follows:
| | | | | | | | |
Contribution Payable ($ millions) | | 2014 | | | 2013 | |
Beginning of year | | | 1,421 | | | | 1,336 | |
Accretion(note 14) | | | 85 | | | | 80 | |
Paid | | | (106 | ) | | | (87 | ) |
Foreign exchange | | | 128 | | | | 92 | |
| | | | | | | | |
End of year | | | 1,528 | | | | 1,421 | |
| | | | | | | | |
The contribution payable accretes at a rate of 6% and is payable between December 31, 2014 and December 31, 2015 with the final balance due by December 31, 2015. The timing of payments made during this period will be determined by the capital expenditures at the refinery during the same period. The entity is included as part of U.S. Refining and Marketing in the Downstream segment. Subsequent to year-end, the Company amended the repayment terms. See Note 26.
Summarized below is the Company’s proportionate share of operating results and financial position that have been included in the consolidated statements of income and the consolidated balance sheets in U.S. Refining and Marketing in the Downstream segment:
| | | | | | | | |
Results of Operations ($ millions) | | 2014 | | | 2013 | |
Revenues | | | 2,673 | | | | 2,856 | |
Expenses | | | (2,847 | ) | | | (2,762 | ) |
| | | | | | | | |
Proportionate share of net earnings | | | (174 | ) | | | 94 | |
| | | | | | | | |
| | | | | | | | |
Balance Sheets ($ millions) | | December 31, 2014 | | | December 31, 2013 | |
Current assets | | | 379 | | | | 442 | |
Non-current assets | | | 2,073 | | | | 1,938 | |
Current liabilities | | | (336 | ) | | | (264 | ) |
Non-current liabilities | | | (630 | ) | | | (664 | ) |
| | | | | | | | |
Proportionate share of net assets | | | 1,486 | | | | 1,452 | |
| | | | | | | | |
Consolidated Financial Statements 26
Sunrise Oil Sands Partnership
The Company holds a 50% interest in the Sunrise Oil Sands Partnership, which is engaged in developing an oil sands project in Northern Alberta. On March 31, 2008, the Company completed a transaction with BP whereby the Company contributed Sunrise oil sands assets with a fair value of U.S. $2.5 billion and BP contributed U.S. $250 million in cash and a contribution receivable of U.S. $2.25 billion. The contribution receivable accreted at a rate of 6% per annum up to the receipt of the final balance during the second quarter of 2014.
The Company’s proportionate share of the contribution receivable included in the consolidated balance sheets is as follows:
| | | | | | | | |
Contribution Receivable ($ millions) | | 2014 | | | 2013 | |
Beginning of year | | | 136 | | | | 607 | |
Accretion(note 14) | | | 1 | | | | 22 | |
Received | | | (143 | ) | | | (520 | ) |
Foreign exchange | | | 6 | | | | 27 | |
| | | | | | | | |
End of year | | | — | | | | 136 | |
| | | | | | | | |
Summarized below is the Company’s proportionate share of operating results and financial position in the Sunrise Oil Sands Partnership that have been included in the consolidated statements of income and the consolidated balance sheets in Exploration and Production in the Upstream segment:
| | | | | | | | |
Results of Operations ($ millions) | | 2014 | | | 2013 | |
Revenues | | | — | | | | — | |
Expenses | | | (24 | ) | | | (10 | ) |
Financial items | | | (16 | ) | | | 48 | |
| | | | | | | | |
Proportionate share of net earnings | | | (40 | ) | | | 38 | |
| | | | | | | | |
| | | | | | | | |
Balance Sheets ($ millions) | | December 31, 2014 | | | December 31, 2013 | |
Current assets | | | 2 | | | | 149 | |
Non-current assets | | | 3,124 | | | | 1,890 | |
Current liabilities | | | (74 | ) | | | (113 | ) |
Non-current liabilities | | | (258 | ) | | | (21 | ) |
| | | | | | | | |
Proportionate share of net assets | | | 2,794 | | | | 1,905 | |
| | | | | | | | |
Atlantic Region Joint Operations
The Company holds interests in the White Rose oil field, with a 72.5% interest in the core field and a 68.875% interest in the satellite fields. The Company also holds 35% interests in two exploration licenses and two significant discovery licenses in the Flemish Pass Basin related to the Bay Du Nord, Harpoon and Mizzen discoveries. Both areas are located off the coast of Newfoundland and Labrador and are a part of Husky’s offshore East Coast exploration and development program. The Company’s proportionate share of operating results and financial position in the White Rose oil field and Flemish Pass Basin have been included in the consolidated statements of income and the consolidated balance sheets in Exploration and Production in the Upstream segment.
Consolidated Financial Statements 27
Joint Venture
Husky-CNOOC Madura Ltd.
The Company currently holds 40% joint control in Husky-CNOOC Madura Ltd., which is engaged in exploring for oil and gas resources in Indonesia. Results of the joint venture are included in the consolidated statements of income in Exploration and Production in the Upstream segment.
Summarized below is the financial information for Husky-CNOOC Madura Ltd. accounted for using the equity method:
| | | | | | | | |
Results of Operations ($ millions, except share of equity investment) | | 2014 | | | 2013 | |
Revenues | | | — | | | | — | |
Expenses | | | (49 | ) | | | (24 | ) |
| | | | | | | | |
Share of equity investment (percent) | | | 40 | % | | | 40 | % |
| | | | | | | | |
Proportionate share of equity investment | | | (6 | ) | | | (10 | ) |
| | | | | | | | |
| | | | | | | | |
Balance Sheets ($ millions, except share of equity investment) | | December 31, 2014 | | | December 31, 2013 | |
Current assets(1) | | | 43 | | | | 28 | |
Non-current assets | | | 574 | | | | 439 | |
Current liabilities | | | (25 | ) | | | (50 | ) |
Non-current liabilities | | | (359 | ) | | | (188 | ) |
| | | | | | | | |
Net assets | | | 233 | | | | 229 | |
Share of net assets (percent) | | | 40 | % | | | 40 | % |
| | | | | | | | |
Carrying amount in statement of financial position | | | 237 | | | | 153 | |
| | | | | | | | |
| (1) | Current assets include cash and cash equivalents of $15 million (2013- $14 million). |
The Company’s share of equity investment and carrying amount of share of net assets does not equal the 40% joint control of the expenses and net assets of Husky-CNOOC Madura Ltd. due to differences in the accounting policies of the joint venture and the Company.
| Note 9 | Cash Flows – Change in Non-cash Working Capital |
| | | | | | | | |
Non-cash Working Capital ($ millions) | | 2014 | | | 2013 | |
Decrease (increase) in non-cash working capital | | | | | | | | |
Accounts receivable | | | 964 | | | | 200 | |
Inventories | | | 191 | | | | 30 | |
Prepaid expenses | | | (76 | ) | | | (22 | ) |
Accounts payable and accrued liabilities | | | (508 | ) | | | 116 | |
| | | | | | | | |
Change in non-cash working capital | | | 571 | | | | 324 | |
| | | | | | | | |
Relating to: | | | | | | | | |
Operating activities | | | 871 | | | | (21 | ) |
Financing activities | | | 33 | | | | (19 | ) |
Investing activities | | | (333 | ) | | | 364 | |
| | | | | | | | |
Cash and cash equivalents at December 31, 2014 included $188 million of cash (December 31, 2013 – $305 million) and $1,079 million of short-term investments with original maturities less than three months at the time of purchase (December 31, 2013 – $792 million).
Consolidated Financial Statements 28
| | | | | | | | |
Goodwill ($ millions) | | 2014 | | | 2013 | |
Beginning of year | | | 698 | | | | 663 | |
Exchange adjustments | | | 48 | | | | 35 | |
| | | | | | | | |
End of year | | | 746 | | | | 698 | |
| | | | | | | | |
As at December 31, 2014, goodwill related primarily to the Lima Refinery CGU included in the Downstream segment with the remaining balance allocated to various Upstream CGUs located in Western Canada. For impairment testing purposes, the recoverable amount of the Lima Refinery CGU was estimated using value-in-use methodology based on cash flows expected over a 40-year period and discounted using a pre-tax discount rate of 8% (2013 – 8%). The discount rate was determined in relation to the Company’s incremental borrowing rate adjusted for risks specific to the refinery. Cash flow projections for the initial five-year period are based on budgeted future cash flows and inflated by a 2% long-term growth rate for the remaining 35-year period. The inflation rate was based upon an average expected inflation rate for the U.S. of 2% (2013 – 2%). At December 31, 2014, the recoverable amount exceeded the carrying amount of the relevant CGUs. The value-in-use calculation for the Lima Refinery CGU is particularly sensitive to changes in discount rates, forecasted crack spreads and refining margins. The values assigned to key assumptions reflect past experience from both internal and external sources.
| Note 11 | Bank Operating Loans |
At December 31, 2014, the Company had unsecured short-term borrowing lines of credit with banks totalling $645 million (December 31, 2013 – $595 million) and letters of credit under these lines of credit totalling $188 million (December 31, 2013 – $224 million). As at December 31, 2014, bank operating loans were nil (December 31, 2013 – nil). Interest payable is based on Bankers’ Acceptance, U.S. LIBOR or prime rates. For 2014, the Company’s weighted average interest rate on unsecured short-term borrowing lines of credit was approximately 1.3% (2013 – 1.2%).
The Sunrise Oil Sands Partnership has an unsecured demand credit facility of $10 million available for general purposes. The Company’s proportionate share of the liability for any drawings under this credit facility is $5 million. As at December 31, 2014, there was no balance outstanding under this credit facility (December 31, 2013 – nil).
| Note 12 | Accounts Payable and Accrued Liabilities |
| | | | | | | | |
Accounts Payable and Accrued Liabilities ($ millions) | | December 31, 2014 | | | December 31, 2013 | |
Trade payables | | | 550 | | | | 82 | |
Accrued liabilities | | | 1,917 | | | | 2,466 | |
Dividend payable(note 18) | | | 295 | | | | 295 | |
Stock-based compensation | | | 53 | | | | 122 | |
Derivatives due within one year | | | 27 | | | | 21 | |
Contingent consideration(note 22) | | | 40 | | | | 29 | |
Other | | | 107 | | | | 140 | |
| | | | | | | | |
| | | 2,989 | | | | 3,155 | |
| | | | | | | | |
Consolidated Financial Statements 29
| Note 13 | Debt and Credit Facilities |
| | | | | | | | |
Short-term Debt ($ millions) | | December 31, 2014 | | | December 31, 2013 | |
Commercial paper(1) | | | 895 | | | | — | |
| | | | | | | | |
| (1) | On September 15, 2014, the Company launched a commercial paper program in Canada. The commercial paper is supported by the Company’s syndicated credit facilities and the Company is authorized to issue commercial paper up to a maximum of $1.0 billion having a term not to exceed 365 days. The weighted average interest rate as at December 31, 2014 was 1.24% per annum. |
| | | | | | | | | | | | | | | | | | | | |
| | | | | | Canadian $ Amount | | | U.S. $ Denominated | |
Long-term Debt ($ millions) | | Maturity | | | December 31, 2014 | | | December 31, 2013 | | | December 31, 2014 | | | December 31, 2013 | |
Long-term debt | | | | | | | | | | | | | | | | | | | | |
3.75% medium-term notes(6) | | | 2015 | | | | — | | | | 300 | | | | — | | | | — | |
7.55% debentures(1)(3) | | | 2016 | | | | 232 | | | | 213 | | | | 200 | | | | 200 | |
6.20% notes(1)(5) | | | 2017 | | | | 348 | | | | 319 | | | | 300 | | | | 300 | |
6.15% notes(1)(4) | | | 2019 | | | | 348 | | | | 319 | | | | 300 | | | | 300 | |
7.25% notes(1)(5) | | | 2019 | | | | 870 | | | | 798 | | | | 750 | | | | 750 | |
5.00% medium-term notes(6) | | | 2020 | | | | 400 | | | | 400 | | | | — | | | | — | |
3.95% senior unsecured notes(1)(5) | | | 2022 | | | | 580 | | | | 532 | | | | 500 | | | | 500 | |
4.00% senior unsecured notes(1)(5) | | | 2024 | | | | 870 | | | | — | | | | 750 | | | | — | |
6.80% notes(1)(5) | | | 2037 | | | | 449 | | | | 411 | | | | 387 | | | | 387 | |
Debt issue costs(2) | | | | | | | (26 | ) | | | (21 | ) | | | — | | | | — | |
Unwound interest rate swaps(note 22) | | | | | | | 26 | | | | 50 | | | | — | | | | — | |
| | | | | | | | | | | | | | | | | | | | |
Long-term debt | | | | | | | 4,097 | | | | 3,321 | | | | 3,187 | | | | 2,437 | |
| | | | | | | | | | | | | | | | | | | | |
Long-term debt due within one year | | | | | | | | | | | | | | | | | | | | |
5.90% notes(1)(5) | | | 2014 | | | | — | | | | 798 | | | | — | | | | 750 | |
3.75% medium-term notes(6) | | | 2015 | | | | 300 | | | | — | | | | — | | | | — | |
| | | | | | | | | | | | | | | | | | | | |
| (1) | A portion of the Company’s U.S. denominated debt is designated as a hedge of the Company’s net investment in its U.S. refining operations. Refer to Note 22. |
| (2) | Calculated using the effective interest rate method. |
| (3) | The 7.55% debentures represent unsecured securities under a trust indenture dated October 31, 1996. |
| (4) | The 6.15% notes represent unsecured securities under a trust indenture dated June 14, 2002. |
| (5) | The 5.90%, the 6.20%, the 7.25%, the 3.95% and the 6.80% notes represent unsecured securities under a trust indenture dated September 11, 2007. |
| (6) | The 3.75% and the 5.00% medium-term notes represent unsecured securities under a trust indenture dated December 21, 2009. |
Credit Facilities
On December 14, 2012, the Company amended and restated both of its revolving syndicated credit facilities to allow the Company to borrow up to $1.5 billion and $1.6 billion in either Canadian or U.S. currency from a group of banks on an unsecured basis. The maturity date for the $1.5 billion facility was extended to December 14, 2016 and in February 2013, the limit on the $1.50 billion facility was increased to $1.6 billion. On June 19, 2014 the maturity of the $1.6 billion facility was increased to $1.63 billion and extended to June 19, 2018. The Company also increased the limit on one of the operating facilities from $50 million to $100 million.
There continues to be no difference between the terms of these facilities, other than their maturity dates. Interest rates vary based on Canadian prime, Bankers’ Acceptance, U.S. LIBOR or U.S. base rate, depending on the borrowing option selected and credit ratings assigned by certain credit rating agencies to the Company’s rated senior unsecured debt.
At December 31, 2014, the Company had $895 million outstanding of commercial paper (December 31, 2013 – nil), which is supported by its revolving syndicated credit facilities.
Consolidated Financial Statements 30
Notes and Debentures
On December 31, 2012, the Company filed a short form base shelf prospectus (the “Canadian Shelf Prospectus”) with applicable securities regulators in each of the provinces of Canada, other than Quebec, that enables the Company to offer up to $3.0 billion of common shares, preferred shares, debt securities, subscription receipts, warrants and units in Canada up to and including January 30, 2015. As at December 31, 2014, the Company had not issued any notes or debentures under the Canadian Shelf Prospectus. See Note 18 regarding the issuance of preferred shares under this prospectus. Subsequent to December 31, 2014, on February 23, 2015, the Company filed a short form base shelf prospectus (the “2015 Canadian Shelf Prospectus”) with applicable securities regulators in each of the provinces of Canada that enables the Company to offer up to $3.0 billion of common shares, preferred shares, debt securities, subscription receipts, warrants and other units in Canada up to and including March 22, 2017.
On October 31, 2013 and November 1, 2013, Husky filed a universal short form base shelf prospectus (the “U.S. Shelf Prospectus”) with the Alberta Securities Commission and the U.S. Securities and Exchange Commission, respectively, that enables the Company to offer up to U.S. $3.0 billion of debt securities, common shares, preferred shares, subscription receipts, warrants and units of the Company in the United States up to and including November 30, 2015. During the 25-month period that the U.S. Shelf Prospectus is effective, securities may be offered in amounts, at prices and on terms set forth in a prospectus supplement.
On March 17, 2014, the Company issued U.S. $750 million of 4.00 percent notes due April 14, 2024 under the U.S. Shelf Prospectus, equivalent to $829 million in Canadian dollars. The notes are redeemable at the option of the Company at any time, subject to a make-whole premium if the notes are redeemed prior to the three-month period prior to maturity. Interest is payable semi-annually. The notes are unsecured and unsubordinated and rank equally with all of the Company’s other unsecured and unsubordinated indebtedness.
On June 15, 2014, the Company repaid the maturing 5.9 percent notes issued under a trust indenture dated September 11, 2007. The amount paid to noteholders was U.S. $772 million, including U.S. $22 million of interest, equivalent to $839 million in Canadian dollars, including interest of $25 million.
The ability of the Company to raise capital utilizing the Canadian Shelf Prospectus or U.S. Shelf Prospectus is dependent on market conditions at the time of sale.
The notes and debentures disclosed above are redeemable (unless otherwise stated) at the option of the Company, at any time, at a redemption price equal to the greater of the par value of the securities and the sum of the present values of the remaining scheduled payments discounted at a rate calculated using a comparable U.S. Treasury Bond rate (for U.S. dollar denominated securities) or Government of Canada Bond rate (for Canadian dollar denominated securities) plus an applicable spread. Interest on the notes and debentures disclosed above is payable semi-annually.
The Company’s notes, debentures, credit facilities and short-term lines of credit rank equally.
Consolidated Financial Statements 31
| | | | | | | | |
| Financial Items | | | |
($ millions) | | 2014 | | | 2013 | |
Foreign exchange | | | | | | | | |
Gains (losses) on translation of U.S. dollar denominated long-term debt | | | 7 | | | | (11 | ) |
Gains on contribution receivable | | | 6 | | | | 27 | |
Gains on non-cash working capital | | | 42 | | | | 33 | |
Other foreign exchange gains (losses)(1) | | | 26 | | | | (28 | ) |
| | | | | | | | |
Net foreign exchange gains | | | 81 | | | | 21 | |
| | | | | | | | |
Finance income | | | | | | | | |
Contribution receivable(note 8) | | | 1 | | | | 22 | |
Interest income | | | 7 | | | | 19 | |
Other | | | — | | | | 10 | |
| | | | | | | | |
Finance income | | | 8 | | | | 51 | |
| | | | | | | | |
Finance expenses | | | | | | | | |
Long-term debt | | | (267 | ) | | | (233 | ) |
Contribution payable(note 8) | | | (85 | ) | | | (80 | ) |
Other | | | (5 | ) | | | 3 | |
| | | | | | | | |
| | | (357 | ) | | | (310 | ) |
Interest capitalized(2) | | | 258 | | | | 266 | |
| | | | | | | | |
| | | (99 | ) | | | (44 | ) |
Accretion of asset retirement obligations (note 16) | | | (133 | ) | | | (118 | ) |
Accretion of other long-term liabilities(note 22) | | | (1 | ) | | | (7 | ) |
| | | | | | | | |
Finance expenses | | | (233 | ) | | | (169 | ) |
| | | | | | | | |
| | | (144 | ) | | | (97 | ) |
| | | | | | | | |
| (1) | Other foreign exchange gains and losses primarily include realized and unrealized foreign exchange gains and losses on purchases of property, plant and equipment, and working capital. |
| (2) | Interest capitalized on project costs in 2014 is calculated using the Company’s annualized effective interest rate of 6% |
| Note 15 | Other Long-term Liabilities |
| | | | | | | | |
| Other Long-term Liabilities | | | | | | |
($ millions) | | December 31, 2014 | | | December 31, 2013 | |
Employee future benefits(note 19) | | | 142 | | | | 116 | |
Finance lease obligations | | | 264 | | | | 31 | |
Stock-based compensation | | | 26 | | | | 39 | |
Contingent consideration(note 22) | | | — | | | | 31 | |
Other | | | 153 | | | | 54 | |
| | | | | | | | |
| | | 585 | | | | 271 | |
| | | | | | | | |
Finance lease obligations
The Company, on behalf of the Sunrise Oil Sands Partnership, entered into an arrangement for the construction and use of pipeline and storage facilities in its oil sands operations. The substance of the arrangement has been determined to be a lease and has been classified as a finance lease. The assets are to be used for a minimum period of 20 years with options to renew.
Consolidated Financial Statements 32
The future minimum lease payments under the new and existing finance leases are payable as follows:
| | | | | | | | | | | | | | | | | | | | | | | | | | | | | | | | |
($ millions) | | Within 1 year | | | After 1 year but no
more than 5 years | | | More than 5 years | | | Total | |
| | | 2014 | | | 2013 | | | 2014 | | | 2013 | | | 2014 | | | 2013 | | | 2014 | | | 2013 | |
Future minimum lease payments | | | 33 | | | | 4 | | | | 141 | | | | 14 | | | | 852 | | | | 28 | | | | 1,026 | | | | 46 | |
Interest | | | 31 | | | | 2 | | | | 119 | | | | 7 | | | | 581 | | | | 6 | | | | 731 | | | | 15 | |
Present value of minimum lease payments | | | 31 | | | | 1 | | | | 104 | | | | 15 | | | | 160 | | | | 16 | | | | 295 | | | | 32 | |
| | | | | | | | | | | | | | | | | | | | | | | | | | | | | | | | |
| Note 16 | Asset Retirement Obligations |
At December 31, 2014, the estimated total undiscounted inflation-adjusted amount required to settle the Company’s ARO was $15.5 billion (December 31, 2013 – $12.3 billion). These obligations will be settled based on the useful lives of the underlying assets, which currently extend an average of 52 years into the future. This amount has been discounted using credit-adjusted risk-free rates of 2.9% to 4.8% (December 31, 2013 – 3.1% to 5.3%). Obligations related to future environmental remediation and cleanup of oil and gas producing assets are included in the estimated ARO.
The change in estimates in 2014 is related to lower average discount rates, increased cost estimates and asset growth that is partially offset by a revision of the timing of future ARO cash flows.
While the provision is based on management’s best estimates of future costs, discount rates and the economic lives of the assets, there is uncertainty regarding the amount and timing of incurring these costs.
A reconciliation of the carrying amount of asset retirement obligations at December 31, 2014 and 2013 is set out below:
| | | | | | | | |
| Asset Retirement Obligations | | | | | | |
($ millions) | | 2014 | | | 2013 | |
Beginning of year | | | 2,918 | | | | 2,793 | |
Additions | | | 48 | | | | 78 | |
Liabilities settled | | | (167 | ) | | | (142 | ) |
Liabilities disposed | | | (8 | ) | | | (6 | ) |
Change in discount rate | | | 279 | | | | (288 | ) |
Change in estimates | | | (156 | ) | | | 351 | |
Exchange adjustment | | | 18 | | | | 14 | |
Accretion(note 14) | | | 133 | | | | 118 | |
| | | | | | | | |
End of year | | | 3,065 | | | | 2,918 | |
| | | | | | | | |
Expected to be incurred within 1 year | | | 97 | | | | 210 | |
Expected to be incurred beyond 1 year | | | 2,968 | | | | 2,708 | |
| | | | | | | | |
The major components of income tax expense for the years ended December 31, 2014 and 2013 were as follows:
| | | | | | | | |
| Income Tax Expense | | | | | | |
($ millions) | | 2014 | | | 2013 | |
Current income tax | | | | | | | | |
Current income tax charge | | | 684 | | | | 413 | |
Adjustments to current income tax estimates | | | 33 | | | | 176 | |
| | | | | | | | |
| | | 717 | | | | 589 | |
| | | | | | | | |
Deferred income tax | | | | | | | | |
Relating to origination and reversal of temporary differences | | | (186 | ) | | | 364 | |
Adjustments to deferred income tax estimates | | | (5 | ) | | | (154 | ) |
| | | | | | | | |
| | | (191 | ) | | | 210 | |
| | | | | | | | |
Consolidated Financial Statements 33
| | | | | | | | |
| Deferred Tax Items in OCI | | | | | | |
($ millions) | | 2014 | | | 2013 | |
Deferred tax items expensed (recovered) directly in OCI | | | | | | | | |
Derivatives designated as cash flow hedges | | | (5 | ) | | | 13 | |
Remeasurement of pension plans | | | (4 | ) | | | 7 | |
Exchange differences on translation of foreign operations | | | 109 | | | | 58 | |
Hedge of net investment | | | (39 | ) | | | (27 | ) |
| | | | | | | | |
| | | 61 | | | | 51 | |
| | | | | | | | |
The provision for income taxes in the consolidated statements of income reflects an effective tax rate which differs from the expected statutory tax rate. Differences for the years ended December 31, 2014 and 2013 were accounted for as follows:
| | | | | | | | |
| Reconciliation of Effective Tax Rate | | | | | | |
($ millions, except tax rate) | | 2014 | | | 2013 | |
Earnings before income taxes | | | | | | | | |
Canada | | | 1,515 | | | | 2,110 | |
United States | | | (180 | ) | | | 379 | |
Other foreign jurisdictions | | | 449 | | | | 139 | |
| | | | | | | | |
| | | 1,784 | | | | 2,628 | |
Statutory Canadian income tax rate (percent) | | | 25.8 | % | | | 25.8 | % |
| | | | | | | | |
Expected income tax | | | 461 | | | | 678 | |
Effect on income tax resulting from: | | | | | | | | |
Capital gains and losses | | | (2 | ) | | | (10 | ) |
Foreign jurisdictions | | | (26 | ) | | | 64 | |
Non-taxable items | | | 4 | | | | 33 | |
Revaluation of foreign tax pools | | | 47 | | | | — | |
Other – net | | | 42 | | | | 34 | |
| | | | | | | | |
Income tax expense | | | 526 | | | | 799 | |
| | | | | | | | |
The statutory tax rate was 25.8% in 2014 (2013 – 25.8%). The 2014 to 2013 tax rates were unchanged as there were no significant changes to applicable tax rates.
The following reconciles the movements in the deferred income tax liabilities and assets:
| | | | | | | | | | | | | | | | | | | | |
Deferred Tax Liabilities and Assets
($ millions) | | January 1, 2014 | | | Recognized in
Earnings | | | Recognized
in OCI | | | Other | | | December 31,
2014 | |
Deferred tax liabilities | | | | | | | | | | | | | | | | | | | | |
Exploration and evaluation assets and property, plant and equipment | | | (5,789 | ) | | | 75 | | | | (124 | ) | | | (2 | ) | | | (5,840 | ) |
Foreign exchange gains taxable on realization | | | (60 | ) | | | (19 | ) | | | 44 | | | | — | | | | (35 | ) |
Debt issue costs | | | 3 | | | | (4 | ) | | | — | | | | — | | | | (1 | ) |
Deferred tax assets | | | | | | | | | | | | | | | | | | | | |
Pension plans | | | 35 | | | | — | | | | 4 | | | | — | | | | 39 | |
Asset retirement obligations | | | 812 | | | | 50 | | | | 8 | | | | — | | | | 870 | |
Loss carry-forwards | | | 51 | | | | 29 | | | | 7 | | | | — | | | | 87 | |
Financial assets at fair value | | | (8 | ) | | | 20 | | | | — | | | | — | | | | 12 | |
Other temporary differences | | | 14 | | | | 40 | | | | — | | | | — | | | | 54 | |
| | | | | | | | | | | | | | | | | | | | |
| | | (4,942 | ) | | | 191 | | | | (61 | ) | | | (2 | ) | | | (4,814 | ) |
| | | | | | | | | | | | | | | | | | | | |
Consolidated Financial Statements 34
| | | | | | | | | | | | | | | | | | | | |
Deferred Tax Liabilities and Assets ($ millions) | | January 1, 2013 | | | Recognized in
Earnings | | | Recognized
in OCI | | | Other | | | December 31,
2013 | |
Deferred tax liabilities | | | | | | | | | | | | | | | | | | | | |
Exploration and evaluation assets and property, plant and equipment | | | (5,425 | ) | | | (258 | ) | | | (65 | ) | | | (41 | ) | | | (5,789 | ) |
Foreign exchange gains taxable on realization | | | (64 | ) | | | (10 | ) | | | 14 | | | | — | | | | (60 | ) |
Financial assets at fair value | | | (7 | ) | | | (1 | ) | | | — | | | | — | | | | (8 | ) |
Deferred tax assets | | | | | | | | | | | | | | | | | | | | |
Pension plans | | | 39 | | | | 3 | | | | (7 | ) | | | — | | | | 35 | |
Asset retirement obligations | | | 778 | | | | 30 | | | | 4 | | | | — | | | | 812 | |
Loss carry-forwards | | | 30 | | | | 18 | | | | 3 | | | | — | | | | 51 | |
Debt issue costs | | | 6 | | | | (3 | ) | | | — | | | | — | | | | 3 | |
Other temporary differences | | | 3 | | | | 11 | | | | — | | | | — | | | | 14 | |
| | | | | | | | | | | | | | | | | | | | |
| | | (4,640 | ) | | | (210 | ) | | | (51 | ) | | | (41 | ) | | | (4,942 | ) |
| | | | | | | | | | | | | | | | | | | | |
The Company has temporary differences associated with its investments in its foreign subsidiaries, branches, and interests in joint ventures. At December 31, 2014, the Company had no deferred tax liabilities in respect of these temporary differences (December 31, 2013 – nil).
At December 31, 2014, the Company had $234 million (December 31, 2013 – $138 million) of U.S. tax losses that will expire between 2030 and 2034. The Company has recorded deferred tax assets in respect of these losses, as there are sufficient taxable temporary differences in the U.S. jurisdiction to utilize these losses.
Common Shares
The Company is authorized to issue an unlimited number of no par value common shares.
| | | | | | | | |
Common Shares | | Number of Shares | | | Amount
($ millions) | |
December 31, 2012 | | | 982,229,220 | | | | 6,939 | |
Stock dividends | | | 290,667 | | | | 8 | |
Options exercised | | | 859,187 | | | | 27 | |
| | | | | | | | |
December 31, 2013 | | | 983,379,074 | | | | 6,974 | |
Stock dividends | | | 315,419 | | | | 11 | |
Options exercised | | | 43,569 | | | | 1 | |
| | | | | | | | |
December 31, 2014 | | | 983,738,062 | | | | 6,986 | |
| | | | | | | | |
Shareholders may receive dividends declared in common shares or in cash. Quarterly dividends may be declared in an amount expressed in dollars per common share and could be paid by way of issuance of a fraction of a common share per outstanding common share determined by dividing the dollar amount of the dividend by the volume-weighted average trading price of the common shares on the principal stock exchange on which the common shares are traded. The volume-weighted average trading price of the common shares is calculated by dividing the total value by the total volume of common shares traded over the five trading day period immediately prior to the payment date of the dividend on the common shares.
During the year ended December 31, 2014, the Company declared dividends payable of $1.20 per common share (2013 – $1.20 per common share), resulting in dividends of $1,180 million (2013 – $1,180 million). An aggregate of $1,169 million was paid in cash and $11 million in common shares during 2014 (2013 – $1,171 million in cash and $8 million in common shares). At December 31, 2014, $295 million, including $292 million in cash and $3 million in common shares, was payable to shareholders on account of dividends declared on October 23, 2014 (December 31, 2013 – $295 million, including $291 million in cash and $4 million in common shares).
Consolidated Financial Statements 35
Preferred Shares
The Company is authorized to issue an unlimited number of no par value preferred shares.
| | | | | | | | |
Preferred Shares | | Number of Shares | | | Amount
($ millions) | |
Cumulative Redeemable Preferred Shares, Series 1 issued, net of share issue costs | | | 12,000,000 | | | | 291 | |
Cumulative Redeemable Preferred Shares, Series 3 issued, net of share issue costs | | | 10,000,000 | | | | 243 | |
| | | | | | | | |
December 31, 2014 | | | 22,000,000 | | | | 534 | |
| | | | | | | | |
Holders of the Cumulative Redeemable Preferred Shares, Series 1 (“Series 1 Preferred Shares”) are entitled to receive a cumulative quarterly fixed dividend yielding 4.45% annually for an initial period ending March 31, 2016, as and when declared by the Company’s Board of Directors. Thereafter, the dividend rate will be reset every five years at a rate equal to the 5-year Government of Canada bond yield plus 1.73%. Holders of Series 1 Preferred Shares have the right, at their option, to convert their shares into Cumulative Redeemable Preferred Shares, Series 2 (the “Series 2 Preferred Shares”), subject to certain conditions, on March 31, 2016 and on March 31 every five years thereafter. Holders of the Series 2 Preferred Shares are entitled to receive a cumulative quarterly floating rate dividend at a rate equal to the three-month Government of Canada Treasury Bill yield plus 1.73%, as and when declared by the Company’s Board of Directors.
In the event of liquidation, dissolution or winding-up of the Company, the holders of the Series 1 Preferred Shares will be entitled to receive $25 per share. All accrued unpaid dividends will be paid before any amounts are paid or any assets of the Company are distributed to the holders of any other shares ranking junior to the Series 1 Preferred Shares. The holders of the Series 1 Preferred Shares will not be entitled to share in any further distribution of the assets of the Company.
During the year ended December 31, 2014, the Company declared dividends payable of $13 million on the Series 1 Preferred Shares (2013 – $13 million) representing approximately $1.11 per Series 1 Preferred Share (2013 – $1.11 per Series 1 Preferred Share). At December 31, 2014, there were no amounts payable as dividends on the Series 1 Preferred Shares (December 31, 2013 – nil). A total of $13 million was paid during 2014 (2013 – $13 million), representing approximately $0.28 per quarter per Series 1 Preferred Share (2013 – $0.28 per Series 1 Preferred Share).
On December 9, 2014, the Company issued 10 million Cumulative Redeemable Preferred Shares, Series 3 (the “Series 3 Preferred Shares”) at a price of $25.00 per share for aggregate gross proceeds of $250 million by way of a prospectus supplement dated December 2, 2014, under the Canadian short form base shelf prospectus dated December 31, 2012. Net proceeds after share issue costs were $243 million. Holders of the Series 3 Preferred Shares are entitled to receive a cumulative quarterly fixed dividend yielding 4.50 percent annually for the initial period ending December 31, 2019 as and when declared by the Company’s Board of Directors. Thereafter, the dividend rate will be reset every five years at the rate equal to the five-year Government of Canada bond yield plus 3.13 percent. Holders of Series 3 Preferred Shares will have the right, at their option, to convert their shares into Cumulative Redeemable Preferred Shares, Series 4 (the “Series 4 Preferred Shares”), subject to certain conditions, on December 31, 2019 and on December 31 every five years thereafter. Holders of the Series 4 Preferred Shares will be entitled to receive cumulative quarterly floating dividends at a rate equal to the 90-day Government of Canada Treasury Bill yield plus 3.13 percent.
Stock Option Plan
Pursuant to the Incentive Stock Option Plan (the “Option Plan”), the Company may grant from time to time to officers and employees of the Company options to purchase common shares of the Company. The term of each option is five years, and vests one-third on each of the first three anniversary dates from the grant date. The Option Plan provides the option holder with the right to exercise the option to acquire one common share at the exercise price or surrender the option for a cash payment. The exercise price of the option is equal to the weighted average trading price of the Company’s common shares during the five trading days prior to the grant date. When the stock option is surrendered to the Corporation, the cash payment is equal to the excess of the aggregate fair market value of the common shares able to be purchased pursuant to the vested and exercisable portion of such stock options on the date of surrender over the aggregate exercise price for those common shares pursuant to those stock options. The fair market value of common shares is calculated as the closing price of the common shares on the date on which board lots of common shares have traded immediately preceding the date a holder of the stock options provides notice to the Corporation that he or she wishes to surrender his or her stock options to the Corporation in lieu of exercise.
Consolidated Financial Statements 36
Certain options granted under the Option Plan and henceforth referred to as performance options vest only if certain shareholder return targets are met. The ultimate number of performance options that vest will depend upon the Company’s performance measured over three calendar years. If the Company’s performance is below the specified level compared with its industry peer group, the performance options awarded will be forfeited. If the Company’s performance is at or above the specified level compared with its industry peer group, the number of performance options exercisable shall be determined by the Company’s relative ranking. Stock compensation expense related to the performance options is accrued based on the price of the common shares at the end of the period and the anticipated performance factor. The term of each performance option is five years and the compensation expense is recognized over the three-year vesting period of the performance options. Performance options are no longer granted and the last grant was on August 7, 2009. All outstanding performance options expired during the year ended December 31, 2014.
Included in accounts payable and accrued liabilities and other long-term liabilities in the consolidated balance sheets at December 31, 2014 was $41 million (December 31, 2013 – $134 million) representing the estimated fair value of options outstanding. The total recovery recognized in selling, general and administrative expenses in the consolidated statements of income for the Option Plan for the year ended December 31, 2014 was $39 million (2013 – $83 million expense). At December 31, 2014, stock options exercisable for cash had an intrinsic value of $15 million (December 31, 2013 – $135 million).
The following options to purchase common shares have been awarded to officers and certain other employees:
| | | | | | | | | | | | | | | | |
Outstanding and Exercisable Options | | 2014 | | | 2013 | |
| | | Number of Options
(thousands) | | | Weighted Average
Exercise Prices ($) | | | Number of Options
(thousands) | | | Weighted Average
Exercise Prices ($) | |
Outstanding, beginning of year | | | 28,937 | | | | 28.20 | | | | 29,021 | | | | 28.85 | |
Granted(1) | | | 6,769 | | | | 33.41 | | | | 6,314 | | | | 31.46 | |
Exercised for common shares | | | (44 | ) | | | 27.57 | | | | (859 | ) | | | 27.75 | |
Surrendered for cash | | | (7,289 | ) | | | 27.94 | | | | (1,857 | ) | | | 28.43 | |
Expired or forfeited | | | (1,631 | ) | | | 30.20 | | | | (3,682 | ) | | | 38.92 | |
| | | | | | | | | | | | | | | | |
Outstanding, end of year | | | 26,742 | | | | 29.47 | | | | 28,937 | | | | 28.20 | |
| | | | | | | | | | | | | | | | |
Exercisable, end of year | | | 13,717 | | | | 27.97 | | | | 13,574 | | | | 27.87 | |
| | | | | | | | | | | | | | | | |
| (1) | Options granted during the year ended December 31, 2014 were attributed a fair value of $4.08 per option (2013 – $4.02) at grant date. |
| | | | | | | | | | | | | | | | | | | | |
Outstanding and Exercisable Options | | Outstanding Options | | | Exercisable Options | |
Range of Exercise Price | | Number of
Options
(thousands) | | | Weighted Average
Exercise Prices ($) | | | Weighted Average
Contractual Life
(years) | | | Number of
Options
(thousands) | | | Weighted Average
Exercise Prices ($) | |
$20.00 – $29.99 | | | 15,236 | | | | 27.12 | | | | 1.67 | | | | 12,102 | | | | 27.50 | |
$30.00 – $36.20 | | | 11,506 | | | | 32.59 | | | | 3.72 | | | | 1,615 | | | | 31.50 | |
| | | | | | | | | | | | | | | | | | | | |
December 31, 2014 | | | 26,742 | | | | 29.47 | | | | 2.55 | | | | 13,717 | | | | 27.97 | |
| | | | | | | | | | | | | | | | | | | | |
The fair value of the share options is estimated at each reporting date using the Black-Scholes option pricing model, taking into account the terms and conditions upon which the share options are granted and for the performance options, the current likelihood of achieving the specified target. The following table lists the assumptions used in the Black-Scholes option pricing model for the share options and performance options:
| | | | | | | | | | | | | | | | |
Black-Scholes Assumptions(1) | | December 31, 2014 | | | December 31, 2013 | |
| | | Tandem
Options | | | Tandem
Performance
Options(1) | | | Tandem
Options | | | Tandem
Performance
Options | |
Dividend per option | | | 1.20 | | | | — | | | | 1.20 | | | | 1.20 | |
Range of expected volatilities used(percent) | | | 20.9 - 61.8 | | | | — | | | | 15.5 - 24.5 | | | | 15.5 - 17.4 | |
Range of risk-free interest rates used(percent) | | | 0.9 - 1.4 | | | | — | | | | 0.9 - 1.9 | | | | 0.9 - 1.0 | |
Expected life of share options from vesting date(years) | | | 1.81 | | | | — | | | | 1.85 | | | | 1.85 | |
Expected forfeiture rate(percent) | | | 9.8 | | | | — | | | | 10.2 | | | | 10.2 | |
Weighted average exercise price | | | 28.90 | | | | — | | | | 27.95 | | | | 30.54 | |
Weighted average fair value | | | 1.85 | | | | — | | | | 5.74 | | | | 3.22 | |
| (1) | All outstanding performance options expired during the year ended December 31, 2014. |
Consolidated Financial Statements 37
The expected life of the share options is based on historical data and current expectations and is not necessarily indicative of exercise patterns that may occur. The expected volatility reflects the assumption that the historical volatility over a period similar to the expected life of the options is indicative of future trends, which may also not necessarily be the actual outcome.
Performance Share Units
In February 2010, the Compensation Committee of the Board of Directors of the Company established the Performance Share Unit Plan for executive officers and certain employees of the Company. The term of each PSU is three years, and the PSU vests on the second and third anniversary dates of the grant date in percentages determined by the Compensation Committee based on the Company reaching certain shareholder return and corporate performance targets. Upon vesting, PSU holders receive a cash payment equal to the number of vested PSUs multiplied by the weighted average trading price of the Company’s common shares for the five preceding trading days. As at December 31, 2014, the carrying amount of the liability relating to PSUs was $38 million (December 31, 2013 – $27 million). The total expense recognized in selling, general and administrative expenses in the consolidated statements of income for the PSUs for the year ended December 31, 2014 was $22 million (2013 – expense of $22 million). The weighted average contractual life of the PSUs at December 31, 2014 was two years (December 31, 2013 – two years).
The number of PSUs outstanding was as follows:
| | | | | | | | |
Performance Share Units | | 2014 | | | 2013 | |
Beginning of year | | | 2,791,875 | | | | 864,500 | |
Granted | | | 2,064,100 | | | | 2,194,015 | |
Exercised | | | (357,628 | ) | | | (209,331 | ) |
Forfeited | | | (339,119 | ) | | | (57,309 | ) |
| | | | | | | | |
Outstanding, end of year | | | 4,159,228 | | | | 2,791,875 | |
| | | | | | | | |
Vested, end of year | | | 1,372,974 | | | | 809,947 | |
| | | | | | | | |
Earnings per Share
| | | | | | | | |
Earnings per Share | | | | | | |
($ millions) | | 2014 | | | 2013 | |
Net earnings | | | 1,258 | | | | 1,829 | |
Effect of dividends declared on preferred shares in the year | | | (13 | ) | | | (13 | ) |
| | | | | | | | |
Net earnings – basic | | | 1,245 | | | | 1,816 | |
Dilutive effect of accounting for share options as equity-settled(1) | | | (65 | ) | | | — | |
| | | | | | | | |
Net earnings – diluted | | | 1,180 | | | | 1,816 | |
| | | | | | | | |
| | |
(millions) | | | | | | |
Weighted average common shares outstanding – basic | | | 983.6 | | | | 983.0 | |
Effect of stock dividends declared in the year | | | 1.7 | | | | 0.6 | |
| | | | | | | | |
Weighted average common shares outstanding – diluted | | | 985.3 | | | | 983.6 | |
| | | | | | | | |
| | |
Earnings per share – basic ($/share) | | | 1.26 | | | | 1.85 | |
Earnings per share – diluted ($/share) | | | 1.20 | | | | 1.85 | |
| | | | | | | | |
| (1) | Stock-based compensation recovery was $39 million based on cash-settlement for the year ended December 31, 2014 (2013 – $83 million expense). Stock-based compensation expense was $26 million based on equity-settlement for the year ended December 31, 2014 (2013 – $29 million expense). For the year ended December 31, 2014, equity-settlement of share options was considered more dilutive than the cash-settlement of share options and as such, was used to calculate earnings per share – diluted. |
For the year ended December 31, 2014, 19 million tandem options (2013 – 26 million) were excluded from the calculation of diluted earnings per share as these options were anti-dilutive. For the year ended December 31, 2014, there were no tandem performance options (2013 – 96,150 anti-dilutive tandem performance options) excluded from the calculation of diluted earnings per share as these options expired during the year ended December 31, 2014.
Consolidated Financial Statements 38
| Note 19 | Pensions and Other Post-employment Benefits |
The Company currently provides defined contribution pension plans for all qualified employees and two other post-employment benefit plans to its retirees. The Company also maintains a defined benefit pension plan, which is closed to new entrants. The measurement date of all plan assets and the accrued benefit obligations was December 31, 2014. The most recent actuarial valuation was December 31, 2013 for the Canadian defined benefit plan. The most recent actuarial valuation was December 31, 2011 for the Canadian Other Post-employment benefit plan. The most recent actuarial valuation of the U.S. Other Post-employment benefit plan was January 1, 2014. The U.S. defined benefit plan was settled in 2014.
Defined Contribution Pension Plan
During the year ended December 31, 2014, the Company recognized a $42 million expense (2013 – $37 million) for the defined contribution plan and the two U.S. 401(k) plans in net earnings.
Defined Benefit Pension Plan (“DB Pension Plan”) and Other Post-employment Benefit Plans (“OPEB Plans”)
The Company has accrued the total net liability for the DB Pension Plan and the OPEB Plans in the consolidated balance sheets in other long-term liabilities as follows:
| | | | | | | | | | | | |
| DB Pension Plan | | | | | | | | | |
($ millions) | | December 31, 2014 | | | December 31, 2013 | | | December 31, 2012 | |
Fair value of plan assets | | | 180 | | | | 173 | | | | 156 | |
Defined benefit obligation | | | (179 | ) | | | (180 | ) | | | (189 | ) |
| | | | | | | | | | | | |
Funded status | | | 1 | | | | (7 | ) | | | (33 | ) |
| | | | | | | | | | | | |
Net asset (liability) | | | 1 | | | | (7 | ) | | | (33 | ) |
| | | | | | | | | | | | |
Non-current asset (liability) | | | 1 | | | | (7 | ) | | | (33 | ) |
| | | | | | | | | | | | |
| | | | | | | | | | | | |
| OPEB Plans | | | | | | | | | |
($ millions) | | December 31, 2014 | | | December 31, 2013 | | | December 31, 2012 | |
Fair value of plan assets | | | — | | | | — | | | | — | |
Defined benefit obligation | | | (143 | ) | | | (109 | ) | | | (105 | ) |
| | | | | | | | | | | | |
Funded status | | | (143 | ) | | | (109 | ) | | | (105 | ) |
| | | | | | | | | | | | |
Net liability | | | (143 | ) | | | (109 | ) | | | (105 | ) |
| | | | | | | | | | | | |
Non-current liability | | | (143 | ) | | | (109 | ) | | | (105 | ) |
| | | | | | | | | | | | |
The following tables summarize the experience adjustments arising on the DB Pension Plan’s and the OPEB Plans’ liabilities:
| | | | | | | | | | | | |
| DB Pension Plan | | | | | | | | | |
($ millions) | | 2014 | | | 2013 | | | 2012 | |
Experience adjustments arising on plan liabilities | | | (1.5 | ) | | | 0.4 | | | | (0.5 | ) |
| | | | | | | | | | | | |
| | | | | | | | | | | | |
| OPEB Plans | | | | | | | | | |
($ millions) | | 2014 | | | 2013 | | | 2012 | |
Experience adjustments arising on plan liabilities | | | (0.2 | ) | | | (0.5 | ) | | | 1.6 | |
| | | | | | | | | | | | |
Consolidated Financial Statements 39
The following tables summarize changes to the net balance sheet position and amounts recognized in net earnings and OCI for the DB Pension Plan and the OPEB Plans for the years ended December 31, 2014 and 2013:
| | | | | | | | | | | | | | | | |
DB Pension Plan and OPEB Plans Net Asset (Liability) | | DB Pension Plan | | | OPEB Plans | |
($ millions) | | 2014 | | | 2013 | | | 2014 | | | 2013 | |
Beginning of year | | | (7 | ) | | | (33 | ) | | | (109 | ) | | | (105 | ) |
Employer contributions | | | 4 | | | | 8 | | | | — | | | | — | |
Benefit cost | | | (1 | ) | | | (3 | ) | | | (12 | ) | | | (11 | ) |
Benefit paid | | | — | | | | — | | | | 1 | | | | 1 | |
Remeasurements | | | | | | | | | | | | | | | | |
Actuarial gain (loss) due to liability experience | | | 2 | | | | — | | | | — | | | | 1 | |
Actuarial gain (loss) due to liability assumption changes | | | (19 | ) | | | 8 | | | | (23 | ) | | | 5 | |
Return on plan assets (greater) less than discount rate | | | 22 | | | | 13 | | | | — | | | | — | |
| | | | | | | | | | | | | | | | |
End of year | | | 1 | | | | (7 | ) | | | (143 | ) | | | (109 | ) |
| | | | | | | | | | | | | | | | |
| | | | | | | | | | | | | | | | |
| DB Pension Plan and OPEB Plans | | DB Pension Plan | | | OPEB Plans | |
($ millions) | | 2014 | | | 2013 | | | 2014 | | | 2013 | |
Amounts recognized in net earnings | | | | | | | | | | | | | | | | |
Current service cost | | | 2 | | | | 2 | | | | 7 | | | | 7 | |
Net Interest cost | | | 1 | | | | 1 | | | | 5 | | | | 4 | |
Gain on settlement | | | (2 | ) | | | — | | | | — | | | | — | |
| | | | | | | | | | | | | | | | |
Benefit cost (gain) | | | 1 | | | | 3 | | | | 12 | | | | 11 | |
| | | | | | | | | | | | | | | | |
Remeasurements | | | | | | | | | | | | | | | | |
Actuarial (gain) loss due to liability experience | | | (2 | ) | | | — | | | | — | | | | (1 | ) |
Actuarial (gain) loss due to liability assumption changes | | | 19 | | | | (8 | ) | | | 23 | | | | (5 | ) |
Loss (gain) on plan assets | | | (22 | ) | | | (13 | ) | | | — | | | | — | |
| | | | | | | | | | | | | | | | |
Remeasurement effects recognized in OCI | | | (5 | ) | | | (21 | ) | | | 23 | | | | (6 | ) |
| | | | | | | | | | | | | | | | |
The following tables summarize changes to the defined benefit obligation for the DB Pension Plan and the OPEB Plans:
| | | | | | | | | | | | | | | | |
| Defined Benefit Obligation | | DB Pension Plan | | | OPEB Plans | |
($ millions) | | 2014 | | | 2013 | | | 2014 | | | 2013 | |
Beginning of year | | | 180 | | | | 189 | | | | 109 | | | | 105 | |
Current service cost | | | 2 | | | | 2 | | | | 7 | | | | 7 | |
Interest cost | | | 8 | | | | 8 | | | | 5 | | | | 4 | |
Benefits paid | | | (10 | ) | | | (11 | ) | | | (1 | ) | | | (1 | ) |
Gain on settlements | | | (2 | ) | | | — | | | | — | | | | — | |
Settlements | | | (16 | ) | | | — | | | | — | | | | — | |
Remeasurements | | | | | | | | | | | | | | | | |
Actuarial (gain) loss - experience | | | (2 | ) | | | — | | | | — | | | | (1 | ) |
Actuarial (gain) loss - demographic assumptions | | | 3 | | | | 6 | | | | 3 | | | | 9 | |
Actuarial (gain) loss - financial assumptions | | | 16 | | | | (14 | ) | | | 20 | | | | (14 | ) |
Curtailment gain | | | — | | | | — | | | | — | | | | — | |
| | | | | | | | | | | | | | | | |
End of year | | | 179 | | | | 180 | | | | 143 | | | | 109 | |
| | | | | | | | | | | | | | | | |
Consolidated Financial Statements 40
The following table summarizes changes to the DB Pension Plan assets during the year:
| | | | | | | | |
| Fair Value of Plan Assets | | | | | | |
($ millions) | | 2014 | | | 2013 | |
Beginning of year | | | 173 | | | | 156 | |
Contributions by employer | | | 4 | | | | 8 | |
Benefits paid | | | (10 | ) | | | (11 | ) |
Interest income | | | 7 | | | | 7 | |
Return on plan assets greater (less) than discount rate | | | 22 | | | | 13 | |
Settlements | | | (16 | ) | | | — | |
| | | | | | | | |
End of year | | | 180 | | | | 173 | |
| | | | | | | | |
The following long-term assumptions were used to estimate the value of the defined benefit obligations, the plan assets and the OPEB Plans:
| | | | | | | | | | | | | | | | |
| DB Pension Plan Long-term Assumptions | | Canada - DB Pension Plan | | | U.S. - DB Pension Plan(1) | |
(percent) | | 2014 | | | 2013 | | | 2014 | | | 2013 | |
Discount rate for benefit expense | | | 4.5 | | | | 3.8 | | | | — | | | | 3.2 | |
Discount rate for benefit obligation | | | 3.7 | | | | 4.5 | | | | — | | | | 4.1 | |
Rate of compensation expense | | | 3.5 | | | | 3.5 | | | | — | | | | 4.5 | |
| (1) | The U.S. Defined Benefit Plan was wound up in 2014. |
| | | | | | | | |
| OPEB Plans Long-term Assumptions | | OPEB Plans | |
(percent) | | 2014 | | | 2013 | |
Discount rate for benefit expense | | | 4.4 - 4.7 | | | | 3.3 - 4.0 | |
Discount rate for benefit obligation | | | 3.7 - 3.9 | | | | 4.3 - 4.7 | |
Dental care escalation rate | | | 4.5 | | | | 4.0 | |
Provincial health care premium | | | 2.5 | | | | 2.5 | |
The average health care cost trend rate used for the benefit expense for the Canadian OPEB Plan was 7.0% for 2014, grading 0.5% per year for 4 years to 5.0% in 2018 and thereafter. The average health care cost trend rate used for the obligation related to the Canadian OPEB Plan was 6.5% for 2015, grading 0.5% per year for 3 years to 5.0% in 2018 and thereafter.
The average health care cost trend rate used for the benefit expense for the U.S. OPEB Plan was 7.0% for 2014, grading 0.25% per year for 8 years to 5.0% per year in 2022 and thereafter. The average health care cost trend rate used for the obligation related to the U.S. OPEB Plan was 6.8% for 2015, grading 0.25% per year for 8 years to 5.0% in 2022 and thereafter.
The medical cost trend rate assumption has a significant effect on amounts reported for the OPEB plans. A 1% increase or decrease in the estimated trend rate would have the following effects:
| | | | | | | | |
| Medical Cost Trend Rate Sensitivity Analysis | | | | | | |
($ millions) | | 1% increase | | | 1% decrease | |
Effect on benefit cost recognized in net earnings | | | 2.7 | | | | (2.1 | ) |
Effect on defined benefit obligation | | | 26.0 | | | | (21.1 | ) |
During 2014, the Company contributed $4 million (2013 – $8 million) to the defined benefit pension plan assets and is expecting to contribute $2 million in 2015. Benefits of $10 million are expected to be paid in 2015.
The Company adheres to a Statement of Investment Policies and Procedures (the “Policy”). Plan assets are allocated in accordance with the long-term nature of the obligation and comprise a balanced investment based on interest rate and inflation sensitivities. The Policy explicitly prescribes diversification parameters for all classes of investment.
Consolidated Financial Statements 41
The composition of the DB Pension Plan assets at December 31, 2014 and 2013 was as follows:
| | | | | | | | | | | | |
| DB Pension Plan Assets | | | | | | | | | |
(percent) | | Target allocation range | | | 2014 | | | 2013 | |
Money market type funds | | | 0 – 5 | | | | 0.5 | | | | 0.5 | |
Equity securities | | | 30 – 50 | | | | 40.6 | | | | 64.5 | |
Debt securities | | | 50 – 65 | | | | 58.9 | | | | 34.5 | |
Other | | | — | | | | — | | | | 0.5 | |
| Note 20 | Commitments and Contingencies |
At December 31, 2014, the Company had commitments that require the following minimum future payments, which are not accrued in the consolidated balance sheet:
| | | | | | | | | | | | | | | | |
Minimum Future Payments for Commitments ($ millions) | | Within 1 year | | | After 1 year but not
more than 5 years | | | More than 5 years | | | Total | |
Operating leases | | | 115 | | | | 918 | | | | 1,019 | | | | 2,052 | |
Firm transportation agreements | | | 351 | | | | 1,317 | | | | 3,275 | | | | 4,943 | |
Unconditional purchase obligations | | | 2,495 | | | | 1,218 | | | | 329 | | | | 4,042 | |
Lease rentals and exploration work agreements | | | 321 | | | | 468 | | | | 1,219 | | | | 2,008 | |
| | | | | | | | | | | | | | | | |
| | | 3,282 | | | | 3,921 | | | | 5,842 | | | | 13,045 | |
| | | | | | | | | | | | | | | | |
The Company has income tax filings that are subject to audit and potential reassessment. The findings may impact the tax liability of the Company. The final results are not reasonably determinable at this time, and management believes that it has adequately provided for current and deferred income taxes.
The Company is involved in various claims and litigation arising in the normal course of business. While the outcome of these matters is uncertain and there can be no assurance that such matters will be resolved in the Company’s favour, the Company does not currently believe that the outcome of adverse decisions in any pending or threatened proceedings related to these and other matters would have a material adverse impact on its financial position, results of operations or liquidity.
Consolidated Financial Statements 42
| Note 21 | Related Party Transactions |
Significant subsidiaries and jointly controlled entities at December 31, 2014 and the Company’s percentage equity interest (to the nearest whole number) are set out below:
| | | | | | | | |
Significant Subsidiaries and Joint Operations | | % | | | Jurisdiction | |
Subsidiary of Husky Energy Inc. | | | | | | | | |
Husky Oil Operations Limited | | | 100 | | | | Alberta | |
Subsidiaries and jointly controlled entities of Husky Oil Operations Limited | | | | | | | | |
Husky Oil Limited Partnership | | | 100 | | | | Alberta | |
Husky Terra Nova Partnership | | | 100 | | | | Alberta | |
Husky Downstream General Partnership | | | 100 | | | | Alberta | |
Husky Energy Marketing Partnership | | | 100 | | | | Alberta | |
Husky Energy International Corporation | | | 100 | | | | Alberta | |
Sunrise Oil Sands Partnership | | | 50 | | | | Alberta | |
BP-Husky Refining LLC | | | 50 | | | | Delaware | |
Lima Refining Company | | | 100 | | | | Delaware | |
Husky Marketing and Supply Company | | | 100 | | | | Delaware | |
Each of the related party transactions described below was made on terms equivalent to those that prevail in arm’s length transactions unless otherwise noted.
On May 11, 2009, the Company issued 5-year and 10-year senior notes of U.S. $251 million and U.S. $107 million, respectively, to certain management, shareholders, affiliates and directors. The coupon rates offered were 5.90% and 7.25% for the 5-year and 10-year tranches, respectively. Subsequent to this offering, U.S. $122 million of the 5-year senior notes and U.S. $75 million of the 10-year senior notes issued to related parties were sold to third parties. On June 15, 2014, the Company repaid the maturing 5.90% notes. As a result, U.S. $133 million was repaid to related parties, including interest of U.S. $4 million. These transactions were measured at fair market value at the date of the transaction and have been carried out on the same terms as would have applied with unrelated parties. At December 31, 2014, the 7.25% senior notes are included in long-term debt in the Company’s consolidated balance sheets.
The Company sells natural gas to, and purchases steam from, Meridian cogeneration facility (“Meridian”) and other cogeneration facilities owned by a related party. These natural gas sales and steam purchases are related party transactions and have been measured at fair value. For the year ended December 31, 2014, the amount of natural gas sales to Meridian and other cogeneration facilities owned by the related party totalled $78 million (2013 – $55 million). For the year ended December 31, 2014, the amount of steam purchases by the Company from Meridian totalled $25 million (2013 – $17 million). In addition, the Company provides cogeneration and facility support services to Meridian, measured on a cost recovery basis. For the year ended December 31, 2014, the total cost recovery for these services was $9 million (2013 – $9 million).
On December 7, 2010, the Company issued 28.9 million common shares at a price of $24.50 per share for total gross proceeds of $707 million in a private placement to its then principal shareholders, L.F. Management and Investment S.à r.l (formerly L.F. Investments (Barbados) Limited) and Hutchison Whampoa Luxembourg Holdings S.à r.l.
On June 29, 2011, the Company issued 7.4 million common shares at a price of $27.05 per share for total gross proceeds of $200 million in a private placement to its then principal shareholders, L.F. Management and Investment S.à r.l and Hutchison Whampoa Luxembourg Holdings S.à r.l.
Consolidated Financial Statements 43
The Company defines its key management as the officers and executives within the executive department of the Company. The amounts disclosed in the table below are the amounts recognized as an expense during the reporting period related to key management personnel:
| | | | | | | | |
| Compensation of Key Management Personnel | | | | | | |
($ millions) | | 2014 | | | 2013 | |
Short-term employee benefits(1) | | | 18 | | | | 13 | |
Post-employment benefits(2) | | | — | | | | — | |
Stock-based compensation(3) | | | 10 | | | | 10 | |
| | | | | | | | |
| | | 28 | | | | 23 | |
| | | | | | | | |
| (1) | Short-term employee benefits are comprised of salary and benefits earned during the year, plus cash bonuses awarded during the year. Annual bonus awards settled in shares are included in stock-based compensation expense. |
| (2) | Post-employment benefits represent the estimated cost to the Company to provide either a defined benefit pension plan or a defined contribution pension plan, and other post-retirement benefits for the current year of service. Refer to Note 19. |
| (3) | Stock-based compensation expense represents the cost to the Company for participation in share-based payment plans. Refer to Note 18. |
| Note 22 | Financial Instruments and Risk Management |
Financial Instruments
The Company’s financial instruments include cash and cash equivalents, accounts receivable, contribution receivable, accounts payable and accrued liabilities, short-term debt, long-term debt, contribution payable and portions of other assets and other long-term liabilities.
The following table summarizes by measurement classification, derivatives, contingent consideration and hedging instruments that are carried at fair value in the consolidated balance sheets:
| | | | | | | | |
| Financial Instruments at Fair Value | | | | | | |
($ millions) | | December 31, 2014 | | | December 31, 2013 | |
Commodity contracts - fair value through profit or loss | | | | | | | | |
Natural gas(1) | | | (5 | ) | | | 32 | |
Crude oil(2) | | | 4 | | | | 41 | |
Foreign currency contracts - FVTPL | | | | | | | | |
Foreign currency forwards | | | (1 | ) | | | — | |
Other assets - FVTPL | | | 2 | | | | 2 | |
Contingent consideration | | | (40 | ) | | | (60 | ) |
Hedging instruments(3) | | | | | | | | |
Derivatives designated as a cash flow hedge(4) | | | — | | | | 37 | |
Hedge of net investment(5) | | | (353 | ) | | | (93 | ) |
| | | | | | | | |
| | | (393 | ) | | | (41 | ) |
| | | | | | | | |
| (1) | Natural gas contracts include a $12 million decrease at December 31, 2014 ( $27 million increase at December 31, 2013) to the fair value of held-for-trading inventory, recognized in the consolidated balance sheets, related to third party physical purchase and sale contracts for natural gas held in storage. Total fair value of the related natural gas storage inventory at December 31, 2014 was $87 million (December 31, 2013—$124 million). |
| (2) | Crude oil contracts include a $21 million decrease as at December 31, 2014 ( $49 million increase at December 31, 2013) to the fair value of held-for-trading inventory, recognized in the consolidated balance sheets, related to third party crude oil physical purchase and sale contracts. Total fair value of the related crude oil inventory at December 31, 2014 was $199 million (December 31, 2013—$297 million) |
| (3) | Hedging instruments are presented net of tax. |
| (4) | Forward starting swaps previously designated as a cash flow hedge were discontinued during the first quarter of 2014. |
| (5) | Represents the translation of the Company’s U. S. denominated long-term debt designated as a hedge of the Company’s net investment in its U.S. refining operations. |
The Company’s other financial instruments that are not related to derivatives, contingent consideration or hedging activities are included in cash and cash equivalents, accounts receivable, contribution receivable, accounts payable and accrued liabilities, short-term debt, long-term debt, other long-term liabilities and contribution payable. These financial instruments are classified as loans and receivables or other financial liabilities and are carried at amortized cost. Excluding long-term debt, the carrying values of these financial instruments approximate their fair values.
Consolidated Financial Statements 44
The fair value of long-term debt represents the present value of future cash flows associated with the debt. Market information, such as treasury rates and credit spreads, are used to determine the appropriate discount rates. These fair value determinations are compared to quotes received from financial institutions to ensure reasonability. The estimated fair value of long-term debt at December 31, 2014 was $4.8 billion (December 31, 2013 – $4.6 billion).
The Company’s financial assets and liabilities that are recorded at fair value on a recurring basis have been categorized into one of three categories based upon the fair value hierarchy. Level 1 fair value measurements are determined by reference to quoted prices in active markets for identical assets and liabilities. Fair value measurements of assets and liabilities in Level 2 include valuations using inputs other than quoted prices for which all significant outputs are observable, either directly or indirectly. Level 3 fair value measurements are based on inputs that are unobservable and significant to the overall fair value measurement.
The estimation of the fair value of commodity derivatives and held-for-trading inventories incorporates exit prices and adjustments for quality and location. The estimation of the fair value of interest rate and foreign currency derivatives incorporates forward market prices, which are compared to quotes received from financial institutions to ensure reasonability. The estimation of the fair value of the net investment hedge incorporates foreign exchange rates and market interest rates from financial institutions. All financial assets and liabilities are classified as Level 2 measurements with the exception of contingent consideration payments. During the year ended December 31, 2014, there were no transfers between Level 1 and Level 2 fair value measurements, and no transfers into and out of Level 3 fair value measurements.
Contingent consideration payments, based on the average differential between heavy and synthetic crude oil prices, are classified as Level 3 fair value measurements and included in accounts payable and accrued liabilities and other long-term liabilities. The fair value of the contingent consideration is determined through forecasts of synthetic crude oil volumes, crude oil prices and forward price differentials deemed specific to the Company’s Upgrader.
A reconciliation of changes in the fair value of contingent consideration payments is provided below:
| | | | | | | | |
| Contingent consideration payments | | | |
($ millions) | | 2014 | | | 2013 | |
Beginning of year | | | 60 | | | | 105 | |
Accretion(note 14) | | | 1 | | | | 7 | |
Upside interest payment | | | (32 | ) | | | (25 | ) |
Increase (decrease) on revaluation(1) | | | 11 | | | | (27 | ) |
| | | | | | | | |
End of year | | | 40 | | | | 60 | |
| | | | | | | | |
Expected to be incurred within 1 year | | | 40 | | | | 29 | |
Expected to be incurred beyond 1 year(note 15) | | | — | | | | 31 | |
| (1) | Revaluation of the contingent consideration liability is recorded in other – net in the consolidated statements of income. |
Risk Management Overview
The Company is exposed to risks related to the volatility of commodity prices, foreign exchange rates and interest rates. It is also exposed to financial risks related to liquidity and credit and contract risks. In certain instances, the Company uses derivative instruments to manage the Company’s exposure to these risks. The Company employs risk management strategies and policies to ensure that any exposures to risk are in compliance with the Company’s business objectives and risk tolerance levels.
Responsibility for risk management is held by the Company’s Board of Directors and is implemented and monitored by senior management within the Company.
| | i) | Commodity Price Risk Management |
In certain instances, the Company uses derivative commodity instruments to manage exposure to price volatility on a portion of its oil and gas production and firm commitments for the purchase or sale of crude oil and natural gas.
The Company’s results will also be impacted by a decrease in the price of crude oil inventory. The Company has crude oil inventories that are feedstock, held at terminals or part of the in-process inventories at its refineries and at offshore sites. The Company also has natural gas inventory in storage that could have an impact on earnings based on changes in natural gas prices. These inventories are subject to a lower of cost or net realizable value test on a monthly basis.
Consolidated Financial Statements 45
| | ii) | Foreign Exchange Risk Management |
The Company’s results are affected by the exchange rates between various currencies, including the Canadian and U.S. dollar. The majority of the Company’s revenues are received in U.S. dollars or from the sale of oil and gas commodities that receive prices determined by reference to U.S. benchmark prices. An increase in the value of the Canadian dollar relative to the U.S. dollar will decrease the revenues received from the sale of oil and gas commodities. Correspondingly, a decrease in the value of the Canadian dollar relative to the U.S. dollar will increase the revenues received from the sale of oil and gas commodities. The majority of the Company’s expenditures are in Canadian dollars. The Company enters into short-dated foreign exchange contracts to fix the exchange rate for conversion of U.S. revenue dollars to hedge against these fluctuations and to mitigate its exposure to foreign exchange risk.
A change in the value of the Canadian dollar against the U.S. dollar will also result in an increase or decrease in the Company’s U.S. dollar denominated debt, as expressed in Canadian dollars, as well as the related finance expense. In order to mitigate the Company’s exposure to long-term debt affected by the U.S./Canadian dollar exchange rate, the Company may enter into cash flow hedges using cross currency debt swap arrangements. In addition, a portion of the Company’s U.S. dollar denominated debt has been designated as a hedge of a net investment in a foreign operation that has a U.S. dollar functional currency. The unrealized foreign exchange gain related to this hedge is recorded in OCI.
At December 31, 2014, the Company had designated U.S. $2.9 billion denominated debt as a hedge of the Company’s net investment in its U.S. refining operations (December 31, 2013 – U.S. $3.2 billion). For the year ended December 31, 2014, the unrealized loss arising from the translation of the debt was $260 million (2013 – unrealized loss of $180 million), net of tax of $39 million (2013 – $27 million), which was recorded in hedge of net investment within OCI.
| | iii) | Interest Rate Risk Management |
Interest rate risk is the impact of fluctuating interest rates on earnings, cash flows and valuations. To mitigate risk related to interest rates, the Company may enter into fair value hedges using interest rate swaps. At December 31, 2014, the balance in long-term debt related to deferred gains resulting from unwound interest rate swaps that had previously been designated as a fair value hedge was $26 million (December 31, 2013 – $50 million). The amortization of the accrued gain upon terminating the interest rate swaps resulted in an offset to finance expenses of $24 million for the year ended December 31, 2014 (2013 – $22 million).
During the first quarter of 2014, the Company discontinued its cash flow hedge with respect to the forward starting interest rate swaps. These forward interest rate swaps were settled and derecognized. Accordingly, the accrued gain in other reserves—hedging, within the consolidated statement of changes in shareholders’ equity, is being amortized into net earnings over the remaining life of the underlying long-term debt to which the hedging relationship was originally designated. The amortization period is ten years.
At December 31, 2014, the balance in other reserves related to the accrued gain from unwound forward starting interest rate swaps designated as a cash flow hedge was $23 million (December 31, 2013 – $37 million), net of tax of $8 million (December 31, 2013 – net of tax of $13 million). The amortization of the accrued gain upon settling the interest rate swaps resulted in an addition to finance income of $3 million for the year ended December 31, 2014 (2013 – nil).
| | iv) | Earnings Impact of Market Risk Management Contracts |
The gains (losses) recognized on risk management positions for the years ended December 31, 2014 and 2013 are set out below:
| | | | | | | | | | | | | | | | |
| | | 2014 | |
Earnings Impact ($ millions) | | Marketing and
Other | | | Purchases of Crude
Oil and Products | | | Other –Net | | | Net Foreign
Exchange Gains
(Losses) | |
Commodity Price | | | | | | | | | | | | | | | | |
Natural gas | | | (37 | ) | | | — | | | | — | | | | — | |
Crude oil | | | (37 | ) | | | — | | | | — | | | | — | |
| | | | | | | | | | | | | | | | |
| | | (74 | ) | | | — | | | | — | | | | — | |
| | | | | | | | | | | | | | | | |
Foreign Currency | | | | | | | | | | | | | | | | |
Foreign currency forwards(1) | | | — | | | | — | | | | (1 | ) | | | (47 | ) |
| | | | | | | | | | | | | | | | |
| | | (74 | ) | | | — | | | | (1 | ) | | | (47 | ) |
| | | | | | | | | | | | | | | | |
| (1) | Unrealized gains or losses from short-dated foreign currency forwards are included in other – net, while realized gains or losses are included in net foreign exchange gains in the consolidated statements of income. |
Consolidated Financial Statements 46
| | | | | | | | | | | | | | | | |
| | | 2013 | |
Earnings Impact ($ millions) | | Marketing and
Other | | | Purchases of Crude
Oil and Products | | | Other –Net | | | Net Foreign
Exchange Gains
(Losses) | |
Commodity Price | | | | | | | | | | | | | | | | |
Natural gas | | | 16 | | | | 12 | | | | 1 | | | | — | |
Crude oil | | | (9 | ) | | | — | | | | — | | | | — | |
| | | | | | | | | | | | | | | | |
| | | 7 | | | | 12 | | | | 1 | | | | — | |
| | | | | | | | | | | | | | | | |
Foreign Currency | | | | | | | | | | | | | | | | |
Foreign currency forwards(1) | | | — | | | | — | | | | 1 | | | | (27 | ) |
| | | | | | | | | | | | | | | | |
| | | 7 | | | | 12 | | | | 2 | | | | (27 | ) |
| | | | | | | | | | | | | | | | |
| (1) | Unrealized gains or losses from short-dated foreign currency forwards are included in other – net, while realized gains or losses are included in net foreign exchange gains in the consolidated statements of income. |
Offsetting Financial Assets and Liabilities
The tables below outline the financial assets and financial liabilities that are subject to set-off rights and related arrangements, and the effect of those rights and arrangements on the consolidated balance sheets:
| | | | | | | | | | | | |
| | | As at December 31, 2014 | |
Offsetting Financial Assets and Liabilities ($ millions) | | Gross Amount | | | Amount Offset | | | Net Amount | |
Financial Assets | | | | | | | | | | | | |
Financial derivatives | | | 264 | | | | (222 | ) | | | 42 | |
Normal purchase and sale agreements | | | 1,078 | | | | (616 | ) | | | 462 | |
| | | | | | | | | | | | |
| | | 1,342 | | | | (838 | ) | | | 504 | |
| | | | | | | | | | | | |
Financial Liabilities | | | | | | | | | | | | |
Financial derivatives | | | (17 | ) | | | 11 | | | | (6 | ) |
Normal purchase and sale agreements | | | (588 | ) | | | 219 | | | | (369 | ) |
| | | | | | | | | | | | |
| | | (605 | ) | | | 230 | | | | (375 | ) |
| | | | | | | | | | | | |
| | | | | | | | | | | | |
| | | As at December 31, 2013 | |
Offsetting Financial Assets and Liabilities ($ millions) | | Gross Amount | | | Amount Offset | | | Net Amount | |
Financial Assets | | | | | | | | |
Financial derivatives | | | 22 | | | | (5 | ) | | | 17 | |
Normal purchase and sale agreements | | | 551 | | | | (170 | ) | | | 381 | |
| | | | | | | | | | | | |
| | | 573 | | | | (175 | ) | | | 398 | |
| | | | | | | | | | | | |
Financial Liabilities | | | | | | | | |
Financial derivatives | | | (293 | ) | | | 271 | | | | (22 | ) |
Normal purchase and sale agreements | | | (778 | ) | | | 284 | | | | (494 | ) |
| | | | | | | | | | | | |
| | | (1,071 | ) | | | 555 | | | | (516 | ) |
| | | | | | | | | | | | |
Consolidated Financial Statements 47
Market Risk Sensitivity Analysis
A sensitivity analysis for commodities, foreign currency exchange and interest rate risks has been calculated by increasing or decreasing commodity prices, foreign currency exchange rates or interest rates, as appropriate. These sensitivities represent the increase or decrease in earnings before income taxes resulting from changing the relevant rates, with all other variables held constant. These sensitivities have only been applied to financial instruments held at fair value. The Company’s process for determining these sensitivities has not changed during the year.
| | | | | | | | |
| Commodity Price Risk(1) | | | | | | |
($ millions) | | 10% price increase | | | 10% price decrease | |
Crude oil price | | | 32 | | | | (32 | ) |
Natural gas price | | | (11 | ) | | | 11 | |
| | |
Foreign Exchange Rate(2) ($ millions) | | Canadian dollar
$0.01 increase | | | Canadian dollar
$0.01 decrease | |
U.S. dollar per Canadian dollar | | | 2 | | | | (2 | ) |
| (1) | Based on average crude oil and natural gas market prices as at December 31, 2014. |
| (2) | Based on the U.S./Canadian dollar exchange rate as at December 31, 2014. |
| | i) | Liquidity Risk Management |
Liquidity risk is the risk that the Company will not be able to meet its financial obligations as they become due. Liquidity risk also includes the risk of not being able to liquidate assets in a timely manner at a reasonable price. The Company’s processes for managing liquidity risk include ensuring, to the extent possible, that it has access to multiple sources of capital including cash and cash equivalents, cash from operating activities, undrawn credit facilities and capability to raise capital from various debt capital markets under its shelf prospectuses. The Company prepares annual capital expenditure budgets, which are monitored and updated as required. In addition, the Company requires authorizations for expenditures on projects, which assists with the management of capital.
Since the Company operates in the upstream oil and gas industry, it requires significant cash to fund capital programs necessary to maintain or increase production, develop reserves, acquire strategic oil and gas assets, repay maturing debt and pay dividends. The Company’s upstream capital programs are funded principally by cash provided from operating activities and issuances of debt and equity. During times of low oil and gas prices, a portion of capital programs can generally be deferred. However, due to the long cycle times and the importance to future cash flow of maintaining the Company’s production, it may be necessary to utilize alternative sources of capital to continue the Company’s strategic investment plan during periods of low commodity prices. As a result, the Company frequently evaluates the options available with respect to sources of short and long-term capital resources. Occasionally, the Company will economically hedge a portion of its production to protect cash flow in the event of commodity price declines.
The Company had the following available credit facilities as at December 31, 2014:
| | | | | | | | |
| Credit Facilities | | | | | | |
($ millions) | | Available | | | Unused | |
Operating facilities(1)(note 11) | | | 645 | | | | 457 | |
Syndicated bank facilities(note 13) | | | 3,230 | | | | 2,335 | |
| | | | | | | | |
| | | 3,875 | | | | 2,792 | |
| | | | | | | | |
| (1) | Consists of demand credit facilities. |
In addition to the credit facilities listed above, the Company had unused capacity under the universal short form base shelf prospectus filed in Canada of $2.8 billion and unused capacity under the universal short form base shelf prospectus filed in the United States of U.S. $2.3 billion. The ability of the Company to raise additional capital utilizing these prospectuses is dependent on market conditions.
The Company believes it has sufficient funding through the use of these facilities and access to the capital markets to meet its future capital requirements.
Consolidated Financial Statements 48
The following are the contractual maturities of the Company’s financial liabilities as at December 31, 2014:
| | | | | | | | | | | | | | | | | | | | | | | | |
| Contractual Maturities of Financial Liabilities | | | | | | | | | | | | | | | | | | |
($ millions) | | 2015 | | | 2016 | | | 2017 | | | 2018 | | | 2019 | | | Thereafter | |
Accounts payable and accrued liabilities | | | 2,989 | | | | — | | | | — | | | | — | | | | — | | | | — | |
Other long-term liabilities | | | 31 | | | | 32 | | | | 27 | | | | 24 | | | | 21 | | | | 160 | |
Long-term debt | | | 537 | | | | 464 | | | | 562 | | | | 193 | | | | 1,400 | | | | 3,065 | |
The Company’s contribution payable pursuant to the joint arrangement with BP is payable between December 31, 2014 and December 31, 2015, with the final balance due and payable by December 31, 2015. See Note 26 for amendments to these repayment terms.
Refer to Note 20 for additional contractual obligations.
| | ii) | Credit and Contract Risk Management |
Credit and contract risk represent the financial loss that the Company would suffer if a counterparty in a transaction fails to meet its obligations in accordance with the agreed terms. The Company actively manages its exposure to credit and contract execution risk from both a customer and a supplier perspective. The Company’s accounts receivables are broad based with customers in the energy industry and midstream and end user segments and are subject to normal industry risks. The Company’s policy to mitigate credit risk includes granting credit limits consistent with the financial strength of the counterparties and customers, requiring financial assurances as deemed necessary, reducing the amount and duration of credit exposures and close monitoring of all accounts. The Company did not have any external customers that constituted more than 10% of gross revenues during the years ended December 31, 2014 or December 31, 2013, with the exception of the Company’s joint venture partner BP, relating to revenues from the BP-Husky Toledo Refinery.
Cash and cash equivalents include cash bank balances and short-term deposits maturing in less than three months. The Company manages the credit exposure related to short-term investments by monitoring exposures daily on a per issuer basis relative to predefined investment limits.
The carrying amounts of cash and cash equivalents, accounts receivable and contribution receivable represent the Company’s maximum credit exposure.
The Company’s accounts receivable was aged as follows at December 31, 2014:
| | | | |
| Accounts Receivable Aging | | | |
($ millions) | | December 31, 2014 | |
Current | | | 1,224 | |
Past due (1 – 30 days) | | | 85 | |
Past due (31 – 60 days) | | | 11 | |
Past due (61 – 90 days) | | | 7 | |
Past due (more than 90 days) | | | 26 | |
Allowance for doubtful accounts | | | (29 | ) |
| | | | |
| | | 1,324 | |
| | | | |
The Company recognizes a valuation allowance when collection of accounts receivable is in doubt. Accounts receivable are impaired directly when collection of accounts receivable is no longer expected. For the year ended December 31, 2014, the Company impaired $1 million (2013 – $1 million) of uncollectible receivables.
Consolidated Financial Statements 49
| Note 23 | Capital Disclosures |
The Company’s objectives when managing capital are to maintain a flexible capital structure, which optimizes the cost of capital at acceptable risk, and to maintain investor, creditor and market confidence to sustain the future development of the business. The Company manages its capital structure and makes adjustments as economic conditions and the risk characteristics of its underlying assets change. The Company considers its capital structure to include shareholders’ equity and debt which, was $25.9 billion as at December 31, 2014 (December 31, 2013 – $24.2 billion). To maintain or adjust the capital structure, the Company may, from time to time, issue shares, raise debt and/or adjust its capital spending to manage its current and projected debt levels.
The Company monitors capital based on the current and projected ratios of debt to cash flow (defined as total debt divided by cash flow – operating activities plus non-cash charges before settlement of asset retirement obligations, income taxes paid, interest received and changes in non-cash working capital) and debt to capital employed (defined as total debt divided by total debt and shareholders’ equity). The Company’s objective is to maintain a debt to capital employed target of less than 25% and a debt to cash flow ratio of less than 1.5 times. At December 31, 2014, debt to capital employed was 20% (December 31, 2013 – 17%) which was below the long-term range, providing the financial flexibility to fund the Company’s capital program and profitable growth opportunities. At December 31, 2014, debt to cash flow was 1.0 times (December 31, 2013 – 0.8 times). The ratio may increase at certain times as a result of capital spending. To facilitate the management of this ratio, the Company prepares annual budgets, which are updated depending on varying factors such as general market conditions and successful capital deployment. The annual budget is approved by the Board of Directors.
The Company’s share capital is not subject to external restrictions; however, the syndicated credit facilities include a debt to cash flow covenant. The Company was in compliance with these covenants at December 31, 2014.
There were no changes in the Company’s approach to capital management from the previous year.
The Company has government assistance programs in place where it receives funding based on ethanol production and sales from the Lloydminster and Minnedosa ethanol plants from the Department of Natural Resources and the Government of Manitoba. Applications for funding are submitted quarterly. During 2014, the Company received $33 million (2013 – $26 million) under these programs. The grants are accrued for operational purposes and have been recorded as revenues in the consolidated statements of income. The programs will expire in 2015.
Consolidated Financial Statements 50
| Note 25 | Employee Salaries and Benefit Expenses |
The total compensation expense recognized in purchases of crude oil and products and selling, general and administrative expenses in the consolidated statements of income for the year ended December 31, 2014 was $734 million (2013 – $778 million) as follows:
| | | | | | | | |
| Compensation of Employees | | | | | | |
($ millions) | | 2014 | | | 2013 | |
Short-term employee benefits(1) | | | 786 | | | | 711 | |
Post-employment benefits(2) | | | 55 | | | | 48 | |
Stock-based compensation(3) | | | (17 | ) | | | 105 | |
| | | | | | | | |
| | | 824 | | | | 864 | |
Less: capitalized portion | | | (90 | ) | | | (86 | ) |
| | | | | | | | |
| | | 734 | | | | 778 | |
| | | | | | | | |
| (1) | Short-term employee benefits are comprised of salary and benefits earned during the year, plus cash bonuses awarded during the year. Annual bonus awards settled in shares are included in stock-based compensation expense. |
| (2) | Post-employment benefits represent the estimated cost to the Company to provide either a defined benefit pension plan or a defined contribution pension plan, and other post-retirement benefits for the current year of service. Refer to Note 19. |
| (3) | Stock-based compensation expense (recovery) represents the cost to the Company for participation in share-based payment plans. Refer to Note 18. |
Subsequent to December 31, 2014, the Company amended the terms of repayment of the Company’s contribution payable with BP-Husky Refining LLC. In accordance with the amendment, U.S. $1 billion of the net contribution payable was paid on February 2, 2015. As a result of prepayment, the accretion rate has been reduced from 6 percent to 2.5 percent for the future term of the agreement. The remaining amount of approximately U.S. $300 million will be paid by way of funding all capital contributions of the BP- Husky Refining LLC joint operation with full payment required on or before December 31, 2017.
Consolidated Financial Statements 51
Document C
Form 40-F
Management’s Discussion and Analysis
MANAGEMENT’S DISCUSSION AND ANALYSIS
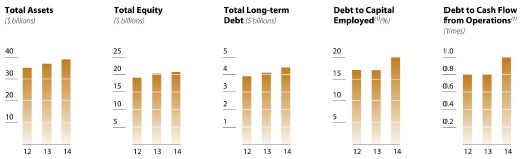
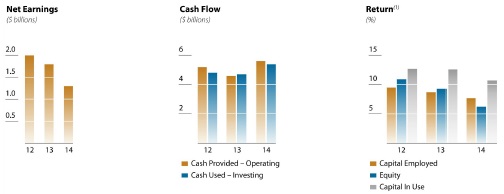
| (1) | Debt to capital employed, debt to cash flow, return on capital employed, return on equity and return on capital in use constitute non-GAAP measures. (Refer to Section 11.3) |
| 1.3 | Total Shareholder Returns |
The following graph shows the total shareholder returns compared with the Standard and Poor’s (“S&P”) and the Toronto Stock Exchange (“TSX”) energy and composite indices.
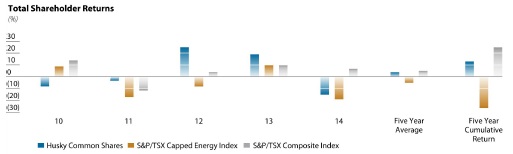
|
Management’s Discussion and Analysis 2014 1 |
| 1.4 | Selected Annual Information |
| | | | | | | | | | | | |
($ millions, except where indicated) | | 2014 | | | 2013 | | | 2012 | |
Gross revenues | | | 25,122 | | | | 24,181 | | | | 22,948 | |
Net earnings (loss) by segment | | | | | | | | | | | | |
Upstream | | | 1,106 | | | | 1,244 | | | | 1,322 | |
Downstream | | | 363 | | | | 830 | | | | 893 | |
Corporate | | | (211 | ) | | | (245 | ) | | | (193 | ) |
| | | | | | | | | | | | |
Net earnings | | | 1,258 | | | | 1,829 | | | | 2,022 | |
| | | | | | | | | | | | |
Net earnings per share – basic | | | 1.26 | | | | 1.85 | | | | 2.06 | |
Net earnings per share – diluted | | | 1.20 | | | | 1.85 | | | | 2.06 | |
Ordinary dividends per common share | | | 1.20 | | | | 1.20 | | | | 1.20 | |
Dividends per cumulative redeemable preferred share, series 1 | | | 1.11 | | | | 1.11 | | | | 1.11 | |
Cash flow from operations(1) | | | 5,535 | | | | 5,222 | | | | 5,010 | |
Total assets | | | 38,848 | | | | 36,904 | | | | 35,161 | |
Other long-term liabilities(2) | | | 585 | | | | 271 | | | | 328 | |
Long-term debt including current portion | | | 4,397 | | | | 4,119 | | | | 3,918 | |
Total non-current liabilities | | | 12,464 | | | | 12,663 | | | | 12,908 | |
Commercial paper | | | 895 | | | | — | | | | — | |
Cash and cash equivalents | | | 1,267 | | | | 1,097 | | | | 2,025 | |
Return on equity(percent)(1)(3) | | | 6.2 | | | | 9.3 | | | | 10.9 | |
Return on capital in use (percent)(1)(4) | | | 10.7 | | | | 12.6 | | | | 12.7 | |
Return on capital employed(percent)(1)(5) | | | 7.7 | | | | 8.7 | | | | 9.5 | |
| | | | | | | | | | | | |
| (1) | Cash flow from operations and financial ratios constitute non-GAAP measures. (Refer to Section 11.3) |
| (2) | As at December 31, 2014, 2013 or 2012, the Company did not have long-term financial liabilities. |
| (3) | Return on equity equals net earnings divided by the two-year average shareholder’s equity. (Refer to Section 11.3) |
| (4) | Return on capital in use for the years ended December 31, 2014 and 2013 was adjusted for after-tax impairment charges on property, plant and equipment of $622 million and $204 million, respectively. Return on capital in use, including impairment charges, for the years ended December 31, 2014 and 2013 was 7.5 percent and 11.3 percent, respectively. (Refer to Section 11.3) |
| (5) | Return on capital employed for the years ended December 31, 2014 and 2013 was adjusted for after-tax impairment charges on property, plant and equipment of $622 million and $204 million, respectively. Return on capital employed, including impairment charges, for the years ended December 31, 2014 and 2013 was 5.3 percent and 7.9 percent respectively. (Refer to Section 11.3) |
| 2.0 | Husky Business Overview |
Husky Energy Inc. (“Husky” or the “Company”) is one of Canada’s largest integrated energy companies and is based in Calgary, Alberta. The Company’s common shares are listed on the Toronto Stock Exchange (“TSX”) under the symbol “HSE” and the Cumulative Redeemable Preferred Shares, Series 1 and Cumulative Redeemable Preferred Shares, Series 3 are listed under the symbols, “HSE.PR.A” and “HSE.PR.C”, respectively. The Company operates in Western Canada, the United States, the Asia Pacific Region and the Atlantic Region with Upstream and Downstream business segments. Husky’s balanced growth strategy focuses on consistent execution, disciplined financial management and safe and reliable operations.
Upstream includes exploration for, and development and production of, crude oil, bitumen, natural gas and natural gas liquids (“NGL”) (Exploration and Production) and marketing of the Company’s and other producers’ crude oil, natural gas, NGL, sulphur and petroleum coke, pipeline transportation and blending of crude oil and natural gas and storage of crude oil, diluent and natural gas (Infrastructure and Marketing). The Company’s Upstream operations are located primarily in Western Canada, offshore East Coast of Canada, offshore China and offshore Indonesia.
Profile and highlights of the Upstream segment include:
| • | | Large base of crude oil producing properties in Western Canada that continue to produce with existing technology and have responded well to the application of increasingly sophisticated techniques, such as horizontal drilling. Enhanced oil recovery (“EOR”) techniques, including thermal in-situ recovery methods, have been extensively used in the mature Western Canada Sedimentary Basin to increase recovery rates and to stabilize decline rates of light and heavy crude oil. EOR techniques, such as Alkaline Surfactant Polymer, are being field tested and advanced, while techniques that have been in practice for several decades continue to be optimized; |
| • | | Large position in Western Canada oil and liquids-rich natural gas resource plays of approximately 1,800,000 net acres; |
|
Management’s Discussion and Analysis 2014 2 |
| • | | Heavy oil thermal portfolio with production of approximately 44,000 bbls/day in 2014 increasing to approximately 80,000 bbls/ day by the end of 2016 with planned first production in the third quarter of 2015 from the 10,000 bbls/day Rush Lake thermal project and planned first production in the second half of 2016 from the two 10,000 bbls/day Edam East and Vawn thermal development projects and the 3,500 bbls/day Edam West thermal development project; |
| • | | Expertise and experience exploring and developing the natural gas potential in the Alberta Deep Basin, Foothills and northwest plains of Alberta and British Columbia; |
| • | | Sunrise Energy Project, a multiple stage in-situ oil sands development, with Phase 1 expected to commence production towards the end of the first quarter of 2015 ramping up to approximately 60,000 bbls/day (30,000 bbls/day net Husky share) around the end of 2016. Sunrise will use proven steam-assisted gravity drainage (“SAGD”) technology, keeping site disturbance to a minimum. Regulatory approval is in place to expand the project to 200,000 bbls/day (100,000 bbls/day net Husky share); |
| • | | In addition to Sunrise, Husky has an extensive portfolio of undeveloped oil sands leases, encompassing in excess of 550,000 acres in northern Alberta; |
| • | | Offshore China includes a production interest in the Wenchang oil field and the significant natural gas discoveries at the Liwan 3-1, Liuhua 34-2 and Liuhua 29-1 fields within Block 29/26 (the “Liwan Gas Project”). First production was achieved from the Liwan 3-1 gas field in March 2014 and from the Liuhua 34-2 gas field in December 2014; |
| • | | Husky has a 40 percent interest in the Madura Strait Block covering approximately 622,000 acres, offshore East Java, south of Madura Island, Indonesia, and is focused on the development of the BD, MDA and MBH fields and five discovered natural gas fields; |
| • | | Husky has a 100 percent interest in the rights to the Anugerah exploration block covering approximately 2,030,000 acres, which is located in the East Java Basin, Indonesia approximately 150 kilometres east of the Madura Straight block; |
| • | | Husky and its joint venture partner CPC Corporation have rights to an exploration block in the South China Sea covering approximately 10,000 square kilometres located 100 kilometres southwest of the island of Taiwan. Husky holds a 75 percent working interest during exploration, while CPC Corporation has the right to participate in the development program up to a 50 percent interest; |
| • | | Husky is the operator of the White Rose field with a 72.5 percent working interest in the core field and a 68.875 percent working interest in satellite tiebacks, including the North Amethyst, West White Rose and South White Rose extensions. Development continued at White Rose and its three satellite extensions in 2014. Husky has a 13 percent non-operated interest in the Terra Nova oil field. The offshore exploration and development program in the Atlantic Region is focused on the Jeanne d’Arc Basin and the Flemish Pass Basin; |
| • | | Husky has a 35 percent interest in each of the three Flemish Pass Basin discoveries: Bay Du Nord, Mizzen and Harpoon; |
| • | | Extensive integrated heavy oil pipeline systems in the Lloydminster producing region; and |
| • | | The Infrastructure and Marketing business manages the sale and transportation of the Company’s Upstream and Downstream production and third-party commodity trading volumes through access to capacity on third-party pipelines and storage facilities in both Canada and the United States and natural gas storage of 29 bcf, owned and leased. |
Downstream includes upgrading of heavy crude oil feedstock into synthetic crude oil (Upgrading), refining in Canada of crude oil, marketing of refined petroleum products including gasoline, diesel, ethanol blended fuels, asphalt and ancillary products and production of ethanol (Canadian Refined Products) and refining in the U.S. of primarily crude oil to produce and market gasoline, jet fuel and diesel fuels that meet U.S. clean fuels standards (U.S. Refining and Marketing).
Profile and highlights of the Downstream segment include:
| • | | Heavy oil upgrading facility located in the Lloydminster, Saskatchewan heavy oil producing region with a throughput capacity of 82 mbbls/day; |
| • | | A refinery at Lima, Ohio with a gross crude oil throughput capacity of 160 mbbls/day and a 50 percent interest in the BP-Husky Refinery in Toledo, Ohio with a name plate capacity of 160 mbbls/day and operating capacity of 135 - 145 mbbls/day on its current crude slate; |
| • | | Refinery at Prince George, British Columbia with throughput capacity of 12 mbbls/day producing low sulphur gasoline and ultra low sulphur diesel; |
| • | | Largest marketer of paving asphalt in Western Canada, with a 29 mbbls/day capacity asphalt refinery located at Lloydminster, Alberta integrated with the local heavy oil production, transportation and upgrading infrastructure; |
| • | | Largest producer of ethanol in Western Canada with a combined 260 million litre per year of capacity at plants located in Lloydminster, Saskatchewan and Minnedosa, Manitoba; and |
| • | | Major regional motor fuel marketer with 490 retail marketing locations as at December 31, 2014, including bulk plants and travel centres with strategic land positions in Western Canada and Ontario. |
|
Management’s Discussion and Analysis 2014 3 |
| 3.0 | The 2014 Business Environment |
Husky’s operations are significantly influenced by domestic and international business environment factors. The global crude oil and liquid fuel industry is impacted by various factors, including those encountered during 2014, that are anticipated to continue to impact the industry to varying degrees into 2015 and beyond. Business factors impacting Husky’s industry during 2014 include, but are not limited, to the following:
| • | | Pricing benchmarks for crude oil and natural gas and underlying market supply and demand drivers; |
| • | | Industry advancement in alternative and improved extraction methods have rapidly evolved North American and international on-shore and offshore activity; |
| • | | Growing domestic production of natural gas and crude oil continues to reshape the U.S. energy economy, with U.S. crude oil production averaging an estimated 9.2 million bbls/day at the end of 2014, approaching the historical high achieved in 1970 of 9.6 million bbls/day; |
| • | | Accelerated growth of global crude oil production and inventory supplies relative to demand led to a sharp decline in key benchmarks such as West Texas Intermediate (“WTI”) and Brent in the second half of 2014; |
| • | | Increased transportation of Western Canadian crude oil by rail which narrowed differentials relative to WTI and other key benchmarks; |
| • | | Expected continued production growth from the Western Canadian oil sands; |
| • | | Economic conditions remain uncertain as national indebtedness among countries continues to impact global GDP growth; |
| • | | Continued global economic uncertainty has led to a tightening of investment from historical norms, creating greater competition among companies within capital markets; |
| • | | Increasing globalization, larger projects with major partners and economies of scale; |
| • | | Strong demand for natural gas in Asian markets has led to robust gas pricing in the region; |
| • | | Domestic and international political, regulatory and tax system changes; and |
| • | | A continuing emphasis on environmental, health and safety, enterprise risk management, resource sustainability and corporate social responsibility. |
Major business factors are considered in the formulation of Husky’s short and longer term business strategy.
The Company is exposed to a number of risks inherent to the exploration, development, production, marketing, transportation, storage and sale of crude oil, liquids-rich natural gas and related products. For a discussion on Risk and Risk Management, see Section 7.0 and the 2014 Annual Information Form.
Commodity prices, foreign exchange rates and refining crack spreads are some of the most significant factors that affect the results of Husky’s operations.
| | | | | | | | | | |
Average Benchmarks | | | | 2014 | | | 2013 | |
WTI crude oil(1) | | (U.S. $/bbl) | | | 93.00 | | | | 97.97 | |
Brent crude oil(2) | | (U.S. $/bbl) | | | 98.99 | | | | 107.91 | |
Canadian light crude 0.3% sulphur | | ($/bbl) | | | 85.08 | | | | 93.85 | |
Western Canada Select @ Hardisty(3) | | (U.S. $/bbl) | | | 73.60 | | | | 72.77 | |
Lloyd heavy crude oil @ Lloydminster | | ($/bbl) | | | 73.28 | | | | 64.41 | |
NYMEX natural gas(4) | | (U.S. $/mmbtu) | | | 4.42 | | | | 3.65 | |
NIT natural gas | | ($/GJ) | | | 4.19 | | | | 3.00 | |
WTI/Lloyd crude blend differential | | (U.S. $/bbl) | | | 19.41 | | | | 25.33 | |
New York Harbor 3:2:1 crack spread | | (U.S. $/bbl) | | | 18.61 | | | | 22.21 | |
Chicago 3:2:1 crack spread | | (U.S. $/bbl) | | | 17.28 | | | | 21.30 | |
U.S./Canadian dollar exchange rate | | (U.S. $) | | | 0.906 | | | | 0.971 | |
Canadian Equivalents(5) | | | | | | | | | | |
WTI crude oil | | ($/bbl) | | | 102.65 | | | | 100.90 | |
Brent crude oil | | ($/bbl) | | | 109.26 | | | | 111.13 | |
Western Canada Select @ Hardisty | | ($/bbl) | | | 81.24 | | | | 74.94 | |
WTI/Lloyd crude blend differential | | ($/bbl) | | | 21.42 | | | | 26.08 | |
NYMEX natural gas | | ($/mmbtu) | | | 4.88 | | | | 3.76 | |
| (1) | Prices quoted are near-month contract prices for settlement during the next month. |
| (2) | Quoted Brent prices are dated less than 15 days prior to loading for delivery. |
| (3) | Western Canadian Select is a heavy crude blend primarily based on existing Canadian heavy conventional and bitumen crude oils and is traded at Hardisty, Alberta. Quoted prices are based on the average price during the month. |
| (4) | Prices quoted are average settlement prices for deliveries during the period. |
| (5) | Prices quoted are calculated using U.S. benchmark commodity prices and U.S./Canadian dollar exchange rates. |
|
Management’s Discussion and Analysis 2014 4 |
As an integrated producer, Husky’s profitability is largely determined by realized prices for crude oil and natural gas, marketing margins on committed pipeline capacity and refinery processing margins, as well as the effect of changes in the U.S./Canadian dollar exchange rate. All of Husky’s crude oil production and the majority of its natural gas production receives the prevailing market price. The price realized for crude oil is determined by North American and global factors and is beyond the Company’s control. The price realized for natural gas production from Western Canada is determined primarily by North American fundamentals since virtually all natural gas production in North America is consumed by North American customers, predominantly in the United States. In the Asia Pacific Region, natural gas is sold to specific buyers with long-term contracts. For the Liwan 3-1 gas field, the price is fixed for the initial five years and then will be linked to local benchmark pricing for the years following. For the Liuhua 34-2 field, the price is fixed during the contract delivery period.
The Downstream segment is heavily impacted by the price of crude oil and natural gas, as the largest cost factor in the Downstream segment is crude oil feedstock, a portion of which is heavy crude oil. In the upgrading business segment, heavy crude oil feedstock is processed into light synthetic crude oil. Husky’s U.S. refining operations process a mix of different types of crude oil from various sources, but the mix is primarily light sweet crude oil at the Lima Refinery and approximately 50 percent heavy crude oil feedstock at the BP-Husky Toledo Refinery. The Company’s refined products business in Canada relies primarily on purchased refined products for resale in the retail distribution network. Refined products are acquired, under supply contracts, from other Canadian refiners at rack prices or exchanged with production from the Husky Prince George Refinery.
Crude Oil
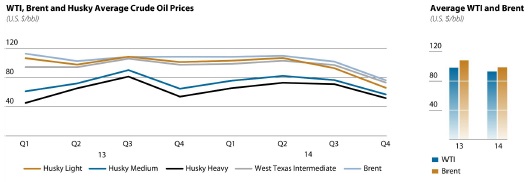
The price Husky receives for production from Western Canada is primarily driven by changes in the price of WTI and discounts or premiums to Western Canadian crude prices, while the majority of the Company’s production in the Atlantic Region and the Asia Pacific Region is referenced to the price of Brent, a light sweet benchmark crude oil produced in the North Sea. The price of WTI ended 2014 at U.S. $53.27/bbl compared to U.S. $98.42/bbl on December 31, 2013 and averaged U.S. $93.00/bbl in 2014 compared to U.S. $97.97/bbl in 2013. The price of Canadian light crude ended 2014 at $51.15/bbl compared to $97.49/bbl on December 31, 2013 and averaged $85.08/bbl in 2014 compared to $93.85/bbl in 2013. The price of Brent ended 2014 at U.S. $54.98/bbl, compared to U.S. $110.28/bbl on December 31, 2013 and averaged U.S. $98.99/bbl in 2014 compared to U.S. $107.91/bbl in 2013.
A portion of Husky’s crude oil production is classified as either heavy crude oil or bitumen, which trades at a discount to light crude oil. In 2014, 56 percent of Husky’s crude oil and NGL production was heavy crude oil or bitumen compared to 54 percent in 2013. The light/heavy crude oil differential averaged U.S. $19.41/bbl or 21 percent of WTI in 2014 compared to U.S. $25.33/bbl or 26 percent of WTI in 2013.
|
Management’s Discussion and Analysis 2014 5 |
Natural Gas
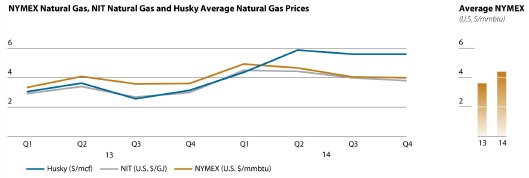
In 2014, 30 percent of Husky’s total oil and gas production was natural gas compared with 27 percent in 2013, reflecting new production from the Liwan Gas Project, partially offset by a shift in investment in Western Canada from dry gas development to higher netback liquids-rich natural gas and crude oil production. The near-month natural gas price quoted on the NYMEX ended 2014 at U.S. $2.89/ mmbtu compared with U.S. $4.23/mmbtu at December 31, 2013. During 2014, the NYMEX near-month contract price of natural gas averaged U.S. $4.42/mmbtu compared with U.S. $3.65/bbl in 2013. The near-month natural gas contract price for NOVA Inventory Transfer (“NIT”), which is a Canadian natural gas benchmark, was $2.64/mmbtu at the end of 2014 compared with $3.73/mmbtu at December 31, 2013. During 2014, the NIT near-month contract price of natural gas averaged $4.19/mmbtu compared to $3.00/mmbtu in 2013.
Foreign Exchange
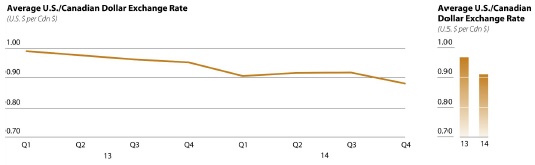
The majority of the Company’s revenues from the sale of oil and gas commodities receive prices determined by reference to U.S. benchmark prices. A decrease in the value of the Canadian dollar relative to the U.S. dollar increases the revenues received from the sale of oil and gas commodities. Correspondingly, an increase in the value of the Canadian dollar relative to the U.S. dollar decreases the revenues received from the sale of oil and gas commodities. The majority of the Company’s long-term debt is denominated in U.S. dollars. A decrease in the value of the Canadian dollar relative to the U.S. dollar increases the principal amount owing on long-term debt at maturity and the associated interest payments. The majority of the Company’s expenditures are in Canadian dollars. In addition, changes in foreign exchange rates impact the translation of U.S. Downstream and international Upstream operations.
The Canadian dollar ended 2014 at U.S. $0.862 on December 31, 2014 compared to U.S. $0.940 on December 31, 2013. In 2014, the Canadian dollar averaged U.S. $0.906, weakening by 7 percent compared with U.S. $0.971 during 2013. Crude oil prices realized by Husky in 2014 benefited from the weakening of the Canadian dollar against the U.S. dollar compared to 2013. In 2014, the price of WTI in U.S. dollars decreased by 5 percent while the price of WTI in Canadian dollars increased by 2 percent when compared to 2013.
|
Management’s Discussion and Analysis 2014 6 |
Refining Crack Spreads
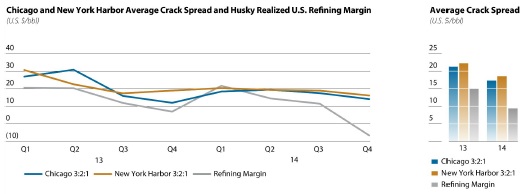
The 3:2:1 refining crack spread is the key indicator for refining margins, as refinery gasoline output is approximately twice the distillate output. This crack spread is equal to the price of two-thirds of a barrel of gasoline plus one-third of a barrel of fuel oil (distillate) less one barrel of crude oil. Market crack spreads are based on quoted near-month contracts for WTI and spot prices for gasoline and diesel and do not necessarily reflect the actual crude oil purchase costs or product configuration of a specific refinery. Each refinery has a unique crack spread depending on several variables. Realized refining margins are affected by the product configuration of each refinery, crude oil feedstock, product slates, transportation costs to benchmark hubs and the time lag between the purchase and delivery of crude oil, which is accounted for on a first in first out (“FIFO”) basis in accordance with International Financial Reporting Standards (“IFRS”).
The New York Harbor 3:2:1 refining crack spread benchmark is calculated as the difference between the price of a barrel of WTI crude oil and the sum of the price of two-thirds of a barrel of reformulated gasoline and the price of one-third of a barrel of heating oil. The Chicago 3:2:1 refining crack spread benchmark is calculated based on WTI, regular unleaded gasoline and ultra low sulphur diesel.
The New York Harbor 3:2:1 refining crack spread averaged U.S. $18.61/bbl in 2014 compared to U.S. $22.21/bbl in 2013, and the Chicago 3:2:1 refining crack spread averaged U.S. $17.28/bbl in 2014 compared to U.S. $21.30/bbl in 2013.
The following table is indicative of the relative annualized effect on pre-tax earnings and net earnings from changes in certain key variables in 2014. The table below shows what the effect would have been on 2014 financial results had the indicated variable increased by the notional amount. The analysis is based on business conditions and production volumes during 2014. Each separate item in the sensitivity analysis shows the effect of an increase in that variable only; all other variables are held constant. While these sensitivities are applicable for the period and magnitude of changes on which they are based, they may not be applicable in other periods, under other economic circumstances or when greater magnitudes of change are occurring.
| | | | | | | | | | | | | | | | | | | | | | |
| | | 2014 | | | | | Effect on Earnings | | | Effect on | |
Sensitivity Analysis | | Average | | | Increase | | before Income Taxes(1) | | | Net Earnings(1) | |
| | | | | | | | ($ millions) | | | ($/share)(2) | | | ($ millions) | | | ($/share)(2) | |
WTI benchmark crude oil price(3)(4) | | | 93.00 | | | U.S. $1.00/bbl | | | 83 | | | | 0.08 | | | | 61 | | | | 0.06 | |
NYMEX benchmark natural gas price(5) | | | 4.42 | | | U.S. $0.20/mmbtu | | | 33 | | | | 0.03 | | | | 24 | | | | 0.02 | |
WTI/Lloyd crude blend differential(6) | | | 19.41 | | | U.S. $1.00/bbl | | | (27 | ) | | | (0.03 | ) | | | (21 | ) | | | (0.02 | ) |
Canadian light oil margins | | | 0.050 | | | Cdn $0.005/litre | | | 14 | | | | 0.01 | | | | 11 | | | | 0.01 | |
Asphalt margins | | | 22.12 | | | Cdn $1.00/bbl | | | 11 | | | | 0.01 | | | | 8 | | | | 0.01 | |
New York Harbor 3:2:1 crack spread | | | 18.61 | | | U.S. $1.00/bbl | | | 48 | | | | 0.05 | | | | 29 | | | | 0.03 | |
Exchange rate (U.S. $ per Cdn $)(3)(7) | | | 0.906 | | | U.S. $0.01 | | | (82 | ) | | | (0.08 | ) | | | (60 | ) | | | (0.06 | ) |
| (1) | Excludes mark to market accounting impacts. |
| (2) | Based on 983.7 million common shares outstanding as of December 31, 2014. |
| (3) | Does not include gains or losses on inventory. |
| (4) | Includes impacts related to Brent based production. |
| (5) | Includes impact of natural gas consumption. |
| (6) | Excludes impact on asphalt operations. |
| (7) | Assumes no foreign exchange gains or losses on U.S. dollar denominated long-term debt and other monetary items, including cash balances. |
|
Management’s Discussion and Analysis 2014 7 |
Husky’s strategy is to maintain and enhance production in its Heavy Oil and Western Canada foundation as it repositions these areas toward thermal developments and resource plays, while advancing growth in the Asia Pacific Region, the Oil Sands and in the Atlantic Region. The Company’s Downstream assets provide specialized support to its Upstream operations to enhance efficiency and extract additional value from production.
Husky’s strategic direction by business segment is summarized as follows:
Husky has a substantial portfolio of assets in Western Canada. New technologies are making it possible to economically access new pools and recover more production from existing reservoirs. The Company is active in the exploration and production of heavy oil, light crude oil, natural gas and natural gas liquids. The Western Canada strategy is comprised of maintaining production while refocusing by growing oil and liquids-rich natural gas resource plays and expanding thermal and horizontal drilling in heavy oil. The Company advanced its oil and gas resource play positions in 2014 with development activities ongoing in the Bakken, Cardium, Duvernay, Falher, Lower Shaunavon, Montney, Muskwa, Second White Specks, Viking and Wilrich formations.
Husky has an extensive portfolio of oil sands leases, encompassing approximately 2,500 square kilometres in northern Alberta. During 2014, Husky advanced the development of the Sunrise Energy Project, a multiple stage in-situ oil sands development, where first steam was achieved on Phase 1 of the project in December 2014 and first oil is anticipated towards the end of the first quarter of 2015. The first phase is expected to produce approximately 60,000 bbls/day (30,000 bbls/day net Husky share). Sunrise will use proven SAGD technology, keeping site disturbance to a minimum. Regulatory approval is in place to expand the project to 200,000 bbls/day (100,000 bbls/day net Husky share), and planning has advanced for the next phase of the project.
The Asia Pacific Region consists of the Wenchang oil field, the Liwan 3-1, Liuhua 34-2 and Liuhua 29-1 fields on Block 29/26 located offshore China, the Madura Strait block BD, MDA and MBH development fields, five discoveries offshore Indonesia and rights to additional exploration blocks in the South China Sea located offshore Taiwan and in the East Java Basin, Indonesia. The Liwan Gas Project, located approximately 300 kilometres southeast of the Hong Kong Special Administrative Region, is an important component of the Company’s near term production growth strategy and a key step in accessing the burgeoning energy markets in the Hong Kong Special Administrative Region and Mainland China. Husky, and its partner China National Offshore Oil Corporation, achieved first gas production from the Liwan 3-1 gas field in March 2014 and from the Liuhua 34-2 gas field in December 2014.
In the Atlantic Region, the Company holds interests in eight Production Licences, 11 Exploration Licences (including two from Greenland) and 23 Significant Discovery Areas. Development activity at the White Rose core field and its satellites, including North Amethyst and the West and South White Rose Extensions, continues to advance. In 2014, the Company and its partner began an 18-month appraisal drilling program around the Bay du Nord discovery in the Northern Flemish Pass. The Company has a 35 percent working interest at Bay du Nord as well as the Mizzen and Harpoon discoveries. The Company has significant exploration acreage in this region and continues to explore innovative ways to further develop the significant resources in the region.
The Infrastructure and Marketing business supports Upstream production while providing integration with the Company’s Downstream assets through optimization of market access. The Company also plans to expand terminal pipeline access and product storage opportunities to enhance market access.
Downstream supports heavy oil and oil sands production and makes prudent investments in respect of feedstock, product and market access flexibility. Husky plans to continue to pursue projects to optimize, integrate and reconfigure the Lima, Ohio Refinery for additional crude oil feedstock and product flexibility and reconfigure and increase capacity at the BP-Husky Toledo Refinery to accommodate Sunrise production as its primary feedstock.
|
Management’s Discussion and Analysis 2014 8 |
Husky is committed to ensuring sufficient liquidity, financial flexibility and access to long-term capital to fund the Company’s growth and support dividend payments. Husky maintains undrawn committed term credit facilities with a portfolio of creditworthy financial institutions and other sources of liquidity to provide timely access to funding to supplement cash flow.
Husky intends to continue to maintain a strong balance sheet to provide financial flexibility. The Company’s target is to maintain a debt to cash flow ratio of under 1.5 times and a debt to capital employed ratio of under 25 percent, which are both non-GAAP measures (refer to Section 11.3). Husky is committed to retaining its investment grade credit ratings to support access to debt capital markets.
The significant asset base in the Company’s foundation businesses in Western Canada provides a steady source of cash flow to reinvest in its growth projects, including in the Asia Pacific Region, the Oil Sands and the Atlantic Region. As these significant growth projects are developed, the Company expects that they will provide steady sources of cash for the Company.
The 2014 Capital Program built on the momentum achieved over the past three years, repositioning the Heavy Oil and Western Canada foundation by accelerating heavy oil production growth and repositioning Western Canada to focus on oil and liquids-rich natural gas resource plays and advancing three major growth areas in the Asia Pacific Region, the Oil Sands and the Atlantic Region.
Western Canada (excluding Heavy Oil and Oil Sands)
Husky continued to progress crude oil and liquids-rich gas resource plays as a core element of its Western Canada foundation. Total production from these resource plays in 2014 was approximately 34,000 boe/day, representing a more than one-third increase when compared to 2013.
Liquids-Rich Natural Gas Resource Plays
During 2014, the Company continued to advance exploration and development projects on its extensive liquids-rich natural gas resource land base. A total of 51 wells (gross) were drilled and 45 wells (gross) were completed in 2014 in key plays across the liquids-rich natural gas resource plays.
The following table summarizes the key liquids-rich natural gas drilling and completion activity for the year ended December 31, 2014:
| | | | | | | | | | |
| Liquids-Rich Natural Gas Resource Plays - Drilling and Completion Activity(1)(2) | | Year ended | |
| | | | | December 31, 2014 | |
| | | | | Gross Wells | | | Gross Wells | |
Project | | Location | | Drilled | | | Completed | |
Ansell Multi-Zone | | Ansell/Edson, Alberta | | | 31 | | | | 23 | |
Duvernay | | Kaybob, Alberta | | | — | | | | 2 | |
Wilrich | | Kakwa, Alberta | | | 10 | | | | 7 | |
Strachan Cardium | | Rocky Mountain House, Alberta | | | 9 | | | | 11 | |
Bivouac Muskwa | | Bivouac, B.C. | | | 1 | | | | 2 | |
| | | | | | | | | | |
Total Gross | | | | | 51 | | | | 45 | |
| | | | | | | | | | |
Total Net | | | | | 41 | | | | 36 | |
| | | | | | | | | | |
| (1) | Excludes service/stratigraphic test wells for evaluation purposes. |
| (2) | Drilling activity includes operated and non-operated wells. |
The liquids-rich gas formations at Ansell in west central Alberta continue to be a key area of focus, with 31 wells (gross) drilled and 23 wells (gross) completed in 2014. To date, the Company has drilled and completed over 350 (gross) wells at the play with average production of 17,500 boe/day in 2014, an increase of 27 percent when compared to 2013.
Husky completed a two-well pad in 2014 at the Duvernay liquids-rich natural gas resource play at Kaybob, Alberta. Results from the four-well pad drilled and completed in 2013 and the two-well pad completed in 2014 continue to be in line with expectations.
Drilling commenced in the year at the Wilrich Kakwa liquids-rich natural gas resource play. The Company drilled ten wells (gross) and completed seven wells (gross) in the year and production is in line with expectations.
|
Management’s Discussion and Analysis 2014 9 |
At the Strachan Cardium liquids-rich natural gas resource play, development continued in the year with nine wells (gross) drilled and 11 wells (gross) completed. Production continues to be in line with expectations.
Oil Resource Plays
During 2014, the Company advanced exploration and development projects on its extensive oil resource land base. A total of 41 horizontal wells (gross) were drilled and 49 horizontal wells (gross) were completed in 2014.
The following table summarizes the key oil resource play drilling and completion activity for the year ended December 31, 2014:
| | | | | | | | | | |
| Oil Resource Plays - Drilling and Completion Activity(1) | | Year ended | |
| | | | | December 31, 2014 | |
| | | | | Gross Wells | | | Gross Wells | |
Project | | Location | | Drilled | | | Completed | |
Oungre Bakken | | S.E. Saskatchewan | | | 7 | | | | 7 | |
Lower Shaunavon | | S.W. Saskatchewan | | | — | | | | 2 | |
Viking(2) | | Alberta and S.W. Saskatchewan | | | 27 | | | | 25 | |
N.Cardium | | Wapiti, Alberta | | | 6 | | | | 13 | |
Muskwa | | Rainbow, Northern Alberta | | | 1 | | | | 2 | |
| | | | | | | | | | |
Total Gross | | | | | 41 | | | | 49 | |
| | | | | | | | | | |
Total Net | | | | | 36 | | | | 44 | |
| | | | | | | | | | |
| (1) | Excludes service/stratigraphic test wells for evaluation purposes. |
| (2) | Viking is comprised of project activity at Redwater in central Alberta, Alliance in Southeastern Alberta and drilling in Southwestern Saskatchewan. |
In the Northwest Territories, construction of the all-season road at the Slater River Canol shale play was completed in 2014. During the second quarter of 2014, Husky withdrew its application to drill four horizontal wells.
Heavy Oil
Production commenced in early 2014 ahead of schedule at the Sandall heavy oil development with rates exceeding the 3,500 bbls/ day design rate capacity throughout the year. Production at the end of 2014 was approximately 5,700 bbls/day.
Construction work continued at the 10,000 bbls/day Rush Lake heavy oil thermal development with first production expected in the third quarter of 2015.
Site clearing, detailed engineering and module fabrication commenced at the two 10,000 bbls/day Edam East and Vawn developments in 2014 with first production expected in the second half of 2016.
The Company sanctioned a 3,500 bbls/day thermal project at Edam West in early 2014. Site clearing, detailed engineering and module fabrication commenced in the year with first production expected in the second half of 2016.
Total production from the Company’s existing heavy oil thermal developments averaged approximately 44,000 bbls/day in 2014.
Husky completed a successful 2013/2014 winter delineation program at the McMullen thermal development property including the drilling of 40 stratigraphic wells, the acquisition of 25 square kilometers of three-dimensional (“3-D”) seismic survey data and the completion of environmental field study work. Additional drilling commenced in December 2014 which will continue into the first quarter of 2015 to further progress the play.
Ninety-four horizontal heavy oil wells (gross) and 153 cold heavy oil production with sand (“CHOPS”) wells (gross) were drilled in 2014.
Asia Pacific Region
China
Block 29/26
At the Liwan Gas Project, first gas from the deepwater wells from the Liwan 3-1 gas field was achieved on March 30, 2014 and gas sales into the Guangdong market natural gas grid commenced on April 24, 2014. In addition, the tie-in of the Liuhua 34-2 gas field single production well into the Liwan 3-1 field deepwater infrastructure was completed and commissioned with first production achieved in December 2014. Production from the Liwan Gas Project continues to increase with natural gas production averaging 114.2 mmcf/day and NGL production averaging 4.2 mbbls/day in 2014. Market opportunities for the sale of gas and liquids from the third deepwater field, Liuhua 29-1, continue to be assessed.
|
Management’s Discussion and Analysis 2014 10 |
Offshore Taiwan
The acquisition of the second phase of two-dimensional seismic survey data on the Company’s offshore Taiwan block was completed in 2014, and evaluation of the data is in progress.
Indonesia
Madura Strait
Progress continued on the shallow water gas developments in the Madura Strait Block during 2014. Work related to the BD field engineering, procurement, installation and construction contract is ongoing and approximately 29 percent complete with construction moving forward on the wellhead platform and pipeline infrastructure in preparation for planned first production in 2017. The contract for the construction and lease of a floating production, storage and offloading (“FPSO”) vessel received final approval in the second quarter of 2014 and was signed in December 2014.
Tender plans for the MDA and MBH development projects were approved by SKK Migas, the Indonesia oil and gas regulator, and the tendering process is in progress. The Gas Sales Agreement for the first tranche of gas from this development is complete and awaiting final approval from the regulator. The development plan for the MDK field to tie into the MDA/MBH combined development was approved by SKK Migas in July.
Anugerah
During 2014, Husky signed a production Production Sharing Contract (“PSC”) for the Anugerah contract area. The contract area covers approximately 8,215 square kilometres and is primarily offshore East Java, Indonesia, with water depths of up to 1,400 metres. The main prospective locations are in water depths of 800 to 1,300 metres. The contract area is located approximately 150 kilometres east of the Madura Strait Block. Under the PSC, Husky has an obligation to carry out seismic surveys to assess the petroleum potential of the exploration block within the first three years. Exploration work, including planning for a 3-D seismic survey covering the contract area, is in progress.
Oil Sands
Sunrise Energy Project
The Company completed all remaining work and commissioning on Plant 1A, the first of two 30,000 bbls/day plants, at the Sunrise Energy Project. Steam injection into the reservoir commenced in December 2014, with first oil anticipated towards the end of the first quarter of 2015.
At Plant 1B, all welding is substantially completed, and construction activities are focused on completing electrical, instrumentation and insulation work. Plant 1B is on track to begin steaming in mid-2015.
In early 2014, an additional 38 square kilometers of 3-D seismic survey data was acquired and 12 stratigraphic wells were drilled to support continued field development of the Sunrise Energy Project.
Emerging Oil Sands
The Company completed a successful winter delineation program in the first quarter of 2014 at the Caribou and Cadotte North emerging oil sands properties.
Atlantic Region
White Rose Field and Satellite Extensions
At the South White Rose Extension project, gas injection commenced in early 2014 which is expected to increase reservoir pressure and oil recovery. Fabrication of production equipment was completed and installed in the second half of the year with development drilling commencing on the first production wells in late 2014. First oil is anticipated in mid-2015.
Drilling continued in 2014 at the Hibernia-formation well at the North Amethyst field which targeted a deeper zone beneath the main North Amethyst field. Production from the well, originally planned to commence in late 2014, has been delayed due to rig scheduling and is now expected to commence producing in the second half of 2015.
Hearings for the public review of the application for a wellhead platform to facilitate full field development at West White Rose were held during 2014. Construction continued on the dry-dock in Argentia, Newfoundland and early site preparation was advanced, including construction of a graving dock. Husky has deferred a final investment decision on the project.
Atlantic Exploration
The Company and its partner commenced an 18-month appraisal and exploration drilling program in November 2014 in the Bay du Nord discovery area in the Flemish Pass basin offshore Newfoundland and Labrador. The drilling program will involve the appraisal and delineation of the Bay du Nord discovery. The Company holds a 35 percent working interest in the Bay du Nord discovery.
|
Management’s Discussion and Analysis 2014 11 |
Drilling of an exploration well on the Aster prospect in the Flemish Pass Basin commenced on December 19, 2014, and results are being evaluated.
In addition, a 3-D seismic program over the Bay du Nord discovery was completed in 2014.
Infrastructure and Marketing
The Hardisty terminal expansion project includes multiple initiatives intended to increase pipeline connectivity and blending capacity that would expand Husky’s terminalling business, support Upstream production growth and provide additional flexibility through the inclusion of the Company’s production in various crude streams. Construction of the two 300,000-barrel storage tanks and the expanded piping and blending infrastructure is complete. The project is now in the commissioning phase with start up expected in the first quarter of 2015.
The Company completed an expansion of its pipeline system from the Sandall heavy oil thermal development to the existing gathering system that leads to Hardisty, Alberta. In addition, the Saskatchewan Gathering System is undergoing an extension and capacity expansion into Lloydminster in order to accommodate the anticipated production from the Rush Lake, Edam East, Vawn and Edam West thermal developments.
Lima Refinery
Front-end engineering design (“FEED”) on the Company’s feedstock flexibility project was completed in 2014. The project is expected to give the refinery flexibility to take up to 40,000 bbls/day of Western Canadian heavy oil while overall nameplate capacity would remain unchanged at 160,000 bbls/day. The initial planned completion date has been deferred with the project now expected to be completed in the 2018-2019 time frame.
BP-Husky Toledo Refinery
The Hydrotreater Recycle Gas Compressor Project was completed and became operational in late 2014. The project is expected to improve operational integrity and plant performance.
| | | | | | | | | | | | | | | | | | | | | | | | |
| | | Earnings (Loss) | | | | | | | | | | |
| | | before Income Taxes | | | Net Earnings (Loss) | | | Capital Expenditures(1) | |
($ millions) | | 2014 | | | 2013 | | | 2014 | | | 2013 | | | 2014 | | | 2013 | |
Upstream | | | | | | | | | | | | | | | | | | | | | | | | |
Exploration and Production | | | 1,337 | | | | 1,283 | | | | 992 | | | | 952 | | | | 4,189 | | | | 4,264 | |
Infrastructure and Marketing | | | 153 | | | | 392 | | | | 114 | | | | 292 | | | | 211 | | | | 96 | |
Downstream | | | | | | | | | | | | | | | | | | | | | | | | |
Upgrading | | | 227 | | | | 401 | | | | 168 | | | | 297 | | | | 50 | | | | 205 | |
Canadian Refined Products | | | 287 | | | | 260 | | | | 214 | | | | 194 | | | | 86 | | | | 109 | |
U.S. Refining and Marketing | | | (30 | ) | | | 522 | | | | (19 | ) | | | 339 | | | | 374 | | | | 220 | |
Corporate | | | (190 | ) | | | (230 | ) | | | (211 | ) | | | (245 | ) | | | 113 | | | | 134 | |
| | | | | | | | | | | | | | | | | | | | | | | | |
Total | | | 1,784 | | | | 2,628 | | | | 1,258 | | | | 1,829 | | | | 5,023 | | | | 5,028 | |
| | | | | | | | | | | | | | | | | | | | | | | | |
| (1) | Excludes capitalized costs related to asset retirement obligations and capitalized interest incurred during the period. |
|
Management’s Discussion and Analysis 2014 12 |
| 6.2 | Summary of Quarterly Results |
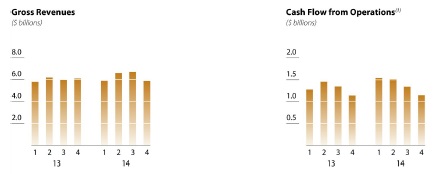
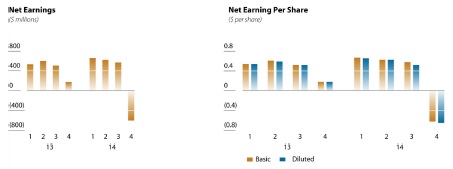
| (1) | Cash flow from operations is a non-GAAP measure. (Refer to Section 11.3) |
2014 Total Upstream Earnings $1,106 million
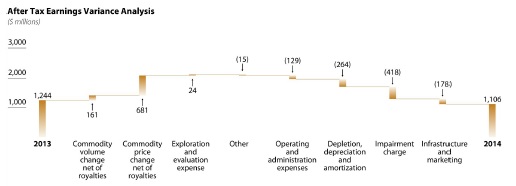
|
Management’s Discussion and Analysis 2014 13 |
Exploration and Production
| | | | | | | | |
Exploration and Production Earnings Summary($ millions) | | 2014 | | | 2013 | |
Gross revenues | | | 8,634 | | | | 7,333 | |
Royalties | | | (1,030 | ) | | | (864 | ) |
| | | | | | | | |
Net revenues | | | 7,604 | | | | 6,469 | |
Purchases, operating, transportation and administrative expenses | | | 2,521 | | | | 2,347 | |
Depletion, depreciation, amortization and impairment | | | 3,434 | | | | 2,515 | |
Exploration and evaluation expenses | | | 214 | | | | 246 | |
Other expenses | | | 98 | | | | 78 | |
Income taxes | | | 345 | | | | 331 | |
| | | | | | | | |
Net earnings | | | 992 | | | | 952 | |
| | | | | | | | |
Excluding an after-tax impairment charge of $622 million and $204 million recognized in 2014 and 2013, respectively, Exploration and Production net earnings in 2014 were $1,614 million, an increase of $458 million compared to 2013 primarily due to new natural gas and NGL production from the Liwan Gas Project and new heavy crude oil production at the Sandall heavy oil thermal development, higher realized commodity prices in the first half of 2014 and lower exploration and evaluation expenses partially offset by lower realized crude oil prices due to declines in market benchmarks in the second half of 2014.
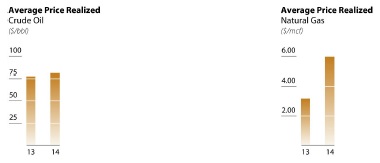
| | | | | | | | |
Average Sales Prices Realized | | 2014 | | | 2013 | |
Crude oil and NGL($/bbl) | | | | | | | | |
Light crude oil & NGL | | | 96.70 | | | | 102.35 | |
Medium crude oil | | | 80.69 | | | | 74.29 | |
Heavy crude oil | | | 71.91 | | | | 63.44 | |
Bitumen | | | 70.57 | | | | 61.68 | |
Total crude oil and NGL average | | | 81.10 | | | | 78.12 | |
Natural gas average($/mcf) | | | 5.99 | | | | 3.19 | |
Total average($/boe) | | | 67.38 | | | | 61.96 | |
| | | | | | | | |
During 2014, the average realized price for crude oil, NGL and bitumen was $81.10/bbl compared to $78.12/bbl in 2013, an increase of 4 percent. Lower average realized Brent and WTI market prices during 2014 were offset by a weaker Canadian dollar and narrower heavy crude oil and bitumen differentials. During 2014, the average realized natural gas price was $5.99/mcf compared to $3.19/mcf in 2013, an increase of 88 percent primarily due to higher realized fixed prices on production from the Liwan Gas Project and higher natural gas benchmark prices in Canada.
|
Management’s Discussion and Analysis 2014 14 |
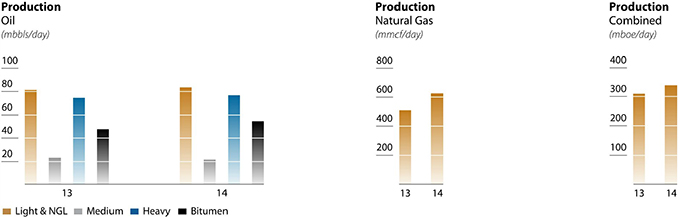
| | | | | | | | |
Daily Gross Production | | 2014 | | | 2013 | |
Crude oil and NGL (mbbls/day) | | | | | | | | |
Western Canada | | | | | | | | |
Light crude oil & NGL | | | 30.1 | | | | 29.7 | |
Medium crude oil | | | 21.5 | | | | 23.2 | |
Heavy crude oil | | | 76.8 | | | | 74.5 | |
Bitumen(1) | | | 54.6 | | | | 47.7 | |
| | | | | | | | |
| | | 183.0 | | | | 175.1 | |
Atlantic Region | | | | | | | | |
White Rose and Satellite Fields – light crude oil | | | 38.6 | | | | 39.3 | |
Terra Nova – light crude oil | | | 6.0 | | | | 4.8 | |
| | | | | | | | |
| | | 44.6 | | | | 44.1 | |
Asia Pacific Region | | | | | | | | |
Light crude oil & NGL(2) | | | 9.0 | | | | 7.3 | |
| | | | | | | | |
Crude oil (mbbls/day) | | | 236.6 | | | | 226.5 | |
| | | | | | | | |
Natural gas (mmcf/day) | | | | | | | | |
Western Canada | | | 506.8 | | | | 512.7 | |
Asia Pacific Region(2) | | | 114.2 | | | | — | |
| | | | | | | | |
| | | 621.0 | | | | 512.7 | |
| | | | | | | | |
Total(mboe/day) | | | 340.1 | | | | 312.0 | |
| | | | | | | | |
| (1) | Bitumen production included heavy oil thermal average daily gross production of 43.8 mbbls/day and 37.4 mbbls/day for the years ended December 31, 2014 and 2013, respectively. |
| (2) | Reported production volumes include Husky’s net working interest production from the Liwan Gas Project (49 percent) and an incremental share of production volumes which are allocated to Husky until full project exploration cost recovery is attained. |
Total production increased 9 percent in 2014 when compared to 2013.
| | | | | | | | |
Exploration and Production Revenue Mix (Percentage of Upstream Net Revenues) | | 2014 | | | 2013 | |
Crude oil | | | | | | | | |
Light crude oil & NGL | | | 36 | % | | | 43 | % |
Medium crude oil | | | 7 | % | | | 9 | % |
Heavy crude oil | | | 24 | % | | | 25 | % |
Bitumen | | | 17 | % | | | 15 | % |
| | | | | | | | |
Crude oil | | | 84 | % | | | 92 | % |
Natural gas | | | 16 | % | | | 8 | % |
| | | | | | | | |
Total | | | 100 | % | | | 100 | % |
| | | | | | | | |
During 2014, crude oil, bitumen and NGL production increased by 10.1 bbls/day or 4 percent compared to 2013, primarily due to new heavy oil thermal production at the Sandall heavy oil thermal development, new NGL production from the Liwan Gas Project, increased production at the Ansell liquids-rich natural gas resource play and higher production from Terra Nova where turnaround activity was lower in 2014 compared to 2013. Production increases were partially offset by natural reservoir declines from mature properties in Western Canada. Production from the White Rose and satellite fields in the Atlantic Region in 2014 was comparable to 2013 with new production from the multilateral well at North Amethyst offsetting natural declines at the mature main field.
|
Management’s Discussion and Analysis 2014 15 |
Natural gas production increased by 108.3 mmcf/day or 21 percent in 2014 compared to 2013 due to new production from the Liwan Gas Project and increased production at the Ansell liquids-rich natural gas resource play, partially offset by natural reservoir declines in Western Canada mature properties.
2015 Production Guidance and 2014 Actual
| | | | | | | | | | | | |
| | | Guidance | | | Year ended
December 31 | | | Guidance | |
Gross Production | | 2015 | | | 2014 | | | 2014 | |
Canada | | | | | | | | | | | | |
Light / Medium crude oil & NGL (mbbls/day) | | | 87 - 92 | | | | 96 | | | | 100 - 103 | |
Heavy crude oil & bitumen (mbbls/day) | | | 125 - 135 | | | | 131 | | | | 125 - 130 | |
Natural gas (mmcf/day) | | | 440 - 480 | | | | 507 | | | | 420 - 480 | |
| | | | | | | | | | | | |
Canada total(mboe/day) | | | 285 - 307 | | | | 312 | | | | 295 - 313 | |
| | | | | | | | | | | | |
Asia Pacific | | | | | | | | | | | | |
Light crude oil & NGL (mbbls/day) | | | 13 - 15 | | | | 9 | | | | 10 - 12 | |
Natural gas (mmcf/day) | | | 160 - 195 | | | | 114 | | | | 150 - 180 | |
| | | | | | | | | | | | |
Asia Pacific total(mboe/day) | | | 40 - 48 | | | | 28 | | | | 35 - 42 | |
| | | | | | | | | | | | |
Total(mboe/day) | | | 325 - 355 | | | | 340 | | | | 330 - 355 | |
| | | | | | | | | | | | |
The Company’s total production for the year ended December 31, 2014 was within production guidance. Husky expects that production levels in 2015 will be comparable to 2014 as increasing production from the Liwan Gas Project in the Asia Pacific Region and new production at the Sunrise Energy Project will be offset by decreasing production from natural gas properties in Western Canada due to natural reservoir declines.
Factors that could potentially impact Husky’s production performance for 2015 include, but are not limited to:
| • | | performance on recently commissioned facilities, new wells brought onto production and unanticipated reservoir response from existing fields; |
| • | | unplanned or extended maintenance and turnarounds at any of the Company’s operated or non-operated facilities, upgrading, refining, pipeline or offshore assets; |
| • | | business interruptions due to unexpected events, such as severe weather, fires, blowouts, freeze-ups, equipment failures, unplanned and extended pipeline shutdowns and other similar events; |
| • | | significant declines in crude oil and natural gas commodity prices, which may result in the decision to temporarily shut-in production or delay capital expenditures; |
| • | | defaults by contracting parties whose services or facilities are necessary for the Company’s production; and |
| • | | foreign operations and related assets, which are subject to a number of political, economic and socio-economic risks. |
Royalties
Royalty rates averaged 12 percent of gross revenues in both 2014 and 2013. Royalty rates in Western Canada averaged 12 percent in both 2014 and 2013. Royalty rates in the Atlantic Region averaged 17 percent in 2014 compared to 13 percent in 2013 due to Tier 1 and super royalty rates being reached at the North Amethyst and West White Rose Satellite Extensions. Royalty rates in the Asia Pacific Region averaged 8 percent in 2014 compared to 24 percent in 2013 due to lower royalty rates associated with production from the Liwan Gas Project which started producing late in March 2014.
Operating Costs
| | | | | | | | |
($ millions) | | 2014 | | | 2013 | |
Western Canada | | | 1,819 | | | | 1,745 | |
Atlantic Region | | | 218 | | | | 201 | |
Asia Pacific | | | 82 | | | | 31 | |
| | | | | | | | |
Total | | | 2,119 | | | | 1,977 | |
| | | | | | | | |
Unit operating costs ($/boe) | | | 16.12 | | | | 16.28 | |
| | | | | | | | |
Total Exploration and Production operating costs were $2,119 million in 2014 compared to $1,977 million in 2013. Total Upstream unit operating costs in 2014 averaged $16.12/boe compared to $16.28/boe in 2013 primarily due to lower per unit operating costs on production from the Liwan Gas Project, which started producing in late March 2014, and lower unit operating costs on production from thermal projects. The decrease was partially offset by increased natural gas prices and maintenance activities in Western Canada and higher logistics and ice management costs and the completion of maintenance turnarounds on the SeaRose FPSO in the Atlantic Region.
|
Management’s Discussion and Analysis 2014 16 |
Operating costs in Western Canada increased to $17.39/boe in 2014 compared to $17.05/boe in 2013 primarily due to increased natural gas prices and maintenance activities partially offset by the impact of production from lower unit operating cost thermal projects.
Operating costs in the Atlantic Region averaged $13.38/boe in 2014 compared to $12.47/boe in 2013 primarily due to higher logistics and ice management costs and the completion of maintenance turnarounds on the SeaRose FPSO.
Operating costs in the Asia Pacific Region averaged $8.06/boe in 2014 compared to $11.39/boe in 2013 primarily due to lower unit cost production from the Liwan Gas Project which commenced in late March 2014.
Exploration and Evaluation Expenses
| | | | | | | | |
($ millions) | | 2014 | | | 2013 | |
Seismic, geological and geophysical | | | 111 | | | | 133 | |
Expensed drilling | | | 45 | | | | 102 | |
Expensed land | | | 58 | | | | 11 | |
| | | | | | | | |
Total | | | 214 | | | | 246 | |
| | | | | | | | |
Exploration and evaluation expenses in 2014 were $214 million compared to $246 million in 2013. Expensed land in 2014 was primarily in Western Canada. Expensed drilling in 2013 included costs related to the winter program at the Slater River Canol shale project, as well as drilling costs associated with activities in the Atlantic Region. Seismic, geological and geophysical costs in 2013 included a one-time work commitment penalty in the Atlantic Region.
Depletion, Depreciation, Amortization (“DD&A”) and Impairment
During 2014, the Company recognized a pre-tax impairment charge of $838 million on certain conventional crude oil and natural gas assets located in Western Canada compared to a pre-tax impairment charge of $275 million in 2013. The impairment charge was the result of lower estimated short and long-term crude oil and natural gas prices.
During 2014, total DD&A was $20.92/boe compared to $19.67/boe in 2013, both excluding impairment charges. The increase in DD&A in 2014 was primarily attributable to higher depletion rates per boe on production from the Liwan Gas Project.
At December 31, 2014, capital costs in respect of assets under construction and major development projects were $6.9 billion compared to $8.3 billion at the end of 2013. These costs are excluded from the Company’s DD&A calculation until the properties are developed and have started producing or the project is deemed to be impaired.
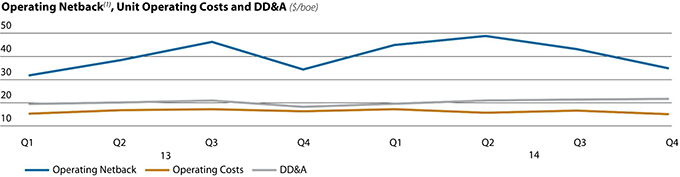
| (1) | Operating netback is a non-GAAP measure and is equal to Husky’s realized price less royalties, operating costs and transportation costs on a per unit basis. Refer to section 11.3. |
|
Management’s Discussion and Analysis 2014 17 |
Exploration and Production Capital Expenditures
In 2014, Upstream Exploration and Production capital expenditures were $4,189 million. Capital expenditures were $2,334 million (56%) in Western Canada including Heavy Oil, $713 million (17%) in Oil Sands, $746 million (18%) in the Atlantic Region and $396 million (9%) in the Asia Pacific Region.
| | | | | | | | |
Exploration and Production Capital Expenditures(1) ($ millions) | | 2014 | | | 2013 | |
Exploration | | | | | | | | |
Western Canada | | | 209 | | | | 353 | |
Oil Sands | | | 5 | | | | — | |
Atlantic Region | | | 96 | | | | 201 | |
Asia Pacific Region | | | 16 | | | | 21 | |
| | | | | | | | |
| | | 326 | | | | 575 | |
| | | | | | | | |
Development | | | | | | | | |
Western Canada | | | 2,074 | | | | 2,029 | |
Oil Sands | | | 708 | | | | 552 | |
Atlantic Region | | | 650 | | | | 437 | |
Asia Pacific Region | | | 380 | | | | 633 | |
| | | | | | | | |
| | | 3,812 | | | | 3,651 | |
| | | | | | | | |
Acquisitions | | | | | | | | |
Western Canada | | | 51 | | | | 38 | |
| | | | | | | | |
| | | 4,189 | | | | 4,264 | |
| | | | | | | | |
| (1) | Excludes capitalized costs related to asset retirement obligations and capitalized interest incurred during the period. |
Western Canada, Heavy Oil & Oil Sands
The following table discloses the number of gross and net exploration and development wells Husky completed in Western Canada, Heavy Oil and Oil Sands during the periods indicated:
| | | | | | | | | | | | | | | | |
| | | 2014 | | | 2013 | |
Wells Drilled (wells)(1) | | Gross | | | Net | | | Gross | | | Net | |
Exploration | | | | | | | | | | | | | | | | |
Oil | | | 53 | | | | 45 | | | | 39 | | | | 24 | |
Gas | | | 9 | | | | 5 | | | | 19 | | | | 14 | |
Dry | | | 3 | | | | 3 | | | | — | | | | — | |
| | | | | | | | | | | | | | | | |
| | | 65 | | | | 53 | | | | 58 | | | | 38 | |
| | | | | | | | | | | | | | | | |
Development | | | | | | | | | | | | | | | | |
Oil | | | 469 | | | | 419 | | | | 768 | | | | 709 | |
Gas | | | 78 | | | | 68 | | | | 68 | | | | 41 | |
Dry | | | 3 | | | | 3 | | | | 1 | | | | — | |
| | | | | | | | | | | | | | | | |
| | | 550 | | | | 490 | | | | 837 | | | | 750 | |
| | | | | | | | | | | | | | | | |
Total | | | 615 | | | | 543 | | | | 895 | | | | 788 | |
| | | | | | | | | | | | | | | | |
| (1) | Excludes Service/Stratigraphic test wells for evaluation purposes. |
The Company drilled 543 net wells in the Western Canada, Heavy Oil and Oil Sands business units in 2014 resulting in 464 net oil wells and 73 net natural gas wells compared to 788 net wells resulting in 733 net oil wells and 55 net natural gas wells in 2013.
During 2014, Husky invested $2,334 million on exploration, development and acquisitions, including Heavy Oil, throughout the Western Canada Sedimentary Basin compared to $2,420 million in 2013. Property acquisitions totalling $51 million were completed in 2014 compared to $38 million in 2013. Oil related exploration and development in 2014 was $392 million compared to $576 million in 2013. Investment in natural gas related exploration and development, primarily liquids-rich, was $502 million in 2014 compared to $596 million in 2013.
In addition, $829 million was spent on production optimization, cost reduction initiatives, facilities, land acquisition and retention and environmental protection in 2014 compared to $581 million in 2013.
Capital expenditures on heavy oil thermal projects, CHOPS drilling and horizontal drilling were $560 million in 2014 compared to $629 million in 2013.
Oil Sands
During 2014, $713 million was invested in Oil Sands projects, compared to $552 million in 2013, primarily for Phase 1 of the Sunrise Energy Project.
|
Management’s Discussion and Analysis 2014 18 |
Atlantic Region
The following table discloses Husky’s offshore Atlantic Region drilling activity during 2014:
Atlantic Region Offshore Drilling Activity
| | | | | | |
Well | | Working Interest | | | Well Type |
Terra Nova L-98-1Y | | | WI 13 | % | | Development (Producer) |
South White Rose J-05-1 | | | WI 68.875 | % | | Development (Gas Injector) |
Terra Nova L-98-13 | | | WI 13 | % | | Development (Water Injector) |
North Amethyst E-18-12A | | | WI 68.875 | % | | Delineation |
Bay de Verde F-67 | | | WI 35 | % | | Exploration |
During 2014, $746 million was invested in Atlantic Region projects compared to $638 million in 2013, primarily on the continued development of the White Rose Extension projects, including the North Amethyst, West White Rose and South White Rose Extensions.
Asia Pacific Region
During 2014, $396 million was invested in the Asia Pacific Region projects, compared to $654 million in 2013, primarily on the continued development of the Liwan Gas Project.
2015 Upstream Capital Program
| | | | |
($ millions) | | | |
Western Canada | | | 1,500 | |
Oil Sands | | | 200 | |
Atlantic Region | | | 600 | |
Asia Pacific Region | | | 200 | |
| | | | |
Total Upstream capital expenditures(1) | | | 2,500 | |
| | | | |
| (1) | Capital program excludes capitalized administration costs, capitalized interest and asset retirement obligations incurred. |
The 2015 Capital Program enables Husky to build on the momentum achieved over the past four years while maintaining prudent capital management and pacing of the Company’s growth projects and exploration plans in a weak commodity price environment.
The Company has budgeted $200 million for the Asia Pacific Region in 2015, primarily for the continued development of the Liwan Gas Project and the development of the Madura Strait block in Indonesia.
The Company has budgeted $200 million in Oil Sands in 2015, primarily for the continued development of Phase 1 of the Sunrise Energy Project.
The Company has budgeted $600 million in the Atlantic Region in 2015, primarily for continued development of the White Rose fields and extensions. The Company has commenced an 18-month exploration and appraisal program in the Bay du Nord discovery area offshore Newfoundland and Labrador.
In addition to advancing mid and long-term growth, the 2015 Capital Program provides support to the Company’s efforts to continue to reinvigorate and transform its foundation in Western Canada. The Company is making progress in its strategy to transition a greater percentage of its heavy oil production to long-life thermal. Husky will continue its development of the 10,000 bbls/day Rush Lake thermal project, with expected first production in the third quarter of 2015 and the two 10,000 bbls/day Edam East and Vawn and the 3,500 bbls/day Edam West thermal developments, with first production from all three projects expected in the second half of 2016.
Oil and Gas Reserves
The following oil and gas reserves disclosure has been prepared in accordance with Canadian Securities Administrators’ National Instrument 51-101 “Standards of Disclosure for Oil and Gas Activities” (“NI 51-101”) effective December 31, 2014. Husky received approval from the Canadian Securities Administrators to also disclose its reserves using U.S. disclosure requirements as supplementary disclosure to the reserves and oil and gas activities disclosure required by NI 51-101. The reserves information prepared in accordance with the U.S. disclosure requirements is included in the Company’s Form 40-F, which is available at www.sec.gov or on the Company’s website at www.huskyenergy.com.
|
Management’s Discussion and Analysis 2014 19 |
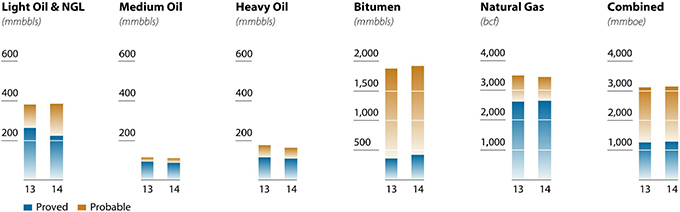
Note: All heavy oil thermal reserves are classified as bitumen.
The Company’s complete Oil and Gas Reserves Disclosure, prepared in accordance with NI 51-101, is contained in Husky’s Annual Information Form, which is available at www.sedar.com, or Husky’s Form 40-F, which is available at www.sec.gov or on the Company’s website at www.huskyenergy.com.
McDaniel & Associates Consultants Ltd. (“McDaniel”), an independent firm of qualified oil and gas reserves evaluation engineers, was engaged to conduct an audit of the Company’s internally evaluated crude oil, natural gas, NGL and the Tucker property reserves estimates, other than for the Company’s Heavy Oil and Gas business unit. McDaniel issued an audit opinion stating that the Company’s internally generated proved and probable reserves and net present values based on forecast and constant price assumptions are, in aggregate, reasonable and have been prepared in accordance with generally accepted oil and gas engineering and evaluation practices as set out in the Canadian Oil and Gas Evaluation Handbook.
Sproule Unconventional Limited (“Sproule”), an independent firm of oil and gas reserves evaluation engineers, was engaged to conduct a full evaluation of Husky’s crude oil, natural gas and natural gas products reserves for the Company’s Heavy Oil and Gas business unit, excluding the Tucker property.
At December 31, 2014, Husky’s proved oil and gas reserves were 1,279 mmboe, up from 1,265 mmboe at the end of 2013. Additions to proved reserves, including acquisitions and divestitures, represent 115 percent excluding economic revisions (111 percent including economic revisions) of 2014 production. Major additions to proved reserves in 2014 included:
| • | | The extension through additional drilling locations at the Sunrise Energy Project that resulted in the booking of an additional 40 mmbbls of bitumen in proved undeveloped reserves; |
| • | | Extensions, improved recovery and strong performance in Heavy Oil and Gas thermal projects that resulted in the booking of an additional 36 mmbbls of Bitumen in proved reserves; |
| • | | Strong performance from Liwan 3-1 that resulted in the booking of an additional 19 mmboe of natural gas and natural gas liquids in proved developed producing reserves; and |
| • | | The extension through additional drilling locations at the Ansell liquids-rich natural gas resource play that resulted in the booking of an additional 10 mmboe of natural gas and natural gas liquids in proved undeveloped reserves. |

Note: Reserves reported represent proved plus probable reserves.
|
Management’s Discussion and Analysis 2014 20 |
Reconciliation of Proved Reserves
| | | | | | | | | | | | | | | | | | | | | | | | | | | | | | | | | | | | | | | | | | | | |
(forecast prices and costs before royalties) | | Canada | | | | | | International | | | Total | |
| | Western Canada | | | Atlantic
Region | | | | | | | |
| | Light
Crude Oil
& NGL
(mmbbls) | | | Medium
Crude Oil
(mmbbls) | | | Heavy Crude
Oil
(mmbbls) (1) | | | Bitumen
(mmbbls) | | | Natural
Gas (bcf) | | | Light Crude
Oil (mmbbls) | | | Light Crude
Oil & NGL
(mmbbls) | | | Natural
Gas (bcf) | | | Crude Oil
& NGL
(mmbbls) | | | Natural
Gas (bcf) | | | Equivalent
Units
(mmboe) | |
Proved reserves | | | | | | | | | | | | | | | | | | | | | | | | | | | | | | | | | | | | | | | | | | | | |
December 31, 2013 | | | 167 | | | | 91 | | | | 113 | | | | 359 | | | | 2,175 | | | | 74 | | | | 23 | | | | 452 | | | | 827 | | | | 2,627 | | | | 1,265 | |
Revision of previous estimate | | | (31 | ) | | | — | | | | 23 | | | | (6 | ) | | | 65 | | | | 5 | | | | 3 | | | | 98 | | | | (6 | ) | | | 163 | | | | 21 | |
Purchase of reserves in place | | | — | | | | — | | | | 2 | | | | 1 | | | | — | | | | — | | | | — | | | | — | | | | 3 | | | | — | | | | 3 | |
Sale of reserves in place | | | — | | | | — | | | | (7 | ) | | | — | | | | (1 | ) | | | — | | | | — | | | | — | | | | (7 | ) | | | (1 | ) | | | (7 | ) |
Discoveries, extensions and improved recovery | | | 12 | | | | 2 | | | | 20 | | | | 70 | | | | 123 | | | | — | | | | 1 | | | | — | | | | 105 | | | | 123 | | | | 125 | |
Economic revision | | | — | | | | — | | | | (1 | ) | | | — | | | | (23 | ) | | | — | | | | — | | | | — | | | | (1 | ) | | | (23 | ) | | | (4 | ) |
Production | | | (11 | ) | | | (8 | ) | | | (44 | ) | | | (4 | ) | | | (185 | ) | | | (16 | ) | | | (3 | ) | | | (42 | ) | | | (86 | ) | | | (227 | ) | | | (124 | ) |
| | | | | | | | | | | | | | | | | | | | | | | | | | | | | | | | | | | | | | | | | | | | |
Proved reserves December 31, 2014 | | | 137 | | | | 85 | | | | 106 | | | | 420 | | | | 2,154 | | | | 63 | | | | 24 | | | | 508 | | | | 835 | | | | 2,662 | | | | 1,279 | |
| | | | | | | | | | | | | | | | | | | | | | | | | | | | | | | | | | | | | | | | | | | | |
Proved and probable reserves December 31, 2014 | | | 176 | | | | 107 | | | | 162 | | | | 1,917 | | | | 2,637 | | | | 177 | | | | 31 | | | | 836 | | | | 2,570 | | | | 3,473 | | | | 3,149 | |
December 31, 2013 | | | 223 | | | | 112 | | | | 176 | | | | 1,870 | | | | 2,669 | | | | 125 | | | | 33 | | | | 859 | | | | 2,539 | | | | 3,528 | | | | 3,127 | |
| | | | | | | | | | | | | | | | | | | | | | | | | | | | | | | | | | | | | | | | | | | | |
| (1) | Heavy oil thermal property reserves are classified as bitumen. |
Reconciliation of Proved Developed Reserves
| | | | | | | | | | | | | | | | | | | | | | | | | | | | | | | | | | | | | | | | | | | | |
(forecast prices and costs before royalties) | | Canada | | | | | | International | | | Total | |
| | Western Canada | | | Atlantic
Region | | | | | | | |
| | Light
Crude Oil
& NGL
(mmbbls) | | | Medium
Crude Oil
(mmbbls) | | | Heavy Crude
Oil
(mmbbls)(1) | | | Bitumen
(mmbbls) | | | Natural
Gas (bcf) | | | Light Crude
Oil (mmbbls) | | | Light Crude
Oil & NGL
(mmbbls) | | | Natural
Gas (bcf) | | | Crude Oil
& NGL
(mmbbls) | | | Natural
Gas (bcf) | | | Equivalent
Units
(mmboe) | |
Proved developed reserves | | | | | | | | | | | | | | | | | | | | | | | | | | | | | | | | | | | | | | | | | | | | |
December 31, 2013 | | | 146 | | | | 85 | | | | 92 | | | | 66 | | | | 1,702 | | | | 60 | | | | 15 | | | | 267 | | | | 464 | | | | 1,969 | | | | 792 | |
Revision of previous estimate | | | (29 | ) | | | 1 | | | | 23 | | | | (8 | ) | | | 97 | | | | 6 | | | | 4 | | | | 116 | | | | (3 | ) | | | 213 | | | | 33 | |
Transfer from proved undeveloped | | | 4 | | | | 1 | | | | 9 | | | | 66 | | | | 63 | | | | — | | | | — | | | | — | | | | 80 | | | | 63 | | | | 90 | |
Purchase of reserves in place | | | — | | | | — | | | | 1 | | | | — | | | | — | | | | — | | | | — | | | | — | | | | 1 | | | | — | | | | 1 | |
Sale of reserves in place | | | — | | | | — | | | | (3 | ) | | | — | | | | (1 | ) | | | — | | | | — | | | | — | | | | (3 | ) | | | (1 | ) | | | (3 | ) |
Discoveries, extensions and improved recovery | | | 4 | | | | 1 | | | | 12 | | | | 1 | | | | 19 | | | | — | | | | 1 | | | | — | | | | 19 | | | | 19 | | | | 22 | |
Economic revision | | | — | | | | — | | | | (1 | ) | | | — | | | | (23 | ) | | | — | | | | — | | | | — | | | | (1 | ) | | | (23 | ) | | | (4 | ) |
Production | | | (11 | ) | | | (8 | ) | | | (44 | ) | | | (4 | ) | | | (185 | ) | | | (16 | ) | | | (3 | ) | | | (42 | ) | | | (86 | ) | | | (227 | ) | | | (124 | ) |
| | | | | | | | | | | | | | | | | | | | | | | | | | | | | | | | | | | | | | | | | | | | |
Proved developed reserves December 31, 2014 | | | 114 | | | | 80 | | | | 89 | | | | 121 | | | | 1,672 | | | | 50 | | | | 17 | | | | 341 | | | | 471 | | | | 2,013 | | | | 807 | |
| | | | | | | | | | | | | | | | | | | | | | | | | | | | | | | | | | | | | | | | | | | | |
| (1) | Heavy oil thermal property reserves are classified as bitumen. |
|
Management’s Discussion and Analysis 2014 21 |
Planned Turnarounds
| • | | Planned turnarounds at the Ansell liquids-rich gas resource play and Ram River plant in Western Canada are expected to have an impact of about 4,700 boe/day in the second quarter of 2015. |
| • | | Other scheduled third-party shutdowns are expected to impact Western Canada production by approximately 3,300 boe/day in the third quarter of 2015. |
| • | | A three-week maintenance shutdown is planned at the Tucker heavy oil thermal project in the second quarter of 2015. |
| • | | Partial shut-downs are scheduled at several heavy oil thermal projects to perform routine maintenance, with an estimated aggregate impact of 8,000 bbls/day in June 2015. |
| • | | An 18-day turnaround on the SeaRose FPSO vessel is scheduled for the third quarter of 2015. |
| • | | A planned ten-week maintenance event at Terra Nova has been scheduled to commence in the second quarter of 2015. |
Infrastructure and Marketing
The Company is engaged in the marketing of both its own and other producers’ crude oil, natural gas, NGL, sulphur and petroleum coke production. The Company owns extensive infrastructure in Western Canada, including pipeline and storage facilities, and has access to capacity on third party pipelines and storage facilities in both Canada and the United States.
| | | | | | | | |
Infrastructure and Marketing Earnings Summary ($ millions, except where indicated) | | 2014 | | | 2013 | |
Infrastructure gross margin | | | 146 | | | | 130 | |
Marketing and other gross margin | | | 70 | | | | 312 | |
| | | | | | | | |
Gross margin | | | 216 | | | | 442 | |
| | | | | | | | |
Operating and administrative expenses | | | 40 | | | | 33 | |
Depletion, depreciation and amortization | | | 25 | | | | 20 | |
Other expenses | | | (2 | ) | | | (3 | ) |
Income taxes | | | 39 | | | | 100 | |
| | | | | | | | |
Net earnings | | | 114 | | | | 292 | |
| | | | | | | | |
Commodity trading volumes managed (mboe/day) | | | 252.3 | | | | 174.5 | |
| | | | | | | | |
Infrastructure and Marketing net earnings decreased by $178 million in 2014 compared with 2013 primarily due to the narrowing product price differentials between Canada and the United States. The Company is able to capture differences between the two markets by utilizing infrastructure capacity to deliver feedstock acquired in Canada to the U.S. market. The increase to commodity trading volumes managed relates primarily to additional pipeline capacity.
Infrastructure and Marketing capital expenditures totalled $211 million in 2014 compared with $96 million in 2013 primarily related to the Hardisty terminal expansion project and the extension and capacity expansion of the Saskatchewan Gathering System into Lloydminster.
|
Management’s Discussion and Analysis 2014 22 |
2014 Total Downstream Earnings $363 million
Upgrader
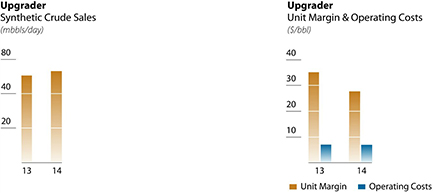
| | | | | | | | |
Upgrader Earnings Summary ($ millions, except where indicated) | | 2014 | | | 2013 | |
Gross revenues | | | 2,212 | | | | 2,023 | |
| | | | | | | | |
Gross margin | | | 536 | | | | 645 | |
Operating and administrative expenses | | | 189 | | | | 168 | |
Depreciation and amortization | | | 108 | | | | 96 | |
Other income (expense) | | | 12 | | | | (20 | ) |
Income taxes | | | 59 | | | | 104 | |
| | | | | | | | |
Net earnings | | | 168 | | | | 297 | |
| | | | | | | | |
Upgrader throughput(1) (mbbls/day) | | | 72.7 | | | | 66.1 | |
Synthetic crude oil sales(mbbls/day) | | | 53.3 | | | | 50.5 | |
Upgrading differential ($/bbl) | | | 21.80 | | | | 29.14 | |
Unit margin ($/bbl) | | | 27.55 | | | | 34.99 | |
Unit operating cost(2)($/bbl) | | | 6.78 | | | | 6.96 | |
| | | | | | | | |
| (1) | Throughput includes diluent returned to the field. |
The Upgrading operations add value by processing heavy sour crude oil into high value synthetic crude oil and low sulphur distillates. The Upgrader profitability is primarily dependent on the differential between the cost of heavy crude oil feedstock and the sales price of synthetic crude oil.
Upgrader net earnings in 2014 decreased by $129 million compared with 2013. The decrease in net earnings was primarily due to lower realized upgrading differentials as slightly higher realized prices for Husky Synthetic Blend were offset by higher feedstock costs.
During 2014, the price of Husky Synthetic Blend averaged $101.38/bbl compared to the average cost of blended heavy crude oil from the Lloydminster area of $79.58/bbl. During 2013, the price of Husky Synthetic Blend averaged $100.57/bbl compared to an average cost of blended heavy crude oil from the Lloydminster area of $71.43/bbl. This resulted in an average synthetic/heavy crude oil differential of $21.80/bbl in 2014 compared to $29.14/bbl in 2013 and a gross unit margin of $27.55/bbl in 2014 compared to $34.99/bbl in 2013.
The operating cost of upgrading averaged $6.78/bbl in 2014 compared to $6.96/bbl in 2013 which resulted in a net margin for upgrading heavy crude of $20.77/bbl, down 26 percent compared to $28.03/bbl in 2013. Higher energy costs and maintenance contributed to the increase in operating and administrative expenses and a recovery of upside interest, associated with the remaining payment obligation to Natural Resources Canada and the Alberta Department of Energy, recognized in 2013 contributed to the increase in other expenses in 2014 compared to 2013.
|
Management’s Discussion and Analysis 2014 23 |
Canadian Refined Products
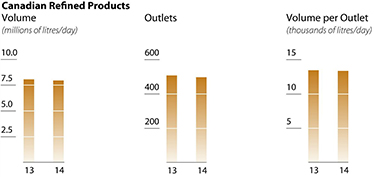
| | | | | | | | |
Canadian Refined Products Earnings Summary ($ millions, except where indicated) | | 2014 | | | 2013 | |
Gross revenues | | | 4,020 | | | | 3,737 | |
| | | | | | | | |
Gross margin | | | | | | | | |
Fuel | | | 147 | | | | 140 | |
Refining | | | 251 | | | | 175 | |
Asphalt | | | 246 | | | | 233 | |
Ancillary | | | 57 | | | | 55 | |
| | | | | | | | |
| | | 701 | | | | 603 | |
Operating and administrative expenses | | | 307 | | | | 253 | |
Depreciation and amortization | | | 102 | | | | 90 | |
Other expense | | | 5 | | | | — | |
Income taxes | | | 73 | | | | 66 | |
| | | | | | | | |
Net earnings | | | 214 | | | | 194 | |
| | | | | | | | |
Number of fuel outlets(1) | | | 497 | | | | 509 | |
Fuel sales volume, including wholesale | | | | | | | | |
Fuel sales(million of litres/day) | | | 8.0 | | | | 8.1 | |
Fuel sales per outlet(thousand of litres/day) | | | 13.4 | | | | 13.5 | |
Refinery throughput | | | | | | | | |
Prince George refinery (mbbls/day) | | | 11.7 | | | | 10.3 | |
Lloydminster refinery(mbbls/day) | | | 28.8 | | | | 26.4 | |
Ethanol production(thousand of litres/day) | | | 780.7 | | | | 742.4 | |
| | | | | | | | |
| (1) | Average number of fuel outlets for period indicated. |
Fuel gross margins increased in 2014 compared to 2013 primarily due to higher realized gasoline margins.
Refining gross margins increased in 2014 compared to 2013 primarily due to higher refinery throughput and lower feedstock costs at the ethanol plants.
Asphalt gross margins increased in 2014 compared to 2013 primarily due to higher asphalt throughput resulting from a scheduled refinery turnaround completed in 2013.
Higher energy costs contributed to the increase in operating and administrative expenses in 2014 when compared to 2013.
|
Management’s Discussion and Analysis 2014 24 |
U.S. Refining and Marketing
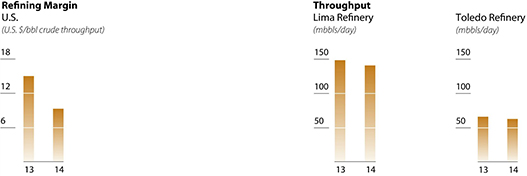
| | | | | | | | |
U.S. Refining and Marketing Earnings Summary ($ millions, except where indicated) | | 2014 | | | 2013 | |
Gross revenues | | | 10,663 | | | | 10,728 | |
| | | | | | | | |
Gross refining margin | | | 722 | | | | 1,182 | |
Operating and administrative expenses | | | 481 | | | | 424 | |
Depreciation and amortization | | | 268 | | | | 233 | |
Other expenses | | | 3 | | | | 3 | |
Income taxes | | | (11 | ) | | | 183 | |
| | | | | | | | |
Net earnings (loss) | | | (19 | ) | | | 339 | |
| | | | | | | | |
Selected operating data: | | | | | | | | |
Lima Refinery throughput(mbbls/day) | | | 141.6 | | | | 149.4 | |
BP-Husky Toledo Refinery throughput(mbbls/day) | | | 63.2 | | | | 65.0 | |
Refining margin(U.S. $/bbl crude throughput) | | | 9.37 | | | | 15.06 | |
Refinery inventory (feedstocks and refined products)(mmbbls)(1) | | | 10.8 | | | | 10.3 | |
| | | | | | | | |
| (1) | Included in refinery inventory is feedstock and refined products. |
U.S. Refining and Marketing net earnings decreased by $358 million in 2014 compared with 2013 primarily due to lower market crack spreads combined with FIFO losses and provisions booked to reduce inventory to net realizable value resulting from falling crack spreads and crude oil prices at year end.
The after-tax impact from provisions booked to reduce inventories to net realizable value was $128 million in 2014. Excluding this provision, the Company’s U.S. refining margin for 2014 was U.S. $11.83/bbl. In addition, lower refinery throughput resulting from planned maintenance at the Lima Refinery contributed to the decrease in net earnings.
The Chicago 3:2:1 market crack spread benchmark is based on last in first out (“LIFO”) accounting, which assumes that crude oil feedstock costs are based on the current month price of WTI, while crude oil feedstock costs included in realized margins are based on FIFO accounting, which reflects purchases made in the previous year when crude oil prices were higher. The estimated FIFO impact was a reduction in net earnings of approximately $108 million in 2014 compared to a reduction in net earnings of $18 million in 2013.
In addition, the product slates produced at the Lima and BP-Husky Toledo Refineries contain approximately 10 percent to 15 percent of other products that are sold at discounted market prices compared to gasoline and distillate, which are the standard products included in the Chicago 3:2:1 market crack spread benchmark.
Downstream Capital Expenditures
In 2014, Downstream capital expenditures totalled $510 million compared to $534 million in 2013. In Canada, capital expenditures of $136 million were primarily related to upgrades at retail stations and projects at the Upgrader and Prince George Refinery. In the United States, capital expenditures totalled $374 million for 2014 compared to $220 million in 2013. At the Lima Refinery, $260 million was spent primarily on the feedstock flexibility project and environmental initiatives. At the BP-Husky Toledo Refinery, capital expenditures totalled $114 million (Husky’s 50 percent share) and were primarily for facility upgrades and environmental protection initiatives.
Downstream Planned Turnarounds
A turnaround at the partner-operated refinery in Toledo is scheduled to commence in the third quarter of 2015.
|
Management’s Discussion and Analysis 2014 25 |
2014 Loss $211 million
| | | | | | | | |
Corporate Summary ($ millions) income (expense) | | 2014 | | | 2013 | |
Selling, general and administration expenses | | | (139 | ) | | | (217 | ) |
Depreciation and amortization | | | (73 | ) | | | (51 | ) |
Other income | | | 5 | | | | 17 | |
Foreign exchange gains | | | 81 | | | | 21 | |
Interest expense | | | (64 | ) | | | — | |
Income taxes | | | (21 | ) | | | (15 | ) |
| | | | | | | | |
Net loss | | | (211 | ) | | | (245 | ) |
| | | | | | | | |
The Corporate segment reported a loss of $211 million in 2014 compared to a loss of $245 million in 2013. Selling, general, and administrative expenses decreased in 2014 compared to 2013 primarily due to lower stock-based compensation expense associated with a decrease in the Company’s share price in 2014. Other income decreased by $12 million in 2014 compared to 2013 primarily due to the recovery of an insurance provision in 2013. Foreign exchange gains increased by $60 million in 2014 compared to 2013 due to the weakening of the Canadian dollar against the U.S. dollar which positively impacted the translation of the Company’s foreign currency denominated working capital. Interest expense increased by $64 million in 2014 compared to 2013 due to a decrease in the amount of capitalized interest related to production being achieved at the Liwan Gas Project and a decrease in interest income associated with the Sunrise Oil Sands Partnership contribution receivable which was paid in full in the second quarter of 2014.
| | | | | | | | |
Foreign Exchange Summary ($ millions, except exchange rate amounts) | | 2014 | | | 2013 | |
Gains (losses) on translation of U.S. dollar denominated long-term debt | | | 7 | | | | (11 | ) |
Gains on contribution receivable | | | 6 | | | | 27 | |
Gains on non-cash working capital | | | 42 | | | | 33 | |
Other foreign exchange gains (losses) | | | 26 | | | | (28 | ) |
| | | | | | | | |
Foreign exchange gains | | | 81 | | | | 21 | |
| | | | | | | | |
U.S./Canadian dollar exchange rates: | | | | | | | | |
At beginning of year | | U.S. $ | 0.940 | | | U.S. $ | 1.005 | |
At end of year | | U.S. $ | 0.862 | | | U.S. $ | 0.940 | |
| | | | | | | | |
Consolidated Income Taxes
Consolidated income taxes decreased in 2014 to $526 million from $799 million in 2013, resulting in an effective tax rate of 29 percent in 2014 compared to 30 percent in 2013. The decrease was primarily due to a recovery of non-deductible stock-based compensation recorded in 2014 compared to an expense recorded in 2013.
| | | | | | | | |
($ millions) | | 2014 | | | 2013 | |
Income taxes as reported | | | 526 | | | | 799 | |
Cash taxes paid | | | 661 | | | | 433 | |
Corporate Capital Expenditures
Corporate capital expenditures were $113 million in 2014 compared to $134 million in 2013 and were primarily related to computer hardware and software and leasehold improvements.
|
Management’s Discussion and Analysis 2014 26 |
| 7.0 | Risk and Risk Management |
| 7.1 | Enterprise Risk Management |
The Company’s enterprise risk management program supports decision-making via comprehensive and systematic identification and assessment of risks that could materially impact the results of the Company. Through this framework, the Company builds risk management and mitigation into strategic planning and operational processes for its business units through the adoption of standards and best practices. The Company has developed an enterprise risk matrix to identify risks to its people, the environment, its assets and its reputation, and to systematically mitigate these risks to an acceptable level.
The Company attempts to mitigate its financial, operational and strategic risks to an acceptable level through a variety of policies, systems and processes. The following provides a list of the most significant risks relating to the Company and its operations.
| 7.2 | Significant Risk Factors |
Operational, Environmental and Safety Incidents
The Company’s businesses are subject to inherent operational risks in respect to safety and the environment that require continuous vigilance. The Company seeks to minimize these operational risks by carefully designing and building its facilities and conducting its operations in a safe and reliable manner using its integrated management system that considers the environmental requirements and process and occupational safety (Husky Operational Integrity Management System). Failure to manage the risks effectively could result in potential fatalities, serious injury, asset damage or environmental impact. Enterprise risk management, emergency preparedness, business continuity and security policies and programs are in place for all operating areas and are adhered to on an ongoing basis. The Company, in accordance with industry practice, maintains insurance coverage against losses from certain of these risks. Nonetheless, insurance proceeds may not be sufficient to cover all losses, and insurance coverage may not be available for all types of operational risks.
Commodity Price Volatility
The Company’s results of operations and financial condition are dependent on the prices received for its crude oil and natural gas production. Lower prices for crude oil and natural gas could adversely affect the value and quantity of the Company’s oil and gas reserves. The Company’s reserves include significant quantities of heavier grades of crude oil that trade at a discount to light crude oil. Heavier grades of crude oil are typically more expensive to produce, process, transport and refine into high value refined products. Refining and transportation capacity for heavy crude oil is limited and planned increases of North American heavy crude oil production may create the need for additional heavy oil refining and transportation capacity. As a result, wider price differentials could have adverse effects on the Company’s financial performance and condition, reduce the value and quantities of the Company’s heavier crude oil reserves and delay or cancel projects that involve the development of heavier crude oil resources. There is no guarantee that planned pipeline development projects will provide sufficient transportation capacity and access to refining capacity to accommodate expected increases in North American heavy crude oil production.
Prices for crude oil are based on world supply and demand. Supply and demand can be affected by a number of factors including, but not limited to, actions taken by OPEC, non-OPEC crude oil supply, social conditions in oil producing countries, the occurrence of natural disasters, general and specific economic conditions, prevailing weather patterns and the availability of alternate sources of energy.
The Company’s natural gas production is currently located in Western Canada and Asia Pacific. Western Canada is subject to North American market forces. North American natural gas supply and demand is affected by a number of factors including, but not limited to, the amount of natural gas available to specific market areas either from the well head or from storage facilities, prevailing weather patterns, the price of crude oil, the U.S. and Canadian economies, the occurrence of natural disasters and pipeline restrictions.
In Asia or in North America, the crude oil price is based on the balance of supply and demand. Natural gas price in North America is affected primarily by supply and demand, as well as by prices for alternative energy sources. The natural gas Husky produces in the Asia Pacific Region is sold to specific buyers with long-term contracts. The price is fixed for the initial 5 years for the Liwan 3-1 gas field and then linked to city-gas pricing adjustment. For Liuhua 34-2, the price is fixed during the delivery period.
In certain instances, the Company uses derivative commodity instruments to manage exposure to price volatility on a portion of its crude oil and gas production and firm commitments for the purchase or sale of crude oil and natural gas.
The fluctuations in crude oil and natural gas prices are beyond the Company’s control and could have a material adverse effect on the Company’s business, financial condition and cash flow. For information on 2014 commodity price sensitivities, refer to Section 3.0 within this Management’s Discussion and Analysis.
|
Management’s Discussion and Analysis 2014 27 |
Reservoir Performance Risk
Lower than projected reservoir performance on the Company’s key growth projects could have a material impact on the Company’s financial position, medium to long-term business strategy and cash flow. Inaccurate appraisal of large project reservoirs could result in missed production, revenue and earnings targets and negatively affect the Company’s reputation, investor confidence and the Company’s ability to deliver on its growth strategy.
In order to maintain the Company’s future production of crude oil, natural gas and NGL and maintain the value of the reserves portfolio, additional reserves must be added through discoveries, extensions, improved recovery, performance related revisions and acquisitions. The production rate of oil and gas properties tends to decline as reserves are depleted while the associated unit operating costs increase. In order to mitigate the effects of this, the Company must undertake successful exploration and development programs, increase the recovery factor from existing properties through applied technology and identify and execute strategic acquisitions of proved developed and undeveloped properties and unproved prospects. Maintaining an inventory of developable projects depends on, among other things, obtaining and renewing rights to explore, develop and produce oil and natural gas, drilling success, completing long-lead time capital intensive projects on budget and on schedule and the application of successful exploitation techniques on mature properties.
Restricted Market Access and Pipeline Interruptions
The Company’s results depend upon the Company’s ability to deliver products to the most attractive markets. The Company’s results could be impacted by restricted market access resulting from a lack of pipeline or other transportation alternatives to attractive markets as well as regulatory and/or other marketplace barriers. The interruptions and restrictions may be caused by the inability of a pipeline to operate, or they can be related to capacity constraints as the supply of feedstock into the system exceeds the infrastructure capacity. With growing conventional and oil sands production across North America and limited availability of infrastructure to carry the Company’s products to the marketplace, oil and natural gas transportation capacity is expected to be restricted in the next few years. Restricted market access may potentially have a material impact on the Company’s financial position, medium to long-term business strategy, cash flow and corporate reputation. Unplanned shutdowns and closures of the Company’s refineries and or upgrader may limit the Company’s ability to deliver product with negative implications on sales and results from operating activities.
Security and Terrorist Threats
Security threats and terrorist or activist activities may impact the Company’s personnel, which could result in injury, death, extortion, hostage and/or kidnapping, including unlawful confinement. A security threat, terrorist attack or activist incident targeted at a facility, office or offshore vessel/installation owned or operated by the Company could result in the interruption or cessation of key elements of the Company’s operations. Outcomes of such incidents could have a material impact on the Company’s financial position, business strategy and cash flow.
A cyber incident may impact the operational state and/or cause physical damage to the Company’s assets, along with potential health and safety risks or loss of intellectual property.
International Operations
International operations can expose the Company to uncertain political, economic and other risks. The Company’s operations in certain jurisdictions may be adversely affected by political, economic or social instability or events. These events may include, but are not limited to, onerous fiscal policy, renegotiation or nullification of agreements, imposition of onerous regulation, changes in laws governing existing operations, financial constraints, including currency and exchange rate fluctuations, and unreasonable taxation. This could adversely affect the Company’s interest in its foreign operations and future profitability.
Gas Storage
The potential inability to deliver an effective gas storage solution as inventories grow over the life of the White Rose field may potentially result in prolonged shutdown of these operations, which may have a material impact on the Company’s financial position, medium to long-term business strategy and cash flow.
Skills and Human Resource Shortage
The Company recognizes that a robust, productive and healthy workforce drives efficiency, effectiveness and financial performance. Attracting and retaining qualified and skilled labour is critical to the successful execution of the Company’s current and future business strategies. A tight labour market, an insufficient number of qualified candidates and an aging workforce are factors that can precipitate a human resource risk for the Company if not properly managed. Failure to retain current employees and attract new skilled employees could materially affect the Company’s ability to conduct its business.
Major Project Execution
The Company manages a variety of oil and gas projects ranging from Upstream to Downstream assets. The risks associated with project development and execution, as well as the risks involved in commissioning and integration of new assets with existing facilities, can impact the economic feasibility of the Company’s projects. These risks can result in, among other things, cost overruns, schedule delays and a decline in the market value of the Company’s oil and gas products. These risks can also impact the Company’s safety and environmental performance, which could negatively affect the Company’s reputation.
|
Management’s Discussion and Analysis 2014 28 |
Partner Misalignment
Joint venture partners operate a portion of the Company’s assets in which the Company has an ownership interest. The Company is at times dependent upon its partners for the successful execution of various projects. If a dispute with partners were to occur over the development and operation of a project or if partners were unable to fund their contractual share of the capital expenditures, a project may be delayed and the Company may be partially or totally liable for its partner’s share of the project.
Reserves Data and Future Net Revenue Estimates
The reserves data contained or referenced in this Management’s Discussion and Analysis represent estimates only. The accurate assessment of oil and gas reserves is critical to the continuous and effective management of the Company’s Upstream assets. Reserves estimates support various investment decisions about the development and management of resource plays. In general, estimates of economically recoverable crude oil and gas reserves and the future net cash flow therefrom are based upon a number of variable factors and assumptions, such as product prices, future operating and capital costs, historical production from the properties and the assumed effects of regulation by governmental agencies, including with respect to royalty payments, all of which may vary considerably from actual results. All such estimates are to some degree uncertain, and classifications of reserves are only attempts to define the degree of uncertainty involved. For those reasons, estimates of the economically recoverable oil and gas reserves attributable to any particular group of properties, classification of such reserves based on risk of recovery and estimates of future net revenues expected therefrom may differ substantially from actual results. The data may be prepared by different engineers or by the same engineers at different times. These factors may cause the estimates to vary substantially over time. All reserves estimates involve a degree of ambiguity and, at times, rely on indirect measurement techniques to estimate the size and recoverability of the resource. While new technologies have increased the accuracy and efficacy of these techniques, there remains the potential for human or systemic error in recording and reporting the magnitude of the Company’s oil and gas reserves. Inaccurate appraisal of large project reservoirs could result in missed production, revenue and earnings targets and could negatively affect the Company’s reputation, investor confidence and the Company’s ability to deliver on its growth strategy.
Government Regulation
Given the scope and complexity of the Company’s operations, the Company is subject to regulation and intervention by governments at the federal, provincial, state and municipal levels in the countries in which it conducts its operations or exploratory activities. As these governments continually balance competing demands from different interest groups and stakeholders, the Company recognizes that the magnitude of regulatory risks has the potential to change over time. Changes in government policy, legislation or regulation could impact the Company’s existing and planned projects as well as impose costs of compliance, increase capital expenditures and operating expenses and expose the Company to other risks including environmental and safety risks. Examples of the Company’s regulatory risks include, but are not limited to, uncertain or negative interactions with governments, uncertain energy policies, uncertain environmental and safety policies, penalties, taxes, royalties, government fees, reserves access, limitations or increases in costs relating to the exportation of commodities, restrictions on the acquisition of exploration and production rights and land tenure, expropriation or cancellation of contract rights, limitations on control over the development and abandonment of fields and loss of licenses to operate.
Environmental Regulation
Changes in environmental regulation could have a material adverse effect on the Company’s financial condition and results of operations by requiring increased capital expenditures and operating costs or by impacting the quality, formulation or demand of products, which may or may not be offset through market pricing. The scope and complexity of changes in environmental regulation make it challenging to forecast the potential impact on the Company. The Company engages in the dialogue on proposed changes, both directly and through industry associations, to ensure the Company’s interests are recognized and the Company is sufficiently prepared to fully comply when new regulations come into force.
The Company anticipates further changes in environmental legislation could occur, which may result in stricter standards and enforcement, larger fines and liabilities, increased compliance costs and approval delays for critical licenses and permits, which could have a material adverse effect on the Company’s financial condition and results of operations through increased capital and operating costs.
Some of the topics that are or could in the future be subject to new or enhanced environmental regulation include:
| | • | | water use, withdrawals and discharges; |
| | • | | the use of hydraulic fracturing to aid in oil and gas production; |
| | • | | targets for reduced purchases of unconventional oils, such as bitumen; |
| | • | | new greenhouse gas (“GHG”) regulations in jurisdictions where the Company has operations; |
| | • | | jurisdictional calculation and regulation of fuel life-cycle carbon content; |
| | • | | fuel reformulation to support reduced combustion emissions; |
| | • | | new regulations for managing air pollutants at facility and equipment levels; and |
| | • | | regulations affecting the transportation of product by rail. |
|
Management’s Discussion and Analysis 2014 29 |
Transportation of Dangerous Goods Regulation
The transportation of flammable liquids (crude, ethanol, gasoline, etc.) by rail is an emerging issue for the petroleum industry. Throughout 2014, Transport Canada and the Pipeline and Hazardous Materials Safety Administration (“PHMSA”) in the United States have issued a series of orders and directives that are intended to enhance the safe transport of flammable liquids. Among these changes is greater oversight by the regulators, enhancements to emergency preparedness and response requirements, rail car design, testing and classification practices as well as discussions on a federal rail liability and compensation regime. Some of the enhancements came into effect in 2014; however the details of the other measures are still being worked on by the Canadian Association of Petroleum Producers, Canadian Fuels and other trade associations. On August 1, 2014, PHMSA published a Notice of Proposed Rulemaking concerning more stringent standards and operational controls for trains transporting high volumes of crude oil and other flammable materials and an Advance Notice of Proposed Rulemaking for oil spill response plans for these trains. If finalized, the rules would require the replacement of existing railcars and the implementation of other compliance measures. The final impact to the Company and the industry due to additional transportation costs imposed by the PHMSA rules and other developing standards has yet to be determined.
Climate Change Regulation
The Company continues to monitor the international and domestic efforts to address climate change, including international low carbon fuel standards and regulations and emerging regulations in the jurisdictions in which the Company operates.
Existing regulations in Alberta require facilities that emit more than 100,000 tonnes of carbon dioxide equivalent in a year to reduce their emissions intensity by up to 12 percent below an established baseline emissions intensity. These regulations currently affect the Company’s Ram River Gas Plant and Tucker Thermal Facility and are expected to affect the Sunrise Energy Project when it starts production.
The Saskatchewan government is currently in the process of developing such regulations. These regulations may impact the Company’s current and future operations in that province.
British Columbia currently has a $30 per tonne carbon tax that is placed on fuel the Company uses and purchases in that jurisdiction, which affects all of the Company’s operations in British Columbia. Additionally, British Columbia has a Low Carbon Fuel Standard in place that requires a reduction in the allowable carbon intensities of all fuels, with penalties applied after 2016 for intensities that do not meet targets. Due to the geographical location of the Company’s Prince George Refinery, the Company is already at the blend-wall as the cloud point of the Company’s produced diesel has to meet the requirements for vehicle engines operating at low temperatures. These regulations may impact the Company’s current and future operations in that province.
The Federal Government of Canada has announced its intention to take a sector based approach to future climate change regulations although it is not clear how new regulations will be structured or what compliance mechanisms will be available for the Company’s affected operations. Climate change regulations may become more onerous over time as public and political pressures increase to implement initiatives that further reduce GHG emissions. Although the impact of emerging regulations is uncertain, they may have a material adverse effect on the Company’s financial condition and results of operations through increased capital and operating costs.
The Company’s U.S. refining business may be materially impacted by implementation of the Environmental Protection Agency (“EPA”) climate change rules or by future U.S. GHG legislation that applies to the oil and gas industry or the consumption of petroleum products. Such legislation or regulation could require the Company’s U.S. refining operations to significantly reduce emissions and/ or purchase allowances, which may have a material adverse effect on the Company’s financial condition and results of operations through increased capital and operating costs.
Competition
The energy industry is highly competitive with respect to gaining access to the resources required to increase oil and gas reserves and production and gain access to markets. The Company competes with others to acquire prospective lands, retain drilling capacity and field operating and construction services obtain sufficient pipeline and other transportation capacity, gain access to and retain adequate markets for its products and services and gain access to capital markets. The Company’s ability to successfully complete development projects could be adversely affected if it is unable to acquire economic supplies and services due to competition. Subsequent increases in the cost of or delays in acquiring supplies and services could result in uneconomic projects. The Company’s competitors comprise all types of energy companies, some of which have greater resources.
|
Management’s Discussion and Analysis 2014 30 |
Internal Credit Risk
Credit ratings affect the Company’s ability to obtain short-term and long-term financing and the cost of such financing. Additionally, the ability of the Company to engage in ordinary course derivative or hedging transactions and maintain ordinary course contracts with customers and suppliers on acceptable terms depends on the Company’s credit ratings. A reduction in the current rating on the Company’s debt by one or more of its rating agencies, particularly a downgrade below investment grade ratings, or a negative change in the Company’s ratings outlook, could adversely affect the Company’s cost of financing and its access to sources of liquidity and capital. Credit ratings are intended to provide investors with an independent measure of credit quality of any issuer of securities. The credit ratings accorded to the Company’s securities by the rating agencies are not recommendations to purchase, hold or sell the securities in as much as such ratings do not comment as to market price or suitability for a particular investor. Any rating may not remain in effect for any given period of time or may be revised or withdrawn entirely by a rating agency in the future if in its judgment circumstances so warrant.
General Economic Conditions
General economic conditions may have a material adverse effect on the Company’s results of operations, liquidity and financial condition. A decline in economic activity will reduce demand for petroleum products and adversely affect the price the Company receives for its commodities. The Company’s cash flow could decline, assets could be impaired, future access to capital could be restricted and major development projects could be delayed or abandoned.
Cost or Availability of Oil and Gas Field Equipment
The cost or availability of oil and gas field equipment may adversely affect the Company’s ability to undertake exploration, development and construction projects. The oil and gas industry is cyclical in nature and is prone to shortages of supply of equipment and services including land and offshore drilling rigs, land and offshore geological and geophysical services, engineering and construction services and construction materials. These materials and services may not be available when required at reasonable prices.
Climatic Conditions
Extreme climatic conditions may have significant adverse effects on operations. The predictability of the demand for energy is affected to a large degree by the predictability of weather and climate. In addition, the Company’s exploration, production and construction operations, or disruptions to the operations of major customers or suppliers, can be affected by extreme weather. This may result in cessation or diminishment of production, delay of exploration and development activities or delay of plant construction. All of these could potentially cause adverse financial impacts.
The Company operates in some of the harshest environments in the world, including offshore in the Atlantic Region. Climate change is expected to increase severe weather conditions in these locations including winds, flooding and variable temperatures, which are contributing to the melting of Northern ice and increased creation of icebergs. Icebergs off the coast of Newfoundland and Labrador may threaten offshore oil production facilities, causing damage to equipment and possible production disruptions, spills, asset damage and human impacts. The Company has in place a number of policies to protect people, equipment and the environment in the event of extreme weather conditions and ice melt conditions.
The Company’s Atlantic Region business unit has a robust ice management program which uses a range of resources including a dedicated ice surveillance aircraft, as well as synergistic relationships with government agencies including Environment Canada, the Coast Guard and Canadian Ice Service. Regular ice surveillance flights commence in February and continue until the threat has abated. In addition, Atlantic Region operators employ a series of supply and support vessels to actively manage ice and icebergs. These vessels are equipped with a variety of ice management tools including towing ropes, towing nets and water cannons. The Company also maintains a series of ad-hoc relationships with contractors, allowing the quick mobilization of additional resources as required.
|
Management’s Discussion and Analysis 2014 31 |
The Company’s financial risks are largely related to commodity price risk, foreign currency risk, interest rate risk, credit risk and liquidity risk. From time to time, the Company uses derivative financial instruments to manage its exposure to these risks. These derivative financial instruments are not intended for trading or speculative purposes.
Foreign Currency Risk
The Company’s results are affected by the exchange rates between various currencies including the Canadian and U.S. dollars. The majority of the Company’s expenditures are in Canadian dollars while the majority of the Company’s revenues are received in U.S. dollars from the sale of oil and gas commodities that receive prices determined by reference to U.S. benchmark prices. An increase in the value of the Canadian dollar relative to the U.S. dollar will decrease the revenues received from the sale of oil and gas commodities. Correspondingly, a decrease in the value of the Canadian dollar relative to the U.S. dollar will increase the revenues received from the sale of oil and gas commodities. In addition, a change in the value of the Canadian dollar against the U.S. dollar will result in an increase or decrease in the Company’s U.S. dollar denominated debt and related interest expense, as expressed in Canadian dollars. The fluctuations in exchange rates are beyond the Company’s control and could have a material adverse effect on the Company’s business, financial condition and cash flow.
The Company enters into short-dated foreign exchange contracts to fix the exchange rate for conversion of U.S. revenue dollars to hedge against these potential fluctuations. The Company also designates a portion of its U.S debt as a hedge of the Company’s net investment in the U.S. refining operations which are considered as a foreign functional currency. At December 31, 2014, the amount that the Company designated was U.S. $2.9 billion (December 31, 2013 - U.S. $3.2 billion).
Interest Rate Risk
Interest rate risk is the impact of fluctuating interest rates on earnings, cash flows and valuations. In order to manage interest rate risk and the resulting interest expense, the Company mitigates some of its exposure to interest rate changes by maintaining a mix of both fixed and floating rate debt through the use of its credit facilities and various financial instruments. The optimal mix maintained will depend on market conditions. The Company may also enter into interest rate swaps from time to time as an additional means of managing current and future interest rate risk.
Credit Risk
Credit risk represents the financial loss that the Company would suffer if the Company’s counterparties in a transaction fail to meet or discharge their obligation to the Company. The Company actively manages this exposure to credit and contract execution risk from both a customer and a supplier perspective. Internal credit policies govern the Company’s credit portfolio and limit transactions according to a counterparty’s and a supplier’s credit quality. Counterparties for all financial derivatives transacted by the Company are major financial institutions or counterparties with investment grade credit ratings.
Liquidity Risk
Liquidity risk is the risk that the Company will not be able to meet its financial obligations as they become due. Liquidity risk also includes the risk of not being able to liquidate assets in a timely manner at a reasonable price. The Company’s process for managing liquidity risk includes ensuring, to the extent possible, that it has access to multiple sources of capital including: cash and cash equivalents, cash from operating activities, undrawn credit facilities and the availability to raise capital from various debt capital markets, including under its shelf prospectuses. The availability of capital under its shelf prospectuses is dependent on market conditions.
The Company is committed to retaining investment grade credit ratings to support access to capital markets and currently has the following credit ratings:
| | | | |
| | | Outlook | | Rating |
Moody’s: | | | | |
| Senior Unsecured Debt | | Stable | | Baa2 |
| Standard and Poor’s: | | | | |
| Senior Unsecured Debt | | Stable | | BBB+ |
| Series 1 Preferred Shares | | Stable | | P-2 (low) |
| Series 3 Preferred Shares | | Stable | | P-2 (low) |
| Dominion Bond Rating Service: | | | | |
| Senior Unsecured Debt | | Stable | | A (low) |
| Series 1 Preferred Shares | | Stable | | Pfd-2 (low) |
| Series 3 Preferred Shares | | Stable | | Pfd-2 (low) |
| Commercial Paper | | Stable | | R-1 (low) |
|
Management’s Discussion and Analysis 2014 32 |
Fair Value of Financial Instruments
The Company’s financial assets and liabilities that are recorded at fair value on a recurring basis have been categorized into one of three categories based upon the fair value hierarchy. Level 1 fair value measurements are determined by reference to quoted prices in active markets for identical assets and liabilities. Fair value measurements of assets and liabilities in Level 2 include valuations using inputs other than quoted prices for which all significant outputs are observable, either directly or indirectly. Level 3 fair value measurements are based on inputs that are unobservable and significant to the overall fair value measurement.
The Company’s financial instruments include cash and cash equivalents, accounts receivable, accounts payable and accrued liabilities, short-term debt, long-term debt, contribution payable, inventories measured at fair value, other assets and other long-term liabilities.
The following table summarizes by measurement classification, derivatives, contingent consideration and hedging instruments that are carried at fair value through profit or loss (“FVTPL”) in the consolidated balance sheets:
| | | | | | | | |
Financial Instruments at Fair Value ($ millions) | | As at December 31,
2014 | | | As at December 31,
2013 | |
Commodity contracts – FVTPL | | | | | | | | |
Natural gas(1) | | | (5 | ) | | | 32 | |
Crude oil(2) | | | 4 | | | | 41 | |
Foreign currency contracts – FVTPL | | | | | | | | |
Foreign currency forwards | | | (1 | ) | | | — | |
Other assets – FVTPL | | | 2 | | | | 2 | |
Contingent consideration | | | (40 | ) | | | (60 | ) |
Hedging instruments(3) | | | | | | | | |
Derivatives designated as a cash flow hedge(4) | | | — | | | | 37 | |
Hedge of net investment(5) | | | (353 | ) | | | (93 | ) |
| | | | | | | | |
| | | (393 | ) | | | (41 | ) |
| | | | | | | | |
| (1) | Natural gas contracts include a $12 million decrease as at December 31, 2014 (December 31, 2013 – $27 million increase) to the fair value of held-for-trading inventory, recognized in the Condensed Consolidated Balance Sheets, related to third party physical purchase and sale contracts for natural gas held in storage. Total fair value of the related natural gas storage inventory was $87 million at December 31, 2014. |
| (2) | Crude oil contracts include a $21 million decrease as at December 31, 2014 (December 31, 2013 – $49 million increase) to the fair value of held-for-trading inventory, recognized in the condensed consolidated balance sheets, related to third party crude oil physical purchase and sale contracts. Total fair value of the related crude oil inventory was $199 million at December 31, 2014. |
| (3) | Hedging instruments are presented net of tax. |
| (4) | Forward starting swaps previously designated as a cash flow hedge were discontinued during the first quarter of 2014. |
| (5) | Represents the translation of the Company’s U.S. dollar denominated long-term debt designated as a hedge of the Company’s net investment in its U.S. refining operations. |
|
Management’s Discussion and Analysis 2014 33 |
| 8.0 | Liquidity and Capital Resources |
In 2014, the Company funded its capital programs and dividend payments through cash generated from operating activities, cash on hand, the issuance of commercial paper and the issuance of preferred shares. At December 31, 2014, the Company had total debt of $5,292 million, partially offset by cash on hand of $1,267 million for $4,025 million of net debt compared to $3,022 million of net debt as at December 31, 2013. At December 31, 2014, the Company had $2,792 million of unused credit facilities of which $2,335 million are long-term committed credit facilities and $457 million are short-term uncommitted credit facilities. In addition, the Company had $2.75 billion in unused capacity under its December 31, 2012 Canadian universal short form base shelf prospectus (the “2012 Canadian Shelf Prospectus”) and U.S. $2.25 billion in unused capacity under its 2013 U.S. universal short form base shelf prospectus (the “U.S. Shelf Prospectus”). The ability of the Company to utilize the capacity under its prospectuses is subject to market conditions. Refer to Section 8.2.
| | | | | | | | |
Cash Flow Summary ($ millions, except ratios) | | 2014 | | | 2013 | |
Cash flow | | | | | | | | |
Operating activities | | | 5,585 | | | | 4,645 | |
Financing activities | | | (6 | ) | | | (846 | ) |
Investing activities | | | (5,423 | ) | | | (4,722 | ) |
Financial Ratios(1) | | | | | | | | |
Debt to capital employed(percent)(2) | | | 20.5 | | | | 17.0 | |
Debt to cash flow(times)(3)(4) | | | 1.0 | | | | 0.8 | |
Corporate reinvestment ratio(percent)(3)(5) | | | 101 | | | | 108 | |
Interest coverage on long-term debt only(3)(6) | | | | | | | | |
Earnings | | | 6.7 | | | | 11.2 | |
Cash flow | | | 23.6 | | | | 22.4 | |
Interest coverage on total debt(3)(7) | | | | | | | | |
Earnings | | | 6.6 | | | | 11.3 | |
Cash flow | | | 23.2 | | | | 22.6 | |
| (1) | Financial ratios constitute non-GAAP measures. (Refer to Section 11.3) |
| (2) | Debt to capital employed is equal to long-term debt, long-term debt due within one year and commercial paper divided by capital employed. (Refer to Section 11.3) |
| (3) | Calculated for the 12 months ended for the dates shown. |
| (4) | Debt to cash flow (times) is equal to long-term debt, long-term debt due within one year and commercial paper divided by cash flow from operations. (Refer to Section 11.3) |
| (5) | Corporate reinvestment ratio is equal to capital expenditures plus exploration and evaluation expenses, capitalized interest and settlements of asset retirement obligations less proceeds from asset disposals divided by cash flow from operations. (Refer to Section 11.3) |
| (6) | Interest coverage on long-term debt on a net earnings basis is equal to net earnings before finance expense on long-term debt and income taxes divided by finance expense on long-term debt and capitalized interest. Interest coverage on long-term debt on a cash flow basis is equal to cash flow – operating activities before finance expense on long-term debt and current income taxes divided by finance expense on long-term debt and capitalized interest. Long-term debt includes the current portion of long-term debt. |
| (7) | Interest coverage on total debt on a net earnings basis is equal to net earnings before finance expense on total debt and income taxes divided by finance expense on total debt and capitalized interest. Interest coverage on total debt on a cash flow basis is equal to cash flow – operating activities before finance expense on total debt and current income taxes divided by finance expense on total debt and capitalized interest. Total debt includes long-term debt, the current portion of long-term debt and commercial paper. |
Cash Flow from Operating Activities
Cash generated from operating activities was $5,585 million in 2014 compared to $4,645 million in 2013. The increase in cash flow generated from operating activities resulted from a decrease in non-cash working capital primarily due to the timing of accounts receivable and accounts payable settlements and lower investments in inventory due to falling commodity prices.
Cash Flow used for Financing Activities
Cash used for financing activities was $6 million in 2014 compared to $846 million in 2013. The decrease in cash flow used for financing activities was primarily resulting from the issuance of Cumulative Redeemable Preferred Shares, Series 3 and proceeds from the issuance of commercial paper.
Cash Flow used for Investing Activities
Cash used for investing activities was $5,423 million in 2014 compared to $4,722 million in 2013. Cash invested in both periods was primarily for capital expenditures.
|
Management’s Discussion and Analysis 2014 34 |
| 8.2 | Working Capital Components |
Working capital is the amount by which current assets exceed current liabilities. At December 31, 2014, Husky’s working capital deficiency was $1,314 million compared to working capital of $754 million at December 31, 2013.
Movement in Working Capital
| | | | | | | | | | | | |
($ millions) | | December 31, 2014 | | | December 31, 2013 | | | Change | |
Cash and cash equivalents | | | 1,267 | | | | 1,097 | | | | 170 | |
Accounts receivable | | | 1,324 | | | | 1,458 | | | | (134 | ) |
Income taxes receivable | | | 353 | | | | 461 | | | | (108 | ) |
Inventories | | | 1,385 | | | | 1,812 | | | | (427 | ) |
Prepaid expenses | | | 166 | | | | 89 | | | | 77 | |
Accounts payable and accrued liabilities | | | (2,989 | ) | | | (3,155 | ) | | | 166 | |
Asset retirement obligations | | | (97 | ) | | | (210 | ) | | | 113 | |
Short-term debt | | | (895 | ) | | | — | | | | (895 | ) |
Contribution payable | | | (1,528 | ) | | | — | | | | (1,528 | ) |
Long-term debt due within one year | | | (300 | ) | | | (798 | ) | | | 498 | |
| | | | | | | | | | | | |
Net working capital (deficiency) | | | (1,314 | ) | | | 754 | | | | (2,068 | ) |
| | | | | | | | | | | | |
The increase in cash was primarily due to higher cash flow from operating activities in the year, proceeds from the issuance of commercial paper and proceeds from the issuance of the Series 3 Shares. Movements in accounts receivable and accounts payable were due to the timing of settlements compared to 2013. The decrease in inventories was primarily due to lower investments in inventory due to falling commodity prices. The increase in short-term debt resulted from the issuance of commercial paper. The increase in contribution payable resulted from the reclassification of the BP-Husky Toledo contribution payable from long-term to short-term to reflect the repayment scheduled in 2015. The decrease in long-term debt due within one year was due to repayment of the maturing U.S. $750 million 5.90 percent notes issued under a trust indenture dated September 11, 2007, partially offset by the reclassification of the $300 million 3.75 percent medium-term notes maturing in 2015.
Sources and Uses of Cash
Liquidity describes a company’s ability to access cash. Companies operating in the upstream oil and gas industry require sufficient cash in order to fund capital programs necessary to maintain and increase production and develop reserves, to acquire strategic oil and gas assets and to repay maturing debt and pay dividends. The Company is currently able to fund its capital programs principally by cash generated from operating activities, cash on hand, issuances of equity, issuances of long-term and short-term debt and borrowings under committed and uncommitted credit facilities. During times of low oil and gas prices, a portion of a capital program can generally be deferred. However, due to the long cycle times and the importance to future cash flow in maintaining production, it may be necessary to utilize alternative sources of capital to continue the Company’s strategic investment plan during periods of low commodity prices. As a result, the Company frequently evaluates options with respect to sources of short and long-term capital resources. Occasionally, the Company will hedge a portion of its production to protect cash flow in the event of commodity price declines. At December 31, 2014, no production was hedged.
At December 31, 2014, Husky had the following available credit facilities:
| | | | | | | | |
Credit Facilities ($ millions) | | Available | | | Unused | |
Operating facilities(1) | | | 645 | | | | 457 | |
Syndicated bank facilities | | | 3,230 | | | | 2,335 | |
| | | | | | | | |
| | | 3,875 | | | | 2,792 | |
| | | | | | | | |
| (1) | Consists of demand credit facilities. |
Cash and cash equivalents at December 31, 2014 totalled $1,267 million compared to $1,097 million at the beginning of the year.
At December 31, 2014, Husky had unused short and long-term borrowing credit facilities totalling $2.8 billion. A total of $188 million of the Company’s short-term uncommitted borrowing credit facilities was used in support of outstanding letters of credit and $895 million of the Company’s long-term committed borrowing credit facilities was used in support of commercial paper.
The Sunrise Oil Sands Partnership has an unsecured demand credit facility of $10 million available for general purposes. The Company’s proportionate share is $5 million. There were no amounts drawn on this demand credit facility at December 31, 2014.
|
Management’s Discussion and Analysis 2014 35 |
At the special meeting of shareholders held on February 28, 2011, the Company’s shareholders approved amendments to the common share terms, which provide shareholders with the ability to receive dividends in common shares or in cash. Under the amended terms, quarterly dividends may be declared in an amount expressed in dollars per common share and paid by way of issuance of a fraction of a common share per outstanding common share determined by dividing the dollar amount of the dividend by the volume weighted average trading price of the common shares on the principal stock exchange on which the common shares are traded. The volume weighted average trading price of the common shares is calculated by dividing the total value by the total volume of common shares traded over the five trading day period immediately prior to the payment date of the dividend on the common shares. During the year ended December 31, 2014, the Company declared dividends payable of $1.20 per common share, resulting in dividends of $1,180 million. An aggregate of $1,169 million was paid in cash during 2014. At December 31, 2014, $295 million, including $292 million in cash and $3 million in common shares, was payable to shareholders on account of dividends declared on October 23, 2014.
On December 14, 2012, the Company amended and restated both of its revolving syndicated credit facilities to allow the Company to borrow up to $1.5 billion and $1.6 billion in either Canadian or U.S. currency from a group of banks on an unsecured basis. The maturity date for the $1.5 billion facility was extended to December 14, 2016, and in February 2013, the limit on the $1.5 billion facility was increased to $1.6 billion. On June 19, 2014, the $1.6 billion revolving syndicated credit facility previously set to expire on August 31, 2014 was increased to $1.63 billion, and its maturity was extended to June 19, 2018. The Company also increased the limit on one of the operating facilities from $50 million to $100 million.
On December 31, 2012, the Company filed the 2012 Canadian Shelf Prospectus with applicable securities regulators in each of the provinces of Canada, other than Quebec, that enabled the Company to offer up to $3.0 billion of common shares, preferred shares, debt securities, subscription receipts, warrants and units in Canada up to and including January 30, 2015. During 2014, the Company issued $250 million of Cumulative Redeemable Preferred Shares, Series 3 (the “Series 3 Preferred Shares”), resulting in unused capacity of $2.75 billion under the 2012 Canadian Shelf Prospectus as at December 31, 2014.
On October 31, 2013 and November 1, 2013, the Company filed the U.S. Shelf Prospectus with the Alberta Securities Commission and the SEC, respectively, that enables the Company to offer up to U.S. $3.0 billion of debt securities, common shares, preferred shares, subscription receipts, warrants and units of the Company in the United States up to and including November 30, 2015. During the 25-month period that the U.S. Shelf Prospectus is effective, securities may be offered in amounts, at prices and on terms set forth in a prospectus supplement.
On March 17, 2014, the Company issued U.S. $750 million of 4 percent notes due April 15, 2024 pursuant to the U.S. Shelf Prospectus. The notes are redeemable at the option of the Company at any time, subject to a make-whole premium if the notes are redeemed prior to the three month period prior to maturity. Interest is payable semi-annually. The notes are unsecured and unsubordinated and rank equally with all of the Company’s other unsecured and unsubordinated indebtedness. As at December 31, 2014, the Company had U.S. $2.25 billion in unused capacity under its U.S. Shelf Prospectus.
On June 15, 2014, the Company repaid the maturing 5.9 percent notes issued under a trust indenture dated September 11, 2007. The amount paid to noteholders was U.S. $772 million, including U.S. $22 million of interest, equivalent to $839 million in Canadian dollars, including interest of $25 million.
On September 15, 2014, the Company launched a commercial paper program in Canada. The program is supported by the Company’s syndicated credit facilities and the Company is authorized to issue commercial paper up to a maximum of $1.0 billion having a term not to exceed 365 days. The weighted average interest rate for commercial paper outstanding as at December 31, 2014 was 1.24 percent.
On December 9, 2014, the Company issued 10 million Series 3 Preferred Shares at a price of $25.00 per share for aggregate gross proceeds of $250 million under the 2012 Canadian Shelf Prospectus. Holders of the Series 3 Preferred Shares are entitled to receive a cumulative quarterly fixed dividend yielding 4.5 percent annually for the initial period ending December 31, 2019 as declared by the Company. Thereafter, the dividend rate will be reset every five years at the rate equal to the five-year Government of Canada bond yield plus 3.13 percent. Holders of Series 3 Preferred Shares will have the right, at their option, to convert their shares into Cumulative Redeemable Preferred Shares, Series 4 (the “Series 4 Preferred Shares”), subject to certain conditions, on December 31, 2019 and on December 31 every five years thereafter. Holders of the Series 4 Preferred Shares will be entitled to receive cumulative quarterly floating dividends at a rate equal to the 90-day Government of Canada Treasury Bill yield plus 3.13 percent.
Subsequent to December 31, 2014, on February 23, 2015, the Company filed a short form base shelf prospectus (the “2015 Canadian Shelf Prospectus”) with applicable securities regulators in each of the provinces of Canada that enables the Company to offer up to $3.0 billion of common shares, preferred shares, debt securities, subscription receipts, warrants and other units in Canada up to and including March 22, 2017.
|
Management’s Discussion and Analysis 2014 36 |
The ability of the Company to raise capital utilizing the 2015 Canadian Shelf Prospectus or U.S. Shelf Prospectus is dependent on market conditions at the time of sale.
| | | | | | | | |
| Capital Structure | | December 31, 2014 | |
($ millions) | | Outstanding | | | Available(1) | |
Total debt | | | 5,292 | | | | 2,792 | |
Common shares, retained earnings and other reserves | | | 20,575 | | | | | |
| (1) | Available long-term debt includes committed and uncommitted credit facilities. |
Contractual Obligations and Other Commercial Commitments
In the normal course of business, the Company is obligated to make future payments. The following summarizes known non-cancellable contracts and other commercial commitments:
| | | | | | | | | | | | | | | | | | | | |
| Contractual Obligations | | | | | | | | | | | | | | | |
Payments due by period ($ millions) | | 2015 | | | 2016-2017 | | | 2018-2019 | | | Thereafter | | | Total | |
Long-term debt and interest on fixed rate debt | | | 537 | | | | 1,026 | | | | 1,593 | | | | 3,065 | | | | 6,221 | |
Operating leases | | | 115 | | | | 478 | | | | 440 | | | | 1,019 | | | | 2,052 | |
Firm transportation agreements | | | 351 | | | | 669 | | | | 648 | | | | 3,275 | | | | 4,943 | |
Unconditional purchase obligations(1) | | | 2,495 | | | | 750 | | | | 468 | | | | 329 | | | | 4,042 | |
Lease rentals and exploration work agreements | | | 321 | | | | 292 | | | | 176 | | | | 1,219 | | | | 2,008 | |
Asset retirement obligations(2) | | | 95 | | | | 315 | | | | 243 | | | | 14,920 | | | | 15,573 | |
| | | | | | | | | | | | | | | | | | | | |
| | | 3,914 | | | | 3,530 | | | | 3,568 | | | | 23,827 | | | | 34,839 | |
| | | | | | | | | | | | | | | | | | | | |
| (1) | Includes purchase of refined petroleum products, processing services, distribution services, insurance premiums, drilling services and natural gas purchases. Unconditional purchase obligations have been updated for changes to commitments subsequent to the release of the Company’s 2014 fourth quarter Management’s Discussion and Analysis. |
| (2) | Asset retirement obligation amounts represent the undiscounted future payments for the estimated cost of abandonment, removal and remediation associated with retiring the Company’s assets. |
The Company updated its estimates for Asset Retirement Obligations (“ARO”) as outlined in Note 16 to the 2014 Consolidated Financial Statements. On an undiscounted basis, the ARO increased from $12.3 billion as at December 31, 2013 to $15.5 billion as at December 31, 2014, due to increased cost estimates and asset growth in both the Upstream and Downstream segments an increased estimated time to retirement in the Upstream segment.
The Company is in the process of renegotiating certain purchase, distribution and terminal commitments related to light oil and asphalt products as the existing contracts are approaching expiration.
The Company has entered into new firm transportation agreements in 2014, and future payments on transportation agreements settled in U.S. dollars have been impacted by a weaker Canadian dollar.
Other Obligations
The Company is involved in various claims and litigation arising in the normal course of business. While the outcome of these matters is uncertain and there can be no assurance that such matters will be resolved in the Company’s favour, the Company does not currently believe that the outcome of adverse decisions in any pending or threatened proceedings related to these and other matters, or any amount which it may be required to pay, would have a material adverse impact on its financial position, results of operations or liquidity.
The Company has income tax filings that are subject to audit and potential reassessment. The findings may impact the tax liability of the Company. The final results are not reasonably determinable at this time and management believes that it has adequately provided for current and deferred income taxes.
Husky provides a defined contribution plan and a post-retirement health and dental plan for all qualified employees in Canada. The Company also provides a defined benefit pension plan for approximately 79 active employees, 89 participants with deferred benefits and 539 participants or joint survivors receiving benefits in Canada. This plan was closed to new entrants in 1991 after the majority of employees transferred to the defined contribution pension plan. Husky completed the full wind up of the defined benefit pension plan in the United States effective May 2014. Husky also assumed a post-retirement welfare plan covering all qualified employees at the Lima Refinery and contributes to a 401(k) plan (Refer to Note 19 to the 2014 Consolidated Financial Statements).
|
Management’s Discussion and Analysis 2014 37 |
The Company has an obligation to fund capital expenditures of the BP-Husky Toledo Refinery (Refer to Note 8 to the 2014 Consolidated Financial Statements), which is payable between December 31, 2011 and December 31, 2015 with the final balance due and payable by December 31, 2015. The timing of payments during this period will be determined by the capital expenditures made at the refinery during this same period. At December 31, 2014, Husky’s share of this obligation was U.S. $1.3 billion, including accrued interest.
Subsequent to December 31, 2014, the Company amended the terms of repayment of the Company’s contribution payable with BP-Husky Refining LLC. In accordance with the amendment, U.S. $1 billion of the net contribution payable was paid on February 2, 2015. As a result of prepayment, the accretion rate has been reduced from 6 percent to 2.5 percent for the future term of the agreement. The remaining amount of approximately U.S. $300 million will be paid by way of funding all capital contributions of the BP- Husky Refining LLC joint operation with full payment required on or before December 31, 2017.
The Company is also subject to various contingent obligations that become payable only if certain events or rulings were to occur. The inherent uncertainty surrounding the timing and financial impact of these events or rulings prevents any meaningful measurement, which is necessary to assess their impact on future liquidity. Such obligations include environmental contingencies, contingent consideration and potential settlements resulting from litigation.
The Company has a number of contingent environmental liabilities, which individually have been estimated to be immaterial and have not been reflected in the Company’s financial statements beyond the associated ARO. These contingent environmental liabilities are primarily related to the migration of contamination at fuel outlets and certain legacy sites where Husky had previously conducted operations. The contingent environmental liabilities involved have been considered in aggregate and based on reasonable estimates the Company does not believe they will result, in aggregate, in a material adverse effect on its financial position, results of operations or liquidity.
| 8.4 | Off-Balance Sheet Arrangements |
The Company does not believe it has any guarantees or off-balance sheet arrangements that have, or are reasonably likely to have, a current or future material effect on the Company’s financial condition, results of operations, liquidity or capital expenditures.
Standby Letters of Credit
On occasion, the Company issues letters of credit in connection with transactions in which the counterparty requires such security.
| 8.5 | Transactions with Related Parties |
On May 11, 2009, the Company issued U.S. $251 million aggregate principal amount of 5-year 5.90 percent senior notes to certain management, shareholders, affiliates and directors. Subsequent to this offering, U.S. $122 million of the 5.90 percent notes issued to related parties were sold to third parties. On June 15, 2014, the Company repaid the maturing 5.90 percent notes. As a result, U.S. $133 million was repaid to related parties which included interest of U.S. $4 million. These transactions were measured at fair market value at the date of the transaction and have been carried out on the same terms as applied to unrelated parties.
On December 7, 2010, the Company issued 28.9 million common shares at a price of $24.50 per share for total gross proceeds of $707 million in a private placement to its then principal shareholders, L.F. Management and Investment S.à r.l (formerly L.F. Investments (Barbados) Limited) and Hutchison Whampoa Luxembourg Holdings S.à r.l.
On June 29, 2011, the Company issued 7.4 million common shares at a price of $27.05 per share for total gross proceeds of $200 million in a private placement to its then principal shareholders, L.F. Management and Investment S.à r.l and Hutchison Whampoa Luxembourg Holdings S.à r.l.
The Company sells natural gas to and purchases steam from Meridian and other cogeneration facilities owned by a related party. These natural gas sales and steam purchases are related party transactions and have been measured at fair value. For the year ended December 31, 2014, the amount of natural gas sales to Meridian and other cogeneration facilities owned by the related party totalled $78 million. For the year ended December 31, 2014, the amount of steam purchased by the Company from Meridian totalled $25 million. In addition, the Company provides facility services to Meridian which are measured and reimbursed at cost. For the year ended December 31, 2014, the total cost recovery for these services was $9 million.
|
Management’s Discussion and Analysis 2014 38 |
| 8.6 | Outstanding Share Data |
Authorized:
| • | | unlimited number of common shares |
| • | | unlimited number of preferred shares |
Issued and outstanding: February 23, 2015
| | | | |
• common shares | | | 983,840,282 | |
• cumulative redeemable preferred shares, series 1 | | | 12,000,000 | |
• cumulative redeemable preferred shares, series 3 | | | 10,000,000 | |
• stock options | | | 25,994,288 | |
• stock options exercisable | | | 13,285,074 | |
| 9.0 | Critical Accounting Estimates and Key Judgments |
Husky’s consolidated financial statements have been prepared in accordance with IFRS as issued by the International Accounting Standards Board (“IASB”). Significant accounting policies are disclosed in Note 3 to the 2014 Consolidated Financial Statements. Certain of the Company’s accounting policies require subjective judgment and estimation about uncertain circumstances.
Estimates and underlying assumptions are reviewed on an ongoing basis. Revisions to accounting estimates are recognized in the period in which the estimates are revised and on a prospective basis. By their nature, estimates are subject to measurement uncertainty and changes in such estimates in future years could require a material change in the consolidated financial statements. These underlying assumptions are based on historical experience and other factors that management believes to be reasonable under the circumstances, and are subject to change as new events occur, as more industry experience is acquired, as additional information is obtained and as the Company’s operating environment changes. Specifically, amounts recorded for depletion, depreciation, amortization and impairment, ARO, assets and liabilities measured at fair value, employee future benefits, income taxes and contingencies are based on estimates.
Depletion, Depreciation and Amortization
Eligible costs associated with oil and gas activities are capitalized on a unit of measure basis. Depletion expense is subject to estimates including petroleum and natural gas reserves, future petroleum and natural gas prices, estimated future remediation costs, future interest rates as well as other fair value assumptions. The aggregate of capitalized costs, net of accumulated DD&A, less estimated salvage values, is charged to DD&A over the life of the proved developed reserves using the unit of production method.
Asset Retirement Obligations
Estimating ARO requires that Husky estimates costs that are many years in the future. Restoration technologies and costs are constantly changing, as are regulatory, political, environment, safety and public relations considerations. Inherent in the calculation of ARO are numerous assumptions and estimates, including the ultimate settlement amounts, future third-party pricing, inflation factors, credit-adjusted discount rates, timing of settlement and changes in the legal, regulatory, environmental and political environments. Future revisions to these assumptions may result in changes to the ARO.
Fair Value of Financial Instruments
The fair values of derivatives are determined using valuation models which require assumptions concerning the amount and timing of future cash flows and discount rates. These estimates are also subject to change with fluctuations in commodity prices, interest rates, foreign currency exchange rates and estimates of non-performance. The actual settlement of a derivative instrument could differ materially from the fair value recorded and could impact future results.
Employee Future Benefits
The determination of the cost of the defined benefit pension plan and the other post-retirement benefit plans reflects a number of estimates that affect expected future benefit payments. These estimates include, but are not limited to, attrition, mortality, the rate of return on pension plan assets, salary escalations for the defined benefit pension plan and expected health care cost trends for the post-retirement health and dental care plan. The fair value of the plan assets is used for the purposes of calculating the expected return on plan assets.
|
Management’s Discussion and Analysis 2014 39 |
Income Taxes
The determination of the Company’s income and other tax liabilities requires interpretation of complex laws and regulations often involving multiple jurisdictions. Estimates that require significant judgments are also are made with respect to the timing of temporary difference reversals, the realizability of tax assets and in circumstances where the transaction and calculations for which the ultimate tax determination are uncertain. All tax filings are subject to audit and potential reassessment, often after the passage of considerable time. Accordingly, the actual income tax liability may differ significantly from that estimated and recorded by management.
Legal, Environmental Remediation and Other Contingent Matters
Husky is required to determine both whether a loss is probable based on judgment and interpretation of laws and regulations and whether the loss can be reasonably estimated. When a loss is determined it is charged to net earnings. Husky must continually monitor known and potential contingent matters and make appropriate provisions by charges to net earnings when warranted by circumstances.
Management makes judgments regarding the application of IFRS for each accounting policy. Critical judgments that have the most significant effect on the amounts recognized in the consolidated financial statements include successful efforts and impairment assessments, the determination of cash generating units (“CGUs”), the determination of a joint arrangement and the designation of the Company’s functional currency.
Exploration and Evaluation Costs
Costs directly associated with an exploration well are initially capitalized as exploration and evaluation assets. Expenditures related to wells that do not find reserves or where no future activity is planned are expensed as exploration and evaluation expenses. Exploration and evaluation costs are excluded from costs subject to depletion until technical feasibility and commercial viability is assessed or production commences. At that time, costs are either transferred to property, plant and equipment or their value is impaired. Impairment is charged directly to net earnings. Drilling results, required operating costs and capital expenditure and estimated reserves are important judgments when making this determination and may change as new information becomes available.
Impairment of Non-Financial Assets and Financial Assets
The carrying amounts of the Company’s non-financial assets are reviewed at the end of each reporting period to determine whether there is any indication of impairment. Determining whether there are any indications of impairment requires significant judgment of external factors, such as an extended decrease in prices or margins for oil and gas commodities or products, a significant decline in an asset’s market value, a significant downward revision of estimated volumes, an upward revision of future development costs, a decline in the entity’s market capitalization or significant changes in the technological, market, economic or legal environment that would have an adverse impact on the entity. If impairment is indicated, the amount by which the carrying value exceeds the estimated fair value of the long-lived asset is charged to net earnings. The determination of the recoverable amount for impairment purposes involves the use of numerous assumptions and estimates including future net cash flows from oil and gas reserves, future third-party pricing, inflation factors, discount rates and other uncertainties. Future revisions to these assumptions impact the recoverable amount.
A financial asset is assessed at the end of each reporting period to determine whether it is impaired based on objective evidence indicating that one or more events have had a negative effect on the estimated future cash flows of that asset. Objective evidence used by the Company to assess impairment of financial assets includes quoted market prices for similar financial assets and historical collection rates for loans and receivables. The calculations for the net present value of estimated future cash flows related to derivative financial assets requires the use of estimates and assumptions, including forecasts of commodity prices, marketing supply and demand, product margins and expected production volumes, and it is possible that the assumptions may change, which may require a material adjustment to the carrying value of financial assets.
Cash Generating Units
The Company’s assets are grouped into respective CGUs, which is the smallest identifiable group of assets, liabilities and associated goodwill that generates cash inflows that are largely independent of the cash inflows from other assets or groups of assets. The determination of the Company’s CGUs is subject to management’s judgment.
Joint Arrangements
Joint arrangements represent activities where the Company has joint control established by a contractual agreement. Joint control requires unanimous consent for financial and operational decisions. A joint arrangement is either a joint operation whereby the parties have rights to the assets and obligations for the liabilities or a joint venture whereby the parties have rights to the net assets.
|
Management’s Discussion and Analysis 2014 40 |
Determining the type of joint arrangement as either joint operation or joint venture is based on management’s assumptions of whether it has joint control over another entity. The considerations include, but are not limited to, determining if the arrangement is structured through a separate vehicle and whether the legal form and contractual arrangements give the entity direct rights to the assets and obligations for the liabilities within the normal course of business. Other facts and circumstances are also assessed by management, including the entity’s rights to the economic benefits and its involvement and responsibility for settling liabilities associated with the arrangement.
Functional and Presentation Currency
Functional currency is the currency of the primary economic environment in which the Company and its subsidiaries operate and is normally the currency in which the entity primarily generates and expends cash. The designation of the Company’s functional currency is a management judgment based on the composition of revenues and costs in the locations in which it operates.
| 10.0 | Recent Accounting Standards and Changes in Accounting Policies |
Recent Accounting Standards
Financial Instruments
In July 2014, the IASB issued IFRS 9 “Financial Instruments” to replace IAS 39 which provides a logical model for classification and measurement, a single, forward-looking ‘expected loss’ impairment model and a substantially-reformed approach to hedge accounting. The standard is effective for the Company for annual periods beginning on January 1, 2018, with required retrospective application and early adoption permitted. The Company intends to retrospectively adopt the standard on January 1, 2018. The adoption of the standard is not expected to have a material impact on the Company’s Consolidated Financial Statements.
Revenue from Contracts with Customers
In May 2014, the IASB issued IFRS 15 “Revenue from Contracts with Customers” to replace IAS 18 which establishes principles for reporting useful information to users of financial statements about the nature, amount, timing and uncertainty of revenue and cash flows arising from an entity’s contracts with customers. The standard is effective for the Company for annual periods beginning on January 1, 2017, with required retrospective application and early adoption permitted. The Company intends to retrospectively adopt the standard on January 1, 2017. The company is assessing the impact of this standard and does not expect it to have a material impact on the Company’s Consolidated Financial Statements.
Change in Accounting Policy
Impairment of Assets
The IASB issued amendments to IAS 36, “Impairment of Assets” which was adopted by the Company on January 1, 2014. The amendments require disclosure of information about the recoverable amount of impaired assets. The adoption of this amended standard had no impact on the Company’s Consolidated Financial Statements.
Levies
The IASB issued International Financial Reporting Interpretations Committee Interpretation (“IFRIC”) 21, “Levies” which was adopted by the Company on January 1, 2014. The IFRIC clarifies that an entity should recognize a liability for a levy when the activity that triggers payment occurs. The adoption of this interpretation had no impact on the Company’s Consolidated Financial Statements.
|
Management’s Discussion and Analysis 2014 41 |
| 11.1 | Forward-Looking Statements |
Certain statements in this document are forward-looking statements and information (collectively “forward-looking statements”), within the meaning of the applicable Canadian securities legislation, Section 21E of the United States Securities Exchange Act of 1934, as amended, and Section 27A of the United States Securities Act of 1933, as amended. The forward-looking statements contained in this document are forward-looking and not historical facts.
Some of the forward-looking statements may be identified by statements that express, or involve discussions as to, expectations, beliefs, plans, objectives, assumptions or future events or performance (often, but not always, through the use of words or phrases such as “will likely result”, “are expected to”, “will continue”, “is anticipated”, “is targeting”, “estimated”, “intend”, “plan”, “projection”, “could”, “aim”, “vision”, “goals”, “objective”, “target”, “schedules” and “outlook”). In particular, forward-looking statements in this document include, but are not limited to, references to:
| | • | | with respect to the business, operations and results of the Company generally: the Company’s general strategic plans and growth strategies; the Company’s 2015 production guidance, including weighting of production among product types; and the Company’s 2015 Upstream capital program; |
| | • | | with respect to the Company’s Asia Pacific Region: planned timing of first gas from the Madura Strait BD field; |
| | • | | with respect to the Company’s Atlantic Region: expected benefits of gas injection at the Company’s South White Rose Extension project; anticipated timing of first production at the Company’s South White Rose Extension project; scheduled timing of first production from the North Amethyst Hibernia-formation well; the scheduled duration and timing of a turnaround for the SeaRose FPSO; and the scheduled timing and duration of a maintenance event at Terra Nova; |
| | • | | with respect to the Company’s Oil Sands properties: anticipated timing of first oil at the Company’s Sunrise Energy Project Phase 1; anticipated timing of, and volume of production from, the Company’s Sunrise Energy Project; and anticipated timing of first steam at Plant 1B at the Company’s Sunrise Energy Project; |
| | • | | with respect to the Company’s Heavy Oil properties: anticipated future volume of production for the Company’s Heavy Oil business segment; expected timing of first production and anticipated volumes of production at the Company’s Rush Lake, Edam East, Edam West and Vawn heavy oil thermal developments; the scheduled timing and duration of a turnaround at the Tucker heavy oil thermal project; and the scheduled timing and anticipated impact of partial shut-downs at several heavy oil thermal projects; |
| | • | | with respect to the Company’s Western Canadian oil and gas resource plays: scheduled timing and anticipated impact of turnarounds at the Ansell liquids-rich natural gas resource play and Ram River plant; and scheduled timing and anticipated impact of third-party shutdowns in Western Canada; |
| | • | | with respect to the Company’s Infrastructure and Marketing operating segment: scheduled timing of completion of, and anticipated outcome of, the Hardisty terminal expansion project; and |
| | • | | with respect to the Company’s Downstream operating segment: the anticipated timing of completion and benefits from the Lima, Ohio Refinery feedstock flexibility project and the anticipated processing capacity of Western Canadian heavy oil once reconfiguration is complete; the anticipated benefits of the Hydrotreater Recycle Gas Compressor Project at the BP- Husky Toledo Refinery; and the scheduled timing of a turnaround at the BP-Husky Toledo Refinery. |
|
Management’s Discussion and Analysis 2014 42 |
In addition, statements relating to “reserves” are deemed to be forward-looking statements as they involve the implied assessment based on certain estimates and assumptions that the reserves described can be profitably produced in the future. There are numerous uncertainties inherent in estimating quantities of reserves and in projecting future rates of production and the timing of development expenditures. The total amount or timing of actual future production may vary from reserve and production estimates.
Although the Company believes that the expectations reflected by the forward-looking statements presented in this document are reasonable, the Company’s forward-looking statements have been based on assumptions and factors concerning future events that may prove to be inaccurate. Those assumptions and factors are based on information currently available to the Company about itself and the businesses in which it operates. Information used in developing forward-looking statements has been acquired from various sources including third party consultants, suppliers, regulators and other sources.
Because actual results or outcomes could differ materially from those expressed in any forward-looking statements, investors should not place undue reliance on any such forward-looking statements. By their nature, forward-looking statements involve numerous assumptions, inherent risks and uncertainties, both general and specific, which contribute to the possibility that the predicted outcomes will not occur. Some of these risks, uncertainties and other factors are similar to those faced by other oil and gas companies and some are unique to Husky.
The Company’s Annual Information Form for the year ended December 31, 2014 and other documents filed with securities regulatory authorities (accessible through the SEDAR website www.sedar.com and the EDGAR website www.sec.gov) describe the risks, material assumptions and other factors that could influence actual results and are incorporated herein by reference.
Any forward-looking statement speaks only as of the date on which such statement is made, and, except as required by applicable securities laws, the Company undertakes no obligation to update any forward-looking statement to reflect events or circumstances after the date on which such statement is made or to reflect the occurrence of unanticipated events. New factors emerge from time to time, and it is not possible for management to predict all of such factors and to assess in advance the impact of each such factor on the Company’s business or the extent to which any factor, or combination of factors, may cause actual results to differ materially from those contained in any forward-looking statement. The impact of any one factor on a particular forward-looking statement is not determinable with certainty as such factors are dependent upon other factors, and the Company’s course of action would depend upon its assessment of the future considering all information then available.
| 11.2 | Oil and Gas Reserves Reporting |
Disclosure of Oil and Gas Reserves and Other Oil and Gas Information
Unless otherwise stated, reserve estimates in this document have an effective date of December 31, 2014 and represent Husky’s share. Unless otherwise noted, historical production numbers given represent Husky’s share.
The Company uses the term barrels of oil equivalent (“boe”), which is calculated on an energy equivalence basis whereby one barrel of crude oil is equivalent to six thousand cubic feet of natural gas. Readers are cautioned that the term boe may be misleading, particularly if used in isolation. This measure is primarily applicable at the burner tip and does not represent value equivalence at the wellhead.
Note to U.S. Readers
The Company reports its reserves and resources information in accordance with Canadian practices and specifically in accordance with National Instrument 51-101, “Standards of Disclosure for Oil and Gas Disclosure”, adopted by the Canadian securities regulators.
|
Management’s Discussion and Analysis 2014 43 |
Disclosure of non-GAAP Measurements
Husky uses measurements primarily based on IFRS as issued by the IASB and also certain secondary non-GAAP measurements. The non-GAAP measurements included in this Management’s Discussion and Analysis are net operating earnings, cash flow from operations, operating netback, debt to capital employed, debt to cash flow, corporate reinvestment ratio, interest coverage on long-term debt, interest coverage on total debt, return on equity, return on capital employed and return on capital in use. Return on capital employed and return on capital in use were adjusted for an after-tax impairment charge on property, plant and equipment of $622 million and $204 million for the years ended December 31, 2014 and 2013, respectively. Return on capital employed including impairment for the years ended December 31, 2014 and 2013 was 5.3 percent and 7.9 percent, respectively. Return on capital in use including impairment for the years ended December 31, 2013 and 2012 was 7.5 percent and 11.3 percent, respectively. None of these measurements are used to enhance the Company’s reported financial performance or position. With the exception of net operating earnings and cash flow from operations, there are no comparable measures to these non-GAAP measures in accordance with IFRS. These non-GAAP measurements are considered to be useful as complementary measurements in assessing the Company’s financial performance, efficiency and liquidity. The non-GAAP measurements do not have a standardized meaning prescribed by IFRS and therefore are unlikely to be comparable by definition to similar measures presented by other companies. Except as described below, the definitions of these measurements are found in Section 11.4, “Additional Reader Advisories.”
Disclosure of Net Operating Earnings
The metric “Net Operating Earnings” is a non-GAAP measure comprised of net earnings excluding extraordinary and non-recurring items such as property, plant and equipment impairment charges and inventory write-downs not considered indicative of the Company’s ongoing financial performance. Net operating earnings is a complementary measure used in assessing Husky’s financial performance through providing comparability between periods.
The following table shows the reconciliation of net earnings to net operating earnings and the related per share amounts for the years ended December 31:
| | | | | | | | | | | | | | |
($ millions) | | | | 2014 | | | 2013 | | | 2012 | |
GAAP | | Net earnings | | | 1,258 | | | | 1,829 | | | | 2,022 | |
| | Impairment of property, plant and equipment, net of tax | | | 622 | | | | 204 | | | | — | |
| | Inventory write-downs, net of tax | | | 135 | | | | 1 | | | | 1 | |
| | | | | | | | | | | | | | |
Non-GAAP | | Net operating earnings(1) | | | 2,015 | | | | 2,034 | | | | 2,023 | |
| | | | | | | | | | | | | | |
| (1) | Net Operating Earnings were redefined in 2014 to include after-tax inventory write-downs. Prior periods have been adjusted to conform with current period presentation. |
Disclosure of Cash Flow from Operations
Husky uses the term “cash flow from operations, “which should not be considered an alternative to, or more meaningful than “cash flow – operating activities” as determined in accordance with IFRS, as an indicator of financial performance. Cash flow from operations is presented in the Company’s financial reports to assist management and investors in analyzing operating performance by business in the stated period. Husky’s determination of cash flow from operations may not be comparable to that reported by other companies. Cash flow from operations equals net earnings plus items not affecting cash, which include accretion, depletion, depreciation, amortization and impairment, exploration and evaluation expenses, deferred income taxes, foreign exchange, stock-based compensation, gain or loss on sale of property, plant, and equipment and other non-cash items.
The following table shows the reconciliation of cash flow – operating activities to cash flow from operations and related per share amounts for the years ended December 31:
| | | | | | | | | | | | |
($ millions) | | 2014 | | | 2013 | | | 2012 | |
GAAP cash flow – operating activities | | | 5,585 | | | | 4,645 | | | | 5,193 | |
Settlement of asset retirement obligations | | | 167 | | | | 142 | | | | 123 | |
Income taxes paid | | | 661 | | | | 433 | | | | 575 | |
Interest received | | | (7 | ) | | | (19 | ) | | | (34 | ) |
Change in non-cash working capital | | | (871 | ) | | | 21 | | | | (847 | ) |
| | | | | | | | | | | | |
Non-GAAP cash flow from operations | | | 5,535 | | | | 5,222 | | | | 5,010 | |
| | | | | | | | | | | | |
Cash flow from operations – basic | | | 5.63 | | | | 5.31 | | | | 5.13 | |
Cash flow from operations – diluted | | | 5.62 | | | | 5.31 | | | | 5.13 | |
| | | | | | | | | | | | |
Disclosure of Operating Netback
Operating netback is a common non-GAAP metric used in the oil and gas industry. This measurement assists management and investors to evaluate the specific operating performance by product at the oil and gas lease level. The Operating netback was determined as realized price less royalties, operating costs and transportation on a per unit basis.
|
Management’s Discussion and Analysis 2014 44 |
| 11.4 | Additional Reader Advisories |
Intention of Management’s Discussion and Analysis
This Management’s Discussion and Analysis is intended to provide an explanation of financial and operational performance compared with prior periods and the Company’s prospects and plans. It provides additional information that is not contained in the Company’s Consolidated Financial Statements.
Review by the Audit Committee
This Management’s Discussion and Analysis was reviewed by the Audit Committee and approved by Husky’s Board of Directors on February 23, 2015. Any events subsequent to that date could materially alter the veracity and usefulness of the information contained in this document.
Additional Husky Documents Filed with Securities Commissions
This Management’s Discussion and Analysis should be read in conjunction with the 2014 Consolidated Financial Statements and related notes. The readers are also encouraged to refer to Husky’s interim reports filed for 2014, which contain the Management’s Discussion and Analysis and Consolidated Financial Statements, and Husky’s 2014 Annual Information Form filed separately with Canadian regulatory agencies and Form 40-F filed with the SEC, the U.S. regulatory agency. These documents are available atwww.sedar.com, atwww.sec.gov andwww.huskyenergy.com. Husky’s Management’s Discussion and Analysis for the interim period ended December 31, 2014 is incorporated herein by reference.
Use of Pronouns and Other Terms
“Husky” and “the Company” refer to Husky Energy Inc. on a consolidated basis.
Standard Comparisons in this Document
Unless otherwise indicated, comparisons of results are for the years ended December 31, 2014 and 2013 and Husky’s financial position as at December 31, 2014 and at December 31, 2013. All currency is expressed in Canadian dollars unless otherwise directed.
Reclassifications and Materiality for Disclosures
Certain prior year amounts have been reclassified to conform to current year presentation. Materiality for disclosures is determined on the basis of whether the information omitted or misstated would cause a reasonable investor to change their decision to buy, sell or hold Husky’s securities.
Additional Reader Guidance
Unless otherwise indicated:
| • | | Financial information is presented in accordance with IFRS as issued by the IASB; |
| • | | Currency is presented in millions of Canadian dollars (“$ millions”); |
| • | | Gross production and reserves are Husky’s working interest prior to deduction of royalty volume; |
| • | | Prices are presented before the effect of hedging; |
| • | | Light crude oil is 31º API and above; |
| • | | Medium crude oil is 22º API and above but below 31º API; |
| • | | Heavy crude oil is above 10º API but below 22º API; and |
| • | | Bitumen is solid or semi-solid with a viscosity greater than 10,000 centipoise at original temperature in the deposit and atmospheric pressure. |
|
Management’s Discussion and Analysis 2014 45 |
Terms
| | |
| Brent Crude Oil | | Brent Crude is a major trading classification of sweet light crude oil that serves as a major benchmark price for purchases of oil worldwide. Brent Crude is sourced from the North Sea and is dated less than 15 days prior to loading for delivery |
| |
| Capital Employed | | Long-term debt including current portion, commercial paper and shareholders’ equity |
| |
| Capital Expenditures | | Includes capitalized administrative expenses, but does not include asset retirement obligations or capitalized interest |
| |
| Capital Program | | Capital expenditures not including capitalized administrative expenses or capitalized interest |
| |
| Cash Flow from Operations | | Net earnings plus items not affecting cash which include accretion, depletion, depreciation, amortization and impairment, exploration and evaluation expenses, deferred income taxes, foreign exchange, stock-based compensation, gains or losses on sale of property, plant and equipment and other non-cash items |
| |
| Corporate Reinvestment Ratio | | Equal to capital expenditures plus exploration and evaluation expenses, capitalized interest and settlements of asset retirement obligations less proceeds from asset disposals divided by cash flow from operations |
| |
| Debt to Capital Employed | | Long-term debt, long-term debt due within one year and commercial paper divided by capital employed |
| |
| Debt to Cash Flow | | Long-term debt, long-term debt due within one year and commercial paper divided by cash flow from operations |
| |
| Diluent | | A lighter gravity liquid hydrocarbon, usually condensate or synthetic oil, added to heavy oil to facilitate transmissibility through a pipeline |
| |
| Feedstock | | Raw materials that are processed into petroleum products |
| |
| Front-End Engineering Design (“FEED”) | | Preliminary engineering and design planning which, among other things, identifies project objectives, scope, alternatives, specifications, risks, costs, schedule and economics |
| |
| Gross/Net Acres/Wells | | Gross refers to the total number of acres/wells in which a working interest is owned. Net refers to the sum of the fractional working interests owned by a company |
| |
| Gross Reserves/Production | | A company’s working interest share of reserves/production before deduction of royalties |
| |
| Interest Coverage on Long-term Debt | | Interest coverage on long-term debt on a net earnings basis is equal to net earnings before finance expense on long- term debt and income taxes divided by finance expense on long-term debt and capitalized interest. Interest coverage on long-term debt on a cash flow basis is equal to cash flow – operating activities before finance expense on long- term debt and current income taxes divided by finance expense on long-term debt and capitalized interest. Long- term debt includes the current portion of long-term debt. |
| |
| Interest Coverage on Total Debt | | Interest coverage on total debt on a net earnings basis is equal to net earnings before finance expense on total debt and income taxes divided by finance expense on total debt and capitalized interest. Interest coverage on total debt on a cash flow basis is equal to cash flow – operating activities before finance expense on total debt and current income taxes divided by finance expense on total debt and capitalized interest. Total debt includes long-term debt, the current portion of long-term debt and commercial paper. |
| |
| Interest Coverage Ratio | | A calculation of a company’s ability to meet its interest payment obligation. It is equal to net earnings or cash flow – operating activities before finance expense divided by finance expense and capitalized interest |
| |
| Net Operating Earnings | | Net earnings before property, plant and equipment impairment charges and inventory write-downs |
| |
| NOVA Inventory Transfer | | Exchange or transfer of title of gas that has been received into the NOVA pipeline system but not yet delivered to a connecting pipeline |
| |
| Operating Netback | | Net revenues after deduction of operating costs, transportation and royalty payments |
| |
| Return on Capital Employed | | Non-GAAP measure used to assist in analyzing shareholder value and return on average capital. Net earnings plus after tax interest expense divided by the two-year average capital employed |
| |
| Return on Capital in Use | | Non-GAAP measure used to assist in analyzing shareholder value and return on capital. Net earnings plus after tax interest expense divided by the two-year average capital employed, less any capital invested in assets that are not generating cash flows |
| |
| Return on Equity | | Non-GAAP measure used to assist in analyzing shareholder value. Net earnings divided by the two-year average shareholders’ equity |
| |
| Seismic | | A method by which the physical attributes in the outer rock shell of the earth are determined by measuring, with a seismograph, the rate of transmission of shock waves through the various rock formations |
| |
| Shareholders’ Equity | | Shares, retained earnings and other reserves |
| |
| Total Debt | | Long-term debt including long-term debt due within one year, commercial paper and bank operating loans |
| |
| Turnaround | | Scheduled performance of plant or facility maintenance |
“Proved reserves” are those reserves that can be estimated with a high degree of certainty to be recoverable. It is likely that the actual remaining quantities recovered will exceed the estimated proved reserves.
“Proved developed reserves” are those reserves that are expected to be recovered from existing wells and installed facilities or , if facilities have not been installed, that would involve a low expenditure (e.g., when compared to the cost of drilling a well) to put the reserves on production.
|
Management’s Discussion and Analysis 2014 46 |
“Proved undeveloped reserves” are those reserves expected to be recovered from known accumulations where a significant expenditure (e.g. when compared to the cost of drilling a well) is required to render them capable of production. They must fully meet the requirements of the reserves category (proved, probable, possible) to which they are assigned. In multi-well pools, it may be appropriate to allocate total pool reserves between the developed and undeveloped categories or to subdivide the developed reserves for the pool between developed producing and developed non-producing. This allocation should be based on the estimator’s assessment as to the reserves that will be recovered from specific wells, facilities and completion intervals in the pool and their respective development and production status.
“Probable reserves” are those additional reserves that are less certain to be recovered than proved reserves. It is equally likely that the actual remaining quantities recovered will be greater or less than the sum of the estimated proved plus probable reserves.
Abbreviations
| | | | | | | | |
| 3-D | | three-dimensional | | mbbls/day | | thousand barrels per day |
| | | |
| ARO | | asset retirement obligations | | mboe | | thousand barrels of oil equivalent |
| | | |
| bbls | | barrels | | mboe/day | | thousand barrels of oil equivalent per day |
| | | |
| bbls/day | | barrels per day | | mcf | | thousand cubic feet |
| | | |
| bcf | | billion cubic feet | | mcfge | | thousand cubic feet of gas equivalent |
| | | |
| boe | | barrels of oil equivalent | | MD&A | | Management’s Discussion and Analysis |
| | | |
| boe/day | | barrels of oil equivalent per day | | mmbbls | | million barrels |
| | | |
| bps | | basis points | | mmboe | | million barrels of oil equivalent |
| | | |
| CGUs | | cash generating units | | mmbtu | | million British Thermal Units |
| | | |
| CHOPS | | cold heavy oil production with sand | | mmcf | | million cubic feet |
| | | |
| CSA | | Canadian Securities Administrators | | mmcf/day | | million cubic feet per day |
| | | |
| DD&A | | depletion, depreciation and amortization | | NGL | | natural gas liquids |
| | | |
| EOR | | enhanced oil recovery | | NIT | | NOVA Inventory Transfer |
| | | |
| EPA | | Environmental Protection Agency | | NYMEX | | New York Mercantile Exchange |
| | | |
| FIFO | | first in first out | | OPEC | | Organization of Petroleum Exporting Countries |
| | | |
| FPSO | | floating production, storage and offloading vessel | | PHMSA | | Pipeline and Hazardous Materials Safety Administration |
| | | | |
| FVTPL | | fair value through profit or loss | | | | PSC | | production sharing contract |
| | | |
| GAAP | | Generally Accepted Accounting Principles | | S&P | | Standard and Poor’s |
| | | | |
| GHG | | greenhouse gas | | | | SAGD | | Steam assisted gravity drainage |
| | | |
| GJ | | gigajoule | | SEC | | U.S. Securities and Exchange Commission |
| | | |
| IASB | | International Accounting Standards Board | | SEDAR | | System for Electronic Document Analysis and Retrieval |
| | | |
| IFRIC | | International Financial Reporting Interpretations Committee Interpretation | | TSX | | Toronto Stock Exchange |
| | | |
| IFRS | | International Financial Reporting Standards | | WI | | working interest |
| | | |
| LIFO | | last in first out | | WTI | | West Texas Intermediate |
| | | |
| mbbls | | thousand barrels | | | | |
|
Management’s Discussion and Analysis 2014 47 |
| 11.5 | Disclosure Controls and Procedures |
Disclosure Controls and Procedures
Husky’s management, under supervision of the Chief Executive Officer and the Chief Financial Officer, have evaluated the effectiveness of Husky’s disclosure controls and procedures (as defined in the rules of the SEC and the Canadian Securities Administrators (“CSA”)) as at December 31, 2014, and have concluded that such disclosure controls and procedures are effective.
Management’s Annual Report on Internal Control over Financial Reporting
The following report is provided by management in respect of Husky’s internal controls over financial reporting (as defined in the rules of the SEC and the CSA):
| | 1) | Husky’s management, under the supervision of the Chief Executive Officer and Chief Financial Officer, is responsible for designing, establishing and maintaining adequate internal control over financial reporting for Husky. All internal control systems, no matter how well designed, have inherent limitations. Therefore, even those systems determined to be effective can provide only reasonable assurance with respect to financial statement preparation and presentation. |
| | 2) | Husky’s management has used the Committee of Sponsoring Organizations of the Treadway Commission framework to evaluate the effectiveness of Husky’s internal control over financial reporting. |
| | 3) | As at December 31, 2014, management, under the supervision of the Chief Executive Officer and Chief Financial Officer, evaluated the effectiveness of Husky’s internal control over financial reporting and concluded that such internal control over financial reporting is effective. |
| | 4) | KPMG LLP, who has audited the Consolidated Financial Statements of Husky for the year ended December 31, 2014, has also issued a report on internal controls over financial reporting under Auditing Standard No. 5 of the Public Company Accounting Oversight Board (United States) that attests to management’s assessment of Husky’s internal controls over financial reporting. |
Changes in Internal Control over Financial Reporting
There have been no changes in Husky’s internal control over financial reporting during the year ended December 31, 2014, that have materially affected or are reasonably likely to materially affect its internal control over financial reporting.
|
Management’s Discussion and Analysis 2014 48 |
| 12.0 | Selected Quarterly Financial & Operating Information |
Segmented Operational Information
| | | | | | | | | | | | | | | | | | | | | | | | | | | | | | | | |
| | | 2014 | | | 2013 | |
| | | Q4 | | | Q3 | | | Q2 | | | Q1 | | | Q4 | | | Q3 | | | Q2 | | | Q1 | |
Upstream | | | | | | | | | | | | | | | | | | | | | | | | | | | | | | | | |
Daily production, before royalties | | | | | | | | | | | | | | | | | | | | | | | | | | | | | | | | |
Light crude oil & NGL(mbbls/day) | | | 89.8 | | | | 76.9 | | | | 77.9 | | | | 90.4 | | | | 78.3 | | | | 77.7 | | | | 82.3 | | | | 86.4 | |
Medium crude oil(mbbls/day) | | | 19.7 | | | | 20.2 | | | | 22.4 | | | | 23.7 | | | | 23.4 | | | | 23.2 | | | | 22.9 | | | | 23.0 | |
Heavy crude oil(mbbls/day) | | | 77.5 | | | | 76.1 | | | | 78.1 | | | | 75.5 | | | | 75.9 | | | | 75.3 | | | | 72.3 | | | | 74.4 | |
Bitumen(mbbls/day) | | | 55.7 | | | | 56.2 | | | | 54.6 | | | | 52.0 | | | | 46.7 | | | | 48.0 | | | | 48.3 | | | | 47.9 | |
| | | | | | | | | | | | | | | | | | | | | | | | | | | | | | | | |
Total crude oil production(mboe/day) | | | 242.7 | | | | 229.4 | | | | 233.0 | | | | 241.6 | | | | 224.3 | | | | 224.2 | | | | 225.8 | | | | 231.7 | |
Natural gas(mmcf/day) | | | 701.5 | | | | 670.3 | | | | 603.6 | | | | 505.9 | | | | 503.8 | | | | 505.5 | | | | 504.7 | | | | 537.3 | |
Total production(mboe/day) | | | 359.6 | | | | 341.1 | | | | 333.6 | | | | 325.9 | | | | 308.3 | | | | 308.5 | | | | 309.9 | | | | 321.3 | |
Average sales prices | | | | | | | | | | | | | | | | | | | | | | | | | | | | | | | | |
Light crude oil & NGL($/bbl) | | | 71.77 | | | | 96.47 | | | | 110.29 | | | | 110.48 | | | | 101.95 | | | | 107.83 | | | | 96.22 | | | | 103.59 | |
Medium crude oil($/bbl) | | | 64.60 | | | | 83.35 | | | | 89.67 | | | | 83.47 | | | | 67.86 | | | | 93.67 | | | | 73.62 | | | | 61.74 | |
Heavy crude oil($/bbl) | | | 58.86 | | | | 77.29 | | | | 79.45 | | | | 72.18 | | | | 56.51 | | | | 84.45 | | | | 66.77 | | | | 45.67 | |
Bitumen($/bbl) | | | 58.21 | | | | 75.50 | | | | 77.87 | | | | 70.78 | | | | 54.08 | | | | 83.17 | | | | 65.71 | | | | 43.12 | |
Natural gas($/mcf) | | | 6.37 | | | | 6.11 | | | | 6.42 | | | | 4.82 | | | | 3.30 | | | | 2.66 | | | | 3.72 | | | | 3.08 | |
Operating costs($/boe) | | | 15.07 | | | | 16.61 | | | | 15.68 | | | | 17.21 | | | | 16.31 | | | | 17.20 | | | | 16.79 | | | | 15.29 | |
Operating netbacks(1) | | | | | | | | | | | | | | | | | | | | | | | | | | | | | | | | |
Lloydminster – Thermal Oil($/boe)(2) | | | 43.73 | | | | 58.92 | | | | 61.67 | | | | 53.32 | | | | 38.76 | | | | 67.57 | | | | 50.57 | | | | 32.55 | |
Lloydminster – Non-Thermal Oil($/boe)(2) | | | 30.54 | | | | 45.50 | | | | 48.81 | | | | 40.29 | | | | 27.32 | | | | 49.69 | | | | 37.70 | | | | 19.06 | |
Oil Sands – Bitumen($/boe)(2) | | | 27.75 | | | | 43.68 | | | | 45.29 | | | | 35.99 | | | | 21.45 | | | | 52.68 | | | | 35.30 | | | | 12.32 | |
Western Canada – Crude Oil($/boe)(2) | | | 31.84 | | | | 44.04 | | | | 49.42 | | | | 45.39 | | | | 37.60 | | | | 54.41 | | | | 39.24 | | | | 31.17 | |
Western Canada – Natural gas($/mcf)(3) | | | 2.16 | | | | 2.29 | | | | 2.90 | | | | 3.40 | | | | 1.93 | | | | 1.21 | | | | 1.81 | | | | 1.68 | |
Atlantic – Light Oil($/boe)(2) | | | 55.50 | | | | 65.78 | | | | 84.47 | | | | 83.74 | | | | 83.90 | | | | 87.14 | | | | 78.66 | | | | 89.37 | |
Asia Pacific – Light Oil & NGL($/boe)(2) | | | 55.10 | | | | 67.21 | | | | 76.56 | | | | 78.41 | | | | 70.35 | | | | 74.60 | | | | 62.52 | | | | 73.46 | |
Total($/boe)(2) | | | 34.84 | | | | 43.05 | | | | 48.70 | | | | 44.81 | | | | 34.29 | | | | 46.15 | | | | 38.32 | | | | 31.78 | |
Net wells drilled(4) | | | | | | | | | | | | | | | | | | | | | | | | | | | | | | | | |
Exploration Oil | | | — | | | | 1 | | | | 1 | | | | 43 | | | | 7 | | | | 8 | | | | — | | | | 9 | |
Gas | | | 1 | | | | 1 | | | | 1 | | | | 2 | | | | 5 | | | | — | | | | 4 | | | | 5 | |
Dry | | | 3 | | | | — | | | | — | | | | — | | | | — | | | | — | | | | — | | | | — | |
| | | | | | | | | | | | | | | | | | | | | | | | | | | | | | | | |
| | | 4 | | | | 2 | | | | 2 | | | | 45 | | | | 12 | | | | 8 | | | | 4 | | | | 14 | |
| | | | | | | | | | | | | | | | | | | | | | | | | | | | | | | | |
Development Oil | | | 93 | | | | 132 | | | | 7 | | | | 187 | | | | 201 | | | | 249 | | | | 30 | | | | 229 | |
Gas | | | 8 | | | | 25 | | | | 24 | | | | 11 | | | | 12 | | | | 12 | | | | 2 | | | | 15 | |
Dry | | | 2 | | | | 1 | | | | — | | | | — | | | | — | | | | — | | | | — | | | | — | |
| | | | | | | | | | | | | | | | | | | | | | | | | | | | | | | | |
| | | 103 | | | | 158 | | | | 31 | | | | 198 | | | | 213 | | | | 261 | | | | 32 | | | | 244 | |
| | | | | | | | | | | | | | | | | | | | | | | | | | | | | | | | |
Total net wells drilled | | | 107 | | | | 160 | | | | 33 | | | | 243 | | | | 225 | | | | 269 | | | | 36 | | | | 258 | |
Success ratio(percent) | | | 95 | | | | 99 | | | | 100 | | | | 100 | | | | 100 | | | | 100 | | | | 100 | | | | 100 | |
| | | | | | | | | | | | | | | | | | | | | | | | | | | | | | | | |
Upgrader | | | | | | | | | | | | | | | | | | | | | | | | | | | | | | | | |
Synthetic crude oil sales(mbbls/day) | | | 54.8 | | | | 56.1 | | | | 48.2 | | | | 56.1 | | | | 52.0 | | | | 37.5 | | | | 56.7 | | | | 56.1 | |
Upgrading differential($/bbl) | | | 14.96 | | | | 19.98 | | | | 25.27 | | | | 38.51 | | | | 26.63 | | | | 23.59 | | | | 27.39 | | | | 38.51 | |
Canadian Refined Products | | | | | | | | | | | | | | | | | | | | | | | | | | | | | | | | |
Fuel sales(million litres/day) | | | 8.1 | | | | 8.5 | | | | 7.5 | | | | 7.7 | | | | 7.9 | | | | 8.3 | | | | 8.0 | | | | 8.2 | |
Refinery throughput | | | | | | | | | | | | | | | | | | | | | | | | | | | | | | | | |
Lloydminster refinery(mbbls/day) | | | 29.0 | | | | 28.3 | | | | 29.0 | | | | 29.0 | | | | 28.4 | | | | 28.7 | | | | 18.7 | | | | 28.3 | |
Prince George refinery(mbbls/day) | | | 11.7 | | | | 11.7 | | | | 11.3 | | | | 12.0 | | | | 12.0 | | | | 11.8 | | | | 6.3 | | | | 11.2 | |
Refinery utilization(percent) | | | 99 | | | | 98 | | | | 97 | | | | 99 | | | | 96 | | | | 61 | | | | 100 | | | | 100 | |
U.S. Refining and Marketing | | | | | | | | | | | | | | | | | | | | | | | | | | | | | | | | |
Refinery throughput | | | | | | | | | | | | | | | | | | | | | | | | | | | | | | | | |
Lima refinery(mbbls/day) | | | 162.8 | | | | 156.0 | | | | 135.9 | | | | 110.5 | | | | 151.8 | | | | 148.8 | | | | 149.8 | | | | 146.9 | |
BP-Husky Toledo refinery(mbbls/day) | | | 63.8 | | | | 64.2 | | | | 59.4 | | | | 65.5 | | | | 66.3 | | | | 59.1 | | | | 68.1 | | | | 66.3 | |
| | | | | | | | | | | | | | | | | | | | | | | | | | | | | | | | |
| (1) | Operating netbacks are Husky’s average prices less royalties and operating costs on a per unit basis. |
| (2) | Includes associated co-products converted to boe. |
| (3) | Includes associated co-products converted to mcfge. |
| (4) | Includes Western Canada, Heavy Oil and Oil Sands. |
|
Management’s Discussion and Analysis 2014 49 |
Segmented Capital Expenditures(1)
| | | | | | | | | | | | | | | | | | | | | | | | | | | | | | | | |
| | | 2014 | | | 2013 | |
($ millions) | | Q4 | | | Q3 | | | Q2 | | | Q1 | | | Q4 | | | Q3 | | | Q2 | | | Q1 | |
Upstream | | | | | | | | | | | | | | | | | | | | | | | | | | | | | | | | |
Exploration | | | | | | | | | | | | | | | | | | | | | | | | | | | | | | | | |
Western Canada | | | 37 | | | | 42 | | | | 56 | | | | 74 | | | | 80 | | | | 99 | | | | 64 | | | | 110 | |
Oil Sands | | | — | | | | — | | | | — | | | | 5 | | | | — | | | | — | | | | — | | | | — | |
Atlantic Region | | | 62 | | | | 12 | | | | 15 | | | | 7 | | | | 55 | | | | 102 | | | | 39 | | | | 5 | |
Asia Pacific Region | | | 5 | | | | 2 | | | | — | | | | 9 | | | | 14 | | | | 1 | | | | — | | | | 6 | |
| | | | | | | | | | | | | | | | | | | | | | | | | | | | | | | | |
| | | 104 | | | | 56 | | | | 71 | | | | 95 | | | | 149 | | | | 202 | | | | 103 | | | | 121 | |
| | | | | | | | | | | | | | | | | | | | | | | | | | | | | | | | |
Development | | | | | | | | | | | | | | | | | | | | | | | | | | | | | | | | |
Western Canada | | | 559 | | | | 456 | | | | 468 | | | | 591 | | | | 744 | | | | 505 | | | | 267 | | | | 513 | |
Oil Sands | | | 225 | | | | 203 | | | | 147 | | | | 133 | | | | 111 | | | | 146 | | | | 137 | | | | 158 | |
Atlantic Region | | | 205 | | | | 201 | | | | 90 | | | | 154 | | | | 34 | | | | 148 | | | | 116 | | | | 139 | |
Asia Pacific Region | | | 12 | | | | 139 | | | | 80 | | | | 149 | | | | 215 | | | | 133 | | | | 156 | | | | 129 | |
| | | | | | | | | | | | | | | | | | | | | | | | | | | | | | | | |
| | | 1,001 | | | | 999 | | | | 785 | | | | 1,027 | | | | 1,104 | | | | 932 | | | | 676 | | | | 939 | |
| | | | | | | | | | | | | | | | | | | | | | | | | | | | | | | | |
Acquisitions | | | | | | | | | | | | | | | | | | | | | | | | | | | | | | | | |
Western Canada | | | 31 | | | | 15 | | | | 3 | | | | 2 | | | | 27 | | | | 1 | | | | 4 | | | | 6 | |
| | | | | | | | | | | | | | | | | | | | | | | | | | | | | | | | |
Total Exploration and Production | | | 1,136 | | | | 1,070 | | | | 859 | | | | 1,124 | | | | 1,280 | | | | 1,135 | | | | 783 | | | | 1,066 | |
| | | | | | | | | | | | | | | | | | | | | | | | | | | | | | | | |
Infrastructure and Marketing | | | 98 | | | | 59 | | | | 30 | | | | 24 | | | | 41 | | | | 27 | | | | 17 | | | | 11 | |
| | | | | | | | | | | | | | | | | | | | | | | | | | | | | | | | |
Total Upstream | | | 1,234 | | | | 1,129 | | | | 889 | | | | 1,148 | | | | 1,321 | | | | 1,162 | | | | 800 | | | | 1,077 | |
Downstream | | | | | | | | | | | | | | | | | | | | | | | | | | | | | | | | |
Upgrader | | | 14 | | | | 23 | | | | 9 | | | | 4 | | | | 43 | | | | 129 | | | | 20 | | | | 13 | |
Canadian Refined Products | | | 31 | | | | 25 | | | | 19 | | | | 11 | | | | 32 | | | | 24 | | | | 41 | | | | 12 | |
U.S. Refining and Marketing | | | 118 | | | | 89 | | | | 92 | | | | 75 | | | | 99 | | | | 52 | | | | 42 | | | | 27 | |
| | | | | | | | | | | | | | | | | | | | | | | | | | | | | | | | |
| | | 163 | | | | 137 | | | | 120 | | | | 90 | | | | 174 | | | | 205 | | | | 103 | | | | 52 | |
Corporate | | | 22 | | | | 13 | | | | 47 | | | | 31 | | | | 42 | | | | 40 | | | | 29 | | | | 23 | |
| | | | | | | | | | | | | | | | | | | | | | | | | | | | | | | | |
| | | 1,419 | | | | 1,279 | | | | 1,056 | | | | 1,269 | | | | 1,537 | | | | 1,407 | | | | 932 | | | | 1,152 | |
| | | | | | | | | | | | | | | | | | | | | | | | | | | | | | | | |
| (1) | Excludes capitalized costs related to asset retirement obligations and capitalized interest incurred during the period. |
|
Management’s Discussion and Analysis 2014 50 |
Segmented Financial Information
| | | | | | | | | | | | | | | | | | | | | | | | | | | | | | | | | | | | | | | | | | | | | | | | |
| | | Upstream | | | Downstream | |
| | | Exploration and Production(1) | | | Infrastructure and
Marketing | | | Upgrading | |
2014($ millions) | | Q4 | | | Q3 | | | Q2 | | | Q1 | | | Q4 | | | Q3 | | | Q2 | | | Q1 | | | Q4 | | | Q3 | | | Q2 | | | Q1 | |
Gross revenues | | | 1,890 | | | | 2,210 | | | | 2,352 | | | | 2,182 | | | | 638 | | | | 647 | | | | 458 | | | | 459 | | | | 475 | | | | 604 | | | | 560 | | | | 573 | |
Royalties | | | (178 | ) | | | (260 | ) | | | (302 | ) | | | (290 | ) | | | — | | | | — | | | | — | | | | — | | | | — | | | | — | | | | — | | | | — | |
Marketing and other | | | — | | | | — | | | | — | | | | — | | | | 22 | | | | 11 | | | | 3 | | | | 34 | | | | — | | | | — | | | | — | | | | — | |
| | | | | | | | | | | | | | | | | | | | | | | | | | | | | | | | | | | | | | | | | | | | | | | | |
Revenues, net of royalties | | | 1,712 | | | | 1,950 | | | | 2,050 | | | | 1,892 | | | | 660 | | | | 658 | | | | 461 | | | | 493 | | | | 475 | | | | 604 | | | | 560 | | | | 573 | |
| | | | | | | | | | | | | | | | | | | | | | | | | | | | | | | | | | | | | | | | | | | | | | | | |
Expenses | | | | | | | | | | | | | | | | | | | | | | | | | | | | | | | | | | | | | | | | | | | | | | | | |
Purchases of crude oil and products | | | 20 | | | | 23 | | | | 31 | | | | 22 | | | | 604 | | | | 611 | | | | 426 | | | | 415 | | | | 380 | | | | 491 | | | | 421 | | | | 384 | |
Production and operating expenses | | | 540 | | | | 562 | | | | 525 | | | | 545 | | | | 10 | | | | 9 | | | | 5 | | | | 8 | | | | 48 | | | | 42 | | | | 43 | | | | 47 | |
Selling, general and administrative expenses | | | 22 | | | | 78 | | | | 74 | | | | 79 | | | | 3 | | | | 1 | | | | 2 | | | | 2 | | | | 2 | | | | 3 | | | | 2 | | | | 2 | |
Depletion, depreciation, amortization and impairment | | | 1,553 | | | | 671 | | | | 637 | | | | 573 | | | | 6 | | | | 6 | | | | 6 | | | | 7 | | | | 29 | | | | 27 | | | | 28 | | | | 24 | |
Exploration and evaluation expenses | | | 113 | | | | 42 | | | | 19 | | | | 40 | | | | — | | | | — | | | | — | | | | — | | | | — | | | | — | | | | — | | | | — | |
Other – net | | | (71 | ) | | | (60 | ) | | | (22 | ) | | | 93 | | | | (1 | ) | | | (1 | ) | | | — | | | | — | | | | 3 | | | | — | | | | — | | | | 8 | |
| | | | | | | | | | | | | | | | | | | | | | | | | | | | | | | | | | | | | | | | | | | | | | | | |
Earnings from operating activities | | | (465 | ) | | | 634 | | | | 786 | | | | 540 | | | | 38 | | | | 32 | | | | 22 | | | | 61 | | | | 13 | | | | 41 | | | | 66 | | | | 108 | |
| | | | | | | | | | | | | | | | | | | | | | | | | | | | | | | | | | | | | | | | | | | | | | | | |
Share of equity investment | | | 8 | | | | (10 | ) | | | (2 | ) | | | (2 | ) | | | — | | | | — | | | | — | | | | — | | | | — | | | | — | | | | — | | | | — | |
| | | | | | | | | | | | | | | | | | | | | | | | | | | | | | | | | | | | | | | | | | | | | | | | |
Net foreign exchange gains (losses) | | | — | | | | — | | | | — | | | | — | | | | — | | | | — | | | | — | | | | — | | | | — | | | | — | | | | — | | | | — | |
Finance income | | | (2 | ) | | | (1 | ) | | | 1 | | | | 1 | | | | — | | | | — | | | | — | | | | — | | | | — | | | | — | | | | — | | | | — | |
Finance expenses | | | (40 | ) | | | (41 | ) | | | (38 | ) | | | (32 | ) | | | — | | | | — | | | | — | | | | — | | | | — | | | | — | | | | — | | | | (1 | ) |
| | | | | | | | | | | | | | | | | | | | | | | | | | | | | | | | | | | | | | | | | | | | | | | | |
| | | (42 | ) | | | (42 | ) | | | (37 | ) | | | (31 | ) | | | — | | | | — | | | | — | | | | — | | | | — | | | | — | | | | — | | | | (1 | ) |
| | | | | | | | | | | | | | | | | | | | | | | | | | | | | | | | | | | | | | | | | | | | | | | | |
Earnings (loss) before income tax | | | (499 | ) | | | 582 | | | | 747 | | | | 507 | | | | 38 | | | | 32 | | | | 22 | | | | 61 | | | | 13 | | | | 41 | | | | 66 | | | | 107 | |
Provisions for (recovery of) income taxes | | | | | | | | | | | | | | | | | | | | | | | | | | | | | | | | | | | | | | | | | | | | | | | | |
Current | | | 52 | | | | 156 | | | | 112 | | | | 66 | | | | 36 | | | | 1 | | | | (13 | ) | | | 75 | | | | 1 | | | | 19 | | | | 17 | | | | 10 | |
Deferred | | | (177 | ) | | | (10 | ) | | | 81 | | | | 65 | | | | (26 | ) | | | 7 | | | | 19 | | | | (60 | ) | | | 3 | | | | (9 | ) | | | — | | | | 18 | |
| | | | | | | | | | | | | | | | | | | | | | | | | | | | | | | | | | | | | | | | | | | | | | | | |
| | | (125 | ) | | | 146 | | | | 193 | | | | 131 | | | | 10 | | | | 8 | | | | 6 | | | | 15 | | | | 4 | | | | 10 | | | | 17 | | | | 28 | |
| | | | | | | | | | | | | | | | | | | | | | | | | | | | | | | | | | | | | | | | | | | | | | | | |
Net earnings (loss) | | | (374 | ) | | | 436 | | | | 554 | | | | 376 | | | | 28 | | | | 24 | | | | 16 | | | | 46 | | | | 9 | | | | 31 | | | | 49 | | | | 79 | |
| | | | | | | | | | | | | | | | | | | | | | | | | | | | | | | | | | | | | | | | | | | | | | | | |
Capital expenditures(3) | | | 1,136 | | | | 1,070 | | | | 859 | | | | 1,124 | | | | 98 | | | | 59 | | | | 30 | | | | 24 | | | | 14 | | | | 23 | | | | 9 | | | | 4 | |
Total assets | | | 26,035 | | | | 26,283 | | | | 25,667 | | | | 25,525 | | | | 1,969 | | | | 1,907 | | | | 2,001 | | | | 1,978 | | | | 1,243 | | | | 1,244 | | | | 1,372 | | | | 1,330 | |
| | | | | | | | | | | | | | | | | | | | | | | | | | | | | | | | | | | | | | | | | | | | | | | | |
| (1) | Includes allocated depletion, depreciation, amortization and impairment related to assets in Infrastructure and Marketing, as these assets provide a service to Exploration and Production. |
| (2) | Eliminations relate to sales and operating revenues between segments recorded at transfer prices based on current market prices. |
| (3) | Excludes capitalized costs related to asset retirement obligations and capitalized interest incurred during the period. |
|
Management’s Discussion and Analysis 2014 51 |
| | | | | | | | | | | | | | | | | | | | | | | | | | | | | | | | | | | | | | | | | | | | | | | | | | | | | | | | | | | | | | |
| Downstream (continued) | | | Corporate and Eliminations(2) | | | Total | |
| Canadian Refined Products | | | U.S. Refining and
Marketing | | | | | | | |
| Q4 | | | Q3 | | | Q2 | | | Q1 | | | Q4 | | | Q3 | | | Q2 | | | Q1 | | | Q4 | | | Q3 | | | Q2 | | | Q1 | | | Q4 | | | Q3 | | | Q2 | | | Q1 | |
| | 945 | | | | 1,145 | | | | 991 | | | | 939 | | | | 2,504 | | | | 2,811 | | | | 2,928 | | | | 2,420 | | | | (599 | ) | | | (738 | ) | | | (678 | ) | | | (664 | ) | | | 5,853 | | | | 6,679 | | | | 6,611 | | | | 5,909 | |
| | — | | | | — | | | | — | | | | — | | | | — | | | | — | | | | — | | | | — | | | | — | | | | — | | | | — | | | | — | | | | (178 | ) | | | (260 | ) | | | (302 | ) | | | (290 | ) |
| | — | | | | — | | | | — | | | | — | | | | — | | | | — | | | | — | | | | — | | | | — | | | | — | | | | — | | | | — | | | | 22 | | | | 11 | | | | 3 | | | | 34 | |
| | | | | | | | | | | | | | | | | | | | | | | | | | | | | | | | | | | | | | | | | | | | | | | | | | | | | | | | | | | | | | |
| | 945 | | | | 1,145 | | | | 991 | | | | 939 | | | | 2,504 | | | | 2,811 | | | | 2,928 | | | | 2,420 | | | | (599 | ) | | | (738 | ) | | | (678 | ) | | | (664 | ) | | | 5,697 | | | | 6,430 | | | | 6,312 | | | | 5,653 | |
| | | | | | | | | | | | | | | | | | | | | | | | | | | | | | | | | | | | | | | | | | | | | | | | | | | | | | | | | | | | | | |
| | 782 | | | | 964 | | | | 822 | | | | 751 | | | | 2,655 | | | | 2,571 | | | | 2,659 | | | | 2,056 | | | | (599 | ) | | | (738 | ) | | | (678 | ) | | | (664 | ) | | | 3,842 | | | | 3,922 | | | | 3,681 | | | | 2,964 | |
| | 67 | | | | 65 | | | | 68 | | | | 63 | | | | 121 | | | | 113 | | | | 116 | | | | 122 | | | | — | | | | — | | | | — | | | | — | | | | 786 | | | | 791 | | | | 757 | | | | 785 | |
| | 14 | | | | 11 | | | | 9 | | | | 10 | | | | 2 | | | | 3 | | | | 2 | | | | 2 | | | | 91 | | | | (35 | ) | | | 59 | | | | 24 | | | | 134 | | | | 61 | | | | 148 | | | | 119 | |
| | 27 | | | | 26 | | | | 25 | | | | 24 | | | | 68 | | | | 77 | | | | 62 | | | | 61 | | | | 21 | | | | 18 | | | | 18 | | | | 16 | | | | 1,704 | | | | 825 | | | | 776 | | | | 705 | |
| | — | | | | — | | | | — | | | | — | | | | — | | | | — | | | | — | | | | — | | | | — | | | | — | | | | — | | | | — | | | | 113 | | | | 42 | | | | 19 | | | | 40 | |
| | — | | | | 1 | | | | — | | | | (1 | ) | | | — | | | | — | | | | — | | | | — | | | | — | | | | 4 | | | | (9 | ) | | | — | | | | (69 | ) | | | (56 | ) | | | (31 | ) | | | 100 | |
| | | | | | | | | | | | | | | | | | | | | | | | | | | | | | | | | | | | | | | | | | | | | | | | | | | | | | | | | | | | | | |
| | 55 | | | | 78 | | | | 67 | | | | 92 | | | | (342 | ) | | | 47 | | | | 89 | | | | 179 | | | | (112 | ) | | | 13 | | | | (68 | ) | | | (40 | ) | | | (813 | ) | | | 845 | | | | 962 | | | | 940 | |
| | | | | | | | | | | | | | | | | | | | | | | | | | | | | | | | | | | | | | | | | | | | | | | | | | | | | | | | | | | | | | |
| | — | | | | — | | | | — | | | | — | | | | — | | | | — | | | | — | | | | — | | | | — | | | | — | | | | — | | | | — | | | | 8 | | | | (10 | ) | | | (2 | ) | | | (2 | ) |
| | | | | | | | | | | | | | | | | | | | | | | | | | | | | | | | | | | | | | | | | | | | | | | | | | | | | | | | | | | | | | |
| | — | | | | — | | | | — | | | | — | | | | — | | | | — | | | | — | | | | — | | | | 35 | | | | 31 | | | | (3 | ) | | | 18 | | | | 35 | | | | 31 | | | | (3 | ) | | | 18 | |
| | — | | | | — | | | | — | | | | — | | | | — | | | | — | | | | — | | | | — | | | | 1 | | | | 1 | | | | 3 | | | | 4 | | | | (1 | ) | | | — | | | | 4 | | | | 5 | |
| | (1) | | | | (1 | ) | | | (2 | ) | | | (1 | ) | | | (1 | ) | | | (1 | ) | | | — | | | | (1 | ) | | | (17 | ) | | | (22 | ) | | | (37 | ) | | | 3 | | | | (59 | ) | | | (65 | ) | | | (77 | ) | | | (32 | ) |
| | | | | | | | | | | | | | | | | | | | | | | | | | | | | | | | | | | | | | | | | | | | | | | | | | | | | | | | | | | | | | |
| | (1) | | | | (1 | ) | | | (2 | ) | | | (1 | ) | | | (1 | ) | | | (1 | ) | | | — | | | | (1 | ) | | | 19 | | | | 10 | | | | (37 | ) | | | 25 | | | | (25 | ) | | | (34 | ) | | | (76 | ) | | | (9 | ) |
| | | | | | | | | | | | | | | | | | | | | | | | | | | | | | | | | | | | | | | | | | | | | | | | | | | | | | | | | | | | | | |
| | 54 | | | | 77 | | | | 65 | | | | 91 | | | | (343 | ) | | | 46 | | | | 89 | | | | 178 | | | | (93 | ) | | | 23 | | | | (105 | ) | | | (15 | ) | | | (830 | ) | | | 801 | | | | 884 | | | | 929 | |
| | 18 | | | | 18 | | | | 17 | | | | 27 | | | | (77 | ) | | | 2 | | | | 15 | | | | 61 | | | | 25 | | | | 27 | | | | 30 | | | | 22 | | | | 55 | | | | 223 | | | | 178 | | | | 261 | |
| | (5) | | | | 2 | | | | — | | | | (4 | ) | | | (50 | ) | | | 15 | | | | 18 | | | | 5 | | | | (27 | ) | | | 2 | | | | (40 | ) | | | (18 | ) | | | (282 | ) | | | 7 | | | | 78 | | | | 6 | |
| | | | | | | | | | | | | | | | | | | | | | | | | | | | | | | | | | | | | | | | | | | | | | | | | | | | | | | | | | | | | | |
| | 13 | | | | 20 | | | | 17 | | | | 23 | | | | (127 | ) | | | 17 | | | | 33 | | | | 66 | | | | (2 | ) | | | 29 | | | | (10 | ) | | | 4 | | | | (227 | ) | | | 230 | | | | 256 | | | | 267 | |
| | | | | | | | | | | | | | | | | | | | | | | | | | | | | | | | | | | | | | | | | | | | | | | | | | | | | | | | | | | | | | |
| | 41 | | | | 57 | | | | 48 | | | | 68 | | | | (216 | ) | | | 29 | | | | 56 | | | | 112 | | | | (91 | ) | | | (6 | ) | | | (95 | ) | | | (19 | ) | | | (603 | ) | | | 571 | | | | 628 | | | | 662 | |
| | | | | | | | | | | | | | | | | | | | | | | | | | | | | | | | | | | | | | | | | | | | | | | | | | | | | | | | | | | | | | |
| | 31 | | | | 25 | | | | 19 | | | | 11 | | | | 118 | | | | 89 | | | | 92 | | | | 75 | | | | 22 | | | | 13 | | | | 47 | | | | 31 | | | | 1,419 | | | | 1,279 | | | | 1,056 | | | | 1,269 | |
| | 1,676 | | | | 1,746 | | | | 1,839 | | | | 1,842 | | | | 5,788 | | | | 6,133 | | | | 5,891 | | | | 5,980 | | | | 2,137 | | | | 1,737 | | | | 883 | | | | 2,022 | | | | 38,848 | | | | 39,050 | | | | 37,653 | | | | 38,677 | |
| | | | | | | | | | | | | | | | | | | | | | | | | | | | | | | | | | | | | | | | | | | | | | | | | | | | | | | | | | | | | | |
|
Management’s Discussion and Analysis 2014 52 |
| | | | | | | | | | | | | | | | | | | | | | | | | | | | | | | | | | | | | | | | | | | | | | | | |
| | | Upstream | | | Downstream | |
| | | Exploration and Production(1) | | | Infrastructure and
Marketing | | | Upgrading | |
2013($ millions) | | Q4 | | | Q3 | | | Q2 | | | Q1 | | | Q4 | | | Q3 | | | Q2 | | | Q1 | | | Q4 | | | Q3 | | | Q2 | | | Q1 | |
Gross revenues | | | 1,734 | | | | 2,111 | | | | 1,843 | | | | 1,645 | | | | 457 | | | | 646 | | | | 664 | | | | 367 | | | | 484 | | | | 437 | | | | 573 | | | | 529 | |
Royalties | | | (215 | ) | | | (237 | ) | | | (208 | ) | | | (204 | ) | | | — | | | | — | | | | — | | | | — | | | | — | | | | — | | | | — | | | | — | |
Marketing and other | | | — | | | | — | | | | — | | | | — | | | | 76 | | | | 17 | | | | 57 | | | | 162 | | | | — | | | | — | | | | — | | | | — | |
| | | | | | | | | | | | | | | | | | | | | | | | | | | | | | | | | | | | | | | | | | | | | | | | |
Revenues, net of royalties | | | 1,519 | | | | 1,874 | | | | 1,635 | | | | 1,441 | | | | 533 | | | | 663 | | | | 721 | | | | 529 | | | | 484 | | | | 437 | | | | 573 | | | | 529 | |
| | | | | | | | | | | | | | | | | | | | | | | | | | | | | | | | | | | | | | | | | | | | | | | | |
Expenses | | | | | | | | | | | | | | | | | | | | | | | | | | | | | | | | | | | | | | | | | | | | | | | | |
Purchases of crude oil and products | | | 29 | | | | 17 | | | | 20 | | | | 25 | | | | 438 | | | | 609 | | | | 622 | | | | 335 | | | | 362 | | | | 341 | | | | 388 | | | | 287 | |
Production and operating expenses | | | 502 | | | | 528 | | | | 503 | | | | 483 | | | | 2 | | | | 3 | | | | 9 | | | | 7 | | | | 45 | | | | 39 | | | | 40 | | | | 37 | |
Selling, general and administrative expenses | | | 44 | | | | 60 | | | | 85 | | | | 51 | | | | 3 | | | | 4 | | | | 3 | | | | 2 | | | | 2 | | | | 1 | | | | 2 | | | | 2 | |
Depletion, depreciation, amortization and impairment | | | 791 | | | | 594 | | | | 568 | | | | 562 | | | | 2 | | | | 6 | | | | 6 | | | | 6 | | | | 25 | | | | 24 | | | | 23 | | | | 24 | |
Exploration and evaluation expenses | | | 28 | | | | 56 | | | | 74 | | | | 88 | | | | — | | | | — | | | | — | | | | — | | | | — | | | | — | | | | — | | | | — | |
Other – net | | | (63 | ) | | | 11 | | | | (24 | ) | | | 41 | | | | (2 | ) | | | — | | | | (1 | ) | | | — | | | | (23 | ) | | | (2 | ) | | | (1 | ) | | | (1 | ) |
| | | | | | | | | | | | | | | | | | | | | | | | | | | | | | | | | | | | | | | | | | | | | | | | |
Earnings from operating activities | | | 188 | | | | 608 | | | | 409 | | | | 191 | | | | 90 | | | | 41 | | | | 82 | | | | 179 | | | | 73 | | | | 34 | | | | 121 | | | | 180 | |
| | | | | | | | | | | | | | | | | | | | | | | | | | | | | | | | | | | | | | | | | | | | | | | | |
Share of equity investment | | | (5 | ) | | | 1 | | | | (6 | ) | | | — | | | | — | | | | — | | | | — | | | | — | | | | — | | | | — | | | | — | | | | — | |
| | | | | | | | | | | | | | | | | | | | | | | | | | | | | | | | | | | | | | | | | | | | | | | | |
Net foreign exchange gains (losses) | | | 1 | | | | (1 | ) | | | — | | | | — | | | | — | | | | — | | | | — | | | | — | | | | — | | | | — | | | | — | | | | — | |
Finance income | | | 2 | | | | — | | | | 2 | | | | — | | | | — | | | | — | | | | — | | | | — | | | | — | | | | — | | | | — | | | | — | |
Finance expenses | | | (27 | ) | | | (28 | ) | | | (23 | ) | | | (29 | ) | | | — | | | | — | | | | — | | | | — | | | | (1 | ) | | | (2 | ) | | | (2 | ) | | | (2 | ) |
| | | | | | | | | | | | | | | | | | | | | | | | | | | | | | | | | | | | | | | | | | | | | | | | |
| | | (24 | ) | | | (29 | ) | | | (21 | ) | | | (29 | ) | | | — | | | | — | | | | — | | | | — | | | | (1 | ) | | | (2 | ) | | | (2 | ) | | | (2 | ) |
| | | | | | | | | | | | | | | | | | | | | | | | | | | | | | | | | | | | | | | | | | | | | | | | |
Earnings (loss) before income taxes | | | 159 | | | | 580 | | | | 382 | | | | 162 | | | | 90 | | | | 41 | | | | 82 | | | | 179 | | | | 72 | | | | 32 | | | | 119 | | | | 178 | |
Provisions for (recovery of) income taxes | | | | | | | | | | | | | | | | | | | | | | | | | | | | | | | | | | | | | | | | | | | | | | | | |
Current | | | 54 | | | | 86 | | | | (30 | ) | | | 52 | | | | 43 | | | | (3 | ) | | | 90 | | | | 92 | | | | 6 | | | | 6 | | | | 1 | | | | 6 | |
Deferred | | | (13 | ) | | | 64 | | | | 129 | | | | (11 | ) | | | (20 | ) | | | 14 | | | | (69 | ) | | | (47 | ) | | | 13 | | | | 2 | | | | 30 | | | | 40 | |
| | | | | | | | | | | | | | | | | | | | | | | | | | | | | | | | | | | | | | | | | | | | | | | | |
| | | 41 | | | | 150 | | | | 99 | | | | 41 | | | | 23 | | | | 11 | | | | 21 | | | | 45 | | | | 19 | | | | 8 | | | | 31 | | | | 46 | |
| | | | | | | | | | | | | | | | | | | | | | | | | | | | | | | | | | | | | | | | | | | | | | | | |
Net earnings (loss) | | | 118 | | | | 430 | | | | 283 | | | | 121 | | | | 67 | | | | 30 | | | | 61 | | | | 134 | | | | 53 | | | | 24 | | | | 88 | | | | 132 | |
| | | | | | | | | | | | | | | | | | | | | | | | | | | | | | | | | | | | | | | | | | | | | | | | |
Capital expenditures(3) | | | 1,280 | | | | 1,135 | | | | 783 | | | | 1,066 | | | | 41 | | | | 27 | | | | 17 | | | | 11 | | | | 43 | | | | 129 | | | | 20 | | | | 13 | |
Total assets | | | 24,653 | | | | 24,058 | | | | 23,603 | | | | 23,250 | | | | 1,670 | | | | 1,766 | | | | 1,554 | | | | 1,476 | | | | 1,355 | | | | 1,214 | | | | 1,217 | | | | 1,214 | |
| | | | | | | | | | | | | | | | | | | | | | | | | | | | | | | | | | | | | | | | | | | | | | | | |
| (1) | Includes allocated depletion, depreciation, amortization and impairment related to assets in Infrastructure and Marketing, as these assets provide a service to the Exploration and Production. |
| (2) | Eliminations relate to sales and operating revenues between segments recorded at transfer prices based on current market prices. |
| (3) | Excludes capitalized costs related to asset retirement obligations and capitalized interest incurred during the period. |
|
Management’s Discussion and Analysis 2014 53 |
| | | | | | | | | | | | | | | | | | | | | | | | | | | | | | | | | | | | | | | | | | | | | | | | | | | | | | | | | | | | | | |
| Downstream (continued) | | | Corporate and Eliminations(2) | | | Total | |
| Canadian Refined Products | | | U.S. Refining and
Marketing | | | | | | | |
| Q4 | | | Q3 | | | Q2 | | | Q1 | | | Q4 | | | Q3 | | | Q2 | | | Q1 | | | Q4 | | | Q3 | | | Q2 | | | Q1 | | | Q4 | | | Q3 | | | Q2 | | | Q1 | |
| | 1,288 | | | | 993 | | | | 613 | | | | 843 | | | | 2,690 | | | | 2,405 | | | | 2,922 | | | | 2,711 | | | | (597 | ) | | | (573 | ) | | | (466 | ) | | | (450 | ) | | | 6,056 | | | | 6,019 | | | | 6,149 | | | | 5,645 | |
| | — | | | | — | | | | — | | | | — | | | | — | | | | — | | | | — | | | | — | | | | — | | | | — | | | | — | | | | — | | | | (215 | ) | | | (237 | ) | | | (208 | ) | | | (204 | ) |
| | — | | | | — | | | | — | | | | — | | | | — | | | | — | | | | — | | | | — | | | | — | | | | — | | | | — | | | | — | | | | 76 | | | | 17 | | | | 57 | | | | 162 | |
| | | | | | | | | | | | | | | | | | | | | | | | | | | | | | | | | | | | | | | | | | | | | | | | | | | | | | | | | | | | | | |
| | 1,288 | | | | 993 | | | | 613 | | | | 843 | | | | 2,690 | | | | 2,405 | | | | 2,922 | | | | 2,711 | | | | (597 | ) | | | (573 | ) | | | (466 | ) | | | (450 | ) | | | 5,917 | | | | 5,799 | | | | 5,998 | | | | 5,603 | |
| | | | | | | | | | | | | | | | | | | | | | | | | | | | | | | | | | | | | | | | | | | | | | | | | | | | | | | | | | | | | | |
| | 1,129 | | | | 875 | | | | 468 | | | | 662 | | | | 2,543 | | | | 2,174 | | | | 2,504 | | | | 2,325 | | | | (597 | ) | | | (573 | ) | | | (466 | ) | | | (450 | ) | | | 3,904 | | | | 3,443 | | | | 3,536 | | | | 3,184 | |
| | 59 | | | | 57 | | | | 57 | | | | 54 | | | | 102 | | | | 109 | | | | 107 | | | | 102 | | | | — | | | | — | | | | — | | | | — | | | | 710 | | | | 736 | | | | 716 | | | | 683 | |
| | 6 | | | | 9 | | | | 7 | | | | 4 | | | | — | | | | — | | | | 1 | | | | 3 | | | | 90 | | | | 55 | | | | 20 | | | | 52 | | | | 145 | | | | 129 | | | | 118 | | | | 114 | |
| | 23 | | | | 23 | | | | 22 | | | | 22 | | | | 60 | | | | 58 | | | | 58 | | | | 57 | | | | 17 | | | | 13 | | | | 11 | | | | 10 | | | | 918 | | | | 718 | | | | 688 | | | | 681 | |
| | — | | | | — | | | | — | | | | — | | | | — | | | | — | | | | — | | | | — | | | | — | | | | — | | | | — | | | | — | | | | 28 | | | | 56 | | | | 74 | | | | 88 | |
| | 1 | | | | (3 | ) | | | (2 | ) | | | (1 | ) | | | — | | | | (1 | ) | | | 1 | | | | — | | | | — | | | | (8 | ) | | | 5 | | | | (14 | ) | | | (87 | ) | | | (3 | ) | | | (22 | ) | | | 25 | |
| | | | | | | | | | | | | | | | | | | | | | | | | | | | | | | | | | | | | | | | | | | | | | | | | | | | | | | | | | | | | | |
| | 70 | | | | 32 | | | | 61 | | | | 102 | | | | (15 | ) | | | 65 | | | | 251 | | | | 224 | | | | (107 | ) | | | (60 | ) | | | (36 | ) | | | (48 | ) | | | 299 | | | | 720 | | | | 888 | | | | 828 | |
| | | | | | | | | | | | | | | | | | | | | | | | | | | | | | | | | | | | | | | | | | | | | | | | | | | | | | | | | | | | | | |
| | — | | | | — | | | | — | | | | — | | | | — | | | | — | | | | — | | | | — | | | | — | | | | — | | | | — | | | | — | | | | (5 | ) | | | 1 | | | | (6 | ) | | | — | |
| | | | | | | | | | | | | | | | | | | | | | | | | | | | | | | | | | | | | | | | | | | | | | | | | | | | | | | | | | | | | | |
| | — | | | | — | | | | — | | | | — | | | | — | | | | — | | | | — | | | | — | | | | 12 | | | | 7 | | | | 10 | | | | (8 | ) | | | 13 | | | | 6 | | | | 10 | | | | (8 | ) |
| | — | | | | — | | | | — | | | | — | | | | — | | | | — | | | | — | | | | — | | | | 13 | | | | 11 | | | | 12 | | | | 11 | | | | 15 | | | | 11 | | | | 14 | | | | 11 | |
| | (1) | | | | (1 | ) | | | (2 | ) | | | (1 | ) | | | (1 | ) | | | (1 | ) | | | — | | | | (1 | ) | | | (4 | ) | | | (10 | ) | | | (13 | ) | | | (20 | ) | | | (34 | ) | | | (42 | ) | | | (40 | ) | | | (53 | ) |
| | | | | | | | | | | | | | | | | | | | | | | | | | | | | | | | | | | | | | | | | | | | | | | | | | | | | | | | | | | | | | |
| | (1) | | | | (1 | ) | | | (2 | ) | | | (1 | ) | | | (1 | ) | | | (1 | ) | | | — | | | | (1 | ) | | | 21 | | | | 8 | | | | 9 | | | | (17 | ) | | | (6 | ) | | | (25 | ) | | | (16 | ) | | | (50 | ) |
| | | | | | | | | | | | | | | | | | | | | | | | | | | | | | | | | | | | | | | | | | | | | | | | | | | | | | | | | | | | | | |
| | 69 | | | | 31 | | | | 59 | | | | 101 | | | | (16 | ) | | | 64 | | | | 251 | | | | 223 | | | | (86 | ) | | | (52 | ) | | | (27 | ) | | | (65 | ) | | | 288 | | | | 696 | | | | 866 | | | | 778 | |
| | | | | | | | | | | | | | | |
| | 11 | | | | 17 | | | | 7 | | | | 30 | | | | (43 | ) | | | (25 | ) | | | 44 | | | | 42 | | | | 22 | | | | 33 | | | | 62 | | | | (14 | ) | | | 93 | | | | 114 | | | | 174 | | | | 208 | |
| | 6 | | | | (9 | ) | | | 8 | | | | (4 | ) | | | 38 | | | | 47 | | | | 44 | | | | 36 | | | | (6 | ) | | | (48 | ) | | | (55 | ) | | | 21 | | | | 18 | | | | 70 | | | | 87 | | | | 35 | |
| | | | | | | | | | | | | | | | | | | | | | | | | | | | | | | | | | | | | | | | | | | | | | | | | | | | | | | | | | | | | | |
| | 17 | | | | 8 | | | | 15 | | | | 26 | | | | (5 | ) | | | 22 | | | | 88 | | | | 78 | | | | 16 | | | | (15 | ) | | | 7 | | | | 7 | | | | 111 | | | | 184 | | | | 261 | | | | 243 | |
| | | | | | | | | | | | | | | | | | | | | | | | | | | | | | | | | | | | | | | | | | | | | | | | | | | | | | | | | | | | | | |
| | 52 | | | | 23 | | | | 44 | | | | 75 | | | | (11 | ) | | | 42 | | | | 163 | | | | 145 | | | | (102 | ) | | | (37 | ) | | | (34 | ) | | | (72 | ) | | | 177 | | | | 512 | | | | 605 | | | | 535 | |
| | | | | | | | | | | | | | | | | | | | | | | | | | | | | | | | | | | | | | | | | | | | | | | | | | | | | | | | | | | | | | |
| | 32 | | | | 24 | | | | 41 | | | | 12 | | | | 99 | | | | 52 | | | | 42 | | | | 27 | | | | 42 | | | | 40 | | | | 29 | | | | 23 | | | | 1,537 | | | | 1,407 | | | | 932 | | | | 1,152 | |
| | 1,788 | | | | 1,704 | | | | 1,656 | | | | 1,714 | | | | 5,537 | | | | 5,665 | | | | 5,525 | | | | 5,397 | | | | 1,901 | | | | 2,193 | | | | 2,439 | | | | 2,468 | | | | 36,904 | | | | 36,600 | | | | 35,994 | | | | 35,519 | |
| | | | | | | | | | | | | | | | | | | | | | | | | | | | | | | | | | | | | | | | | | | | | | | | | | | | | | | | | | | | | | |
|
Management’s Discussion and Analysis 2014 54 |
| | |
Exhibit No. | | Description |
| |
| 23.1 | | Consent of KPMG LLP, independent registered public accounting firm. |
| 23.2 | | Consent of McDaniel and Associates Consultants Ltd., independent engineers. |
| 23.3 | | Consent of Sproule Unconventional Limited, independent engineers. |
| 23.4 | | Consent of Richard Leslie, P. Eng, internal qualified reserves evaluator. |
| 31.1 | | Certification of Chief Executive Officer pursuant to Rule 13a-14(a) or 15d-14(a) of the Securities Exchange Act of 1934. |
| 31.2 | | Certification of Chief Financial Officer pursuant to Rule 13a-14(a) or 15d-14(a) of the Securities Exchange Act of 1934. |
| 32.1 | | Certification of Chief Executive Officer pursuant to Rule 13(a)-14(b) or Rule 15d-14(b)and Section 1350 of Chapter 63 of Title 18 of the United States Code (18 U.S.C. 1350). |
| 32.2 | | Certification of Chief Financial Officer pursuant to Rule 13(a)-14(b) or Rule 15d-14(b) and Section 1350 of Chapter 63 of Title 18 of the United States Code (18 U.S.C. 1350). |
| 99.1 | | Supplemental Disclosures of Oil and Gas Activities. |
| 99.2 | | Amended Code of Business Conduct. |