EXHIBIT 99.1

This description of Hydro-Québec is dated as of April 26, 2012 and appears as Exhibit 99.1 to Hydro-Québec’s annual report on Form 18-K to the U.S. Securities and Exchange Commission for the fiscal year ended December 31, 2011.
This document may be delivered to you at any time but you should assume that the information is accurate only as of April 26, 2012. Hydro-Québec’s business, financial condition, results of operations and prospects may have changed since that date.
This document does not constitute an offer to sell or the solicitation of an offer to buy any securities of Hydro-Québec, unless it is included in a registration statement filed under the Securities Act of 1933, as amended.
TABLE OF CONTENTS
| Page |
Where You Can Find More Information | 3 |
Forward-Looking Statements | 3 |
Foreign Exchange | 3 |
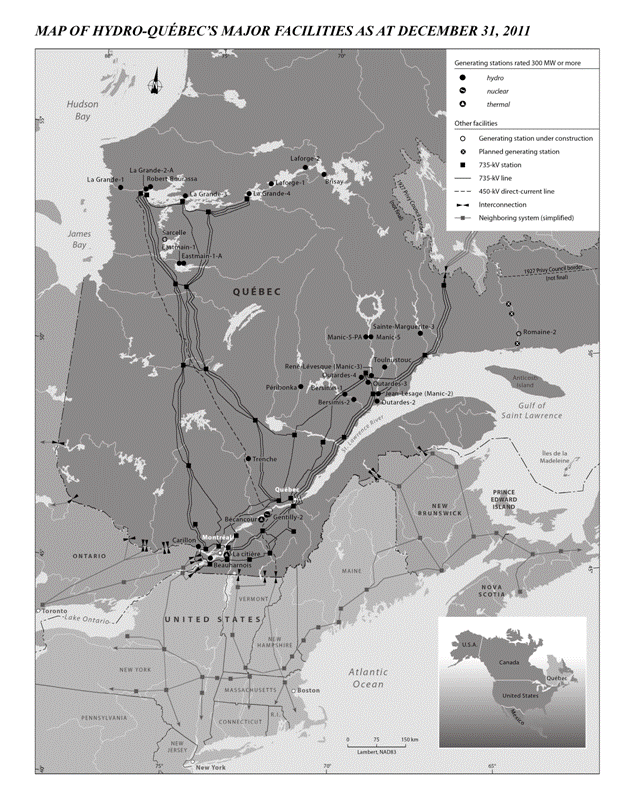
Map of Hydro-Québec’s Major Facilities | 4 |
Five-Year Review | 5 |
Hydro-Québec | 8 |
General | 8 |
Generation | 9 |
Generation Operations | 10 |
Wholesale and Trading Operations | 12 |
Transmission | 14 |
Transmission System | 14 |
Distribution | 15 |
Electricity Rates | 17 |
Electricity Sales and Revenue | 17 |
Construction | 18 |
Corporate and Other Activities | 18 |
Corporate Outlook | 19 |
Development Strategy | 19 |
Water-Power Royalties | 20 |
Capital Investment Program | 21 |
Regulatory Framework | 24 |
Litigation | 26 |
Employees | 26 |
Management’s Discussion and Analysis | 27 |
Overview | 27 |
Consolidated Results | 28 |
Financial Position | 30 |
Segmented Information | 32 |
Integrated Business Risk Management | 41 |
Summary of Certain Material Differences between Canadian GAAP and US GAAP | 45 |
Independent Auditors’ Report | 47 |
Consolidated Financial Statements | 49 |
Supplementary Information | 81 |
2
WHERE YOU CAN FIND MORE INFORMATION
This document appears as an exhibit to Hydro-Québec’s annual report filed with the U.S. Securities and Exchange Commission (the “SEC”) on Form 18-K for the fiscal year ended December 31, 2011. Additional information with respect to Hydro-Québec is available in the annual report or in other exhibits or amendments to the annual report.
You may read and copy any document we file with the SEC at the SEC’s public reference rooms in Washington, DC. Please call the SEC’s toll free number at 1-800-SEC-0330 for further information on the public reference room. These filings are also available from the Electronic Data Gathering, Analysis, and Retrieval system, which is commonly known by the acronym EDGAR, through the SEC’s website at http://www.sec.gov.
You may request a copy of these filings at no cost by calling Hydro-Québec at (514) 289-3147. This document is also available on our website at www.hydroquebec.com; however, any other information available on our website (such website listed in the 18-K is an inactive textual reference only) shall not be deemed to form a part of this document or the annual report to which it appears as an exhibit.
FORWARD-LOOKING STATEMENTS
Various statements made throughout this document are forward looking and contain information about financial results, economic conditions and trends, including, without limitation, the statements under the captions Corporate Outlook and Management’s Discussion and Analysis. The words “estimate”, “believe”, “expect”, “forecast”, “anticipate”, “intend” and “plan” and similar expressions identify forward-looking statements. You are cautioned that any such forward-looking statements are not guarantees of future performance. Forward-looking statements involve risks and uncertainties, and actual results may differ materially from those in the forward-looking statements as a result of various factors. Such factors may include, among others, business risks, such as variations in runoff that affect hydroelectric plant performance, and general levels of economic activity which affect demand for electricity, and risks related to economic parameters, such as changes in interest and exchange rates. You are cautioned not to place undue reliance on these forward-looking statements which speak only as of the date of this document. We undertake no obligation to publicly release the result of any revisions to these forward-looking statements which may be made to reflect events or circumstances after the date hereof or to reflect the occurrence of unanticipated events.
FOREIGN EXCHANGE
Canada maintains a floating exchange rate for the Canadian dollar in order to permit the rate to be determined by fundamental forces without intervention except as required to maintain orderly conditions. Annual average noon spot exchange rates for major foreign currencies in which the debt of Hydro-Québec is denominated, expressed in Canadian dollars, are shown below.
Foreign Currency | | 2007 | | 2008 | | 2009 | | 2010 | | 2011 | | 2012 (1) | |
United States Dollar | | $ | 1.0748 | | $ | 1.0660 | | $ | 1.1420 | | $ | 1.0299 | | $ | 0.9891 | | $ | 1.0012 | |
Euro | | 1.4691 | | 1.5603 | | 1.5855 | | 1.3661 | | 1.3767 | | 1.3129 | |
Pound Sterling | | 2.1487 | | 1.9617 | | 1.7804 | | 1.5918 | | 1.5861 | | 1.5732 | |
100 Japanese Yen | | 0.9121 | | 1.0370 | | 1.2200 | | 1.1760 | | 1.2420 | | 1.2640 | |
| | | | | | | | | | | | | | | | | | | |
(1) Monthly average through the end of March 2012.
Source: Bank of Canada.
In this document, unless otherwise specified or the context otherwise requires, all dollar amounts are expressed in Canadian dollars.
3
4
FIVE-YEAR REVIEW
CONSOLIDATED AND SELECTED FINANCIAL INFORMATION
| | Years ended December 31 | |
| | 2007 | | 2008 | | 2009 | | 2010 | | 2011 | |
| | (in millions of dollars) | |
OPERATIONS | | | | | | | | | | | |
| | | | | | | | | | | |
Revenue (a) | | $ | 12,442 | | $ | 12,646 | | $ | 12,217 | | $ | 12,484 | | $ | 12,392 | |
| | | | | | | | | | | |
Expenditure | | | | | | | | | | | |
Operations (a) | | 2,556 | | 2,502 | | 2,527 | | 2,579 | | 2,571 | |
Electricity and fuel purchases | | 1,555 | | 1,406 | | 1,207 | | 1,390 | | 1,224 | |
Depreciation and amortization (a) | | 2,228 | | 2,316 | | 2,286 | | 2,565 | | 2,623 | |
Taxes | | 820 | | 1,093 | | 928 | | 909 | | 866 | |
| | 7,159 | | 7,317 | | 6,948 | | 7,443 | | 7,284 | |
| | | | | | | | | | | |
Operating income | | 5,283 | | 5,329 | | 5,269 | | 5,041 | | 5,108 | |
| | | | | | | | | | | |
Financial expenses | | 2,510 | | 2,443 | | 2,398 | | 2,526 | | 2,497 | |
| | | | | | | | | | | |
Income from continuing operations | | 2,773 | | 2,886 | | 2,871 | | 2,515 | | 2,611 | |
| | | | | | | | | | | |
Income from discontinued operations | | 25 | | 129 | | — | | — | | — | |
| | | | | | | | | | | |
Net income | | $ | 2,798 | | $ | 3,015 | | $ | 2,871 | | $ | 2,515 | | $ | 2,611 | |
| | | | | | | | | | | |
DIVIDEND | | $ | 2,095 | | $ | 2,252 | | $ | 2,168 | | $ | 1,886 | | $ | 1,958 | |
| | | | | | | | | | | |
BALANCE SHEET SUMMARY | | | | | | | | | | | |
Total assets | | $ | 61,107 | | $ | 62,850 | | $ | 64,918 | | $ | 65,809 | | $ | 69,637 | |
Long-term debt, including current portion and perpetual debt | | $ | 34,534 | | $ | 36,415 | | $ | 37,943 | | $ | 38,660 | | $ | 42,050 | |
Equity | | $ | 17,206 | | $ | 18,250 | | $ | 18,419 | | $ | 18,566 | | $ | 18,834 | |
| | | | | | | | | | | |
INVESTMENTS FOR CONTINUING OPERATIONS AFFECTING CASH | | | | | | | | | | | |
Property, plant and equipment and intangible assets (b) | | $ | 3,590 | | $ | 3,954 | | $ | 4,307 | | $ | 4,220 | | $ | 3,814 | |
| | | | | | | | | | | |
FINANCIAL RATIOS | | | | | | | | | | | |
Interest coverage (c) | | 2.09 | | 2.07 | | 2.11 | | 1.92 | | 1.99 | |
Return on equity (d) | | 17.8 | % | 18.1 | % | 16.5 | % | 14.0 | % | 14.0 | % |
Profit margin from continuing operations (e) | | 22.3 | % | 22.8 | % | 23.5 | % | 20.1 | % | 21.1 | % |
Capitalization (f) | | 33.1 | % | 33.4 | % | 32.6 | % | 32.1 | % | 31.0 | % |
Self-financing (g) | | 63.7 | % | 45.7 | % | 41.3 | % | 46.8 | % | 47.6 | % |
(a) In the 2011 Consolidated Financial Statements, we have retrospectively reclassified the Energy Efficiency Plan as an intangible asset, and certain regulatory variance accounts as financial assets and liabilities. These changes are described in Note 2 to the 2011 Consolidated Financial Statements and have been reflected from 2007 for the purposes of the Five-Year Review.
(b) Including the Energy Efficiency Plan.
(c) Sum of operating income and net investment income divided by gross interest expense.
(d) Net income divided by average equity less average accumulated other comprehensive income.
(e) Income from continuing operations divided by revenue.
(f) Equity divided by the sum of equity, long-term debt (including current portion), perpetual debt, borrowings and derivative instrument liabilities, less derivative instrument assets.
(g) Cash flows from operating activities less dividend paid, divided by the sum of cash flows from investing activities, excluding net disposal (acquisition) of short-term investments, and repayment of long-term debt and sinking fund.
Note: Throughout the Five-Year Review, certain comparative figures have been reclassified to conform to the presentation adopted in the current year.
5
FIVE-YEAR REVIEW (CONTINUED)
OPERATING STATISTICS
| | Years ended December 31 | |
| | 2007 | | 2008 | | 2009 | | 2010 | | 2011 | |
| | (in GWh) | |
Electricity Sales | | | | | | | | | | | |
In Québec, by category | | | | | | | | | | | |
Residential and farm | | 60,046 | | 60,747 | | 62,484 | | 59,534 | | 62,748 | |
Commercial and institutional | | 34,751 | | 35,228 | | 34,151 | | 33,865 | | 33,569 | |
Industrial | | 73,005 | | 69,144 | | 63,310 | | 68,439 | | 67,621 | |
Other | | 5,353 | | 5,278 | | 5,371 | | 7,647 | | 6,028 | |
| | 173,155 | | 170,397 | | 165,316 | | 169,485 | | 169,966 | |
Outside Québec | | | | | | | | | | | |
Canada/U.S. (long-term) | | 2,384 | | 2,516 | | 2,604 | | 2,677 | | 2,617 | |
Canada/U.S. (short-term) | | 17,240 | | 18,783 | | 20,753 | | 20,593 | | 24,146 | |
| | 19,624 | | 21,299 | | 23,357 | | 23,270 | | 26,763 | |
Total Electricity Sales | | 192,779 | | 191,696 | | 188,673 | | 192,755 | | 196,729 | |
| | (in millions of dollars) | |
Revenue from Electricity Sales | | | | | | | | | | | |
In Québec, by category | | | | | | | | | | | |
Residential and farm | | $ | 4,144 | | $ | 4,300 | | $ | 4,500 | | $ | 4,302 | | $ | 4,536 | |
Commercial and institutional | | 2,602 | | 2,687 | | 2,662 | | 2,648 | | 2,599 | |
Industrial | | 3,336 | | 3,174 | | 3,092 | | 3,185 | | 3,262 | |
Other | | 286 | | 284 | | 295 | | 371 | | 323 | |
| | 10,368 | | 10,445 | | 10,549 | | 10,506 | | 10,720 | |
Outside Québec | | | | | | | | | | | |
Canada/U.S. (long-term) | | 225 | | 220 | | 256 | | 247 | | 254 | |
Canada/U.S. (short-term) | | 1,392 | | 1,699 | | 1,250 | | 1,266 | | 1,145 | |
| | 1,617 | | 1,919 | | 1,506 | | 1,513 | | 1,399 | |
Total Revenue from Electricity Sales | | $ | 11,985 | | $ | 12,364 | | $ | 12,055 | | $ | 12,019 | | $ | 12,119 | |
| | (as at December 31) | |
Number of Customer Accounts | | | | | | | | | | | |
In Québec, by category | | | | | | | | | | | |
Residential and farm | | 3,554,443 | | 3,603,330 | | 3,649,470 | | 3,698,169 | | 3,746,397 | |
Commercial and institutional | | 299,524 | | 296,504 | | 297,380 | | 300,163 | | 291,212 | (a) |
Industrial | | 11,565 | | 10,111 | | 9,829 | | 9,589 | | 18,573 | (a) |
Other | | 3,440 | | 3,499 | | 3,653 | | 3,868 | | 4,013 | |
Total Customer Accounts | | 3,868,972 | | 3,913,444 | | 3,960,332 | | 4,011,789 | | 4,060,195 | |
| | (kWh/customer account) | |
Average Annual Consumption | | | | | | | | | | | |
In Québec, by category | | | | | | | | | | | |
Residential and farm | | 17,019 | | 16,974 | | 17,230 | | 16,205 | | 16,857 | |
Commercial and institutional | | 116,782 | | 118,209 | | 115,009 | | 113,347 | | 113,529 | |
Industrial | | 6,187,651 | | 6,379,775 | | 6,350,050 | | 7,049,027 | | 4,802,287 | |
Other | | 1,162,811 | | 1,521,257 | | 1,501,957 | | 2,033,506 | | 1,529,755 | |
(a) Reflects a reclassification in 2011.
6
FIVE-YEAR REVIEW (CONTINUED)
OPERATING STATISTICS (CONTINUED)
| | Years ended December 31 | |
| | 2007 | | 2008 | | 2009 | | 2010 | | 2011 | |
| | (in MW) | |
Installed Capacity (a) | | | | | | | | | | | |
Hydroelectric | | 33,305 | | 34,118 | | 34,499 | | 34,490 | | 35,285 | |
Nuclear | | 675 | | 675 | | 675 | | 675 | | 675 | |
Thermal | | 1,672 | | 1,637 | | 1,637 | | 1,506 | | 1,011 | |
Wind farm | | 2 | | 2 | | 2 | | — | | — | |
Total Installed Capacity | | 35,654 | | 36,432 | | 36,813 | | 36,671 | | 36,971 | |
| | | | | | | | | | | |
| | (in GWh) | |
| | | | | | | | | | | |
Total Energy Requirements (b) | | 209,818 | | 211,228 | | 208,524 | | 209,108 | | 214,764 | |
| | | | | | | | | | | |
| | (in MW) | |
| | | | | | | | | | | |
Peak Power Demand in Québec (c) | | 35,352 | | 37,230 | | 34,659 | | 37,717 | | 35,481 | |
| | | | | | | | | | | |
| | (in km *) | |
| | | | | | | | | | | |
Lines (overhead and underground) | | | | | | | | | | | |
Transmission | | 33,008 | | 33,058 | | 33,244 | | 33,453 | | 33,630 | |
Distribution (d) | | 109,618 | | 110,127 | | 111,205 | | 112,089 | | 113,525 | |
| | 142,626 | | 143,185 | | 144,449 | | 145,542 | | 147,155 | |
(a) In addition to the generating capacity of our own facilities, we have access to almost all the output from Churchill Falls generating station (5,428 MW) under a contract with Churchill Falls (Labrador) Corporation Limited that will remain in effect until 2041. We also purchase all the output from 12 wind farms (919 MW) and 3 small hydropower plants (23 MW) operated by independent power producers. An additional 1,215 MW is available under long-term contracts with other suppliers.
(b) Total energy requirements consist of kilowatthours delivered within Québec and to neighboring systems.
(c) Total power demand at the annual domestic peak for the winter beginning in December, including interruptible power. The 2011-2012 winter peak occurred at 8:00 a.m. on January 16, 2012.
(d) These figures include off-grid systems but exclude private systems, lines under construction and 44-kV lines (transmission).
* I km = 0.62 miles
OTHER INFORMATION
| | Years ended December 31 | |
| | 2007 | | 2008 | | 2009 | | 2010 | | 2011 | |
| | | | | | | | | | | |
Rate (Decrease) Increases | | | | | | | | | | | |
Average (decrease) increase from January 1 to December 31 | | 2.8 | % | 2.7 | % | 1.6 | % | 0.6 | % | (0.2 | )% |
| | | | | | | | | | | |
As at December 31 | | | | | | | | | | | |
Number of Employees (a) | | | | | | | | | | | |
Permanent | | 19,459 | | 19,297 | | 19,536 | | 19,521 | | 19,415 | |
Temporary | | 3,610 | | 3,619 | | 3,554 | | 3,571 | | 3,086 | |
Total | | 23,069 | | 22,916 | | 23,090 | | 23,092 | | 22,501 | |
Women | | 31.3 | % | 30.9 | % | 30.6 | % | 30.9 | % | 31.1 | % |
(a) Excludes employees of subsidiaries and joint ventures.
UNITS OF MEASURE
V: volt (a unit for measuring voltage) |
kV: kilovolt (one thousand volts) |
W: watt (a unit for measuring power) | Wh: watthour (a unit for measuring electric energy) |
kW: kilowatt (one thousand watts) | kWh: kilowatthour (one thousand watthours) |
MW: megawatt (one million watts) | MWh: megawatthour (one million watthours) |
GW: gigawatt (one million kilowatts) | GWh: gigawatthour (one million kilowatthours) |
| TWh: terawatthour (one billion kilowatthours) |
7
HYDRO-QUÉBEC
GENERAL
We operate one of the major systems in Canada for the generation, transmission and distribution of electric power. We supply virtually all electric power distributed in Québec, the largest province in Canada in land area and the second largest in population.
Hydro-Québec was created in 1944 by the Hydro-Québec Act of the Parliament of Québec and is an agent of Québec. All capital stock of Hydro-Québec is held by the Minister of Finance on behalf of the Government of Québec (the “Government”).
Our head office is located at 75 René-Lévesque Boulevard West, Montréal, Québec, Canada.
Our operations are allocated among five business segments:
· Generation: Hydro-Québec Production operates and develops our generating facilities in Québec. It also sells electricity in markets outside Québec and engages in energy trading. Hydro-Québec Production is required to provide Hydro-Québec Distribution with a base volume of up to 165 TWh of heritage pool electricity annually at an average price of 2.79¢/kWh (“Heritage Pool Electricity”). In excess of this volume, it may participate in Hydro-Québec Distribution’s calls for tenders in a context of free market competition;
· Transmission: Hydro-Québec TransÉnergie operates and develops our power transmission system. It markets system capacity and manages power flows throughout Québec;
· Distribution: Hydro-Québec Distribution operates and develops our distribution system and is responsible for sales and services to Québec customers. It also promotes energy efficiency and ensures the security of the supply of electricity to the Québec market;
· Construction: Hydro-Québec Équipement et services partagés and our wholly-owned subsidiary, Société d’énergie de la Baie James (“SEBJ”), design, build and refurbish generating and transmission facilities. Hydro-Québec Équipement et services partagés is responsible for projects throughout Québec, except in the territory governed by the James Bay and Northern Québec Agreement (the “JBNQ Agreement”). SEBJ builds generating facilities in the territory governed by the JBNQ Agreement (north of the 49th parallel) and may carry out projects outside Québec; and
· Corporate and Other Activities: The following corporate units support our divisions in the achievement of their business objectives: Groupe — Technologie (Technology Group), Groupe — Affaires corporatives et secrétariat général (Corporate Affairs and General Secretariat Group), Vice-présidence — Comptabilité et contrôle (Accounting and Control Vice Presidency), Vice-présidence — Financement, trésorerie et caisse de retraite (Financing, Treasury and Pension Fund Vice Presidency) and Vice-présidence — Ressources humaines (Human Resources Vice Presidency) as well as the Direction principale — Centre de services partagés (Shared Services Centre Unit), which reports to Hydro-Québec Équipement et services partagés. The Centre de services partagés (Shared Services Centre) brings together internal company-wide shared services, including procurement of goods and services, real estate management, document management, material management and transportation, food and accommodation services.
8
GENERATION
Hydro-Québec Production generates electricity to supply the Québec market and sells its excess output on wholesale markets. Hydro-Québec Production also offers balancing and firming capacity services to Hydro-Québec Distribution to offset variations in wind farm output and thereby facilitate the integration of this energy source.
The following subsidiaries, affiliates and interests are also part of this segment:
· Bucksport Energy LLC (69.44% interest; cogeneration plant in Maine);
· Churchill Falls (Labrador) Corporation Limited (“CF(L)Co”) (34.2% interest; hydroelectric generation activities);
· HQ Manicouagan inc. (wholly-owned; holds a 60% interest in Manicouagan Power Limited Partnership, which owns and operates a generating station (McCormick) located on the Rivière Manicouagan);
· Société en commandite Betsiamites (1) (86.31% interest; ownership of assets related to the partial diversion of the Portneuf, Sault aux Cochons and Manouane rivers);
· Gestion Production HQ inc. (wholly-owned; investment in local generation businesses);
· HQ Energy Marketing Inc. (“HQEM”) (wholly-owned; conducts energy transactions in other Canadian provinces and holds shares in energy trading companies in Canada and the United States);
· H.Q. Energy Services (U.S.) Inc. (“HQUS”) (wholly-owned subsidiary of HQEM; power marketer in the United States); and
· Hydro Renewable Energy Inc. (“HRE”) (wholly-owned subsidiary of HQEM; holds transmission rights of a 1,200 MW line to be built in New Hampshire).
(1) As of March 31, 2012, the ownership interest increased to 100%.
9
GENERATION OPERATIONS
Facilities
In Québec, our electric generation system comprises 88 power stations currently in service, of which 60 are hydroelectric, 27 are thermal and one is nuclear; with a total installed capacity of 36,971 MW as of December 31, 2011.
The following table lists the generating stations in service as of such date.
GENERATING STATIONS IN SERVICE IN QUÉBEC
Name of Facility | | Years Commissioned (1) | | Capacity | |
| | | | (MW) | |
Hydroelectric | | | | | |
Robert-Bourassa | | 1979-1981 | | 5,616 | |
La Grande-4 | | 1984-1986 | | 2,779 | |
La Grande-3 | | 1982-1984 | | 2,417 | |
La Grande-2-A | | 1991-1992 | | 2,106 | |
Beauharnois | | 1932-1961 | | 1,906 | |
Manic-5 | | 1970-1971 | | 1,596 | |
La Grande-1 | | 1994-1995 | | 1,436 | |
René-Lévesque (Manic-3) | | 1975-1976 | | 1,244 | |
Bersimis-1 | | 1956-1959 | | 1,178 | |
Jean-Lesage (Manic-2) | | 1965-1967 | | 1,145 | |
Manic-5-PA | | 1989-1990 | | 1,064 | |
Outardes-3 | | 1969 | | 1,026 | |
Sainte-Marguerite-3 | | 2003-2004 | | 882 | |
Laforge-1 | | 1993-1994 | | 878 | |
Bersimis-2 | | 1959-1960 | | 869 | |
Eastmain-1-A | | 2011-2012 | | 829 | |
Outardes-4 | | 1969 | | 785 | |
Carillon | | 1962-1964 | | 753 | |
Toulnustouc | | 2005 | | 526 | |
Outardes-2 | | 1978 | | 523 | |
Eastmain-1 | | 2006 | | 507 | |
Brisay | | 1993 | | 469 | |
Péribonka | | 2007-2008 | | 405 | |
Laforge-2 | | 1996 | | 319 | |
Trenche | | 1950-1955 | | 302 | |
La Tuque | | 1940-1955 | | 294 | |
Beaumont | | 1958-1959 | | 270 | |
McCormick | | 1951-1965 | | 235 | |
Rocher-de-Grand-Mère | | 2004 | | 230 | |
Paugan | | 1928-1956 | | 213 | |
Rapide-Blanc | | 1934-1955 | | 204 | |
Shawinigan-2 | | 1911-1929 | | 200 | |
Shawinigan-3 | | 1948-1949 | | 194 | |
Manic-1 | | 1966-1967 | | 184 | |
Rapides-des-Îles | | 1966-1973 | | 176 | |
Chelsea | | 1927-1939 | | 152 | |
La Gabelle | | 1924-1931 | | 131 | |
Première-Chute | | 1968-1975 | | 131 | |
Rapides-Farmer | | 1927-1947 | | 104 | |
Les Cèdres | | 1914-1924 | | 103 | |
Rapides-des-Quinze | | 1923-1955 | | 103 | |
Other (19 — generating stations rated less than 100 MW)(2) | | 1910-2009 | | 801 | |
Total | | | | 35,285 | |
Thermal | | | | | |
Bécancour, La Citière and Cadillac (gas turbine) | | 1976-1993 | | 881 | |
Other (24 diesel plants) (2) | | 1946-2010 | | 130 | |
Total | | | | 1,011 | |
Nuclear | | | | | |
Gentilly-2 (3) | | 1983 | | 675 | |
(1) Indicates years when facilities began commercial operation.
(2) Some facilities are operated by Hydro-Québec Distribution.
(3) The Gentilly-2 plant has a Canada-Deuterium-Uranium heavy water moderated reactor, using heavy water as a moderator and coolant, and uranium dioxide as fuel.
10
Power and Energy Purchases
We purchase power and energy from the Churchill Falls generating station in Labrador through agreements with CF(L)Co. Under an initial power contract signed in 1969 with CF(L)Co, we agreed to purchase annually, through the year 2041, 4,083 MW of power (the “1969 Power Contract”). In June 1999, we signed another agreement with CF(L)Co to guarantee us the availability of 682 MW of additional power until 2041 for each November 1 to March 31 period. In 2011, purchases under the CF(L)Co agreements totaled 28.6 TWh at a cost of $92 million as compared to 29.1 TWh at a cost of $108 million in 2010.
We have a power agreement with Rio Tinto Alcan Inc., which was amended in 2006, for the purchase of 365 MW of peak power and 375 MW of additional peak power until December 31, 2045. Under this 2006 amendment, we agreed to purchase from Rio Tinto Alcan Inc. an additional 150 MW of peak power until January 1, 2013 which, if certain conditions are met, will be extended until December 31, 2045.
In addition, we purchase power and energy under 80 long-term contracts with independent producers located in Québec. During 2011, 3.9 TWh were purchased under these contracts, at a total cost of $269 million. For 2012, we expect to purchase approximately 3.8 TWh under these contracts.
We also purchase power and energy in connection with our trading operations (see “Wholesale and Trading Operations”).
Peak
We use energy purchased from our neighboring systems, which experience different demand patterns, to meet a portion of our peak power needs in Québec (see “Wholesale and Trading Operations”). The following table summarizes our peak power demand in Québec and installed capacity as at December 31 for the years 2007 through 2011.
| | Peak Power Demand (1) | | Installed Capacity (2) | | Total Average Load (3) | |
| | (MW) | |
2007 | | 35,352 | | 35,654 | | 23,952 | |
2008 | | 37,230 | | 36,432 | | 24,047 | |
2009 | | 34,659 | | 36,813 | | 23,804 | |
2010 | | 37,717 | | 36,671 | | 23,871 | |
2011 | | 35,481 | | 36,971 | | 24,516 | |
(1) Total power demand at the annual domestic peak for the winter beginning in December, including interruptible power. The 2011-2012 winter peak occurred at 8:00 a.m. on January 16, 2012.
(2) In addition to the generating capacity of our own facilities, we have access to almost all the output from Churchill Falls generating station (5,428 MW) under a contract with Churchill Falls (Labrador) Corporation Limited that will remain in effect until 2041. We also purchase all the output from 12 wind farms (919 MW) and 3 small hydropower plants (23 MW) operated by independent power producers. An additional 1,215 MW is available under long-term contracts with other suppliers.
(3) Annual energy demand, including sales outside Québec, divided by the number of hours in the year.
Investment Outside Québec
We hold an indirect interest in Bucksport Energy LLC, a thermal energy plant located in Maine. The plant, which started its commercial operations in January 2001, produces approximately 1.4 TWh of energy per year. HQUS supplies the plant with natural gas and receives most of the energy under fifteen-year contracts through January 2016.
11
WHOLESALE AND TRADING OPERATIONS
Québec Wholesale Market
The Québec wholesale electricity market has been open since May 1, 1997. This market is comprised of 11 distributors: Hydro-Québec Distribution, nine distributors operating municipal systems and one regional electricity cooperative. As a result of the opening of the wholesale market, the municipal systems can, subject to the Government’s authorization, purchase electricity from suppliers other than Hydro-Québec Distribution, and independent generators in Québec can sell their electricity on the wholesale market using Hydro-Québec TransÉnergie’s transmission facilities.
Under a call for tenders issued by Hydro-Québec Distribution in 2002, Hydro-Québec Production signed agreements with Hydro-Québec Distribution for the supply of 600 MW over a 20-year period starting in March 2007, which is in addition to the Heritage Pool Electricity.
Markets Outside Québec
Currently, our main markets outside Québec consist of neighboring networks located in Canada and the northeastern United States.
In 2011, net exports by Hydro-Québec Production accounted for 11% (2010 — 7%) of net sales volume and generated 15% (2010 — 17%) of our net income.
HQUS is a member of New York ISO, ISO New England, Midwest ISO (which includes all or parts of Illinois, Indiana, Iowa, Kentucky, Michigan, Minnesota, Missouri, Montana, North Dakota, Ohio, Pennsylvania, South Dakota, Wisconsin and Manitoba) and PJM Interconnection (which includes all or parts of Delaware, Illinois, Indiana, Kentucky, Maryland, Michigan, New Jersey, North Carolina, Ohio, Pennsylvania, Tennessee, Virginia, West Virginia and the District of Columbia). ISOs, or Independent Systems Operators, and RTOs, or Regional Transmission Organizations, enable participants to buy and sell energy, schedule bilateral transactions and reserve transmission service. HQUS holds a permit from the U.S. Federal Energy Regulatory Commission to sell at market-based rates.
HQEM sells and buys energy and reserves transmission service in the Ontario, New Brunswick and Nova Scotia wholesale markets. HQEM is a participant of the Independent Electricity System Operator (the Ontario ISO).
We have four long-term export contracts for the sale of energy and power. The following table summarizes our principal energy export agreements.
PRINCIPAL ENERGY EXPORT AGREEMENTS
| | Expiry Date | | Power | | Maximum Annual
Deliveries | |
| | | | (MW) | | (TWh) | |
Long-Term Sales - Power and Energy | | | | | | | |
Cornwall Electric - Canada | | 2019 | | 45 | | 0.2 | |
Cornwall Electric - Canada | | 2019 | | 100 | | 0.4 | (1) |
Vermont Joint Owners (“VJO”) | | 2020 | | 335 | (2) | 2.1 | |
Seven Vermont power distributors (3) | | 2038 | (4) | 225 | | 1.3 | |
(1) Based on historical data.
(2) By separate agreement with a VJO Member, 25 MW (0.2 TWh) are being repurchased annually until April 30, 2012.
(3) Central Vermont Public Service Corporation, Green Mountain Power Corporation, Vermont Electric Cooperative, Inc., Vermont Public Power Supply Authority, Vermont Marble Power Division of Omya Inc., the Town of Stowe Electric Department and City of Burlington, Vermont Electric Department.
(4) The term will begin on November 1, 2012 and will continue through October 31, 2038.
In 2010, HRE signed a transmission service agreement with Northern Pass Transmission LLC (“NPT”), a New Hampshire company that is indirectly owned by two major New England power distributors, Northeast Utilities (75%) and NSTAR (25%), which completed their merger on April 10, 2012. NPT is working to obtain all necessary permits and authorizations.
12
Hydro-Québec Production is continuing discussions with regard to its potential participation in a transmission line project, running largely underwater and underground, between Québec and the State of New York. This project would give us access to new markets.
Electricity Sales and Revenue
The following table summarizes electricity sales and revenue outside Québec, by category, for the years 2007 through 2011.
ELECTRICITY SALES AND REVENUE OUTSIDE QUÉBEC
| | Years ended December 31 | |
| | 2007 | | 2008 | | 2009 | | 2010 | | 2011 | |
| | (in GWh) | |
Electricity Sales | | | | | | | | | | | |
Canada/U.S. (long-term) | | 2,384 | | 2,516 | | 2,604 | | 2,677 | | 2,617 | |
Canada/U.S. (short-term) | | 17,240 | | 18,783 | | 20,753 | | 20,593 | | 24,146 | |
Total Electricity Sales | | 19,624 | | 21,299 | | 23,357 | | 23,270 | | 26,763 | |
| | | | | | | | | | | |
| | (in millions of dollars) | |
Revenue from Electricity Sales | | | | | | | | | | | |
Canada/U.S. (long-term) | | $ | 225 | | $ | 220 | | $ | 256 | | $ | 247 | | $ | 254 | |
Canada/U.S. (short-term) | | 1,392 | | 1,699 | | 1,250 | | 1,266 | | 1,145 | |
Total Revenue from Electricity Sales | | $ | 1,617 | | $ | 1,919 | | $ | 1,506 | | $ | 1,513 | | $ | 1,399 | |
13
TRANSMISSION
Hydro-Québec TransÉnergie provides the following services:
· transmission of electricity to supply Québec’s native load; the native load is made up of the total transmission requirements of the Québec wholesale market (see “Generation — Québec Wholesale Market”) but excludes customers in remote communities; Hydro-Québec Distribution is Hydro-Québec TransÉnergie’s largest customer;
· point-to-point transmission service; as of the end of 2011, Hydro-Québec TransÉnergie had signed transmission service agreements with 27 customers, including Hydro-Québec Production, the largest customer for this service; and
· connection of privately-owned generating facilities to Hydro-Québec TransÉnergie’s transmission system; Hydro-Québec TransÉnergie currently serves 34 private producers.
This segment includes our holding in Cedars Rapids Transmission Company, Limited, a transmission provider that owns and operates a 325 MW interconnection line that links Hydro-Québec TransÉnergie’s grid at the Les Cèdres and Langlois substations in Québec with the Cornwall Electric system in Ontario and the National Grid system in New York.
TRANSMISSION SYSTEM
Some generating stations in Québec are located at substantial distances from consumer centers. As a result, Hydro-Québec TransÉnergie’s transmission system is one of the most extensive in North America, comprising approximately 20,900 miles of lines.
The system includes the following facilities as at December 31, 2011.
Voltage | | Substations | | Lines (miles) (1) | |
765 kV and 735 kV | | 38 | | 7,097 | |
450 kV DC | | 2 | | 757 | |
315 kV | | 65 | | 3,265 | |
230 kV | | 51 | | 2,003 | |
161 kV | | 44 | | 1,319 | |
120 kV | | 217 | | 4,201 | |
69 kV or less | | 97 | | 2,255 | |
TOTAL | | 514 | | 20,897 | |
(1) Miles covered by the transmission system. Many facilities carry two lines on the same infrastructure.
In 1997, Hydro-Québec TransÉnergie opened access to its transmission grid in accordance with the Hydro-Québec Open Access Transmission Tariff. Consequently, electricity distributors, producers and marketers in and outside Québec have the option to enter into transactions with distributors, producers and marketers to buy or sell electricity and to wheel in, wheel out or wheel through Hydro-Québec TransÉnergie’s transmission grid at specified rates. The capacity available on the system is posted on the OASIS (Open Access Same-Time Information System) website.
Hydro-Québec TransÉnergie’s Direction — Contrôle des mouvements d’énergie (System Control Unit) is responsible for energy dispatching, power flow supervision and system security monitoring. Hydro-Québec TransÉnergie’s transmission system is linked through interconnections with other major power systems in Canada (Ontario, New Brunswick and Churchill Falls) and the northeastern United States (New York and New England).
The following table shows existing interconnection capacity with neighboring systems outside Québec as at December 31, 2011.
INTERCONNECTIONS WITH NEIGHBORING SYSTEMS OUTSIDE QUÉBEC
| | | Maximum Export Capacity | | Maximum Import Capacity | | Voltage | |
| | | (MW) | | (MW) | | (kV) | |
CANADA | Ontario | | 2,705 | | 1,945 | | 120 and 230 | |
| New Brunswick | | 1,029 | | 785 | | 230, 315 and 345 | |
| Churchill Falls | | — | | 5,150 | | 735 | |
| | | | | | | | |
UNITED STATES | New York | | 1,999 | | 1,100 | | 120 and 765 | |
| New England | | 2,260 | | 2,170 | | 120 and ±450 | |
14
DISTRIBUTION
The primary responsibility of Hydro-Québec Distribution is to deliver electricity to Québec customers. To fulfill this responsibility, Hydro-Québec Distribution relies primarily on the Heritage Pool Electricity which it purchases from Hydro-Québec Production. To meet demand beyond that volume, Hydro-Québec Distribution purchases additional electricity under market conditions by issuing calls for tenders from suppliers in the market (see “Regulatory Framework — Energy Board Act”).
Our distribution system is comprised of 70,544 miles of medium voltage lines (almost exclusively 25 kV), as well as 63,181 miles of low voltage lines. Approximately 10% of all such lines are underground.
We sell to a wide range of customers, from industrial users, which accounted for 39.8% of sales volume in 2011, to residential customers and farms, which represented 36.9% of sales volume in the same period. Revenues are also derived from sales to commercial and institutional customers as well as distributors operating municipal electric systems.
Hydro-Québec Distribution along with Hydro-Québec Production have developed some flexibility in the management of our system and currently have 1,550 MW of interruptible power and 850 MW of concurrent peak-saving capacity in our residential dual-energy market.
We have entered into special agreements with nine industrial customers for whom electricity costs represent a substantial proportion of total production costs. Some of these agreements provide for the sale, on a long-term basis, of firm energy at prices that vary in accordance with a formula based on the market price of aluminum. We manage the exposure to fluctuations in aluminum prices resulting from these contracts by entering into financial transactions, such as futures or swaps (see “Note 16 to the 2011 Consolidated Financial Statements”). In 2011, deliveries under these agreements accounted for 39.4% of the total energy deliveries to industrial users.
Hydro-Québec Distribution relies on various sources to supply the Québec market. To meet requirements in excess of the Heritage Pool Electricity reserved for it by Hydro-Québec Production, Hydro-Québec Distribution issues short- and long-term calls for tenders. For requirements of less than three months, it may also buy electricity directly on the market, without tendering, under an authorization granted by the Régie de l’énergie (the “Energy Board”). For unforeseen needs that cannot be met otherwise, it relies on a framework agreement with Hydro-Québec Production that covers the period from January 1, 2009 to December 31, 2013. This agreement was approved by the Energy Board in 2009.
Further to calls for tenders issued since 2002, Hydro-Québec Distribution signed contracts with Hydro-Québec Production for the supply of 600 MW over a 20-year period beginning in March 2007 and with 36 independent producers for the supply of nearly 3,800 MW (including 3,138 MW of wind-generated electricity) for deliveries beginning between 2006 and 2015.
15
The following table summarizes these contracts.
LONG-TERM CONTRACTS AWARDED BY TENDERS
Producers | | Type of power | | Capacity
(MW) | | Starting Date | | Expiry Date | |
Hydro-Québec Production | | Hydroelectric | | 600 | | 2007 | | 2027 | |
Société d’énergie rivière Franquelin Inc. | | Hydroelectric | | 10 | | 2010 | | 2030 | |
Ville de Saguenay | | Hydroelectric | | 13 | | 2011 | | 2031 | |
Société d’énergie rivière Sheldrake Inc. | | Hydroelectric | | 25 | | 2013 | | 2033 | |
Société Hydro-Canyon Saint-Joachin Inc. | | Hydroelectric | | 23 | | 2013 | | 2033 | |
| | | | 671 | | | | | |
| | | | | | | | | |
Trans-Canada Energy Ltd | | Natural gas cogeneration | | 507 | | 2006 | | 2026 | |
| | | | | | | | | |
Cartier Wind Energy Inc. | | Wind | | 590 | | 2006 to 2012 | | 2026 to 2032 | |
Northland Power Inc. | | Wind | | 250 | | 2009 and 2011 | | 2029 to 2031 | |
Enerfin | | Wind | | 100 | | 2012 | | 2032 | |
Kruger Energy Montérégie S.E.C. | | Wind | | 100 | | 2012 | | 2032 | |
Électricité de France / Enbridge | | Wind | | 300 | | 2012 to 2013 | | 2032 to 2033 | |
Invenergy | | Wind | | 295 | | 2012 to 2013 | | 2032 to 2033 | |
Venterre NRG Inc. | | Wind | | 116 | | 2012 and 2014 | | 2032 and 2034 | |
Électricité de France | | Wind | | 654 | | 2012 to 2015 | | 2032 to 2035 | |
Énergie éolienne communautaire Le Plateau S.E.C. | | Wind | | 23 | | 2013 | | 2033 | |
Parc éolien communautaire Viger-Denonville S.E.C. | | Wind | | 25 | | 2013 | | 2033 | |
Parcs éoliens de la Seigneurie de Beaupré 2 et 3, S.E.N.C. | | Wind | | 272 | | 2013 | | 2033 | |
Société en commandite Fleur de lis éoliennes Saint-Damase | | Wind | | 24 | | 2013 | | 2033 | |
Boralex Inc. / Gaz Métro Éole Inc. | | Wind | | 68 | | 2014 | | 2034 | |
Éoliennes Témiscouata S.E.C. | | Wind | | 25 | | 2014 | | 2034 | |
Parc éolien Saint-Philémon L.P. | | Wind | | 24 | | 2014 | | 2034 | |
Société en commandite EEN CA le Granit et Énergie du Granit Inc. | | Wind | | 25 | | 2014 | | 2034 | |
Société en commandite EEN CA La Mitis et Énergie renouvelable de la Mitis S.E.C. | | Wind | | 25 | | 2014 | | 2034 | |
Vents du Kempt Inc. | | Wind | | 100 | | 2014 | | 2034 | |
Éoliennes Frampton S.E.C. | | Wind | | 24 | | 2015 | | 2035 | |
Parc éolien Pierre-de-Saurel S.E.C. | | Wind | | 25 | | 2015 | | 2035 | |
Éoliennes Belle-Rivière S.E.C. | | Wind | | 24 | | 2015 | | 2035 | |
Éoliennes Côte-de-Beaupré S.E.C. | | Wind | | 25 | | 2015 | | 2035 | |
Kahnawà:ke Sustainable Energies | | Wind | | 24 | | 2015 | | 2035 | |
| | | | 3,138 | | | | | |
| | | | | | | | | |
Kruger Énergie Bromptonville S.E.C. | | Forest biomass cogeneration | | 16 | | 2007 | | 2027 | |
Tembec Inc. | | Forest biomass cogeneration | | 8 | | 2008 | | 2023 | |
Fortress Speciality Cellulose Inc. | | Forest biomass cogeneration | | 19 | | 2012 | | 2027 | |
Fibrek S.E.N.C. | | Forest biomass cogeneration | | 10 | | 2012 | | 2027 | |
Innoventé Inc. | | Forest biomass cogeneration | | 5 | | 2012 | | 2037 | |
| | | | 58 | | | | | |
| | | | | | | | | |
EBI Énergie Inc. | | Biomass cogeneration | | 9 | | 2012 | | 2037 | |
WM Québec Inc. | | Biomass cogeneration | | 8 | | 2012 | | 2032 | |
Terreau biogas S.E.C. | | Biomass cogeneration | | 3 | | 2012 | | 2036 | |
| | | | 20 | | | | | |
Hydro-Québec Distribution manages its flexible and diversified energy portfolio to deal with fluctuations in demand. Every three years, Hydro-Québec Distribution prepares a supply plan covering the next 10 years. This supply plan presents forecasts of Hydro-Québec Distribution’s customers’ electricity requirements, taking into account energy efficiency measures that have been implemented, along with the various means that Hydro-Québec Distribution intends to use to ensure a secure supply of electricity for Québec. The Electricity Supply Plan 2011-2020 filed in November 2010 was approved by the Energy Board in October 2011 and is subject to follow-up on an annual basis.
16
In 2011, Hydro-Québec Distribution took the following measures to ensure balance between energy supply and demand in Québec:
· Following a decision by the Energy Board in August 2011, Hydro-Québec Distribution renewed for another year (2012) the suspension of deliveries from TransCanada Energy’s Bécancour generating station; and
· Hydro-Québec Distribution made 0.9 TWh of short-term transactions in 2011.
Calls for tenders could be made in the coming years in order to maintain such balance (see “Regulatory Framework — Energy Board Act”). In December 2011, Hydro-Québec Distribution launched a power purchase program involving the acquisition of energy generated in Québec from forest biomass cogeneration power plants, for a total installed capacity of 150 MW. Tenders will be considered until December 2013 or until the total installed capacity has been contracted.
ELECTRICITY RATES
Under the applicable provisions of the Energy Board Act, rates are fixed or modified by the Energy Board (see “Regulatory Framework — Energy Board Act”). Rates are fixed to allow recovery of authorized service costs, including estimated supply costs, and a reasonable rate of return on shareholder’s equity. In March 2012, the Energy Board authorized an average rate decrease of 0.45% effective April 1, 2012.
The following table shows the rate increase (decrease) applicable for each year, from 2007 to 2012, as well as annual inflation rates:
| | 2007 | | 2008 | | 2009 | | 2010 | | 2011 | | 2012 | |
Rate (decrease) increase as of April 1 | | 1.92 | % | 2.90 | % | 1.22 | % | 0.35 | % | (0.41 | )% | (0.45 | )% |
Inflation Rate (1) | | 2.2 | % | 2.3 | % | 0.3 | % | 1.8 | % | 2.9 | % | 2.0 | %(2) |
(1) Canadian Consumer Price Index for the calendar year.
(2) Estimate.
ELECTRICITY SALES AND REVENUE
The following table summarizes electricity sales and revenue in Québec, by category of customers, for the years 2007 through 2011.
ELECTRICITY SALES AND REVENUE
| | Years ended December 31 | |
| | 2007 | | 2008 | | 2009 | | 2010 | | 2011 | |
| | (in GWh) | |
Electricity Sales | | | | | | | | | | | |
In Québec, by category | | | | | | | | | | | |
Residential and farm | | 60,046 | | 60,747 | | 62,484 | | 59,534 | | 62,748 | |
Commercial and institutional | | 34,751 | | 35,228 | | 34,151 | | 33,865 | | 33,569 | |
Industrial | | 73,005 | | 69,144 | | 63,310 | | 68,439 | | 67,621 | |
Other | | 5,353 | | 5,278 | | 5,371 | | 7,647 | | 6,028 | |
Total Electricity Sales | | 173,155 | | 170,397 | | 165,316 | | 169,485 | | 169,966 | |
| | (in millions of dollars) | |
Revenue from Electricity Sales | | | | | | | | | | | |
In Québec, by category | | | | | | | | | | | |
Residential and farm | | $ | 4,144 | | $ | 4,300 | | $ | 4,500 | | $ | 4,302 | | $ | 4,536 | |
Commercial and institutional | | 2,602 | | 2,687 | | 2,662 | | 2,648 | | 2,599 | |
Industrial | | 3,336 | | 3,174 | | 3,092 | | 3,185 | | 3,262 | |
Other | | 286 | | 284 | | 295 | | 371 | | 323 | |
Total Revenue from Electricity Sales | | $ | 10,368 | | $ | 10,445 | | $ | 10,549 | | $ | 10,506 | | $ | 10,720 | |
| | (as at December 31 ) | |
Number of Customer Accounts | | | | | | | | | | | |
In Québec, by category | | | | | | | | | | | |
Residential and farm | | 3,554,443 | | 3,603,330 | | 3,649,470 | | 3,698,169 | | 3,746,397 | |
Commercial and institutional | | 299,524 | | 296,504 | | 297,380 | | 300,163 | | 291,212 | (a) |
Industrial | | 11,565 | | 10,111 | | 9,829 | | 9,589 | | 18,573 | (a) |
Other | | 3,440 | | 3,499 | | 3,653 | | 3,868 | | 4,013 | |
Total Customer Accounts | | 3,868,972 | | 3,913,444 | | 3,960,332 | | 4,011,789 | | 4,060,195 | |
(a) Reflects a reclassification in 2011.
17
CONSTRUCTION
The Construction segment includes activities related to projects carried out by Hydro-Québec Équipement et services partagés and SEBJ.
Hydro-Québec Équipement et services partagés is responsible for construction and refurbishment projects throughout Québec, except in the territory governed by the JBNQ Agreement. SEBJ builds generating facilities in the territory governed by the JBNQ Agreement (north of the 49th parallel) and may carry out projects outside Québec.
As engineering and environmental specialists, Hydro-Québec Équipement et services partagés and SEBJ also offer Hydro-Québec Production and Hydro-Québec TransÉnergie a variety of services needed for draft-design studies, impact assessments and other undertakings in the context of energy-related projects. These services include technical and scientific surveys, planning, cost estimates, design, architecture, geomatics and quality control.
CORPORATE AND OTHER ACTIVITIES
This segment includes the Technology Group, the Corporate Affairs and General Secretariat Group, the Accounting and Control Vice Presidency, the Financing, Treasury and Pension Fund Vice Presidency, the Human Resources Vice Presidency, the Shared Services Centre Unit and our subsidiary Hydro-Québec International inc. (“HQI”). The following are under the supervision of the Technology Group:
· Hydro-Québec CapiTech inc. (“Hydro-Québec CapiTech”) (wholly-owned; a venture capital company investing in businesses that provide energy-related high-technology products and services);
· Hydro-Québec IndusTech inc. (“Hydro-Québec IndusTech”) (wholly-owned; a corporation pursuing the development of an electrical motor for automobiles); and
· Institut de recherche d’Hydro-Québec (“IREQ”) (our energy-technology research and development division).
18
CORPORATE OUTLOOK
DEVELOPMENT STRATEGY
In July 2009, we presented our five-year Strategic Plan (the “Strategic Plan”) for the 2009-2013 period. This Strategic Plan was reviewed by a parliamentary commission in October 2009.
The Strategic Plan sets forth three main priorities: energy efficiency, renewable energies and technological innovation. More specifically, we plan to:
· promote the conservation of energy by investing in energy efficiency programs;
· begin a new phase of large-scale hydroelectric development in order to finish carrying out Québec’s energy strategy (4,500 MW) and to implement an additional planned expansion in northern Québec (3,500 MW) that Québec refers to as its “Plan Nord”;
· continue integrating wind farm capacity resulting from our tender calls of recent years, for a total of nearly 4,000 MW by 2016-2017;
· rely on technological innovation to remain on the leading edge of the power industry, improve customer services and further enhance our performance; and
· develop energy-efficiency technologies.
We plan to invest approximately $4.7 billion in 2012. More than half of this amount will be earmarked for development and growth activities and for the Energy Efficiency Plan. The remainder will go toward facility maintenance and improvements.
Hydro-Québec Production intends to continue its major hydroelectric development projects, including the commissioning of Sarcelle powerhouse. At the same time, it plans to continue with work at the Romaine complex, including ongoing construction at Romaine-2; startup at Romaine-1; completion of the section of road leading to Romaine-3 and construction of Mista workcamp in order to get work under way at the Romaine-3 jobsite. The complex’s four generating stations are expected to be commissioned between 2014 and 2020.
Hydro-Québec TransÉnergie intends to invest in development to integrate new hydroelectric and wind capacity in Québec. Specifically, it plans to continue connecting various wind farms built in response to Hydro-Québec Distribution’s calls for tenders and start constructing the necessary infrastructure for connecting Romaine-2 generating station. Hydro-Québec TransÉnergie will also continue to invest in maintenance and improvement activities to ensure the reliability and long-term operability of its transmission assets and enhance service quality. An example of this is the addition and modification of equipment on the 315-kV transmission system in the Québec-Montréal corridor, which, among other things, involves expanding Bout-de-l’Île substation, replacing equipment at this facility, reorganizing lines and connecting the substation to the 735-kV network.
Hydro-Québec Distribution intends to continue to deliver reliable power and high-quality services to its Québec customers. It will make further investments to handle the growth of its Québec customer base and to maintain and improve the quality of its facilities, notably those involved in distribution automation. It will also continue to implement the Energy Efficiency Plan, which includes measures for low-income households, with a view to achieving 11 TWh in energy savings by 2015. In addition, as part of the remote meter reading project, which is subject to the approval of the Energy Board, it plans to install 3.8 million next-generation meters over the 2012-2017 period in order to roll out an advanced metering infrastructure.
19
WATER-POWER ROYALTIES
As stipulated in the Watercourses Act (Québec), Hydro-Québec Production pays the same statutory royalties as those paid by private producers of hydro-electricity in Québec. These water-power royalties, which are paid to the Government’s Generations Fund, consist of a statutory royalty for the electricity delivered during the year and a contractual royalty payable pursuant to the contract awarded for the operation of a generation station.
For 2012, these royalties, indexed annually to the Consumer Price Index, consist of:
· a statutory royalty of $2.98 ($2.90, $2.86 and $2.84, for 2011, 2010 and 2009 respectively) per thousand kilowatt-hours of electricity produced; and
· a contractual royalty of $0.699 ($0.680, $0.671 and $0.667, for 2011, 2010 and 2009 respectively) per thousand kilowatt-hours of electricity produced.
These royalties totaled $593 million in 2011, $557 million in 2010 and $567 million in 2009.
20
CAPITAL INVESTMENT PROGRAM
Our capital investment program includes capital expenditures for fixed and intangible assets including Energy Efficiency Programs. The following table is a summary of our capital investments affecting cash for the years 2007 through 2011. The table also includes estimates for the years 2012 to 2013; these estimates are based on, among other things, a projected growth in demand for electricity in Québec of 1.0% yearly for the next two years. In 2012, capital investments in fixed and intangible assets, including Energy Efficiency Programs, are estimated at $4,729 million.
CAPITAL INVESTMENTS AFFECTING CASH (1)
| | | | | | | | | | | | Estimated | |
| | 2007 | | 2008 | | 2009 | | 2010 | | 2011 | | 2012 | | 2013 | |
| | (millions of dollars) | |
Fixed and Intangible Assets (2) | | | | | | | | | | | | | | | |
Generation | | $ | 1,756 | | $ | 1,853 | | $ | 2,033 | | $ | 1,900 | | $ | 1,467 | | $ | 1,643 | | $ | 1,465 | |
Transmission (3) | | 846 | | 1,099 | | 1,196 | | 1,248 | | 1,292 | | 1,893 | | 1,946 | |
Distribution (2) | | 896 | | 901 | | 966 | | 944 | | 950 | | 1,046 | | 1,482 | |
Construction | | 3 | | 5 | | 1 | | 7 | | 5 | | 7 | | 6 | |
Corporate and Other Activities | | 89 | | 96 | | 111 | | 121 | | 100 | | 140 | | 110 | |
Total Investments | | $ | 3,590 | | $ | 3,954 | | $ | 4,307 | | 4,220 | | 3,814 | | $ | 4,729 | | $ | 5,009 | |
| | | | | | | | | | | | | | | | | | | | | | |
(1) Certain comparative figures have been reclassified to conform to the presentation adopted in the current year.
(2) Including Energy Efficiency Programs.
(3) Includes sub-transmission.
The development of Québec’s hydropower potential is based on three fundamental criteria: projects must be profitable, environmentally acceptable and favorably received by the host communities. Since 2004, Hydro-Québec Production has increased its generating capability with the inauguration of several facilities, including Sainte-Marguerite-3, Rocher-de-Grand-Mère, Toulnustouc, Eastmain-1, Mercier, Péribonka, Chute-Allard, Rapides-des-Coeurs and Eastmain-1-A generating stations, as well as the Rupert diversion.
In the Baie-James region, two of the three generating units at Eastmain-1-A powerhouse were commissioned in 2011, followed by the third in January 2012. Commissioning of the three generating units at Sarcelle powerhouse is slated for 2012. This $5.0 billion Eastmain-1-A/Sarcelle/Rupert project will add 918 MW in installed capacity and 8.7 TWh in annual output, including additional output (5.3 TWh) as a result of diverting part of the Rupert’s flow to existing generating stations in the La Grande complex.
At the Romaine jobsite, in the Minganie region, work on the Romaine-2 development is moving ahead as scheduled. The $6.5-billion Romaine project calls for the construction of four generating stations with a total capacity of 1,550 MW and annual output of 8.0 TWh on the Rivière Romaine, north of Havre-Saint-Pierre. The facilities are expected to be commissioned in phases between 2014 and 2020.
Gentilly-2 nuclear generating station’s operating licence was renewed until June 2016 and preparatory activities for the refurbishment project are continuing. In 2010, a decision was made to postpone refurbishing work at Gentilly-2 nuclear generating station, which was driven by several factors. First, our main supplier and partner, Atomic Energy of Canada Limited (AECL), was unavailable due to delays in the refurbishment of CANDU-type generating stations at Point Lepreau, New Brunswick, and Wolsong, South Korea. Also, we continue to draw upon the valuable experience these projects provide and intend to apply them to our own project. In 2011, the Government stated that it would announce its decision concerning the future of Gentilly-2 nuclear generating station in 2012. Should it decide to close down the generating station, abandoning the refurbishment project would have a major financial impact on the costs already capitalized for the work under way (see Note 8 to the 2011 Consolidated Financial Statements) and would require a review of the assumptions related to the work to dismantle the station, as described in Note 13 to the 2011 Consolidated Financial Statements.
21
Allocation of Capital Expenditures for the Generation, Transmission and Distribution Business Segments
The following tables summarize the allocation of estimated capital expenditures for 2012 and 2013 among our three major business segments:
GENERATION BUSINESS SEGMENT
| | Available | | Planned Date | | Estimated Capital Expenditures | |
| | Power | | of Operation | | 2012 | | 2013 | |
| | (MW) | | | | (millions of dollars) | |
MAIN REHABILITATION PROJECTS | | | | | | | | | |
Improvement and rebuilding of facilities (1) | | — | | Continuous program | | $ | 730 | | $ | 530 | |
| | | | | | | | | |
ONGOING GENERATION PROJECTS | | | | | | | | | |
Eastmain-1-A/Sarcelle/Rupert | | 918 | | 2009-2012 | | 135 | | 1 | |
Romaine complex | | 1,550 | | 2014-2020 | | 707 | | 882 | |
Other generation projects | | — | | — | | 5 | | 5 | |
| | | | | | | | | |
OTHER FIXED ASSETS | | — | | — | | 53 | (2) | 42 | (3) |
| | | | | | | | | |
INTANGIBLE ASSETS | | — | | — | | 13 | | 5 | |
| | | | | | $ | 1,643 | | $ | 1,465 | |
(1) Includes Gentilly-2 refurbishment project.
(2) Includes 72.1% in equipment, 22.1% in buildings and 5.8% in technology.
(3) Includes 76.0% in equipment and 24.0% in buildings.
TRANSMISSION BUSINESS SEGMENT
| | Planned Date | | Estimated Capital Expenditures | |
| | of Operation | | 2012 | | 2013 | |
| | | | (millions of dollars) | |
TRANSMISSION FACILITIES (1) | | | | | | | |
System maintenance and improvement | | Continuous program | | $ | 673 | | $ | 589 | |
| | | | | | | |
Projects in development and demand growth | | | | | | | |
Wind Power interconnection — 1,000 MW | | 2006-2012 | | 31 | | — | |
Wind Power interconnection — 2,000 MW | | 2011-2016 | | 334 | | 229 | |
Expansion of transportation network in Minganie | | 2014-2020 | | 222 | | 272 | |
Other | | | | 456 | | 705 | |
| | | | | | | |
OTHER FIXED ASSETS | | — | | 144 | (2) | 118 | (3) |
| | | | | | | |
INTANGIBLE ASSETS | | — | | 33 | | 33 | |
| | | | $ | 1,893 | | $ | 1,946 | |
(1) Includes sub-transmission facilities.
(2) Includes 69.9% in telecommunications, 17.8% in equipment and 12.3% in buildings.
(3) Includes 64.4% in telecommunications, 29.7% in equipment and 5.9% in buildings.
22
DISTRIBUTION BUSINESS SEGMENT
| | Estimated Capital Expenditures | |
| | 2012 | | 2013 | |
| | (millions of dollars) | |
DISTRIBUTION SYSTEM (1) | | | | | |
System maintenance | | $ | 271 | | $ | 575 | |
System improvements and demand growth | | 405 | | 393 | |
| | | | | |
OTHER FIXED ASSETS | | 84 | (2) | 84 | (3) |
| | | | | |
INTANGIBLE ASSETS | | | | | |
Energy Efficiency Programs | | 211 | | 379 | |
Other | | 75 | | 51 | |
| | $ | 1,046 | | $ | 1,482 | |
(1) Includes investments in distribution facilities and investments in generation and transmission facilities of our off-grid systems.
(2) Includes 49.3% in equipment, 42.6% in buildings, 5.0% in technology and 3.1% in telecommunications.
(3) Includes 58.7% in equipment, 36.2% in buildings and 5.1% in technology.
Cash Requirements
The total estimated cash requirements for 2012 are approximately $8.1 billion, and include approximately $4.7 billion in capital investments, approximately $1.4 billion for long-term debt repayment and sinking fund redemption and approximately $2.0 billion for the payment of dividend declared for 2011. Our self-financing ratio (defined as cash flows from operating activities less dividend paid, divided by the sum of cash flows from investing activities, excluding net disposal (acquisition) of short-term investments, and repayments of long-term debt and sinking fund) is expected to be 48.3% in 2012, compared to 47.6% in 2011.
We estimate that cash requirements for capital investments, long-term debt repayment and sinking fund redemption will amount to approximately $6.2 billion for 2013.
23
REGULATORY FRAMEWORK
Hydro-Québec Act
Under the provisions of the Hydro-Québec Act, we are mandated to supply power and to pursue endeavors in energy-related research and promotion, energy conversion and conservation, and any field connected with or related to power or energy.
Under the Hydro-Québec Act, the Government is entitled to declare a dividend from Hydro-Québec when certain financial criteria are met (see “Note 19 to the 2011 Consolidated Financial Statements”). In its 2008-2009 Budget, the Government announced that Hydro-Québec’s dividend policy was revised and raised to its distributable surplus, which is 75% of net income. This change of policy began with the dividend payable for our fiscal year ending December 31, 2007.
Energy Board Act
The Act respecting the Régie de l’énergie (the “Energy Board Act”), enacted in 1996, grants the Energy Board exclusive authority to determine or modify rates and conditions under which electricity is transmitted and distributed. Hydro-Québec TransÉnergie and Hydro-Québec Distribution’s activities in Québec are therefore regulated. Under this legislation, rates are set by reasoned decision of three commissioners after public hearings. Moreover, the Act stipulates that rates are determined on a basis that allows for recovery of the cost of service plus a reasonable return on the rate base.
The Energy Board consists of seven full-time members appointed by the Government and, in the exercise of its functions, is charged with reconciling the public interest, consumer protection and the fair treatment of the electric power carriers and of distributors.
Under the Energy Board Act, we have been granted exclusive rights for the distribution of electric power throughout Québec, excluding the territories served by distributors operating a municipal or private electric system as of May 13, 1997.
The Energy Board has the authority to:
· fix, or modify, after holding public hearings, our rates and conditions for the transmission and distribution of electric power;
· approve our electric power supply plan;
· designate a reliability coordinator for Québec and adopt the standards of reliability proposed by the designated reliability coordinator;
��
· authorize our transmission and distribution investment projects;
· approve our distribution commercial programs; and
· rule upon complaints from customers concerning rates or services.
The Energy Board Act was amended in 2010 to allow a gradual increase of the cost of the Heritage Pool Electricity starting in 2014. For the years 2014 to 2018, the average Heritage Pool Electricity cost will be the average cost for the previous year, plus 0.2¢/kWh, up to a maximum of 3.79¢/kWh. For 2019 and subsequent years, the average Heritage Pool Electricity cost will be that in effect for 2018 adjusted yearly (up to a maximum of 2%) for the annual variation in the Québec consumer price index (excluding alcoholic beverages and tobacco products).
Generation
The Energy Board’s jurisdiction does not extend to generation.
24
Transmission
Transmission rates and service conditions are subject to approval by the Energy Board. In August 2011, Hydro-Québec TransÉnergie filed an application with the Energy Board for the approval of transmission rates. Using an updated forecast of the cost of capital, the proposed rates are $72.21/kW/year for firm long-term point-to-point service with a rate rider (a rate rider is a temporary credit or charge approved by a regulator) for 2012 of minus $0.26/kW/year, $8.24/MWh/hour for hourly service, and an amount payable for the native load transmission service at $2,650,829,100 per year with a rate rider for 2012 of minus $9,544,600. On December 21, 2011, the Energy Board approved these proposed rates, effective January 1, 2012, on an interim basis, pending a final determination on the rate application.
The Direction — Contrôle des mouvements d’énergie (System Control Unit) of Hydro-Québec TransÉnergie has been designated as the Reliability Coordinator for Québec by the Energy Board.
Distribution
Electricity required to meet Québec’s needs in excess of the Heritage Pool Electricity must be purchased through a competitive bidding process. Purchase contracts for electricity in excess of the Heritage Pool Electricity are subject to the approval of the Energy Board.
Hydro-Québec Distribution’s Electricity Supply Plan 2011-2020 was approved by the Energy Board on October 27, 2011.
In August 2011, Hydro-Québec Distribution filed with the Energy Board an application for a rate increase of 1.7% beginning April 1, 2012. In March 2012, the Energy Board authorized an average rate decrease of 0.45% due to lower than forecasted operating costs and interest rates.
National Energy Board Act
Our exports of electric power are subject to the National Energy Board Act which provides that a permit or license must be obtained from the National Energy Board of Canada (the “National Board”) for such exports. We hold the following permits for short-term exports (contracts of five years or less):
· one permit expiring on December 31, 2020 authorizing us to export annually up to 30 TWh of combined firm and interruptible energy to the United States;
· one permit granted to our subsidiary, HQEM, expiring on April 7, 2019. The permit authorizes HQEM, as a power marketer, to export annually up to 30 TWh of firm and interruptible energy and up to 6,000 MW of power from interconnections located in other provinces.
Each of these permits allows us to take advantage of the spot market in the United States; however‚ long-term export contracts (more than five years) require prior issuance of specific permits or licenses by the National Board.
HQEM is authorized by an order of the National Board to export natural gas to the United States. This authorization will expire in 2013.
The National Board also regulates international power lines and we operate our interconnections with the United States in accordance with the terms and conditions of Certificates of Public Convenience and Necessity issued by the National Board.
Environmental Regulation
Our activities are subject to federal and provincial environmental laws and regulations, and, to some extent, municipal by-laws.
Before beginning new construction, our projects are subject to environmental impact assessment studies as well as information and consultation processes. The studies are submitted for review and approval by government departments and agencies responsible for issuing governmental authorizations. In some instances, the approval process includes public hearings by an independent body.
Environmental protection is a central concern of Hydro-Québec. Most activities that have an impact on the environment are governed by ISO 14001—certified environmental management systems. ISO 14001 is the environmental management standard of the International Organization for Standardization. In addition, every year, we review our management of environmental issues and publish a Sustainability Report.
25
The Government adopted the Sustainable Development Act (the “Sustainable Act”) in April 2006 and the Government Sustainable Development Strategy 2008-2013 (the “Government Strategy”), which came into effect in January 2008. As a Government-owned corporation, we are subject to the Sustainable Act and the Government Strategy and published our Sustainable Development Action Plan 2009-2013 (the “Action Plan”) in March 2009.
LITIGATION
Innus of Uashat mak Mani-Utenam
On December 30, 2003, representatives of the Innus of Uashat mak Mani-Utenam (the “Uashaunnuat”) instituted an action against the Attorney-General of Canada, the Attorney-General of Québec and us (Superior Court, no 200-17-004196-036) seeking judicial recognition of their aboriginal rights and of their unextinguished Indian title over certain areas of land in Québec. Plaintiffs who claim not to be parties to the 1975 James Bay and Northern Québec Agreement (the “Agreement”) allege that the Agreement and certain federal and provincial laws are illegal, inoperative, unconstitutional and not binding upon the plaintiffs. The plaintiffs seek various orders, including rendering of accounts and revenue sharing for the unlawful use and management of the lands, notably in respect of hydroelectric facilities on these lands, and awarding damages from Canada, Québec and us, jointly and severally, in an amount of up to $1.5 billion (subject to further increase by the plaintiffs). In June 2005, as requested by the parties, the Québec Superior Court suspended the legal action for five years. However on January 27, 2009, at the request of the Attorney-General of Canada, the suspension of the proceedings was lifted and the case has been reactivated. With Québec, we intend to contest this claim.
On May 7, 2010, the Uashaunnuat filed a motion before the Superior Court of Québec seeking an interlocutory injunction against the Attorney-General of Canada, the Attorney-General of Québec and us (Superior Court, no 500-17-050868-093) regarding, amongst other issues, our proposed construction of transmission lines to connect the Romaine River hydroelectric complex to our grid which, according to the Uashaunnuat, is being undertaken in violation of their ancestral rights on their alleged ancestral territory. In addition, the Uashaunnuat are raising various procedural claims relating to the environmental review conducted with respect to this project. Along with the Attorney-General of Québec representing the interests of Québec, we intend to contest this motion.
At the request of the parties, these proceedings were suspended in January 2011 and discussions are ongoing to determine the possibility of settling the disputes.
Innus of Pessamit
In November 2006, the Innus of Pessamit re-activated an action which was filed in 1998 against the Attorney-General of Canada, the Attorney-General of Québec and us (Superior Court, no 500-05-039472-988) seeking judicial recognition of their aboriginal rights and title over certain areas of land in Québec where our Manicouagan-Outardes hydroelectric facilities are located. By amendment, this community attempted to increase its initial claim of $500 million to $10.8 billion and to add annual compensation payments of $657 million from us. The request for amendment was rejected by Québec’s Superior Court and Court of Appeal in 2011. The case concerning the initial amount of $500 million remains outstanding. With the Attorney-General of Québec, we are challenging the legitimacy of this claim.
CF(L)Co
On February 23, 2010, CF(L)Co instituted proceedings against us seeking the modification, as of November 30, 2009, of the pricing terms under the 1969 Power Contract (see “Generation Operations-Power Purchases”) by increasing the pricing terms payable by us to CF(L)Co. Alternatively, CF(L)Co is seeking the cancellation of the 1969 Power Contract with effect six months from the date of judgment. We intend to contest this claim.
EMPLOYEES
We had 22,501 employees as at December 31, 2011 composed of 19,415 permanent employees and 3,086 temporary employees. These numbers do not include employees of our subsidiaries and joint ventures. Unionized employees represent approximately 84% of our work force.
Eight collective agreements govern the working conditions of our unionized employees. These collective agreements extend to 2013 or 2014. They provide for annual incentive compensation plan based on attainment of net income target and other business objectives.
26
MANAGEMENT’S DISCUSSION AND ANALYSIS
The Management’s Discussion and Analysis should be read in conjunction with our consolidated financial statements and the notes thereto. The financial information and tabular amounts presented herein are expressed in Canadian dollars, unless otherwise indicated. The consolidated financial statements reflect the decisions of the Energy Board.
This analysis contains statements based on estimates and assumptions concerning future results and the course of events. Given the risks and uncertainties inherent in any forward-looking statements, our actual future results could differ materially from those anticipated. Certain financial and operating data for previous years have been reclassified to conform to the presentation adopted for the current year.
OVERVIEW
We earned net income of $2,611 million in 2011, exceeding the $2,400-million target in the Strategic Plan 2009—2013. A number of factors account for this good performance. Net electricity exports by Hydro-Québec Production increased, despite the appreciation of the Canadian dollar and lower prices on energy markets in northeastern North America. Electricity sales in Québec increased due to higher demand, mainly in the residential sector. Finally, strict management enabled us not only to absorb the impact of inflation, indexing and growth in activities, but also to reduce operating expenses.
Net income increased by $96 million over $2,515 million in 2010. Net electricity exports totaled $1,134 million, or $100 million more than the $1,034 million recorded a year earlier. This difference is the result of a $40-million increase in electricity sales reflecting the combined effect of volume growth of 3.4 TWh, which had a $227-million positive impact, and lower energy prices, which had a $187-million negative impact. In addition, short-term electricity purchases decreased by $209 million because of a 4.8-TWh reduction in volume. In 2010, Hydro-Québec Production had bought more power to offset the effect of precipitation levels considerably lower than the historic mean across the entire hydroelectric generating fleet. On the other hand, the appreciation of the Canadian dollar had a $147-million negative impact. Foreign currency hedging operations generated an $82-million gain in 2011 after an unusually high gain of $185 million in 2010.
Revenue totaled $12,392 million, a $92-million decrease from the $12,484 million recorded in 2010. Revenue from electricity sales amounted to $12,119 million, compared to $12,019 million in 2010: it increased by $214 million in Québec and decreased by $114 million outside Québec. Other revenue was $273 million, compared to $465 million in 2010.
Total expenditure was $7,284 million, or $159 million less than in 2010. The difference is principally due to an $89-million decrease in current operating expenses as a result of strict management, a $166-million reduction in electricity and fuel purchases and the abolition, in 2011, of the capital tax, which resulted in a positive variance of $51 million. These items were partly offset by a $58-million increase in depreciation and amortization expense and an $81-million increase in pension expense, mainly due to the actuarial impact of the reduction in long-term interest rates. Water-power royalties increased by $37 million over 2010.
Financial expenses amounted to $2,497 million in 2011, comparable to the $2,526 million recorded in 2010.
Return on equity was 14.0% in 2011, reflecting our good financial performance.
Cash from operating activities totaled $5.2 billion. This cash allowed us, among other things, to pay the 2010 dividend of $1,886 million and to finance a large portion of our investment program, which reached $3.8 billion in 2011, compared to $4.2 billion in 2010.
The dividend for 2011 amounts to $1,958 million.
27
CONSOLIDATED RESULTS
Revenue totaled $12,392 million, compared to $12,484 million in 2010. Revenue from electricity sales increased by $100 million to $12,119 million. Sales in Québec accounted for $10,720 million of this amount, or $214 million more than in 2010. In markets outside Québec, revenue from electricity sales totaled $1,399 million, a decrease of $114 million. Other revenue totaled $273 million, compared to $465 million in 2010.
The $214-million increase in revenue from electricity sales in Québec resulted mainly from volume growth of 2.1 TWh due to more normal winter temperatures in 2011, whereas they had been exceptionally mild in 2010, as well as a 1.7-TWh increase in demand from residential customers.
The $114-million decrease in revenue from electricity sales on markets outside Québec resulted from lower export revenue from Hydro-Québec Production. The 3.4-TWh increase in sales volume, partly offset by the impact of lower prices on energy markets in northeastern North America, was counterbalanced by the negative impact of the appreciation of the Canadian dollar.
Other revenue totaled $273 million, a decrease of $192 million from 2010, mainly due to decreases in the amounts recognized as revenue variances related to climate conditions and variances in the annual cost of native-load transmission service, in supply costs for electricity in excess of the Heritage Pool Electricity and in pension costs. These variances led to the recognition of a $51-million liability in 2011, compared to a $184-million asset in 2010. This $235-million negative change was mitigated by revenue of $26 million generated by the granting of sublicences for the use of lithium metal phosphates in the manufacture of rechargeable batteries.
Total expenditure was $7,284 million, or $159 million less than in 2010.
Operating expenses amounted to $2,571 million, or $8 million less than in 2010. The efficiency gains achieved within the company made it possible not only to absorb the impact of inflation and annual indexing as well as the additional expenses associated with growth in activities, notably as of result of the commissioning of new generating, transmission and distribution equipment, but also to reduce current operating expenses by $89 million. Pension expense increased by $81 million, mainly because of the actuarial impact of the reduction in long-term interest rates.
Electricity and fuel purchases totaled $1,224 million in 2011, compared to $1,390 million in 2010, a $166-million decrease due mainly to a $216-million reduction in short-term electricity purchases related to exports by Hydro-Québec Production. In 2010, the division had bought more power to offset the effect of precipitation levels considerably lower than the historic mean across the entire hydroelectric generating fleet. Electricity purchases by Hydro-Québec Distribution increased by $41 million, among other things, because winter temperatures were closer to normal in 2011, whereas they had been exceptionally mild in 2010.
Depreciation and amortization expense amounted to $2,623 million, an increase of $58 million over 2010. The difference is due to a $126-million increase in the depreciation of property, plant and equipment as a result of the commissioning of certain capital assets, including the first generating unit at Eastmain-1-A powerhouse, in June 2011, as well as the definitive shutdown of Tracy generating station during the year. The amortization expense related to regulatory assets, recognized in accordance with the conditions established by the Energy Board, decreased by $74 million, mainly as a result of the $51 million of amortization in 2010 in connection with the net costs associated with retirement of property, plant and equipment at Des Cantons substation. Amortization of regulatory assets was taken into account in setting the electricity transmission and distribution rates.
Taxes were $866 million, compared to $909 million in 2010. This decrease resulted from the abolition of the capital tax in 2011, among other things. This item was partly offset, however, by an increase in water-power royalties paid by Hydro-Québec Production, because of higher output and the indexing of royalty rates.
28
Financial expenses totaled $2,497 million in 2011, comparable to the $2,526 million recorded in 2010.
| | 2011 | | 2010 | |
| | | | | |
OPERATIONS AND DIVIDEND ($M) | | | | | |
Revenue | | 12,392 | | 12,484 | |
Operating income | | 5,108 | | 5,041 | |
Net income | | 2,611 | | 2,515 | |
Dividend | | 1,958 | | 1,886 | |
| | | | | |
BALANCE SHEETS ($M) | | | | | |
Total assets | | 69,637 | | 65,809 | |
Property, plant and equipment | | 56,901 | | 55,537 | |
Long-term debt, including current portion and perpetual debt | | 42,050 | | 38,660 | |
Equity | | 18,834 | | 18,566 | |
| | | | | |
FINANCIAL RATIOS | | | | | |
Interest coverage | | 1.99 | | 1.92 | |
Return on equity (%) | | 14.0 | | 14.0 | |
Profit margin (%) | | 21.1 | | 20.1 | |
Capitalization (%) | | 31.0 | | 32.1 | |
Self-financing (%) | | 47.6 | | 46.8 | |
Note: Certain comparative figures have been reclassified to conform to the presentation adopted in the current year.
29
FINANCIAL POSITION
Operating activities
Cash from operating activities totaled $5.2 billion in 2011, compared to $4.6 billion in 2010. These funds were mainly used to pay the dividend for 2010 and to finance a large portion of the investment program.
Investing activities
In 2011, we invested $3.8 billion in property, plant and equipment and intangible assets including the Energy Efficiency Plan (EEP), compared to $4.2 billion in 2010. Of this total, $1.8 billion was invested in development projects and $1.8 billion in maintaining or improving asset quality, while $0.2 billion went to the EEP.
Hydro-Québec Production invested a total of $1,467 million in 2011, compared to $1,900 million in 2010. As expected, a large portion of this amount, $951 million, went to the division’s development projects such as Eastmain-1-A/Sarcelle/Rupert and the Romaine complex. The amounts allocated to ongoing asset maintenance and improvement totaled $516 million. For example, rehabilitation and refurbishment continued at Beauharnois generating station, the Manicouagan complex and La Tuque dam in 2011.
Capital spending at Hydro-Québec TransÉnergie totaled $1,292 million in 2011, 36% of which was used to increase transmission capacity and integrate the output from new hydroelectric and wind power facilities. These projects include connecting Eastmain-1-A and Sarcelle powerhouses and the ongoing work to integrate output from wind farms built in response to Hydro-Québec Distribution’s calls for tenders. The remainder was devoted to long-term transmission system operability, including the project to upgrade the main transmission system.
Hydro-Québec Distribution invested $733 million to handle its growing customer base, ensure the long-term operability of the distribution system and enhance service quality. An additional $217 million was allocated to the EEP.
Hydro-Québec Équipement et services partagés and Société d’énergie de la Baie James carry out engineering, construction and refurbishment projects for Hydro-Québec Production and Hydro-Québec TransÉnergie. In addition, Hydro-Québec Équipement et services partagés offers company-wide shared services that include procurement of goods and services, real estate management, document management, material management and transportation, food and accommodation services.
Financing activities
In 2011, our financing activities raised $4.6 billion on the Canadian and global markets.
In the first half of the year, we issued variable-rate notes for a total amount of $2.0 billion, maturing in February 2015. In addition, fixed-rate financing transactions conducted in January, September and November, which mature in February 2050, raised $1.6 billion. These transactions were carried out on the Canadian market.
We also took advantage of favorable market conditions to issue securities denominated in U.S. dollars, a first since 2001. In June, we floated a US$1.0-billion debenture issue on the global market, bearing interest at 2.00% and maturing in June 2016. This transaction enabled us to diversify our investor base.
The proceeds were used to support part of the investment program and refinance maturing debt.
30
SOURCES OF FINANCING
Type of financing | | Amount authorized by the Board of Directors | | Market | | Outstanding as at
December 31, 2011 |
Credit lines | | C$500 million (a) or US$500 million (a) | | | | C$1 million |
Credit facility (b) | | US$2,000 million | | | | — |
Commercial paper (b) | | US$3,500 million or equivalent in C$ | | United States or Canada | | C$16 million |
Medium-term notes (b) | | US$3,000 million or equivalent in other currencies | | United States | | US$340 million (c) |
| | C$20,000 million or equivalent in US$ | | Canada | | C$14,283 million (c) |
(a) Of this amount, $397 million is covered by operating credit line agreements with financial institutions.
(b) Guaranteed by the Québec government.
(c) Represents net proceeds from the issue of medium-term notes.
Dividend and capitalization rate
The dividend for 2011 amounts to $1,958 million. Once this dividend is factored in, the capitalization rate was 31.0% as at December 31, 2011.
31
SEGMENTED INFORMATION
As in 2010, we had four operating segments in 2011, namely Generation, Transmission, Distribution and Construction, as well as activities grouped under Corporate and Other Activities.
| | | | | | | | | | | | 2011 |
Segmented financial information ($M) | | Generation | | Transmission | | Distribution | | Construction | | Corporate and
Other Activities | | Hydro-Québec (a) | |
Revenue | | 6,496 | | 3,089 | | 10,751 | | 2,122 | | 1,445 | | 12,392 | |
Net income | | 1,690 | | 435 | | 374 | | — | | 109 | | 2,611 | |
Total assets | | 31,661 | | 18,483 | | 12,983 | | 398 | | 6,343 | | 69,637 | |
| | | | | | | | | | | | 2010 |
Segmented financial information ($M) | | Generation | | Transmission | | Distribution | | Construction | | Corporate and
Other Activities | | Hydro-Québec (a) | |
Revenue | | 6,535 | | 3,089 | | 10,775 | | 2,607 | | 1,393 | | 12,484 | |
Net income (loss) | | 1,605 | | 447 | | 453 | | — | | (2 | ) | 2,515 | |
Total assets | | 30,609 | | 18,072 | | 12,700 | | 449 | | 4,307 | | 65,809 | |
(a) Includes the intersegment eliminations presented in Note 24 to the consolidated financial statements.
Note: Certain comparative figures have been reclassified to conform to the presentation adopted in the current year.
Segment highlights
The Generation segment recorded net income of $1,690 million, compared to $1,605 million in 2010, an increase of $85 million. Net electricity exports totaled $1,134 million, or $100 million more than the $1,034 million recorded a year earlier. This difference is the result of a $40-million increase in electricity sales reflecting the combined effect of volume growth of 3.4 TWh, which had a $227-million positive impact, and lower energy prices, which had a $187-million negative impact. In addition, short-term electricity purchases decreased by $209 million because of a 4.8-TWh reduction in volume. On the other hand, the appreciation of the Canadian dollar had a $147-million negative impact. Foreign currency hedging operations generated an $82-million gain in 2011 after an unusually high gain of $185 million in 2010.
Electricity sales to Hydro-Québec Distribution increased by $86 million over the $4,735 million recorded in 2010, mainly because of colder temperatures in winter 2011. Net income from special contracts signed with certain large industrial customers in Québec increased by $13 million, due to the more favorable effect of hedging operations in 2011 than in 2010. Depreciation and amortization expense increased by $100 million over 2010, in large part because of the definitive shutdown of Tracy generating station during the year. Water-power royalties amounted to $598 million in 2011, compared to $561 million in 2010, an increase of $37 million resulting from higher output and the indexing of royalty rates.
The Transmission segment recorded net income of $435 million, a decrease of $12 million from $447 million in 2010. Revenue from native-load transmission service and revenue from point-to-point transmission services provided to Hydro-Québec Production decreased by $6 million and $5 million, respectively.
The Distribution segment recorded net income of $374 million, compared to $453 million in 2010, a decrease of $79 million. Revenue from electricity sales increased on account of colder temperatures in winter 2011 and higher demand in the residential sector. This increase was offset by revenue variances related to climate conditions and variances in the annual cost of native-load transmission service, in supply costs for electricity in excess of the Heritage Pool Electricity and in pension costs. In addition, net electricity purchases, which are net of transmission costs, increased over 2010.
The Construction segment recorded a volume of activity of $2,122 million, compared to $2,607 million in 2010. As in 2010, this high volume stemmed from work on several major projects.
32
GENERATION
Under the Act respecting the Régie de l’énergie, Hydro-Québec Production is required to provide Hydro-Québec Distribution with up to 165 TWh a year of heritage pool electricity. The division sells its excess output on deregulated markets in northeastern North America, including Québec, at market prices. It may also compete for contracts under Hydro-Québec Distribution’s open tendering process.
The division operates 63 generating stations. Its capital projects serve a twofold objective: to ensure the long-term operability of existing facilities and to continue development of Québec’s hydroelectric potential.
Operating results
Hydro-Québec Production recorded net income of $1,690 million, compared to $1,605 million in 2010, an increase of $85 million. Net electricity exports totaled $1,134 million, or $100 million more than the $1,034 million recorded a year earlier. This difference is the result of a $40-million increase in electricity sales reflecting the combined effect of volume growth of 3.4 TWh, which had a $227-million positive impact, and lower energy prices, which had a $187-million negative impact. In addition, short-term electricity purchases decreased by $209 million because of a 4.8-TWh reduction in volume. On the other hand, the appreciation of the Canadian dollar had a $147-million negative impact. Foreign currency hedging operations generated an $82-million gain in 2011 after an unusually high gain of $185 million in 2010.
Electricity sales to Hydro-Québec Distribution increased by $86 million over the $4,735 million recorded in 2010, mainly because of colder temperatures in winter 2011. Net income from special contracts signed with certain large industrial customers in Québec increased by $13 million, due to the more favorable effect of hedging operations in 2011 than in 2010. Depreciation and amortization expense increased by $100 million over 2010, in large part because of the definitive shutdown of Tracy generating station during the year. Water-power royalties amounted to $598 million in 2011, compared to $561 million in 2010, an increase of $37 million resulting from higher output and the indexing of royalty rates.
Electricity sales in Québec
Sales to Hydro-Québec Distribution
In 2011, the total volume of electricity sales to Hydro-Québec Distribution was 168.6 TWh, compared to 167.6 TWh in 2010, an increase of 1.0 TWh. Revenue generated by these sales increased by $86 million to $4,821 million, mainly due to colder temperatures in winter 2011 and higher demand from residential customers.
Special contracts between Hydro-Québec Distribution and certain large industrial customers
The risks related to Hydro-Québec Distribution’s special contracts with certain large industrial customers in Québec are absorbed by Hydro-Québec Production. In 2011, special contracts had a $159-million negative impact on net income, comparable to the level in 2010. On the other hand, hedging operations carried out by us, as part of our risk management strategy related to aluminum prices and exchange rates, generated a $227-million positive impact in 2011, compared to $214 million in 2010.
Electricity sales outside Québec
Electricity sales outside Québec amounted to $1,397 million for 26.7 TWh in 2011, compared to $1,513 million for 23.3 TWh in 2010. Short-term electricity sales generated $1,143 million for 24.1 TWh, compared to $1,266 million for 20.6 TWh in 2010.
Taking short-term electricity purchases into account, net electricity exports generated $1,134 million in 2011 for a net reservoir drawdown of 20.8 TWh, compared to $1,034 million for 12.6 TWh in 2010. This represented a unit contribution of 5.4¢/kWh in 2011, against 8.2¢/kWh in 2010. The decrease is due to the appreciation of the Canadian dollar, the lower volume of short-term purchase/resale transactions and lower prices on energy markets.
As at December 31, 2011, reservoir storage stood at 102.8 TWh, compared to 99.4 TWh a year earlier. Reservoir storage continues to fully meet the criteria set for management of risks related to the security of the energy supply.
33
Electricity and fuel purchases
Electricity and fuel purchases totaled $1,190 million in 2011, a decrease of $253 million from $1,443 million in 2010, due to a reduction in purchase volume. Specifically, short-term purchases related to electricity exports amounted to $254 million for 5.1 TWh, compared to $470 million for 9.9 TWh in 2010. In 2010, Hydro-Québec Production had bought more power to offset the effect of precipitation levels considerably lower than the historic mean across the entire hydroelectric generating fleet.
Depreciation and amortization
Depreciation and amortization expense totaled $825 million, compared to $725 million in 2010, a $100-million increase. This increase is mainly due to the commissioning of capital assets, including the first generating unit at Eastmain-1-A powerhouse, in June 2011, as well as the definitive shutdown of Tracy generating station during the year.
Investing activities
Investments in property, plant and equipment and intangible assets affecting cash totaled $1,467 million in 2011. Of this amount, $951 million went toward hydroelectric development activities, mainly work on the Eastmain-1-A, Sarcelle and Romaine jobsites.
Hydro-Québec Production also invested $516 million in refitting and asset sustainment initiatives. Work included rehabilitation and refurbishment at Beauharnois generating station, the Manicouagan complex and La Tuque dam.
34
TRANSMISSION
Hydro-Québec TransÉnergie operates and develops our power transmission system. It markets system capacity and manages power flows throughout Québec.
The operations of Hydro-Québec TransÉnergie are regulated by the Energy Board.
Rate case
For 2011, the revenue authorized by the Energy Board for transmission rate-setting purposes totaled $3,009 million, including $2,645 million in native-load transmission revenue (representing a $6-million decrease from 2010) and $364 million for short- and long-term point-to-point transmission services.
Operating results
Hydro-Québec TransÉnergie recorded net income of $435 million, a $12-million decrease from $447 million in 2010. Revenue from native-load transmission service and revenue from point-to-point transmission services provided to Hydro-Québec Production decreased by $6 million and $5 million, respectively.
Investing activities
In 2011, Hydro-Québec TransÉnergie invested $1,292 million in property, plant and equipment and intangible assets affecting cash, namely $460 million for growth projects and $832 million for asset sustainment projects. The purpose of growth projects is to increase transmission capacity and bring new hydropower plants and wind farms onto the grid. The asset sustainment projects involve maintaining facilities, improving service quality and complying with the legal and regulatory requirements for operating a power transmission system.
Under growth projects, the division invested $114 million and $49 million, respectively, in integrating output from wind farms related to Hydro-Québec Distribution’s calls for tenders in 2003 (1,000 MW) and 2005 (2,000 MW). It also devoted $56 million to completing the work to connect Eastmain-1-A and Sarcelle powerhouses.
Under asset sustainment projects, which represented 64% of the division’s investments in 2011, Hydro-Québec TransÉnergie devoted $616 million to replacing assets. It also invested $193 million in improving service quality, including $116 million for the project to upgrade the main transmission system.
35
DISTRIBUTION
Hydro-Québec Distribution provides electricity to the Québec market and delivers reliable power and quality services to its customers with a view to efficiency and sustainable development. In this context, it also promotes energy-saving measures among its customers.
The division’s activities are regulated by the Energy Board, which has exclusive jurisdiction to set electricity rates.
Rate cases
In March 2011, the Energy Board approved an across-the-board electricity rate decrease of 0.41%, effective April 1, 2011. In March 2012, it authorized an across-the-board electricity rate decrease on the order of 0.5% for the period from April 1, 2012, to March 31, 2013.
Supplying the Québec market
Hydro-Québec Distribution relies on various sources to supply the Québec market. To meet requirements in excess of the Heritage Pool Electricity (165 TWh) reserved for it by Hydro-Québec Production, the division issues short- and long-term calls for tenders. For requirements of less than three months, it may also buy electricity directly on the market, without tendering, under an authorization granted by the Energy Board. For unforeseen needs that cannot be met otherwise, the division relies on a framework agreement with Hydro-Québec Production that covers the period from January 1, 2009, to December 31, 2013. The agreement was approved by the Energy Board in 2009.
In October 2011, the Energy Board approved the Electricity Supply Plan 2011—2020, which was submitted by Hydro-Québec Distribution in 2010. This plan is based on the demand forecast for the Québec market over a 10-year period. Energy requirements are expected to increase by nearly 13 TWh over that period.
Finally, Hydro-Québec Distribution is continuing its efforts to promote energy efficiency. In 2011, its programs generated new energy savings of 995 GWh, for a total of 6.2 TWh of annual savings achieved to date. The division has a target of 11 TWh by 2015.
Operating results
Hydro-Québec Distribution recorded net income of $374 million, compared to $453 million in 2010, a decrease of $79 million. Revenue from electricity sales increased on account of colder temperatures in winter 2011 and higher demand in the residential sector. This increase was offset by revenue variances related to climate conditions and variances in the annual cost of native-load transmission service, in supply costs for electricity in excess of the Heritage Pool Electricity and in pension costs. In addition, net electricity purchases, which are net of transmission costs, increased over 2010.
ELECTRICITY SALES IN QUÉBEC BY CATEGORY
| | Sales volume | | Sales revenue | |
| | 2011 | | 2011—2010 change | | 2011 | | 2011—2010 change | |
Customer category | | TWh | | TWh | | % | | $M | | $M | | % | |
Residential and farm | | 62.7 | | 3.2 | | 5.4 | | 4,536 | | 234 | | 5.4 | |
Commercial and institutional | | 33.6 | | (0.3 | ) | (0.9 | ) | 2,599 | | (49 | ) | (1.9 | ) |
Industrial | | 67.6 | | (0.8 | ) | (1.2 | ) | 3,262 | | 77 | | 2.4 | |
Other | | 5.3 | | 0.2 | | 3.9 | | 291 | | 9 | | 3.2 | |
Total | | 169.2 | | 2.3 | | 1.4 | | 10,688 | | 271 | | 2.6 | |
FACTORS IN THE 2011—2010 CHANGE IN SALES BY CATEGORY
| | Volume effects | | Price effects | | Total | |
| | Baseload demand | | Temperatures | | Total | | Rate
adjustments | | Other | | Total | | | |
Customer category | | TWh | | $M | | TWh | | $M | | $M | | $M | | $M | | $M | | $M | |
Residential and farm | | 1.7 | | 126 | | 1.5 | | 119 | | 245 | | (7 | ) | (4 | ) | (11 | ) | 234 | |
Commercial and institutional | | (0.8 | ) | (105 | ) | 0.5 | | 27 | | (78 | ) | (5 | ) | 34 | | 29 | | (49 | ) |
Industrial | | (0.8 | ) | 3 | | — | | 2 | | 5 | | (3 | ) | 75 | | 72 | | 77 | |
Other | | 0.1 | | 3 | | 0.1 | | 2 | | 5 | | — | | 4 | | 4 | | 9 | |
Total | | 0.2 | | 27 | | 2.1 | | 150 | | 177 | | (15 | ) | 109 | | 94 | | 271 | |
36
Electricity sales in Québec
Revenue from electricity sales totaled $10,688 million, a $271-million increase over 2010 due to colder temperatures in winter 2011 and higher demand in the residential sector.
Sales volume rose by 2.3 TWh to 169.2 TWh, compared to 166.9 TWh in 2010, essentially as a result of a 2.1-TWh increase in volume because winter temperatures were closer to normal in 2011, whereas they had been exceptionally mild in 2010, and a 1.7-TWh increase in demand from residential customers, mostly due to growth in the number of accounts.
Other revenue
Other revenue decreased by $300 million from the $288 million recorded in 2010. The change in amounts recognized in connection with revenue variances related to climate conditions and variances in the annual cost of native-load transmission service, in supply costs for electricity in excess of the Heritage Pool Electricity and in pension costs decreased other revenue by $240 million.
Revenue variances related to climate conditions correspond to differences between Hydro-Québec Distribution’s actual transmission and distribution revenue and the revenue forecasts established on the basis of the climate normal for rate application purposes. A $61-million asset was recognized in this regard in 2011, compared to $144 million in 2010, for a negative change of $83 million. This is because winter temperatures were closer to normal in 2011, whereas they had been exceptionally mild in 2010.
Variances in the annual cost of native-load transmission service are the result of changes in cost that have not been taken into account in the setting of electricity rates. A $46-million liability was recorded in this regard in 2011, compared to a $16-million asset in 2010, resulting in a negative change of $62 million.
As for variances in supply costs for electricity in excess of the Heritage Pool Electricity, a $3-million liability was recorded in 2011 to take into account the fact that the actual supply costs were lower than the costs forecasted for the purpose of rate-setting by the Energy Board. In 2010, a $56-million asset was recognized in this regard, resulting in a negative change of $59 million.
Lastly, a $32-million liability was recognized in 2011 for variances in pension costs given that the actual related costs for the year were lower than in the rate case.
Electricity purchases and transmission costs
Net electricity purchases increased by $166 million over 2010 because of colder temperatures in winter 2011 and higher demand from residential customers.
The cost of native-load transmission service decreased by $6 million in 2011. Hydro-Québec Distribution annually adjusts its transmission costs to factor in the recognition of Hydro-Québec TransÉnergie’s variance account for revenue from point-to-point transmission services. In 2011, a $47-million reduction was recorded in this regard, compared to a $2-million reduction in 2010, resulting in a positive change of $45 million.
Depreciation and amortization
Depreciation and amortization expense totaled $751 million, compared to $817 million in 2010, a $66-million decrease due mainly to a $45-million reduction in depreciation for property, plant and equipment. This reduction is due, among other things, to the revision of the useful life of certain distribution equipment.
Investing activities
In 2011, Hydro-Québec Distribution’s investments in property, plant and equipment and intangible assets affecting cash totaled $950 million.
Of this amount, $326 million went toward handling the growth of its Québec customer base, including $208 million for new customer hookups. The division also invested $312 million in distribution system asset sustainment and $36 million to improve service quality, including $27 million for the distribution automation program, which will permit remote monitoring of equipment and improvements in system reliability indicators.
Hydro-Québec Distribution also invested $217 million in the Energy Efficiency Plan.
37
CONSTRUCTION
The Construction segment includes activities related to the projects carried out by Hydro-Québec Équipement et services partagés (2) and by Société d’énergie de la Baie James (SEBJ).
Hydro-Québec Équipement et services partagés is responsible for construction and refurbishment projects throughout Québec, except in the territory governed by the James Bay and Northern Québec Agreement (JBNQA). SEBJ builds generating facilities in the territory governed by the JBNQA (north of the 49th parallel) and may carry out certain projects outside Québec.
As engineering and environmental specialists, Hydro-Québec Équipement et services partagés and SEBJ also offer Hydro-Québec Production and Hydro-Québec TransÉnergie a variety of services needed for draft-design studies, impact assessments and other undertakings in the context of energy-related projects. These services include technical and scientific surveys, planning, cost estimates, design, architecture, geomatics and quality control.
Volume of activity
Hydro-Québec Équipement et services partagés and SEBJ carried out activities amounting to a total of $2,122 million in 2011, compared to $2,607 million in the previous year. As in 2010, the high volume can be attributed to several large-scale projects. Work done for Hydro-Québec Production totaled $1,172 million, compared to $1,610 million in 2010, while work done for Hydro-Québec TransÉnergie totaled $920 million, compared to $953 million in 2010.
Hydro-Québec Équipement et services partagés
In 2011, Hydro-Québec Équipement et services partagés carried out power generation and transmission projects amounting to a total of $1,833 million, compared to $1,927 million in 2010. Work done for Hydro-Québec Production included the Romaine complex, specifically the Romaine-2 jobsite, as well as the rehabilitation and refurbishment of numerous facilities, such as Beauharnois generating station. For Hydro-Québec TransÉnergie, the division completed the connection of Eastmain-1-A and Sarcelle powerhouses. It commissioned the 230-kV Goémon—Mont-Louis—Gros-Morne line, which connects two wind farms in the Gaspésie region, and continued work to integrate output from other wind farms contracted for by Hydro-Québec Distribution. At the same time, it carried on with the upgrade of the main transmission system while pursuing other projects to increase transmission system capacity.
Société d’énergie de la Baie James
SEBJ’s activities, carried out on behalf of Hydro-Québec Production, represented a total of $289 million, compared to $680 million in 2010. The main work took place at Eastmain-1-A powerhouse (commissioning of two generating units in 2011, followed by the third and final unit in January 2012) and Sarcelle powerhouse (generating unit assembly).
(2) The operations of the Direction principale — Centre de services partagés are included under Corporate and Other Activities.
38
CORPORATE AND OTHER ACTIVITIES
This heading includes corporate activities, the Direction principale — Centre de services partagés and the Groupe — Technologie.
Results
Corporate and Other Activities recorded net income of $109 million in 2011, an increase of $111 million over 2010, partly because of the revenue generated by the granting of sublicences for the use of lithium metal phosphates in the manufacture of rechargeable batteries.
Corporate activities
Corporate activities consist of the Vice-présidence — Ressources humaines; financial services, which are provided by two departments; and the Groupe — Affaires corporatives et secrétariat général.
The Vice-présidence — Ressources humaines develops strategies, guidelines, frameworks, corporate programs and objectives in matters pertaining to human resources, labor relations, health and safety, and skills development. Its mission includes providing certain products and services in these areas to the entire company. In addition, it is responsible for ensuring that Management can count on optimum human resources conditions.
The Vice-présidence — Comptabilité et contrôle is responsible for overseeing financial, regulatory and management accounting frameworks as well as integrated business risk management. It also has the task of producing and analyzing our consolidated financial statements. Its other duties include financial planning, taxation, financial control and disbursements related to payroll and accounts payable.
The Vice-présidence — Financement, trésorerie et caisse de retraite is in charge of meeting our financing requirements, managing our treasury and maintaining relations with Hydro-Québec bondholders and rating agencies. It also acts as trustee of Hydro-Québec’s pension fund. As at December 31, 2010, the date of the most recent valuation for funding purposes, the pension plan’s funding ratio was 100.2%, which means that the assets held are sufficient to cover future pension costs. The funding ratio has recovered by almost 20% compared to its low point during the 2008 economic crisis, notably because of the returns obtained on pension fund assets in the past two financial years.
The Groupe — Affaires corporatives et secrétariat général provides support services and strategic consulting in the areas of communications, public affairs, environment, ethics and government relations. It is also responsible for services and expertise related to legal affairs as well as safety and security of persons and property. In addition, it coordinates strategic planning and our contribution to the electrification of ground transportation. The Secretary General assists the President and Chief Executive Officer in carrying out our mandate and acts as Secretary to the Board of Directors and the Board committees at Hydro-Québec and its subsidiaries.
Direction principale — Centre de services partagés
The Direction principale — Centre de services partagés, which is part of Hydro-Québec Équipement et services partagés, develops strategies, guidelines and frameworks pertaining to procurement and services common to the entire company. It provides divisions and corporate units with support services, at least cost and adapted to their needs, so that they can focus on their core activities. These services include procurement of goods and services, real estate management, document management, material management and transportation, food and accommodation services.
Its revenue totaled $470 million in 2011, comparable to the $474 million recorded in 2010.
Groupe — Technologie
The Groupe — Technologie is composed primarily of the Direction principale — Télécommunications, the Direction principale — Technologie de l’information, our research institute and the subsidiaries Hydro-Québec IndusTech and Hydro-Québec CapiTech. The group’s mandate is to ensure the integrated management of technological innovation and the optimal management of telecommunications and information technology infrastructure. With this in mind, it has continued to implement an overall vision for systems governance, architecture and security in order to capitalize on the convergence of technologies.
39
In the area of technological innovation, we are interested in, among other things, battery materials, which are crucial to the development of electric mobility. In 2011, together with the Université de Montréal and France’s Centre national de la recherche scientifique, co-owners of the rights to key patents for the production of lithium metal phosphates (LMP), including lithium iron phosphate (LFP), and their use in lithium-ion batteries, we established a new base for the international marketing of these products, in conjunction with the German firm Süd-Chemie. To this end, Süd-Chemie set up a Swiss subsidiary, LiFePO4+C Licensing, which can sublicense the patents for LMP production. The granting of sublicences generated $26 million of revenue during the year.
Direction principale — Télécommunications and Direction principale — Technologie de l’information
The Direction principale — Télécommunications and the Direction principale — Technologie de l’information enhance the efficiency of all divisions and corporate units by offering technology solutions in line with our business priorities.
In 2011, these two units recorded revenue of $557 million, compared to $523 million in 2010.
Research institute
Our research institute, IREQ, provides technical assistance to the divisions and carries out technological innovation projects to support their operations and ensure our long-term development. We allocate approximately $100 million annually to IREQ’s activities.
Hydro-Québec IndusTech
The mission of Hydro-Québec IndusTech is to partner with the private sector in industrializing and marketing technologies resulting from our research activities. Among other things, it is responsible for TM4 inc., a company active in the field of electric powertrain systems. In 2011, TM4 began work on designing a 200-kW powertrain for electric buses and other heavy vehicles.
Investing activities
In 2011, the Groupe — Technologie’s investments totaled $82 million, of which $62 million was earmarked for maintaining asset quality, $14 million for development activities, and $6 million for meeting growth in demand.
40
INTEGRATED BUSINESS RISK MANAGEMENT
For a number of years, we have applied an integrated business risk management process that is now part of our ongoing activities. This process is supported by various control, communication and assessment mechanisms that enable us to monitor risk developments on a dynamic basis.
Our divisions and corporate units are central to the process. As part of their ongoing activities, they manage the risks to which they are exposed and reassess them on a regular basis, daily in some cases. In concrete terms, each division or corporate unit must determine and assess its main risks and then develop and apply mitigation measures to ensure that residual business risks are at a level acceptable to us. During the annual planning process, this exercise results in a consolidated portfolio of residual business risks. This consolidated portfolio is presented to the Board of Directors with the Strategic Plan or the annual Business Plan, which include an analysis of the sensitivity of net income to the principal risks. The divisions and corporate units report on their risk management activities and follow-up to the Management Committee, which then acts as a risk management committee to provide overall monitoring of business risks.
FINANCIAL RISKS
In the course of our operations, we carry out transactions that expose us to certain financial risks, such as market, credit and liquidity risk. Rigorous follow-up and the adoption of strategies that include the use of derivative instruments considerably reduce exposure to such risks and their impact on results.
Market risk
Our results are subject to different types of market risk associated mainly with fluctuations in the Canadian dollar’s exchange rate compared to the U.S. dollar as well as fluctuations in interest rates and aluminum prices. Exchange rate fluctuations affect revenue from sales denominated in U.S. dollars as well as the cost of U.S. dollar-denominated debt and swaps. Interest rate fluctuations affect financial expenses, pension costs and the authorized return on equity of regulated divisions. Aluminum price fluctuations have an impact on the revenue from special contracts with certain large industrial customers in Québec.
The three types of market risk are subject to active integrated management, in particular through derivative financial products. The purpose of such management is to limit the impact of market risk on our short-term results, according to strategies and criteria established based on our risk tolerance. Furthermore, we can count on certain offsetting factors that mitigate our market risk over the medium and long term. For example, we hold debt and swaps denominated in U.S. dollars as a hedge against sales in that currency. The effect of exchange rate fluctuations on sales is thus offset by exchange gains or losses on debt in U.S. dollars. There is also an offsetting effect between the impact of a general increase or decrease in interest rates on financial expenses, on the one hand, and the impact of such an increase or decrease on pension costs and the authorized return on equity of regulated divisions, on the other.
Credit risk
Credit risk is the risk that a counterparty may not meet its contractual obligations. We are exposed to credit risk related to receivables through ongoing energy sales in Québec. These sales are billed at rates that provide for cost recovery according to conditions approved by the Energy Board. We are also exposed to credit risk related to the cash equivalents, short-term investments and derivative instruments traded with financial institutions and other issuers and, to a lesser extent, with North American energy companies under Hydro-Québec Distribution supply contracts and Hydro-Québec Production energy transactions on markets outside Québec.
Exposure to credit risk is mitigated by the implementation of limits and frameworks for risk concentration and level of exposure by counterparty. To ensure compliance with such limits and frameworks, we take a proactive approach based on various controls and monitoring reports. These enable us to react quickly to any event that could have an impact on the financial condition of our counterparties. In addition, we generally do business with counterparties that have a high credit rating. We also enter into agreements to limit the market value of the main portfolios of derivative instruments.
41
Liquidity risk
Liquidity risk is the risk that we may have difficulty meeting commitments related to our financial liabilities. For a company, this type of risk may translate into difficulties accessing sources of financing for its investment program.
Our liquidity risk is mitigated by several factors, including substantial cash flows generated by operating activities, access to a preauthorized standby credit facility and a diversified portfolio of highly liquid financial instruments. Given the mitigation measures in place, we consider our level of exposure to liquidity risk to be low.
OPERATIONAL RISKS
Generation
One of the principal uncertainties that we face relates to natural water inflows. Hydro-Québec Production must ensure that it is able to meet its commitments to supply the annual heritage pool of 165 TWh to Hydro-Québec Distribution and fulfill its contractual obligations. In concrete terms, this means being able to cover a natural inflow deficit of 64 TWh over two consecutive years, and 98 TWh over four consecutive years. To meet this requirement, the division applies a variety of mitigation measures and closely monitors them. It therefore manages its reservoir storage on a multiyear basis and maintains an adequate margin between its generating capacity and its commitments. This allows the division to compensate for variations in runoff, replenish its reserves or take advantage of business opportunities. We regularly report to the Energy Board on our generating capacity and the energy reserve of Hydro-Québec Production.
Beyond runoff uncertainties, Hydro-Québec Production’s wholesale activities are subject to market risk and the risk of unavailability of generating and transmission equipment. Market risk results from fluctuations in electricity and fuel prices, and is mitigated by ongoing monitoring of trends in wholesale markets and the use of hedging derivative instruments. The risk of unavailability of generating and transmission equipment is maintained at a level deemed acceptable through maintenance and upgrade programs.
The risks related to Hydro-Québec Production’s wholesale activities are quantified in an integrated fashion by a team of specialists that is independent of the group carrying out the transactions. This team sees to the application of controls, presents daily reports to Senior Management and ensures compliance with the limits approved by Management and the Board of Directors.
Transmission
Several factors, such as extreme weather and equipment failure, may cause service interruptions or result in the unavailability of part of the transmission system. The multifaceted strategy adopted by Hydro-Québec TransÉnergie to prevent these problems includes implementing the standards of the North American Electric Reliability Corporation and the Northeast Power Coordinating Council, as well as measures to maintain and improve transmission facilities and extend their useful life. In 2007, the Energy Board confirmed the reliability expertise of Hydro-Québec TransÉnergie by designating its Direction — Contrôle des mouvements d’énergie, the unit responsible for system control, as Reliability Coordinator for Québec.
Hydro-Québec TransÉnergie must ensure adequate transmission capacity to supply Hydro-Québec Distribution and other customers, as well as transmission system security and reliability. To do so, the division relies, among other things, on a strategy of ensuring long-term operability of transmission assets and on optimal management of annual peak load.
Distribution
Hydro-Québec Distribution’s activities are subject to uncertainty related to fluctuations in demand (under normal climate conditions) due to the economic and energy situation, which have an impact on results. When demand is lower than the forecasts made in the rate case, the division cannot recover from customers all the costs related to power distribution and power transmission through the Hydro-Québec TransÉnergie system. To counter the impact of this risk, the division constantly fine-tunes its method of forecasting demand for electricity.
In addition, Hydro-Québec Distribution applies a series of measures to ensure long-term operability of the distribution system, and hence service quality. These measures include compliance with applicable standards for overhead and underground systems, the implementation of an asset maintenance program and a strategy for asset renewal, as well as vegetation control.
In order to promote better energy use, the division is also pursuing its efforts in the area of energy efficiency.
42
Construction
One of the principal risks that Hydro-Québec Équipement et services partagés must deal with is pressure on project costs, due to such factors as the rising cost of labor in the construction industry, higher prices for certain materials or products (such as steel and petroleum products) and unforeseen events that affect project timetables.
There is also a risk related to the quality and delivery time for components, especially if they are manufactured outside Canada. In addition, the ongoing consolidation of electrical equipment suppliers could affect the medium- and long-term price or availability of such equipment.
To meet its commitments and continue to apply high quality and safety standards, Hydro-Québec Équipement et services partagés has implemented a number of measures that reduce its risk exposure. For instance, the division monitors key indicators for trends in prices and the rate of activity in the construction industry. It has also developed procurement strategies that promote competition or maintaining expertise in most markets and it adjusts its project completion strategies according to economic conditions, in consultation with its customers.
Corporate and Other Activities
Environmental protection and conservation are among our central concerns. Most activities that have a significant impact on the environment are governed by an ISO 14001—certified environmental management system. In addition, every year, we review our management of environmental issues and detail them in our Sustainability Report.
We are also concerned with information security and the risks associated with confidentiality and with the loss of availability or integrity of systems and data as a result of a malicious act, error or natural disaster. We regularly assess how well our information systems are protected against threats and implement the necessary security measures. These measures include an information and communication technologies security program, an antivirus expertise centre, Internet filtering, a security monitoring centre, managing of identities and access, and managing of incidents and vulnerabilities.
Finally, we have a corporate emergency response plan to ensure the continuity of our operations and our mission in case of an exceptional event. The plan defines the material, technical and organizational means required to restore electrical service. It also provides for effective coordination of all internal and external responders, including public authorities.
43
CHANGEOVER TO INTERNATIONAL FINANCIAL REPORTING STANDARDS
On February 13, 2008, the Canadian Accounting Standards Board (AcSB) confirmed that publicly accountable enterprises would be required to apply International Financial Reporting Standards (IFRS) in their interim and annual financial statements relating to fiscal years beginning on or after January 1, 2011, with comparative information presented for fiscal 2010. On October 28, 2009, the Public Sector Accounting Board confirmed that government business enterprises such as us would be required to comply with the standards applicable to publicly accountable enterprises.
At its meeting of September 7 and 8, 2010, the AcSB approved an amendment to provide an optional one-year deferral, to January 1, 2012, of the mandatory date for adoption of IFRS for entities with activities subject to cost-based rate regulation.
In March 2012, the AcSB announced a decision to extend the deferral of the mandatory IFRS changeover date for entities with qualifying rate-regulated activities by one year to January 1, 2013. The AcSB expects to issue the amendment to the Introduction to Part 1 of the Handbook in May 2012. Changes to Canadian GAAP become effective only upon issuance of Handbook revisions and apply to financial statements issued subsequently.
Because we are subject to rate regulation in our power transmission and distribution activities and we recognize regulatory assets and liabilities in this regard, we would be able to use this deferral right. Therefore, we are examining if we will adopt this further one-year delay.
We began our IFRS conversion project in 2007. The project was broken down into three main phases:
Phase 1 — Diagnostic study: Identification of the main differences between Canadian generally accepted accounting principles (GAAP) and IFRS and preliminary evaluation of IFRS 1, First-time Adoption of International Financial Reporting Standards, which deals with the optional exemptions on first-time adoption of IFRS. This phase led to establishing strategies for the implementation of IFRS.
Phase 2 — Designing and developing solutions: Preparation of a conversion plan, detailed analysis of IFRS, election of the most appropriate accounting policies and quantification of the impact of the changeover to IFRS.
Phase 3 — Implementation: Changes to systems, filing of requests for changes in accounting policies with the Energy Board, preparation of the opening Statement of Financial Position and comparative information and preparation of model financial statements according to IFRS.
The main issues identified concern property, plant and equipment, regulatory accounting practices and employee future benefits.
44
SUMMARY OF CERTAIN MATERIAL DIFFERENCES BETWEEN CANADIAN GAAP AND US GAAP
BACKGROUND
Our Consolidated Financial Statements are prepared in accordance with Canadian generally accepted accounting principles (“Canadian GAAP”), as presented in Part V of the Canadian Institute of Chartered Accountants Handbook, which differ in many instances from accounting principles generally accepted in the United States (“US GAAP”). As well, some accounting practices under both Canadian GAAP and US GAAP applicable to regulated entities, such as us, differ from accounting practices otherwise applied by unregulated companies (see “Notes 1 and 3 to the 2011 Consolidated Financial Statements”). The material differences between Canadian GAAP and US GAAP in relation to our 2011 Consolidated Financial Statements are summarized below; this discussion does not include disclosure differences. The matters discussed below have not been audited and do not necessarily include all applicable differences between Canadian GAAP and US GAAP. The following summary should be read in conjunction with our 2011 Consolidated Financial Statements.
JOINT VENTURES
Under Canadian GAAP, interests in joint ventures are accounted for using the proportionate consolidation method, whereas under US GAAP, they are accounted for using the equity method. This results in reclassification in the captions in the consolidated balance sheets and the consolidated statements of operations, cash flows and comprehensive income, but these reclassifications would have no impact on net income and shareholder’s equity.
FOREIGN CURRENCY TRANSLATION
Under Canadian GAAP, exchange gains or losses resulting from the translation of long-term monetary items are included in the consolidated statement of operations. When such items are designated as hedges of future revenue streams in U.S. dollars, related exchange gains or losses are deferred to the year such sales are made when conditions to use hedge accounting are met and they are documented as cash-flow hedging relationship.
Under US GAAP, firmly committed sales may be designated as a hedged item if hedged by a non-derivative financial instrument and must be in a fair-value hedging relationship. Thus, since we have not documented the fair-value hedge for US GAAP purposes, related exchange gains or losses resulting from the translation of long-term monetary items would have been included in the consolidated statement of operations.
DEFINED BENEFIT PENSION AND OTHER POST-RETIREMENT BENEFIT PLANS
Under Canadian GAAP, the accrued benefit asset or liability of defined benefit pension and post-retirement benefit plans, presented in the consolidated balance sheet, consists of the cumulative difference between the benefit cost of the period and the employer’s contributions. The unamortized actuarial gains or losses, unamortized past service costs, unamortized transitional asset or obligation as well as yearly changes in the funded status are presented in the notes to the consolidated financial statements.
Under US GAAP, an entity should recognize the over-funded or under-funded status of defined benefit pension and post-retirement benefit plans as an asset or liability in the consolidated balance sheet. The unamortized actuarial gains or losses, unamortized past service costs and unamortized transitional asset or obligation would be presented under accumulated other comprehensive income. Actuarial gains and losses and prior service costs and credits that arise during the period would be recognized as a component of other comprehensive income.
DERIVATIVE INSTRUMENTS AND HEDGING ACTIVITIES INCLUDING ENERGY DERIVATIVES
Under Canadian GAAP, an entity may assume that there is no ineffectiveness in a hedge of interest rate risk involving a recognized interest-bearing asset or liability and an interest rate swap when certain conditions exist. The same assumption applies to certain cross-currency swaps. Also, contracts that meet the definition of an embedded derivative instrument are separated from the host contract and accounted for as a derivative instrument at fair value. At the date of initial application, an entity must choose to either separate all embedded derivative instruments from their host contract or select the beginning of a fiscal year ending no later than March 31, 2004 as its transition date.
45
Under US GAAP, an entity may not assume that there is no ineffectiveness in a hedge of cross-currency swaps. For these hedging relationships, the effectiveness must be assessed and measured on a regular basis. Also, contracts that meet the definition of an embedded derivative instrument are separated from the host contract and accounted for as a derivative instrument at fair value. At the date of initial application, an entity must choose to either separate all embedded derivative instruments from their host contract or select January 1, 1998 or January 1, 1999 as a transition date and recognize only those derivatives embedded in hybrid instruments issued, acquired or substantively modified by the entity on or after the selected transition date.
46
INDEPENDENT AUDITORS’ REPORT
To the Minister of Finance of Québec:
Report on Consolidated Financial Statements
We have audited the accompanying consolidated financial statements of Hydro-Québec, which comprise the consolidated balance sheets as at December 31, 2011 and 2010, and the consolidated statements of operations, retained earnings, cash flows and comprehensive income for the years then ended, and the notes, which include a summary of significant accounting policies and other explanatory information.
MANAGEMENT’S RESPONSIBILITY FOR THE CONSOLIDATED FINANCIAL STATEMENTS
Management is responsible for the preparation and fair presentation of these consolidated financial statements in accordance with Canadian generally accepted accounting principles, and for such internal control as Management determines is necessary to enable the preparation of consolidated financial statements that are free from material misstatement, whether due to fraud or error.
AUDITORS’ RESPONSIBILITY
Our responsibility is to express an opinion on these consolidated financial statements based on our audits. We conducted our audits in accordance with Canadian generally accepted auditing standards. Those standards require that we comply with ethical requirements and plan and perform our audits to obtain reasonable assurance about whether the consolidated financial statements are free from material misstatement.
An audit involves performing procedures to obtain audit evidence about the amounts and disclosures in the consolidated financial statements. The procedures selected depend on the auditor’s judgment, including the assessment of the risks of material misstatement of the consolidated financial statements, whether due to fraud or error. In making those risk assessments, the auditor considers internal control relevant to the entity’s preparation and fair presentation of the consolidated financial statements in order to design audit procedures that are appropriate in the circumstances, but not for the purpose of expressing an opinion on the effectiveness of the entity’s internal control. An audit also includes evaluating the appropriateness of accounting policies used and the reasonableness of accounting estimates made by Management, as well as evaluating the overall presentation of the consolidated financial statements.
We believe that the audit evidence we have obtained in our audits is sufficient and appropriate to provide a basis for our audit opinion.
OPINION
In our opinion, these consolidated financial statements present fairly, in all material respects, the financial position of Hydro-Québec as at December 31, 2011 and 2010, and the consolidated results of its operations and its consolidated cash flows for the years then ended, in accordance with Canadian generally accepted accounting principles.
Report on Other Legal and Regulatory Requirements
As required by the Auditor General Act (R.S.Q., c. V-5.01), we report that, in our opinion, except for the application of the changes in accounting policies described in Note 2 to the consolidated financial statements, these principles have been applied on a basis consistent with that of the preceding year.
/s/ KPMG LLP (a) | /s/ Ernst & Young LLP (b) | /s/ Michel Samson, CA auditor |
| | |
KPMG LLP
Chartered Accountants | Ernst & Young LLP
Chartered Accountants | Michel Samson, CA auditor
Acting Auditor General of Québec |
Montréal, Québec
February 17, 2012
a) CA auditor permit No. 20027
b) CA auditor permit No. 13764
47
INDEPENDENT AUDITORS’ REPORT
To the Minister of Finance of Québec:
We have audited the consolidated statements of operations, retained earnings, cash flows and comprehensive income of Hydro-Québec for the year ended December 31, 2009. These financial statements are the responsibility of Hydro-Québec’s Management. Our responsibility is to express an opinion on these financial statements based on our audit.
We conducted our audit in accordance with Canadian generally accepted auditing standards. Those standards require that we plan and perform an audit to obtain reasonable assurance whether the financial statements are free of material misstatement. An audit includes examining, on a test basis, evidence supporting the amounts and disclosures in the financial statements. An audit also includes assessing the accounting principles used and significant estimates made by Management, as well as evaluating the overall financial statement presentation.
In our opinion, these consolidated financial statements present fairly, in all material respects, the results of operations and cash flows of Hydro-Québec for the year ended December 31, 2009, in accordance with Canadian generally accepted accounting principles. As required by the Auditor General Act (R.S.Q., c. V-5.01), we report that, in our opinion, except for the application of changes in accounting policies described in Note 2 to the consolidated financial statements, these principles have been applied on a basis consistent with that of the preceding year.
/s/ KPMG LLP (a) | /s/ Ernst & Young LLP (b) |
| |
KPMG LLP
Chartered Accountants | Ernst & Young LLP
Chartered Accountants |
Montréal, Québec
February 5, 2010
a) CA auditor permit No. 6992
b) CA auditor permit No. 13764
48
CONSOLIDATED FINANCIAL STATEMENTS
Consolidated Statements of Operations
Years ended December 31
In millions of Canadian dollars | | Notes | | 2011 | | 2010 | | 2009 | |
| | | | | | | | | |
Revenue | | 4 | | 12,392 | | 12,484 | | 12,217 | |
| | | | | | | | | |
Expenditure | | | | | | | | | |
Operations | | | | 2,571 | | 2,579 | | 2,527 | |
Electricity and fuel purchases | | | | 1,224 | | 1,390 | | 1,207 | |
Depreciation and amortization | | 5 | | 2,623 | | 2,565 | | 2,286 | |
Taxes | | 6 | | 866 | | 909 | | 928 | |
| | | | 7,284 | | 7,443 | | 6,948 | |
| | | | | | | | | |
Operating income | | | | 5,108 | | 5,041 | | 5,269 | |
| | | | | | | | | |
Financial expenses | | 7 | | 2,497 | | 2,526 | | 2,398 | |
| | | | | | | | | |
Net income | | | | 2,611 | | 2,515 | | 2,871 | |
Consolidated Statements of Retained Earnings
Years ended December 31
In millions of Canadian dollars | | Note | | 2011 | | 2010 | | 2009 | |
| | | | | | | | | |
Balance, beginning of year | | | | 13,965 | | 13,336 | | 12,633 | |
| | | | | | | | | |
Net income | | | | 2,611 | | 2,515 | | 2,871 | |
| | | | | | | | | |
| | | | 16,576 | | 15,851 | | 15,504 | |
| | | | | | | | | |
Dividend | | 19 | | 1,958 | | 1,886 | | 2,168 | |
| | | | | | | | | |
Balance, end of year | | | | 14,618 | | 13,965 | | 13,336 | |
The accompanying notes are an integral part of the consolidated financial statements.
49
Consolidated Balance Sheets
As at December 31
In millions of Canadian dollars | | Notes | | 2011 | | 2010 | |
| | | | | | | |
ASSETS | | | | | | | |
| | | | | | | |
Current assets | | | | | | | |
Cash and cash equivalents | | | | 1,377 | | 80 | |
Short-term investments | | | | 904 | | 1,230 | |
Accounts receivable and other receivables | | 16 | | 1,744 | | 1,814 | |
Derivative instruments | | 16 | | 1,322 | | 889 | |
Regulatory assets | | 3 | | 18 | | — | |
Materials, fuel and supplies | | | | 236 | | 314 | |
| | | | 5,601 | | 4,327 | |
| | | | | | | |
Property, plant and equipment | | 8 | | 56,901 | | 55,537 | |
Intangible assets | | 9 | | 2,187 | | 2,083 | |
Investments | | 10 | | 124 | | 114 | |
Derivative instruments | | 16 | | 1,313 | | 952 | |
Regulatory assets | | 3 | | 21 | | 30 | |
Other assets | | 11 | | 3,490 | | 2,766 | |
| | | | | | | |
| | | | 69,637 | | 65,809 | |
| | | | | | | |
LIABILITIES | | | | | | | |
| | | | | | | |
Current liabilities | | | | | | | |
Borrowings | | | | 52 | | 18 | |
Accounts payable and accrued liabilities | | | | 2,099 | | 1,987 | |
Dividend payable | | 19 | | 1,958 | | 1,886 | |
Accrued interest | | | | 862 | | 909 | |
Derivative instruments | | 16 | | 261 | | 308 | |
Current portion of long-term debt | | 12 | | 1,025 | | 1,933 | |
| | | | 6,257 | | 7,041 | |
| | | | | | | |
Long-term debt | | 12 | | 40,744 | | 36,439 | |
Asset retirement obligations | | 13 | | 540 | | 504 | |
Derivative instruments | | 16 | | 2,098 | | 2,114 | |
Other long-term liabilities | | 14 | | 883 | | 857 | |
Perpetual debt | | 15 | | 281 | | 288 | |
| | | | | | | |
| | | | 50,803 | | 47,243 | |
| | | | | | | |
EQUITY | | 19 | | | | | |
Share capital | | | | 4,374 | | 4,374 | |
| | | | | | | |
Retained earnings | | | | 14,618 | | 13,965 | |
Accumulated other comprehensive income | | | | (158 | ) | 227 | |
| | | | 14,460 | | 14,192 | |
| | | | | | | |
| | | | 18,834 | | 18,566 | |
| | | | | | | |
| | | | 69,637 | | 65,809 | |
Commitments and contingencies | | 23 | | | | | |
The accompanying notes are an integral part of the consolidated financial statements.
50
Consolidated Statements of Cash Flows
Years ended December 31
In millions of Canadian dollars | | Notes | | 2011 | | 2010 | | 2009 | |
| | | | | | | | | |
Operating activities | | | | | | | | | |
Net income | | | | 2,611 | | 2,515 | | 2,871 | |
Adjustments to determine net cash flows from operating activities | | | | | | | | | |
Depreciation and amortization | | 5 | | 2,623 | | 2,565 | | 2,286 | |
Amortization of premiums, discounts and issue expenses related to debt securities | | 7 | | 148 | | 127 | | 117 | |
Other | | | | 149 | | (152 | ) | 77 | |
Change in non-cash working capital items | | 21 | | 170 | | 153 | | (3 | ) |
Net change in accrued benefit assets and liabilities | | 22 | | (498 | ) | (569 | ) | (561 | ) |
| | | | 5,203 | | 4,639 | | 4,787 | |
| | | | | | | | | |
Investing activities | | | | | | | | | |
Additions to property, plant and equipment | | | | (3,508 | ) | (3,916 | ) | (3,989 | ) |
Additions to intangible assets | | | | (306 | ) | (304 | ) | (318 | ) |
Cash receipts from the government reimbursement for the 1998 ice storm | | | | 7 | | 9 | | 19 | |
Disposal (acquisition) of investments | | | | — | | 10 | | (15 | ) |
Acquisition of an interest | | 17 | | — | | — | | (580 | ) |
Net disposal of short-term investments | | | | 376 | | 891 | | 1,430 | |
Other | | | | (4 | ) | 8 | | (22 | ) |
| | | | (3,435 | ) | (3,302 | ) | (3,475 | ) |
| | | | | | | | | |
Financing activities | | | | | | | | | |
Issuance of long-term debt | | | | 4,574 | | 1,593 | | 4,135 | |
Repayment of long-term debt and sinking fund | | | | (3,158 | ) | (1,083 | ) | (1,233 | ) |
Cash receipts arising from credit risk management | | 16 | | 3,898 | | 2,322 | | 1,125 | |
Cash payments arising from credit risk management | | 16 | | (3,933 | ) | (2,374 | ) | (2,950 | ) |
Net change in borrowings | | | | 32 | | (13 | ) | (32 | ) |
Dividend paid | | | | (1,886 | ) | (2,168 | ) | (2,252 | ) |
Other | | | | (2 | ) | (2 | ) | (2 | ) |
| | | | (475 | ) | (1,725 | ) | (1,209 | ) |
| | | | | | | | | |
Foreign currency effect on cash and cash equivalents | | | | 4 | | (4 | ) | (16 | ) |
| | | | | | | | | |
Net change in cash and cash equivalents | | | | 1,297 | | (392 | ) | 87 | |
| | | | | | | | | |
Cash and cash equivalents, beginning of year | | | | 80 | | 472 | | 385 | |
| | | | | | | | | |
Cash and cash equivalents, end of year | | | | 1,377 | | 80 | | 472 | |
| | | | | | | | | |
Supplementary cash flow information | | 21 | | | | | | | |
The accompanying notes are an integral part of the consolidated financial statements.
51
Consolidated Statements of Comprehensive Income
Years ended December 31
In millions of Canadian dollars | | 2011 | | 2010 | | 2009 | |
| | | | | | | |
Net income | | 2,611 | | 2,515 | | 2,871 | |
| | | | | | | |
Other comprehensive income | | | | | | | |
Change in deferred (losses) gains on items designated as cash flow hedges | | (113 | ) | (38 | ) | 9 | |
Reclassification to operations of deferred gains on items designated as cash flow hedges | | (272 | ) | (444 | ) | (543 | ) |
| | (385 | ) | (482 | ) | (534 | ) |
| | | | | | | |
Comprehensive income | | 2,226 | | 2,033 | | 2,337 | |
The accompanying notes are an integral part of the consolidated financial statements.
52
Notes to Consolidated Financial Statements
Years ended December 31, 2011 and 2010
Amounts in tables are in millions of Canadian dollars, unless otherwise indicated.
Under the provisions of the Hydro-Québec Act, Hydro-Québec is mandated to supply power and to pursue endeavors in energy-related research and promotion, energy conversion and conservation, and any field connected with or related to power or energy. Hydro-Québec is required, in particular, to supply a base volume of up to 165 TWh a year of heritage pool electricity for the Québec market, as set out in the Act respecting the Régie de l’énergie. As a government corporation, Hydro-Québec is exempt from paying income taxes.
Note 1 Significant Accounting Policies
In September 2010, the Canadian Accounting Standards Board authorized rate-regulated entities to defer the adoption of International Financial Reporting Standards to January 1, 2012. Since Hydro-Québec was entitled to exercise this deferral right, its 2011 financial statements have been prepared in accordance with Canadian generally accepted accounting principles (GAAP) as set forth in Part V of the Canadian Institute of Chartered Accountants Handbook (CICA Handbook), “Pre-Changeover Accounting Standards,” and reflect the decisions of the Régie de l’énergie (the “Régie”). These decisions may affect the timing of the recognition of certain transactions in the consolidated operations, resulting in the recognition of regulatory assets and liabilities, which Hydro-Québec considers it is likely to recover or settle subsequently through the rate-setting process.
REGULATION
The Act respecting the Régie de l’énergie grants the Régie exclusive authority to determine or modify the rates and conditions under which electricity is transmitted and distributed by Hydro-Québec. Hydro-Québec’s electricity transmission and distribution activities in Québec are therefore regulated. Under this legislation, rates are set by reasoned decision of three commissioners after public hearings. Moreover, the Act stipulates that rates are determined on a basis that allows for recovery of the cost of service plus a reasonable return on the rate base.
The Régie and Hydro-Québec are both part of the Québec government reporting entity. However, the Régie is an independent, quasi-judicial economic regulatory agency accountable to the National Assembly of Québec through the Minister of Natural Resources and Wildlife.
Transmission
Hydro-Québec’s power transmission rates for 2011, 2010 and 2009 were determined in Régie decisions D-2011-061, D-2010-041 and D-2009-023, respectively, and became effective on January 1, 2011, January 1, 2010, and January 1, 2009, respectively. The authorized return on the rate base was set at 7.21% in 2011, 7.44% in 2010 and 7.65% in 2009, assuming a capitalization with 30% equity.
Distribution
Hydro-Québec’s electricity rates were determined in decisions D-2011-036, D-2010-035 and D-2009-21, in which the Régie authorized an across-the-board rate reduction of 0.41%, and granted an across-the-board rate increase of 0.35% and 1.22%, effective April 1, 2011, April 1, 2010 and April 1, 2009, respectively. The authorized return on the rate base was set at 7.26% in 2011, 7.54% in 2010, and 7.42% in 2009, assuming a capitalization with 35% equity.
SCOPE OF CONSOLIDATION
The consolidated financial statements include the accounts of Hydro-Québec, its subsidiaries and its joint ventures as well as those of variable interest entities where Hydro-Québec is the primary beneficiary. Interests in joint ventures are accounted for using the proportionate consolidation method.
53
Note 1 Significant Accounting Policies (continued)
USE OF ESTIMATES
The preparation of financial statements in accordance with GAAP requires that Management make estimates and assumptions that affect the amounts recognized as assets and liabilities, the disclosures regarding contingent assets and liabilities at the date of the consolidated financial statements and the amounts recognized as revenue and expenditure for the years at issue. The estimates relate, among other things, to revenue, which includes estimated amounts for electricity delivered but not billed; the useful life of property, plant and equipment and intangible assets for calculating the depreciation and amortization expense; cash flows, the expected timing of payments; and the discount rates used to determine asset retirement obligations and employee future benefits. These rates are based on actuarial and economic assumptions. Actual results could differ from those estimates and such differences could be significant.
REVENUE
Substantially all the revenue comes from electricity sales. Revenue from these sales is recognized on delivery. Revenue also includes certain amounts that Hydro-Québec is entitled to recover from customers or is required to reimburse to them. These amounts relate, among other things, to the supply of electricity in excess of the heritage pool, to transmission services and to climate conditions. These items give rise to financial assets and liabilities that are reported in Accounts receivable and other receivables and Other assets or in Accounts payable and accrued liabilities and Other long-term liabilities, based on their maturities, which range from one to five years.
Other revenue is recognized on delivery of the goods or services.
FOREIGN CURRENCY TRANSLATION
Self-sustaining foreign operations
The financial statements of foreign operations that are self-sustaining in terms of financial and operational management are translated according to the current rate method using the foreign currency as the measuring unit. Under this method, assets and liabilities are translated into Canadian dollars at the exchange rate in effect at the balance sheet date, and revenue and expenditure are translated at the average exchange rate in effect during the period. The exchange gains or losses resulting from the translation of the financial statements of these foreign operations are presented in Accumulated other comprehensive income under Equity on the balance sheet.
Integrated foreign operations and foreign currency transactions
In the case of foreign operations that are integrated in terms of financial and operational management, as well as foreign currency transactions, accounts stated in foreign currencies are translated according to the temporal method. Under this method, monetary assets and liabilities are translated into Canadian dollars at the exchange rate in effect at the balance sheet date, and non-monetary items are translated at the historical exchange rate. Revenue and expenditure arising from foreign currency transactions are translated into Canadian dollars at the exchange rate in effect at the transaction date. The exchange gains or losses resulting from the translation of monetary items are included in operations, unless they relate to hedging items for future sales in U.S. dollars, in which case they are recognized in Other comprehensive income until the period in which such sales are made.
54
Note 1 Significant Accounting Policies (continued)
FINANCIAL INSTRUMENTS
Financial instruments are measured at fair value on initial recognition. Their measurement in subsequent periods and the recognition of any changes in fair value depend on the category in which they are classified.
The following table presents the classification of financial instruments in the various categories:
Category | | Financial Instruments |
| | |
Financial assets and liabilities held for trading | | |
Designated | | Cash and cash equivalents |
Classified | | Derivative instruments |
| | |
Available-for-sale financial assets | | Short-term investments
Sinking fund, presented in Other assets |
| | |
Loans and receivables | | Accounts receivable and other receivables
Government reimbursement for the 1998 ice storm, presented in Other assets Receivables presented in Other assets |
| | |
Other financial liabilities | | Borrowings
Accounts payable and accrued liabilities
Dividend payable
Accrued interest
Current portion of long-term debt
Long-term debt
Accounts payable presented in Other long-term liabilities
Perpetual debt |
Financial assets and liabilities are offset when certain criteria are met. The net amount is therefore reported in the balance sheet when Hydro-Québec has a legally enforceable right to set off the recognized amounts and it intends either to settle on a net basis, or to realize the asset and settle the liability simultaneously.
Moreover, futures or forward contracts on non-financial items that can be settled on a net basis are recorded at the date of settlement if there is a probability of receipt or delivery in accordance with expected requirements.
Financial assets and liabilities held for trading are recorded at fair value at the balance sheet date. Changes in fair value are recognized in operations for the period in which they occur, except in the case of derivative instruments designated as hedges in a cash flow hedging relationship.
Available-for-sale financial assets are recorded at fair value at the balance sheet date. Changes in fair value are recorded in Other comprehensive income until they are realized, at which time they are reclassified to operations.
Loans and receivables, less any impairment losses, as well as other financial liabilities are measured at amortized cost using the effective interest method. Amortized cost includes transaction costs.
As part of its integrated business risk management, Hydro-Québec uses various financial instruments to manage its market risk, consisting of currency risk, interest rate risk and risk resulting from fluctuating aluminum and energy prices. Hydro-Québec applies cash flow or fair value hedge accounting to the eligible hedging relationships. It formally documents all relationships between hedging instruments and hedged items. This process involves associating all derivative instruments with specific assets and liabilities on the balance sheet, or with probable anticipated transactions. Hydro-Québec also measures the effectiveness of hedging relationships initially and then monthly thereafter. In addition, for hedges of anticipated transactions, it regularly assesses the probability of the occurrence of those transactions designated as hedged items.
55
Note 1 Significant Accounting Policies (continued)
In the case of a cash flow hedge, the effective portion of changes in the fair value of an instrument designated as a hedge is recognized under Other comprehensive income, while the ineffective portion is immediately recognized in operations, under the line item affected by the hedged item. Amounts included in Accumulated other comprehensive income are reclassified to operations, also under the line item affected by the hedged item, during the periods in which the change in cash flows attributable to the hedged item affects operations. If a derivative instrument no longer satisfies hedging conditions or is sold or liquidated, or if Hydro-Québec terminates its designation as a hedging item, hedge accounting ceases to be applied on a prospective basis. Previously recognized gains and losses continue to be carried forward to be recognized in operations during the same periods as the hedged item. If the hedged item ceases to exist, the gains or losses carried forward are immediately reclassified to operations.
In the case of a fair value hedge, the derivative instrument is recorded at fair value, and changes in the fair value, including those related to the ineffective portion of the hedge, are recognized in operations under the line item affected by the hedged item. Offsetting changes in the fair value of the hedged item attributable to the hedged risk are recognized as adjustments to the hedged item’s carrying amount and are offset against operations.
In addition, an embedded derivative must be separated from its host contract and recognized at fair value on the balance sheet if certain conditions are met. Hydro-Québec has opted to apply this accounting treatment to all host contracts issued, acquired or substantively amended on or after January 1, 2003.
Hydro-Québec must classify the fair value measurements of financial instruments according to a three-level hierarchy, based on the type of inputs used in making these measurements:
· Level 1: Quoted prices on active markets for identical instruments;
· Level 2: Significant inputs and value drivers that are observable on active markets; and
· Level 3: One or more significant inputs or value drivers that are not observable market data.
Cash, cash equivalents, short-term investments and derivative instruments are recognized at fair value. Fair value is the amount of the consideration that would be agreed upon in an arm’s-length transaction between knowledgeable, willing parties who are under no compulsion to act. Cash equivalents consist of investments with a maturity of three months or less from the date of acquisition. Investments with a maturity of more than three months are presented in Short-term investments.
Except for cash and measurements of exchange-traded derivative instruments, which are Level 1 measurements, fair value measurements for financial instruments are Level 2 measurements. These measurements are obtained by discounting future cash flows, which are estimated on the basis of the spot rates or the forward rates or prices (foreign exchange rates, interest rates, and aluminum or energy prices) in effect on the balance sheet date and take into account the credit risk assessment. The valuation techniques make use of observable market data.
MATERIALS, FUEL AND SUPPLIES
Inventories of materials, fuel and supplies are valued at the lower of cost and net realizable value. Cost is determined by the weighted average cost method.
PROPERTY, PLANT AND EQUIPMENT
Property, plant and equipment are carried at cost, which comprises materials, labor, other costs directly related to construction activities, and financial expenses capitalized during construction. Property, plant and equipment also include draft-design costs for projects whose technical feasibility has been demonstrated, whose profitability has been estimated, and for which Management deems that it will in all likelihood have the necessary resources for completion. The discounted value of retirement obligations related to property, plant and equipment is added to the carrying amount. Moreover, contributions from third parties are applied against the cost of the related property, plant and equipment.
Financial expenses capitalized to property, plant and equipment under construction are determined using the average cost of Hydro-Québec’s long-term debt. When the property, plant and equipment under construction relate to regulated transmission and distribution activities, such financial expenses take return on equity into account. The portion that corresponds to return on equity is included in Revenue in the consolidated operations.
56
Note 1 Significant Accounting Policies (continued)
Property, plant and equipment are depreciated over their useful life, using the straight-line method, starting in the month following the date of commissioning. The depreciation periods for the principal categories of property, plant and equipment are as follows:
Hydraulic generation | | 40 to 100 years |
Thermal generation | | 15 to 50 years |
Nuclear generation | | 15 to 50 years |
Transmission substations and lines | | 30 to 50 years |
Distribution substations and lines | | 25 to 40 years |
Other property, plant and equipment | | 3 to 50 years |
When property, plant and equipment are retired, their cost, net of accumulated depreciation and salvage value, is recognized in operations for the year.
Maintenance and repair costs are recognized in operations when incurred.
INTANGIBLE ASSETS
Intangible assets are recorded at cost. Financial expenses are capitalized over the development period.
The costs related to the Energy Efficiency Plan (EEP), and internally developed computer software and development costs are capitalized when they meet capitalization criteria.
Intangible assets with an indefinite useful life are not amortized. These assets are tested for impairment annually or more frequently if events indicate a potential impairment loss. The excess of the carrying amount over the fair value is recognized in operations for the period in which the impairment is determined.
Intangible assets with a finite useful life, namely the EEP, software and licences, development costs and patents, are amortized over their useful life according to the straight-line method over the following periods:
EEP | | 10 years |
Software and licences | | 3 to 10 years |
Development costs | | 5 years |
Patents | | 20 years |
IMPAIRMENT OF LONG-LIVED ASSETS
Hydro-Québec reviews the carrying amount of its property, plant and equipment and its amortizable intangible assets whenever events or changes in circumstances indicate that the expected undiscounted net cash flows could be lower than the carrying amount of the property and assets. An impairment loss corresponding to the amount by which the carrying amount exceeds fair value is recognized, if applicable.
INVESTMENTS
Investments in companies over which Hydro-Québec can exercise significant influence are accounted for on an equity basis. These investments are initially recognized at cost, and the carrying amount is increased or decreased by an amount equal to Hydro-Québec’s share of the changes in the investees’ net assets after the date of acquisition. Hydro-Québec’s share of the investees’ operations is recognized in net income. Dividends received from the investees are applied against the carrying amount of the investment.
EMPLOYEE FUTURE BENEFITS
Hydro-Québec offers all its employees a contributory defined-benefit pension plan based on final pay, as well as other post-retirement and post-employment benefits.
57
Note 1 Significant Accounting Policies (continued)
The cost of pension benefits and other post-retirement benefits provided in exchange for current service is calculated according to the projected benefit method prorated on years of service. It is determined using a discount rate and is based on Management’s best estimates, in particular concerning the expected return on plan assets, salary escalation, the increase in health care costs, and employees’ retirement ages. Plan assets are measured at fair value at the balance sheet date.
In order to establish the cost of benefits and its employee future benefit obligations, Hydro-Québec has adopted the following policies:
· The discount rate is based on the average rate of the interest rate curve on the measurement date of AA or AAA-rated Canadian corporate bonds and takes into account the expected cash flows associated with the accrued benefit obligations.
· Past service costs arising from plan amendments and transitional balances relating to the pension plan and post-retirement benefits as at January 1, 1999, are amortized using the straight-line method over periods not exceeding active employees’ average remaining years of service, which was 12 years as at January 1, 2011, 2010 and 2009.
· Amortization of actuarial gains or losses is recognized in operations for the year if the unamortized net actuarial gain or loss at the beginning of the year exceeds 10% of the value of the accrued benefit obligations or 10% of the market-related value of the plan assets, whichever is greater. The amortization corresponds to the excess divided by active employees’ average remaining years of service.
· The expected return on pension plan assets is based on a market-related value determined by using a five-year moving average value for equity securities and by measuring other asset classes at fair value.
ASSET RETIREMENT OBLIGATIONS
Hydro-Québec accounts for asset retirement obligations in the period in which the legal obligations with respect thereto are incurred, provided that a reasonable estimate of their fair value can be made. The corresponding costs of asset retirement are added to the carrying amount of the related long-lived asset and are amortized over its useful life. In subsequent financial years, any change due to the passage of time is recognized in operating expenses for the current year (accretion expense) and the corresponding amount is added to the carrying amount of the liability. Changes resulting from revisions to the timing or the amount of the undiscounted cash flows are recognized as an increase or decrease in the carrying amount of the liability arising from asset retirement obligations, and the related asset retirement cost is capitalized as part of the carrying amount of the related asset.
The cash flows required to settle asset retirement obligations are estimated on the basis of studies that use various assumptions concerning the methods and timing to be adopted for the retirement. Hydro-Québec periodically reviews the measurement of these obligations in light of the underlying assumptions and estimates, potential technological advances, and changes in applicable standards, laws and regulations.
AGREEMENTS WITH LOCAL COMMUNITIES
Hydro-Québec has entered into various agreements with the local communities concerned by certain capital projects. The amounts under these agreements are recognized in Long-term debt if they fall within the definition of a liability, and the offsetting item is recognized in Property, plant and equipment. The recognized amounts are determined by discounting the future cash flows related to these agreements. The discount rate used is the interest rate on Hydro-Québec bonds at the date of initial recognition.
RELATED PARTY TRANSACTIONS
In the normal course of business, Hydro-Québec enters into various business transactions, including electricity sales, with the Québec government and its agencies, as well as with other government corporations. These business transactions are measured at the exchange amount.
58
Note 2 Changes to Accounting Policies
RECENT CHANGES
2011
Assets and liabilities related to rate-regulated activities
Hydro-Québec has retrospectively reclassified the EEP as an intangible asset, and certain regulatory variance accounts as financial assets and liabilities. These items were previously reported as regulatory assets and liabilities. These changes have made it possible to group together items with similar characteristics, and Management considers that they have therefore led to a more appropriate presentation of the items in question. In 2011, they resulted in a decrease of $95 million (increase of $146 million in 2010, decrease of $116 million in 2009) in revenue and expenditure, without any impact on net income or equity. As at December 31, 2011, the changes had also resulted in a $19-million ($43 million in 2010) decrease in current regulatory assets; a $25-million ($18 million in 2010) increase in property, plant and equipment; a $974-million ($858 million in 2010) increase in intangible assets; a $231-million ($237 million in 2010) increase in other assets; and a $1,236-million ($1,114 million in 2010) decrease in long-term regulatory assets. Moreover, accounts payable and accrued liabilities had increased by $99 million ($15 million in 2010), and current and long-term regulatory liabilities had decreased by $118 million and $6 million, respectively ($58 million and $1 million in 2010).
Business combinations
On January 1, 2011, Hydro-Québec adopted the recommendations of Section 1582 of the CICA Handbook, “Business Combinations,” which superseded Section 1581, “Business Combinations.” Section 1582 establishes the principles and requirements for how the acquirer recognizes and measures in its financial statements the identifiable assets acquired, the liabilities assumed and any non-controlling interest in the acquiree. It applies prospectively to business combinations for which the acquisition date is in a fiscal year beginning on or after January 1, 2011. The adoption of these recommendations had no material impact on the consolidated financial statements.
Consolidated financial statements and non-controlling interests
On January 1, 2011, Hydro-Québec adopted the recommendations of Section 1601 of the CICA Handbook, “Consolidated Financial Statements,” and Section 1602, “Non-controlling Interests,” which superseded Section 1600, “Consolidated Financial Statements.” Section 1601 establishes standards for the preparation of consolidated financial statements. Section 1602 establishes standards for accounting for a non-controlling interest in a subsidiary in consolidated financial statements subsequent to a business combination. These sections apply to interim and annual financial statements relating to fiscal years beginning on or after January 1, 2011. The adoption of these recommendations had no material impact on the consolidated financial statements.
2010
Depreciation method for property, plant and equipment and related issues
On January 1, 2010, Hydro-Québec amended the accounting policy on the depreciation of property, plant and equipment in order to adopt the straight-line method. Property, plant and equipment were previously depreciated using the sinking fund method, at a rate of 3%. Management believes that the straight-line method of depreciation best reflects the rate at which Hydro-Québec expects to consume the future economic benefits of these assets.
Hydro-Québec has applied this change in accounting policy retrospectively with restatement of prior periods for assets related to non-regulated activities. For assets related to regulated activities, Hydro-Québec has applied the change prospectively in compliance with the U.S. Financial Accounting Standards Board’s Accounting Standards Codification (ASC) 980, “Regulated Operations,” which is the reference accounting standard for the evaluation and measurement of the effects of rate regulation. In decision D-2010-020, the Régie approved the change in the depreciation method for property, plant and equipment applied by the Transmission Provider and the Distributor.
The retrospective application of this change in accounting policy resulted in a decrease of $3,885 million in property, plant and equipment and retained earnings as at January 1, 2010 ($3,728 million as at January 1, 2009). The change in accounting policy led to an increase in depreciation expense and a decrease in property, plant and equipment of $466 million in 2010 ($157 million in 2009).
59
Note 2 Changes to Accounting Policies (continued)
Furthermore, in 2010 Hydro-Québec recognized obligations essentially related to the dismantling of thermal generating stations. These obligations were recognized retrospectively, resulting in the following changes as at January 1, 2010: a $91-million decrease in retained earnings ($84 million as at January 1, 2009), a $19-million increase in property, plant and equipment ($21 million as at January 1, 2009), a $96-million increase in asset retirement obligations ($93 million as at January 1, 2009) and a $14-million increase in other long-term liabilities ($12 million as at January 1, 2009). Their recognition also reduced net income by $7 million in 2010 ($7 million in 2009).
2009
Goodwill and intangible assets
On January 1, 2009, Hydro-Québec adopted the recommendations of Section 3064 of the Canadian Institute of Chartered Accountants (CICA) Handbook, “Goodwill and Intangible Assets,” which superseded Section 3062, “Goodwill and Other Intangible Assets,” and Section 3450, “Research and Development Costs.” Section 3064 establishes standards for the recognition, measurement, presentation and disclosure of goodwill and intangible assets. The adoption of these recommendations had no material impact on the consolidated financial statements.
Rate-regulated activities
On January 1, 2009, the temporary exemption provided for in CICA Handbook Section 1100, “Generally Accepted Accounting Principles,” which allowed the recognition and measurement of regulatory assets and liabilities, was withdrawn. Pursuant to a practice allowed by Canadian GAAP, however, Hydro-Québec has relied on ASC 980 to maintain its established accounting treatment for regulatory assets and liabilities. The withdrawal of the exemption therefore had no impact on the consolidated financial statements.
Credit risk and the fair value of financial assets and financial liabilities
On January 20, 2009, the Emerging Issues Committee (EIC) of the CICA issued Abstract of Issue Discussed EIC-173, “Credit Risk and the Fair Value of Financial Assets and Financial Liabilities.” EIC-173 clarifies that an entity’s own credit risk and the credit risk of the counterparty should be taken into account in determining the fair value of financial assets and financial liabilities, including derivative instruments. The adoption of the recommendations in this abstract had no impact on the consolidated financial statements.
Financial instruments — Disclosures
In June 2009, the CICA amended CICA Handbook Section 3862, “Financial Instruments — Disclosures.” The purpose of the amendments was to improve disclosures about fair value measurements and the liquidity risk associated with financial instruments. The information required is provided in Note 1, Significant Accounting Policies — Financial Instruments, and Note 16, Financial Instruments.
Note 3 Effects of Rate Regulation on the Consolidated Financial Statements
The following information describes the impact on the consolidated financial statements of accounting methods and practices adopted by Hydro-Québec in accordance with the Régie’s decisions with respect to regulated activities.
REGULATORY ASSETS
Costs incurred until the rescission of dual-energy Rate BT
The costs incurred until the rescission of dual-energy Rate BT were charged to a separate account and have been amortized on a straight-line basis over five years since the rescission date of April 1, 2006. These costs mainly include the deficit resulting from the variance between the supply cost recognized by the Régie and energy prices in effect, multiplied by the quantity of electricity delivered to customers at Rate BT between January 1, 2004, and March 31, 2006. Financial expenses arising from these costs were capitalized at the rate of return authorized by the Régie on the rate base until March 31, 2006. This accounting practice was authorized by the Régie in decisions D-2004-47, D-2004-170 and D-2006-34, which relate to Hydro-Québec’s power distribution activities. Were these activities not regulated, the costs would have been recognized in operations for the year in which they were incurred, and net income for 2011 would have been $7 million higher ($30 million in 2010 and $29 million in 2009).
60
Note 3 Effects of Rate Regulation on the Consolidated Financial Statements (continued)
Costs related to the de-icing system at Lévis substation
Certain costs related to the Lévis substation de-icing system, designed in the wake of the 1998 ice storm to secure the transmission lines supplying the greater Québec area, were recognized in a separate account. These costs have been depreciated using the straight-line method starting from the date of commissioning of the de-icing system, over a period corresponding to the average remaining useful life of the assets enhanced by the system. Financial expenses arising from these costs were capitalized at the rate of return authorized by the Régie on the rate base until such time as they were included in the rate base and amortization began. The Régie authorized this accounting practice in decision D-2004-175, which relates to Hydro-Québec’s power transmission activities. Were these activities not regulated, the costs would have been recognized in operations for the year in which they were incurred, and net income for 2011 would have been $1 million higher ($1 million in 2010 and 2009).
Costs related to the customer systems optimization project
Certain costs incurred for the customer systems optimization (CSO) project that were not taken into account in setting rates were recognized in a separate account and will be amortized in 2012. Financial expenses arising from these costs were capitalized at the rate of return authorized by the Régie on the rate base until such time as amortization began. This accounting practice was authorized by the Régie in decision D-2011-058, which relates to Hydro-Québec’s power distribution activities. Were these activities not regulated, the costs would have been recognized in operations for the year in which they were incurred, and net income for 2011 would have been $7 million lower ($3 million in 2010 and nil in 2009).
REGULATORY ASSETS
| | Expected years of
amortization | | 2011 | | 2010 | |
| | | | | | | |
Costs incurred until rescission of dual-energy Rate BT | | — | | — | | 7 | |
Costs related to the de-icing system at Lévis substation | | 2012–2047 | | 10 | | 11 | |
Costs related to the CSO project | | 2012 | | 10 | | 3 | |
Other | | 2012–2016 | | 19 | | 9 | |
| | | | 39 | | 30 | |
Current portion | | | | 18 | | — | |
| | | | 21 | | 30 | |
Risks and uncertainties
The risks and uncertainties related to the above regulatory assets are subject to periodic monitoring and assessment. Once Hydro-Québec considers that it is no longer likely that the net carrying amount of a regulatory asset will be taken into account in setting future rates, this amount is recognized in operations for the year in which the conclusion is reached.
OTHER REGULATORY PRACTICES
Under Régie decisions D-2002-95 and D-2003-93, the compensation granted by the Québec government for the 1998 ice storm was applied against the cost of newly constructed property, plant and equipment; it is amortized over the remaining life of the retired assets, with the exception of the portion equivalent to the unamortized cost of these assets, which is amortized over 10 years. The straight-line method is used in both cases. Were these activities not regulated, the compensation would be amortized over the useful life of the newly constructed property, plant and equipment.
In decisions D-2002-95 and D-2004-47, the Régie prescribed capitalizing financial expenses to property, plant and equipment under construction and intangible assets under development related to regulated activities, according to the authorized rates of return on the rate bases. These rates, which are set using methods approved by the Régie, take into account a component associated with the cost of the debt and a component associated with the return on equity. Were these activities not regulated, financial expenses would be capitalized using the average cost of Hydro-Québec’s long-term debt.
61
Note 3 Effects of Rate Regulation on the Consolidated Financial Statements (continued)
Under Régie decisions D-2002-95 and D-2003-93, the cost of dismantling assets that were retired and replaced, net of the salvage value, is added to the cost of newly constructed assets. Under Régie decision D-2011-039, which relates to Hydro-Québec’s power transmission activities, the costs of restoring sites associated with replaced assets are also added to the cost of newly constructed assets, as of January 1, 2011. Were these activities not regulated, the related costs would be charged to operations in the year in which they are incurred.
Under Régie decisions D-2006-76 and D-2006-76R, contributions received for relocation or modification projects relating to certain transmission grid assets are recognized in a separate account and applied against property, plant and equipment. These contributions are amortized over the average useful life of assets for each project, using the straight-line method. Were these activities not regulated, the contributions would be amortized over the useful life of each fixed asset concerned.
Under Régie decisions D-2002-25, D-2002-288, D-2003-93 and D-2006-56, advertising and promotional costs, entertainment expenses, training costs and other EEP general expenses are recognized in the costs related to this intangible asset and amortized over 10 years on a straight-line basis. Were these activities not regulated, the costs and expenses would be recognized in operations for the year in which they are incurred.
Finally, the legal and regulatory context in which Hydro-Québec operates gives it the right to recover from its customers or the obligation to reimburse to them, as the case may be, the amounts corresponding to any variance between the actual amount of certain specific items and the amount provided in rate cases for these items. These items therefore give rise to financial assets or liabilities. They include the supply of electricity in excess of the heritage pool (decisions D-2005-34, D-2005-132, D-2006-34, D-2007-12 and D-2008-024), fuel purchases (decision D-2009-016), native-load transmission service (decisions D-2003-93, D-2006-34, D-2007-12 and D-2008-024), climate conditions (decisions D-2006-34 and D-2009-016), point-to-point transmission service (decisions D-2007-08 and D-2008-019) and pension costs (decisions D-2011-028 and D-2011-039).
Note 4 Revenue
| | 2011 | | 2010 | | 2009 | |
| | | | | | | |
Electricity sales | | 12,119 | | 12,019 | | 12,055 | |
Other | | 273 | | 465 | | 162 | |
| | 12,392 | | 12,484 | | 12,217 | |
Note 5 Depreciation and Amortization
| | 2011 | | 2010 | | 2009 | |
| | | | | | | |
Property, plant and equipment | | 2,391 | | 2,265 | | 1,843 | |
Intangible assets | | 213 | | 194 | | 178 | |
Regulatory assets | | 9 | | 83 | | 250 | |
Write-offs | | 10 | | 23 | | 15 | |
| | 2,623 | | 2,565 | | 2,286 | |
Note 6 Taxes
| | 2011 | | 2010 | | 2009 | |
| | | | | | | |
Water-power royalties (a) | | 598 | | 561 | | 573 | |
Public utilities tax (b) | | 246 | | 262 | | 188 | |
Capital tax (c) | | — | | 51 | | 132 | |
Municipal, school and other taxes | | 22 | | 35 | | 35 | |
| | 866 | | 909 | | 928 | |
(a) Water-power royalties payable to the Québec government totaled $593 million in 2011 ($557 million in 2010 and $567 million in 2009), including a balance due of $83 million as at December 31, 2011 (nil as at December 31, 2010 and $21 million as at December 31, 2009).
(b) The public utilities tax is paid to the Québec government.
(c) Capital tax, which was paid to the Québec government, was abolished in 2011.
62
Note 7 Financial Expenses
| | 2011 | | 2010 | | 2009 | |
Interest | | | | | | | |
Interest on debt securities | | 2,483 | | 2,495 | | 2,411 | |
Amortization of premiums, discounts and issue expenses related to debt securities | | 148 | | 127 | | 117 | |
| | 2,631 | | 2,622 | | 2,528 | |
| | | | | | | |
Net exchange (gain) loss | | (5 | ) | 7 | | 40 | |
Guarantee fees related to debt securities (a) | | 188 | | 183 | | 174 | |
| | 183 | | 190 | | 214 | |
Less | | | | | | | |
Capitalized financial expenses | | 300 | | 276 | | 318 | |
Net investment income | | 17 | | 10 | | 26 | |
| | 317 | | 286 | | 344 | |
| | 2,497 | | 2,526 | | 2,398 | |
(a) Guarantee fees related to debt securities are paid to the Québec government.
Note 8 Property, Plant and Equipment
2011 |
| | In service | | Accumulated
depreciation | | Under
construction | | Net carrying
amount | |
Generation | | | | | | | | | |
Hydraulic | | 39,723 | | 14,205 | | 2,857 | | 28,375 | |
Thermal | | 782 | | 721 | | — | | 61 | |
Nuclear | | 1,921 | | 1,550 | | 852 | | 1,223 | |
Other | | 764 | | 441 | | 15 | | 338 | |
| | 43,190 | | 16,917 | | 3,724 | | 29,997 | |
Transmission | | | | | | | | | |
Substations and lines | | 24,478 | | 8,729 | | 806 | | 16,555 | |
Other | | 2,216 | | 1,306 | | 104 | | 1,014 | |
| | 26,694 | | 10,035 | | 910 | | 17,569 | |
Distribution | | | | | | | | | |
Substations and lines | | 13,082 | | 5,605 | | 375 | | 7,852 | |
Other | | 2,001 | | 1,113 | | 120 | | 1,008 | |
| | 15,083 | | 6,718 | | 495 | | 8,860 | |
Construction | | 27 | | 16 | | 1 | | 12 | |
Corporate and Other Activities | | 1,117 | | 712 | | 58 | | 463 | |
| | 86,111 | | 34,398 | | 5,188 | | 56,901 | |
2010 |
| | In service | | Accumulated
depreciation | | Under
construction | | Net carrying
amount | |
Generation | | | | | | | | | |
Hydraulic | | 37,990 | | 13,549 | | 3,107 | | 27,548 | |
Thermal | | 797 | | 632 | | — | | 165 | |
Nuclear | | 1,907 | | 1,539 | | 690 | | 1,058 | |
Other | | 757 | | 432 | | 20 | | 345 | |
| | 41,451 | | 16,152 | | 3,817 | | 29,116 | |
Transmission | | | | | | | | | |
Substations and lines | | 23,538 | | 8,093 | | 791 | | 16,236 | |
Other | | 2,188 | | 1,272 | | 66 | | 982 | |
| | 25,726 | | 9,365 | | 857 | | 17,218 | |
Distribution | | | | | | | | | |
Substations and lines | | 12,663 | | 5,217 | | 334 | | 7,780 | |
Other | | 1,927 | | 1,072 | | 84 | | 939 | |
| | 14,590 | | 6,289 | | 418 | | 8,719 | |
Construction | | 28 | | 17 | | 3 | | 14 | |
Corporate and Other Activities | | 1,136 | | 720 | | 54 | | 470 | |
| | 82,931 | | 32,543 | | 5,149 | | 55,537 | |
63
Note 9 Intangible Assets
| | | | | | 2011 | | | | | | 2010 | |
| | Cost | | Accumulated
amortization | | Net carrying
amount | | Cost | | Accumulated
amortization | | Net carrying
amount | |
Intangible assets | | | | | | | | | | | | | |
Subject to amortization | | | | | | | | | | | | | |
EEP | | 1,403 | | 429 | | 974 | | 1,183 | | 325 | | 858 | |
Software and licences | | 1,392 | | 869 | | 523 | | 1,385 | | 841 | | 544 | |
Development costs | | 41 | | 23 | | 18 | | 45 | | 23 | | 22 | |
Patents | | 22 | | 7 | | 15 | | 11 | | 5 | | 6 | |
| | 2,858 | | 1,328 | | 1,530 | | 2,624 | | 1,194 | | 1,430 | |
Not subject to amortization | | | | | | | | | | | | | |
Servitudes | | | | | | 375 | | | | | | 371 | |
Water-power rights | | | | | | 282 | | | | | | 282 | |
| | | | | | 657 | | | | | | 653 | |
| | | | | | 2,187 | | | | | | 2,083 | |
The additions of internally generated intangible assets subject to amortization totaled $308 million in 2011 ($301 million in 2010).
Note 10 Investments
| | 2011 | | 2010 | |
At equity | | | | | |
Churchill Falls (Labrador) Corporation Limited | | 106 | | 97 | |
CITEQ inc. | | (5 | ) | (5 | ) |
| | 101 | | 92 | |
Other | | 23 | | 22 | |
| | 124 | | 114 | |
Note 11 Other Assets
| | Note | | 2011 | | 2010 | |
| | | | | | | |
Accrued benefit assets | | 22 | | 2,887 | | 2,361 | |
Government reimbursement for the 1998 ice storm (a) | | | | 67 | | 74 | |
Receivables (b) | | | | 238 | | 243 | |
Sinking fund | | | | 198 | | — | |
Other | | | | 100 | | 88 | |
| | | | 3,490 | | 2,766 | |
(a) Payable in quarterly installments of $6 million until January 15, 2010, followed by quarterly installments of $3 million between April 15, 2010, and October 15, 2019, and a final installment of $0.4 million on January 15, 2020. These installments include interest at an annual rate of 7.2%. The current portion, presented under Accounts receivable and other receivables, totaled $8 million as at December 31, 2011 ($8 million as at December 31, 2010). The fair value of this financial asset, including the current portion, was $91 million as at December 31, 2011 ($96 million as at December 31, 2010).
(b) Including revenue variances of $231 million related to climate conditions ($212 million as at December 31, 2010), for which financial expenses were capitalized at the rate of return authorized by the Régie to ensure that their carrying amount agrees with their fair value. These amounts are recovered over a five-year period.
64
Note 12 Long-Term Debt
Long-term debt is mainly composed of bonds, medium-term notes and other debts, including liabilities under agreements entered into with local communities. The following table presents a breakdown of the debt at amortized cost, including the current portion, by currency at the time of issue and at the time of repayment. Swaps related to long-term debt were taken into account in determining the percentages of debt by currency at the time of repayment.
| | | | | | | | 2011 | | | | | | | | 2010 | |
| | | | | | At time | | At time of | | | | | | At time | | At time of | |
| | | | | | of issue | | repayment | | | | | | of issue | | repayment | |
| | In | | At closing | | | | | | In | | At closing | | | | | |
| | Canadian | | exchange | | | | | | Canadian | | exchange | | | | | |
| | dollars | | rates as at | | | | | | dollars | | rates as at | | | | | |
| | and other | | the balance | | | | | | and other | | the balance | | | | | |
| | currencies | | sheet date | | % | | % | | currencies | | sheet date | | % | | % | |
Hydro-Québec’s debt | | | | | | | | | | | | | | | | | |
Canadian dollars (a) | | 32,755 | | 32,755 | | 79 | | 98 | | 29,869 | | 29,869 | | 78 | | 96 | |
U.S. dollars | | 8,021 | | 8,148 | | 20 | | 2 | (b) | 8,047 | | 7,989 | | 21 | | 4 | (b) |
Other currencies | | | | | | | | | | | | | | | | | |
Euros | | 60 | | 79 | | — | | — | | 60 | | 80 | | — | | — | |
Pounds sterling | | 199 | | 314 | | 1 | | — | | 239 | | 370 | | 1 | | — | |
Yen | | 2,000 | | 26 | | — | | — | | 2,002 | | 24 | | — | | — | |
| | | | 41,322 | | | | | | | | 38,332 | | | | | |
Subsidiaries’ debt | | | | | | | | | | | | | | | | | |
U.S. dollars | | 17 | | 17 | | — | | — | | 20 | | 20 | | — | | — | |
| | | | 41,339 | | 100 | | 100 | | | | 38,352 | | 100 | | 100 | |
Plus | | | | | | | | | | | | | | | | | |
Adjustment for fair-value hedged risk | | | | 430 | | | | | | | | 20 | | | | | |
| | | | 41,769 | | | | | | | | 38,372 | | | | | |
Less | | | | | | | | | | | | | | | | | |
Current portion | | | | 1,025 | | | | | | | | 1,933 | | | | | |
| | | | 40,744 | | | | | | | | 36,439 | | | | | |
(a) Including non-interest-bearing debts other than bonds and medium-term notes for a discounted amount of $939 million as at December 31, 2011 ($781 million as at December 31, 2010).
(b) Of this amount, 100% was used to hedge sales in U.S. dollars as at December 31, 2011 (99.4% as at December 31, 2010).
INTEREST RATES
The following table shows interest rates, which take into account stated interest rates on bonds and medium-term notes, including premiums, discounts and issuance costs, as well as the effect of swaps related to long-term debt:
% | | | | | | | | 2011 | | 2010 | |
Maturity | | Canadian
dollars | | U.S.
dollars | | Other
currencies | | Weighted
average | | Weighted
average | |
| | | | | | | | | | | |
1 to 5 years | | 2.01 | | 3.66 | | 9.58 | | 3.34 | | 6.21 | |
6 to 10 years | | 10.49 | | 9.45 | | 1.86 | | 10.22 | | 10.02 | |
11 to 15 years | | 8.96 | | 8.40 | | — | | 8.60 | | 9.17 | |
16 to 20 years | | 3.72 | | 9.63 | | — | | 7.64 | | 9.41 | |
21 to 25 years | | 5.61 | | — | | — | | 5.61 | | 5.30 | |
26 to 30 years | | 5.11 | | — | | — | | 5.11 | | 5.16 | |
31 to 35 years | | 4.89 | | — | | — | | 4.89 | | 4.93 | |
36 to 40 years | | 4.55 | | — | | — | | 4.55 | | 4.79 | |
41 to 45 years | | — | | — | | — | | — | | — | |
46 to 50 years | | 6.53 | | — | | — | | 6.53 | | 6.62 | |
51 to 55 years | | — | | — | | — | | — | | — | |
| | | | | | | | | | | |
Weighted average | | 5.29 | | 8.69 | | 9.35 | | 5.70 | | 6.37 | |
As at December 31, 2011, the floating-rate portion of long-term debt amounted to 6.1%, or 6.8% including perpetual debt (10.6%, or 11.3% including perpetual debt, as at December 31, 2010).
65
Note 12 Long-Term Debt (continued)
FAIR VALUE
As at December 31, 2011, the fair value of the long-term debt, including the current portion, amounted to $57,622 million ($49,141 million as at December 31, 2010). Including swaps and forward contracts related to long-term debt, it totaled $57,883 million ($50,097 million as at December 31, 2010). Fair value is obtained by discounting future cash flows, based on forward interest rates derived from interest rates at the close of business on the balance sheet date for similar instruments traded on capital markets. Changes in fair value reflect sensitivity to capital market interest rates. However, Management’s primary intention is to hold these debt securities until maturity.
CREDIT FACILITY AND LINES OF CREDIT
Hydro-Québec has an undrawn credit facility of US$2,000 million ($2,034 million), composed of two tranches, one of US$360 million ($366 million) and the other of US$1,640 million ($1,668 million), including a US$750-million ($763 million) swing loan, which will expire in 2012 and 2013. Any debt securities will bear interest at a rate based on the London Interbank Offered Rate (LIBOR), except for the swing loan, which is at the U.S. base rate. Hydro-Québec also has access to undrawn lines of credit totaling $396 million, which are renewed automatically in the absence of notice to the contrary and bear interest at the prime rate.
Note 13 Asset Retirement Obligations
Liabilities arising from asset retirement obligations relate to the costs to be incurred in dismantling Gentilly-2 nuclear generating station at the end of its useful life, the removal of spent nuclear fuel resulting from its operation, and the dismantling of thermal generating stations and certain fuel tanks and transmission substations. The costs related to dismantling Gentilly-2 generating station are based on the assumption that Hydro-Québec will in fact refurbish it.
Hydro-Québec has also identified asset retirement obligations relating to transmission activities for which no liability has been recognized since it expects to use these assets for an undetermined period. These relate to property, plant and equipment for which Hydro-Québec does not have sufficient information to accurately establish a schedule for the obligations. A liability resulting from these asset retirement obligations will be recognized in the period in which there is sufficient information to establish such a schedule.
The aggregate carrying amount of the asset retirement obligations is as follows:
2011 |
| | Dismantling of nuclear
generating station (a) | | Removal of spent
nuclear fuel (a) | | Dismantling of
other assets | | Total | |
Balance, beginning of year | | 197 | | 187 | | 120 | | 504 | |
Liabilities incurred | | — | | 2 | | 19 | | 21 | |
Accretion expense | | 11 | | 17 | | 6 | | 34 | |
Liabilities settled | | — | | (1 | ) | (3 | ) | (4 | ) |
Revision of estimated cash flows and expected timing of payments | | — | | (4 | ) | (11 | ) | (15 | ) |
Balance, end of year | | 208 | | 201 | | 131 | | 540 | |
2010 |
| | Dismantling of nuclear
generating station (a) | | Removal of spent
nuclear fuel (a) | | Dismantling of
other assets | | Total | |
Balance, beginning of year | | 185 | | 170 | | 112 | | 467 | |
Liabilities incurred | | — | | 2 | | 1 | | 3 | |
Accretion expense | | 12 | | 16 | | 5 | | 33 | |
Liabilities settled | | — | | (1 | ) | (1 | ) | (2 | ) |
Revision of estimated cash flows and expected timing of payments | | — | | — | | 3 | | 3 | |
Balance, end of year | | 197 | | 187 | | 120 | | 504 | |
(a) The Québec government has provided an irrevocable financial guarantee of up to $685 million to the Canadian Nuclear Safety Commission (CNSC) for the performance of Hydro-Québec’s obligations with regard to the cost of dismantling Gentilly-2 nuclear generating station at the end of its useful life and the removal of spent nuclear fuel. This financial guarantee is required under the CNSC licence issued to Hydro-Québec to operate the generating station until June 30, 2016.
66
Note 13 Asset Retirement Obligations (continued)
The carrying amount of the asset retirement obligations is based on the following key assumptions:
| | Dismantling of nuclear
generating station (a) | | Removal of spent
nuclear fuel | | Dismantling of
other assets | |
Estimated cash flows (in constant dollars) required to settle the obligations (b) | | | | | | | |
As at December 31, 2011 | | 951 | | 624 | | 173 | |
As at December 31, 2010 | | 932 | | 667 | | 170 | |
Expected timing of payment of the cash flows required to settle the obligations | | | | | | | |
As at December 31, 2011 | | Between 2040 and 2071 | | Between 2012 and 2164 | | Between 2012 and 2092 | |
As at December 31, 2010 | | Between 2040 and 2071 | | Between 2011 and 2159 | | Between 2011 and 2092 | |
Credit quality—adjusted, risk-free rate (%) | | | | | | | |
Initial recognition of obligations | | 6.4 | | 6.4 | | Between 1.0 and 6.4 | |
Subsequent recognition of obligations | | Between 5.0 and 5.5 | | 5.5 and 5.7 | | Between 1.3 and 6.1 | |
(a) The abandonment of the refurbishment project for the nuclear generating station would result in an increase on the order of $320 million in related obligations, due to the change in timing of the payment of the related cash flows (assuming all the other parameters of the calculation remained the same).
(b) Inflation rates varying between 1.8% and 3.7% were used to determine the asset retirement obligations.
HYDRO-QUÉBEC NUCLEAR FUEL WASTE MANAGEMENT TRUST FUND
On November 15, 2002, the Nuclear Fuel Waste Act came into force. Under this Act, Canadian nuclear energy corporations were required to set up a waste management organization whose role would be to propose a long-term approach for managing spent nuclear fuel to the Government of Canada. Each nuclear energy corporation was also required to set up a trust fund to finance the costs of long-term management of its nuclear fuel waste. In November 2005, the Nuclear Waste Management Organization (NWMO) filed its report with the Government of Canada and recommended an approach which was adopted in June 2007.
In October 2007, the members of the NWMO ratified an agreement that sets forth a formula for financing the costs of long-term nuclear fuel waste management. This formula, approved by the Canadian Minister of Natural Resources in April 2009, is used to determine each member’s share for the coming years, based on the number of spent nuclear fuel bundles produced at a given date. It also takes into account the date on which each member plans to start shipping spent nuclear fuel bundles to the future national repository site.
The amounts deposited in the trust funds can only be used to finance the application of the approach adopted by the Government of Canada. As at December 31, 2011, the investments held in the Hydro-Québec trust fund were composed of Hydro-Québec securities, the fair value of which totaled $99 million ($77 million as at December 31, 2010).
Hydro-Québec’s nuclear fuel waste management trust fund is considered a variable interest entity of which Hydro-Québec is the primary beneficiary.
Note 14 Other Long-Term Liabilities
| | Note | | 2011 | | 2010 | |
| | | | | | | |
Accrued benefit liabilities | | 22 | | 789 | | 761 | |
Accounts payable | | | | 94 | | 96 | |
| | | | 883 | | 857 | |
67
Note 15 Perpetual Debt
Perpetual notes in the amount of $281 million (US$276 million) as at December 31, 2011, and $288 million (US$289 million) as at December 31, 2010, bear interest at LIBOR, plus 0.0625%, as determined semiannually. The notes are redeemable at Hydro-Québec’s option. In 2011, a portion amounting to $13 million was repurchased on the secondary market and then canceled. No portion was redeemed in 2010. Various derivative instruments recorded at fair value are used to mitigate the currency risk associated with this debt.
As at December 31, 2011 and 2010, the rate applicable to the perpetual notes was 0.6%. As at December 31, 2011, the fair value of these notes was $209 million ($263 million as at December 31, 2010). Fair value is obtained by discounting future cash flows, based on forward interest rates derived from interest rates at the close of business on the balance sheet date for similar instruments traded on capital markets.
Note 16 Financial Instruments
In the course of its operations, Hydro-Québec carries out transactions that expose it to certain financial risks, such as market, liquidity and credit risk. Exposure to such risks and the impact on operating results are significantly reduced through careful monitoring and implementation of strategies that include the use of derivative instruments.
MARKET RISK
Market risk is the risk that the fair value or future cash flows of a financial instrument will fluctuate as a result of changes in market prices. Hydro-Québec is exposed to three main types of market risk: currency risk, interest rate risk and risk associated with aluminum and energy prices. Active integrated management of these three types of risk aims to limit their impact on operating results through mitigation measures so that exposure to each risk is reduced to an acceptable level.
MANAGEMENT OF LONG-TERM RISK
Management of risk associated with sales in U.S. dollars
Currency risk — Hydro-Québec uses currency swaps and a portion of its U.S. dollar—denominated debt to manage currency risk associated with probable U.S.-dollar sales, designating them as cash flow hedges. The impact of these hedging transactions on operating results is recognized in Revenue.
Management of risk associated with debt
Currency risk and interest rate risk — Hydro-Québec uses currency swaps to manage the currency risk associated with long-term debt and perpetual debt, as well as forward contracts and interest-rate swaps to modify long-term exposure to interest rate risk. When designated as hedging items, these derivative instruments are recognized as cash flow hedges or fair value hedges, depending on the risk hedged. The impact on operating results of foreign currency hedging transactions and those associated with debt interest rates is recognized in Financial expenses.
The following table shows the notional amounts of swaps and forward contracts used to manage risk associated with U.S.-dollar sales and the debt, expressed in Canadian dollars and foreign currencies:
| | | | | | | | | | 2011 (a) | | 2010 (a) | |
Maturity | | 1 to 5 years | | 6 to 10 years | | 11 to 15 years | | 16 to 20 years | | Total | | Total | |
Swaps | | | | | | | | | | | | | |
Canadian dollars | | 502 | | (1,044 | ) | (3,169 | ) | (2,448 | ) | (6,159 | ) | (6,845 | ) |
U.S. dollars | | 139 | | 960 | | 2,700 | | 2,070 | | 5,869 | | 6,302 | |
Other currencies | | | | | | | | | | | | | |
Euros | | 61 | | — | | — | | — | | 61 | | 61 | |
Pounds sterling | | 200 | | — | | — | | — | | 200 | | 240 | |
Yen | | 1,000 | | 1,000 | | — | | — | | 2,000 | | 2,000 | |
| | | | | | | | | | | | | |
Forward contracts | | | | | | | | | | | | | |
U.S. dollars | | 1,279 | | — | | — | | — | | 1,279 | | 290 | |
(a) Figures in parentheses represent amounts to be paid.
68
Note 16 Financial Instruments (continued)
The following table shows the fair value of swaps and forward contracts used to manage risk associated with U.S.-dollar sales and the debt, expressed in Canadian dollars:
| | 2011 | | 2010 | |
| | | | | |
Instruments designated as cash flow hedges for U.S.-dollar sales (a) | | 212 | | 213 | |
Instruments designated as cash flow hedges for debt | | (1,817 | ) | (1,928 | ) |
Instruments designated as fair value hedges for debt | | 489 | | (58 | ) |
| | (1,116 | ) | (1,773 | ) |
Instruments not designated as hedges (b) | | 1,263 | | 1,221 | |
| | 147 | | (552 | ) |
(a) A portion of the long-term debt, with a nominal amount of US$626 million as at December 31, 2011 (US$1,403 million as at December 31, 2010), was also designated as a cash flow hedge for U.S.-dollar sales.
(b) Transactions carried out as part of Hydro-Québec’s risk management, including $1,067 million in consideration of amounts received or disbursed with respect to credit risk mitigation agreements in 2011 ($1,030 million in 2010).
MANAGEMENT OF SHORT-TERM RISK
Currency risk — Hydro-Québec uses forward contracts to manage its foreign currency risk exposure over the short term. When designated as hedging items, these derivative instruments are recognized as cash flow hedges. The impact of currency risk hedging transactions on operating results is recognized in the line item affected by the hedged item, namely Revenue, Electricity and fuel purchases, or Financial expenses. The nominal amount of open positions as at December 31, 2011, was US$787 million in sales contracts (US$78 million as at December 31, 2010).
Interest rate risk — Hydro-Québec uses interest rate swaps and forward rate agreements to manage short-term interest rate risk. When designated as hedging items, these derivative instruments are recognized as cash flow hedges. The impact on operating results of transactions to hedge short-term interest rate risk is recognized in Financial expenses.
Price risk — Hydro-Québec uses mainly swaps and commodity futures to manage risk resulting from fluctuations in aluminum and energy prices. When designated as hedging items, these derivative instruments are recognized as cash flow hedges. The impact on operating results of transactions to hedge the risk of variability in aluminum and energy prices is recognized in the line item affected by the hedged item, namely Revenue or Electricity and fuel purchases. To hedge exposure to variability in aluminum and energy prices, Hydro-Québec has traded derivative instruments for which open positions as at December 31, 2011, totaled 99,900 tonnes of aluminum (158,300 tonnes as at December 31, 2010), as well as electricity swaps for which open positions as at December 31, 2011, were 10.8 TWh (7.5 TWh as at December 31, 2010). As at December 31, 2011, there were no open positions for natural gas futures (4.0 million MBtu as at December 31, 2010).
The following table presents the fair value of derivative instruments used to manage short-term financial risk, depending on whether or not they are designated as hedges:
| | 2011 | | 2010 | |
| | | | | |
Instruments designated as cash flow hedges | | 133 | | (33 | ) |
Instruments not designated as hedges | | (4 | ) | 4 | |
| | 129 | (a) | (29 | )(a) |
(a) Of which $3 million ($4 million in 2010) was equal to the aggregate of financial instruments measured on the basis of quoted market prices (Level 1) and $126 million [$(33) million in 2010] to instruments measured through techniques based on observable market inputs (Level 2).
69
Note 16 Financial Instruments (continued)
EFFECT OF HEDGES
Effect of hedges on operating results
Effect of cash flow hedges
As at December 31, 2011, the net loss related to the ineffectiveness of cash flow hedges recognized in operations totaled $3 million ($25 million as at December 31, 2010).
As at December 31, 2011, Hydro-Québec estimated at $192 million the amount of net gains presented in Accumulated other comprehensive income that would be reclassified to operations in the next 12 months ($261 million as at December 31, 2010).
In 2011, Hydro-Québec reclassified a net loss of $10 million from Accumulated other comprehensive income to operations (no amount reclassified in 2010) as a result of the discontinuance of cash flow hedges.
As at December 31, 2011, the maximum period during which Hydro-Québec hedged its exposure to the variability of cash flows related to anticipated transactions was five years (six years as at December 31, 2010).
Effect of fair value hedges
As at December 31, 2011, the net gain related to the ineffectiveness of fair value hedges recognized in operations totaled $9 million (net loss of $10 million as at December 31, 2010).
Effect of revaluation of derivative instruments not designated as hedges
As at December 31, 2011, the net gain recognized in operations as a result of the revaluation, at fair value, of derivative instruments that had not been accounted for using hedge accounting totaled $71 million ($10 million as at December 31, 2010). These instruments are essentially related to risk management transactions.
Sensitivity analyses
The risks associated with variability in foreign exchange rates, interest rates, and aluminum and energy prices are the subject of integrated management aimed at limiting the impact of such risks on operating results. Most of the derivative instruments traded are designated as cash flow hedges or fair value hedges and therefore reduce the volatility of operating results, except for the ineffective portion of the hedges, which is insignificant. Derivative instruments which are not designated as hedges, but which nonetheless serve to hedge at-risk opposite positions, also reduce the volatility in operating results. The sensitivity of operating results is thus limited to net exposure to unhedged risks.
As at December 31, 2011, had the exchange rate ($C/$US) been 5% higher or lower, net income would have been $8 million higher or lower, respectively ($7 million as at December 31, 2010), while Other comprehensive income would have been $136 million higher or lower, respectively ($71 million as at December 31, 2010). The analysis is based on financial assets and liabilities denominated in U.S. dollars, including a cash amount of US$124 million (US$53 million as at December 31, 2010). It also takes into account the impact of hedged sales in U.S. dollars.
In 2011, had interest rates been 50 basis points higher or lower, net income would have been $11 million higher or $13 million lower, respectively ($12 million lower or higher, respectively, in 2010), while Other comprehensive income would have been $258 million higher or $269 million lower ($233 million higher or $179 million lower in 2010).
In 2011, had the price of aluminum been 5% higher or lower, net income would have been $2 million higher or lower, respectively ($3 million in 2010), taking into account the impact of hedged sales, and Other comprehensive income would have been $10 million lower or higher, respectively ($26 million in 2010).
70
Note 16 Financial Instruments (continued)
LIQUIDITY RISK
Liquidity risk is the risk that Hydro-Québec will have difficulty meeting commitments related to its financial liabilities.
Hydro-Québec’s exposure is reduced by a large volume of cash flows from operations, a diversified portfolio of highly liquid or readily convertible instruments traded with high-quality counterparties, preauthorized sources of financing, the quality of Hydro-Québec’s signature on financial markets, diversified sources of financing and its management of the proportions of floating-rate debt and debt repayable in foreign currency.
Moreover, as at December 31, 2011, $39,643 million in long-term debt, perpetual debt and borrowings was guaranteed by the Québec government ($36,932 million as at December 31, 2010).
Maturities of financial liabilities are presented in the following table. The amounts reported are contractual undiscounted cash flows, representing payments of principal and interest for financial liabilities as at December 31, 2011.
Maturity | | Borrowings (a) | | Accounts
payable and
accrued
liabilities | | Dividend
payable | | Long-term
debt | | Derivative
instruments (b) | |
| | | | | | | | | | | |
2012 | | 52 | | 1,687 | | 1,958 | | 3,248 | (c) | 427 | |
2013 | | — | | 21 | | — | | 3,076 | | 415 | |
2014 | | — | | 15 | | — | | 4,336 | | 154 | |
2015 | | — | | 25 | | — | | 4,591 | | 268 | |
2016 | | — | | — | | — | | 3,676 | | 129 | |
1 to 5 years | | 52 | | 1,748 | | 1,958 | | 18,927 | | 1,393 | |
6 to 10 years | | — | | — | | — | | 15,722 | | 567 | |
11 to 15 years | | — | | — | | — | | 12,153 | (c) | 724 | |
16 to 20 years | | — | | — | | — | | 9,806 | | 460 | |
21 to 25 years | | — | | — | | — | | 10,359 | | — | |
26 to 30 years | | — | | — | | — | | 8,125 | | — | |
31 to 35 years | | — | | — | | — | | 8,730 | | — | |
36 to 40 years | | — | | — | | — | | 7,552 | | — | |
41 to 45 years | | — | | — | | — | | 1,656 | | — | |
46 to 50 years | | — | | — | | — | | 1,462 | | — | |
51 to 55 years | | — | | — | | — | | 185 | | — | |
56 years and over | | — | | — | | — | | 3,056 | | — | |
Total | | 52 | | 1,748 | | 1,958 | | 97,733 | | 3,144 | |
Carrying amount | | 52 | (d) | 1,748 | (d),(e),(f) | 1,958 | (d) | 41,769 | (g) | 2,359 | |
(a) As at December 31, 2011, the weighted average interest rate on interest-bearing borrowings was 1.51% (0.75% as at December 31, 2010).
(b) Agreements entered into with certain counterparties to limit the market value of these financial instruments could result in cash receipts or payments at dates different from the initially scheduled maturity.
(c) Certain debts carry sinking fund requirements.
(d) Because of their short-term maturities, the carrying amount of these financial liabilities approximates their fair value.
(e) Including liabilities of $99 million related to variances between the forecasted and actual amounts of certain revenue and expenditure items ($15 million as at December 31, 2010), which are classified in Accounts payable and accrued liabilities.
(f) Of this amount, $1,687 million is recorded in Accounts payable and accrued liabilities and $61 million in Other long-term liabilities.
(g) Including the current portion.
Contractual maturities of perpetual debt, whose terms and conditions are described in Note 15, Perpetual Debt, result in biennial interest flows.
71
Note 16 Financial Instruments (continued)
CREDIT RISK
Credit risk is the risk that one party to a financial asset will fail to meet its obligations.
Hydro-Québec is exposed to credit risk related to cash and cash equivalents, short-term investments and derivative instruments traded with financial institutions. It is also exposed to credit risk related to accounts receivable and other receivables arising primarily from its day-to-day energy sales in and outside Québec. Credit risk is limited to the carrying amount presented under assets on the balance sheet, which approximates fair value.
Cash and cash equivalents, short-term investments and derivative instruments
In order to reduce its credit risk exposure, Hydro-Québec deals with Canadian and international issuers and financial institutions with high credit ratings. In addition, it applies policies to limit risk concentration as well as various monitoring programs and sets credit limits for each counterparty. Through prior agreements, it can also limit the market value of the main derivative instrument portfolios. Any variation in market value beyond the agreed-upon limit results in a cash receipt or payment. As at December 31, 2011, substantially all counterparties dealing with Hydro-Québec had a rating over A, and none of them had defaulted on their obligations to Hydro-Québec.
Accounts receivable and other receivables
Exposure to credit risk from energy sales is limited due to Hydro-Québec’s large and diverse customer base. Management believes that Hydro-Québec is not exposed to a significant credit risk, particularly because sales in Québec are billed at rates that allow for recovery of costs based on the terms and conditions set by the Régie. Moreover, Hydro-Québec holds as collateral customer deposits totaling $72 million ($59 million as at December 31, 2010), of which $21 million ($15 million as at December 31, 2010) is recognized in Accounts payable and accrued liabilities and $51 million ($44 million as at December 31, 2010) in Other long-term liabilities.
The value of accounts receivable, by age and net of the related allowance for doubtful accounts, is presented in the following table:
| | 2011 | | 2010 | |
Accounts receivable | | | | | |
Under 30 days (a) | | 1,324 | | 1,362 | |
30 to 60 days | | 48 | | 47 | |
61 to 90 days | | 20 | | 25 | |
Over 90 days | | 138 | | 148 | |
| | 1,530 | | 1,582 | |
Other receivables (b) | | 214 | | 232 | |
Accounts receivable and other receivables (c) | | 1,744 | | 1,814 | |
(a) Including unbilled electricity deliveries, which totaled $1,062 million as at December 31, 2011 ($1,092 million as at December 31, 2010).
(b) Including a $15-million financial guarantee ($16 million in 2010) covering certain financial instruments held at year end.
(c) Including US$113 million (US$107 million in 2010) translated at the exchange rate in effect at the balance sheet date.
The allowance for doubtful accounts increased by $34 million ($29 million in 2010) to $312 million as at December 31, 2011 ($278 million as at December 31, 2010). The allowance is based on a specific percentage deemed appropriate for each account age group and customer standing.
Note 17 Acquisition of an Interest
On December 9, 2009, Hydro-Québec acquired, through its subsidiary HQ Manicouagan inc., a 60% interest in Manicouagan Power Limited Partnership, which owns and operates a hydroelectric generating station on the Rivière Manicouagan, for a consideration of $616 million, including cash, a balance of purchase price and acquisition fees. Hydro-Québec consequently acquired joint control over this limited partnership with Alcoa Ltd, which has a 40% interest, because under a contractual agreement, major operating, investment and financing decisions must be approved by all the directors. The transaction was accounted for using the purchase method.
72
Note 17 Acquisition of an Interest (continued)
The purchase price was broken down as follows:
Current assets | | 9 | |
Property, plant and equipment | | 373 | |
Water-power rights | | 282 | |
| | 664 | |
Current liabilities | | 47 | |
Long-term liabilities | | 1 | |
| | 48 | |
Purchase price | | 616 | |
The consideration was determined as follows:
Cash | | 580 | |
Balance of purchase price (payable in 2011) | | 30 | |
Acquisition fees | | 3 | |
Other | | 3 | |
| | 616 | |
Note 18 Interests in Joint Ventures
The proportionate share of the joint venture items included in the consolidated financial statements is presented in the following table. These joint ventures consist of the interests managed by Hydro-Québec Production and the Groupe — Technologie.
| | 2011 | | 2010 | | 2009 | |
Operations | | | | | | | |
Revenue | | 132 | | 115 | | 64 | |
Expenditure and financial expenses | | 75 | | 85 | | 61 | |
Net income | | 57 | | 30 | | 3 | |
Balance Sheets | | | | | | | |
Current assets | | 24 | | 11 | | | |
Long-term assets | | 654 | | 665 | | | |
Current liabilities | | 8 | | 5 | | | |
Long-term liabilities | | 18 | | 21 | | | |
Net assets | | 652 | | 650 | | | |
Cash Flows | | | | | | | |
Operating activities | | 68 | | 6 | | 3 | |
Investing activities | | (5 | ) | (4 | ) | — | |
Financing activities | | (3 | ) | (4 | ) | (10 | ) |
Net change in cash and cash equivalents | | 60 | | (2 | ) | (7 | ) |
Note 19 Equity
SHARE CAPITAL
The authorized share capital consists of 50,000,000 shares with a par value of $100 each, of which 43,741,090 shares were issued and paid up as at December 31, 2011 and 2010.
RETAINED EARNINGS
Under the Hydro-Québec Act, the dividends to be paid by Hydro-Québec are declared once a year by the Québec government, which also determines the terms and conditions of payment. For a given financial year, the dividend cannot exceed the distributable surplus, equal to 75% of net income. This calculation is based on the consolidated financial statements. However, in respect of a given financial year, no dividend may be declared in an amount that would have the effect of reducing the capitalization rate to less than 25% at the end of the year. All or a portion of the distributable surplus that has not been subject to a dividend declaration may no longer be distributed to the shareholder as a dividend.
73
Note 19 Equity (continued)
For 2011, the dividend is $1,958 million ($1,886 million for 2010).
ACCUMULATED OTHER COMPREHENSIVE INCOME
CASH FLOW HEDGES
| | 2011 | | 2010 | |
| | | | | |
Balance, beginning of year | | 227 | | 709 | |
Change for the year | | (385 | ) | (482 | ) |
Balance, end of year | | (158 | ) | 227 | |
Note 20 Capital Management
Hydro-Québec manages its capital in such a way as to meet its shareholder’s expectations, safeguard its funds at all times and sustain its growth. It fosters a management environment allowing it to enhance the long-term value of its assets and equity, ensure its financial sustainability, preserve its financing capability and safeguard its funds and securities.
In addition to equity, capital includes long-term debt, perpetual debt, borrowings and derivative instruments.
Hydro-Québec uses its capitalization rate to monitor its capital structure. It aims to maintain capitalization at no less than 25%.
CAPITALIZATION
| | 2011 | | 2010 | |
| | | | | |
Equity | | 18,834 | | 18,566 | |
Long-term debt, including current portion | | 41,769 | | 38,372 | |
Perpetual debt | | 281 | | 288 | |
Borrowings | | 52 | | 18 | |
Derivative instruments | | (276 | ) | 581 | |
Total | | 60,660 | | 57,825 | |
Capitalization rate (%) (a) | | 31.0 | | 32.1 | |
(a) Equity divided by the sum of equity, long-term debt (including current portion), perpetual debt, borrowings and derivative instrument liabilities, less derivative instrument assets.
In 2011, Hydro-Québec’s capital management objectives were unchanged from 2010.
Note 21 Supplementary Cash Flow Information
| | 2011 | | 2010 | | 2009 | |
Change in non-cash working capital items | | | | | | | |
Accounts receivable and other receivables | | 62 | | 141 | | (6 | ) |
Materials, fuel and supplies | | 78 | | 15 | | (51 | ) |
Accounts payable and accrued liabilities | | 109 | | 8 | | 79 | |
Accrued interest | | (79 | ) | (11 | ) | (25 | ) |
| | 170 | | 153 | | (3 | ) |
Investing activities not affecting cash | | | | | | | |
Increase in property, plant and equipment and intangible assets | | 239 | | 115 | | 165 | |
| | | | | | | |
Interest paid | | 2,180 | | 2,149 | | 2,102 | |
74
Note 22 Employee Future Benefits
Hydro-Québec’s pension plan (the “Pension Plan”) is a fully funded contributory plan that ensures pension benefits based on the number of years of service and an average of the best five years of earnings. These benefits are indexed annually based on a rate which is the greater of the inflation rate, up to a maximum of 2%, and the inflation rate less 3%.
Hydro-Québec also offers other post-retirement benefits as well as post-employment benefits. Post-retirement benefits are provided by group life, medical and hospitalization insurance plans, which are contributory plans with contributions adjusted annually. Post-employment benefits are under non-contributory salary insurance plans, which pay short- and long-term disability benefits. Most of these plans are not funded, with the exception of the long-term disability salary insurance plan, which is fully funded, and the supplementary group life insurance plan, which is partially funded.
All Hydro-Québec’s plans are defined benefit plans. The accrued benefit obligations of these plans, valued by independent actuaries, and their assets, at fair value, are valued as at December 31 of each year. The most recent actuarial valuation of the Pension Plan for funding purposes was as at December 31, 2010, at which date the plan was funded at 100.2%. The next valuation will be as at December 31, 2011.
CHANGES IN ACCRUED BENEFIT OBLIGATIONS AND PLAN ASSETS, AT FAIR VALUE
| | Pension Plan | | Other plans | |
| | 2011 | | 2010 | | 2011 | | 2010 | |
Accrued benefit obligations | | | | | | | | | |
Balance, beginning of year | | 14,984 | | 12,742 | | 983 | (a) | 889 | |
Current service cost | | 281 | | 227 | | 44 | | 45 | |
Employee contributions | | 124 | | 120 | | — | | — | |
Benefit payments and refunds | | (664 | ) | (602 | ) | (53 | ) | (55 | ) |
Interest on obligations | | 823 | | 778 | | 53 | | 54 | |
Actuarial loss | | 1,355 | | 1,719 | | 34 | | 95 | |
Balance, end of year | | 16,903 | | 14,984 | | 1,061 | | 1,028 | |
Plan assets, at fair value | | | | | | | | | |
Balance, beginning of year | | 14,226 | | 12,390 | | 70 | | 65 | |
Actual return on plan assets | | 613 | | 1,708 | | 2 | | 2 | |
Employee contributions | | 124 | | 120 | | — | | — | |
Current contributions by Hydro-Québec | | 263 | | 296 | | 5 | | 13 | |
Special contribution by Hydro-Québec | | 386 | | 350 | | — | | — | |
Benefit payments and refunds | | (664 | ) | (602 | ) | (9 | ) | (10 | ) |
Administrative and management expenses | | (51 | ) | (36 | ) | — | | — | |
Balance, end of year | | 14,897 | | 14,226 | | 68 | | 70 | |
Deficit, end of year | | (2,006 | ) | (758 | ) | (993 | ) | (958 | ) |
Unamortized past service cost | | 185 | | 235 | | — | | — | |
Unamortized net actuarial loss | | 5,013 | | 3,341 | | 179 | (a) | 157 | |
Unamortized transitional (asset) obligation | | (305 | ) | (457 | ) | 25 | (a) | 40 | |
Accrued benefit assets (liabilities) | | 2,887 | | 2,361 | | (789 | ) | (761 | ) |
(a) Including an adjustment related to the calculation of basic life insurance.
ADDITIONAL DISCLOSURES WITH RESPECT TO PLAN ASSETS
At year end, plan assets, at fair value, consisted of:
| | Pension Plan | | Other plans | |
% | | 2011 | | 2010 | | 2011 | | 2010 | |
| | | | | | | | | |
Bonds | | 50 | | 50 | | 92 | | 93 | |
Equities | | 40 | | 40 | | — | | — | |
Real estate investments | | 9 | | 8 | | — | | — | |
Other | | 1 | | 2 | | 8 | | 7 | |
| | 100 | | 100 | | 100 | | 100 | |
75
Note 22 Employee Future Benefits (continued)
Assets of the plans include the following securities issued by Hydro-Québec and by the Québec government and some of its agencies:
| | Pension Plan | | Other plans | |
| | 2011 | | 2010 | | 2011 | | 2010 | |
| | | | | | | | | |
Bonds | | 1,708 | | 1,828 | | 62 | | 65 | |
CASH PAYMENTS
Cash payments made by Hydro-Québec for employee benefit plans consist of the contributions paid to the funded plans and the benefits paid to employees and pensioners under unfunded plans. The cash payment details are as follows:
| | 2011 | | 2010 | | 2009 | |
Contributions by Hydro-Québec | | | | | | | |
Pension Plan | | 649 | | 646 | | 665 | |
Other funded plans | | 5 | | 13 | | 14 | |
Benefit payments | | | | | | | |
Unfunded plans | | 43 | | 45 | | 43 | |
| | 697 | | 704 | | 722 | |
In accordance with the actuarial valuation for funding purposes, Hydro-Québec made current contributions of $263 million in 2011 ($296 million in 2010), including additional contributions of $110 million ($156 million in 2010), to cover the current service cost, and a special contribution of $386 million ($350 million in 2010) to cover part of the unfunded actuarial liability. The special contributions paid in 2011 and 2010 take into account certain temporary relief measures introduced by An Act to amend the Supplemental Pension Plans Act and other legislative provisions in order to reduce the effects of the financial crisis on plans covered by the Act and, in particular, the extension of the period to cover the unfunded actuarial liability.
ELEMENTS OF ACCRUED BENEFIT COST RECOGNIZED FOR THE YEAR
| | Pension Plan | | Other plans | |
| | 2011 | | 2010 | | 2009 | | 2011 | | 2010 | | 2009 | |
| | | | | | | | | | | | | |
Current service cost (a) | | 281 | | 227 | | 161 | | 44 | | 45 | | 38 | |
Administrative and management expenses (b) | | 51 | | 36 | | 30 | | — | | — | | — | |
Interest on obligations | | 823 | | 778 | | 760 | | 53 | | 54 | | 51 | |
Actual return on plan assets | | (613 | ) | (1,708 | ) | (1,713 | ) | (2 | ) | (2 | ) | (2 | ) |
Actuarial loss | | 1,355 | | 1,719 | | 2,046 | | 34 | | 95 | | 81 | |
Cost before adjustments required to recognize the long-term nature of employee future benefits | | 1,897 | | 1,052 | | 1,284 | | 129 | | 192 | | 168 | |
Difference between actual and expected return on assets | | (403 | ) | 790 | | 926 | | (1 | ) | — | | — | |
Difference between actuarial loss on accrued benefit obligations and actuarial loss recognized | | (1,269 | ) | (1,719 | ) | (2,046 | ) | (28 | ) | (92 | ) | (82 | ) |
Amortization of past service cost | | 50 | | 50 | | 50 | | — | | — | | — | |
Amortization of transitional (asset) obligation | | (152 | ) | (152 | ) | (152 | ) | 13 | | 14 | | 13 | |
| | (1,774 | ) | (1,031 | ) | (1,222 | ) | (16 | ) | (78 | ) | (69 | ) |
Cost recognized for the year | | 123 | | 21 | | 62 | | 113 | | 114 | | 99 | |
(a) For the long-term disability salary insurance plan, the current service cost corresponds to the cost of new disability cases for the year.
(b) Administrative expenses billed to the Pension Plan by Hydro-Québec amounted to $12 million in 2011 ($12 million in 2010 and $13 million in 2009).
76
Note 22 Employee Future Benefits (continued)
SIGNIFICANT ACTUARIAL ASSUMPTIONS
The following actuarial assumptions, used to determine the accrued benefit obligations and cost of the plans, result from a weighted average:
| | Pension Plan | | Other plans | |
% | | 2011 | | 2010 | | 2009 | | 2011 | | 2010 | | 2009 | |
Accrued benefit obligations | | | | | | | | | | | | | |
Rate at end of year | | | | | | | | | | | | | |
Discount rate | | 5.01 | | 5.54 | | 6.17 | | 5.01 | | 5.54 | | 6.17 | |
Salary escalation rate (a) | | 2.61 | | 2.60 | | 2.97 | | — | | — | | — | |
Accrued benefit cost recognized | | | | | | | | | | | | | |
Rate at end of prior year | | | | | | | | | | | | | |
Discount rate | | 5.54 | | 6.17 | | 7.49 | | 5.54 | | 6.17 | | 7.49 | |
Expected long-term rate of return on plan assets | | 6.75 | | 6.75 | | 6.25 | | 4.45 | | 3.90 | | 3.72 | |
Salary escalation rate (a) | | 2.60 | | 2.97 | | 2.86 | | — | | — | | — | |
(a) This rate takes salary increases into account as well as promotion opportunities while in service.
As at December 31, 2011, health care costs were based on an annual growth rate of 5.5% for 2012. Subsequently, depending on the assumption used, the rate will ultimately decrease to 4.8% in 2030. A change of 1% in this annual growth rate would have had the following impact for 2011:
| | 1% increase | | 1% decrease | |
| | | | | |
Impact on current service cost and interest cost on accrued benefit obligations for the year | | 8 | | (6 | ) |
Impact on accrued benefit obligations at end of year | | 70 | | (55 | ) |
Note 23 Commitments and Contingencies
ELECTRICITY PURCHASE TRANSACTIONS
On May 12, 1969, Hydro-Québec signed a contract with Churchill Falls (Labrador) Corporation Limited [CF(L)Co] whereby Hydro-Québec undertook to purchase substantially all the output from Churchill Falls generating station, which has a rated capacity of 5,428 MW. Expiring in 2016, this contract will be automatically renewed for a further 25 years under agreed-upon terms and conditions. On June 18, 1999, Hydro-Québec and CF(L)Co entered into a contract to guarantee the availability of 682 MW of additional power until 2041 for the November 1 to March 31 winter period.
As at December 31, 2011, Hydro-Québec was committed under 132 contracts, with terms extending through 2052, to purchase electricity from other power producers. These contracts represent an installed capacity of about 5,644 MW, and the majority of them include renewal clauses. Hydro-Québec has also undertaken to purchase power transmission rights.
Hydro-Québec expects to make the following minimum payments on all its electricity purchase contracts over the coming years:
2012 | | 908 | |
2013 | | 1,206 | |
2014 | | 1,478 | |
2015 | | 1,672 | |
2016 | | 1,816 | |
2017 and thereafter | | 33,850 | |
77
Note 23 Commitments and Contingencies (continued)
GUARANTEES
In accordance with the terms and conditions of certain debt securities issued outside Canada, Hydro-Québec has undertaken to increase the amount of interest paid to non-residents in the event of changes to Canadian tax legislation governing the taxation of non-residents’ income. Hydro-Québec cannot estimate the maximum amount it might have to pay under such circumstances. Should an amount become payable, Hydro-Québec has the option of redeeming most of the securities in question. As at December 31, 2011, the amortized cost of these debts was $4,436 million.
Under the contract signed on May 12, 1969, with CF(L)Co, Hydro-Québec could be required to provide additional funding if CF(L)Co were unable to pay its expenses and service its debt. The maximum amount that Hydro-Québec could be required to pay cannot be reasonably evaluated, however, since it is not stated in the contract and since the amount payable would depend on the outcome of future events whose nature and probability cannot be determined. To date, Hydro-Québec has not had to pay any amount under this contract.
INVESTMENTS
In its Strategic Plan 2009—2013, Hydro-Québec anticipates investing approximately $5 billion annually in property, plant and equipment and intangible assets in 2012 and 2013.
In addition, Hydro-Québec has entered into various agreements with the local communities concerned by certain capital projects. The amounts related to some of these agreements are not recorded under Long-term debt because, as at December 31, 2011, they did not correspond to the definition of a liability. These agreements provide for annual payments as of 2021, for a maximum term of 51 years and a total amount of $618 million.
Finally, the Québec government has stated that it would announce its decision concerning the future of Gentilly-2 nuclear generating station in 2012. Should it decide to close down the generating station, abandoning the refurbishment project would have a major financial impact on the costs already capitalized for the work under way (see Note 8, Property, Plant and Equipment) and would require a review of the assumptions related to the work to dismantle the station, as described in Note 13, Asset Retirement Obligations.
LITIGATION
In the normal course of its development and operating activities, Hydro-Québec is sometimes party to claims and legal proceedings. Management is of the opinion that an adequate provision has been made for these legal actions. Consequently, it does not foresee any adverse effect of such contingent liabilities on Hydro-Québec’s consolidated operating results or financial position.
Among other ongoing actions, some local communities have instituted proceedings against the governments of Canada and Québec, as well as against Hydro-Québec, concerning their ancestral rights. Thus, the Innus of Uashat and Mani-Utenam are claiming $1.5 billion. In May 2010, they served notice that they had filed for an injunction to suspend work at the Romaine complex jobsite. Proceedings in this case are currently pending. As well, in November 2006, the Innus of Pessamit reactivated a case instituted in 1998 aimed at obtaining, among other things, the recognition of rights related to Québec lands on which certain hydroelectric generating facilities belonging to the Manic-Outardes complex are located. By amendment, this community attempted to increase its initial claim of $500 million to $10.8 billion and to add annual compensation payments of $657 million from Hydro-Québec. The request for amendment was rejected by Québec’s Superior Court and Court of Appeal in 2011. The case concerning the initial amount of $500 million has not yet been settled. Hydro-Québec is challenging the legitimacy of all these claims.
78
Note 24 Segmented Information
Hydro-Québec carries on its activities in the four reportable business segments defined below. The non-reportable business segments and other activities are grouped together under Corporate and Other Activities for reporting purposes.
Generation: Hydro-Québec Production operates and develops Hydro-Québec’s generating facilities. This division also sells electricity on external markets and engages in energy trading. Hydro-Québec Production provides Hydro-Québec Distribution with a base volume of up to 165 TWh of heritage pool electricity annually at an average price of 2.79¢/kWh. In excess of this volume, it can participate in Hydro-Québec Distribution’s calls for tenders in a context of free market competition.
Transmission: Hydro-Québec TransÉnergie operates and develops Hydro-Québec’s power transmission system. It markets system capacity and manages power flows throughout Québec.
Distribution: Hydro-Québec Distribution operates and develops Hydro-Québec’s distribution system and is responsible for sales and services to Québec customers. It also promotes energy efficiency and ensures the security of the supply of electricity to the Québec market.
Construction: Hydro-Québec Équipement et services partagés and Société d’énergie de la Baie James (SEBJ) design, build and refurbish generating and transmission facilities. Hydro-Québec Équipement et services partagés is responsible for projects throughout Québec, except in the territory governed by the James Bay and Northern Québec Agreement (JBNQA). SEBJ builds generating facilities in the territory governed by the JBNQA (north of the 49th parallel) and may carry out projects outside Québec.
Corporate and Other Activities: The corporate units support the divisions in the achievement of their business objectives. They include the Groupe — Technologie, Groupe — Affaires corporatives et secrétariat général, Vice-présidence — Comptabilité et contrôle, Vice-présidence — Financement, trésorerie et caisse de retraite and Vice-présidence — Ressources humaines, as well as the Direction principale — Centre de services partagés, which reports to Hydro-Québec Équipement et services partagés. The Centre de services partagés brings together internal company-wide shared services, including procurement of goods and services, real estate management, document management, material management and transportation, food and accommodation services.
The amounts presented for each segment are based on the financial information used to prepare the consolidated financial statements. The accounting policies used to calculate these amounts are as described in Note 1, Significant Accounting Policies, and Note 3, Effects of Rate Regulation on the Consolidated Financial Statements.
Intersegment transactions related to electricity sales are recorded based on the supply and transmission rates provided for by the Act respecting the Régie de l’énergie. The Act sets a commodity rate for an annual base volume of up to 165 TWh of heritage pool electricity for the Québec market.
Other intersegment products and services are measured at full cost, which includes all costs directly associated with product or service delivery.
Most of Hydro-Québec’s revenue is from Québec, and substantially all its property, plant and equipment are related to its Québec operations. In 2011, revenue from outside Québec amounted to $1,536 million, with $1,172 million originating from the United States ($1,643 million and $1,293 million, respectively, in 2010 and $1,610 million and $1,311 million, respectively, in 2009).
79
Note 24 Segmented Information (continued)
OPERATIONS AND ASSETS BY SEGMENT
2011 |
| | Generation | | Transmission | | Distribution | | Construction | | Corporate
and Other
Activities | | Intersegment
eliminations
and
adjustments | | Total | |
Revenue | | | | | | | | | | | | | | | |
External customers | | 1,555 | | 98 | | 10,676 | | — | | 60 | | 3 | (a) | 12,392 | |
Intersegment | | 4,941 | | 2,991 | | 75 | | 2,122 | | 1,385 | | (11,514 | ) | — | |
Depreciation and amortization | | 825 | | 963 | | 751 | | 4 | | 83 | | (3 | ) | 2,623 | |
Financial expenses | | 1,101 | | 859 | | 511 | | — | | 30 | | (4 | ) | 2,497 | |
Net income | | 1,690 | | 435 | | 374 | | — | | 109 | | 3 | | 2,611 | |
Total assets | | 31,661 | | 18,483 | | 12,983 | | 398 | | 6,343 | | (231 | ) | 69,637 | |
Investing activities | | | | | | | | | | | | | | | |
Increase in property, plant and equipment and intangible assets | | | | | | | | | | | | | | | |
Affecting cash | | 1,467 | | 1,292 | | 950 | | 5 | | 100 | | — | | 3,814 | |
Not affecting cash | | 208 | | 21 | | 10 | | — | | — | | — | | 239 | |
2010 |
| | Generation | | Transmission | | Distribution | | Construction | | Corporate
and Other
Activities | | Intersegment
eliminations
and
adjustments | | Total | |
Revenue | | | | | | | | | | | | | | | |
External customers | | 1,692 | | 38 | | 10,705 | | — | | 33 | | 16 | (a) | 12,484 | |
Intersegment | | 4,843 | | 3,051 | | 70 | | 2,607 | | 1,360 | | (11,931 | ) | — | |
Depreciation and amortization | | 725 | | 951 | | 817 | | 3 | | 81 | | (12 | ) | 2,565 | |
Financial expenses | | 1,119 | | 872 | | 503 | | — | | 35 | | (3 | ) | 2,526 | |
Net income (loss) | | 1,605 | | 447 | | 453 | | — | | (2 | ) | 12 | | 2,515 | |
Total assets | | 30,609 | | 18,072 | | 12,700 | | 449 | | 4,307 | | (328 | ) | 65,809 | |
Investing activities | | | | | | | | | | | | | | | |
Increase in property, plant and equipment and intangible assets | | | | | | | | | | | | | | | |
Affecting cash | | 1,900 | | 1,248 | | 944 | | 7 | | 121 | | — | | 4,220 | |
Not affecting cash | | 89 | | 17 | | 9 | | — | | — | | — | | 115 | |
2009 |
| | Generation | | Transmission | | Distribution | | Construction | | Corporate
and Other
Activities | | Intersegment
eliminations
and
adjustments | | Total | |
Revenue | | | | | | | | | | | | | | | |
External customers | | 1,588 | | 46 | | 10,547 | | — | | 25 | | 11 | (a) | 12,217 | |
Intersegment | | 4,819 | | 2,868 | | 68 | | 2,645 | | 1,298 | | (11,698 | ) | — | |
Depreciation and amortization | | 667 | | 782 | | 778 | | 3 | | 68 | | (12 | ) | 2,286 | |
Financial expenses | | 1,019 | | 851 | | 502 | | — | | 27 | | (1 | ) | 2,398 | |
Net income | | 2,053 | | 435 | | 363 | | — | | 8 | | 12 | | 2,871 | |
Investing activities | | | | | | | | | | | | | | | |
Increase in property, plant and equipment and intangible assets | | | | | | | | | | | | | | | |
Affecting cash | | 2,033 | | 1,196 | | 966 | | 1 | | 111 | | — | | 4,307 | |
Not affecting cash | | 139 | | 23 | | 3 | | — | | — | | — | | 165 | |
(a) Resales of excess supply by Hydro-Québec Distribution on outside markets are presented as offsets of electricity purchases rather than in Revenue.
Note 25 Comparative Information
Some of the prior years’ data have been reclassified to conform to the presentation adopted in the current year.
80
SUPPLEMENTARY INFORMATION
As per Canadian accounting principles, long-term debt is shown at amortized cost (i.e. the nominal amount plus or minus unamortized discount and/or premium). Moreover, the sinking fund is not stated separately; instead each issue of Hydro-Québec’s debt held in the sinking fund reduces the outstanding amount of such issue.
The following table sets forth the non-consolidated and outstanding long-term debt by issue of Hydro-Québec as of December 31, 2011, expressed in Canadian dollars and in currency units:
LONG-TERM DEBT BY ISSUE
Series | | Maturity Date | | Issue Date (1) | | Interest
Rate % | | Canadian Dollars | | CUSIP Number
or ISIN Code | | References (2) | |
| | | | | | | | | | | |
Payable in Canadian Dollars | | | | | | | | | | | |
| | | | | | | | | | | | | |
GU2 | | 2012-07-16 | | 1987-07-16 | | 10.250 | | $ | 746,667,607 | | 448814 CV 3 | | | |
HG | | 2019-11-22 | | 1989-11-22 | | 10.000 | | 100,000,000 | | 448814 DE 0 | | | |
II | | 2020-01-10 | | 1993-07-27 | | 10.250 | | 157,618,242 | | 448814 EF 6 | | | |
HL | | 2020-08-15 | | 1990-08-15 | | 11.000 | | 1,110,000,000 | | 448814 DG 5 | | | |
HM | | 2020-08-15 | | 1990-08-15 | | — | | 706,028,229 | | 448814 DK 6 | | | |
HX | | 2021-10-15 | | 1991-10-15 | | 10.500 | | 1,100,000,000 | | 448814 DW 0 | | | |
IC | | 2022-07-15 | | 1992-07-15 | | 9.625 | | 1,950,000,000 | | 448814 DZ 3 | | | |
IH | | 2031-02-26 | | 1993-07-27 | | 11.000 | | 224,896,887 | | 448814 EG 4 | | | |
JG | | 2031-08-15 | | 1999-01-26 | | 6.000 | | 825,675,000 | | 448814 GY 3 | | | |
JM | | 2045-02-15 | | 2006-10-17 | | 5.000 | | 5,000,000,000 | | CA448814 HZ 92 | | | |
JN | | 2050-02-15 | | 2009-01-15 | | 5.000 | | 5,000,000,000 | | CA448814 JA 24 | | | |
| | | | | | | | |
Medium-term notes issued under Canadian MTN program | | | | | | | | |
| | | | | | | | | | | | | |
0006 | | 2012-02-15 | | 1997-02-14 | | 7.000 | | 10,700,000 | | CA44889Z DP 86 | | | |
0058 | | 2014-02-20 | | 2009-06-22 | | Floating | | 2,060,000,000 | | CA44889Z EE 21 | | | |
0052 | | 2014-03-03 | | 2004-03-03 | | 4.783 | | 12,000,000 | | CA44889Z DX 11 | | | |
0063 | | 2015-02-11 | | 2011-02-11 | | Floating | | 2,038,375,000 | | CA44889Z EK 80 | | | |
0062 | | 2016-03-01 | | 2010-02-23 | | 3.290 | | 14,626,000 | | CA44889Z EJ 18 | | | |
0056 | | 2017-03-02 | | 2009-03-02 | | 4.205 | | 14,000,000 | | CA44889Z EC 64 | | | |
0059 | | 2017-04-15 | | 2009-10-14 | | — | | 21,702,602 | | CA44889Z EF 95 | | | |
0049 | | 2018-08-15 | | 2003-09-04 | | 5.500 | | 150,000,000 | | CA44889Z DU 71 | | | |
0057 | | 2019-03-02 | | 2009-03-02 | | 4.678 | | 14,600,000 | | CA44889Z ED 48 | | | |
0003 | | 2021-08-15 | | 1996-09-27 | | — | | 54,102,705 | | — | | (a) | |
0060 | | 2022-04-15 | | 2009-10-14 | | — | | 29,046,699 | | CA44889Z EG 78 | | | |
0005 | | 2024-11-07 | | 1996-11-07 | | 7.500 | | 25,000,000 | | CA44889Z DZ 68 | | | |
0061 | | 2027-04-15 | | 2009-10-14 | | — | | 29,412,176 | | CA44889Z EH 51 | | | |
0017 | | 2029-01-16 | | 1999-02-02 | | 6.500 | | 75,000,000 | | CA44889Z CK 09 | | | |
0038 | | 2031-08-15 | | 2001-01-17 | | 6.000 | | 4,325,000 | | CA44889Z DG 87 | | | |
0009 | | 2035-01-16 | | 1998-02-03 | | 6.500 | | 686,500,000 | | CA44889Z BF 23 | | | |
0011 | | 2035-01-16 | | 1998-02-18 | | Various | | 26,791,350 | | CA44889Z BH 88 | | (b) | |
0016 | | 2035-01-16 | | 1998-07-27 | | 3.529 | | 100,629,762 | | CA44889Z CJ 36 | | (c) | |
0019 | | 2035-02-15 | | 1999-04-30 | | 6.500 | | 3,794,000,000 | | CA44889Z CM 64 | | | |
0012 | | 2035-07-16 | | 1998-06-05 | | Various | | 67,379,631 | | CA44889Z BJ 45 | | (d) | |
0014 | | 2035-07-16 | | 1998-07-15 | | — | | 24,320,477 | | — | | (e) | |
0020 | | 2040-02-15 | | 1999-05-14 | | 6.000 | | 3,770,500,000 | | CA44889Z CN 48 | | | |
0032 | | 2050-02-15 | | 2000-08-01 | | 6.000 | | 50,000,000 | | CA44889Z DA 18 | | | |
0033 | | 2060-02-15 | | 2000-11-02 | | Various | | 390,328,312 | | CA44889Z DB 90 | | (f) | |
0037 | | 2060-02-15 | | 2001-01-12 | | Various | | 62,596,641 | | CA44889Z DF 05 | | (g) | |
0039 | | 2060-02-15 | | 2001-01-19 | | Various | | 235,495,990 | | CA44889Z DH 60 | | (h) | |
0040 | | 2060-02-15 | | 2001-01-24 | | Various | | 29,096,944 | | CA44889Z DJ 27 | | (i) | |
| | | | | | | | | | | | | |
Present value of lease obligations for regional offices and service facilities | | 24,714,662 | | | | | |
Others | | 913,811,635 | | | | | |
Unamortized discount and/or premium | | 1,183,682,025 | | | | | |
| | | | | | | |
Debt classified by currency of issue | | 32,833,623,576 | | | | | |
| | | | | | | |
Debt classified by currency of repayment (4) | | 40,770,909,753 | | | | | |
| | | | | | | | | | | | | | |
81
Series | | Maturity
Date | | Issue Date (1) | | Interest
Rate % | | Canadian Dollars (3) | | Currency Units | | CUSIP Number
or ISIN Code | | References (2) | |
| | | | | | | | | | | | | | | |
Payable in U.S. Dollars |
| | | | | | | | | | | | | | | |
FU | | 2012-02-01 | | 1985-02-01 | | 11.750 | | $ | 203,400,000 | | US$ | 200,000,000 | | 448814 CF 8 | | (j) | |
IF2 | | 2013-02-01 | | 1993-02-03 | | 8.000 | | 757,610,082 | | 744,946,000 | | 448814 ED 1 | | | |
IU | | 2016-04-01 | | 1996-04-01 | | 7.500 | | 406,800,000 | | 400,000,000 | | 448814 EK 5 | | | |
JO | | 2016-06-30 | | 2011-06-30 | | 2.000 | | 1,017,000,000 | | 1,000,000,000 | | US448814 JB05 | | | |
HS | | 2021-02-01 | | 1991-02-12 | | 9.400 | | 915,300,000 | | 900,000,000 | | 448814 DM 2 | | | |
HY | | 2022-01-15 | | 1992-01-30 | | 8.400 | | 1,017,000,000 | | 1,000,000,000 | | 448814 DX 8 | | | |
IO | | 2024-07-07 | | 1994-07-07 | | 8.050 | | 1,016,949,150 | | 999,950,000 | | 448814 EJ 8 | | | |
GF | | 2026-03-01 | | 1986-03-13 | | 8.875 | | 254,250,000 | | 250,000,000 | | 448814 CP 6 | | (j) | |
GH | | 2026-04-15 | | 1986-04-30 | | 8.250 | | 254,250,000 | | 250,000,000 | | 448814 CS 0 | | (j) | |
GQ | | 2027-01-15 | | 1987-01-29 | | 8.250 | | 254,250,000 | | 250,000,000 | | 448814 CT 8 | | | |
HE | | 2029-06-15 | | 1989-06-22 | | 8.625 | | 254,250,000 | | 250,000,000 | | 448814 DB 6 | | | |
HH | | 2029-12-01 | | 1989-12-07 | | 8.500 | | 508,500,000 | | 500,000,000 | | 448814 DC 4 | | | |
HK | | 2030-04-15 | | 1990-04-18 | | 9.375 | | 508,500,000 | | 500,000,000 | | 448814 DF 7 | | | |
HQ | | 2030-11-15 | | 1990-11-20 | | 9.500 | | 508,500,000 | | 500,000,000 | | 448814 DL 4 | | | |
| | | | | | | | | | | | | | | |
Medium-term notes issued under U.S. MTN program |
| | | | | | | | | | | | | | | |
B-7 | | 2020-12-11 | | 1990-12-10 | | 9.400 | | 10,170,000 | | 10,000,000 | | 44881H AF 1 | | | |
B-48 | | 2021-12-20 | | 1991-12-19 | | 8.680 | | 50,850,000 | | 50,000,000 | | 44881H BX 1 | | | |
B-49 | | 2022-02-15 | | 1992-02-15 | | 9.800 | | 50,850,000 | | 50,000,000 | | 44881H BY 9 | | | |
B-64 | | 2022-05-10 | | 1992-04-30 | | 9.750 | | 20,340,000 | | 20,000,000 | | 44881H CL 6 | | | |
B-124 | | 2024-11-18 | | 1994-11-18 | | 8.910 | | 25,425,000 | | 25,000,000 | | 44881H ET 7 | | | |
B-125 | | 2025-03-28 | | 1995-03-28 | | 8.400 | | 55,935,000 | | 55,000,000 | | 44881H EU 4 | | | |
B-127 | | 2026-01-03 | | 1996-01-03 | | 6.270 | | 50,850,000 | | 50,000,000 | | 44881H EW O | | | |
B-63 | | 2027-04-30 | | 1992-04-30 | | 9.500 | | 20,340,000 | | 20,000,000 | | 44881H CK 8 | | | |
B-130 | | 2028-07-13 | | 1998-07-13 | | 6.625 | | 50,850,000 | | 50,000,000 | | 44881H EZ 3 | | | |
| | | | | | | | | | | | | | | |
Unamortized discount and/or premium | | (64,439,057 | ) | | | | | | |
| | | | | | | | | |
Debt classified by currency of issue | | 8,147,730,175 | | | | | | | |
| | | | | | | | | |
Debt classified by currency of repayment (4) | | 630,079,268 | | | | | | | |
| | | | | | | | | | | | | | | |
Payable in Euro | | | | | | | | | | | | | |
| | | | | | | | | | | | | | | |
D15B | | 2016-05-01 | | 1986-05-01 | | 6.000 | | $ | 79,856,291 | | € | 60,529,289 | | DE0004780325 | | | |
| | | | | | | | | | | | | | | |
Unamortized discount and/or premium | | (613,299 | ) | | | | | | |
| | | | | | | | | |
Debt classified by currency of issue | | 79,242,992 | | | | | | | |
| | | | | | | | | |
Debt classified by currency of repayment (4) | | — | | | | | | | |
| | | | | | | | | | | | | | | |
Payable in Japanese Yen |
| | | | | | | | | | | | | | | |
Medium-term notes issued under Euro MTN program |
| | | | | | | | | | | | | | | |
32 | | 2012-03-05 | | 1997-03-05 | | 4.400 | | $ | 13,210,000 | | ¥ | 1,000,000,000 | | XS0074215830 | | | |
34 | | 2017-03-17 | | 1997-03-17 | | 4.850 | | 13,210,000 | | 1,000,000,000 | | XS0074480319 | | | |
| | | | | | | | | | | | | | | |
Unamortized discount and/or premium | | | | 6,165 | | | | | | | |
| | | | | | | | | | | | | | | |
Debt classified by currency of issue | | | | 26,426,165 | | | | | | | |
| | | | | | | | | | | | | | | |
Debt classified by currency of repayment (4) | | — | | | | | | | |
| | | | | | | | | | | | | | | | | | |
82
Series | | Maturity
Date | | Issue Date (1) | | Interest
Rate % | | Canadian Dollars (3) | | Currency Units | | CUSIP Number
or ISIN Code | | References (2) | |
| | | | | | | | | | | | | | | |
Payable in Pounds Sterling | | | | | | | | | | | |
| | | | | | | | | | | | | | (k) | |
HI | | 2015-03-08 | | 1990-03-08 | | 12.625 | | $ | 236,985,000 | | £ | 150,000,000 | | XS0015132904 | | | |
FA | | 2015-09-13 | | 1982-09-13 | | 12.750 | | 78,995,000 | | 50,000,000 | | GB0004494216 | | | |
| | | | | | | | | | | |
Unamortized discount and/or premium | | (2,013,887 | ) | | | | | | |
| | | | | | | | | |
Debt classified by currency of issue | | 313,966,113 | | | | | | | |
| | | | | | | | | |
Debt classified by currency of repayment (4) | | — | | | | | | | |
| | | | | | | | | |
Total Long-term Debt | | $ | 41,400,989,021 | | | | | | | |
| | | | | | | | | | | | | | | | | |
(1) | If more than one issue date, the date of the first issue is indicated. |
(2) | Not redeemable unless otherwise specified. |
(3) | Translated at rates in effect at December 31, 2011. |
(4) | Takes into account swaps related to long-term debt (see Notes 12 and 16 to the 2011 Consolidated Financial Statements). |
| |
(a) | Sold at deep discount maturing semi-annually from February 15, 2011 to August 15, 2021 in equal payments. |
(b) | From January 16, 2022, fixed coupon amounts of $1.6 million payable semi-annually. |
(c) | From January 16, 1999 to January 16, 2014, interest coupons of $3 million payable semi-annually. From July 16, 2024 to January 16, 2035, interest coupons of $5.525 million payable semi-annually. |
(d) | Fixed rate coupon of 6.5% semi-annually commencing on January 16, 2026. |
(e) | Sold at deep discount maturing semi-annually from January 16, 2025 to July 16, 2035 in various payment amounts. |
(f) | No interest payment until February 15, 2030 exclusive. Commencing on February 15, 2030, fixed rate coupon of 45% payable semi-annually. |
(g) | No interest payment until February 15, 2041 exclusive. From February 15, 2041 to February 15, 2045, interest coupons of $50 million payable annually. From February 15, 2046 to February 15, 2050, interest coupons of $35 million payable annually. From February 15, 2051 to February 15, 2055, interest coupons of $20 million payable annually. From February 15, 2056 to February 15, 2059, interest coupons of $10 million payable annually. |
(h) | No interest payment until February 15, 2040 exclusive. Commencing on February 15, 2040, fixed rate coupon of 100% payable semi-annually. |
(i) | No interest payment until February 15, 2050 exclusive. From February 15, 2050 to February 15, 2052, interest coupons of $45 million payable annually. From February 15, 2053 to February 15, 2055, interest coupons of $40 million payable annually. From February 15, 2056 to February 15, 2058, interest coupons of $35 million payable annually. On February 15, 2059, interest coupon of $30 million is payable. |
(j) | Sinking fund debentures. |
(k) | Redeemable anytime at the highest of par or adjusted price as per the Fiscal Agency Agreement at the option of Hydro-Québec. |
83