Exhibit 99.4

Third Quarter 2013
| | Message from the Chairman of the Board
and the President and Chief Executive Officer |
| | |
| | |
| | |
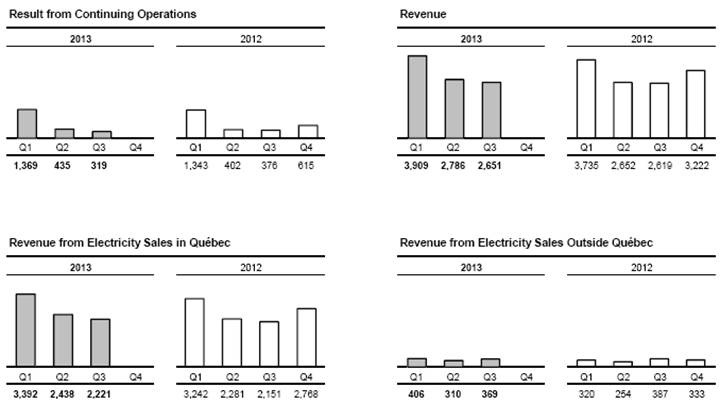
Third quarter | | For the third quarter of 2013, Hydro-Québec’s result from continuing operations was $319 million, compared to $376 million in 2012. Net electricity exports by Hydro-Québec Production increased slightly compared to the same period in 2012. However, this increase was offset by adjustments related to the regulated activities of Hydro-Québec TransÉnergie and Hydro-Québec Distribution. |
| | |
| | |
Summary of operations for the first three quarters | | For the nine months ended September 30, 2013, the result from continuing operations was $2,123 million, compared to $2,121 million for the same period last year. Net electricity exports increased by $147 million, whereas electricity purchases from Rio Tinto Alcan decreased. Moreover, the deferred implementation of Hydro-Québec Distribution’s rate adjustment, i.e., the difference between the April 1 effective date of the rate adjustment and the recording of additional costs as of January 1, whose effect was amplified in 2013, had a negative impact of $91 million. When the discontinued operations are factored in, the net result for the first nine months of the year amounted to $2,136 million in 2013, compared to $265 million in 2012. It should be remembered that in September 2012, following the decision to abandon the project to refurbish Gentilly-2 nuclear generating station and to terminate all nuclear power operations, Hydro-Québec had recorded a negative result from discontinued operations of $1,856 million. |
| | |
| | |
Result from continuing operations for the first three quarters | | Revenue totaled $9,346 million, compared to $9,006 million a year earlier. In Québec, revenue from electricity sales amounted to $8,051 million, or $377 million more than in 2012, mainly because temperatures were close to normal in 2013, whereas they had been milder in 2012. Higher demand was also a factor, primarily in the residential sector, as were the rate adjustments of April 1, 2012 and 2013. |
| | On markets outside Québec, revenue from electricity sales was $1,085 million, compared to $961 million in 2012. This $124-million increase resulted from growth in Hydro-Québec Production’s export revenue. Other revenue totaled $210 million, a $161-million decrease compared to 2012 that is partly due to revenue variances related to climate conditions, given the mild temperatures in 2012, and to the adjustments related to the regulated activities of Hydro-Québec TransÉnergie and Hydro-Québec Distribution. Total expenditure amounted to $5,393 million, or $337 million more than in 2012. Electricity and fuel purchases increased by $180 million because of a $206-million rise in electricity purchases made by Hydro-Québec Distribution, mainly from independent wind power and biomass energy producers. This increase was mitigated, however, by a $78-million decrease in electricity purchases made by Hydro-Québec Production from Rio Tinto Alcan, among other suppliers. In addition, water-power royalties increased by $39 million. |
| | |
| | |
Segmented operations for the first three quarters | | Generation Hydro-Québec Production posted a result from continuing operations of $1,414 million, compared to $1,208 million in 2012. This $206-million increase is due to growth of $147 million in net electricity exports and of $60 million in revenue from electricity sales to Hydro-Québec Distribution, mainly because temperatures were close to normal in 2013, whereas they had been milder in 2012, and because demand rose in Québec. In addition, electricity purchases from Rio Tinto Alcan decreased by $105 million. These factors were mitigated by a $39-million increase in water-power royalties. Transmission Hydro-Québec TransÉnergie’s result from continuing operations was $416 million, a $60-million decrease from 2012 that is due, among other things, to an adjustment related to the division’s 2013 rate case and to variances in revenue from point-to-point transmission services. Distribution Hydro-Québec Distribution posted a result from continuing operations of $231 million, compared to $346 million in 2012. Revenue from electricity sales increased by $317 million on account of three main factors: temperatures that were close to normal in 2013, whereas they had been milder in 2012; higher demand, primarily in the residential sector; and the rate adjustments of April 1, 2012 and 2013. Other revenue decreased, partly because of revenue variances related to climate conditions given the mild temperatures in 2012. Electricity purchases increased by $261 million, $206 million of which relate to supplies from independent power producers and $60 million to supplies from Hydro-Québec Production. In addition, depreciation and amortization expense increased by $40 million compared to 2012. |
Page 2 | Third Quarter 2013 |
| | Construction The Construction segment includes activities related to the projects carried out by Hydro-Québec Équipement et services partagés and by Société d’énergie de la Baie James (SEBJ). The volume of activity at Hydro-Québec Équipement et services partagés and SEBJ totaled $1,756 million, compared to $1,551 million in 2012. Projects under way for Hydro-Québec Production include ongoing construction at the Romaine jobsites. Work in progress for Hydro-Québec TransÉnergie includes expansion of the transmission system in the Minganie region, the addition of a 735/315-kV section and related work at Bout-de-l’Île substation as well as various projects stemming from continued investment in asset sustainment. |
| | |
| | |
Investment | | In the first nine months of 2013, Hydro-Québec invested $2,920 million in property, plant and equipment and intangible assets, compared to $2,627 million in 2012. As expected, a large portion of this amount was devoted to the major hydroelectric projects of Hydro-Québec Production, especially ongoing construction at the Romaine jobsites. Hydro-Québec TransÉnergie continued investing in its transmission system. As part of its growth projects, it continued construction of Romaine-2 substation and the 735-kV line that will connect it to Arnaud substation. The division also carried out maintenance and improvement activities to ensure the long-term operability of its transmission assets. Hydro-Québec Distribution kept up investments to handle the growth of its Québec customer base and to ensure the long-term operability of its facilities. |
| | |
| | |
Financing | | During the third quarter of 2013, Hydro-Québec borrowed $1.6 billion on the Canadian market. In July, it issued debentures due February 2050 with a yield of 3.95%, which enabled it to raise $0.6 billion. Then, in September, the company issued variable-rate notes for a total amount of $1.0 billion, maturing in September 2018. The funds will be used to support part of the investment program and to refinance maturing debt. |
| | |
| | |
| | |
| | |
| | Pierre Karl Péladeau | Thierry Vandal |
| | | |
| | Chairman of the Board | President and Chief Executive Officer |
| | | |
| | November 15, 2013 | |
CONSOLIDATED FINANCIAL STATEMENTS
(UNAUDITED)
CONSOLIDATED STATEMENTS OF OPERATIONS
In millions of Canadian dollars
(unaudited) | | | | Three months ended
September 30 | | Nine months ended
September 30 | |
| | Notes | | 2013 | | 2012 | | 2013 | | 2012 | |
| | | | | | | | | | | |
Revenue | | 3 | | 2,651 | | 2,619 | | 9,346 | | 9,006 | |
| | | | | | | | | | | |
Expenditure | | | | | | | | | | | |
Operations | | | | 563 | | 534 | | 1,788 | | 1,702 | |
Electricity and fuel purchases | | | | 314 | | 295 | | 1,081 | | 901 | |
Depreciation and amortization | | 4 | | 605 | | 576 | | 1,787 | | 1,740 | |
Taxes | | | | 230 | | 217 | | 737 | | 713 | |
| | | | 1,712 | | 1,622 | | 5,393 | | 5,056 | |
| | | | | | | | | | | |
Operating result | | | | 939 | | 997 | | 3,953 | | 3,950 | |
Financial expenses | | 5 | | 620 | | 621 | | 1,830 | | 1,829 | |
| | | | | | | | | | | |
Result from continuing operations | | | | 319 | | 376 | | 2,123 | | 2,121 | |
Result from discontinued operations | | 6 | | (7) | | (1,833 | ) | 13 | | (1,856 | ) |
| | | | | | | | | | | |
Net result | | | | 312 | | (1,457 | ) | 2,136 | | 265 | |
CONSOLIDATED STATEMENTS OF RETAINED EARNINGS
In millions of Canadian dollars
(unaudited) | | Three months ended
September 30 | | Nine months ended
September 30 | |
| | 2013 | | 2012 | | 2013 | | 2012 | |
| | | | | | | | | |
Balance, beginning of period | | 16,657 | | 16,340 | | 14,833 | | 14,618 | |
Net result | | 312 | | (1,457 | ) | 2,136 | | 265 | |
| | | | | | | | | |
Balance, end of period | | 16,969 | | 14,883 | | 16,969 | | 14,883 | |
The accompanying notes are an integral part of the consolidated financial statements.
Page 4 | Third Quarter 2013 |
CONSOLIDATED BALANCE SHEETS
In millions of Canadian dollars
(unaudited) | | As at September 30,
2013 | | | As at December 31,
2012 | |
| | | | | | |
ASSETS | | | | | | |
Current assets | | | | | | |
Cash and cash equivalents | | 1,798 | | | 2,183 | |
Short-term investments | | 1,042 | | | 609 | |
Accounts receivable and other receivables | | 1,717 | | | 1,838 | |
Derivative instruments | | 1,077 | | | 1,052 | |
Regulatory assets | | 14 | | | 22 | |
Materials, fuel and supplies | | 186 | | | 178 | |
| | 5,834 | | | 5,882 | |
| | | | | | |
Property, plant and equipment | | 58,362 | | | 57,174 | |
Intangible assets | | 2,287 | | | 2,241 | |
Investments | | 147 | | | 134 | |
Derivative instruments | | 687 | | | 1,269 | |
Regulatory assets | | 12 | | | 18 | |
Other assets | | 4,162 | | | 3,799 | |
| | | | | | |
| | 71,491 | | | 70,517 | |
| | | | | | |
LIABILITIES | | | | | | |
Current liabilities | | | | | | |
Borrowings | | 331 | | | 19 | |
Accounts payable and accrued liabilities | | 1,850 | | | 2,078 | |
Dividend payable | | – | | | 645 | |
Accrued interest | | 489 | | | 835 | |
Asset retirement obligations | | 178 | | | 178 | |
Derivative instruments | | 329 | | | 663 | |
Current portion of long-term debt | | 1,510 | | | 694 | |
| | 4,687 | | | 5,112 | |
| | | | | | |
Long-term debt | | 42,193 | | | 42,555 | |
Asset retirement obligations | | 784 | | | 774 | |
Derivative instruments | | 1,519 | | | 1,816 | |
Other long-term liabilities | | 1,042 | | | 1,003 | |
Perpetual debt | | 284 | | | 275 | |
| | 50,509 | | | 51,535 | |
| | | | | | |
EQUITY | | | | | | |
| | | | | | |
Share capital | | 4,374 | | | 4,374 | |
| | | | | | |
Retained earnings | | 16,969 | | | 14,833 | |
Accumulated other comprehensive income | | (361 | ) | | (225 | ) |
| | 16,608 | | | 14,608 | |
| | | | | | |
| | 20,982 | | | 18,982 | |
| | | | | | |
| | 71,491 | | | 70,517 | |
The accompanying notes are an integral part of the consolidated financial statements.
On behalf of the Board of Directors, | | |
| | |
/s/ Jacques Leblanc | | /s/ Pierre Karl Péladeau |
Chair of the Audit Committee | | Chairman of the Board |
CONSOLIDATED STATEMENTS OF CASH FLOWS
In millions of Canadian dollars
(unaudited) | | | | Three months ended
September 30 | | Nine months ended
September 30 | |
| | Notes | | 2013 | | 2012 | | 2013 | | 2012 | |
| | | | | | | | | | | |
Operating activities | | | | | | | | | | | |
Net result | | | | 312 | | (1,457 | ) | 2,136 | | 265 | |
Adjustments to determine net cash flows from operating activities | | | | | | | | | | | |
Depreciation and amortization | | 4 | | 605 | | 581 | | 1,787 | | 1,754 | |
Amortization of premiums, discounts and issue expenses related to debt securities | | | | 33 | | 57 | | 115 | | 213 | |
Write-off of property, plant and equipment under construction | | 6 | | – | | 978 | | – | | 978 | |
Impairment of nuclear generating station assets | | 6 | | – | | 827 | | – | | 827 | |
Other | | | | (33 | ) | 57 | | 88 | | 21 | |
Change in non-cash working capital items | | 7 | | (52 | ) | (103 | ) | (479 | ) | (531 | ) |
Net change in accrued benefit assets and liabilities | | | | (107 | ) | (101 | ) | (331 | ) | (297 | ) |
| | | | 758 | | 839 | | 3,316 | | 3,230 | |
| | | | | | | | | | | |
Investing activities | | | | | | | | | | | |
Additions to property, plant and equipment | | | | (1,046 | ) | (969 | ) | (2,747 | ) | (2,497 | ) |
Additions to intangible assets | | | | (72 | ) | (44 | ) | (173 | ) | (130 | ) |
Net (acquisition) disposal of short-term investments | | | | (306 | ) | 83 | | (425 | ) | 166 | |
Other | | | | 7 | | 7 | | 16 | | 98 | |
| | | | (1,417 | ) | (923 | ) | (3,329 | ) | (2,363 | ) |
| | | | | | | | | | | |
Financing activities | | | | | | | | | | | |
Issuance of long-term debt | | | | 1,597 | | 661 | | 1,597 | | 1,675 | |
Repayment of long-term debt | | | | (610 | ) | (611 | ) | (1,682 | ) | (1,233 | ) |
Cash receipts arising from credit risk management | | | | 1,256 | | 954 | | 3,869 | | 3,726 | |
Cash payments arising from credit risk management | | | | (1,304 | ) | (1,548 | ) | (3,903 | ) | (3,724 | ) |
Net change in borrowings | | | | 3 | | (319 | ) | 314 | | 468 | |
Dividend paid | | | | – | | – | | (645 | ) | (1,958 | ) |
Other | | | | (11 | ) | (98 | ) | 75 | | (99 | ) |
| | | | 931 | | (961 | ) | (375 | ) | (1,145 | ) |
| | | | | | | | | | | |
Foreign currency effect on cash and cash equivalents | | | | (3 | ) | (5 | ) | 3 | | (4 | ) |
| | | | | | | | | | | |
Net change in cash and cash equivalents | | | | 269 | | (1,050 | ) | (385 | ) | (282 | ) |
| | | | | | | | | | | |
Cash and cash equivalents, beginning of period | | | | 1,529 | | 2,145 | | 2,183 | | 1,377 | |
| | | | | | | | | | | |
Cash and cash equivalents, end of period | | | | 1,798 | | 1,095 | | 1,798 | | 1,095 | |
| | | | | | | | | | | |
Supplementary cash flow information | | 7 | | | | | | | | | |
The accompanying notes are an integral part of the consolidated financial statements.
Page 6 | Third Quarter 2013 |
CONSOLIDATED STATEMENTS OF COMPREHENSIVE INCOME
In millions of Canadian dollars
(unaudited) | | Three months ended
September 30 | | Nine months ended
September 30 | |
| | 2013 | | | 2012 | | 2013 | | | 2012 | |
| | | | | | | | | | | |
Net result | | 312 | | | (1,457 | ) | 2,136 | | | 265 | |
| | | | | | | | | | | |
Other comprehensive income | | | | | | | | | | | |
Change in deferred (losses) gains on items designated as cash flow hedges | | (47 | ) | | (123 | ) | (53 | ) | | 102 | |
Reclassification to operations of deferred gains on items designated as cash flow hedges | | (63 | ) | | (68 | ) | (83 | ) | | (210 | ) |
| | (110 | ) | | (191 | ) | (136 | ) | | (108 | ) |
| | | | | | | | | | | |
Comprehensive income | �� | 202 | | | (1,648 | ) | 2,000 | | | 157 | |
The accompanying notes are an integral part of the consolidated financial statements.
NOTES TO CONSOLIDATED FINANCIAL STATEMENTS
(UNAUDITED)
For the three- and nine-month periods ended September 30, 2013 and 2012
Amounts shown in tables are in millions of Canadian dollars.
Note 1 Basis of Presentation
The Canadian Accounting Standards Board has authorized rate-regulated entities to defer the adoption of International Financial Reporting Standards until January 1, 2015. Since Hydro-Québec was entitled to exercise this deferral right, it opted to prepare its 2013 and 2012 financial statements in accordance with Canadian generally accepted accounting principles as set forth in Part V of the CPA Canada Handbook, “Pre-Changeover Accounting Standards.”
Hydro-Québec’s consolidated financial statements also reflect the decisions of the Régie de l’énergie (the “Régie”). These decisions may affect the timing of the recognition of certain transactions in the consolidated operations, resulting in the recognition of regulatory assets and liabilities, which Hydro-Québec considers it is likely to recover or settle subsequently through the rate-setting process.
The quarterly consolidated financial statements, including these notes, do not contain all the required information regarding annual consolidated financial statements and should therefore be read in conjunction with the consolidated financial statements and accompanying notes in Hydro-Québec’s Annual Report 2012.
The accounting policies used to prepare the quarterly consolidated financial statements are consistent with those presented in Hydro-Québec’s Annual Report 2012.
Hydro-Québec’s quarterly results are not necessarily indicative of results for the year on account of seasonal temperature fluctuations. Because of higher electricity demand during winter months, revenue from electricity sales in Québec is higher during the first and fourth quarters.
Note 2 Effects of Rate Regulation on the Consolidated Financial Statements
Distribution
In decision D-2013-043 of March 22, 2013, the Régie authorized an across-the-board increase of 2.41% in Hydro-Québec’s electricity rates, effective April 1, 2013. The authorized return on the rate base was set at 6.38%, assuming a capitalization with 35% equity.
In decision D-2013-037 of March 12, 2013, the Régie asked the Distributor to recognize in a separate account any variance between the actual amount of the expense related to the activities of the Bureau de l’efficacité et de l’innovation énergétiques and the amount provided in rate cases for this item. As at September 30, 2013, no amount had been recognized in this account.
Note 3 Revenue
| | Three months ended
September 30 | | Nine months ended
September 30 | |
| | 2013 | | 2012 | | 2013 | | 2012 | |
| | | | | | | | | |
Electricity salesa | | 2,590 | | 2,538 | | 9,136 | | 8,635 | |
Other | | 61 | | 81 | | 210 | | 371 | |
| | 2,651 | | 2,619 | | 9,346 | | 9,006 | |
a) Including unbilled electricity deliveries, which totaled $686 million as at September 30, 2013 ($678 million as at September 30, 2012).
Page 8 | Third Quarter 2013 |
Note 4 Depreciation and Amortization
| | Three months ended
September 30 | | Nine months ended
September 30 | |
| | 2013 | | 2012 | | 2013 | | 2012 | |
| | | | | | | | | |
Property, plant and equipment | | 520 | | 495 | | 1,538 | | 1,516 | |
Intangible assets | | 68 | | 61 | | 202 | | 181 | |
Regulatory assets | | 5 | | 4 | | 17 | | 15 | |
Retirement of capital assets | | 12 | | 16 | | 30 | | 28 | |
| | 605 | | 576 | a | 1,787 | | 1,740 | a |
a) The depreciation and amortization expense presented in the consolidated statements of cash flows for the three- and nine-month periods ended September 30, 2012, includes amounts of $5 million and $14 million, respectively, for assets related to discontinued operations. These assets were impaired in their entirety in the third quarter of 2012.
Note 5 Financial Expenses
| | Three months ended
September 30 | | Nine months ended
September 30 | |
| | 2013 | | 2012 | | 2013 | | 2012 | |
Interest on debt securities | | 651 | | 657 | | 1,934 | | 1,927 | |
Net exchange loss (gain) | | 7 | | 5 | | (12) | | 5 | |
Guarantee fees related to debt securities | | 50 | | 50 | | 150 | | 148 | |
| | 708 | | 712 | | 2,072 | | 2,080 | |
Less | | | | | | | | | |
Capitalized financial expenses | | 81 | | 84 | | 222 | | 231 | |
Net investment income | | 7 | | 7 | | 20 | | 20 | |
| | 88 | | 91 | | 242 | | 251 | |
| | 620 | | 621 | | 1,830 | | 1,829 | |
Note 6 Discontinued Operations
In September 2012, the decision was made to abandon the project to refurbish Gentilly-2 nuclear generating station and to terminate all nuclear power operations. The facility continued to generate electricity until the end of 2012, in accordance with the terms and conditions of its operating licence, after which time Hydro-Québec started to prepare it for dormancy with a view to dismantling it around the year 2060.
The abandonment of the refurbishment project led to the write-off of the property, plant and equipment under construction for this project and to the impairment of the assets related to the facility.
Gentilly-2’s operating result is presented under discontinued operations in the consolidated statements of operations for all periods concerned.
Note 7 Supplementary Cash Flow Information
| | Three months ended
September 30 | | Nine months ended
September 30 | |
| | 2013 | | 2012 | | 2013 | | 2012 | |
| | | | | | | | | |
Change in non-cash working capital items | | | | | | | | | |
Accounts receivable and other receivables | | 341 | | 290 | | 131 | | 231 | |
Materials, fuel and supplies | | 10 | | 12 | | (9) | | 11 | |
Accounts payable and accrued liabilities | | (36) | | (49 | ) | (230) | | (350 | ) |
Accrued interest | | (367) | | (356 | ) | (371) | | (423 | ) |
| | (52) | | (103 | ) | (479) | | (531 | ) |
| | | | | | | | | |
Investing activities not affecting cash | | | | | | | | | |
Increase in property, plant and equipment and intangible assets | | 14 | | 631 | | 94 | | 679 | |
| | | | | | | | | |
Interest paid | | 857 | | 822 | | 1,901 | | 1,841 | |
Note 8 Employee Future Benefits
| | | | | | Three months ended
September 30 | |
| | Pension Plan | | Other plans | |
| | 2013 | | 2012 | | 2013 | | 2012 | |
| | | | | | | | | |
Accrued benefit cost recognized | | 78 | | 51 | | 30 | | 28 | |
| | | | | | | | | |
| | | | | | Nine months ended September 30 | |
| | Pension Plan | | Other plans | |
| | 2013 | | 2012 | | 2013 | | 2012 | |
| | | | | | | | | |
Accrued benefit cost recognized | | 232 | | 153 | | 92 | | 84 | |
| | | | | | | | | |
Page 10 | Third Quarter 2013 |
Note 9 Segmented Information
The following tables contain information related to operations and assets by segment:
| | | | | | | | | | | | Three months ended
September 30, 2013 | |
| | | | | | | | | | | | | | | |
| | | | | | | | | | | | | | | |
| | Generation | | Transmission | | Distribution | | Construction | | Corporate
and Other
Activities | | Intersegment
eliminations
and
adjustments | | Total | |
Revenue | | | | | | | | | | | | | | | |
External customers | | 405 | | (14 | ) | 2,252 | | – | | 8 | | – | | 2,651 | |
Intersegment customers | | 990 | | 753 | | 20 | | 696 | | 385 | | (2,844 | ) | – | |
Result from continuing operations | | 303 | | 124 | | (157 | ) | – | | 49 | | – | | 319 | |
Result from discontinued operations | | (7 | ) | – | | – | | – | | – | | – | | (7 | ) |
Net result | | 296 | | 124 | | (157 | ) | – | | 49 | | – | | 312 | |
Total assets as at September 30, 2013 | | 31,745 | | 19,931 | | 13,300 | | 452 | | 6,245 | | (182 | ) | 71,491 | |
| | | | | | | | | | | | Three months ended
September 30, 2012 | |
| | | | | | | | | | | | | | | |
| | | | | | | | | | | | | | | |
| | Generation | | Transmission | | Distribution | | Construction | | Corporate
and Other
Activities | | Intersegment
eliminations
and
adjustments | | Total | |
Revenue | | | | | | | | | | | | | | | |
External customers | | 403 | | 24 | | 2,178 | | – | | 8 | | 6 | ª | 2,619 | |
Intersegment customers | | 984 | | 754 | | 19 | | 635 | | 358 | | (2,750 | ) | – | |
Result from continuing operations | | 280 | | 161 | | (125 | ) | – | | 60 | | – | | 376 | |
Result from discontinued operations | | (1,824 | ) | (9 | ) | – | | – | | – | | – | | (1,833 | ) |
Net result | | (1,544 | ) | 152 | | (125 | ) | – | | 60 | | – | | (1,457 | ) |
Total assets as at September 30, 2012 | | 31,039 | | 18,863 | | 12,828 | | 422 | | 6,098 | | (211 | ) | 69,039 | |
a) Resales of excess supply by Hydro-Québec Distribution on outside markets are presented as offsets of electricity purchases rather than in Revenue.
Third Quarter 2013 | Page 11 |
Note 9 Segmented Information (continued)
| | | | | | | | | | | | Nine months ended
September 30, 2013 | |
| | | | | | | | | | | | | | | |
| | Generation | | Transmission | | Distribution | | Construction | | Corporate
and Other
Activities | | Intersegment
eliminations
and
adjustments | | Total | |
Revenue | | | | | | | | | | | | | | | |
External customers | | 1,204 | | 26 | | 8,117 | | – | | (1 | ) | – | | 9,346 | |
Intersegment customers | | 3,589 | | 2,250 | | 59 | | 1,756 | | 1,107 | | (8,761 | ) | – | |
Result from continuing operations | | 1,414 | | 416 | | 231 | | – | | 62 | | – | | 2,123 | |
Result from discontinued operations | | 13 | | – | | – | | – | | – | | – | | 13 | |
Net result | | 1,427 | | 416 | | 231 | | – | | 62 | | – | | 2,136 | |
Total assets as at September 30, 2013 | | 31,745 | | 19,931 | | 13,300 | | 452 | | 6,245 | | (182 | ) | 71,491 | |
| | | | | | | | | | | | Nine months ended
September 30, 2012 | |
| | | | | | | | | | | | | | | |
| | Generation | | Transmission | | Distribution | | Construction | | Corporate
and Other
Activities | | Intersegment
eliminations
and
adjustments | | Total | |
Revenue | | | | | | | | | | | | | | | |
External customers | | 1,043 | | 84 | | 7,842 | | – | | 31 | | 6 | ª | 9,006 | |
Intersegment customers | | 3,483 | | 2,247 | | 56 | | 1,551 | | 1,061 | | (8,398 | ) | – | |
Result from continuing operations | | 1,208 | | 476 | | 346 | | – | | 91 | | – | | 2,121 | |
Result from discontinued operations | | (1,847 | ) | (9 | ) | – | | – | | – | | – | | (1,856 | ) |
Net result | | (639 | ) | 467 | | 346 | | – | | 91 | | – | | 265 | |
Total assets as at September 30, 2012 | | 31,039 | | 18,863 | | 12,828 | | 422 | | 6,098 | | (211 | ) | 69,039 | |
a) Resales of excess supply by Hydro-Québec Distribution on outside markets are presented as offsets of electricity purchases rather than in Revenue.
Note 10 Comparative Information
Some corresponding period data of the previous year have been reclassified to conform to the presentation adopted in the current periods.
Page 12 | Third Quarter 2013 |
CONSOLIDATED FINANCIAL HIGHLIGHTS
(UNAUDITED)
Amounts shown in tables are in millions of Canadian dollars.
| | Three months ended
September 30 | | Nine months ended
September 30 | |
Summary of Operations | | 2013 | | 2012 | | | Change (%) | | 2013 | | 2012 | | | Change (%) | |
Revenue | | 2,651 | | 2,619 | | | 1.2 | Û | | 9,346 | | 9,006 | | | 3.8 | Û | |
Expenditure | | 1,712 | | 1,622 | | | 5.5 | Û | | 5,393 | | 5,056 | | | 6.7 | Û | |
Financial expenses | | 620 | | 621 | | | 0.2 | Ü | | 1,830 | | 1,829 | | | 0.1 | Û | |
Result from continuing operations | | 319 | | 376 | | | 15.2 | Ü | | 2,123 | | 2,121 | | | 0.1 | Û | |
Result from discontinued operations | | (7) | | (1,833) | | | 99.6 | Û | | 13 | | (1,856) | | | – | Û | |
Net result | | 312 | | (1,457) | | | – | Û | | 2,136 | | 265 | | | – | Û | |
| | | | | | | | | | | | | | | |
Highlights of Continuing Operations
|
Note: Throughout the Consolidated Financial Highlights, certain comparative figures have been reclassified to conform to the presentation adopted in the current periods. |
Third Quarter 2013 | Page 13 |
| | Quarter Highlights |
| | |
Distribution | | 2014–2015 rate adjustment application In August 2013, Hydro-Québec Distribution filed an application with the Régie de l’énergie for a 3.4% adjustment in electricity rates, effective April 1, 2014. The main reasons for the adjustment are the costs related to wind energy purchase contracts and indexing the price of the heritage pool. However, Hydro-Québec will offset some of these additional costs with $160 million in efficiency gains. At the request of the Régie de l’énergie, the division incorporated into its rate case, in September 2013, an application to review its rate of return that it had previously submitted as a separate file. The purpose of the review is to bring the Distributor’s rate of return in line with that of similar companies in Québec and elsewhere in North America. The review would have a 2.4% impact on electricity rates, bringing the overall adjustment requested to 5.8%. Hydro-Québec also proposed the implementation of a sharing mechanism that would enable customers to benefit from its future cost reductions. The Régie de l’énergie’s ruling is expected in early 2014. |
| | |
| | |
Transmission | | 2013 and 2014 rate application from the Transmission Provider In August 2013, Hydro-Québec TransÉnergie filed its 2013 and 2014 rate application with the Régie de l’énergie. This application seeks the approval of revenue requirements and changes to transmission service rates. The projected revenue requirements amount to $2,924.7 million for 2013. For 2014, they total $3,219.0 million when the request for a return rate revision that the division has previously submitted is factored in. The Régie de l’énergie’s ruling is expected in early 2014. In the meantime, the revenue requirements for 2013 are provisionally maintained at the same level as in 2012, i.e., $2,991.6 million. |
Hydro-Québec, 75, boul. René-Lévesque Ouest, Montréal (Québec) H2Z 1A4 |
Ce document est également publié en français. |
www.hydroquebec.com |
ISSN 0848-5836 |