Exhibit 99.4

Third Quarter 2014
| | Message from the Chairman of the Board |
| | and the President and Chief Executive Officer |
| | |
| | |
| | |
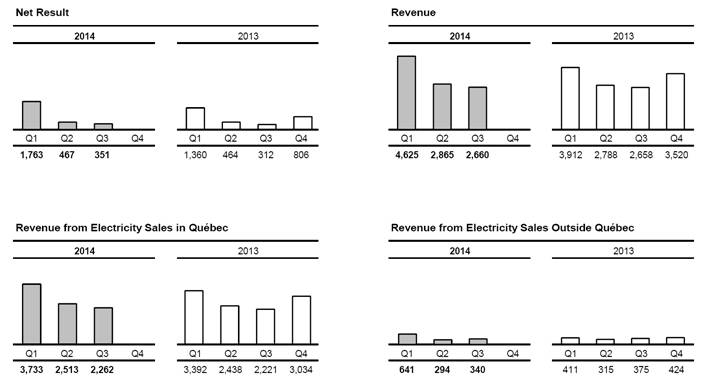
Third quarter | | For the third quarter of 2014, Hydro-Québec posted a net result of $351 million, compared to $312 million in 2013. This $39-million increase is mainly due to a decrease in financial expenses. |
| | |
| | |
Summary of operations for the first three quarters | | For the nine months ended September 30, 2014, Hydro-Québec’s net result totaled $2,581 million, or $445 million more than the $2,136 million recorded in 2013. This increase is mainly due to the very cold temperatures in winter 2014, which led to growth in Hydro-Québec Production’s net electricity exports as well as in the Québec market’s contribution. |
| | |
| | |
Consolidated operations for the first three quarters | | Revenue totaled $10,150 million, compared to $9,358 million a year earlier. Revenue from electricity sales in Québec amounted to $8,508 million, or $457 million more than in 2013, mainly because of the very cold temperatures in winter 2014 and the April 1, 2013 and 2014 rate adjustments. This increase was mitigated, however, by a decline in revenue from special contracts with certain large industrial customers in Québec. |
| | |
| | Revenue from electricity sales on markets outside Québec was $1,275 million, compared to $1,101 million in 2013. This $174-million increase is due to growth in Hydro-Québec Production’s export revenue as a result of the very cold temperatures that drove up market prices in 2014. |
| | |
| | Other revenue totaled $367 million, a $161-million increase compared to 2013 that is mainly related to amounts due to Hydro-Québec for the additional supply costs incurred in winter 2014. |
| | |
| | Total expenditure amounted to $5,749 million, or $342 million more than in 2013. Electricity and fuel purchases increased by $343 million because of a $403-million rise in electricity supplies purchased by Hydro-Québec Distribution from third parties. Of this amount, $163 million was allocated to wind power purchases and $214 million went toward meeting ad hoc requirements stemming from the very cold temperatures in winter 2014. |
Segmented operations for the first three quarters | | Generation Hydro-Québec Production recorded a net result of $1,798 million, compared to $1,427 million in 2013. This $371-million increase is due to the very cold temperatures in winter 2014. Net electricity exports generated $214 million more than last year as a result of higher market prices. The Québec market’s contribution increased by $129 million, mainly because of the additional peak supplies provided by Hydro-Québec Production to Hydro-Québec Distribution. |
| | |
| | |
| | Transmission |
| | |
| | Hydro-Québec TransÉnergie’s net result amounted to $514 million, a $98-million increase over 2013 that is partly due to a $67-million increase in revenue from native-load transmission service following a decision handed down by the Régie de l’énergie. It is also owing to the fact that last year, the division had recorded a $38-million adjustment related to its 2013 rate case. |
| | |
| | |
| | Distribution |
| | |
| | Hydro-Québec Distribution posted a net result of $157 million, compared to $231 million in 2013. Revenue from electricity sales increased by $556 million due to the very cold temperatures in winter 2014 and the April 1, 2013 and 2014 rate adjustments. Other revenue also increased, mainly on account of the amounts due to Hydro-Québec for the additional supply costs incurred in winter 2014. Net electricity purchases and the related transmission costs rose by $707 million, primarily because of temperatures. Supplies from third parties thus increased by $403 million due to wind power purchases and ad hoc winter requirements, while supplies from Hydro-Québec Production increased by $252 million. |
| | |
| | |
| | Construction |
| | |
| | The Construction segment includes activities related to the projects carried out by Hydro-Québec Équipement et services partagés and by Société d’énergie de la Baie James (SEBJ). |
| | |
| | The volume of activity at Hydro-Québec Équipement et services partagés and SEBJ totaled $1,660 million, compared to $1,756 million in 2013. Projects under way for Hydro-Québec Production include ongoing construction of the Romaine hydroelectric complex. Work in progress for Hydro-Québec TransÉnergie includes expansion of the transmission system in the Minganie region, the addition of a 735/315-kV section and related work at Bout-de-l’Île substation as well as various projects stemming from continued investment in asset sustainment. |
| |
Page 2 | Third Quarter 2014 |
Investment | | In the first nine months of 2014, Hydro-Québec invested $2,725 million in property, plant and equipment and intangible assets, compared to $2,920 million in 2013. |
| | |
| | Most of Hydro-Québec Production’s investments were allocated to the construction of the Romaine complex. |
| | |
| | Hydro-Québec TransÉnergie continued investing in its transmission system. As part of its growth projects, it continued construction of Romaine-2 substation and the 735-kV line that will connect it to Arnaud substation. The division also carried out maintenance and improvement activities to ensure the long-term operability of its transmission assets. |
| | |
| | Hydro-Québec Distribution kept up investments to handle the growth of its Québec customer base and to ensure the long-term operability of its facilities. |
| | |
| | |
Financing | | During the third quarter of 2014, Hydro-Québec issued variable-rate notes for a total amount of $1.0 billion, maturing in 2019. This borrowing was made on the Canadian market. |
| | |
| | The funds will be used to support part of the investment program and to refinance maturing debt. |
| | |
| | | |
| | | |
| | Michael D. Penner | Thierry Vandal |
| | | |
| | Chairman of the Board | President and Chief Executive Officer |
| | | |
| | November 14, 2014 | |
CONSOLIDATED FINANCIAL STATEMENTS
(UNAUDITED)
CONSOLIDATED STATEMENTS OF OPERATIONS
In millions of Canadian dollars
(unaudited) | | | | Three months ended
September 30 | | Nine months ended
September 30 | |
| | Notes | | 2014 | | 2013 | | 2014 | | 2013 | |
Revenue | | 3 | | 2,660 | | 2,658 | | 10,150 | | 9,358 | |
| | | | | | | | | | | |
Expenditure | | | | | | | | | | | |
Operations | | | | 544 | | 566 | | 1,724 | | 1,790 | |
Electricity and fuel purchases | | | | 335 | | 320 | | 1,440 | | 1,097 | |
Depreciation and amortization | | 4 | | 607 | | 603 | | 1,843 | | 1,783 | |
Taxes | | | | 230 | | 230 | | 742 | | 737 | |
| | | | 1,716 | | 1,719 | | 5,749 | | 5,407 | |
| | | | | | | | | | | |
Operating result | | | | 944 | | 939 | | 4,401 | | 3,951 | |
Financial expenses | | 5 | | 593 | | 620 | | 1,820 | | 1,828 | |
| | | | | | | | | | | |
Result from continuing operations | | | | 351 | | 319 | | 2,581 | | 2,123 | |
Result from discontinued operations | | | | – | | (7 | ) | – | | 13 | |
| | | | | | | | | | | |
Net result | | | | 351 | | 312 | | 2,581 | | 2,136 | |
CONSOLIDATED STATEMENTS OF RETAINED EARNINGS
In millions of Canadian dollars
(unaudited) | | Three months ended
September 30 | | Nine months ended
September 30 | |
| | 2014 | | 2013 | | 2014 | | 2013 | |
| | | | | | | | | |
Balance, beginning of period | | 17,798 | | 16,657 | | 15,568 | | 14,833 | |
Net result | | 351 | | 312 | | 2,581 | | 2,136 | |
| | | | | | | | | |
Balance, end of period | | 18,149 | | 16,969 | | 18,149 | | 16,969 | |
The accompanying notes are an integral part of the consolidated financial statements.
Page 4 | Third Quarter 2014 |
CONSOLIDATED BALANCE SHEETS
In millions of Canadian dollars
(unaudited) | | As at September 30, 2014 | | As at December 31, 2013 | |
| | | | | |
ASSETS | | | | | |
Current assets | | | | | |
Cash and cash equivalents | | 920 | | 1,695 | |
Short-term investments | | 1,293 | | 1,689 | |
Accounts receivable and other receivables | | 1,887 | | 2,177 | |
Derivative instruments | | 627 | | 883 | |
Regulatory assets | | 177 | | 1 | |
Materials, fuel and supplies | | 192 | | 194 | |
| | 5,096 | | 6,639 | |
| | | | | |
Property, plant and equipment | | 60,226 | | 59,077 | |
Intangible assets | | 2,238 | | 2,323 | |
Investments | | 155 | | 146 | |
Derivative instruments | | 786 | | 659 | |
Regulatory assets | | 417 | | 8 | |
Other assets | | 4,346 | | 4,258 | |
| | | | | |
| | 73,264 | | 73,110 | |
| | | | | |
LIABILITIES | | | | | |
Current liabilities | | | | | |
Borrowings | | 819 | | 23 | |
Accounts payable and accrued liabilities | | 1,840 | | 2,229 | |
Dividend payable | | – | | 2,207 | |
Accrued interest | | 504 | | 890 | |
Asset retirement obligations | | 114 | | 118 | |
Derivative instruments | | 446 | | 576 | |
Current portion of long-term debt | | 1,569 | | 1,157 | |
| | 5,292 | | 7,200 | |
| | | | | |
Long-term debt | | 42,590 | | 43,067 | |
Asset retirement obligations | | 787 | | 834 | |
Derivative instruments | | 917 | | 1,295 | |
Other liabilities | | 1,504 | | 1,067 | |
Perpetual debt | | 267 | | 253 | |
| | 51,357 | | 53,716 | |
EQUITY | | | | | |
| | | | | |
Share capital | | 4,374 | | 4,374 | |
| | | | | |
Retained earnings | | 18,149 | | 15,568 | |
Accumulated other comprehensive income | | (616) | | (548 | ) |
| | 17,533 | | 15,020 | |
| | | | | |
| | 21,907 | | 19,394 | |
| | | | | |
| | 73,264 | | 73,110 | |
The accompanying notes are an integral part of the consolidated financial statements.
On behalf of the Board of Directors, | |
| |
/s/ Jacques Leblanc | /s/ Michael D. Penner |
Chair of the Audit Committee | Chairman of the Board |
CONSOLIDATED STATEMENT OF CASH FLOWS
In millions of Canadian dollars
(unaudited) | | Three months ended
September 30 | Nine months ended
September 30 |
| Notes | 2014 | 2013 | 2014 | 2013 |
Operating activities | | | | | |
Net result | | 351 | 312 | 2,581 | 2,136 |
Adjustments to determine net cash flows from operating activities | | | | | |
Depreciation and amortization | 4 | 607 | 603 | 1,843 | 1,783 |
Amortization of premiums, discounts and issue expenses related to debt securities | | 37 | 33 | 108 | 115 |
Other | | (268) | (35) | (99) | 59 |
Change in non-cash working capital items | 6 | 433 | (49) | (642) | (446) |
Net change in accrued benefit assets and liabilities | | 93 | (107) | 4 | (331) |
| | 1,253 | 757 | 3,795 | 3,316 |
Investing activities | | | | | |
Additions to property, plant and equipment | | (977) | (1,046) | (2,579) | (2,747) |
Additions to intangible assets | | (47) | (72) | (146) | (173) |
Acquisition of investments | | – | – | (1) | – |
Net (acquisition) disposal of short-term investments | | (253) | (306) | 409 | (425) |
Other | | 4 | 7 | (5) | 16 |
| | (1,273) | (1,417) | (2,322) | (3,329) |
Financing activities | | | | | |
Issuance of long-term debt | | 999 | 1,597 | 1,011 | 1,597 |
Repayment of long-term debt | | (868) | (610) | (2,023) | (1,682) |
Cash receipts arising from credit risk management | | 654 | 1,256 | 2,380 | 3,869 |
Cash payments arising from credit risk management | | (671) | (1,304) | (2,237) | (3,903) |
Net change in borrowings | | (1,006) | 4 | 762 | 314 |
Dividend paid | | – | – | (2,207) | (645) |
Other | | 19 | (10) | 59 | 75 |
| | (873) | 933 | (2,255) | (375) |
Foreign currency effect on cash and cash equivalents | | 7 | (3) | 7 | 3 |
Net change in cash and cash equivalents | | (886) | 270 | (775) | (385) |
Cash and cash equivalents, beginning of period | | 1,806 | 1,528 | 1,695 | 2,183 |
Cash and cash equivalents, end of period | | 920 | 1,798 | 920 | 1,798 |
Supplementary cash flow information | 6 | | | | |
The accompanying notes are an integral part of the consolidated financial statements.
Page 6 | Third Quarter 2014 |
CONSOLIDATED STATEMENTS OF COMPREHENSIVE INCOME
In millions of Canadian dollars
(unaudited) | | Three months ended
September 30 | Nine months ended
September 30 |
| | 2014 | 2013 | 2014 | 2013 |
Net result | | 351 | 312 | 2,581 | 2,136 |
Other comprehensive income | | | | | |
Change in deferred gains (losses) on items designated as cash flow hedges | | 73 | (47) | (195) | (53) |
Reclassification to operations of deferred (gains) losses on items designated as cash flow hedges | | (74) | (63) | 127 | (83) |
| | (1) | (110) | (68) | (136) |
Comprehensive income | | 350 | 202 | 2,513 | 2,000 |
The accompanying notes are an integral part of the consolidated financial statements.
NOTES TO CONSOLIDATED FINANCIAL STATEMENTS
(UNAUDITED)
For the three- and nine-month periods ended September 30, 2014 and 2013
Amounts shown in tables are in millions of Canadian dollars.
Note 1 Basis of Presentation
As authorized by the Canadian Accounting Standards Board, Hydro-Québec opted to prepare its 2014 and 2013 consolidated financial statements in accordance with Canadian generally accepted accounting principles as set forth in Part V of the CPA Canada Handbook, “Pre-Changeover Accounting Standards.” As of January 1, 2015, Hydro-Québec’s consolidated financial statements will be prepared in accordance with United States generally accepted accounting principles.
Hydro-Québec’s consolidated financial statements also reflect the decisions of the Régie de l’énergie (the Régie). These decisions may affect the timing of the recognition of certain transactions in the consolidated operations, resulting in the recognition of regulatory assets and liabilities, which Hydro-Québec considers it is likely to recover or settle subsequently through the rate-setting process.
The quarterly consolidated financial statements, including these notes, do not contain all the required information regarding annual consolidated financial statements and should therefore be read in conjunction with the consolidated financial statements and accompanying notes in Hydro-Québec’s Annual Report 2013.
The accounting policies used to prepare the quarterly consolidated financial statements are consistent with those presented in Hydro-Québec’s Annual Report 2013.
Hydro-Québec’s quarterly results are not necessarily indicative of results for the year on account of seasonal temperature fluctuations. Because of higher electricity demand during winter months, revenue from electricity sales in Québec is higher during the first and fourth quarters.
Note 2 Effects of Rate Regulation on the Consolidated Financial Statements
Rate of return on equity and earnings sharing mechanism for the treatment of related variances
In decision D-2013-034 of March 4, 2014, the Régie set the Transmission Provider’s and the Distributor’s rate of return on equity for 2014 at 8.20%. The Régie also approved the implementation of an earnings sharing mechanism for the treatment of related variances.
Distribution
In decision D-2014-052 of March 25, 2014, the Régie authorized an average increase of 4.27% in all Hydro-Québec electricity rates except Rate L, for which the increase was set at 3.45%. The new rates are effective as of April 1, 2014. The authorized return on the rate base was set at 7.135%, assuming a capitalization with 35% equity.
In decision D-2014-037 of March 6, 2014, the Régie authorized the Distributor to modify the remaining amortization periods for variances related to 2010, 2011 and 2012 climate conditions to five, six and seven years, respectively, and asked it to continue using a five-year amortization period for the 2008 and 2009 variances as well as for variances recognized in 2013 and subsequent years.
In decision D-2014-086 of May 27, 2014, the Régie authorized an agreement regarding the temporary suspension of deliveries from a generating station. Recognition of the costs related to the suspension is deferred through the creation of a regulatory asset. The Régie also approved that this asset be amortized and the costs related to the suspension agreement be recovered in the rates on an annual basis.
Transmission
In decision D-2014-049 of March 20, 2014, the Régie set Hydro-Québec’s power transmission rates for 2013 and 2014. The authorized return on the rate base was set at 6.497% for 2013 and 7.053% for 2014, assuming a capitalization with 30% equity.
Page 8 | Third Quarter 2014 |
Note 3 Revenue
| Three months ended
September 30 | Nine months ended
September 30 |
| 2014 | 2013 | 2014 | 2013 |
Electricity salesa | 2,602 | 2,596 | 9,783 | 9,152 |
Other | 58 | 62 | 367 | 206 |
| 2,660 | 2,658 | 10,150 | 9,358 |
a) Including unbilled electricity deliveries, which totaled $677 million as at September 30, 2014 ($686 million as at September 30, 2013).
Note 4 Depreciation and Amortization
| Three months ended
September 30 | Nine months ended
September 30 |
| 2014 | 2013 | 2014 | 2013 |
Property, plant and equipment | 523 | 519 | 1,586 | 1,538 |
Intangible assets | 77 | 68 | 231 | 202 |
Regulatory assets | – | 4 | 1 | 13 |
Retirement of capital assets | 7 | 12 | 25 | 30 |
| 607 | 603 | 1,843 | 1,783 |
Note 5 Financial Expenses
|
| Three months ended
September 30 | Nine months ended
September 30 |
| 2014 | 2013 | 2014 | 2013 |
Interest on debt securities | 654 | 653 | 1,947 | 1,935 |
Net exchange (gain) loss | (18) | 7 | (19) | (12) |
Guarantee fees related to debt securities | 51 | 50 | 154 | 150 |
| 687 | 710 | 2,082 | 2,073 |
Less | | | | |
Capitalized financial expenses | 89 | 79 | 243 | 217 |
Net investment income | 5 | 11 | 19 | 28 |
| 94 | 90 | 262 | 245 |
| 593 | 620 | 1,820 | 1,828 |
Note 6 Supplementary Cash Flow Information
| Three months ended
September 30 | Nine months ended
September 30 |
| 2014 | 2013 | 2014 | 2013 |
Change in non-cash working capital items | | | | |
Accounts receivable and other receivables | 811 | 349 | 298 | 158 |
Materials, fuel and supplies | (10) | 10 | 3 | (9) |
Accounts payable and accrued liabilities | (9) | (40) | (534) | (224) |
Accrued interest | (359) | (368) | (409) | (371) |
| 433 | (49) | (642) | (446) |
Investing activities not affecting cash | | | | |
Increase in property, plant and equipment and intangible assets | 204 | 14 | 223 | 94 |
Interest paid | 869 | 857 | 1,948 | 1,901 |
Note 7 Employee Future Benefits
| | | Three months ended
September 30 |
| Pension Plan | Other plans |
| 2014 | 2013 | 2014 | 2013 |
Accrued benefit cost recognized | 73 | 78 | 23 | 30 |
| | | | |
| | | Nine months ended
September 30 |
| Pension Plan | Other plans |
| 2014 | 2013 | 2014 | 2013 |
| | | | |
Accrued benefit cost recognized | 220 | 232 | 70 | 92 |
| | | | |
Page 10 | Third Quarter 2014 |
Note 8 Segmented Information
The following tables contain information related to operations and assets by segment:
| | | | | | | | | | | | | |
| | | | | | | | | | | | Three months ended
September 30, 2014 | |
| | | | | | | | | | | | | |
| | | | | | | | | | | | | |
| | Generation | | Transmission | | Distribution | | Construction | | Corporate
and Other
Activities | | Intersegment
eliminations
and
adjustments | | Total | |
Revenue | | | | | | | | | | | | | | | |
External customers | | 372 | | 26 | | 2,254 | | – | | 8 | | – | | 2,660 | |
Intersegment customers | | 963 | | 790 | | 19 | | 643 | | 379 | | (2,794 | ) | – | |
Result from continuing operations | | 336 | | 179 | | (199 | ) | – | | 35 | | – | | 351 | |
Result from discontinued operations | | – | | – | | – | | – | | – | | – | | – | |
Net result | | 336 | | 179 | | (199 | ) | – | | 35 | | – | | 351 | |
Total assets as at September 30, 2014 | | 32,671 | | 20,708 | | 14,430 | | 444 | | 5,216 | | (205 | ) | 73,264 | |
| | | | | | | | | | | | | |
| | | | | | | | | | | | Three months ended
September 30, 2013 | |
| | | | | | | | | | | | | |
| | | | | | | | | | | | | |
| | Generation | | Transmission | | Distribution | | Construction | | Corporate
and Other
Activities | | Intersegment
eliminations
and
adjustments | | Total | |
Revenue | | | | | | | | | | | | | | | |
External customers | | 411 | | (15 | ) | 2,253 | | – | | 9 | | – | | 2,658 | |
Intersegment customers | | 990 | | 753 | | 20 | | 696 | | 388 | | (2,847 | ) | – | |
Result from continuing operations | | 303 | | 124 | | (157 | ) | – | | 49 | | – | | 319 | |
Result from discontinued operations | | (7 | ) | – | | – | | – | | – | | – | | (7 | ) |
Net result | | 296 | | 124 | | (157 | ) | – | | 49 | | – | | 312 | |
Total assets as at September 30, 2013 | | 31,745 | | 19,931 | | 13,300 | | 452 | | 6,245 | | (182 | ) | 71,491 | |
|
|
|
Third Quarter 2014 | Page 11 |
| | | | | | | | | | | | | | | | |
Note 8 Segmented Information (continued)
| | | | | | | | | | | | | |
| | | | | | | | | | | | Nine months ended
September 30, 2014 | |
| | | | | | | | | | | | | |
| | | | | | | | | | | | | |
| | Generation | | Transmission | | Distribution | | Construction | | Corporate
and Other
Activities | | Intersegment
eliminations
and
adjustments | | Total | |
Revenue | | | | | | | | | | | | | | | |
External customers | | 1,359 | | 98 | | 8,636 | | – | | 57 | | – | | 10,150 | |
Intersegment customers | | 3,718 | | 2,335 | | 62 | | 1,660 | | 1,121 | | (8,896 | ) | – | |
Result from continuing operations | | 1,798 | | 514 | | 157 | | – | | 112 | | – | | 2,581 | |
Result from discontinued operations | | – | | – | | – | | – | | – | | – | | – | |
Net result | | 1,798 | | 514 | | 157 | | – | | 112 | | – | | 2,581 | |
Total assets as at September 30, 2014 | | 32,671 | | 20,708 | | 14,430 | | 444 | | 5,216 | | (205 | ) | 73,264 | |
| | | | | | | | | | | | | |
| | | | | | | | | | | | Nine months ended
September 30, 2013 | |
| | | | | | | | | | | | | |
| | | | | | | | | | | | | |
| | Generation | | Transmission | | Distribution | | Construction | | Corporate
and Other
Activities | | Intersegment
eliminations
and
adjustments | | Total | |
Revenue | | | | | | | | | | | | | | | |
External customers | | 1,220 | | 25 | | 8,114 | | – | | (1 | ) | – | | 9,358 | |
Intersegment customers | | 3,589 | | 2,250 | | 59 | | 1,756 | | 1,117 | | (8,771 | ) | – | |
Result from continuing operations | | 1,414 | | 416 | | 231 | | – | | 62 | | – | | 2,123 | |
Result from discontinued operations | | 13 | | – | | – | | – | | – | | – | | 13 | |
Net result | | 1,427 | | 416 | | 231 | | – | | 62 | | – | | 2,136 | |
Total assets as at September 30, 2013 | | 31,745 | | 19,931 | | 13,300 | | 452 | | 6,245 | | (182 | ) | 71,491 | |
Note 9 Comparative Information
Some corresponding period data of the previous year have been reclassified to conform to the presentation adopted in the current periods.
Page 12 | Third Quarter 2014 |
CONSOLIDATED FINANCIAL HIGHLIGHTS
(UNAUDITED)
Amounts shown in tables are in millions of Canadian dollars.
| | | | | | | | |
| | | | Three months ended
September 30 | | | | Nine months ended
September 30 |
Summary of Operations | | 2014 | | 2013 | | | Change | (%) | | 2014 | | 2013 | | | Change | (%) |
| | | | | | | | | | | | | | | | |
Revenue | | 2,660 | | 2,658 | | | 0.1 | Û | | 10,150 | | 9,358 | | | 8.5 | Û |
Expenditure | | 1,716 | | 1,719 | | | 0.2 | Ü | | 5,749 | | 5,407 | | | 6.3 | Û |
Financial expenses | | 593 | | 620 | | | 4.4 | Ü | | 1,820 | | 1,828 | | | 0.4 | Ü |
Result from continuing operations | | 351 | | 319 | | | 10.0 | Û | | 2,581 | | 2,123 | | | 21.6 | Û |
Result from discontinued operations | | – | | (7) | | | – | Û | | – | | 13 | | | – | Ü |
Net result | | 351 | | 312 | | | 12.5 | Û | | 2,581 | | 2,136 | | | 20.8 | Û |
| | | | | | | | | | | | | | | | |
Note: Throughout the Consolidated Financial Highlights, certain comparative figures have been reclassified to conform to the presentation adopted in the current periods.
Third Quarter 2014 | Page 13 |
| Highlights |
| |
Governance | On October 8, 2014, the Québec Cabinet announced the appointment of Michael D. Penner as Chairman of the Board of Hydro-Québec, effective immediately. A native of Montréal and lawyer by profession, Mr. Penner is the President and Chief Executive Officer of Bonneterie Richelieu (Int’l) and has extensive experience in business, both in Québec and internationally. |
| |
| |
Generation | Québec Superior Court rules in favor of Hydro-Québec |
| |
| Last July, the Québec Superior Court ruled in favor of Hydro-Québec in response to a motion filed by Churchill Falls (Labrador) Corporation Limited [CF(L)Co] to amend its contract with Hydro-Québec. In February 2010, the Newfoundland-based entity had petitioned the Court for permission to reopen the contract in order to negotiate different pricing terms than those agreed upon by the parties in 1969 or, failing that, to terminate the contract. |
| |
Transmission | National Grid to operate Hydro-Québec LineScout technology |
| |
| In September, Hydro-Québec and British utility National Grid signed a licensing agreement for LineScout, a remote-controlled robot designed to inspect high-voltage transmission lines. Under the agreement, National Grid obtains the right to use LineScout technology in the U.K. for a 10-year period. |
| |
Ground
transportation
electrification | TM4, a subsidiary of Hydro-Québec, makes a significant breakthrough in China |
|
Prestolite E-Propulsion Systems (PEPS), the joint venture set up in Beijing by TM4 and Prestolite Electric (Beijing), has made a significant breakthrough in China. More specifically, PEPS recently received orders from major Chinese bus manufacturers for more than 350 SUMO electric motor systems. |
Hydro-Québec, 75, boul. René-Lévesque Ouest, Montréal (Québec) H2Z 1A4 |
Ce document est également publié en français.
www.hydroquebec.com
ISSN 0848-5836 |