EXHIBIT 4

First Quarter 2011
| | |
| | Message from the Chairman of the Board and the President and Chief Executive Officer |
| |
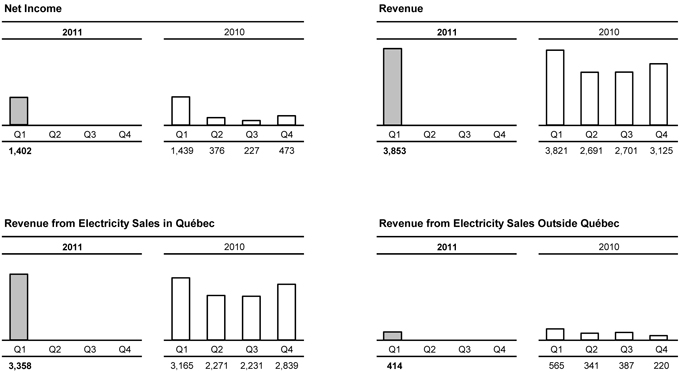
Summary of operations | | Net income totaled $1,402 million, a slight decrease compared to the $1,439 million recorded in first quarter 2010. In the context of colder temperatures in 2011, Hydro-Québec Production reduced its net export volume somewhat in order to meet electricity demand in Québec. |
| |
| Consolidated operations | | Revenue totaled $3,853 million, compared to $3,821 million in 2010. In Québec, revenue from electricity sales amounted to $3,358 million, a $193-million increase over 2010 due essentially to a 2.7-TWh volume increase stemming from the fact that temperatures were close to normal in winter 2011, whereas they had been exceptionally mild in 2010. Revenue from electricity sales on markets outside Québec was $414 million, a $151-million decrease resulting from higher demand for electricity in Québec. |
| |
| | Total expenditure amounted to $1,831 million, or $87 million more than in 2010. It should be mentioned that, in 2010, the mild winter temperatures led to the recognition of a $105-million regulatory asset for revenue variances related to climate conditions, namely the differences between Hydro-Québec Distribution’s actual transmission and distribution revenue and the revenue forecasts established on the basis of the climate normal for rate application purposes. Taxes decreased by $19 million following the abolition of the capital tax in 2011. |
| |
| | Generation |
| |
| Segmented operations | | Hydro-Québec Production posted net income of $782 million, a decrease of $42 million compared to first quarter 2010. The $156-million decrease in net electricity exports was partly offset by a $136-million increase in revenue from electricity sales to Hydro-Québec Distribution on account of the colder temperatures in winter 2011. |
| | |
| | Transmission |
| |
| | Hydro-Québec TransÉnergie’s net income amounted to $135 million, a $3-million decrease from 2010 due, among other things, to a $2-million decrease in revenue from native load transmission service following a decision by the Régie de l’énergie in May 2011. |
| |
| | Distribution |
| |
| | Hydro-Québec Distribution recorded net income of $477 million, which is stable compared to the same period of 2010. Revenue from electricity sales increased because of the colder temperatures in winter 2011. The increase was offset by higher electricity purchases and by the recognition, in 2010, of a regulatory asset for revenue variances related to climate conditions. |
| |
| | Construction |
| |
| | The Construction segment includes activities related to the projects carried out by Hydro-Québec Équipement et services partagés and Société d’énergie de la Baie James. |
| |
| | The volume of activity in this segment totaled $409 million in first quarter 2011, compared to $512 million in 2010. Among the major projects under way for Hydro-Québec Production are Eastmain-1-A/Sarcelle/Rupert and Romaine-2. Work in progress for Hydro-Québec TransÉnergie mainly revolves around connecting new generating facilities and continued investment in asset sustainability projects. |
| |
| Investment | | As at March 31, 2011, investments in property, plant and equipment, intangible assets and the Energy Efficiency Plan totaled $749 million, compared to $825 million in 2010. As expected, a large portion of this amount was devoted to the major capital projects of Hydro-Québec Production, especially the Eastmain-1-A/Sarcelle/Rupert and Romaine-2 hydroelectric developments. |
| |
| | Hydro-Québec TransÉnergie continued investing in its transmission system to integrate new hydroelectric and wind capacity in Québec. It also carried on with its investments in maintenance and improvement to ensure the reliability and long-term operability of its transmission assets and enhance service quality. |
| |
| | Hydro-Québec Distribution kept up investments to handle the growth of its Québec customer base and ensure the quality of its facilities, especially those related to distribution automation. It also continued implementation of the Energy Efficiency Plan. |
| | |
| Page 2 | | First Quarter 2011 |
| | | | |
| Financing | | In January 2011, the reopening of the debenture issue made in January 2009 and maturing in February 2050 raised $0.5 billion at a rate of 4.60%. Hydro-Québec also issued $1.5 billion of floating-rate notes maturing in 2015. These borrowings were all contracted on the Canadian market. |
| |
| | The financing program for 2011 amounts to more than $3.0 billion. The amounts raised will be used to support the investment program and to refinance debt maturing during the year, among other things. |
| | |
| | /s/ Michael L. Turcotte | | /s/Thierry Vandal |
| | |
| | Michael L. Turcotte | | Thierry Vandal |
| | |
| | Chairman of the Board | | President and Chief Executive Officer |
| | May 20, 2011 | | |
| | |
| First Quarter 2011 | | Page 3 |
CONSOLIDATED FINANCIAL STATEMENTS
(UNAUDITED)
CONSOLIDATED STATEMENTS OF OPERATIONS
| | | | | | | | | | | | |
In millions of Canadian dollars (unaudited) | | | | | Three months ended
March 31 | |
| | | | Notes | | | | 2011 | | | | 2010 | |
Revenue | | | | | | | 3,853 | | | | 3,821 | |
Expenditure | | | | | | | | | | | | |
Operations | | | | | | | 599 | | | | 631 | |
Electricity and fuel purchases | | | | | | | 340 | | | | 333 | |
Depreciation and amortization | | | 4 | | | | 615 | | | | 617 | |
Taxes | | | | | | | 253 | | | | 272 | |
Regulatory deferrals | | | | | | | 24 | | | | (109 | ) |
| | | | | | | | 1,831 | | | | 1,744 | |
Operating income | | | | | | | 2,022 | | | | 2,077 | |
Financial expenses | | | 5 | | | | 620 | | | | 638 | |
Net income | | | | | | | 1,402 | | | | 1,439 | |
CONSOLIDATED STATEMENTS OF RETAINED EARNINGS
| | | | | | | | |
In millions of Canadian dollars (unaudited) | | Three months ended
March 31 | |
| | | | 2011 | | | | 2010 | |
Balance, beginning of period | | | 13,965 | | | | 13,336 | |
Net income | | | 1,402 | | | | 1,439 | |
| | |
Balance, end of period | | | 15,367 | | | | 14,775 | |
The accompanying notes are an integral part of the consolidated financial statements.
| | |
| Page 4 | | First Quarter 2011 |
Consolidated Balance Sheets
| | | | | | | | |
In millions of Canadian dollars (unaudited) | | As at March 31,
2011 | | | As at December 31,
2010 | |
ASSETS | | | | | | | | |
Current assets | | | | | | | | |
Cash and cash equivalents | | | 579 | | | | 80 | |
Short-term investments | | | 215 | | | | 1,230 | |
Accounts receivable and other receivables | | | 2,574 | | | | 1,813 | |
Derivative instruments | | | 1,398 | | | | 889 | |
Regulatory assets | | | 58 | | | | 43 | |
Materials, fuel and supplies | | | 297 | | | | 321 | |
| | | | 5,121 | | | | 4,376 | |
Property, plant and equipment | | | 55,659 | | | | 55,512 | |
Goodwill and intangible assets | | | 1,238 | | | | 1,235 | |
Investments | | | 116 | | | | 114 | |
Derivative instruments | | | 958 | | | | 952 | |
Regulatory assets | | | 1,112 | | | | 1,144 | |
Other assets | | | 2,691 | | | | 2,565 | |
| | | | | | | | |
| | | | 66,895 | | | | 65,898 | |
LIABILITIES | | | | | | | | |
Current liabilities | | | | | | | | |
Borrowings | | | 844 | | | | 18 | |
Accounts payable and accrued liabilities | | | 1,847 | | | | 2,017 | |
Dividend payable | | | - | | | | 1,886 | |
Accrued interest | | | 504 | | | | 909 | |
Derivative instruments | | | 435 | | | | 308 | |
Regulatory liabilities | | | 71 | | | | 58 | |
Current portion of long-term debt | | | 1,378 | | | | 1,933 | |
| | | | 5,079 | | | | 7,129 | |
Long-term debt | | | 37,954 | | | | 36,439 | |
Asset retirement obligations | | | 517 | | | | 504 | |
Derivative instruments | | | 2,130 | | | | 2,114 | |
Regulatory liabilities | | | - | | | | 1 | |
Other long-term liabilities | | | 851 | | | | 857 | |
Perpetual debt | | | 275 | | | | 288 | |
| | | | 46,806 | | | | 47,332 | |
EQUITY | | | | | | | | |
Share capital | | | 4,374 | | | | 4,374 | |
Retained earnings | | | 15,367 | | | | 13,965 | |
Accumulated other comprehensive income | | | 348 | | | | 227 | |
| | | 15,715 | | | | 14,192 | |
| | | | 20,089 | | | | 18,566 | |
| | | | 66,895 | | | | 65,898 | |
The accompanying notes are an integral part of the consolidated financial statements.
| | |
| On behalf of the Board of Directors, | | |
| |
| /s/ Jacques Leblanc | | /s/Michael L. Turcotte |
Jacques Leblanc Chair of the Audit Committee | | Michael L. Turcotte Chairman of the Board |
| | |
| First Quarter 2011 | | Page 5 |
CONSOLIDATED STATEMENTS OF CASH FLOWS
| | | | | | | | | | | | |
In millions of Canadian dollars (unaudited) | | | | | Three months ended
March 31 | |
| | | Notes | | | 2011 | | | 2010 | |
Operating activities | | | | | | | | | | | | |
Net income | | | | | | | 1,402 | | | | 1,439 | |
Adjustments to determine net cash flows from operating activities | | | | | | | | | | | | |
Depreciation and amortization | | | 4 | | | | 615 | | | | 617 | |
Amortization of premiums, discounts and issue expenses related to debt securities | | | 5 | | | | 26 | | | | 32 | |
Regulatory deferrals | | | | | | | 24 | | | | (109 | ) |
Other | | | | | | | (52 | ) | | | (92 | ) |
Change in non-cash working capital items | | | 6 | | | | (1,343 | ) | | | (1,128 | ) |
Net change in accrued benefit assets and liabilities | | | | | | | (122 | ) | | | (140 | ) |
| | | | | | | | 550 | | | | 619 | |
Investing activities | | | | | | | | | | | | |
Additions to property, plant and equipment | | | | | | | (687 | ) | | | (775 | ) |
Additions to intangible assets | | | | | | | (28 | ) | | | (17 | ) |
Cash receipts from the government reimbursement for the 1998 ice storm | | | | | | | 2 | | | | 5 | |
Disposal of investments | | | | | | | 1 | | | | - | |
Costs related to Energy Efficiency Plan | | | | | | | (34 | ) | | | (33 | ) |
Net disposal of short-term investments | | | | | | | 1,017 | | | | 1,580 | |
Other | | | | | | | 2 | | | | 1 | |
| | | | | | | | 273 | | | | 761 | |
Financing activities | | | | | | | | | | | | |
Issuance of long-term debt | | | | | | | 1,960 | | | | 534 | |
Repayment of long-term debt | | | | | | | (772 | ) | | | (12 | ) |
Cash receipts arising from credit risk management | | | | | | | 638 | | | | 90 | |
Cash payments arising from credit risk management | | | | | | | (1,092 | ) | | | (259 | ) |
Net change in short-term borrowings | | | | | | | 830 | | | | 643 | |
Dividend paid | | | | | | | (1,886 | ) | | | (2,168 | ) |
| | | | | | | | (322 | ) | | | (1,172 | ) |
Foreign currency effect on cash and cash equivalents | | | | | | | (2 | ) | | | (5 | ) |
Net change in cash and cash equivalents | | | | | | | 499 | | | | 203 | |
Cash and cash equivalents, beginning of period | | | | | | | 80 | | | | 472 | |
Cash and cash equivalents, end of period | | | | | | | 579 | | | | 675 | |
Supplementary cash flow information | | | 6 | | | | | | | | | |
The accompanying notes are an integral part of the consolidated financial statements.
| | |
| Page 6 | | First Quarter 2011 |
CONSOLIDATED STATEMENTS OF COMPREHENSIVE INCOME
| | | | | | | | |
In millions of Canadian dollars (unaudited) | | Three months ended
March 31 | |
| | | 2011 | | | 2010 | |
Net income | | | 1,402 | | | | 1,439 | |
Other comprehensive income | | | | | | | | |
Change in deferred gains on items designated as cash flow hedges | | | 160 | | | | 25 | |
Reclassification to operations of deferred gains on items designated as cash flow hedges | | | (39 | ) | | | (164 | ) |
| | | | 121 | | | | (139 | ) |
Comprehensive income | | | 1,523 | | | | 1,300 | |
The accompanying notes are an integral part of the consolidated financial statements.
| | |
| First Quarter 2011 | | Page 7 |
NOTES TO CONSOLIDATED FINANCIAL STATEMENTS
(UNAUDITED)
For the three-month periods ended March 31, 2011 and 2010
Amounts shown in tables are in millions of Canadian dollars.
| Note 1 | Basis of Presentation |
The consolidated financial statements have been prepared in accordance with Canadian generally accepted accounting principles as set forth in Part V of the Canadian Institute of Chartered Accountants (CICA) Handbook, “Pre-changeover Accounting Standards,” and reflect the decisions of the Régie de l’énergie (the “Régie”). These decisions affect the timing of the recognition of certain transactions in the consolidated operations, resulting in the recognition of regulatory assets and liabilities, which Hydro-Québec considers it is likely to recover or settle subsequently through the rate-setting process. The quarterly consolidated financial statements, including the present notes, do not contain all the required information regarding the audited annual consolidated financial statements and should therefore be read in conjunction with the consolidated financial statements and accompanying notes in Hydro-Québec’s Annual Report 2010.
The accounting policies used to prepare the quarterly consolidated financial statements are consistent with those presented in Hydro-Québec’s Annual Report 2010.
Hydro-Québec’s quarterly results are not necessarily indicative of results for the year on account of seasonal temperature fluctuations. Because of higher electricity demand during winter months, revenue from electricity sales in Québec is higher during the first and fourth quarters.
| Note 2 | Change in Accounting Policy |
Future Change
In February 2008, the Canadian Accounting Standards Board (AcSB) confirmed that publicly accountable enterprises would be required to apply International Financial Reporting Standards (IFRS) in their interim and annual financial statements relating to fiscal years beginning on or after January 1, 2011. In September 2010, the AcSB authorized rate-regulated entities to defer the adoption of IFRS to January 1, 2012. Since Hydro-Québec is entitled to exercise this deferral right, it will present its 2011 financial statements in accordance with Part V of the CICA Handbook, “Pre-changeover Accounting Standards.”
| Note 3 | Effects of Rate Regulation on the Consolidated Financial Statements |
Transmission
In decision D-2011-061 of May 5, 2011, the Régie set Hydro-Québec’s power transmission rates for 2011. The new rates take into account a 7.21% return on the rate base, assuming a capitalization with 30% equity.
Distribution
In decision D-2011-036 of March 31, 2011, the Régie imposed an across-the-board reduction of 0.41% in Hydro-Québec’s electricity rates, effective April 1, 2011. This reduction takes into account a 7.26% return on the rate base, assuming a capitalization with 35% equity.
In decision D-2011-028 of March 9, 2011, the Régie authorized the amortization of an amount of $33 million in 2011 for the 2010 revenue variances related to climate conditions, stipulating that the balance of these variances must be amortized over five years as of 2012, in compliance with decision D-2009-016. An amortization expense of $8 million was recorded in this regard for the three months ended March 31, 2011.
In decisions D-2011-039 and D-2011-028, the Régie also asked the Transmission Provider and the Distributor to recognize in a separate account the variances between the recognized pension cost and the cost authorized in the rate decisions. The amortization terms and conditions for this account have not yet been determined. As at March 31, 2011, an amount of $12 million had been recognized as a regulatory liability.
| | |
| Page 8 | | First Quarter 2011 |
Note 4 Depreciation and Amortization
| | | | | | | | |
| | | Three months ended
March 31 | |
| | | 2011 | | | 2010 | |
Property, plant and equipment | | | 542 | | | | 538 | |
Intangible assets | | | 27 | | | | 24 | |
Regulatory assets and liabilities | | | 45 | | | | 55 | |
Write-offs | | | 1 | | | | - | |
| | | | 615 | | | | 617 | |
Note 5 Financial Expenses
| | | | | | | | |
| | | Three months ended
March 31 | |
| | | 2011 | | | 2010 | |
Interest | | | | | | | | |
Interest on debt securities | | | 619 | | | | 615 | |
Amortization of premiums, discounts and issue expenses related to debt securities | | | 26 | | | | 32 | |
| | | | 645 | | | | 647 | |
Net exchange loss | | | 8 | | | | 10 | |
Guarantee fees related to debt securities | | | 47 | | | | 46 | |
| | | | 55 | | | | 56 | |
Less | | | | | | | | |
Capitalized financial expenses | | | 76 | | | | 63 | |
Net investment income | | | 4 | | | | 2 | |
| | | | 80 | | | | 65 | |
| | | | 620 | | | | 638 | |
Note 6 Supplementary Cash Flow Information
| | | | | | | | |
| | | Three months ended
March 31 | |
| | | 2011 | | | 2010 | |
Change in non-cash working capital items | | | | | | | | |
Accounts receivable and other receivables | | | (764 | ) | | | (548 | ) |
Materials, fuel and supplies | | | 24 | | | | 9 | |
Accounts payable and accrued liabilities | | | (188 | ) | | | (175 | ) |
Accrued interest | | | (415 | ) | | | (414 | ) |
| | | | (1,343 | ) | | | (1,128 | ) |
Investing activities not affecting cash | | | | | | | | |
Increase in property, plant and equipment | | | 13 | | | | 62 | |
Interest paid | | | 944 | | | | 928 | |
| | |
| First Quarter 2011 | | Page 9 |
| Note 7 | Employee Future Benefits |
| | | | | | | | | | | | | | | | |
| | | | | | | | | Three months ended
March 31 | |
| | | Pension Plan | | | Other plans | |
| | | 2011 | | | 2010 | | | 2011 | | | 2010 | |
Accrued benefit cost recognized | | | 30 | | | | 5 | | | | 31 | | | | 29 | |
| Note 8 | Segmented Information |
The following tables contain information related to operations and assets by segment:
| | | | | | | | | | | | | | | | | | | | | | | | | | | | |
| | | | Three months ended March 31, 2011 | |
| | | Generation | | | Transmission | | | Distribution | | | Construction | | | Corporate
and Other
Activities | | | Intersegment
eliminations and
adjustments | | | Total | |
Revenue | | | | | | | | | | | | | | | | | | | | | | | | | | | | |
External customers | | | 454 | | | | 16 | | | | 3,376 | | | | — | | | | 7 | | | | — | | | | 3,853 | |
Intersegment | | | 1,523 | | | | 746 | | | | 20 | | | | 409 | | | | 323 | | | | (3,021 | ) | | | — | |
Net income | | | 782 | | | | 135 | | | | 477 | | | | — | | | | 5 | | | | 3 | | | | 1,402 | |
Total assets as at March 31, 2011 | | | 30,911 | | | | 18,188 | | | | 13,292 | | | | 452 | | | | 4,321 | | | | (269 | ) | | | 66,895 | |
| | | | | | | | | | | | | | | | | | | | | | | | | | | | |
| | | Three months ended March 31, 2010 | |
| | | Generation | | | Transmission | | | Distribution | | | Construction | | | Corporate
and Other
Activities | | | Intersegment
eliminations
and
adjustments | | | Total | |
Revenue | | | | | | | | | | | | | | | | | | | | | | | | | | | | |
External customers | | | 614 | | | | 17 | | | | 3,177 | | | | — | | | | 13 | | | | — | | | | 3,821 | |
Intersegment | | | 1,447 | | | | 768 | | | | 19 | | | | 512 | | | | 323 | | | | (3,069 | ) | | | — | |
Net income (loss) | | | 824 | | | | 138 | | | | 476 | | | | — | | | | (2 | ) | | | 3 | | | | 1,439 | |
Total assets as at March 31, 2010 | | | 29,960 | | | | 17,787 | | | | 12,740 | | | | 431 | | | | 4,233 | | | | (308 | ) | | | 64,843 | |
| Note 9 | Comparative Information |
Some corresponding period data of the previous year have been reclassified to conform to the presentation adopted in the current period, or restated in accordance with the changes to accounting policies described in Note 2 to the consolidated financial statements published in Hydro-Québec’s Annual Report 2010.
| | |
| Page 10 | | First Quarter 2011 |
CONSOLIDATED FINANCIAL HIGHLIGHTS
| | | | | | | | | | | | | | |
In millions of Canadian dollars (unaudited) | | Three months ended
March 31 |
| Summary of Operations | | 2011 | | | 2010 | | | Change (%) |
Revenue | | | 3,853 | | | | 3,821 | | | | 0.8 | | | é |
| | | | |
Expenditure | | | 1,831 | | | | 1,744 | | | | 5.0 | | | é |
| | | | |
Financial expenses | | | 620 | | | | 638 | | | | 2.8 | | | ê |
| | | | |
Net income | | | 1,402 | | | | 1,439 | | | | 2.6 | | | ê |
| | |
| First Quarter 2011 | | Page 11 |
| | |
| | Highlights |
| |
Generation | | A model for environmental integration In its twelfth annual inventory of global electricity production from renewable sources, the Observatoire des énergies renouvelables (Observ’ER) noted that the Eastmain-1-A/ Sarcelle/Rupert project constitutes “a prime example of how to incorporate environmental constraints.” Based in France, Observ’ER is a world reference in the fields of renewable energy and sustainable development. |
| |
Transmission | | Decisions of the Régie de l’énergie In February, the Régie de l’énergie authorized Hydro-Québec TransÉnergie to build Lachenaie substation north of Montréal, to connect it to the grid by looping an existing 315-kV circuit and to perform related work. This $51-million project will help meet long-term demand in the Mille-Îles Est–Lanaudière area. The facilities are scheduled to come on stream in October 2013. Also in February, the Régie gave its approval to the project to rebuild 315/120/25-kV Bélanger substation, to build a 315-kV tap line for this facility, to modify Duvernay, Montréal-Nord and Bout-de-l’Île substations, and to carry out related work on the distribution system. The total cost of the project is $190 million and commissioning is planned for April 2014. In March, the Régie authorized Hydro-Québec TransÉnergie to build 315/120-kV Pierre-Le Gardeur substation. This $87-million project will help meet Hydro-Québec Distribution’s regional load growth. Commissioning is scheduled for October 2014. In May, the Régie set Hydro-Québec TransÉnergie’s power transmission rates and conditions of service for 2011. Among other things, the decision calls for a decrease in revenue from native load transmission service, down to $2,645 million from $2,651 million. |
| |
Distribution | | Decision of the Régie de l’énergie The Régie de l’énergie’s decision for the 2011–2012 rate year calls for an across-the-board reduction of 0.41% in Hydro-Québec Distribution’s rates, effective April 1, 2011. Energy efficiency Hydro-Québec has reached the milestone of 300,000 energy-hungry fridges and freezers collected under the RECYC-FRIGO Environnement™ program. Given the great public response, the program has been extended until the end of 2011. |
| | |
| Page 12 | | First Quarter 2011 |
| | |
| |
Technological innovation | | Partner in excellence L’École de technologie supérieure (ÉTS) paid tribute to Hydro-Québec with an award for its excellence as a partner in research and innovation. Hydro-Québec’s researchers have collaborated with those at the engineering school on numerous projects in such fields as electric grid simulation, atmospheric icing and dielectric materials. In addition, Hydro-Québec Production and Hydro-Québec’s research institute are among the six cofounders of the ÉTS-led Consortium de recherche en fabrication et réparation des roues d’eau [research consortium on runner manufacturing and repair], which was launched in 2011. |
| |
Environment | | Ten years of commitment to the environment Created on March 1, 2001, the Fondation Hydro-Québec pour l’environnement is celebrating 10 years of commitment to the environment in all of Québec’s administrative regions. Over the past decade, it has allocated $9.7 million to 160 projects designed to protect natural environments that are crucial to sustaining plants and wildlife. |
| | |
Hydro-Québec, 75, boul. René-Lévesque Ouest, Montréal (Québec) H2Z 1A4 Ce document est également publié en français. www.hydroquebec.com ISSN 0848-5836 | | |