Exhibit 5

Second Quarter 2011
| | |
| | Message from the Chairman of the Board and the President and Chief Executive Officer |
| |
Summary of operations for the first six months | | For the six months ended June 30, 2011, net income totaled $1,854 million, a $39-million increase compared to the same period last year, mainly due to lower operating expenses. |
| |
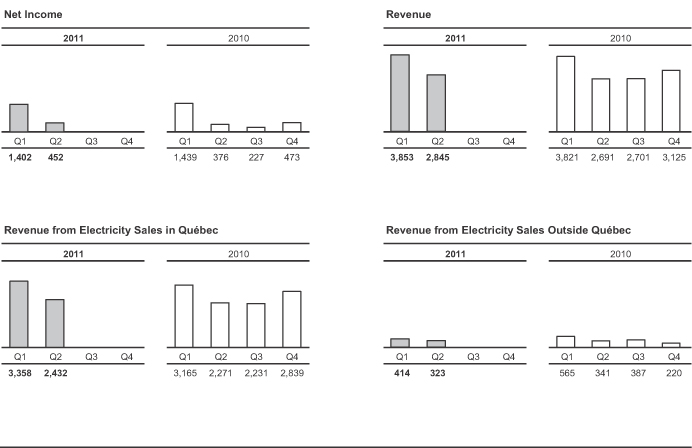
| Second quarter | | In second quarter 2011, net income amounted to $452 million, compared to $376 million in 2010. This $76-million increase stems from growth in electricity sales in Québec as a result of higher demand, mainly from residential and farm customers. |
| |
Consolidated operations for the first six months | | Revenue totaled $6,698 million, compared to $6,512 million in 2010. In Québec, revenue from electricity sales amounted to $5,790 million, or $354 million more than in 2010, essentially because of a 3.7-TWh volume increase resulting from the fact that temperatures were close to normal in the first half of 2011, whereas they had been exceptionally mild in 2010. A 1.8-TWh increase in demand was also a factor. On markets outside Québec, revenue from electricity sales was $737 million, a $169-million decrease due to a lower volume of exports on account of the higher demand in Québec, as well as to market conditions and the appreciation of the Canadian dollar. |
| |
| | Total expenditure amounted to $3,607 million, or $135 million more than in 2010. The $45-million decrease in operating expenses and the $33-million reduction in taxes, following the abolition of the capital tax in 2011, were offset by a $48-million increase in electricity and fuel purchases and by the recognition, in 2010, of a $105-million regulatory asset for revenue variances related to climate conditions. |
| | |
Segmented operations for the first six months | | Generation Hydro-Québec Production posted net income of $1,144 million, or $21 million less than for the first six months of 2010. This decrease stems from a reduction in the volume of net electricity exports as a result of colder temperatures in the first half of 2011 and higher demand in Québec, as well as from market conditions and the appreciation of the Canadian dollar. The decrease in net exports was more than offset, however, by a $205-million increase in revenue from electricity sales to Hydro-Québec Distribution. |
| |
| |
| | Net revenue from Hydro-Québec Distribution’s special contracts with certain large industrial customers in Québec, the terms of which were established some 20 years ago and whose risks are assumed by Hydro-Québec Production, decreased by $46 million. As for operating expenses, they were down $25 million. |
| |
| | Transmission |
| |
| | Hydro-Québec TransÉnergie’s net income amounted to $267 million, a $2-million decrease from 2010 due, among other things, to a $3-million decline in revenue from native load transmission service following a decision by the Régie de l’énergie in May 2011. |
| |
| | Distribution |
| |
| | Hydro-Québec Distribution recorded net income of $431 million, an increase of $57 million over last year. Revenue from electricity sales increased due to the colder temperatures in the first half of 2011 and to higher demand, mainly from residential and farm customers. This increase was mitigated by higher net electricity purchases and by the recognition, in 2010, of a regulatory asset for revenue variances related to climate conditions. |
| |
| | Construction |
| |
| | The Construction segment includes activities related to the projects carried out by Hydro-Québec Équipement et services partagés and Société d’énergie de la Baie James (SEBJ). |
| |
| | Work handled by Hydro-Québec Équipement et services partagés totaled $772 million in the first six months of 2011, compared to $871 million in 2010. Large-scale projects under way for Hydro-Québec Production include Romaine-2, whereas work in progress for Hydro-Québec TransÉnergie revolves around connecting new generating facilities and continued investment in asset sustainment projects, among other things. |
| |
| | As for SEBJ, its volume of activity amounted to $174 million, compared to $359 million last year. The Eastmain-1-A/Sarcelle/Rupert project reached an important milestone with the commissioning of the first generating unit at Eastmain-1-A powerhouse. |
| | |
| Page 2 | | Second Quarter 2011 |
| | |
| Investment | | As at June 30, 2011, investments in property, plant and equipment, intangible assets and the Energy Efficiency Plan totaled $1,691 million, compared to $1,886 million in 2010. As expected, a large portion of this amount was devoted to the major capital projects of Hydro-Québec Production, especially the Eastmain-1-A/Sarcelle/Rupert and Romaine-2 hydroelectric developments. |
| |
| | Hydro-Québec TransÉnergie continued investing in its transmission system to integrate new hydroelectric and wind capacity in Québec. It also carried on with its investments in maintenance and improvement to ensure the reliability and long-term operability of its transmission assets and enhance service quality. |
| |
| | Hydro-Québec Distribution kept up investments to handle the growth of its Québec customer base and ensure the quality of its facilities, especially those related to distribution automation. It also continued implementation of the Energy Efficiency Plan. |
| |
| Financing | | During the second quarter, Hydro-Québec borrowed $1.5 billion. More specifically, variable-rate notes totaling $0.5 billion, due in February 2015, were issued on the Canadian market. In addition, a US$1.0-billion debenture issue bearing interest at 2.00% and maturing in June 2016 was negotiated on the global market in June—Hydro-Québec’s first U.S.-dollar global issue since 2001. These transactions were in addition to the $2.0 billion in borrowings contracted in first quarter 2011. |
| | | | |
| | /s/ Michael L. Turcotte | | /s/ Thierry Vandal |
| | |
| | Michael L. Turcotte | | Thierry Vandal |
| | |
| | Chairman of the Board | | President and Chief Executive Officer |
| | |
| | August 26, 2011 | | |
| | |
| Second Quarter 2011 | | Page 3 |
CONSOLIDATED FINANCIAL STATEMENTS
(UNAUDITED)
CONSOLIDATED STATEMENTS OF OPERATIONS
| | | | | | | | | | | | | | | | | | | | |
In millions of Canadian dollars (unaudited) | | | | | Three months ended
June 30 | | | Six months ended
June 30 | |
| | | Notes | | | 2011 | | | 2010 | | | 2011 | | | 2010 | |
Revenue | | | | | | | 2,845 | | | | 2,691 | | | | 6,698 | | | | 6,512 | |
| | | | | | | | | | | | | | | | | | | | |
Expenditure | | | | | | | | | | | | | | | | | | | | |
Operations | | | | | | | 619 | | | | 632 | | | | 1,218 | | | | 1,263 | |
Electricity and fuel purchases | | | | | | | 296 | | | | 255 | | | | 636 | | | | 588 | |
Depreciation and amortization | | | 4 | | | | 634 | | | | 629 | | | | 1,249 | | | | 1,246 | |
Taxes | | | | | | | 202 | | | | 216 | | | | 455 | | | | 488 | |
Regulatory deferrals | | | | | | | 25 | | | | (4 | ) | | | 49 | | | | (113 | ) |
| | | | | | | | | | | | | | | | | | | | |
| | | | | | | 1,776 | | | | 1,728 | | | | 3,607 | | | | 3,472 | |
| | | | | | | | | | | | | | | | | | | | |
| | | | | |
Operating income | | | | | | | 1,069 | | | | 963 | | | | 3,091 | | | | 3,040 | |
Financial expenses | | | 5 | | | | 617 | | | | 587 | | | | 1,237 | | | | 1,225 | |
| | | | | | | | | | | | | | | | | | | | |
| | | | | |
Net income | | | | | | | 452 | | | | 376 | | | | 1,854 | | | | 1,815 | |
| | | | | | | | | | | | | | | | | | | | |
CONSOLIDATED STATEMENTS OF RETAINED EARNINGS
| | | | | | | | | | | | | | | | |
In millions of Canadian dollars (unaudited) | | Three months ended
June 30 | | | Six months ended
June 30 | |
| | | 2011 | | | 2010 | | | 2011 | | | 2010 | |
Balance, beginning of period | | | 15,367 | | | | 14,775 | | | | 13,965 | | | | 13,336 | |
Net income | | | 452 | | | | 376 | | | | 1,854 | | | | 1,815 | |
| | | | | | | | | | | | | | | | |
| | | | |
Balance, end of period | | | 15,819 | | | | 15,151 | | | | 15,819 | | | | 15,151 | |
| | | | | | | | | | | | | | | | |
The accompanying notes are an integral part of the consolidated financial statements.
| | |
| Page 4 | | Second Quarter 2011 |
CONSOLIDATED BALANCE SHEETS
| | | | | | | | |
In millions of Canadian dollars (unaudited) | | As at June 30,
2011 | | | As at December 31,
2010 | |
ASSETS | | | | | | | | |
Current assets | | | | | | | | |
Cash and cash equivalents | | | 1,270 | | | | 80 | |
Short-term investments | | | 294 | | | | 1,230 | |
Accounts receivable and other receivables | | | 2,124 | | | | 1,813 | |
Derivative instruments | | | 949 | | | | 889 | |
Regulatory assets | | | 48 | | | | 43 | |
Materials, fuel and supplies | | | 291 | | | | 321 | |
| | | | | | | | |
| | | 4,976 | | | | 4,376 | |
| | | | | | | | |
Property, plant and equipment | | | 55,966 | | | | 55,512 | |
Goodwill and intangible assets | | | 1,238 | | | | 1,235 | |
Investments | | | 126 | | | | 114 | |
Derivative instruments | | | 1,029 | | | | 952 | |
Regulatory assets | | | 1,121 | | | | 1,144 | |
Other assets | | | 2,811 | | | | 2,565 | |
| | | | | | | | |
| | | 67,267 | | | | 65,898 | |
| | | | | | | | |
| | |
LIABILITIES | | | | | | | | |
Current liabilities | | | | | | | | |
Borrowings | | | 92 | | | | 18 | |
Accounts payable and accrued liabilities | | | 1,633 | | | | 2,017 | |
Dividend payable | | | — | | | | 1,886 | |
Accrued interest | | | 871 | | | | 909 | |
Derivative instruments | | | 129 | | | | 308 | |
Regulatory liabilities | | | 85 | | | | 58 | |
Current portion of long-term debt | | | 604 | | | | 1,933 | |
| | | | | | | | |
| | | 3,414 | | | | 7,129 | |
| | | | | | | | |
Long-term debt | | | 39,561 | | | | 36,439 | |
Asset retirement obligations | | | 527 | | | | 504 | |
Derivative instruments | | | 2,337 | | | | 2,114 | |
Regulatory liabilities | | | — | | | | 1 | |
Other long-term liabilities | | | 869 | | | | 857 | |
Perpetual debt | | | 266 | | | | 288 | |
| | | | | | | | |
| | | 46,974 | | | | 47,332 | |
| | | | | | | | |
| | |
EQUITY | | | | | | | | |
Share capital | | | 4,374 | | | | 4,374 | |
| | |
Retained earnings | | | 15,819 | | | | 13,965 | |
Accumulated other comprehensive income | | | 100 | | | | 227 | |
| | | | | | | | |
| | | 15,919 | | | | 14,192 | |
| | | | | | | | |
| | | 20,293 | | | | 18,566 | |
| | | | | | | | |
| | | 67,267 | | | | 65,898 | |
| | | | | | | | |
The accompanying notes are an integral part of the consolidated financial statements.
| | |
On behalf of the Board of Directors, | | |
| |
| /s/ Jacques Leblanc | | /s/ Michael L. Turcotte |
Jacques Leblanc Chair of the Audit Committee | | Michael L. Turcotte Chairman of the Board |
| | |
| Second Quarter 2011 | | Page 5 |
CONSOLIDATED STATEMENTS OF CASH FLOWS
| | | | | | | | | | | | | | | | | | | | |
In millions of Canadian dollars (unaudited) | | | | | Three months ended
June 30 | | | Six months ended
June 30 | |
| | | Notes | | | 2011 | | | 2010 | | | 2011 | | | 2010 | |
Operating activities | | | | | | | | | | | | | | | | | | | | |
Net income | | | | | | | 452 | | | | 376 | | | | 1,854 | | | | 1,815 | |
Adjustments to determine net cash flows from operating activities | | | | | | | | | | | | | | | | | | | | |
Depreciation and amortization | | | 4 | | | | 634 | | | | 629 | | | | 1,249 | | | | 1,246 | |
Amortization of premiums, discounts and issue expenses related to debt securities | | | 5 | | | | 25 | | | | 30 | | | | 51 | | | | 62 | |
Regulatory deferrals | | | | | | | 25 | | | | (4 | ) | | | 49 | | | | (113 | ) |
Other | | | | | | | 237 | | | | 20 | | | | 185 | | | | (72 | ) |
Change in non-cash working capital items | | | 6 | | | | 618 | | | | 837 | | | | (725 | ) | | | (291 | ) |
Net change in accrued benefit assets and liabilities | | | | | | | (117 | ) | | | (151 | ) | | | (239 | ) | | | (291 | ) |
| | | | | | | | | | | | | | | | | | | | |
| | | | | | | 1,874 | | | | 1,737 | | | | 2,424 | | | | 2,356 | |
| | | | | | | | | | | | | | | | | | | | |
Investing activities | | | | | | | | | | | | | | | | | | | | |
Additions to property, plant and equipment | | | | | | | (877 | ) | | | (996 | ) | | | (1,564 | ) | | | (1,771 | ) |
Additions to intangible assets | | | | | | | (20 | ) | | | (18 | ) | | | (48 | ) | | | (35 | ) |
Cash receipts from the government reimbursement for the 1998 ice storm | | | | | | | 1 | | | | 1 | | | | 3 | | | | 6 | |
(Acquisition) disposal of investments | | | | | | | (1 | ) | | | 11 | | | | — | | | | 11 | |
Costs related to Energy Efficiency Plan | | | | | | | (45 | ) | | | (47 | ) | | | (79 | ) | | | (80 | ) |
Net (acquisition) disposal of short-term investments | | | | | | | (79 | ) | | | 53 | | | | 938 | | | | 1,633 | |
Other | | | | | | | 5 | | | | 4 | | | | 7 | | | | 5 | |
| | | | | | | | | | | | | | | | | | | | |
| | | | | | | (1,016 | ) | | | (992 | ) | | | (743 | ) | | | (231 | ) |
| | | | | | | | | | | | | | | | | | | | |
Financing activities | | | | | | | | | | | | | | | | | | | | |
Issuance of long-term debt | | | | | | | 1,537 | | | | — | | | | 3,497 | | | | 534 | |
Repayment of long-term debt | | | | | | | (1,244 | ) | | | (444 | ) | | | (2,016 | ) | | | (456 | ) |
Cash receipts arising from credit risk management | | | | | | | 1,156 | | | | 840 | | | | 1,794 | | | | 930 | |
Cash payments arising from credit risk management | | | | | | | (859 | ) | | | (476 | ) | | | (1,951 | ) | | | (735 | ) |
Net change in short-term borrowings | | | | | | | (757 | ) | | | (209 | ) | | | 73 | | | | 434 | |
Dividend paid | | | | | | | — | | | | — | | | | (1,886 | ) | | | (2,168 | ) |
| | | | | | | | | | | | | | | | | | | | |
| | | | | | | (167 | ) | | | (289 | ) | | | (489 | ) | | | (1,461 | ) |
| | | | | | | | | | | | | | | | | | | | |
Foreign currency effect on cash and cash equivalents | | | | | | | — | | | | 7 | | | | (2 | ) | | | 2 | |
| | | | | | | | | | | | | | | | | | | | |
Net change in cash and cash equivalents | | | | | | | 691 | | | | 463 | | | | 1,190 | | | | 666 | |
Cash and cash equivalents, beginning of period | | | | | | | 579 | | | | 675 | | | | 80 | | | | 472 | |
| | | | | | | | | | | | | | | | | | | | |
Cash and cash equivalents, end of period | | | | | | | 1,270 | | | | 1,138 | | | | 1,270 | | | | 1,138 | |
| | | | | | | | | | | | | | | | | | | | |
Supplementary cash flow information | | | 6 | | | | | | | | | | | | | | | | | |
| | | | | | | | | | | | | | | | | | | | |
The accompanying notes are an integral part of the consolidated financial statements.
| | |
| Page 6 | | Second Quarter 2011 |
CONSOLIDATED STATEMENTS OF COMPREHENSIVE INCOME
| | | | | | | | | | | | | | | | |
In millions of Canadian dollars (unaudited) | | Three months ended
June 30 | | | Six months ended
June 30 | |
| | | 2011 | | | 2010 | | | 2011 | | | 2010 | |
Net income | | | 452 | | | | 376 | | | | 1,854 | | | | 1,815 | |
| | | | | | | | | | | | | | | | |
Other comprehensive income | | | | | | | | | | | | | | | | |
Change in deferred (losses) gains on items designated as cash flow hedges | | | (160 | ) | | | 539 | | | | — | | | | 564 | |
Reclassification to operations of deferred gains on items designated as cash flow hedges | | | (88 | ) | | | (91 | ) | | | (127 | ) | | | (255 | ) |
| | | | | | | | | | | | | | | | |
| | | (248 | ) | | | 448 | | | | (127 | ) | | | 309 | |
| | | | | | | | | | | | | | | | |
Comprehensive income | | | 204 | | | | 824 | | | | 1,727 | | | | 2,124 | |
| | | | | | | | | | | | | | | | |
The accompanying notes are an integral part of the consolidated financial statements.
| | |
| Second Quarter 2011 | | Page 7 |
NOTES TO CONSOLIDATED FINANCIAL STATEMENTS
(UNAUDITED)
For the three- and six-month periods ended June 30, 2011 and 2010
Amounts shown in tables are in millions of Canadian dollars.
| Note 1 | Basis of Presentation |
The consolidated financial statements have been prepared in accordance with Canadian generally accepted accounting principles as set forth in Part V of the Canadian Institute of Chartered Accountants (CICA) Handbook, “Pre-changeover Accounting Standards,” and reflect the decisions of the Régie de l’énergie (the “Régie”). These decisions affect the timing of the recognition of certain transactions in the consolidated operations, resulting in the recognition of regulatory assets and liabilities, which Hydro-Québec considers it is likely to recover or settle subsequently through the rate-setting process. The quarterly consolidated financial statements, including the present notes, do not contain all the required information regarding the audited annual consolidated financial statements and should therefore be read in conjunction with the consolidated financial statements and accompanying notes in Hydro-Québec’s Annual Report 2010.
The accounting policies used to prepare the quarterly consolidated financial statements are consistent with those presented in Hydro-Québec’s Annual Report 2010.
Hydro-Québec’s quarterly results are not necessarily indicative of results for the year on account of seasonal temperature fluctuations. Because of higher electricity demand during winter months, revenue from electricity sales in Québec is higher during the first and fourth quarters.
| Note 2 | Change in Accounting Policy |
Future Change
In February 2008, the Canadian Accounting Standards Board (AcSB) confirmed that publicly accountable enterprises would be required to apply International Financial Reporting Standards (IFRS) in their interim and annual financial statements relating to fiscal years beginning on or after January 1, 2011. In September 2010, the AcSB authorized rate-regulated entities to defer the adoption of IFRS to January 1, 2012. Since Hydro-Québec is entitled to exercise this deferral right, it has opted to present its 2011 financial statements in accordance with Part V of the CICA Handbook, “Pre-changeover Accounting Standards.”
| Note 3 | Effects of Rate Regulation on the Consolidated Financial Statements |
Transmission
In decision D-2011-061 of May 5, 2011, the Régie set Hydro-Québec’s power transmission rates for 2011. The new rates take into account a 7.21% return on the rate base, assuming a capitalization with 30% equity.
Distribution
In decision D-2011-036 of March 31, 2011, the Régie imposed an across-the-board reduction of 0.41% in Hydro-Québec’s electricity rates, effective April 1, 2011. This reduction takes into account a 7.26% return on the rate base, assuming a capitalization with 35% equity.
In decision D-2011-028 of March 9, 2011, the Régie authorized the amortization of an amount of $33 million in 2011 for the 2010 revenue variances related to climate conditions, stipulating that the balance of these variances must be amortized over five years as of 2012, in compliance with decision D-2009-016. The impact of decision D-2011-028 on the amortization expense for the three- and six-month periods ended June 30, 2011, totaled $9 million and $17 million, respectively.
In decisions D-2011-039 and D-2011-028, the Régie asked the Transmission Provider and the Distributor to recognize in a separate account the variances between the recognized pension cost and the cost authorized in the rate decisions. The amortization terms and conditions for this account have not yet been determined. As at June 30, 2011, an amount of $26 million had been recognized as a regulatory liability.
In decision D-2011-058 of May 3, 2011, the Régie allowed the Distributor to create an account for deferred expenses bearing interest at the authorized rate on the rate base, in order to recognize certain costs related to the customer systems optimization project. This account will be amortized in 2012. As at June 30, 2011, costs of $7 million had been recognized as a regulatory asset.
| | |
| Page 8 | | Second Quarter 2011 |
| Note 4 | Depreciation and Amortization |
| | | | | | | | | | | | | | | | |
| | | Three months ended
June 30 | | | Six months ended
June 30 | |
| | | 2011 | | | 2010 | | | 2011 | | | 2010 | |
Property, plant and equipment | | | 569 | | | | 550 | | | | 1,111 | | | | 1,088 | |
Intangible assets | | | 26 | | | | 24 | | | | 53 | | | | 48 | |
Regulatory assets and liabilities | | | 38 | | | | 55 | | | | 83 | | | | 110 | |
Write-offs | | | 1 | | | | — | | | | 2 | | | | — | |
| | | | | | | | | | | | | | | | |
| | | 634 | | | | 629 | | | | 1,249 | | | | 1,246 | |
| | | | | | | | | | | | | | | | |
| | | | | | | | | | | | | | | | |
| | | Three months ended
June 30 | | | Six months ended
June 30 | |
| | | 2011 | | | 2010 | | | 2011 | | | 2010 | |
Interest | | | | | | | | | | | | | | | | |
Interest on debt securities | | | 624 | | | | 596 | | | | 1,243 | | | | 1,211 | |
Amortization of premiums, discounts and issue expenses related to debt securities | | | 25 | | | | 30 | | | | 51 | | | | 62 | |
| | | | | | | | | | | | | | | | |
| | | 649 | | | | 626 | | | | 1,294 | | | | 1,273 | |
| | | | | | | | | | | | | | | | |
| | | | |
Net exchange loss (gain) | | | 1 | | | | (14 | ) | | | 9 | | | | (4 | ) |
Guarantee fees related to debt securities | | | 47 | | | | 45 | | | | 94 | | | | 91 | |
| | | | | | | | | | | | | | | | |
| | | 48 | | | | 31 | | | | 103 | | | | 87 | |
| | | | | | | | | | | | | | | | |
Less | | | | | | | | | | | | | | | | |
Capitalized financial expenses | | | 78 | | | | 69 | | | | 154 | | | | 132 | |
Net investment income | | | 2 | | | | 1 | | | | 6 | | | | 3 | |
| | | | | | | | | | | | | | | | |
| | | 80 | | | | 70 | | | | 160 | | | | 135 | |
| | | | | | | | | | | | | | | | |
| | | 617 | | | | 587 | | | | 1,237 | | | | 1,225 | |
| | | | | | | | | | | | | | | | |
| Note 6 | Supplementary Cash Flow Information |
| | | | | | | | | | | | | | | | |
| | | Three months ended
June 30 | | | Six months ended
June 30 | |
| | | 2011 | | | 2010 | | | 2011 | | | 2010 | |
Change in non-cash working capital items | | | | | | | | | | | | | | | | |
Accounts receivable and other receivables | | | 450 | | | | 575 | | | | (314 | ) | | | 27 | |
Materials, fuel and supplies | | | 5 | | | | (1 | ) | | | 29 | | | | 8 | |
Accounts payable and accrued liabilities | | | (200 | ) | | | (121 | ) | | | (388 | ) | | | (296 | ) |
Accrued interest | | | 363 | | | | 384 | | | | (52 | ) | | | (30 | ) |
| | | | | | | | | | | | | | | | |
| | | 618 | | | | 837 | | | | (725 | ) | | | (291 | ) |
| | | | | | | | | | | | | | | | |
Investing activities not affecting cash | | | | | | | | | | | | | | | | |
Increase in property, plant and equipment | | | 12 | | | | 1 | | | | 25 | | | | 63 | |
| | | | | | | | | | | | | | | | |
Interest paid | | | 175 | | | | 169 | | | | 1,119 | | | | 1,097 | |
| | | | | | | | | | | | | | | | |
| | |
| Second Quarter 2011 | | Page 9 |
| Note 7 | Employee Future Benefits |
| | | | | | | | | | | | | | | | |
| | | | | | | | | Three months ended
June 30 | |
| | | Pension Plan | | | Other plans | |
| | | 2011 | | | 2010 | | | 2011 | | | 2010 | |
Accrued benefit cost recognized | | | 30 | | | | 5 | | | | 31 | | | | 28 | |
| | | |
| | | | | | | | | Six months ended
June 30 | |
| | | Pension Plan | | | Other plans | |
| | | 2011 | | | 2010 | | | 2011 | | | 2010 | |
Accrued benefit cost recognized | | | 60 | | | | 10 | | | | 62 | | | | 57 | |
| Note 8 | Segmented Information |
The following tables contain information related to operations and assets by segment:
| | | | | | | | | | | | | | | | | | | | | | | | | | | | |
| | | Three months ended June 30, 2011 | |
| | | Generation | | | Transmission | | | Distribution | | | Construction | | | Corporate
and Other
Activities | | | Intersegment
eliminations
and
adjustments | | | Total | |
Revenue | | | | | | | | | | | | | | | | | | | | | | | | | | | | |
External customers | | | 367 | | | | 18 | | | | 2,453 | | | | — | | | | 7 | | | | — | | | | 2,845 | |
Intersegment | | | 1,122 | | | | 746 | | | | 21 | | | | 537 | | | | 348 | | | | (2,774 | ) | | | — | |
Net income (loss) | | | 362 | | | | 132 | | | | (46 | ) | | | — | | | | 4 | | | | — | | | | 452 | |
Total assets as at June 30, 2011 | | | 31,135 | | | | 18,230 | | | | 12,975 | | | | 451 | | | | 4,743 | | | | (267 | ) | | | 67,267 | |
| | | | | | | | | | | | | | | | | | | | | | | | | | | | |
| |
| | | Three months ended June 30, 2010 | |
| | | Generation | | | Transmission | | | Distribution | | | Construction | | | Corporate
and Other
Activities | | | Intersegment
eliminations
and
adjustments | | | Total | |
Revenue | | | | | | | | | | | | | | | | | | | | | | | | | | | | |
External customers | | | 400 | | | | 15 | | | | 2,261 | | | | — | | | | 8 | | | | 7ª | | | | 2,691 | |
Intersegment | | | 1,043 | | | | 755 | | | | 17 | | | | 718 | | | | 334 | | | | (2,867 | ) | | | — | |
Net income (loss) | | | 341 | | | | 131 | | | | (102 | ) | | | — | | | | 3 | | | | 3 | | | | 376 | |
Total assets as at June 30, 2010 | | | 30,162 | | | | 17,857 | | | | 12,311 | | | | 457 | | | | 4,535 | | | | (327 | ) | | | 64,995 | |
| | | | | | | | | | | | | | | | | | | | | | | | | | | | |
| a) | Resales of excess supply by Hydro-Québec Distribution on outside markets are presented as offsets of electricity purchases rather than in Revenue. |
| | |
| Page 10 | | Second Quarter 2011 |
| Note 8 | Segmented Information (continued) |
| | | | | | | | | | | | | | | | | | | | | | | | | | | | |
| | | Six months ended June 30, 2011 | |
| | | Generation | | | Transmission | | | Distribution | | | Construction | | | Corporate
and Other
Activities | | | Intersegment
eliminations
and
adjustments | | | Total | |
Revenue | | | | | | | | | | | | | | | | | | | | | | | | | | | | |
External customers | | | 821 | | | | 34 | | | | 5,828 | | | | — | | | | 15 | | | | — | | | | 6,698 | |
Intersegment | | | 2,645 | | | | 1,492 | | | | 41 | | | | 946 | | | | 672 | | | | (5,796 | ) | | | — | |
Net income | | | 1,144 | | | | 267 | | | | 431 | | | | — | | | | 9 | | | | 3 | | | | 1,854 | |
Total assets as at June 30, 2011 | | | 31,135 | | | | 18,230 | | | | 12,975 | | | | 451 | | | | 4,743 | | | | (267 | ) | | | 67,267 | |
| | | | | | | | | | | | | | | | | | | | | | | | | | | | |
| |
| | | Six months ended June 30, 2010 | |
| | | Generation | | | Transmission | | | Distribution | | | Construction | | | Corporate
and Other
Activities | | | Intersegment
eliminations
and
adjustments | | | Total | |
Revenue | | | | | | | | | | | | | | | | | | | | | | | | | | | | |
External customers | | | 1,014 | | | | 32 | | | | 5,436 | | | | — | | | | 23 | | | | 7ª | | | | 6,512 | |
Intersegment | | | 2,490 | | | | 1,523 | | | | 36 | | | | 1,230 | | | | 658 | | | | (5,937 | ) | | | — | |
Net income | | | 1,165 | | | | 269 | | | | 374 | | | | — | | | | 1 | | | | 6 | | | | 1,815 | |
Total assets as at June 30, 2010 | | | 30,162 | | | | 17,857 | | | | 12,311 | | | | 457 | | | | 4,535 | | | | (327 | ) | | | 64,995 | |
| | | | | | | | | | | | | | | | | | | | | | | | | | | | |
| a) | Resales of excess supply by Hydro-Québec Distribution on outside markets are presented as offsets of electricity purchases rather than in Revenue. |
| Note 9 | Comparative Information |
Some corresponding period data of the previous year have been reclassified to conform to the presentation adopted in the current period, or restated in accordance with the changes to accounting policies described in Note 2 to the consolidated financial statements published in Hydro-Québec’s Annual Report 2010.
| | |
| Second Quarter 2011 | | Page 11 |
CONSOLIDATED FINANCIAL HIGHLIGHTS
(UNAUDITED)
Amounts shown in tables are in millions of Canadian dollars.
| | | | | | | | | | | | | | | | | | | | | | | | | | | | | | | | |
| | | Three months ended
June 30 | | | Six months ended
June 30 | |
Summary of Operations | | 2011 | | | 2010 | | | Change (%) | | | 2011 | | | 2010 | | | Change (%) | |
| | | | | | | | |
Revenue | | | 2,845 | | | | 2,691 | | | | 5.7 | | | Û | | | | | 6,698 | | | | 6,512 | | | | 2.9 | | | Û | | |
Expenditure | | | 1,776 | | | | 1,728 | | | | 2.8 | | | Û | | | | | 3,607 | | | | 3,472 | | | | 3.9 | | | Û | | |
Financial expenses | | | 617 | | | | 587 | | | | 5.1 | | | Û | | | | | 1,237 | | | | 1,225 | | | | 1.0 | | | Û | | |
Net income | | | 452 | | | | 376 | | | | 20.2 | | | Û | | | | | 1,854 | | | | 1,815 | | | | 2.1 | | | Û | | |
| | |
| Page 12 | | Second Quarter 2011 |
| | |
| | Quarter Highlights |
| |
| Generation | | Commissioning of first unit at Eastmain-1-A powerhouse |
| |
| | In June, the first of three generating units was commissioned at Eastmain-1-A powerhouse. The two other units should come on stream in the second half of 2011. The facility will have a total installed capacity of 768 MW and generate 2.3 TWh per year. |
| |
| | Renewal of Gentilly-2 nuclear generating station’s operating licence |
| |
| | In June, the Canadian Nuclear Safety Commission renewed Gentilly-2 generating station’s operating licence and merged it with the station’s radioactive waste management facility operating licence. The merged licence is valid for a five-year period extending from July 1, 2011, to June 30, 2016. |
| |
| Transmission | | Decisions of the Régie de l’énergie |
| |
| | In May, the Régie de l’énergie authorized a $309-million project to add and modify equipment on the 315-kV transmission system in the Québec–Montréal corridor. More specifically, this infrastructure will be separated from the 735-kV system and reorganized. Hydro-Québec TransÉnergie will thus be able to make better use of existing equipment and develop the transmission grid serving the northeastern part of the Montréal metropolitan region in an optimal, sustainable manner. |
| |
| | In June, the Régie approved a $1.8-billion project to connect the 1,550-MW Romaine complex to Hydro-Québec’s transmission system. Connection of the complex’s four generating stations will be done progressively from 2014 to 2020. |
| |
| | Also in June, the Régie authorized construction of Charlesbourg substation. The aim of this project is to meet long-term load growth on the system supplying the greater city of Québec area and to replace obsolete equipment. Transmission-related construction costs will amount to $94 million, and the substation is slated for commissioning in fall 2014. |
| |
| Distribution | | Rollout of an advanced metering infrastructure |
| |
| | In May, Hydro-Québec Distribution entered a new stage in the deployment of an advanced metering infrastructure by signing a contract with Landis+Gyr for the purchase of the necessary equipment, including 3 million next-generation meters. The new infrastructure, to be rolled out between 2012 and 2017, is expected to generate savings of $300 million over the next 20 years. |
| |
| | Decision of the Régie de l’énergie |
| |
| | In June, the Régie de l’énergie authorized Hydro-Québec Distribution to proceed with the CATVAR (voltage regulation and reactive power control) project, which will generate energy savings of almost 2 TWh by 2015 through the reduction of consumption and energy losses on the distribution system. |
| | |
| Second Quarter 2011 | | Page 13 |
| | |
| | Energy efficiency |
| |
| | In June, the Government of Canada presented Hydro-Québec with its 2011 ENERGY STAR® Market Transformation Award in the Utility of the Year – Provincial category. The ENERGY STAR awards recognize excellence in the promotion of energy-efficient products, technologies and services. |
| |
Technological innovation | | Leadership in wind-power integration In April, three teams at Hydro-Québec’s research institute, IREQ, received an Annual Achievement Award from the Utility Wind Integration Group (UWIG) for their contribution to the development of tools for the simulation, modeling and analysis of power systems integrating large amounts of wind power. The UWIG has over 150 members in Canada, the United States, Europe and Asia. |
| |
| |
Transportation electrification | | First public charging network for plug-in electric vehicles In June, a partnership formed by Hydro-Québec, RONA, Les Rôtisseries St-Hubert, METRO and the Agence métropolitaine de transport (AMT) announced the creation of “The Electric Circuit,” Canada’s first public charging network for plug-in electric vehicles. This infrastructure, which will supply clean, renewable energy, will be rolled out gradually as of 2012 in the parking lots of the founding partners’ business sites and at several AMT park-and-ride facilities. |
| |
Hydro-Québec, 75, boul. René-Lévesque Ouest, Montréal (Québec) H2Z 1A4
Ce document est également publié en français.
www.hydroquebec.com
ISSN 0848-5836