Exhibit 99.6
Third Quarter 2011
| | |
| | Message from the Chairman of the Board and the President and Chief Executive Officer |
| |
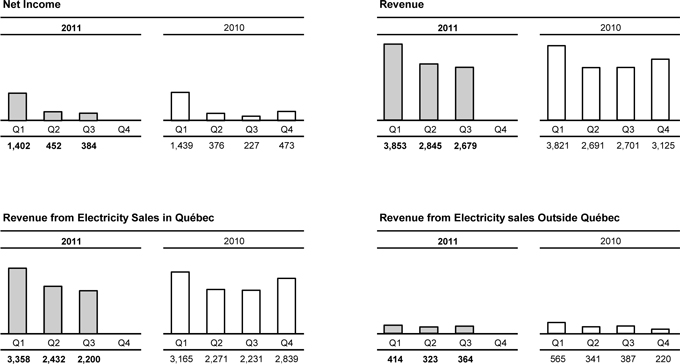
Summary of operations for the first three quarters | | For the nine months ended September 30, 2011, net income totaled $2,238 million, a $196-million increase compared to the same period last year. This rise is due to a $70-million decrease in operating expenses as well as an $82-million increase in electricity sales in Québec as a result of higher demand, mainly from residential customers. |
| |
| Third quarter | | In third quarter 2011, net income amounted to $384 million, compared to $227 million in 2010. This $157-million increase stems from growth in net electricity exports, among other things. It should be noted that in third quarter 2010, Hydro-Québec had to limit its net exports because of well-below-average precipitation levels across its entire hydroelectric generating fleet. The granting of sublicences for the manufacture of rechargeable battery materials generated $22 million in third quarter 2011. As for operating expenses, they were down $25 million. |
| |
Consolidated operations for the first three quarters | | Revenue totaled $9,377 million, compared to $9,213 million in 2010. In Québec, revenue from electricity sales amounted to $7,990 million, or $323 million more than in 2010, essentially because of a 3.6-TWh volume increase resulting from the fact that temperatures were close to normal in 2011, whereas they had been exceptionally mild in 2010. A 0.8-TWh increase in demand was also a factor. On markets outside Québec, revenue from electricity sales was $1,101 million, a $192-million decrease due mainly to the impact of the appreciation of the Canadian dollar. Other revenue totaled $286 million, compared to $253 million in 2010. This $33-million increase was due, among other things, to the revenue generated by the granting of sublicences for the manufacture of rechargeable battery materials. Total expenditure amounted to $5,293 million, which is comparable to the 2010 level. The $70-million decrease in operating expenses as well as the reduction in electricity purchases and capital tax were offset by the impact of regulatory deferrals which, in 2010, included a $105-million asset for revenue variances related to climate conditions. |
| | |
Segmented operations for the first three quarters | | Generation Hydro-Québec Production posted net income of $1,459 million, compared to $1,407 million in 2010. The increase in net electricity exports was offset by the impact of the appreciation of the Canadian dollar. On the other hand, revenue from electricity sales to Hydro-Québec Distribution increased by $169 million. Transmission Hydro-Québec TransÉnergie’s net income amounted to $424 million, a $28-million increase over 2010. The decline in revenue from native load transmission service following a decision by the Régie de l’énergie in May 2011 was more than offset by the reduction in financial expenses. Distribution Hydro-Québec Distribution recorded net income of $266 million, an increase of $28 million over last year. Revenue from electricity sales increased due to colder temperatures in 2011 and to higher demand, mainly from residential customers. This increase was partly offset by higher electricity purchases, net of transmission costs, and by the recognition, in 2010, of a regulatory asset for revenue variances related to climate conditions. Construction The Construction segment includes activities related to the projects carried out by Hydro-Québec Équipement et services partagés and Société d’énergie de la Baie James (SEBJ). Work handled by Hydro-Québec Équipement et services partagés totaled $1,245 million in the first nine months of 2011, compared to $1,352 million in 2010. Large-scale projects under way for Hydro-Québec Production include Romaine-2, while work in progress for Hydro-Québec TransÉnergie revolves around connecting new generating facilities and continued investment in asset sustainment projects, among other things. As for SEBJ, its volume of activity amounted to $244 million, compared to $549 million last year. In June 2011, the Eastmain-1-A/Sarcelle/Rupert project reached an important milestone with the commissioning of the first generating unit at Eastmain-1-A powerhouse. |
| |
| Investment | | As at September 30, 2011, investments in property, plant and equipment, intangible assets and the Energy Efficiency Plan totaled $2,619 million, compared to $2,953 million in 2010. As expected, a large portion of this amount was devoted to the major capital projects of Hydro-Québec Production, especially the Eastmain-1-A/Sarcelle/Rupert and Romaine-2 hydroelectric developments. Hydro-Québec TransÉnergie continued investing in its transmission system to integrate new hydroelectric and wind capacity in Québec. It also carried on with its investments in maintenance and improvement to ensure the reliability and long-term operability of its transmission assets and enhance service quality. Hydro-Québec Distribution kept up investments to handle the growth of its Québec customer base and ensure the quality of its facilities, especially those related to distribution automation. It also continued implementation of the Energy Efficiency Plan. |
| | |
| Page 2 | | Third Quarter 2011 |
| | | | |
| Financing | | In September 2011, bonds maturing in February 2050 were issued on the Canadian market, at the rate of 3.89%. This financing raised $0.6 billion, adding to the $3.5 billion raised in the first half of the year. The funds are being used to refinance maturing debt and to support the investment program. |
| | |
| | /s/ Michael L. Turcotte | | /s/ Thierry Vandal |
| | |
| | Michael L. Turcotte | | Thierry Vandal |
| | |
| | Chairman of the Board | | President and Chief Executive Officer |
| | |
| | November 18, 2011 | | |
| | |
| Third Quarter 2011 | | Page 3 |
CONSOLIDATED FINANCIAL STATEMENTS
(UNAUDITED)
CONSOLIDATED STATEMENTS OF OPERATIONS
| | MMMMM | | | MMMMM | | | | MMMMM | | | | MMMMM | | | | MMMMM | |
In millions of Canadian dollars (unaudited) | | | | Three months ended September 30 | | | Nine months ended
September 30 | |
| | | Notes | | 2011 | | | 2010 | | | 2011 | | | 2010 | |
| | | | | |
Revenue | | | | | 2,679 | | | | 2,701 | | | | 9,377 | | | | 9,213 | |
| | | | | |
Expenditure | | | | | | | | | | | | | | | | | | |
| | | | | |
Operations | | | | | 569 | | | | 594 | | | | 1,787 | | | | 1,857 | |
| | | | | |
Electricity and fuel purchases | | | | | 282 | | | | 370 | | | | 918 | | | | 958 | |
| | | | | |
Depreciation and amortization | | 4 | | | 609 | | | | 656 | | | | 1,858 | | | | 1,902 | |
| | | | | |
Taxes | | | | | 202 | | | | 201 | | | | 657 | | | | 689 | |
| | | | | |
Regulatory deferrals | | | | | 24 | | | | (4 | ) | | | 73 | | | | (117 | ) |
| | | | | |
| | | | | | 1,686 | | | | 1,817 | | | | 5,293 | | | | 5,289 | |
| | | | | |
Operating income | | | | | 993 | | | | 884 | | | | 4,084 | | | | 3,924 | |
| | | | | |
Financial expenses | | 5 | | | 609 | | | | 657 | | | | 1,846 | | | | 1,882 | |
| | | | | |
Net income | | | | | 384 | | | | 227 | | | | 2,238 | | | | 2,042 | |
CONSOLIDATED STATEMENTS OF RETAINED EARNINGS
| | | MMMM | | | | MMMM | | | | MMMM | | | | MMMM | |
In millions of Canadian dollars (unaudited) | | Three months ended
September 30 | | | Nine months ended
September 30 | |
| | | 2011 | | | 2010 | | | 2011 | | | 2010 | |
| | | | |
Balance, beginning of period | | | 15,819 | | | | 15,151 | | | | 13,965 | | | | 13,336 | |
| | | | |
Net income | | | 384 | | | | 227 | | | | 2,238 | | | | 2,042 | |
| | | | |
Balance, end of period | | | 16,203 | | | | 15,378 | | | | 16,203 | | | | 15,378 | |
The accompanying notes are an integral part of the consolidated financial statements.
| | |
| Page 4 | | Third Quarter 2011 |
CONSOLIDATED BALANCE SHEETS
| | | MMMM | | | | MMMM | |
In millions of Canadian dollars (unaudited) | | As at September 30,
2011 | | | As at December 31,
2010 | |
| | |
| ASSETS | | | | | | |
| Current assets | | | | | | |
Cash and cash equivalents | | | 1,683 | | | | 80 | |
Short-term investments | | | 432 | | | | 1,230 | |
Accounts receivable and other receivables | | | 1,641 | | | | 1,813 | |
Derivative instruments | | | 910 | | | | 889 | |
Regulatory assets | | | 38 | | | | 43 | |
Materials, fuel and supplies | | | 260 | | | | 321 | |
| | |
| | | | 4,964 | | | | 4,376 | |
| | |
Property, plant and equipment | | | 56,289 | | | | 55,512 | |
Goodwill and intangible assets | | | 1,228 | | | | 1,235 | |
Investments | | | 124 | | | | 114 | |
Derivative instruments | | | 1,456 | | | | 952 | |
Regulatory assets | | | 1,134 | | | | 1,144 | |
Other assets | | | 2,926 | | | | 2,565 | |
| | | | 68,121 | | | | 65,898 | |
| | |
LIABILITIES | | | | | | | | |
Current liabilities | | | | | | | | |
Borrowings | | | 23 | | | | 18 | |
Accounts payable and accrued liabilities | | | 1,649 | | | | 2,017 | |
Dividend payable | | | - | | | | 1,886 | |
Accrued interest | | | 498 | | | | 909 | |
Derivative instruments | | | 604 | | | | 308 | |
Regulatory liabilities | | | 98 | | | | 58 | |
Current portion of long-term debt | | | 890 | | | | 1,933 | |
| | | | 3,762 | | | | 7,129 | |
| | |
Long-term debt | | | 40,324 | | | | 36,439 | |
Asset retirement obligations | | | 517 | | | | 504 | |
Derivative instruments | | | 1,669 | | | | 2,114 | |
Regulatory liabilities | | | - | | | | 1 | |
Other long-term liabilities | | | 857 | | | | 857 | |
Perpetual debt | | | 287 | | | | 288 | |
| | | | 47,416 | | | | 47,332 | |
| | |
EQUITY | | | | | | | | |
Share capital | | | 4,374 | | | | 4,374 | |
| | |
Retained earnings | | | 16,203 | | | | 13,965 | |
Accumulated other comprehensive income | | | 128 | | | | 227 | |
| | |
| | | 16,331 | | | | 14,192 | |
| | |
| | | | 20,705 | | | | 18,566 | |
| | |
| | | | 68,121 | | | | 65,898 | |
The accompanying notes are an integral part of the consolidated financial statements.
| | |
| |
On behalf of the Board of Directors, | | |
| |
/s/ Jacques Leblanc | | /s/Michael L. Turcotte |
| |
Jacques Leblanc Chair of the Audit Committee | | Michael L. Turcotte Chairman of the Board |
| | |
| Third Quarter 2011 | | Page 5 |
CONSOLIDATED STATEMENTS OF CASH FLOWS
| | MMMM | | | MMMM | | | | MMMM | | | | MMMM | | | | MMMM | |
In millions of Canadian dollars (unaudited) | | | | Three months ended
September 30 | | | Nine months ended
September 30 | |
| | | | | |
| | | Notes | | | 2011 | | | | 2010 | | | | 2011 | | | | 2010 | |
| | | | | |
Operating activities | | | | | | | | | | | | | | | | | | |
| | | | | |
Net income | | | | | 384 | | | | 227 | | | | 2,238 | | | | 2,042 | |
| | | | | |
Adjustments to determine net cash flows from operating activities | | | | | | | | | | | | | | | | | | |
| | | | | |
Depreciation and amortization | | 4 | | | 609 | | | | 656 | | | | 1,858 | | | | 1,902 | |
| | | | | |
Amortization of premiums, discounts and issue expenses related to debt securities | | 5 | | | 29 | | | | 29 | | | | 80 | | | | 91 | |
| | | | | |
Regulatory deferrals | | | | | 24 | | | | (4 | ) | | | 73 | | | | (117 | ) |
| | | | | |
Other | | | | | 12 | | | | 77 | | | | 197 | | | | 5 | |
| | | | | |
Change in non-cash working capital items | | 6 | | | 175 | | | | 111 | | | | (550 | ) | | | (180 | ) |
| | | | | |
Net change in accrued benefit assets and liabilities | | | | | (151 | ) | | | (139 | ) | | | (390 | ) | | | (430 | ) |
| | | | | |
| | | | | | 1,082 | | | | 957 | | | | 3,506 | | | | 3,313 | |
| | | | | |
Investing activities | | | | | | | | | | | | | | | | | | |
| | | | | |
Additions to property, plant and equipment | | | | | (865 | ) | | | (996 | ) | | | (2,429 | ) | | | (2,767 | ) |
| | | | | |
Additions to intangible assets | | | | | (15 | ) | | | (21 | ) | | | (63 | ) | | | (56 | ) |
| | | | | |
Cash receipts from the government reimbursement for the 1998 ice storm | | | | | 2 | | | | 2 | | | | 5 | | | | 8 | |
| | | | | |
Disposal of investments | | | | | - | | | | - | | | | - | | | | 11 | |
| | | | | |
Costs related to Energy Efficiency Plan | | | | | (48 | ) | | | (50 | ) | | | (127 | ) | | | (130 | ) |
| | | | | |
Net (acquisition) disposal of short-term investments | | | | | (141 | ) | | | (303 | ) | | | 797 | | | | 1,330 | |
| | | | | |
Other | | | | | 9 | | | | 2 | | | | 16 | | | | 7 | |
| | | | | |
| | | | | | (1,058 | ) | | | (1,366 | ) | | | (1,801 | ) | | | (1,597 | ) |
| | | | | |
Financing activities | | | | | | | | | | | | | | | | | | |
| | | | | |
Issuance of long-term debt | | | | | 593 | | | | 494 | | | | 4,090 | | | | 1,028 | |
| | | | | |
Repayment of long-term debt | | | | | (609 | ) | | | (186 | ) | | | (2,625 | ) | | | (642 | ) |
| | | | | |
Cash receipts arising from credit risk management | | | | | 1,188 | | | | 667 | | | | 2,982 | | | | 1,597 | |
| | | | | |
Cash payments arising from credit risk management | | | | | (720 | ) | | | (635 | ) | | | (2,671 | ) | | | (1,370 | ) |
| | | | | |
Net change in short-term borrowings | | | | | (70 | ) | | | (260 | ) | | | 3 | | | | 174 | |
| | | | | |
Dividend paid | | | | | - | | | | - | | | | (1,886 | ) | | | (2,168 | ) |
| | | | | |
Other | | | | | (1 | ) | | | (2 | ) | | | (1 | ) | | | (2 | ) |
| | | | | |
| | | | | | 381 | | | | 78 | | | | (108 | ) | | | (1,383 | ) |
| | | | | |
Foreign currency effect on cash and cash equivalents | | | | | 8 | | | | (4 | ) | | | 6 | | | | (2 | ) |
| | | | | |
Net change in cash and cash equivalents | | | | | 413 | | | | (335 | ) | | | 1,603 | | | | 331 | |
| | | | | |
Cash and cash equivalents, beginning of period | | | | | 1,270 | | | | 1,138 | | | | 80 | | | | 472 | |
| | | | | |
Cash and cash equivalents, end of period | | | | | 1,683 | | | | 803 | | | | 1,683 | | | | 803 | |
| | | | | |
Supplementary cash flow information | | 6 | | | | | | | | | | | | | | | | |
The accompanying notes are an integral part of the consolidated financial statements.
| | |
| Page 6 | | Third Quarter 2011 |
CONSOLIDATED STATEMENTS OF COMPREHENSIVE INCOME
| | | MMMMM | | | | MMMMM | | | | MMMMM | | | | MMMMM | |
In millions of Canadian dollars (unaudited) | | Three months ended
September 30 | | | Nine months ended
September 30 | |
| | | | |
| | | | 2011 | | | | 2010 | | | | 2011 | | | | 2010 | |
| | | | |
Net income | | | 384 | | | | 227 | | | | 2,238 | | | | 2,042 | |
| | | | |
Other comprehensive income | | | | | | | | | | | | | | | | |
| | | | |
Change in deferred gains (losses) on items designated as cash flow hedges | | | 104 | | | | (256 | ) | | | 104 | | | | 308 | |
| | | | |
Reclassification to operations of deferred gains on items designated as cash flow hedges | | | (76 | ) | | | (134 | ) | | | (203 | ) | | | (389 | ) |
| | | | |
| | | | 28 | | | | (390 | ) | | | (99 | ) | | | (81 | ) |
| | | | |
Comprehensive income | | | 412 | | | | (163 | ) | | | 2,139 | | | | 1,961 | |
The accompanying notes are an integral part of the consolidated financial statements.
| | |
| Third Quarter 2011 | | Page 7 |
NOTES TO CONSOLIDATED FINANCIAL STATEMENTS
(UNAUDITED)
For the three- and nine-month periods ended September 30, 2011 and 2010
Amounts shown in tables are in millions of Canadian dollars.
| Note 1 | Basis of Presentation |
The consolidated financial statements have been prepared in accordance with Canadian generally accepted accounting principles as set forth in Part V of the Canadian Institute of Chartered Accountants (CICA) Handbook, “Pre-changeover Accounting Standards,” and reflect the decisions of the Régie de l’énergie (the “Régie”). These decisions affect the timing of the recognition of certain transactions in the consolidated operations, resulting in the recognition of regulatory assets and liabilities, which Hydro-Québec considers it is likely to recover or settle subsequently through the rate-setting process. The quarterly consolidated financial statements, including the present notes, do not contain all the required information regarding the audited annual consolidated financial statements and should therefore be read in conjunction with the consolidated financial statements and accompanying notes in Hydro-Québec’s Annual Report 2010.
The accounting policies used to prepare the quarterly consolidated financial statements are consistent with those presented in Hydro-Québec’s Annual Report 2010.
Hydro-Québec’s quarterly results are not necessarily indicative of results for the year on account of seasonal temperature fluctuations. Because of higher electricity demand during winter months, revenue from electricity sales in Québec is higher during the first and fourth quarters.
| Note 2 | Change in Accounting Policy |
Future Change
In February 2008, the Canadian Accounting Standards Board (AcSB) confirmed that publicly accountable enterprises would be required to apply International Financial Reporting Standards (IFRS) in their interim and annual financial statements relating to fiscal years beginning on or after January 1, 2011. In September 2010, the AcSB authorized rate-regulated entities to defer the adoption of IFRS to January 1, 2012. Since Hydro-Québec is entitled to exercise this deferral right, it has opted to present its 2011 financial statements in accordance with Part V of the CICA Handbook, “Pre-changeover Accounting Standards.”
| Note 3 | Effects of Rate Regulation on the Consolidated Financial Statements |
Transmission
In decision D-2011-061 of May 5, 2011, the Régie set Hydro-Québec’s power transmission rates for 2011. The new rates take into account a 7.21% return on the rate base, assuming a capitalization with 30% equity.
Distribution
In decision D-2011-036 of March 31, 2011, the Régie imposed an across-the-board reduction of 0.41% in Hydro-Québec’s electricity rates, effective April 1, 2011. This reduction takes into account a 7.26% return on the rate base, assuming a capitalization with 35% equity.
In decision D-2011-028 of March 9, 2011, the Régie authorized the amortization of an amount of $33 million in 2011 for the 2010 revenue variances related to climate conditions, stipulating that the balance of these variances must be amortized over five years as of 2012, in compliance with decision D-2009-016. The impact of decision D-2011-028 on the amortization expense for the three- and nine-month periods ended September 30, 2011, totaled $8 million and $25 million, respectively.
In decisions D-2011-039 of April 6, 2011 and D-2011-028, the Régie asked the Transmission Provider and the Distributor to recognize in a separate account the variances between the recognized pension cost and the cost authorized in the rate decisions. The amortization terms and conditions for this account have not yet been determined. As at September 30, 2011, an amount of $39 million had been recognized as a regulatory liability.
In decision D-2011-058 of May 3, 2011, the Régie allowed the Distributor to create an account for deferred expenses bearing interest at the authorized rate on the rate base, in order to recognize certain costs related to the customer systems optimization project. This account will be amortized in 2012. As at September 30, 2011, costs of $8 million had been recognized as a regulatory asset.
| | |
| Page 8 | | Third Quarter 2011 |
Note 4 Depreciation and Amortization
| | | MMMM | | | | MMMM | | | | MMMM | | | | MMMM | |
| | | Three months ended
September 30 | | | Nine months ended
September 30 | |
| | | 2011 | | | 2010 | | | 2011 | | | 2010 | |
| | | | |
Property, plant and equipment | | | 543 | | | | 570 | | | | 1,654 | | | | 1,658 | |
Intangible assets | | | 28 | | | | 24 | | | | 81 | | | | 72 | |
Regulatory assets and liabilities | | | 38 | | | | 55 | | | | 121 | | | | 165 | |
Write-offs | | | - | | | | 7 | | | | 2 | | | | 7 | |
| | | | 609 | | | | 656 | | | | 1,858 | | | | 1,902 | |
Note 5 Financial Expenses
| | | MMMM | | | | MMMM | | | | MMMM | | | | MMMM | |
| | | Three months ended
September 30 | | | Nine months ended
September 30 | |
| | | 2011 | | | 2010 | | | 2011 | | | 2010 | |
| | | | |
Interest | | | | | | | | | | | | | | | | |
Interest on debt securities | | | 630 | | | | 651 | | | | 1,873 | | | | 1,862 | |
Amortization of premiums, discounts and issue expenses related to debt securities | | | 29 | | | | 29 | | | | 80 | | | | 91 | |
| | | | 659 | | | | 680 | | | | 1,953 | | | | 1,953 | |
| | | | |
Net exchange (gain) loss | | | (21 | ) | | | 7 | | | | (12 | ) | | | 3 | |
Guarantee fees related to debt securities | | | 47 | | | | 46 | | | | 141 | | | | 137 | |
| | | | 26 | | | | 53 | | | | 129 | | | | 140 | |
Less | | | | | | | | | | | | | | | | |
Capitalized financial expenses | | | 72 | | | | 73 | | | | 226 | | | | 205 | |
Net investment income | | | 4 | | | | 3 | | | | 10 | | | | 6 | |
| | | | 76 | | | | 76 | | | | 236 | | | | 211 | |
| | | | 609 | | | | 657 | | | | 1,846 | | | | 1,882 | |
Note 6 Supplementary Cash Flow Information
| | | MMMM | | | | MMMM | | | | MMMM | | | | MMMM | |
| | | Three months ended
September 30 | | | Nine months ended
September 30 | |
| | | 2011 | | | 2010 | | | 2011 | | | 2010 | |
Change in non-cash working capital items | | | | | | | | | | | | | | | | |
Accounts receivable and other receivables | | | 488 | | | | 413 | | | | 174 | | | | 440 | |
Materials, fuel and supplies | | | 31 | | | | (1 | ) | | | 60 | | | | 7 | |
Accounts payable and accrued liabilities | | | 36 | | | | 66 | | | | (352 | ) | | | (230 | ) |
Accrued interest | | | (380 | ) | | | (367 | ) | | | (432 | ) | | | (397 | ) |
| | | | 175 | | | | 111 | | | | (550 | ) | | | (180 | ) |
Investing activities not affecting cash | | | | | | | | | | | | | | | | |
Increase in property, plant and equipment | | | 24 | | | | 8 | | | | 49 | | | | 71 | |
Interest paid | | | 920 | | | | 891 | | | | 2,039 | | | | 1,988 | |
| | |
| Third Quarter 2011 | | Page 9 |
Note 7 Employee Future Benefits
| | | | | | | | | | | | | | | | |
| | | Three months ended September 30 | |
| | |
| | | Pension Plan | | | Other plans | |
| | | 2011 | | | 2010 | | | 2011 | | | 2010 | |
| | | | |
Accrued benefit cost | | | 31 | | | | 6 | | | | 22 | | | | 28 | |
| | | | | | | | | | | | | | | | |
| | | Nine months ended September 30 | |
| | |
| | | Pension Plan | | | Other plans | |
| | | 2011 | | | 2010 | | | 2011 | | | 2010 | |
| | | | |
Accrued benefit cost | | | 91 | | | | 16 | | | | 84 | | | | 85 | |
Note 8 Segmented Information
The following tables contain information related to operations and assets by segment:
| | | | | | | | | | | | | | | | | | | | | | | | | | | | |
| | | Three months ended September 30, 2011 | |
| | | | | | | |
| | | Generation | | | Transmission | | | Distribution | | | Construction | | | Corporate
and Other
Activities | | | Intersegment
eliminations
and
adjustments | | | Total | |
| | | | | | | |
Revenue | | | | | | | | | | | | | | | | | | | | | | | | | | | | |
| | | | | | | |
External customers | | | 403 | | | | 17 | | | | 2,225 | | | | - | | | | 34 | | | | - | | | | 2,679 | |
| | | | | | | |
Intersegment | | | 1,029 | | | | 750 | | | | 17 | | | | 543 | | | | 346 | | | | (2,685 | ) | | | - | |
| | | | | | | |
Net income (loss) | | | 315 | | | | 157 | | | | (165 | ) | | | - | | | | 77 | | | | - | | | | 384 | |
| | | | | | | |
Total assets as at September 30, 2011 | | | 31,239 | | | | 18,321 | | | | 12,642 | | | | 446 | | | | 5,727 | | | | (254 | ) | | | 68,121 | |
| | | | | | | | | | | | | | | | | | | | | | | | | | | | |
| | | Three months ended September 30, 2010 | |
| | | | | | | |
| | | Generation | | | Transmission | | | Distribution | | | Construction | | | Corporate
and Other
Activities | | | Intersegment
eliminations
and
adjustments | | | Total | |
| | | | | | | |
Revenue | | | | | | | | | | | | | | | | | | | | | | | | | | | | |
| | | | | | | |
External customers | | | 431 | | | | 17 | | | | 2,241 | | | | - | | | | 5 | | | | 7a | | | | 2,701 | |
| | | | | | | |
Intersegment | | | 1,031 | | | | 764 | | | | 15 | | | | 671 | | | | 331 | | | | (2,812 | ) | | | - | |
| | | | | | | |
Net income (loss) | | | 242 | | | | 127 | | | | (136 | ) | | | - | | | | (9 | ) | | | 3 | | | | 227 | |
| | | | | | | |
Total assets as at September 30, 2010 | | | 30,370 | | | | 17,935 | | | | 12,173 | | | | 467 | | | | 4,362 | | | | (327 | ) | | | 64,980 | |
a) Resales of excess supply by Hydro-Québec Distribution on outside markets are presented as offsets of electricity purchases rather than in Revenue.
| | |
| Page 10 | | Third Quarter 2011 |
Note 8 Segmented Information (continued)
| | | | | | | | | | | | | | | | | | | | | | | | | | | | |
| | | Nine months ended September 30, 2011 | |
| | | Generation | | | Transmission | | | Distribution | | | Construction | | | Corporate
and Other
Activities | | | Intersegment
eliminations
and
adjustments | | | Total | |
| | | | | | | |
Revenue | | | | | | | | | | | | | | | | | | | | | | | | | | | | |
| | | | | | | |
External customers | | | 1,224 | | | | 51 | | | | 8,053 | | | | - | | | | 49 | | | | - | | | | 9,377 | |
| | | | | | | |
Intersegment | | | 3,674 | | | | 2,242 | | | | 55 | | | | 1,489 | | | | 1,023 | | | | (8,483 | ) | | | - | |
| | | | | | | |
Net income | | | 1,459 | | | | 424 | | | | 266 | | | | - | | | | 86 | | | | 3 | | | | 2,238 | |
| | | | | | | |
Total assets as at September 30, 2011 | | | 31,239 | | | | 18,321 | | | | 12,642 | | | | 446 | | | | 5,727 | | | | (254 | ) | | | 68,121 | |
| | | | | | | | | | | | | | | | | | | | | | | | | | | | |
| | |
| | | Nine months ended September 30, 2010 | |
| | | | | | | |
| | | Generation | | | Transmission | | | Distribution | | | Construction | | | Corporate
and Other
Activities | | | Intersegment
eliminations
and
adjustments | | | Total | |
| | | | | | | |
Revenue | | | | | | | | | | | | | | | | | | | | | | | | | | | | |
| | | | | | | |
External customers | | | 1,445 | | | | 49 | | | | 7,680 | | | | - | | | | 25 | | | | 14 | a | | | 9,213 | |
| | | | | | | |
Intersegment | | | 3,521 | | | | 2,287 | | | | 51 | | | | 1,901 | | | | 994 | | | | (8,754 | ) | | | - | |
| | | | | | | |
Net income (loss) | | | 1,407 | | | | 396 | | | | 238 | | | | - | | | | (8 | ) | | | 9 | | | | 2,042 | |
| | | | | | | |
Total assets as at September 30, 2010 | | | 30,370 | | | | 17,935 | | | | 12,173 | | | | 467 | | | | 4,362 | | | | (327 | ) | | | 64,980 | |
a) Resales of excess supply by Hydro-Québec Distribution on outside markets are presented as offsets of electricity purchases rather than in Revenue.
Note 9 Comparative Information
Some corresponding period data of the previous year have been reclassified to conform to the presentation adopted in the current period, or restated in accordance with the changes to accounting policies described in Note 2 to the consolidated financial statements published in Hydro-Québec’s Annual Report 2010.
| | |
| Third Quarter 2011 | | Page 11 |
CONSOLIDATED FINANCIAL HIGHLIGHTS
(UNAUDITED)
Amounts shown in tables are in millions of Canadian dollars.
| | MMMM | | MMMM | | | MMMM | | | | MMMM | | | | MMMM | | | | MMMM | | | | MMMM | | | | MMMM | | | | MMMM | | | | MMMM | |
| | | Three months ended September 30 | | | Nine months ended September 30 | |
Summary of Operations | | | 2011 | | | | 2010 | | | | Change (%) | | | | 2011 | | | | 2010 | | | | Change (%) | |
| | | | | | | | |
Revenue | | | 2,679 | | | | 2,701 | | | | 0.8 | | | i | | | | | 9,377 | | | | 9,213 | | | | 1.8 | | | h | | |
| | | | | | | | |
Expenditure | | | 1,686 | | | | 1,817 | | | | 7.2 | | | i | | | | | 5,293 | | | | 5,289 | | | | 0.1 | | | h | | |
| | | | | | | | |
Financial expenses | | | 609 | | | | 657 | | | | 7.3 | | | i | | | | | 1,846 | | | | 1,882 | | | | 1.9 | | | i | | |
| | | | | | | | |
Net income | | | 384 | | | | 227 | | | | 69.2 | | | h | | | | | 2,238 | | | | 2,042 | | | | 9.6 | | | h | | |
| | |
| Page 12 | | Third Quarter 2011 |
| | |
| | Quarter Highlights |
| |
| Transmission | | Application to amend the Open Access Transmission Tariff In August, Hydro-Québec TransÉnergie filed its 2012 rate application with the Régie de l’énergie. The application essentially seeks the approval of revenue requirements and changes to transmission service rates, effective January 1, 2012. Revenue requirements amount to $3,080.6 million, which is $71.2 million more than the revenue approved by the Régie for 2011. |
| |
| Distribution | | Régie de l’énergie decision In July, the Régie de l’énergie authorized Hydro-Québec Distribution to build a new thermal generating station in Akulivik, an Inuit village in Nunavik, to replace the existing one. The new facility will be equipped with three generating units, for a total capacity of 2,028 kW. Project costs will run to $49.4 million. Rate adjustment application In August, Hydro-Québec Distribution filed an application with the Régie de l’énergie for a rate adjustment of 1.7%, effective April 1, 2012. |
| |
Technological innovation | | Granting of lithium metal phosphate sublicences In July, Hydro-Québec, Université de Montréal and the Centre national de la recherche scientifique [France’s national centre for scientific research], co-owners of the rights to key patents on lithium metal phosphate (LMP), including lithium iron phosphate (LFP), announced that they had broadened the base for the international marketing of these battery materials, in conjunction with Munich-based Süd-Chemie AG. The co-owners can now grant sublicences to LMP manufacturers capable of meeting market demand with quality products. Contracts have already been signed with Japanese entities Sumitomo Osaka Cement Co., Ltd. and Mitsui Engineering & Shipbuilding Co., Ltd. as well as with Taiwanese companies Tatung Fine Chemicals Co., Ltd. and Advanced Lithium Electrochemistry Co., Ltd. The latter has undertaken to build a plant in Québec. Süd-Chemie is already building a plant in Candiac through its subsidiary Phostech Lithium Inc. |
| |
| Transportation electrification | | Request for proposals to supply charging stations In August, Hydro-Québec launched a request for proposals for the purchase of 120 charging stations for electric vehicles on behalf of the partners of “The Electric Circuit,” namely RONA, Les Rôtisseries St-Hubert, METRO, the Agence métropolitaine de transport (AMT) and Hydro-Québec. The winning bidder will be announced by the end of 2011. The charging stations will supply clean, renewable energy to the public beginning in winter 2012. They will be installed at business locations designated by Hydro-Québec’s partners and at several AMT park-and-ride facilities. First all-electric vehicles available for carsharing in Québec In August, Communauto, Hydro-Québec and Nissan Canada announced that Communauto’s customers now have access to 15 Nissan LEAFs—nine in Montréal and six in the city of Québec. By early 2012, the number of cars available will reach 50. This represents the largest fleet of all-electric vehicles to be part of a carsharing service in North America. |
| | |
| Third Quarter 2011 | | Page 13 |
Hydro-Québec, 75, boul. René-Lévesque Ouest, Montréal (Québec) H2Z 1A4
Ce document est également publié en français.
www.hydroquebec.com
ISSN 0848-5836