Exhibit 99.2

First Quarter 2015
| | |
| | Message from the Chairman of the Board and the Acting President and Chief Executive Officer |
| |
| Summary of results | | For a second consecutive year, Hydro-Québec posted a net result of $1.8 billion in the first quarter. Thanks to the skillful deployment of the company’s sales programs and the solid performance of its generating and transmission facilities in a context marked by very cold winter temperatures, the net result totaled $1,788 million in 2015, compared to $1,750 million in 2014. This $38-million increase is due in part to growth in Hydro-Québec Production’s net electricity exports. |
| |
Consolidated results | | Revenue totaled $4,600 million, compared to $4,616 million a year earlier. |
| |
| | Revenue from electricity sales in Québec amounted to $3,989 million, or $263 million more than in 2014, partly because of the very cold temperatures in winter 2015. |
| |
| | Revenue from electricity sales on markets outside Québec was $625 million, which is comparable to the 2014 figure. |
| |
| | Other revenue decreased by $263 million, mainly because supply costs incurred during the winter for electricity in excess of the heritage pool were lower than last year. |
| |
| | Total expenditure amounted to $2,208 million, or $54 million less than in 2014. Electricity purchases made by Hydro-Québec Distribution from third parties decreased by $71 million on account of a $151-million reduction in short-term market purchases. This reduction was partly offset by a $56-million increase in wind power purchases. |
| | |
| |
| Segmented | | Generation |
| results | | Hydro-Québec Production recorded a net result of $1,129 million, comparable to the $1,132 million posted in 2014. |
| |
| | Transmission |
| |
| | Hydro-Québec TransÉnergie’s net result amounted to $141 million, a $22-million decrease compared to 2014. Revenue from native-load transmission service increased by $8 million following a decision handed down by the Régie de l’énergie. Net amounts payable to customers, recognized in Other revenue, increased by $16 million. |
| |
| | Distribution |
| |
| | Hydro-Québec Distribution posted a net result of $527 million, compared to $454 million in 2014. Revenue from electricity sales increased by $273 million, partly because of the very cold temperatures in winter 2015. Other revenue decreased, essentially because supply costs incurred during the winter for electricity in excess of the heritage pool were lower than last year. Moreover, electricity purchases and the related transmission costs decreased by $65 million. On the one hand, supplies purchased from third parties decreased by $71 million, primarily on account of a $151-million reduction in short-term market purchases, which was partly offset by a $56-million increase in wind power purchases. On the other hand, supplies from Hydro-Québec Production decreased by $24 million. |
| |
| | Construction |
| |
| | The Construction segment includes activities related to the projects carried out by Hydro-Québec Équipement et services partagés and by Société d’énergie de la Baie James (SEBJ). |
| |
| | The volume of activity at Hydro-Québec Équipement et services partagés and SEBJ totaled $341 million, compared to $418 million in 2014. Projects under way for Hydro-Québec Production include ongoing construction of the Romaine hydroelectric complex. Work in progress for Hydro-Québec TransÉnergie includes expansion of the transmission system in the Minganie region, refurbishment of static var compensators at Albanel substation, as well as various projects stemming from continued investment in asset reliability and long-term operability. |
| | |
| Page 2 | | First Quarter 2015 |
| | | | |
| |
| Investment | | In the first three months of 2015, Hydro-Québec invested $618 million in property, plant and equipment, intangible assets and the Energy Efficiency Plan, compared to $748 million in 2014. |
| |
| | Most of Hydro-Québec Production’s investments were allocated to the construction of the Romaine complex. The division also carried out refurbishments at a number of facilities to optimize the generating fleet and ensure its long-term operability. |
| |
| | Hydro-Québec TransÉnergie continued investing in its transmission system. Among other growth projects, it continued construction of Romaine-1 substation, the 315-kV line that will connect it to Romaine-2 substation, and the 735-kV Romaine-4–Montagnais line, as part of the expansion of the transmission system in the Minganie region. The division also conducted maintenance and improvement activities to ensure the reliability and long-term operability of its transmission assets. |
| |
| | Hydro-Québec Distribution kept up investments to handle the growth of its Québec customer base and to ensure the long-term operability of its facilities. This included continuing to install next-generation meters as part of the rollout of the advanced metering infrastructure. |
| | |
| | Michael D. Penner | | Lise Croteau |
| | |
| | Chairman of the Board | | Acting President and Chief Executive Officer |
| | |
| | May 22, 2015 | | |
| | |
First Quarter 2015 | | Page 3 |
CONSOLIDATED FINANCIAL STATEMENTS
(UNAUDITED)
CONSOLIDATED STATEMENTS OF OPERATIONS
| | | | | | | | | | |
| | | | | | | | | | | |
In millions of Canadian dollars (unaudited) | | | | | | Three months ended March 31 | |
| | | | | | | | | | | |
| | | Notes | | | | 2015 | | 2014 (Note 14) | |
| | | | | | | | | | | |
Revenue | | 5 | | | | 4,600 | | | 4,616 | |
| | | | | | | | | | | |
Expenditure | | | | | | | | | | |
Operations | | | | | | 634 | | | 602 | |
Electricity and fuel purchases | | | | | | 645 | | | 768 | |
Depreciation and amortization | | 6 | | | | 628 | | | 610 | |
Taxes | | | | | | 301 | | | 282 | |
| | | | | | | | | | |
| | | | | | 2,208 | | | 2,262 | |
| | | | | | | | | | | |
Operating result | | | | | | 2,392 | | | 2,354 | |
Financial expenses | | 7 | | | | 604 | | | 604 | |
| | | | | | | | | | | |
Net result | | | | | | 1,788 | | | 1,750 | |
| | | | | | | | | | | |
The accompanying notes are an integral part of the consolidated financial statements.
| | |
| Page 4 | | First Quarter 2015 |
CONSOLIDATED STATEMENTS OF COMPREHENSIVE INCOME
| | | | | | | | | | |
| | | | | | | | | | | |
In millions of Canadian dollars (unaudited) | | | | | | Three months ended March 31 | |
| | | | | | | | | | | |
| | | Note | | | | 2015 | | 2014 (Note 14) | |
| | | | | | | | | | | |
Net result | | | | | | 1,788 | | | 1,750 | |
| | | | | | | | | | | |
Other comprehensive income | | | | | | | | | | |
Change in deferred gains on items designated as cash flow hedges | | 8 | | | | 772 | | | 23 | |
Reclassification to results of deferred gains on items designated as cash flow hedges | | 8 | | | | (618) | | | (11) | |
Reclassification to results of the net actuarial loss and past service costs for employee future benefits | | | | | | 28 | | | 57 | |
| | | | | | | | | | |
| | | | | | 182 | | | 69 | |
| | | | | | | | | | | |
Comprehensive income | | | | | | 1,970 | | | 1,819 | |
| | | | | | | | | | | |
The accompanying notes are an integral part of the consolidated financial statements.
| | |
First Quarter 2015 | | Page 5 |
CONSOLIDATED BALANCE SHEETS
| | | | | | | | | | | | |
| | | | | | | | | | | | | |
In millions of Canadian dollars (unaudited) | | Notes | | | | As at March 31, 2015 | | | As at December 31, 2014 (Note 14) | |
| | | | | | | | | | | | | |
ASSETS | | | | | | | | | | | | |
| | | | | | | | | | | | | |
Current assets | | | | | | | | | | | | |
Cash and cash equivalents | | | | | | | 349 | | | | 1,271 | |
Short-term investments | | | | | | | 713 | | | | 1,664 | |
Accounts receivable and other receivables | | | | | | | 3,387 | | | | 2,172 | |
Derivative instruments | | 8 | | | | | 130 | | | | 164 | |
Regulatory assets | | | | | | | 165 | | | | 182 | |
Materials, fuel and supplies | | | | | | | 190 | | | | 199 | |
| | | | | | | | | | | | |
| | | | | | | 4,934 | | | | 5,652 | |
| | | | | | | | | | | | | |
Property, plant and equipment | | | | | | | 60,469 | | | | 60,413 | |
Intangible assets | | | | | | | 1,050 | | | | 1,062 | |
Investments | | | | | | | 869 | | | | 863 | |
Derivative instruments | | 8 | | | | | 227 | | | | 133 | |
Regulatory assets | | | | | | | 4,601 | | | | 4,721 | |
Other assets | | | | | | | 282 | | | | 461 | |
| | | | | | | | | | | | | |
| | | | | | | 72,432 | | | | 73,305 | |
| | | | | | | | | | | | | |
LIABILITIES | | | | | | | | | | | | |
| | | | | | | | | | | | | |
Current liabilities | | | | | | | | | | | | |
Borrowings | | | | | | | 187 | | | | 126 | |
Accounts payable and accrued liabilities | | | | | | | 2,050 | | | | 2,153 | |
Dividend payable | | | | | | | – | | | | 2,535 | |
Accrued interest | | | | | | | 507 | | | | 907 | |
Asset retirement obligations | | | | | | | 76 | | | | 79 | |
Derivative instruments | | 8 | | | | | 155 | | | | 159 | |
Regulatory liabilities | | | | | | | 24 | | | | – | |
Current portion of long-term debt | | 8 | | | | | 129 | | | | 906 | |
| | | | | | | | | | | | |
| | | | | | | 3,128 | | | | 6,865 | |
| | | | | | | | | | | | | |
Long-term debt | | 8 | | | | | 44,616 | | | | 43,579 | |
Asset retirement obligations | | | | | | | 801 | | | | 804 | |
Derivative instruments | | 8 | | | | | 21 | | | | 95 | |
Other liabilities | | | | | | | 3,450 | | | | 3,541 | |
Perpetual debt | | 8 | | | | | 292 | | | | 267 | |
| | | | | | | | | | | | |
| | | | | | | 52,308 | | | | 55,151 | |
| | | | | | | | | | | | | |
EQUITY | | | | | | | | | | | | |
| | | | | | | | | | | | | |
Share capital | | | | | | | 4,374 | | | | 4,374 | |
Retained earnings | | | | | | | 17,580 | | | | 15,792 | |
Accumulated other comprehensive income | | | | | | | (1,830) | | | | (2,012) | |
| | | | | | | | | | | | |
| | | | | | | 15,750 | | | | 13,780 | |
| | | | | | | | | | | | |
| | | | | | | 20,124 | | | | 18,154 | |
| | | | | | | | | | | | | |
| | | | | | | 72,432 | | | | 73,305 | |
| | | | | | | | | | | | | |
Contingencies | | 12 | | | | | | | | | | |
| | | | | | | | | | | | | |
The accompanying notes are an integral part of the consolidated financial statements.
| | |
On behalf of the Board of Directors, | | |
| |
/s/ Jacques Leblanc | | /s/ Michael D. Penner |
Chair of the Audit Committee | | Chairman of the Board |
| | |
| Page 6 | | First Quarter 2015 |
CONSOLIDATED STATEMENTS OF CHANGES IN EQUITY
| | | | | | | | | | | | | | | | |
| | | | | | | | | | | | | | | | | |
In millions of Canadian dollars (unaudited) | | | | | | | | | | | | | | |
| | | | | | | | | | | | | | | | | |
| | | Notes | | | | Share capital | | Retained earnings | | | Accumulated
other
comprehensive
income | | Total equity | |
| | | | | | | | | | | | | | | | | |
| | | | | | |
Balance as at January 1, 2015 | | | | | | 4,374 | | | 15,792 | | | (2,012) | | | 18,154 | |
| | | | | | |
Net result | | | | | | – | | | 1,788 | | | – | | | 1,788 | |
Other comprehensive income | | 11 | | | | – | | | – | | | 182 | | | 182 | |
| | | | | | | | | | | | | | | | | |
| | | | | | |
Balance as at March 31, 2015 | | | | | | 4,374 | | | 17,580 | | | (1,830) | | | 20,124 | |
| | | | | | | | | | | | | | | | | |
| | | | | | |
Balance as at January 1, 2014 | | 14 | | | | 4,374 | | | 15,013 | | | (1,930) | | | 17,457 | |
| | | | | | |
Net result | | | | | | – | | | 1,750 | | | – | | | 1,750 | |
Other comprehensive income | | 11 | | | | – | | | – | | | 69 | | | 69 | |
| | | | | | | | | | | | | | | | | |
| | | | | | |
Balance as at March 31, 2014 | | | | | | 4,374 | | | 16,763 | | | (1,861) | | | 19,276 | |
| | | | | | | | | | | | | | | | | |
The accompanying notes are an integral part of the consolidated financial statements.
| | |
First Quarter 2015 | | Page 7 |
CONSOLIDATED STATEMENTS OF CASH FLOWS
| | | | | | |
In millions of Canadian dollars (unaudited) | | | | Three months ended March 31 |
| | | Notes | | 2015 | | 2014 (Note 14) |
Operating activities | | | | | | |
Net result | | | | 1,788 | | 1,750 |
Adjustments to determine net cash flows from operating activities | | | | | | |
Depreciation and amortization | | 6 | | 628 | | 610 |
Amortization of premiums, discounts and issue expenses related to debt securities | | | | 38 | | 36 |
Excess of net cost recognized over amounts paid (amounts paid over net cost recognized) for employee future benefits | | | | 28 | | (90) |
Other | | | | 259 | | 229 |
Change in non-cash working capital items | | 9 | | (1,711) | | (1,888) |
| | | | | | |
| | | | 1,030 | | 647 |
| | | | | | | |
Investing activities | | | | | | |
Additions to property, plant and equipment | | | | (585) | | (707) |
Additions to intangible assets | | | | (27) | | (33) |
Costs related to the Energy Efficiency Plan | | | | (6) | | (8) |
Net disposal of short-term investments | | | | 956 | | 769 |
Other | | | | 3 | | (9) |
| | | | | | |
| | | | 341 | | 12 |
| | | | | | | |
Financing activities | | | | | | |
Issuance of long-term debt | | | | 13 | | 12 |
Repayment of long-term debt | | | | (884) | | (1,145) |
Cash receipts arising from credit risk management | | 8 | | 2,004 | | 951 |
Cash payments arising from credit risk management | | 8 | | (1,197) | | (689) |
Net change in borrowings | | | | 50 | | 1,632 |
Dividend paid | | | | (2,535) | | (2,207) |
Other | | | | 230 | | 100 |
| | | | | | |
| | | | (2,319) | | (1,346) |
| | | | | | | |
Foreign currency effect on cash and cash equivalents | | | | 26 | | 6 |
| | | | | | | |
Net change in cash and cash equivalents | | | | (922) | | (681) |
Cash and cash equivalents, beginning of period | | | | 1,271 | | 1,680 |
| | | | | | | |
Cash and cash equivalents, end of period | | | | 349 | | 999 |
| | | | | | | |
Supplementary cash flow information | | 9 | | | | |
| | | | | | | |
The accompanying notes are an integral part of the consolidated financial statements.
| | |
| Page 8 | | First Quarter 2015 |
NOTES TO CONSOLIDATED FINANCIAL STATEMENTS
(UNAUDITED)
For the three-month periods ended March 31, 2015 and 2014
All amounts are in millions of Canadian dollars, unless otherwise indicated.
| Note 1 | Basis of Presentation |
These quarterly consolidated financial statements are Hydro-Québec’s first quarterly consolidated financial statements prepared in accordance with United States generally accepted accounting principles (U.S. GAAP).
The quarterly consolidated financial statements, including these notes, do not contain all the information required for annual consolidated financial statements and should therefore be read in conjunction with the consolidated financial statements and accompanying notes in Hydro-Québec’s Annual Report 2014. The 2014 annual consolidated financial statements were prepared in accordance with Canadian generally accepted accounting principles as set out in Part V of the CPA Canada Handbook, “Pre-Changeover Accounting Standards” (Canadian GAAP).
Note 14, First-Time Application of U.S. GAAP, presents the impact of the changeover to U.S. GAAP on the financial position and operating results of comparative periods as well as reconciliations with Canadian GAAP.
Note 15, Other Information Regarding Fiscal 2014 in Accordance with U.S. GAAP, presents information required for annual consolidated financial statements prepared in accordance with U.S. GAAP which is not provided in Hydro-Québec’s annual consolidated financial statements prepared in accordance with Canadian GAAP, and which is helpful for understanding these quarterly consolidated financial statements.
Management is of the opinion that these quarterly consolidated financial statements include all the necessary adjustments to present fairly, in all material respects, the consolidated financial position of Hydro-Québec.
Hydro-Québec’s quarterly results are not necessarily indicative of results for the year on account of seasonal temperature fluctuations. Because of higher electricity demand during winter months, revenue from electricity sales in Québec is higher during the first and fourth quarters.
Management has reviewed events occurring until May 22, 2015, the approval date of these quarterly consolidated financial statements by the Board of Directors, and has determined that nothing called for the recording or presentation of events after the consolidated balance sheet date.
| Note 2 | Significant Accounting Policies |
The significant accounting policies of Hydro-Québec in accordance with Canadian GAAP are described in Note 1 of Hydro-Québec’s Annual Report 2014. The policies that were subject to significant changes as a result of the transition to U.S. GAAP are described below.
SCOPE OF CONSOLIDATION
The consolidated financial statements include the accounts of Hydro-Québec and its subsidiaries as well as those of variable interest entities where Hydro-Québec is the primary beneficiary. All intercompany balances and transactions were eliminated at the time of consolidation.
Investments in joint ventures and in companies over which Hydro-Québec can exercise significant influence, but does not have control, are accounted for on an equity basis. These investments are initially recognized at cost, and the carrying amount is increased or decreased by an amount equal to Hydro-Québec’s share of the changes in the investees’ net assets after the date of acquisition. Hydro-Québec’s share of the investees’ results is recognized in the net result. Dividends received from the investees are applied against the carrying amount of the investment. Other investments are recorded at cost.
FINANCIAL INSTRUMENTS
Cash and cash equivalents
Cash and cash equivalents consist of investments with a maturity of three months or less from the date of acquisition.
| | |
First Quarter 2015 | | Page 9 |
| Note 2 | Significant Accounting Policies (continued) |
Short-term investments
Short-term investments classified as available-for-sale debt securities consist of investments with a maturity of more than three months from the date of acquisition and are recognized at fair value. Changes in fair value are recorded in Other comprehensive income until they are realized, at which time they are reclassified to results. Interest on these investments, calculated using the effective interest method, is recognized in results.
Receivables – Accounts receivable
Accounts receivable are recognized at the amount invoiced, net of the allowance for doubtful accounts. This allowance is based on the loss and recovery experience, on a specific percentage deemed appropriate for each age group of accounts and on the status of customer files.
Other receivables and financial liabilities
Other receivables presented under Accounts receivable and other receivables, receivables presented under Other assets and the government reimbursement for the 1998 ice storm, also presented in Other assets, less any impairment losses, as well as financial liabilities, are measured at amortized cost using the effective interest method. Amortized cost includes transaction costs as well as premiums and discounts, if applicable. Interest is recognized in results.
Derivative instruments
Derivative instruments are recorded at fair value at the balance sheet date. Changes in fair value are recognized in results for the period in which they occur, except in the case of derivative instruments designated as hedges in a cash flow hedging relationship. The net balances of derivative instruments that are transacted with the same counterparty, that are the subject of an enforceable master netting arrangement, and that meet the conditions for setoff are presented on the balance sheet.
As part of its integrated business risk management, Hydro-Québec uses derivative instruments to manage its market risk, consisting of currency risk, interest rate risk and risk resulting from fluctuating energy and aluminum prices. It applies cash flow or fair value hedge accounting to eligible hedging relationships that it designates as hedges, and formally documents these relationships. Among other things, this process involves associating derivative instruments with specific assets or liabilities on the balance sheet, or with probable anticipated transactions. Hydro-Québec ensures that hedging relationships are highly effective in offsetting the designated risk exposure initially and then monthly thereafter. In addition, for hedges of anticipated transactions, it assesses the probability of the occurrence of those transactions designated as hedged items at least on a quarterly basis.
In the case of a cash flow hedge, the effective portion of changes in the fair value of an instrument designated as a hedge is recognized under Other comprehensive income, while the ineffective portion is immediately recognized in results, under the line item affected by the hedged item. Amounts included in Accumulated other comprehensive income are reclassified to results, also under the line item affected by the hedged item, during the periods in which the hedged item affects results. If a derivative instrument no longer satisfies hedging conditions, if it has expired, or if it is sold, cancelled or exercised, or if Hydro-Québec terminates its designation as a hedging item, hedge accounting ceases to be applied on a prospective basis. Previously accumulated gains and losses in Other comprehensive income continue to be carried forward to be reclassified to results during the same periods as the hedged item. If the hedged item ceases to exist or if it becomes likely that the hedged anticipated transactions will not occur, the gains or losses carried forward are immediately reclassified to results.
In the case of a fair value hedge, changes in the fair value of the derivative instrument, including those related to the ineffective portion of the hedge, are recognized in results under the line item affected by the hedged item. Offsetting changes in the fair value of the hedged item attributable to the hedged risk are recognized as adjustments to this item’s carrying amount and are offset against results.
Cash flows attributable to derivative instruments designated as hedges are presented in the statement of cash flows based on the same classification as the hedged item.
Hydro-Québec assesses its contracts to determine if they meet the definition of a derivative or if they include an embedded derivative, which must be separated from its host contract. If such is the case, the contract or the embedded derivative is recognized at fair value on the balance sheet.
All futures or forward contracts on non-financial items that can be settled on a net basis and whose price is closely tied to the non-financial item bought or sold are recorded at the date of settlement if there is a probability of receipt or delivery in accordance with expected requirements.
| | |
| Page 10 | | First Quarter 2015 |
| Note 2 | Significant Accounting Policies (continued) |
INTANGIBLE ASSETS
Intangible assets are recorded at cost.
The cost of internally developed computer software is capitalized when it meets capitalization criteria. The related financial expenses are capitalized over the development period.
Intangible assets with an indefinite useful life are not amortized. These assets are tested for impairment annually or more frequently if events indicate a potential impairment loss. The excess of the carrying amount over the fair value is recognized in results for the period in which the impairment is determined.
Intangible assets with a finite useful life, namely software and licences, as well as patents, are amortized over their useful life according to the straight-line method over the following periods:
| | |
Software and licences | | 3 to 10 years |
Patents | | 20 years |
EMPLOYEE FUTURE BENEFITS
Pension plan and other post-retirement benefits
Hydro-Québec offers all its employees a contributory defined-benefit pension plan based on final pay (the Pension Plan), as well as other post-retirement benefits. It accounts for its obligations under the Pension Plan and these other benefits after deducting the fair value of their respective assets.
Benefit costs and obligations under the Pension Plan and other post-retirement benefits provided in exchange for current service are calculated according to the projected benefit method prorated on years of service. They are determined using a discount rate and are based on Management’s best estimates, in particular concerning the expected return on plan assets, salary escalation, the increase in health care costs, and employees’ retirement ages. Plan assets are measured at fair value at the balance sheet date.
In order to establish the benefit costs and its obligations under the Pension Plan and other post-retirement benefits, Hydro-Québec has adopted the following policies:
| ¡ | The discount rate is based on the average rate of the interest rate curve on the measurement date of high-quality Canadian corporate bonds and takes into account the expected cash flows associated with the projected benefit obligations. |
| ¡ | Past service costs arising from amendments to the Pension Plan and other post-retirement benefits are initially recognized in Other comprehensive income, and thereafter are amortized in the line item Operating expenses using the straight-line method over periods not exceeding active employees’ average remaining years of service, which was 13 years as at January 1, 2015 (12 years as at January 1, 2014). |
| ¡ | Actuarial gains and losses are recognized in Other comprehensive income for the period in which they occur. Thereafter, amortization of actuarial gains or losses is recognized in the line item Operating expenses if the unamortized net actuarial gain or loss at the beginning of the year exceeds 10% of the value of the projected benefit obligations or 10% of the market-related value of the plan assets, whichever is greater. The amortization corresponds to the excess divided by active employees’ average remaining years of service. |
| ¡ | The expected return on Pension Plan assets is based on a market-related value determined by using a five-year moving average value for equity securities and by measuring other asset classes at fair value. |
A regulatory asset is offset against the components of Accumulated other comprehensive income related to rate-regulated activities to take into account the expected recovery of the amounts in question in setting future rates.
Post-employment benefits
Hydro-Québec offers all its employees post-employment benefits, including a long-term disability salary insurance plan that provides for the payment of long-term defined benefits.
The post-employment benefit cost and obligation are recognized at the time of the event giving rise to the obligation to pay benefits. The cost of these benefits, including all related actuarial gains and losses, is recognized in results for the period.
| | |
First Quarter 2015 | | Page 11 |
| Note 3 | Changes to Accounting Policies |
RECENTLY ADOPTED STANDARD
Transaction costs
In April 2015, the Financial Accounting Standards Board (FASB) issued Accounting Standards Update (ASU) 2015-03, Interest—Imputation of Interest (Subtopic 835-30): Simplifying the Presentation of Debt Issuance Costs. This standard requires that debt issuance costs be presented retrospectively on the balance sheet as a direct deduction from the carrying amount of the relevant debt liability. Hydro-Québec has opted for an early application as of January 1, 2015.
STANDARDS ISSUED BUT NOT YET EFFECTIVE
Consolidation
In February 2015, the FASB issued ASU 2015-02, Consolidation (Topic 810): Amendments to the Consolidation Analysis. This standard amends the guidance concerning entities that must be fully consolidated during the preparation of consolidated financial statements. Hydro-Québec will apply it retrospectively in its interim and annual financial statements for periods beginning on or after January 1, 2016, and is currently examining the impact of this standard on its consolidated financial statements.
Statements of Operations
In January 2015, the FASB issued ASU 2015-01, Income Statement—Extraordinary and Unusual Items (Subtopic 225-20): Simplifying Income Statement Presentation by Eliminating the Concept of Extraordinary Items. This standard will apply to the interim and annual financial statements for periods beginning on or after January 1, 2016. It is not expected to have any impact on Hydro-Québec’s consolidated financial statements.
Revenue
In May 2014, the FASB issued ASU 2014-09, Revenue from Contracts with Customers (Topic 606). This standard provides guidance on the recognition of revenue at the time that goods or services are transferred to a client, for an amount that reflects the payment which the entity expects to receive in exchange for the goods or services. In April 2015, the FASB issued the Proposed Accounting Standards Update Revenue from Contracts with Customers (Topic 606): Deferral of the Effective Date, which proposes to delay the effective date by one year, so that the standard would be applied retrospectively to the interim and annual financial statements for periods beginning on or after January 1, 2018. Hydro-Québec is currently examining the impact of this standard on its consolidated financial statements.
Distribution
In decision D-2015-033 of March 23, 2015, the Régie de l’énergie (the Régie) authorized an increase of 2.86% in all Hydro-Québec electricity rates except Rate L, for which the increase was set at 2.49%. The new rates are effective as of April 1, 2015. The authorized return on the rate base was set at 7.08%, assuming a capitalization with 35% equity.
In decision D-2015-018 of March 6, 2015, the Régie established that it would henceforth exclude from the rate base all accounts used to recover variances between the actual amount of certain items and the amount projected in the rate cases. Variance accounts with an amortization and recovery period of three years or less will bear interest at Hydro-Québec’s three-year bond rate, plus guarantee fees and issuance expenses, namely 2.23% for 2015. Variance accounts with an amortization and recovery period in excess of three years will bear interest at Hydro-Québec’s five-year bond rate, plus guarantee fees and issuance expenses, namely 2.73% for 2015.
Moreover, the Régie authorized the Distributor to include in the 2015–2016 rates a debit amount of $136 million related to variances in supply costs for electricity in excess of the heritage pool in 2014, as well as an equivalent credit amount for revenue variances related to climate conditions in 2014, and to amortize over five years, as of 2016, the remaining balance of variances in supply costs for electricity in excess of the heritage pool in 2013 and 2014.
The Régie also authorized the Distributor to include in the 2015–2016 rates a $20-million credit for a variance in the costs related to the 2014 activities of the Bureau de l’efficacité et de l’innovation énergétiques.
Transmission
In decision D-2015-031 of March 23, 2015, the Régie set Hydro-Québec’s power transmission rates for 2015. The authorized return on the rate base was set at 6.97%, assuming a capitalization with 30% equity.
| | |
| Page 12 | | First Quarter 2015 |
| | | | |
| | | Three months ended March 31 |
| | | | | |
| | | 2015 | | 2014 |
| | | | | |
| | |
Electricity salesa | | 4,614 | | 4,367 |
Other | | (14) | | 249 |
| | | | | |
| | 4,600 | | 4,616 |
| | | | | |
| a) | Including unbilled electricity deliveries, which totaled $1,063 million as at March 31, 2015 ($1,247 million as at March 31, 2014). |
| Note 6 | Depreciation and Amortization |
| | | | |
| | | Three months ended March 31 |
| | | | | |
| | | 2015 | | 2014 |
| | | | | |
| | |
Property, plant and equipment | | 534 | | 528 |
Intangible assetsa | | 38 | | 37 |
Regulatory assets | | 49 | | 40 |
Retirement of capital assets | | 7 | | 5 |
| | | | | |
| | 628 | | 610 |
| | | | | |
| a) | For the period from 2015 to 2019, amortization of intangible assets is expected to be as follows: $150 million in 2015, $132 million in 2016, $114 million in 2017, $49 million in 2018 and $20 million in 2019. |
| | | | |
| | | Three months ended
March 31 |
| | | | | |
| | | 2015 | | 2014 |
| | | | | |
| | |
Interest on debt securities | | 648 | | 645 |
Net exchange gain | | (38) | | (10) |
Guarantee fees related to debt securities | | 51 | | 51 |
| | | | |
| | 661 | | 686 |
| | | | | |
Less | | | | |
Capitalized financial expenses | | 49 | | 73 |
Net investment income | | 8 | | 9 |
| | | | |
| | 57 | | 82 |
| | | | | |
| | 604 | | 604 |
| | | | | |
| | |
First Quarter 2015 | | Page 13 |
| Note 8 | Financial Instruments |
In the course of its operations, Hydro-Québec carries out transactions that expose it to certain financial risks, such as market, credit and liquidity risk. Exposure to such risks and the impact on results are significantly reduced through careful monitoring and implementation of strategies that include the use of derivative instruments.
MARKET RISK
Market risk is the risk that the fair value or future cash flows of a financial instrument will fluctuate as a result of changes in market prices. Hydro-Québec is exposed to three main types of market risk: currency risk, interest rate risk and risk associated with energy and aluminum prices. Active integrated management of these three types of risk aims to limit their impact on results.
MANAGEMENT OF LONG-TERM RISK
Management of risk associated with sales in U.S. dollars
Currency risk – Hydro-Québec uses currency swaps to manage currency risk associated with probable U.S.-dollar sales, designating them as cash flow hedges. The impact of these hedging transactions on results is recognized in Revenue.
Management of risk associated with debt
Currency risk and interest rate risk – Hydro-Québec uses forward contracts and currency swaps to manage the currency risk associated with long-term debt and perpetual debt, as well as forward contracts and interest rate swaps to modify long-term exposure to interest rate risk. When designated as hedging items, these derivative instruments are recognized as cash flow hedges or fair value hedges, depending on the risk hedged. The impact on results of foreign currency hedging transactions and those associated with debt interest rates is recognized in Financial expenses.
The following table shows the notional amounts of forward contracts and swaps used to manage risk associated with U.S.-dollar sales and with the debt, expressed in Canadian dollars and foreign currencies:
| | | | |
| | | As at March 31,
2015a | | As at December 31,
2014a |
| | | | | |
| | |
Forward contracts | | | | |
| | |
U.S. dollars | | 2,232 | | 2,233 |
| | |
Swaps | | | | |
Canadian dollars | | (8,497) | | (7,941) |
U.S. dollars | | 6,042 | | 6,042 |
Other currencies | | | | |
Euros | | 61 | | 61 |
Pounds sterling | | 50 | | 200 |
Yen | | 1,000 | | 1,000 |
| | | | | |
| a) | Figures in parentheses represent amounts to be paid. |
| | |
| Page 14 | | First Quarter 2015 |
| Note 8 | Financial Instruments (continued) |
MANAGEMENT OF SHORT-TERM RISK
Currency risk – Hydro-Québec uses forward contracts to manage its foreign currency risk exposure over the short term. When designated as hedging items, these derivative instruments are recognized as cash flow hedges. The impact of currency risk hedging transactions on results is recognized in the line item affected by the hedged item, namely Revenue, Electricity and fuel purchases, or Financial expenses. The nominal amount of open positions as at March 31, 2015, was US$200 million in currency sales contracts (US$500 million as at December 31, 2014).
Interest rate risk – Hydro-Québec uses forward rate agreements to manage short-term interest rate risk. When designated as hedging items, these derivative instruments are recognized as cash flow hedges. The impact on results of transactions to hedge short-term interest rate risk is recognized in the line item affected by the hedged item, namely Financial expenses.
Price risk – Hydro-Québec uses mainly commodity futures and swaps to manage risk resulting from fluctuations in energy and aluminum prices. When designated as hedging items, these derivative instruments are recognized as cash flow hedges. The impact on results of transactions to hedge the risk related to energy and aluminum prices is recognized in the line item affected by the hedged item, namely Revenue or Electricity and fuel purchases. In this context, Hydro-Québec has traded commodity futures and electricity swaps for which open positions as at March 31, 2015, were 17.3 TWh (14.9 TWh as at December 31, 2014), and natural gas futures for which open positions as at March 31, 2015, totaled 2.0 million MMBtu (1.3 million MMBtu as at December 31, 2014), as well as aluminum swaps for which open positions as at March 31, 2015, totaled 76,875 tonnes (100,000 tonnes as at December 31, 2014).
FAIR VALUE
Fair value is the price that would be received to sell an asset or paid to transfer a liability in an orderly transaction between market participants at the measurement date.
In accordance with the applicable standards, Hydro-Québec classifies the fair value measurements of financial instruments according to a three-level hierarchy, based on the type of inputs used in making these measurements:
| | | | |
• | | Level 1: | | Quoted prices (unadjusted) in active markets for identical assets or liabilities that the entity can access at the measurement date; |
• | | Level 2: | | Inputs other than quoted prices included within Level 1 that are observable either directly or indirectly; and |
• | | Level 3: | | Unobservable inputs. |
Except for measurements of exchange-traded derivative instruments, which are Level 1 measurements, fair value measurements for derivative instruments are Level 2 measurements. Measurements of other financial instruments recognized at fair value or for which fair value is disclosed are Level 2 measurements. These measurements are obtained by discounting future cash flows, which are estimated on the basis of the spot rates or the forward rates or prices (foreign exchange rates, interest rates, and energy or aluminum prices) in effect on the balance sheet date and take into account the credit risk assessment. The valuation techniques make use of observable market data.
| | |
First Quarter 2015 | | Page 15 |
| Note 8 | Financial Instruments (continued) |
FAIR VALUE OF DERIVATIVE INSTRUMENTS
The fair value of derivative instruments by type and depending on whether they are designated as fair value hedges or cash flow hedges, or not designated as hedges, is shown in the tables below:
| | | | | | | | | | | | | | | | |
| | | | | | | | | As at March 31, 2015 | |
| | | Derivatives
designated as
fair value
hedges | | | Derivatives
designated as
cash flow
hedges | | | Derivatives
not
designated
as hedges | | | Total gross
value of
derivatives | |
Assets | | | | | | | | | | | | | | | | |
Contracts – Currency risk | | | – | | | | 953 | | | | 416 | | | | 1,369 | |
Contracts – Currency risk and interest rate risk | | | 1 | | | | – | | | | – | | | | 1 | |
Contracts – Interest rate risk | | | 633 | | | | – | | | | – | | | | 633 | |
Contracts – Price risk | | | – | | | | 125 | | | | 60 | | | | 185 | |
| | | | 634 | | | | 1,078 | | | | 476 | | | | 2,188 | |
Liabilities | | | | | | | | | | | | | | | | |
Contracts – Currency risk | | | – | | | | (318) | | | | (1,612) | | | | (1,930) | |
Contracts – Currency risk and interest rate risk | | | (1) | | | | – | | | | – | | | | (1) | |
Contracts – Interest rate risk | | | – | | | | (11) | | | | (8) | | | | (19) | |
Contracts – Price risk | | | – | | | | (13) | | | | (44) | | | | (57) | |
| | | | (1) | | | | (342) | | | | (1,664) | | | | (2,007) | |
Total | | | 633 | | | | 736 | | | | (1,188)a | | | | 181b | |
| | | | | | | | | | |
| | | | | | | | | As at December 31, 2014 | |
| | | Derivatives
designated as
fair value
hedges | | | Derivatives
designated as
cash flow
hedges | | | Derivatives
not
designated
as hedges | | | Total gross
value of
derivatives | |
Assets | | | | | | | | | | | | | | | | |
Contracts – Currency risk | | | – | | | | 415 | | | | 565 | | | | 980 | |
Contracts – Currency risk and interest rate risk | | | 1 | | | | – | | | | – | | | | 1 | |
Contracts – Interest rate risk | | | 512 | | | | 8 | | | | – | | | | 520 | |
Contracts – Price risk | | | – | | | | 166 | | | | 47 | | | | 213 | |
| | | | 513 | | | | 589 | | | | 612 | | | | 1,714 | |
Liabilities | | | | | | | | | | | | | | | | |
Contracts – Currency risk | | | – | | | | (653) | | | | (870) | | | | (1,523) | |
Contracts – Currency risk and interest rate risk | | | (66) | | | | – | | | | – | | | | (66) | |
Contracts – Interest rate risk | | | (1) | | | | (13) | | | | (9) | | | | (23) | |
Contracts – Price risk | | | – | | | | (20) | | | | (39) | | | | (59) | |
| | | | (67) | | | | (686) | | | | (918) | | | | (1,671) | |
Total | | | 446 | | | | (97) | | | | (306)a | | | | 43b | |
| a) | These derivative instruments were mainly traded as part of Hydro-Québec’s risk management. As at March 31, 2015, $(1,315) million was in consideration of amounts received or disbursed [$(508) million as at December 31, 2014] with respect to agreements to limit the market value of the main portfolios of derivative instruments. These agreements arise from frameworks applied by Hydro-Québec to reduce its credit risk exposure and limit risk concentration. |
| b) | Except for measurements of exchange-traded derivative instruments, which totaled $1 million as at March 31, 2015 [$(1) million as at December 31, 2014] and which are Level 1 measurements, fair value measurements of derivative instruments are Level 2 measurements. |
| | |
| Page 16 | | First Quarter 2015 |
| Note 8 | Financial Instruments (continued) |
The offsetting of derivative instruments is shown in the table below:
| | | | | | | | | | | | | | | | | | | | | | | | |
| | | As at March 31, 2015 | | | As at December 31, 2014 | |
| | | Total gross
value of
derivatives | | | Amount offseta | | | Total net value
presented on the
balance sheet | | | Total gross
value of
derivatives | | | Amount offseta | | | Total net value
presented on the
balance sheet | |
Assets | | | | | | | | | | | | | | | | | | | | | | | | |
Current | | | 474 | | | | (344) | | | | 130 | | | | 586 | | | | (422) | | | | 164 | |
Long-term | | | 1,714 | | | | (1,487) | | | | 227 | | | | 1,128 | | | | (995) | | | | 133 | |
| | | | 2,188 | | | | (1,831) | | | | 357 | | | | 1,714 | | | | (1,417) | | | | 297 | |
Liabilities | | | | | | | | | | | | | | | | | | | | | | | | |
Current | | | (1,684) | | | | 1,529 | | | | (155) | | | | (969) | | | | 810 | | | | (159) | |
Long-term | | | (323) | | | | 302 | | | | (21) | | | | (702) | | | | 607 | | | | (95) | |
| | | | (2,007) | | | | 1,831 | | | | (176) | | | | (1,671) | | | | 1,417 | | | | (254) | |
Total | | | 181 | | | | – | | | | 181 | | | | 43 | | | | – | | | | 43 | |
| a) | The amounts offset are related to contracts traded according to International Swaps and Derivatives Association (ISDA) guidelines and constituting enforceable master netting arrangements. |
Moreover, although certain derivatives cannot be offset, margin calls on derivative instruments may result in amounts received from or paid to clearing agents, based on the fair value of the instruments concerned. As at March 31, 2015, $84 million had been received on this basis; the offsetting item is presented in Borrowings under Current liabilities on the balance sheet ($103 million as at December 31, 2014).
| | |
First Quarter 2015 | | Page 17 |
| Note 8 | Financial Instruments (continued) |
Derivatives’ impact on results and other comprehensive income is presented in the table below. It should be noted that most of the derivative instruments traded are designated as cash flow hedges or fair value hedges and therefore reduce the volatility of results, except for the ineffective portion of the hedges, which is insignificant. Derivative instruments which are not designated as hedges, but which nonetheless serve to hedge at-risk opposite positions, also reduce the volatility of results. The sensitivity of results is thus limited to net exposure to unhedged risks.
| | | | | | | | | | | | | | | | | | | | |
| | | | | | | | | | | | Three months ended March 31, 2015 | |
| | | Losses (gains) on
derivatives designated
as fair value hedges | | | Losses (gains) on derivatives designated as cash flow hedges | | | Losses (gains)
on derivatives
not designated
as hedges | |
| | | Recognized in results | | | Effective portion
recognized in
Other
comprehensive
income | | | Ineffective
portion
recognized in
results | | | Effective portion
reclassified from
Other
comprehensive
income to
results | | | Recognized
in results | |
Contracts – Currency risk | | | – | | | | (806 | ) | | | – | | | | (606 | )a | | | (222 | ) |
Contracts – Currency risk and interest rate risk | | | (15 | ) | | | – | | | | – | | | | – | | | | – | |
Contracts – Interest rate risk | | | (126 | ) | | | 7 | | | | – | | | | 1 | b | | | 8 | |
Contracts – Price risk | | | – | | | | 27 | | | | (3 | )c | | | (13 | )c | | | 2 | |
| | | | (141 | )d | | | (772 | ) | | | (3 | ) | | | (618 | ) | | | (212 | )e |
Impact of hedged items on results | | | 139 | | | | | | | | – | | | | 618 | | | | 227 | |
| | | | | | | | | | | | | | | | | | | | |
| | | | | | | | | | | | Three months ended March 31, 2014 | |
| | | Losses (gains) on
derivatives designated
as fair value hedges | | | Losses (gains) on derivatives designated as cash flow hedges | | | Losses (gains)
on derivatives
not designated
as hedges | |
| | | Recognized in results | | | Effective portion
recognized in
Other
comprehensive
income | | | Ineffective
portion
recognized in
results | | | Effective portion
reclassified from
Other
comprehensive
income to
results | | | Recognized in
results | |
Contracts – Currency risk | | | – | | | | (247 | ) | | | 1 | a | | | (289 | )a | | | (83 | ) |
Contracts – Currency risk and interest rate risk | | | (13 | ) | | | – | | | | – | | | | – | | | | – | |
Contracts – Interest rate risk | | | (91 | ) | | | (9 | ) | | | – | | | | (1 | )b | | | 1 | |
Contracts – Price risk | | | – | | | | 233 | | | | – | | | | 279 | c | | | 6 | |
| | | | (104 | )d | | | (23 | ) | | | 1 | | | | (11 | ) | | | (76 | )e |
Impact of hedged items on results | | | 99 | | | | | | | | – | | | | 11 | | | | 88 | |
| a) | The impact of currency risk hedging transactions on results is recognized in the line item affected by the hedged item. Therefore, $50 million was recognized in the line item Revenue [$(27) million as at March 31, 2014] and $(656) million in the line item Financial expenses [$(261) million as at March 31, 2014]. |
| b) | The impact on results of interest rate risk hedging transactions is recognized in the line item affected by the hedged item. Therefore, $1 million was recognized in the line item Financial expenses [$(1) million as at March 31, 2014]. |
| c) | The impact on results of transactions to hedge energy and aluminum price risk is recognized in the line item affected by the hedged item. Therefore, $(16) million was recognized in the line item Revenue ($279 million as at March 31, 2014). |
| d) | The impact of fair value risk hedging transactions on results, including the ineffective portion, is recognized in the line item affected by the hedged item, namely Financial expenses. |
| e) | These instruments are essentially related to integrated risk management transactions. The impact of these instruments on results is recognized in the line item affected by the managed risk. Therefore, $22 million was recognized in the line item Revenue ($11 million as at March 31, 2014), $(4) million in the line item Electricity and fuel purchases [$(3) million as at March 31, 2014] and $(230) million in the line item Financial expenses [$(84) million as at March 31, 2014]. |
| | |
| Page 18 | | First Quarter 2015 |
| Note 8 | Financial Instruments (continued) |
During the first three months of 2014 and 2015, Hydro-Québec did not reclassify any amounts from Accumulated other comprehensive income to results after having discontinued cash flow hedges.
As at March 31, 2015, the net amount of gains presented in Accumulated other comprehensive income that would be reclassified to the net result within the next 12 months was estimated at $88 million.
As at March 31, 2015, the maximum period during which Hydro-Québec hedged its exposure to the variability of cash flows related to anticipated transactions was three years.
FAIR VALUE OF OTHER FINANCIAL INSTRUMENTS
Fair value measurements for other financial instruments are Level 2 measurements. Fair value is obtained by discounting cash flows, calculated on the basis of forward interest rates measured according to the rates on the balance sheet date for similar instruments traded on financial markets.
The fair value of cash equivalents, receivables – accounts receivable, other receivables and financial liabilities approximates their carrying amount, except for the items presented in the table below:
| | | | | | | | | | | | | | | | |
| | | As at March 31, 2015 | | | As at December 31, 2014 | |
| | | Carrying
amount | | | Fair value | | | Carrying
amount | | | Fair value | |
Long-term debt | | | 44,745 | | | | 64,309 | | | | 44,485 | | | | 60,569 | |
Perpetual debt | | | 292 | | | | 234 | | | | 267 | | | | 217 | |
| Note 9 | Supplementary Cash Flow Information |
| | | | | | | | |
| | | Three months ended March 31 | |
| | | 2015 | | | 2014 | |
Change in non-cash working capital items | | | | | | | | |
Accounts receivable and other receivables | | | (1,197 | ) | | | (1,349) | |
Materials, fuel and supplies | | | 9 | | | | 9 | |
Accounts payable and accrued liabilities | | | (116 | ) | | | (140) | |
Accrued interest | | | (407 | ) | | | (408) | |
| | | | (1,711 | ) | | | (1,888) | |
Investing activities not affecting cash | | | | | | | | |
Increase in property, plant and equipment | | | 15 | | | | 12 | |
Interest paid | | | 950 | | | | 927 | |
| Note 10 | Employee Future Benefits |
| | | | | | | | | | | | | | | | |
| | | | | | | | | Three months ended March 31 | |
| | | Pension Plan | | | Other plans | |
| | | 2015 | | | 2014 | | | 2015 | | | 2014 | |
Current service costs | | | 111 | | | | 86 | | | | 11 | | | | 10 | |
Interest on obligations | | | 220 | | | | 220 | | | | 13 | | | | 13 | |
Expected return on assets | | | (326 | ) | | | (297 | ) | | | (1 | ) | | | (1 | ) |
Amortization of net actuarial lossa | | | 73 | | | | 45 | | | | 6 | | | | 3 | |
Amortization of past service costs (credits)a | | | 7 | | | | 9 | | | | (1 | ) | | | (1 | ) |
Net cost recognized | | | 85 | | | | 63 | | | | 28 | | | | 24 | |
| a) | The amortization of the net actuarial loss and past service costs (credits) was reclassified from Other comprehensive income, net of the change in the employee future benefit regulatory asset, which totaled $56 million as at March 31, 2015 (nil as at March 31, 2014). |
| | |
First Quarter 2015 | | Page 19 |
| Note 11 | Accumulated Other Comprehensive Income |
| | | | | | | | |
| | | | | | | | | |
| | | | | | | Three months ended March 31, 2015 |
| | | | | | | | | |
| | | Cash flow hedges | | | | Employee future benefitsa | | Accumulated other comprehensive
income |
| | | | | | | | | |
Balance, beginning of period | | (187) | | | | (1,825) | | (2,012) |
| | | | | | | | | |
Other comprehensive income before reclassifications | | 772 | | | | – | | 772 |
Amounts reclassified to results | | (618) | | | | 28 | | (590) |
| | | | | | | | | |
Other comprehensive income | | 154 | | | | 28 | | 182 |
| | | | | | | | | |
Balance, end of period | | (33) | | | | (1,797) | | (1,830) |
| | | | | | | | | |
| | | | | | | | |
| | | | | | | | | |
| | | | | | | Three months ended March 31, 2014 |
| | | | | | | | | |
| | | Cash flow hedges | | | | Employee future benefitsa | | Accumulated other comprehensive income |
| | | | | | | | | |
Balance, beginning of period | | (575) | | | | (1,355) | | (1,930) |
| | | | | | | | | |
Other comprehensive income before reclassifications | | 23 | | | | – | | 23 |
Amounts reclassified to results | | (11) | | | | 57 | | 46 |
| | | | | | | | | |
Other comprehensive income | | 12 | | | | 57 | | 69 |
| | | | | | | | | |
Balance, end of period | | (563) | | | | (1,298) | | (1,861) |
| | | | | | | | | |
| a) | Including the share of interests accounted for on an equity basis. |
GUARANTEES
In accordance with the terms and conditions of certain debt securities issued outside Canada, Hydro-Québec has undertaken to increase the amount of interest paid to non-residents in the event of changes to Canadian tax legislation governing the taxation of non-residents’ income. Hydro-Québec cannot estimate the maximum amount it might have to pay under such circumstances. Should an amount become payable, Hydro-Québec has the option of redeeming most of the securities in question. As at March 31, 2015, the amortized cost of the long-term debts concerned was $5,754 million.
LITIGATION
In the normal course of its development and operating activities, Hydro-Québec is sometimes party to claims and legal proceedings. Management is of the opinion that an adequate provision has been made for these legal actions. Consequently, it does not foresee any adverse effect of such contingent liabilities on Hydro-Québec’s financial position or consolidated operating results.
Among other ongoing actions, some Aboriginal communities have instituted proceedings against the governments of Canada and Québec, as well as against Hydro-Québec, based on demands concerning their ancestral rights. In particular, the Innus of Uashat mak Mani-Utenam are demanding $1.5 billion in damages resulting from various operations carried out on land they claim as their own.
Furthermore, in June 2009, the Innus of Uashat mak Mani-Utenam served notice that they had filed for an injunction to suspend work at the Romaine complex jobsite, and in May 2010, an application was added for an interlocutory injunction to suspend work on the related tie lines. In March 2015, a proposed out-of-court settlement for the injunction proceedings was accepted by a vast majority of the applicants. Motions will be filed shortly to have the courts declare as inadmissible the injunctions being brought by dissident claimants.
| | |
| Page 20 | | First Quarter 2015 |
| Note 12 | Contingencies (continued) |
In addition, in November 2006, the Innus of Pessamit reactivated a case instituted in 1998 aimed at obtaining, among other things, the recognition of ancestral rights related to Québec lands on which certain hydroelectric generating facilities belonging to the Manic-Outardes complex are located. The Innus of Pessamit are claiming $500 million. In April 2015, the Innus of Pessamit filed a motion requesting that proceedings be suspended until the end of January 2017 so that they could pursue discussions with the Québec government.
The judicial proceedings are progressing, and Hydro-Québec is challenging the legitimacy of all these claims.
| Note 13 | Segmented Information |
The following tables contain information related to results and assets by segment:
| | | | | | | | | | | | | | | | | | | | | | | | | | | | |
| | | Three months ended March 31, 2015 | |
| | | Generation | | | Transmission | | | Distribution | | | Construction | | | Corporate
and Other
Activities | | | Intersegment
eliminations
and
adjustments | | | Total | |
| | | | | | | | | | | | | | | | | | | | | | | | | | | | | |
Revenue | | | | | | | | | | | | | | | | | | | | | | | | | | | | |
External customers | | | 647 | | | | (3 | ) | | | 3,959 | | | | – | | | | (3 | ) | | | – | | | | 4,600 | |
Intersegment customers | | | 1,670 | | | | 801 | | | | 22 | | | | 341 | | | | 359 | | | | (3,193 | ) | | | – | |
Net result | | | 1,129 | | | | 141 | | | | 527 | | | | – | | | | (9 | ) | | | – | | | | 1,788 | |
Total assets as at March 31, 2015 | | | 32,694 | | | | 20,363 | | | | 14,582 | | | | 61 | | | | 5,041 | | | | (309 | ) | | | 72,432 | |
| | | | | | | | | | | | | | | | | | | | | | | | | | | | | |
| | | | | | | |
| | | | | | | | | | | | | | | | | | | | | | | | | | | | |
| | | Three months ended March 31, 2014 | |
| | | Generation | | | Transmission | | | Distribution | | | Construction | | | Corporate
and Other
Activities | | | Intersegment
eliminations
and
adjustments | | | Total | |
| | | | | | | | | | | | | | | | | | | | | | | | | | | | | |
Revenue | | | | | | | | | | | | | | | | | | | | | | | | | | | | |
External customers | | | 668 | | | | 45 | | | | 3,904 | | | | – | | | | (1 | ) | | | – | | | | 4,616 | |
Intersegment customers | | | 1,681 | | | | 758 | | | | 23 | | | | 418 | | | | 362 | | | | (3,242 | ) | | | – | |
Net result | | | 1,132 | | | | 163 | | | | 454 | | | | – | | | | 1 | | | | – | | | | 1,750 | |
Total assets as at March 31, 2014 | | | 31,855 | | | | 19,886 | | | | 13,827 | | | | 109 | | | | 4,734 | | | | (241 | ) | | | 70,170 | |
| | |
| | |
First Quarter 2015 | | Page 21 |
| Note 14 | First-Time Application of U.S. GAAP |
Hydro-Québec’s consolidated financial statements have been prepared in accordance with U.S. GAAP since January 1, 2015. Prior to that date, they were prepared in accordance with Canadian GAAP. The new accounting framework has been applied retrospectively.
In May, 2015, Hydro-Québec submitted a request to the Régie to change accounting policies for the purpose of setting future rates, given its changeover to U.S. GAAP. These financial statements take into account the expected effects of this request, especially with regard to regulatory assets and liabilities, which Hydro-Quebec considers it is likely to recover or settle subsequently. Actual results could differ significantly from those anticipated.
The tables and notes below describe the impact of the transition from Canadian GAAP to U.S. GAAP.
RECONCILIATION OF NET RESULT
| | | | | | | | | | |
| | | | | | | | | | | |
| | | Notes | | Three months
ended March 31, 2014 | | | Year ended December 31,
2014 | |
| | | | | | | | | | | |
Net result in accordance with Canadian GAAP | | | | | 1,763 | | | | 3,380 | |
Adjustments | | | | | | | | | | |
Employee future benefits | | a | | | 9 | | | | 34 | |
Other adjustments | | e | | | (22 | ) | | | (100) | |
| | | | | | | | | | |
| | | | | (13 | ) | | | (66) | |
| | | | | | | | | | | |
Net result in accordance with U.S. GAAP | | | | | 1,750 | | | | 3,314 | |
| | | | | | | | | | | |
| | | |
RECONCILIATION OF COMPREHENSIVE INCOME | | | | | | | | | | |
| | | | | | | | | | | |
| | | Notes | | Three months
ended March 31, 2014 | | | Year ended December 31,
2014 | |
| | | | | | | | | | | |
Comprehensive income in accordance with Canadian GAAP | | | | | 1,772 | | | | 3,759 | |
Adjustments | | | | | | | | | | |
Net result | | | | | (13 | ) | | | (66) | |
Employee future benefits | | a | | | 57 | | | | (470) | |
| | | | | | | | | | |
Other adjustments | | e | | | 3 | | | | 9 | |
| | | | | | | | | | |
| | | | | 47 | | | | (527) | |
| | | | | | | | | | | |
Comprehensive income in accordance with U.S. GAAP | | | | | 1,819 | | | | 3,232 | |
| | | | | | | | | | | |
| | |
| Page 22 | | First Quarter 2015 |
| Note 14 | First-Time Application of U.S. GAAP (continued) |
RECONCILIATION OF EQUITY
| | | | | | | | | | |
| | | Notes | | As at January 1,
2014 | | | As at December 31,
2014 | |
Retained earnings in accordance with Canadian GAAP | | | | | 15,568 | | | | 16,413 | |
Adjustments | | | | | | | | | | |
Employee future benefits | | a | | | (462 | ) | | | (426 | ) |
Other adjustments | | e | | | (93 | ) | | | (195 | ) |
| | | | | (555 | ) | | | (621 | ) |
Retained earnings in accordance with U.S. GAAP
| | | | | 15,013 | | | | 15,792 | |
| | | | | | | | | | |
| | | Notes | | As at January 1,
2014 | | | As at December 31, 2014 | |
Accumulated other comprehensive income in accordance with Canadian GAAP | | | | | (548 | ) | | | (169 | ) |
Adjustments | | | | | | | | | | |
Employee future benefits | | a | | | (1,355 | ) | | | (1,825 | ) |
Other adjustments | | e | | | (27 | ) | | | (18 | ) |
| | | | | | (1,382 | ) | | | (1,843 | ) |
Accumulated other comprehensive income in accordance with U.S. GAAP | | | | | (1,930 | ) | | | (2,012 | ) |
| | |
First Quarter 2015 | | Page 23 |
| Note 14 | First-Time Application of U.S. GAAP (continued) |
CONSOLIDATED BALANCE SHEETS
| | | | | | | | | | | | | | | | |
As at January 1, 2014 | | Notes | | | | Canadian GAAP | | | Adjustments | | | U.S. GAAP | |
ASSETS | | | | | | | | | | | | | | | | |
Current assets | | | | | | | | | | | | | | | | |
Cash and cash equivalents | | d | | | | | 1,695 | | | | (15 | ) | | | 1,680 | |
Short-term investments | | | | | | | 1,689 | | | | – | | | | 1,689 | |
Accounts receivable and other receivables | | d, e | | | | | 2,177 | | | | (15 | ) | | | 2,162 | |
Derivative instruments | | c, e | | | | | 883 | | | | (802 | ) | | | 81 | |
Regulatory assets | | | | | | | 1 | | | | – | | | | 1 | |
Materials, fuel and supplies | | d | | | | | 194 | | | | (2 | ) | | | 192 | |
| | | | | | | | 6,639 | | | | (834 | ) | | | 5,805 | |
Property, plant and equipment | | d, e | | | | | 59,077 | | | | (308 | ) | | | 58,769 | |
Intangible assets | | b, d, e | | | | | 2,323 | | | | (1,278 | ) | | | 1,045 | |
Investments | | d | | | | | 146 | | | | 717 | | | | 863 | |
Derivative instruments | | c, e | | | | | 659 | | | | (509 | ) | | | 150 | |
Regulatory assets | | a, b | | | | | 8 | | | | 3,102 | | | | 3,110 | |
Other assets | | a, d | | | | | 4,258 | | | | (3,786 | ) | | | 472 | |
| | | | | | | | 73,110 | | | | (2,896 | ) | | | 70,214 | |
LIABILITIES | | | | | | | | | | | | | | | | |
Current liabilities | | | | | | | | | | | | | | | | |
Borrowings | | | | | | | 23 | | | | – | | | | 23 | |
Accounts payable and accrued liabilities | | a, d | | | | | 2,229 | | | | 50 | | | | 2,279 | |
Dividend payable | | | | | | | 2,207 | | | | – | | | | 2,207 | |
Accrued interest | | | | | | | 890 | | | | – | | | | 890 | |
Asset retirement obligations | | d | | | | | 118 | | | | (1 | ) | | | 117 | |
Derivative instruments | | c, d | | | | | 576 | | | | (317 | ) | | | 259 | |
Current portion of long-term debt | | d | | | | | 1,157 | | | | (11 | ) | | | 1,146 | |
| | | | | | | | 7,200 | | | | (279 | ) | | | 6,921 | |
Long-term debt | | e | | | | | 43,067 | | | | 7 | | | | 43,074 | |
Asset retirement obligations | | | | | | | 834 | | | | – | | | | 834 | |
Derivative instruments | | c | | | | | 1,295 | | | | (1,007 | ) | | | 288 | |
Other liabilities | | a, e | | | | | 1,067 | | | | 320 | | | | 1,387 | |
Perpetual debt | | | | | | | 253 | | | | – | | | | 253 | |
| | | | | | | | 53,716 | | | | (959 | ) | | | 52,757 | |
EQUITY | | | | | | | | | | | | | | | | |
Share capital | | | | | | | 4,374 | | | | – | | | | 4,374 | |
| | | | | |
Retained earnings | | a, e | | | | | 15,568 | | | | (555 | ) | | | 15,013 | |
Accumulated other comprehensive income | | a, e | | | | | (548 | ) | | | (1,382 | ) | | | (1,930 | ) |
| | | | | | | 15,020 | | | | (1,937 | ) | | | 13,083 | |
| | | | | | | | 19,394 | | | | (1,937 | ) | | | 17,457 | |
| | | | | | | | 73,110 | | | | (2,896 | ) | | | 70,214 | |
| | |
| Page 24 | | First Quarter 2015 |
| Note 14 | First-Time Application of U.S. GAAP (continued) |
CONSOLIDATED BALANCE SHEETS
| | | | | | | | | | | | | | | | |
As at December 31, 2014 | | Notes | | | | Canadian GAAP | | | Adjustments | | | U.S. GAAP | |
ASSETS | | | | | | | | | | | | | | | | |
Current assets | | | | | | | | | | | | | | | | |
Cash and cash equivalents | | d | | | | | 1,275 | | | | (4 | ) | | | 1,271 | |
Short-term investments | | | | | | | 1,664 | | | | – | | | | 1,664 | |
Accounts receivable and other receivables | | d, e | | | | | 2,184 | | | | (12 | ) | | | 2,172 | |
Derivative instruments | | c, e | | | | | 507 | | | | (343 | ) | | | 164 | |
Regulatory assets | | | | | | | 182 | | | | – | | | | 182 | |
Materials, fuel and supplies | | d | | | | | 201 | | | | (2 | ) | | | 199 | |
| | | | | | | | 6,013 | | | | (361 | ) | | | 5,652 | |
Property, plant and equipment | | d, e | | | | | 60,713 | | | | (300 | ) | | | 60,413 | |
Intangible assets | | b, d, e | | | | | 2,278 | | | | (1,216 | ) | | | 1,062 | |
Investments | | d | | | | | 151 | | | | 712 | | | | 863 | |
Derivative instruments | | c, e | | | | | 1,047 | | | | (914 | ) | | | 133 | |
Regulatory assets | | a, b | | | | | 372 | | | | 4,349 | | | | 4,721 | |
Other assets | | a | | | | | 4,316 | | | | (3,855 | ) | | | 461 | |
| | | | | | | | 74,890 | | | | (1,585 | ) | | | 73,305 | |
LIABILITIES | | | | | | | | | | | | | | | | |
Current liabilities | | | | | | | | | | | | | | | | |
Borrowings | | | | | | | 126 | | | | – | | | | 126 | |
Accounts payable and accrued liabilities | | a, d | | | | | 2,099 | | | | 54 | | | | 2,153 | |
Dividend payable | | | | | | | 2,535 | | | | – | | | | 2,535 | |
Accrued interest | | | | | | | 907 | | | | – | | | | 907 | |
Asset retirement obligations | | | | | | | 79 | | | | – | | | | 79 | |
Derivative instruments | | c | | | | | 896 | | | | (737 | ) | | | 159 | |
Current portion of long-term debt | | | | | | | 906 | | | | – | | | | 906 | |
| | | | | | | | 7,548 | | | | (683 | ) | | | 6,865 | |
Long-term debt | | e | | | | | 43,571 | | | | 8 | | | | 43,579 | |
Asset retirement obligations | | | | | | | 804 | | | | – | | | | 804 | |
Derivative instruments | | c | | | | | 623 | | | | (528 | ) | | | 95 | |
Other liabilities | | a, e | | | | | 1,459 | | | | 2,082 | | | | 3,541 | |
Perpetual debt | | | | | | | 267 | | | | – | | | | 267 | |
| | | | | | | | 54,272 | | | | 879 | | | | 55,151 | |
EQUITY | | | | | | | | | | | | | | | | |
Share capital | | | | | | | 4,374 | | | | – | | | | 4,374 | |
Retained earnings | | a, e | | | | | 16,413 | | | | (621 | ) | | | 15,792 | |
Accumulated other comprehensive income | | a, e | | | | | (169 | ) | | | (1,843 | ) | | | (2,012 | ) |
| | | | | | | 16,244 | | | | (2,464 | ) | | | 13,780 | |
| | | | | | | | 20,618 | | | | (2,464 | ) | | | 18,154 | |
| | | | | | | | 74,890 | | | | (1,585 | ) | | | 73,305 | |
| | |
First Quarter 2015 | | Page 25 |
| Note 14 | First-Time Application of U.S. GAAP (continued) |
ADJUSTMENTS
| a) | Employee future benefits |
In accordance with Canadian GAAP, Hydro-Québec recognized accrued benefit assets and liabilities in the line items Other assets and Other liabilities on the balance sheet, namely the cumulative difference between accrued benefit costs recognized and the contributions that it made to the various plans.
Under U.S. GAAP, Hydro-Québec recognizes the funded status of plans on the balance sheet, namely the difference between the fair value of their respective assets and the value of projected benefit obligations. Consequently, on the date of transition to U.S. GAAP, unamortized net actuarial losses and the unamortized past service costs (credits) under the Pension Plan and other post-retirement benefits were recognized in Accumulated other comprehensive income, while post-employment actuarial gains were recognized in Retained earnings. Hydro-Québec also recognizes a regulatory asset against components of Accumulated other comprehensive income related to rate-regulated activities to take into account the expected recovery of these amounts in setting future rates.
For the three-month period ended March 31, 2014, these adjustments resulted in a $9-million increase in the net result ($34 million for fiscal 2014) and a $57-million increase in other comprehensive income ($470-million decrease for fiscal 2014).
As at January 1, 2014, these adjustments also resulted in a $2,112-million increase in regulatory assets ($3,425 million as at December 31, 2014), a $3,782-million decrease in employee future benefit assets ($3,855 million as at December 31, 2014), a $53-million increase in accounts payable and accrued liabilities ($55 million as at December 31, 2014), a $91-million increase in employee future benefit liabilities ($1,765 million as at December 31, 2014), a $462-million decrease in retained earnings ($426 million as at December 31, 2014) and a $1,355-million decrease in accumulated other comprehensive income ($1,825 million as at December 31, 2014).
In accordance with Canadian GAAP, development costs were capitalized when they met capitalization criteria. Under U.S. GAAP, these costs cannot be capitalized and must be expensed in the period in which they are incurred. A request was filed with the Régie in May 2015 to include in the rate base development costs related to regulated activities, including costs related to the implementation of the Energy Efficiency Plan, and to have these development costs recognized as regulatory assets.
This adjustment led to a $990-million decrease in intangible assets as at January 1, 2014 ($924 million as at December 31, 2014) and a corresponding increase in regulatory assets.
Moreover, in accordance with Canadian GAAP, the straight-line method of depreciation was adopted prospectively on January 1, 2010, for property, plant and equipment related to regulated activities, replacing the sinking fund method for regulatory accounting purposes. The cumulative variance between the amounts calculated under the two methods as at January 1, 2010, was on the order of $3.4 billion; it was applied to the balance of accumulated depreciation for property, plant and equipment to offset a regulatory asset integrated into the cost of the assets concerned, since it is taken into account in the depreciation and amortization expense for purposes of setting rates for the Transmission Provider and the Distributor.
In accordance with Canadian GAAP, set-off was compulsory if the entity had an unconditional and legally enforceable right of set-off and intended to proceed with a net settlement. Under U.S. GAAP, the legally enforceable right does not need to be unconditional. In addition, in the event a derivative instrument is subject to an enforceable master netting arrangement, the intent to proceed with a net settlement is not a required criterion.
As at January 1, 2014, this adjustment led to a $811-million decrease in derivative instruments classified under Current assets ($349 million as at December 31, 2014), a $510-million decrease in derivatives classified under Long-term assets ($916 million as at December 31, 2014), a $314-million decrease in derivatives classified under Current liabilities ($737 million as at December 31, 2014), and a $1,007-million decrease in derivatives classified under Long-term liabilities ($528 million as at December 31, 2014).
| | |
| Page 26 | | First Quarter 2015 |
| Note 14 | First-Time Application of U.S. GAAP (continued) |
In accordance with Canadian GAAP, interests in joint ventures were accounted for using the proportionate consolidation method. Under U.S. GAAP, such interests must be accounted for using the equity method. The adjustment as at January 1, 2014, and December 31, 2014, consists in reclassifying joint venture assets and liabilities to the line item Investments, as well as reclassifying the revenue and expenses thereof to the line item Revenue.
Other adjustments are related to various items.
CONSOLIDATED STATEMENTS OF CASH FLOWS
The transition from Canadian GAAP to U.S. GAAP has not had any significant impact on the totals presented as operating, investing and financing activities in the consolidated statements of cash flows.
| Note 15 | Other Information Regarding Fiscal 2014 |
in Accordance with U.S. GAAP
EMPLOYEE FUTURE BENEFITS
FUNDED STATUS OF PLANS AS AT DECEMBER 31, 2014
| | | | | | | | |
| | | | | | | | | |
| | | Pension Plan | | | Other plans | |
| | | | | | | | | |
Projected benefit obligations | | | 22,275 | | | | 1,339 | |
Plan assets at fair value | | | 20,778 | | | | 76 | |
| | | | | | | | | |
Funded status – Plan deficits | | | 1,497 | | | | 1,263 | |
| | | | | | | | | |
Presented as: | | | | | | | | |
Accounts payable and accrued liabilities | | | – | | | | 54 | |
Other liabilities | | | 1,497 | | | | 1,209 | |
| | | | | | | | | |
As at December 31, 2014, accumulated benefit obligations under the Pension Plan totaled $20,905 million. Unlike projected benefit obligations, accumulated benefit obligations do not take into account the salary escalation rate assumption.
PENSION PLAN ASSETS
Investments and their associated risks are managed in accordance with the Hydro-Québec Pension Fund Investment Management Policy (the Investment Policy), which is approved every year by Hydro-Québec’s Board of Directors. These risks include market risk, credit risk and liquidity risk. The Investment Policy provides for diversification of benchmark portfolio securities in order to maximize the expected return within an acceptable risk interval that takes into account the volatility of the Pension Plan’s surplus or deficit. Additional frameworks define the approval process for each type of transaction and establish rules governing the active management of the different portfolios as well as credit risk management. Compliance with the Investment Policy and the additional frameworks is monitored on a regular basis.
The Investment Policy allows the use of derivative instruments such as forward contracts, options and swaps.
As at December 31, 2014, the target allocation of Pension Plan investments, as established by the Investment Policy in effect, was as follows:
| | | | | | |
| | | | | | | |
% | | | | | Target allocation | |
| | | | | | | |
Fixed-income securities | | | | | 38.0 | |
Equities | | | | | 49.5 | |
Alternative investmentsa | | | | | 12.5 | |
| | | | | | | |
| | | | | 100.0 | |
| | | | | | | |
| a) | Alternative investments include real estate investments, private equity investments and commercial mortgages. |
| | |
First Quarter 2015 | | Page 27 |
| Note 15 | Other Information Regarding Fiscal 2014 |
in Accordance with U.S. GAAP (continued)
As at December 31, 2014, the fair value of Pension Plan investments, according to the fair value hierarchy defined in Note 8 and based on the type of securities, was as follows:
| | | | | | | | |
| | | | | | | | | |
| | Level 1 | | Level 2 | | Level 3 | | Total |
| | | | | | | | | |
Short-term investmentsa | | – | | 142 | | – | | 142 |
Bondsa | | 1,212 | | 6,743 | | – | | 7,955 |
Equities | | 9,001 | | – | | – | | 9,001 |
Real estate investmentsb | | 341 | | – | | 2,121 | | 2,462 |
Private equity investmentsc | | – | | – | | 87 | | 87 |
Hedge fundsd | | 443 | | 816 | | – | | 1,259 |
Derivativese | | (11) | | 35 | | – | | 24 |
| | | | | | | | |
| | 10,986 | | 7,736 | | 2,208 | | 20,930 |
| | | | | | | | | |
Otherf | | | | | | | | 166 |
| | | | | | | | | |
Fair value of investmentsg | | | | | | | | 21,096 |
| | | | | | | | | |
| a) | The fair value of Level 2 short-term investments and bonds is essentially measured by discounting future cash flows. |
| b) | The fair value of Level 3 real estate investments is measured by independent appraisers. The main method used is discounting future cash flows; it is based on observable and unobservable inputs, in particular the discount rate and future cash flows. |
| c) | The fair value of private equity investments is measured by various techniques including future cash flow discounting or using data such as capitalization multiples or the price of recent comparable transactions. |
| d) | The value of hedge funds is provided by the fund administrators and is based on the fair value of the underlying investments. |
| e) | Level 2 derivatives are measured using the market closing prices of the underlying products or by discounting net future cash flows. |
| f) | This item includes cash as well as interest and dividends receivable. |
| g) | The fair value of investments does not take into account amounts receivable and payable related to the pension fund. |
As at December 31, 2014, the reconciliation of the opening and closing balances of investments classified in Level 3 was as follows:
| | | | | | | | |
|
| | | | | | | | | |
| | | | Real estate investments | | Private equity investments | | Total |
| | | | | | | | | |
Balance as at January 1, 2014 | | | | 1,941 | | – | | 1,941 |
Unrealized net gains | | | | 33 | | 15 | | 48 |
Acquisitions and disposals | | | | 147 | | 72 | | 219 |
| | | | | | | | | |
Balance as at December 31, 2014 | | | | 2,121 | | 87 | | 2,208 |
| | | | | | | | | |
In 2014, there was no reclassification between Level 3 and Levels 1 and 2.
OTHER PLAN ASSETS
As at December 31, 2014, the assets of other plans were comprised of bonds issued by Hydro-Québec for a total of $69 million, as well as cash amounting to $7 million. Bonds are classified at Level 2 in the fair value hierarchy.
| | |
| Page 28 | | First Quarter 2015 |
| Note 15 | Other Information Regarding Fiscal 2014 |
in Accordance with U.S. GAAP (continued)
PLAN COSTS
NET COST COMPONENTS RECOGNIZED FOR FISCAL 2014
| | | | | | |
| | | | | | | |
| | | Pension Plan | | | Other plans |
| | | | | | | |
Current service costs | | | 345 | | | 42 |
Interest on obligations | | | 879 | | | 53 |
Expected return on assetsa | | | (1,189 | ) | | (3) |
Amortization of net actuarial loss | | | 181 | | | 11 |
Amortization of past service costs (credits) | | | 37 | | | (5) |
Actuarial loss on long-term disability salary insurance plan | | | – | | | 2 |
| | | | | | | |
Cost recognized for the year | | | 253 | | | 100 |
| | | | | | | |
| a) | The expected long-term rate of return on the Pension Plan assets is the average of the expected long-term return on the various asset classes, weighted according to their respective target weightings, plus a rebalancing, diversification and active management premium, minus expected management and administration fees. |
| | | | | | |
COMPONENTS OF OTHER COMPREHENSIVE INCOME FOR FISCAL 2014 |
| | | | | | | |
| | | Pension Plan | | | Other plansa |
| | | | | | | |
Actuarial loss | | | 1,829 | | | 181 |
Past service credits | | | – | | | (4) |
Amortization of net actuarial loss | | | (181 | ) | | (11) |
Amortization of past service costs (credits) | | | (37 | ) | | 5 |
| | | | | | | |
Total decrease in Other comprehensive income | | | 1,611 | | | 171 |
Less: Increase in the employee future benefit regulatory asset | | | 1,189 | | | 123 |
| | | | | | | |
Net decrease in Other comprehensive income for the year | | | 422 | | | 48 |
| | | | | | | |
COMPONENTS OF ACCUMULATED OTHER COMPREHENSIVE INCOME AS AT DECEMBER 31, 2014 |
| | | | | | | |
| | | Pension Plan | | | Other plansa |
| | | | | | | |
Unamortized net actuarial loss | | | 4,809 | | | 401 |
Unamortized past service costs (credits) | | | 88 | | | (48) |
| | | | | | | |
Aggregate of amounts recognized in Accumulated other comprehensive income | | | 4,897 | | | 353 |
Less: Employee future benefit regulatory asset | | | 3,183 | | | 242 |
| | | | | | | |
Net amount recognized in Accumulated other comprehensive income | | | 1,714 | | | 111 |
| | | | | | | |
| a) | Including the share of the interests accounted for on an equity basis. |
For fiscal 2015, the amortization of the net actuarial loss and the past service costs (credits) in the net cost recognized for the fiscal year should amount to $291 million and $29 million, respectively, for the Pension Plan, and to $24 million and $(5) million, respectively, for the other plans.
| | |
First Quarter 2015 | | Page 29 |
| Note 15 | Other Information Regarding Fiscal 2014 |
| | in Accordance with U.S. GAAP (continued) |
BENEFITS TO BE PAID IN NEXT 10 YEARS
| | | | | | | | |
| | | | | | | | | |
| | | Pension Plan | | | | Other plans | |
| | | | | | | | | |
2015 | | | 911 | | | | 65 | |
2016 | | | 957 | | | | 68 | |
2017 | | | 1,003 | | | | 70 | |
2018 | | | 1,049 | | | | 73 | |
2019 | | | 1,096 | | | | 76 | |
2020–2024 | | | 6,215 | | | | 414 | |
| | | | | | | | | |
In 2015, Hydro-Québec plans to make contributions of $309 million and $14 million, respectively, to the Pension Plan and other plans.
FINANCIAL INSTRUMENTS
The impact of derivatives on results and other comprehensive income is presented in the table below:
| | | | | | | | | | | | | | | | | | | | |
| | | | | | | | | | | | | | | | | | | | | |
| | | | | | | | | | | | | | | As at December 31, 2014 | |
| | | | | | | | | | | | | | | | | | | | | |
| |
| Losses (gains) on
derivatives designated as
fair value hedges |
| |
| Losses (gains) on derivatives designated as
cash flow hedges |
| | | Losses (gains) on derivatives not designated as hedges | |
| | | | | | | | | | | | | | | | | | | | | |
| |
| Recognized
in results |
| |
| Effective
portion
recognized in
Other
comprehensive
income |
| |
| Ineffective
portion
recognized
in results |
| |
| Effective portion
reclassified from
Other
comprehensive
income to
results |
| |
| Recognized
in results |
|
| | | | | | | | | | | | | | | | | | | | | |
Contracts – Currency risk | | | – | | | | (745 | ) | | | 3 | a | | | (728 | )a | | | (215 | ) |
Contracts – Currency risk and interest rate risk | | | (1 | ) | | | – | | | | – | | | | – | | | | – | |
Contracts – Interest rate risk | | | (254 | ) | | | 1 | | | | – | | | | 12 | b | | | – | |
Contracts – Price risk | | | – | | | | (185 | ) | | | (4 | )c | | | 175 | c | | | (12 | ) |
| | | | | | | | | | | | | | | | | | | | | |
| | | (255 | )d | | | (929 | ) | | | (1 | ) | | | (541 | ) | | | (227 | )e |
| | | | | | | | | | | | | | | | | | | | | |
Impact of hedged items on results | | | 241 | | | | | | | | – | | | | 541 | | | | 242 | |
| | | | | | | | | | | | | | | | | | | | | |
| a) | The impact of currency risk hedging transactions on results is recognized in the line item affected by the hedged item. Therefore, $(136) million was recognized in the line item Revenue, and $(589) million in the line item Financial expenses. |
| b) | The impact on results of interest rate risk hedging transactions is recognized in the line item affected by the hedged item. Therefore, $12 million was recognized in the line item Financial expenses. |
| c) | The impact on results of transactions to hedge the energy and aluminum price risk is recognized in the line item affected by the hedged item. Therefore, $166 million was recognized in the line item Revenue, and $5 million in the line item Electricity and fuel purchases. |
| d) | The impact of fair value risk hedging transactions on results, including the ineffective portion, is recognized in the line item affected by the hedged item, namely Financial expenses. |
| e) | These instruments are essentially related to integrated risk management transactions. The impact of these instruments on results is recognized in the line item affected by the managed risk. Therefore, $(8) million was recognized in the line item Revenue, $(3) million in the line item Electricity and fuel purchases, and $(216) million in the line item Financial expenses. |
| | |
| Page 30 | | First Quarter 2015 |
CONSOLIDATED FINANCIAL HIGHLIGHTS
(UNAUDITED)
Tabular amounts are in millions of Canadian dollars.
| | | | | | | | | | | | | | |
| | | Three months ended
March 31 |
Summary of Results | | | 2015 | | | | 2014 | | | | | Change (%) |
Revenue | | | 4,600 | | | | 4,616 | | | | | 0.3 | | i |
Expenditure | | | 2,208 | | | | 2,262 | | | | | 2.4 | | i |
Financial expenses | | | 604 | | | | 604 | | | | | – | | – |
Net result | | | 1,788 | | | | 1,750 | | | | | 2.2 | | h |
| | | | | | | | | | | | | | | |
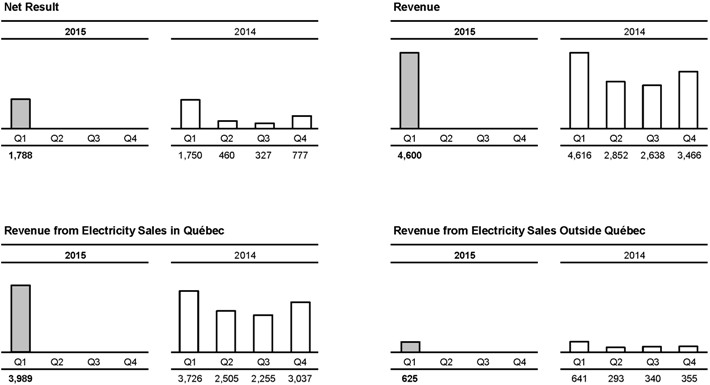
Note: Throughout the Consolidated Financial Highlights, certain comparative figures have been restated based on the retrospective application of U.S. GAAP.
| | |
First Quarter 2015 | | Page 31 |
| | |
| | Highlights |
| |
| Transmission | | Work on the Hertel–Viger line |
| | In January, Hydro-Québec began moving a segment of the 315-kV Hertel–Viger line, in Brossard, to free up the corridor of the new Champlain bridge across the Saint-Laurent and allow Infrastructure Canada to build the bridge. Construction of the new line segment should be completed in July 2015, and the existing segment will subsequently be dismantled. |
| |
| | Authorization of the Chamouchouane–Bout-de-l’Île project |
| | In March, the Régie de l’énergie authorized the 735-kV Chamouchouane–Bout-de-l’Île project, which includes three components: a 400-km line between Chamouchouane substation in the Saguenay–Lac-Saint-Jean region and the metropolitan Montréal loop, a distinct 19-km tap line to Bout-de-l’Île substation in Montréal, and Judith-Jasmin substation, in Terrebonne. The project will create the equivalent of more than 1,000 full-time jobs in Québec over a five-year period. |
| |
| Distribution | | Emergency assistance to National Grid |
| | In January, nearly 180 Hydro-Québec employees, including 150 line workers as well as technical and logistics personnel, were dispatched to Boston to lend a hand to National Grid following the winter storm that hit the region. Hydro-Québec provides such emergency assistance to neighboring utilities as a member of the North Atlantic Mutual Assistance Group. |
| |
| | Rate increase effective April 1, 2015 |
| | In March, the Régie de l’énergie authorized an average increase of 2.9% for all rates except Rate L, applicable only to large-power industrial customers, for whom the increase is 2.5%. These increases went into effect April 1, 2015. The 2.9% rate adjustment adds approximately $1.49 to the monthly electricity bill for a three-bedroom apartment, $3.79 for a small house, $5.41 for a midsize house and $6.98 for a large one. |
| |
| | Tender call for 500 MW of capacity |
| | Also in March, Hydro-Québec Distribution launched a tender call for the purchase of 500 MW of firm capacity and associated energy to meet the long-term needs of Québec customers. The energy must be available for a minimum of 300 hours, mainly in winter. The contracts will cover a 20-year period commencing on the starting date of deliveries, and the capacity must be available and guaranteed as of December 1, 2018. |
| | |
| Page 32 | | First Quarter 2015 |
| | |
Ground transportation electrification | | Nissan to support the expansion of the Electric Circuit In January, the Japanese automaker Nissan announced that it would support the expansion of the Electric Circuit with a significant investment in 25 direct-current fast charging sites. The partnering agreement is part of a new phase of development of the Electric Circuit, which targets up to 50 sites in high-traffic areas along major roads and in large urban centres. |
| |
| |
Technological innovation | | Breakthrough towards longer-lasting rechargeable batteries In February, researchers from the A*STAR Institute of Bioengineering and Nanotechnology (IBN), based in Singapore, and Hydro-Québec’s research institute, IREQ, announced that they had synthesized silicate-based nanoboxes that could one day replace phosphate as a cathode material and thus double the storage capacity of lithium-ion batteries. This breakthrough could hold the key to longer-lasting rechargeable batteries for electric vehicles and mobile devices. |
| |
| | |
First Quarter 2015 | | Page 33 |
Hydro-Québec, 75, boul. René-Lévesque Ouest, Montréal (Québec) H2Z 1A4
Ce document est également publié en français.
www.hydroquebec.com
ISSN 0848-5836