Exhibit 99.5

Third Quarter 2016
| | | | |
| | Message from the Chairman of the Board and the President and Chief Executive Officer |
| |
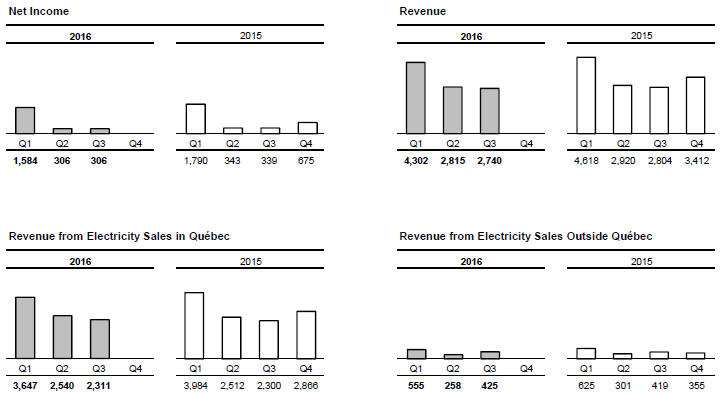
Third quarter | | For the three months ended September 30, 2016, Hydro-Québec posted net income of $306 million. |
| |
| | On markets outside Québec, Hydro-Québec Production recorded net exports of 9.8 TWh, a historic quarterly high and a 1.4-TWh increase compared to the previous record, set in the third quarter of 2015. Good availability of generating and transmission facilities, combined with high runoff, enabled the division to seize several business opportunities, making it possible to completely offset the impact of lower prices on energy markets. |
| |
| | Financial expenses increased by $26 million, essentially on account of the foreign currency effect on working capital denominated in U.S. dollars. Because the Canadian dollar did not depreciate as markedly as in third quarter 2015, the exchange gain was lower than last year. This is the main factor behind the difference compared to 2015 net income, which was $339 million. |
| |
Summary of results for the first three quarters | | For the nine months ended September 30, 2016, Hydro-Québec recorded net income of $2,196 million, compared to $2,472 million in the same period of 2015. |
| | On the Québec market, supplies provided by Hydro-Québec Production to Hydro-Québec Distribution decreased by $156 million, mainly as a result of first-quarter temperatures, which were much colder in 2015 than in 2016. On average, temperatures were 5°C lower than normal in the first three months of 2015, whereas they were 1°C higher than normal in the first quarter of 2016. |
| |
| | On markets outside Québec, Hydro-Québec Production’s net electricity exports decreased by $79 million. They reached a historic high of 24.4 TWh after three quarters, which is all the more remarkable given the unavailability of a major power transmission link between Québec and New England in April and May 2016. The volume increase, combined with the positive impact of the company’s risk management strategy, partly offset the decrease in prices on energy markets. |
| | | | |
| |
Consolidated results for the first three quarters | | Revenue totaled $9,857 million, compared to $10,342 million in 2015. The difference is primarily due to a $298-million decrease in revenue from electricity sales in Québec, largely as a result of temperatures, which led to a 4.1-TWh reduction in electricity sales compared to last year. |
| |
| | Total expenditure amounted to $5,766 million, compared to $6,035 million in 2015. The decrease is partly attributable to a $93-million reduction in short-term market purchases by Hydro-Québec Distribution. It should be recalled that in 2015, the division had to purchase large quantities of energy on the markets to meet ad hoc requirements resulting from the very cold winter temperatures. It is also due to a $96-million decrease in depreciation and amortization, essentially related to regulatory assets and liabilities. |
| |
| | Financial expenses totaled $1,895 million, compared to $1,835 million last year. This increase is chiefly due to the foreign currency effect on working capital denominated in U.S. dollars. |
| |
Segmented results for the first three quarters | | Generation |
| | Hydro-Québec Production posted net income of $1,438 million, compared to $1,753 million in 2015. Net electricity sales to Hydro-Québec Distribution decreased by $156 million, primarily because of a reduction in peak supplies, which were greater in 2015 on account of the harsh winter. Net electricity exports decreased by $79 million. They reached a historic high of 24.4 TWh after three quarters, which is all the more remarkable given the unavailability of a major power transmission link between Québec and New England in April and May 2016. The volume increase, combined with the positive impact of the company’s risk management strategy, partly offset the decrease in prices on energy markets. Financial expenses increased by $58 million, chiefly on account of the foreign currency effect on working capital denominated in U.S. dollars. |
| |
| | Transmission |
| |
| | Hydro-Québec TransÉnergie’s net income was $471 million, comparable to the $447 million recorded in the first nine months of 2015. |
| |
| | Distribution |
| |
| | Hydro-Québec Distribution’s net income totaled $215 million, compared to $219 million in 2015. Revenue from electricity sales decreased by $298 million, mainly because of a 4.1-TWh volume reduction attributable to the fact that temperatures were much colder than normal in the first three months of 2015, which led to additional sales of 4.3 TWh or $338 million, whereas they were milder than normal in the first quarter of 2016. Electricity purchases, the related transmission costs and fuel purchases decreased by $287 million. More specifically, supplies from Hydro-Québec Production were $156 million lower, while third-party supplies decreased by $61 million, essentially on account of a $93-million reduction in short-term market purchases. |
| | |
| Page 2 | | Third Quarter 2016 |
| | | | |
| |
| | Construction |
| |
| | The Construction segment includes activities related to the design, construction and refurbishment of power generation and transmission facilities. These projects are carried out by Hydro-Québec Innovation, équipement et services partagés and by Société d’énergie de la Baie James (SEBJ). |
| |
| | The segment’s volume of activity totaled $1,497 million, compared to $1,396 million in 2015. Projects under way for Hydro-Québec Production mainly include ongoing construction of the Romaine hydroelectric complex. Work in progress for Hydro-Québec TransÉnergie includes expansion of the transmission system in the Minganie region, implementation of the Chamouchouane–Bout-de-l’Île project, reconstruction of De Lorimier substation and the deployment of related lines, as well as various projects stemming from continued investment in asset reliability and sustainment. |
| |
Investment | | In the first nine months of 2016, Hydro-Québec invested $2,308 million in property, plant and equipment and intangible assets, compared to $2,347 million in 2015. |
| |
| | Most of Hydro-Québec Production’s investments were allocated to ongoing construction of the Romaine complex. The division also carried out refurbishments at a number of facilities to optimize performance and ensure the long-term operability of the generating fleet. |
| |
| | Hydro-Québec TransÉnergie continued investing in its transmission system. Among other things, it continued work to connect the Romaine complex as part of the expansion of the transmission system in the Minganie region and to implement the 735-kV Chamouchouane–Bout-de-l’Île project. The division also carried out emergency work to replace PK circuit breakers and conducted facility maintenance and improvement activities to ensure the reliability and long-term operability of its transmission assets and to enhance service quality. |
| |
| | Hydro-Québec Distribution kept up investments to handle the growth of its Québec customer base and to ensure the long-term operability of its facilities. In addition, with a view to enhancing service quality, it continued to expand the range of its online self-service options to make it easier for customers to manage their accounts. |
| |
Financing | | During the third quarter, Hydro-Québec issued variable-rate notes for a total amount of $1.0 billion, maturing in 2019. This borrowing was made on the Canadian market. |
| |
| | Since the beginning of 2016, financing activities have raised $2.0 billion. The funds were used to support part of the investment program and to refinance maturing debt. |
| | |
| | Michael D. Penner | | Éric Martel |
| | |
| | Chairman of the Board | | President and Chief Executive Officer |
| | |
| | November 18, 2016 | | |
| | |
Third Quarter 2016 | | Page 3 |
CONSOLIDATED FINANCIAL STATEMENTS
(UNAUDITED)
CONSOLIDATED STATEMENTS OF OPERATIONS
| | | | | | | | | | | | | | | | |
In millions of Canadian dollars (unaudited) | | Three months ended September 30 | | Nine months ended September 30 |
| | | | | | | | | | | | | | | | | |
| | | | | | |
| | | Notes | | | | | | 2016 | | 2015 | | 2016 | | 2015 |
| | | | | | | | | | | | | | | | | |
| | | | | | |
Revenue | | | | | | | | | | 2,740 | | 2,804 | | 9,857 | | 10,342 |
| | | | | | | | | | | | | | | | | |
Expenditure | | | | | | | | | | | | | | | | |
Operations | | | | | | | | | | 544 | | 601 | | 1,726 | | 1,860 |
Electricity and fuel purchases | | | | | | | | | | 402 | | 398 | | 1,386 | | 1,461 |
Depreciation and amortization | | | 4 | | | | | | | 633 | | 674 | | 1,886 | | 1,982 |
Taxes | | | | | | | | | | 239 | | 202 | | 768 | | 732 |
| | | | | | | | | | | | | | | | |
| | | | | | | | | | 1,818 | | 1,875 | | 5,766 | | 6,035 |
| | | | | | | | | | | | | | | | | |
Operating income | | | | | | | | | | 922 | | 929 | | 4,091 | | 4,307 |
Financial expenses | | | 5 | | | | | | | 616 | | 590 | | 1,895 | | 1,835 |
| | | | | | | | | | | | | | | | | |
Net income | | | | | | | | | | 306 | | 339 | | 2,196 | | 2,472 |
| | | | | | | | | | | | | | | | | |
| | | | |
CONSOLIDATED STATEMENTS OF COMPREHENSIVE INCOME | | | | | | | | | |
In millions of Canadian dollars (unaudited) | | Three months ended September 30 | | Nine months ended September 30 |
| | | | | | | | | | | | | | | | | |
| | | | | | |
| | | Note | | | | | | 2016 | | 2015 | | 2016 | | 2015 |
| | | | | | | | | | | | | | | | | |
| | | | | | |
Net income | | | | | | | | | | 306 | | 339 | | 2,196 | | 2,472 |
| | | | | | | | | | | | | | | | | |
Other comprehensive income | | | | | | | | | | | | | | | | |
Change in deferred (losses) gains on items designated as cash flow hedges | | | 6 | | | | | | | (2) | | 982 | | (200) | | 1,617 |
Reclassification to results of deferred (gains) losses on items designated as cash flow hedges | | | 6 | | | | | | | (104) | | (634) | | 127 | | (1,197) |
Actuarial loss and past service costs for employee future benefits | | | | | | | | | | – | | (22) | | – | | (22) |
Reclassification to results of net actuarial losses and past service costs (credits) for employee future benefits | | | | | | | | | | 28 | | 39 | | 85 | | 209 |
Translation differences in financial statements of foreign operations | | | | | | | | | | (1) | | – | | (1) | | – |
| | | | | | | | | | | | | | | | |
| | | | | | | | | | (79) | | 365 | | 11 | | 607 |
| | | | | | | | | | | | | | | | | |
Comprehensive income | | | | | | | | | | 227 | | 704 | | 2,207 | | 3,079 |
| | | | | | | | | | | | | | | | | |
The accompanying notes are an integral part of the consolidated financial statements.
| | |
| Page 4 | | Third Quarter 2016 |
CONSOLIDATED BALANCE SHEETS
| | | | | | | | |
| | | | | | | | | |
In millions of Canadian dollars (unaudited) | | Notes | | | | As at September 30,
2016 | | As at December 31,
2015 |
| | | | | | | | | |
ASSETS | | | | | | | | |
| | | | | | | | | |
Current assets | | | | | | | | |
Cash and cash equivalents | | | | | | 2,853 | | 2,648 |
Short-term investments | | | | | | 2,161 | | 1,895 |
Accounts receivable and other receivables | | | | | | 1,633 | | 2,242 |
Derivative instruments | | 6 | | | | 122 | | 274 |
Regulatory assets | | | | | | 145 | | 122 |
Materials, fuel and supplies | | | | | | 219 | | 212 |
| | | | | | | | |
| | | | | | 7,133 | | 7,393 |
| | | | | | | | | |
Property, plant and equipment | | | | | | 62,259 | | 61,558 |
Intangible assets | | | | | | 938 | | 1,014 |
Investments | | | | | | 886 | | 859 |
Derivative instruments | | 6 | | | | 296 | | 128 |
Regulatory assets | | | | | | 3,874 | | 3,939 |
Other assets | | | | | | 238 | | 308 |
| | | | | | | | | |
| | | | | | 75,624 | | 75,199 |
| | | | | | | | | |
LIABILITIES | | | | | | | | |
| | | | | | | | | |
Current liabilities | | | | | | | | |
Borrowings | | | | | | 2,148 | | 9 |
Accounts payable and accrued liabilities | | | | | | 1,807 | | 2,278 |
Dividend payable | | | | | | – | | 2,360 |
Accrued interest | | | | | | 489 | | 913 |
Asset retirement obligations | | | | | | 80 | | 85 |
Derivative instruments | | 6 | | | | 82 | | 299 |
Regulatory liabilities | | | | | | 12 | | 49 |
Current portion of long-term debt | | 6 | | | | 1,368 | | 2,059 |
| | | | | | | | |
| | | | | | 5,986 | | 8,052 |
| | | | | | | | | |
Long-term debt | | 6 | | | | 44,194 | | 43,613 |
Asset retirement obligations | | | | | | 781 | | 780 |
Derivative instruments | | 6 | | | | 6 | | 5 |
Regulatory liabilities | | | | | | 381 | | 392 |
Other liabilities | | | | | | 2,308 | | 2,571 |
Perpetual debt | | 6 | | | | 286 | | 311 |
| | | | | | | | |
| | | | | | 53,942 | | 55,724 |
| | | | | | | | | |
EQUITY | | | | | | | | |
| | | | | | | | | |
Share capital | | | | | | 4,374 | | 4,374 |
Retained earnings | | | | | | 18,742 | | 16,546 |
Accumulated other comprehensive income | | | | | | (1,434) | | (1,445) |
| | | | | | | | |
| | | | | | 21,682 | | 19,475 |
| | | | | | | | | |
| | | | | | 75,624 | | 75,199 |
| | | | | | | | | |
Contingencies | | 10 | | | | | | |
| | | | | | | | | |
The accompanying notes are an integral part of the consolidated financial statements.
| | |
On behalf of the Board of Directors, | | |
| |
/s/ Michelle Cormier | | /s/ Michael D. Penner |
Chair of the Audit Committee | | Chairman of the Board |
| | |
Third Quarter 2016 | | Page 5 |
CONSOLIDATED STATEMENTS OF CHANGES IN EQUITY
| | | | | | | | | | | | | | | | | | | | | | |
| | | | | | | | | | | | | | | | | | | | | | | |
In millions of Canadian dollars (unaudited) | | Nine months ended September 30 | |
| | | | | | | | | | | | | | | | | | | | | | | |
| | | | | | |
| | | Note | | | | | Share capital | | | Retained earnings | | | Accumulated
other
comprehensive
income | | | Total equity | |
| | | | | | | | | | | | | | | | | | | | | | | |
| | | | | | |
Balance as at January 1, 2016 | | | | | | | | | 4,374 | | | | 16,546 | | | | (1,445) | | | | 19,475 | |
| | | | | | |
Net income | | | | | | | | | – | | | | 2,196 | | | | – | | | | 2,196 | |
Other comprehensive income | | | 9 | | | | | | – | | | | – | | | | 11 | | | | 11 | |
| | | | | | | | | | | | | | | | | | | | | | | |
| | | | | | |
Balance as at September 30, 2016 | | | | | | | | | 4,374 | | | | 18,742 | | | | (1,434) | | | | 21,682 | |
| | | | | | | | | | | | | | | | | | | | | | | |
| | | | | | |
Balance as at January 1, 2015 | | | | | | | | | 4,374 | | | | 15,759 | | | | (2,172) | | | | 17,961 | |
| | | | | | |
Net income | | | | | | | | | – | | | | 2,472 | | | | – | | | | 2,472 | |
Other comprehensive income | | | 9 | | | | | | – | | | | – | | | | 607 | | | | 607 | |
| | | | | | | | | | | | | | | | | | | | | | | |
| | | | | | |
Balance as at September 30, 2015 | | | | | | | | | 4,374 | | | | 18,231 | | | | (1,565) | | | | 21,040 | |
| | | | | | | | | | | | | | | | | | | | | | | |
The accompanying notes are an integral part of the consolidated financial statements.
| | |
| Page 6 | | Third Quarter 2016 |
CONSOLIDATED STATEMENTS OF CASH FLOWS
| | | | | | | | | | | | | | | | |
In millions of Canadian dollars (unaudited) | | Three months ended September 30 | | Nine months ended September 30 |
| | | | | | | | | | | | | | | | | |
| | | | | | |
| | | Notes | | | | | | 2016 | | 2015 | | 2016 | | 2015 |
| | | | | | | | | | | | | | | | | |
Operating activities | | | | | | | | | | | | | | | | |
Net income | | | | | | | | | | 306 | | 339 | | 2,196 | | 2,472 |
Adjustments to determine net cash flows from operating activities | | | | | | | | | | | | | | | | |
Depreciation and amortization | | | 4 | | | | | | | 633 | | 674 | | 1,886 | | 1,982 |
Amortization of premiums, discounts and issue expenses related to debt securities | | | | | | | | | | 44 | | 40 | | 128 | | 117 |
Excess of (amounts paid over net cost recognized) net cost recognized over amounts paid for employee future benefits | | | | | | | | | | (69) | | 45 | | (181) | | 123 |
Other | | | | | | | | | | 208 | | (31) | | 277 | | 252 |
Regulatory assets and liabilities | | | | | | | | | | (245) | | (10) | | (277) | | (17) |
Change in non-cash working capital items | | | 7 | | | | | | | 134 | | (39) | | (311) | | (735) |
| | | | | | | | | | | | | | | | |
| | | | | | | | | | 1,011 | | 1,018 | | 3,718 | | 4,194 |
| | | | | | | | | | | | | | | | | |
Investing activities | | | | | | | | | | | | | | | | |
Additions to property, plant and equipment | | | | | | | | | | (829) | | (844) | | (2,249) | | (2,269) |
Additions to intangible assets | | | | | | | | | | (17) | | (25) | | (59) | | (78) |
Net (acquisition) disposal of short-term investments | | | | | | | | | | (741) | | (182) | | (253) | | 460 |
Other | | | | | | | | | | 3 | | 6 | | (7) | | 8 |
| | | | | | | | | | | | | | | | |
| | | | | | | | | | (1,584) | | (1,045) | | (2,568) | | (1,879) |
| | | | | | | | | | | | | | | | | |
Financing activities | | | | | | | | | | | | | | | | |
Issuance of long-term debt | | | | | | | | | | 999 | | – | | 2,011 | | 13 |
Repayment of long-term debt | | | | | | | | | | (15) | | (126) | | (1,916) | | (1,026) |
Cash receipts arising from credit risk management | | | 6 | | | | | | | 3,914 | | 2,501 | | 9,633 | | 5,985 |
Cash payments arising from credit risk management | | | 6 | | | | | | | (3,955) | | (1,486) | | (10,262) | | (4,614) |
Net change in borrowings | | | | | | | | | | 864 | | (989) | | 2,125 | | 686 |
Dividend paid | | | | | | | | | | – | | – | | (2,360) | | (2,535) |
Other | | | | | | | | | | 23 | | 197 | | (154) | | 367 |
| | | | | | | | | | | | | | | | |
| | | | | | | | | | 1,830 | | 97 | | (923) | | (1,124) |
| | | | | | | | | | | | | | | | | |
Foreign currency effect on cash and cash equivalents | | | | | | | | | | 1 | | 23 | | (22) | | 44 |
| | | | | | | | | | | | | | | | | |
Net change in cash and cash equivalents | | | | | | | | | | 1,258 | | 93 | | 205 | | 1,235 |
Cash and cash equivalents, beginning of period | | | | | | | | | | 1,595 | | 2,413 | | 2,648 | | 1,271 |
| | | | | | | | | | | | | | | | | |
Cash and cash equivalents, end of period | | | | | | | | | | 2,853 | | 2,506 | | 2,853 | | 2,506 |
| | | | | | | | | | | | | | | | | |
Supplementary cash flow information | | | 7 | | | | | | | | | | | | | |
| | | | | | | | | | | | | | | | | |
The accompanying notes are an integral part of the consolidated financial statements.
| | |
Third Quarter 2016 | | Page 7 |
NOTES TO CONSOLIDATED FINANCIAL STATEMENTS
(UNAUDITED)
For the three- and nine-month periods ended September 30, 2016 and 2015
Amounts in tables are in millions of Canadian dollars, unless otherwise indicated.
| Note 1 | Basis of Presentation |
Hydro-Québec’s consolidated financial statements have been prepared in accordance with United States generally accepted accounting principles (U.S. GAAP).
These quarterly consolidated financial statements, including these notes, do not contain all the required information regarding annual consolidated financial statements and should therefore be read in conjunction with the consolidated financial statements and accompanying notes in Hydro-Québec’s Annual Report 2015.
The accounting policies used to prepare the quarterly consolidated financial statements are consistent with those presented in Hydro-Québec’s Annual Report 2015, except for the recent changes.
Management is of the opinion that these quarterly consolidated financial statements include all the necessary adjustments to present fairly, in all material respects, the consolidated financial position of Hydro-Québec.
Hydro-Québec’s quarterly results are not necessarily indicative of results for the year on account of seasonal temperature fluctuations. Because of higher electricity demand during winter months, revenue from electricity sales in Québec is higher during the first and fourth quarters.
Management has reviewed events occurring until November 18, 2016, the date of approval of these quarterly consolidated financial statements by the Board of Directors, to determine whether circumstances warranted the recording or presentation of events subsequent to the balance sheet date.
| Note 2 | Changes to Accounting Policies |
RECENT CHANGES
Hedge accounting
On January 1, 2016, Hydro-Québec early adopted Accounting Standards Update (ASU) 2016-05, Derivatives and Hedging (Topic 815): Effect of Derivative Contract Novations on Existing Hedge Accounting Relationships, as issued by the Financial Accounting Standards Board (FASB). This ASU states that hedge accounting may continue to apply to a derivative that has been designated as a hedging instrument if this derivative is novated to a new counterparty, as long as all the other applicable conditions continue to be met. It was applied prospectively and has not had any impact on Hydro-Québec’s consolidated financial statements.
Intangible assets
On January 1, 2016, Hydro-Québec adopted ASU 2015-05, Intangibles—Goodwill and Other—Internal-Use Software (Subtopic 350-40): Customer’s Accounting for Fees Paid in a Cloud Computing Arrangement, as issued by the FASB. This ASU clarifies the circumstances in which a cloud computing arrangement includes an internal-use software licence. It was applied prospectively and has not had any impact on Hydro-Québec’s consolidated financial statements.
Consolidation
On January 1, 2016, Hydro-Québec adopted ASU 2015-02, Consolidation (Topic 810): Amendments to the Consolidation Analysis, as issued by the FASB. This ASU amends the guidance on the analysis to be performed by a reporting entity in order to determine if it must consolidate certain types of legal entities. It was applied on a modified retrospective basis and has not had any impact on Hydro-Québec’s consolidated financial statements.
Statement of operations
On January 1, 2016, Hydro-Québec adopted ASU 2015-01, Income Statement—Extraordinary and Unusual Items (Subtopic 225-20): Simplifying Income Statement Presentation by Eliminating the Concept of Extraordinary Items, as issued by the FASB. It was applied prospectively and has not had any impact on Hydro-Québec’s consolidated financial statements.
| | |
| Page 8 | | Third Quarter 2016 |
| Note 2 | Changes to Accounting Policies (continued) |
STANDARDS ISSUED BUT NOT YET EFFECTIVE
Statement of cash flows
In August 2016, the FASB issued ASU 2016-15, Statement of Cash Flows (Topic 230): Classification of Certain Cash Receipts and Cash Payments. This ASU clarifies how certain items are presented and classified in the statement of cash flows. It will apply on a full retrospective basis to interim and annual financial statements for annual periods beginning on or after January 1, 2018. Hydro-Québec is currently examining the impact of this ASU on its consolidated financial statements.
Investments
In March 2016, the FASB issued ASU 2016-07, Investments—Equity Method and Joint Ventures (Topic 323): Simplifying the Transition to the Equity Method of Accounting. This ASU simplifies the application of the equity method of accounting in the case where a reporting entity increases its level of investment in another entity or its degree of influence over such an entity. The ASU will apply prospectively to transactions as of January 1, 2017. Hydro-Québec is currently examining the impact of this ASU on its consolidated financial statements.
Leases
In February 2016, the FASB issued ASU 2016-02, Leases (Topic 842). This ASU provides guidance on lease definition, recognition and presentation and requires the recognition of assets and liabilities by lessees for all operating and finance leases with a term of more than 12 months. It will apply on a modified retrospective basis to interim and annual financial statements for annual periods beginning on or after January 1, 2019. Hydro-Québec is currently examining the impact of this ASU on its consolidated financial statements.
Financial instruments
In January 2016, the FASB issued ASU 2016-01, Financial Instruments—Overall (Subtopic 825-10): Recognition and Measurement of Financial Assets and Financial Liabilities. This ASU provides guidance on the recognition and measurement of financial assets and financial liabilities. It will be applied on a simplified retrospective basis to interim and annual financial statements for annual periods beginning on or after January 1, 2018, and should not have any significant impact on Hydro-Québec’s consolidated financial statements.
In June 2016, the FASB issued ASU 2016-13, Financial Instruments—Credit Losses (Topic 326): Measurement of Credit Losses on Financial Instruments. This ASU provides new guidance on the impairment of financial assets that are not accounted for at fair value through net income. It will be applied on a modified retrospective basis to the consolidated financial statements for annual periods beginning on or after January 1, 2020. Hydro-Québec is currently examining the impact of this ASU on its consolidated financial statements, but does not intend early adoption.
Revenue
In May 2014, the FASB issued ASU 2014-09, Revenue from Contracts with Customers (Topic 606). This ASU provides guidance on the recognition of revenue at the time that goods or services are transferred to a client, for an amount that reflects the payment which the entity expects to receive in exchange for the goods or services.
In August 2015, the FASB issued ASU 2015-14, Revenue from Contracts with Customers (Topic 606): Deferral of the Effective Date, which defers the effective date of this guidance by one year.
In March 2016, the FASB issued ASU 2016-08, Revenue from Contracts with Customers (Topic 606): Principal versus Agent Considerations (Reporting Revenue Gross versus Net). This ASU clarifies the guidance used to determine if an entity is acting on its own behalf or as an intermediary.
In April 2016, the FASB issued ASU 2016-10, Revenue from Contracts with Customers (Topic 606): Identifying Performance Obligations and Licensing. This ASU clarifies guidance on identifying performance obligations and the licensing of intellectual property rights.
In May 2016, the FASB issued ASU 2016-12, Revenue from Contracts with Customers (Topic 606): Narrow-Scope Improvements and Practical Expedients. This ASU clarifies the guidance on assessing collectibility, on noncash considerations and on completed contracts on the date of initial application.
These ASUs will apply on a full or simplified retrospective basis to consolidated financial statements for annual periods beginning on or after January 1, 2018. Hydro-Québec is currently examining their impact on its consolidated financial statements, but does not intend early adoption.
| | |
Third Quarter 2016 | | Page 9 |
DISTRIBUTION
In decision D-2016-047 of March 23, 2016, the Régie de l’énergie (the Régie) authorized an increase of 0.70% in all Hydro-Québec electricity rates except Rate L, which remains the same. The new rates are effective as of April 1, 2016. The authorized return on the rate base was set at 6.95%, assuming a capitalization with 35% equity.
In decision D-2016-033 of March 7, 2016, the Régie authorized the Distributor to include in its 2016–2017 rates a debit amount of $248 million for variances in supply costs for electricity in excess of the heritage pool in 2013 and 2014, a credit amount of $168 million for revenue variances related to climate conditions in 2015, as well as a credit amount of $3 million corresponding to the balance of the deferral account for the changeover to U.S. GAAP.
In decision D-2016-105 of July 5, 2016, the Régie revoked decisions D-2015-179 and D-2016-069, in which it had approved an agreement regarding use of a generating station during peak demand periods.
TRANSMISSION
In decision D-2016-046 of March 23, 2016, the Régie set Hydro-Québec’s power transmission rates for 2016. The authorized return on the rate base was set at 6.85%, assuming a capitalization with 30% equity.
In decision D-2016-029 of March 2, 2016, the Régie authorized the Transmission Provider to include in its 2016 rates a credit amount of $46 million corresponding to the balance of the deferral account for the changeover to U.S. GAAP, as well as a credit amount of up to $6 million to implement and apply the North American Electric Reliability Corporation’s Critical Infrastructure Protection Version 5 (CIP V5) standards.
In partial and interim decision D-2016-077 of May 18, 2016, the Régie authorized the Transmission Provider to create a non-rate-base deferral account for the recognition of all expenses incurred as of April 11, 2016, as part of the project involving the emergency replacement of PK model circuit breakers. These expenses will bear interest. As at September 30, 2016, $31 million had been recognized in this account.
| Note 4 | Depreciation and Amortization |
| | | | | | | | | | | | | | | | |
| | | |
| | | Three months ended September 30 | | | Nine months ended September 30 | |
| | | | | | | | | | | | | | | | | |
| | | | |
| | | 2016 | | | 2015 | | | 2016 | | | 2015 | |
| | | | | | | | | | | | | | | | | |
| | | | |
Property, plant and equipment | | | 555 | | | | 540 | | | | 1,652 | | | | 1,606 | |
| | | | |
Intangible assets | | | 45 | | | | 39 | | | | 131 | | | | 116 | |
| | | | |
Regulatory assets and liabilities | | | 29 | | | | 70 | | | | 87 | | | | 213 | |
| | | | |
Retirement of capital assets | | | 4 | | | | 25 | | | | 16 | | | | 47 | |
| | | | | | | | | | | | | | | | | |
| | | 633 | | | | 674 | | | | 1,886 | | | | 1,982 | |
| | | | | | | | | | | | | | | | | |
| | | | | | | | | | | | | | | | |
| | | |
| | | Three months ended September 30 | | | Nine months ended September 30 | |
| | | | | | | | | | | | | | | | | |
| | | | |
| | | 2016 | | | 2015 | | | 2016 | | | 2015 | |
| | | | | | | | | | | | | | | | | |
| | | | |
Interest on debt securities | | | 623 | | | | 627 | | | | 1,867 | | | | 1,917 | |
| | | | |
Net exchange (gain) loss | | | (3) | | | | (26) | | | | 31 | | | | (55) | |
| | | | |
Guarantee fees related to debt securities | | | 55 | | | | 52 | | | | 164 | | | | 154 | |
| | | | | | | | | | | | | | | | |
| | | 675 | | | | 653 | | | | 2,062 | | | | 2,016 | |
| | | | | | | | | | | | | | | | | |
| | | | |
Less | | | | | | | | | | | | | | | | |
| | | | |
Capitalized financial expenses | | | 52 | | | | 57 | | | | 141 | | | | 160 | |
| | | | |
Net investment income | | | 7 | | | | 6 | | | | 26 | | | | 21 | |
| | | | | | | | | | | | | | | | |
| | | 59 | | | | 63 | | | | 167 | | | | 181 | |
| | | | | | | | | | | | | | | | | |
| | | 616 | | | | 590 | | | | 1,895 | | | | 1,835 | |
| | | | | | | | | | | | | | | | | |
| | |
| Page 10 | | Third Quarter 2016 |
| Note 6 | Financial Instruments |
In the course of its operations, Hydro-Québec carries out transactions that expose it to certain financial risks, such as market, liquidity and credit risk. Exposure to such risks and the impact on results are reduced through careful monitoring and implementation of strategies that include the use of derivative instruments.
MARKET RISK
Market risk is the risk that the fair value or future cash flows of a financial instrument will fluctuate as a result of changes in market prices. Hydro-Québec is exposed to three main types of market risk: currency risk, interest rate risk and risk associated with energy and aluminum prices. Active integrated management of these three types of risk aims to limit exposure to each risk and reduce their overall impact on results.
MANAGEMENT OF LONG-TERM RISK
Management of risk associated with debt
Currency risk and interest rate risk – Hydro-Québec uses forward contracts and currency swaps to manage the currency risk associated with long-term debt and perpetual debt, as well as forward contracts and interest rate swaps to modify long-term exposure to interest rate risk. When designated as hedging items, these derivative instruments are recognized as cash flow hedges or fair value hedges, depending on the risk hedged. The impact on results of foreign currency hedging transactions and those associated with debt interest rates is recognized in Financial expenses.
The following table shows the notional amounts, expressed in Canadian dollars and foreign currencies, of forward contracts and swaps used to manage long-term risk:
| | | | | | | | |
| | | As at September 30, 2016a | | | As at December 31, 2015a | |
| | | | | | | | | |
| | |
Forward contracts | | | | | | | | |
| | |
U.S. dollars | | | 1,223 | | | | 2,230 | |
| | |
Swaps | | | | | | | | |
| | |
Canadian dollars | | | (8,066) | | | | (9,400) | |
| | |
U.S. dollars | | | 5,730 | | | | 6,042 | |
| | |
Other currencies | | | | | | | | |
| | |
Euros | | | – | | | | 61 | |
| | |
Yen | | | 1,000 | | | | 1,000 | |
| | | | | | | | | |
| a) | Figures in parentheses represent amounts to be paid. |
MANAGEMENT OF SHORT-TERM RISK
Currency risk – Hydro-Québec uses forward contracts to manage its foreign currency risk exposure over the short term. When designated as hedging items, these derivative instruments are recognized as cash flow hedges. The impact of currency risk hedging transactions on results is recognized in the line item affected by the hedged item, namely Revenue, Electricity and fuel purchases, or Financial expenses. The notional amount of open positions in currency sales and purchase contracts as at September 30, 2016, was US$975 million and US$1,556 million, respectively (US$1,129 million in currency sales contracts and no open position in currency purchase contracts as at December 31, 2015).
Interest rate risk – Hydro-Québec uses forward rate agreements and interest rate swaps to manage short-term interest rate risk. When designated as hedging items, these derivative instruments are recognized as cash flow hedges. The impact on results of transactions to hedge short-term interest rate risk is recognized in the line item affected by the hedged item, namely Financial expenses.
Price risk – Hydro-Québec uses mainly commodity futures and swaps to manage risk resulting from fluctuations in energy and aluminum prices. When designated as hedging items, these derivative instruments are recognized as cash flow hedges. The impact on results of transactions to hedge the risk related to energy and aluminum prices is recognized in the line item affected by the hedged item, namely Revenue or Electricity and fuel purchases. In this context, Hydro-Québec has traded electricity futures and swaps for which open positions as at September 30, 2016, totaled 19.8 TWh (20.0 TWh as at December 31, 2015), natural gas futures for which open positions as at September 30, 2016, totaled 5.0 million MMBtu (no open position as at December 31, 2015), petroleum product swaps for which open positions as at September 30, 2016, totaled 4.3 million litres (8.5 million litres as at December 31, 2015), as well as aluminum swaps for which open positions as at September 30, 2016, totaled 152,600 tonnes (no open position as at December 31, 2015).
| | |
Third Quarter 2016 | | Page 11 |
| Note 6 | Financial Instruments (continued) |
Fair value
FAIR VALUE OF DERIVATIVE INSTRUMENTS
The following tables present the fair value of derivative instruments by type and depending on whether they are designated as fair value hedges or cash flow hedges, or not designated as hedges:
| | | | | | | | | | | | | | | | |
| | | | | | | | | As at September 30, 2016 | |
| | | Derivatives
designated as
fair value
hedges | | | Derivatives
designated
as cash flow
hedges | | | Derivatives
not
designated as hedgesa | | | Gross
amounts of derivatives recognizedb | |
Assets | | | | | | | | | | | | | | | | |
| | | | |
Contracts – Currency risk | | | – | | | | 1,248 | | | | 406 | | | | 1,654 | |
| | | | |
Contracts – Currency risk and interest rate risk | | | 3 | | | | – | | | | – | | | | 3 | |
| | | | |
Contracts – Interest rate risk | | | 736 | | | | – | | | | – | | | | 736 | |
| | | | |
Contracts – Price risk | | | – | | | | 103 | | | | 70 | | | | 173 | |
| | | | 739 | | | | 1,351 | | | | 476 | | | | 2,566 | |
Liabilities | | | | | | | | | | | | | | | | |
| | | | |
Contracts – Currency risk | | | – | | | | (166 | ) | | | (1,661) | | | | (1,827) | |
| | | | |
Contracts – Currency risk and interest rate risk | | | – | | | | – | | | | – | | | | – | |
| | | | |
Contracts – Interest rate risk | | | – | | | | – | | | | (3) | | | | (3) | |
| | | | |
Contracts – Price risk | | | – | | | | (20 | ) | | | (18) | | | | (38) | |
| | | | – | | | | (186 | ) | | | (1,682) | | | | (1,868) | |
| | | | |
Total | | | 739 | | | | 1,165 | | | | (1,206) | | | | 698 | |
| | | | | | | | | | |
| | | | | | | | | As at December 31, 2015 | |
| | | Derivatives
designated as
fair value
hedges | | | Derivatives
designated
as cash flow
hedges | | | Derivatives
not
designated as hedgesa | | | Gross
amounts of derivatives recognizedb | |
Assets | | | | | | | | | | | | | | | | |
| | | | |
Contracts – Currency risk | | | – | | | | 1,682 | | | | 157 | | | | 1,839 | |
| | | | |
Contracts – Currency risk and interest rate risk | | | 1 | | | | – | | | | – | | | | 1 | |
| | | | |
Contracts – Interest rate risk | | | 573 | | | | – | | | | – | | | | 573 | |
| | | | |
Contracts – Price risk | | | – | | | | 219 | | | | 84 | | | | 303 | |
| | | | 574 | | | | 1,901 | | | | 241 | | | | 2,716 | |
| | | | |
Liabilities | | | | | | | | | | | | | | | | |
| | | | |
Contracts – Currency risk | | | – | | | | (139 | ) | | | (2,398) | | | | (2,537) | |
| | | | |
Contracts – Currency risk and interest rate risk | | | – | | | | – | | | | – | | | | – | |
| | | | |
Contracts – Interest rate risk | | | – | | | | (7 | ) | | | (6) | | | | (13) | |
| | | | |
Contracts – Price risk | | | – | | | | (24 | ) | | | (44) | | | | (68) | |
| | | | – | | | | (170 | ) | | | (2,448) | | | | (2,618) | |
| | | | |
Total | | | 574 | | | | 1,731 | | | | (2,207) | | | | 98 | |
| a) | These derivative instruments are mainly traded as part of Hydro-Québec’s risk management. As at September 30, 2016, $(1,334) million was in consideration of amounts received or disbursed [$(2,331) million as at December 31, 2015] with respect to agreements to limit the market value of the main portfolios of derivative instruments. These agreements arise from frameworks applied by Hydro-Québec to reduce its credit risk exposure and limit risk concentration. |
| b) | Fair value measurements of derivative instruments are Level 2 measurements. These measurements are obtained by discounting future cash flows, which are estimated on the basis of the spot rates, forward rates or forward prices (foreign exchange rates, interest rates, and energy or aluminum prices) in effect on the balance sheet date and take into account the credit risk assessment. The valuation techniques make use of observable market data. |
| | |
| Page 12 | | Third Quarter 2016 |
| Note 6 | Financial Instruments (continued) |
The impact of offsetting derivative instruments is shown in the table below:
| | | | | | | | | | | | | | | | | | | | | | | | | | | | | | | | |
| | | As at September 30, 2016 | | | As at December 31, 2015 | |
| | | Gross
amounts of
derivatives recognized | | | Gross
amounts offseta | | | Cash
(received)
paid as collateralb | | | Net amounts
presented on
the balance
sheet | | | Gross
amounts of
derivatives
recognized | | | Gross
amounts offseta | | | Cash
(received)
paid as collateralb | | | Net amounts
presented on
the balance
sheet | |
Assets | | | | | | | | | | | | | | | | | | | | | | | | | | | | | | | | |
| | | | | | | | |
Current | | | 584 | | | | (454) | | | | (8) | | | | 122 | | | | 452 | | | | (178) | | | | – | | | | 274 | |
| | | | | | | | |
Long-term | | | 1,982 | | | | (1,326) | | | | (360) | | | | 296 | | | | 2,264 | | | | (2,136) | | | | – | | | | 128 | |
| | | | 2,566 | | | | (1,780) | | | | (368) | | | | 418 | | | | 2,716 | | | | (2,314) | | | | – | | | | 402 | |
Liabilities | | | | | | | | | | | | | | | | | | | | | | | | | | | | | | | | |
| | | | | | | | |
Current | | | (1,694) | | | | 1,612 | | | | – | | | | (82) | | | | (2,550) | | | | 2,251 | | | | – | | | | (299) | |
| | | | | | | | |
Long-term | | | (174) | | | | 168 | | | | – | | | | (6) | | | | (68) | | | | 63 | | | | – | | | | (5) | |
| | | | (1,868) | | | | 1,780 | | | | – | | | | (88) | | | | (2,618) | | | | 2,314 | | | | – | | | | (304) | |
| | | | | | | | | |
Total | | | 698 | | | | – | | | | (368) | | | | 330 | | | | 98 | | | | – | | | | – | | | | 98 | |
| a) | The gross amounts of derivatives offset are related to contracts traded according to International Swaps and Derivatives Association (ISDA) guidelines and constituting enforceable master netting arrangements. Such master netting arrangements apply to all derivative instrument contracts traded over the counter. |
| b) | Cash amounts offset represent amounts received or paid under collateral exchange agreements signed in compliance with ISDA guidelines. |
Moreover, although certain derivatives cannot be offset for lack of enforceable master netting arrangements, margin calls may result in amounts received from or paid to clearing agents, based on the fair value of the instruments concerned. As at September 30, 2016, $97 million payable to clearing agents in consideration of net cash receipts was included in Accounts payable and accrued liabilities, under Current liabilities on the balance sheet ($316 million as at December 31, 2015).
| | |
Third Quarter 2016 | | Page 13 |
| Note 6 | Financial Instruments (continued) |
The impact of derivative instruments on results and other comprehensive income is presented in the tables below. It should be noted that most derivative instruments traded are designated as cash flow hedges or fair value hedges and therefore reduce the volatility of results, except for the ineffective portion of the hedges, which is insignificant. Derivative instruments which are not designated as hedges, but which nonetheless provide an economic hedge for at-risk opposite positions, also reduce the volatility of results. The sensitivity of results is thus limited to net exposure to unhedged risks.
| | | | | | | | | | | | | | | | | | | | |
| | | | | |
| | | | | | | | | | | | Three months ended
September 30, 2016 | |
| | | |
| | | Losses (gains) on
derivatives designated
as fair value hedges | | | Losses (gains) on derivatives designated
as cash flow hedges | | | Losses (gains)
on derivatives
not designated
as hedges | |
| | | | | | |
| | | Recognized in results | | | Effective portion
recognized in
Other
comprehensive
income | | | Ineffective
portion
recognized
in results | | | Effective portion
reclassified
from Other
comprehensive
income to
results | | | Recognized in results | |
| | | | | |
Contracts – Currency risk | | | – | | | | 38 | | | | – | | | | (81 | )a | | | (30 | ) |
| | | | | |
Contracts – Currency risk and interest rate risk | | | – | | | | – | | | | – | | | | – | | | | – | |
| | | | | |
Contracts – Interest rate risk | | | (11 | ) | | | – | | | | – | | | | – | b | | | – | |
| | | | | |
Contracts – Price risk | | | – | | | | (36 | ) | | | 1 | c | | | (23 | )c | | | (4 | ) |
| | | | (11 | )d | | | 2 | | | | 1 | | | | (104 | ) | | | (34 | )e |
| | | | | |
Impact of hedged items on results | | | 9 | | | | | | | | | | | | 104 | | | | 32 | |
| | | | | | | | | | | | |
| | | | |
| | | | | | | | | Three months ended
September 30, 2015 | |
| | | |
| | | Losses (gains) on
derivatives designated
as fair value hedges | | | Losses (gains) on derivatives designated
as cash flow hedges | | | Losses (gains)
on derivatives
not designated
as hedges | |
| | | | | |
| | | Recognized in results | | | Effective portion
recognized in
Other
comprehensive
income | | | Ineffective
portion
recognized
in results | | | Effective portion
reclassified
from Other
comprehensive
income to
results | | | Recognized in
results | |
| | | | | |
Contracts – Currency risk | | | – | | | | (860 | ) | | | – | | | | (549 | )a | | | (287 | ) |
| | | | | |
Contracts – Currency risk and interest rate risk | | | (1 | ) | | | – | | | | – | | | | – | | | | – | |
| | | | | |
Contracts – Interest rate risk | | | (91 | ) | | | (3 | ) | | | – | | | | – | b | | | – | |
| | | | | |
Contracts – Price risk | | | – | | | | (119 | ) | | | (2 | )c | | | (85 | )c | | | (4 | ) |
| | | | (92 | )d | | | (982 | ) | | | (2 | ) | | | (634 | ) | | | (291 | )e |
| | | | | |
Impact of hedged items on results | | | 88 | | | | | | | | | | | | 634 | | | | 294 | |
| a) | The impact on results of currency risk hedging transactions is recognized in the line item affected by the hedged item. Therefore, $(18) million was recognized in Revenue in 2016 ($19 million in 2015), and $(63) million in Financial expenses [$(568) million in 2015]. |
| b) | The impact on results of interest rate risk hedging transactions is recognized in the line item affected by the hedged item. No amount was recognized in Financial expenses in 2016 and 2015. |
| c) | The impact on results of transactions to hedge energy and aluminum price risk is recognized in the line item affected by the hedged item. Therefore, $(22) million was recognized in Revenue in 2016 [$(87) million in 2015]. |
| d) | The impact on results of fair value risk hedging transactions, including the ineffective portion, which amounts to $(2) million in 2016 [$(4) million in 2015], is recognized in the line item affected by the hedged item, namely Financial expenses. |
| e) | These instruments are essentially related to integrated risk management transactions. The impact of these instruments on results is recognized in the line item affected by the managed risk. Therefore, $5 million was recognized in Revenue in 2016 ($9 million in 2015), $(7) million in Electricity and fuel purchases [$(2) million in 2015], and $(32) million in Financial expenses [$(298) million in 2015]. |
| | |
| Page 14 | | Third Quarter 2016 |
| Note 6 | Financial Instruments (continued) |
| | | | | | | | | | | | | | | | | | | | |
| | | | | |
| | | | | | | | | | | | Nine months ended
September 30, 2016 | |
| | | |
| | | Losses (gains) on
derivatives designated
as fair value hedges | | | Losses (gains) on derivatives designated as cash flow hedges | | | Losses (gains)
on derivatives
not designated
as hedges | |
| | | | | | |
| | | Recognized in results | | | Effective portion
recognized in
Other
comprehensive
income | | | Ineffective
portion
recognized in
results | | | Effective portion
reclassified
from Other
comprehensive
income to
results | | | Recognized in results | |
| | | | | |
Contracts – Currency risk | | | – | | | | 419 | | | | – | | | | 472 | a | | | 190 | |
| | | | | |
Contracts – Currency risk and interest rate risk | | | (1 | ) | | | – | | | | – | | | | – | | | | – | |
| | | | | |
Contracts – Interest rate risk | | | (179 | ) | | | (2 | ) | | | – | | | | 2 | b | | | – | |
| | | | | |
Contracts – Price risk | | | – | | | | (217 | ) | | | 1 | c | | | (347 | )c | | | (50 | ) |
| | | | (180 | )d | | | 200 | | | | 1 | | | | 127 | | | | 140 | e |
| | | | | |
Impact of hedged items on results | | | 168 | | | | | | | | | | | | (127 | ) | | | (191 | ) |
| | | | | | | | | | | | |
| | | | | |
| | | | | | | | | | | | Nine months ended
September 30, 2015 | |
| | | |
| | | Losses (gains) on
derivatives designated
as fair value hedges | | | Losses (gains) on derivatives designated as cash flow hedges | | | Losses (gains)
on derivatives
not designated
as hedges | |
| | | | | |
| | | Recognized in results | | | Effective portion
recognized in
Other
comprehensive
income | | | Ineffective
portion
recognized in
results | | | Effective portion
reclassified
from Other
comprehensive
income to
results | | | Recognized in results | |
| | | | | |
Contracts – Currency risk | | | – | | | | (1,416 | ) | | | 2 | a | | | (1,026 | )a | | | (485 | ) |
| | | | | |
Contracts – Currency risk and interest rate risk | | | (14 | ) | | | – | | | | – | | | | – | | | | – | |
| | | | | |
Contracts – Interest rate risk | | | (94 | ) | | | 2 | | | | – | | | | 2 | b | | | 7 | |
| | | | | |
Contracts – Price risk | | | – | | | | (203 | ) | | | (5 | )c | | | (173 | )c | | | (20 | ) |
| | | | (108 | )d | | | (1,617 | ) | | | (3 | ) | | | (1,197 | ) | | | (498 | )e |
| | | | | |
Impact of hedged items on results | | | 108 | | | | | | | | | | | | 1,197 | | | | 504 | |
| a) | The impact on results of currency risk hedging transactions is recognized in the line item affected by the hedged item. Therefore, $35 million was recognized in Revenue in 2016 ($81 million in 2015), and $437 million in Financial expenses [$(1,105) million in 2015]. |
| b) | The impact on results of interest rate risk hedging transactions is recognized in the line item affected by the hedged item. Therefore, $2 million was recognized in Financial expenses in 2016 and 2015. |
| c) | The impact on results of transactions to hedge energy and aluminum price risk is recognized in the line item affected by the hedged item. Therefore, $(346) million was recognized in Revenue in 2016 [$(178) million in 2015]. |
| d) | The impact on results of fair value risk hedging transactions, including the ineffective portion, which amounts to $(12) million in 2016 (nil in 2015), is recognized in the line item affected by the hedged item, namely Financial expenses. |
| e) | These instruments are essentially related to integrated risk management transactions. The impact of these instruments on results is recognized in the line item affected by the managed risk. Therefore, $(56) million was recognized in Revenue in 2016 ($13 million in 2015), $(12) million in Electricity and fuel purchases [$(9) million in 2015], and $208 million in Financial expenses [$(502) million in 2015]. |
| | |
Third Quarter 2016 | | Page 15 |
| Note 6 | Financial Instruments (continued) |
During the first nine months of 2016, Hydro-Québec did not reclassify any amounts from Accumulated other comprehensive income to results after having discontinued cash flow hedges (net gain of $3 million during the first nine months of 2015).
As at September 30, 2016, the net amount of gains presented in Accumulated other comprehensive income that would be reclassified to results in the next 12 months was estimated at $101 million ($46 million as at September 30, 2015).
As at September 30, 2016 and 2015, the maximum period during which Hydro-Québec hedged its exposure to the variability of cash flows related to anticipated transactions was three years.
FAIR VALUE OF OTHER FINANCIAL INSTRUMENTS
Fair value measurements for other financial instruments are Level 2 measurements. Fair value is obtained by discounting future cash flows, based on rates observed on the balance sheet date for similar instruments traded on capital markets.
The fair value of cash equivalents, receivables – accounts receivable, other receivables and financial liabilities approximates their carrying amount because of the short-term nature of these financial instruments, except in the case of the items presented in the table below:
| | | | | | | | | | | | | | | | |
| | | As at September 30, 2016 | | | As at December 31, 2015 | |
| | | Carrying amount | | | Fair value | | | Carrying amount | | | Fair value | |
Long-term debta | | | 45,562 | | | | 65,349 | | | | 45,672 | | | | 62,106 | |
Perpetual debt | | | 286 | | | | 190 | | | | 311 | | | | 237 | |
| a) | Including the current portion. |
Accounts receivable and other receivables
Accounts receivable and other receivables include unbilled electricity deliveries, which totaled $686 million as at September 30, 2016 ($1,093 million as at December 31, 2015).
| Note 7 | Supplementary Cash Flow Information |
| | | | | | | | | | | | | | | | |
| | | Three months ended
September 30 | | | Nine months ended
September 30 | |
| | | 2016 | | | 2015 | | | 2016 | | | 2015 | |
| Change in non-cash working capital items | | | | | | | | | | | | | | | | |
Accounts receivable and other receivables | | | 576 | | | | 440 | | | | 594 | | | | 111 | |
Materials, fuel and supplies | | | (2 | ) | | | (11) | | | | (6 | ) | | | (8) | |
Accounts payable and accrued liabilities | | | (46 | ) | | | (98) | | | | (450 | ) | | | (422) | |
Accrued interest | | | (394 | ) | | | (370) | | | | (449 | ) | | | (416) | |
| | | | 134 | | | | (39) | | | | (311 | ) | | | (735) | |
Investing activities not affecting cash | | | | | | | | | | | | | | | | |
Increase in property, plant and equipment | | | 113 | | | | 33 | | | | 155 | | | | 64 | |
Interest paid | | | 877 | | | | 892 | | | | 1,964 | | | | 2,013 | |
| | |
| Page 16 | | Third Quarter 2016 |
| Note 8 | Employee Future Benefits |
| | | | | | | | |
| | | | | | | Three months ended
September 30 |
| | | | | | | | | | | | | | | | |
| | | Pension Plan | | | Other plans | |
| | | | |
| | | 2016 | | | 2015 | | | 2016 | | | 2015 | |
Current service cost | | | 105 | | | | 110 | | | | 11 | | | | 11 | |
Interest on obligations | | | 192 | | | | 220 | | | | 12 | | | | 14 | |
Expected return on plan assets | | | (334 | ) | | | (326 | ) | | | (1 | ) | | | (1 | ) |
Amortization of net actuarial loss | | | 62 | | | | 73 | | | | 6 | | | | 6 | |
Amortization of past service costs (credits) | | | 4 | | | | 7 | | | | (1 | ) | | | 1 | |
Net cost recognized | | | 29 | | | | 84 | | | | 27 | | | | 31 | |
| | | | | | | | |
| | | | | | | Nine months ended
September 30 |
| | | | | | | | | | | | | | | | |
| | | Pension Plan | | | Other plans | |
| | | | |
| | | 2016 | | | 2015 | | | 2016 | | | 2015 | |
Current service cost | | | 317 | | | | 332 | | | | 34 | | | | 33 | |
Interest on obligations | | | 574 | | | | 660 | | | | 36 | | | | 40 | |
Expected return on plan assets | | | (1,001 | ) | | | (978 | ) | | | (3 | ) | | | (2 | ) |
Amortization of net actuarial loss | | | 185 | | | | 219 | | | | 19 | | | | 18 | |
Amortization of past service costs (credits) | | | 12 | | | | 21 | | | | (3 | ) | | | (1 | ) |
Net cost recognized | | | 87 | | | | 254 | | | | 83 | | | | 88 | |
Since January 1, 2016, Hydro-Québec has been using a more precise method to estimate the cost of services rendered and interest on its employee future benefit plan obligations. These costs were previously estimated by applying an average weighted discount rate based on the interest rate curve used to measure employee future benefit obligations at the beginning of the year. Under the new method, separate discount rates based on the interest rate curve are used to reflect the various payment maturity dates of the projected benefits.
In addition, the assumption regarding the expected long-term rate of return on Pension Plan assets was revised downward for the year ending December 31, 2016.
These changes in accounting estimates were applied prospectively. For the three- and nine-month periods ended September 30, 2016, they resulted in decreases of $23 million and $69 million, respectively, in the net cost of employee future benefits.
| | |
Third Quarter 2016 | | Page 17 |
| Note 9 | Accumulated Other Comprehensive Income |
| | | | | | | | | | |
| | | | | | | | | | | |
| | | | | | | | | | | Nine months ended
September 30, 2016 |
| | | | | | | | | | | |
| | | Cash flow
hedges | | | | Employee
future
benefits | | Translation
differences | | Accumulated
other
comprehensive
income |
| | | | | | | | | | | |
Balance, beginning of period | | 233 | | | | (1,678) | | – | | (1,445) |
| | | | | | | | | | | |
Other comprehensive income before reclassifications | | (200) | | | | – | | (1) | | (201) |
Amounts reclassified to results | | 127 | | | | 85 | | – | | 212 |
| | | | | | | | | | | |
Other comprehensive income | | (73) | | | | 85a | | (1) | | 11 |
| | | | | | | | | | | |
Balance, end of period | | 160 | | | | (1,593) | | (1) | | (1,434) |
| | | | | | | | | | | |
| | | | | | | | | | |
| | | | | | | | | | | |
| | | | | | | | | | | Nine months ended
September 30, 2015 |
| | | | | | | | | | | |
| | | Cash flow
hedges | | | | Employee
future
benefits | | Translation
differences | | Accumulated
other
comprehensive
income |
| | | | | | | | | | | |
Balance, beginning of period | | (187) | | | | (1,985) | | – | | (2,172) |
| | | | | | | | | | | |
Other comprehensive income before reclassifications | | 1,617 | | | | (22) | | – | | 1,595 |
Amounts reclassified to results | | (1,197) | | | | 209 | | – | | (988) |
| | | | | | | | | | | |
Other comprehensive income | | 420 | | | | 187a | | – | | 607 |
| | | | | | | | | | | |
Balance, end of period | | 233 | | | | (1,798) | | – | | (1,565) |
| | | | | | | | | | | |
| a) | Other comprehensive income includes the change in the employee future benefit regulatory asset, which totaled $(128) million as at September 30, 2016 [$(46) million as at September 30, 2015]. |
| | |
| Page 18 | | Third Quarter 2016 |
GUARANTEES
In accordance with the terms and conditions of certain debt securities issued outside Canada, Hydro-Québec has undertaken to increase the amount of interest paid to non-residents in the event of changes to Canadian tax legislation governing the taxation of non-residents’ income. Hydro-Québec cannot estimate the maximum amount it might have to pay under such circumstances. Should an amount become payable, Hydro-Québec has the option of redeeming most of the securities in question. As at September 30, 2016, the amortized cost of the long-term debts concerned was $4,359 million.
LITIGATION
In the normal course of its development and operating activities, Hydro-Québec is sometimes party to claims and legal proceedings. Management is of the opinion that an adequate provision has been made for these legal actions. Consequently, it does not foresee any significant adverse effect of such contingent liabilities on Hydro-Québec’s consolidated operating results or financial position.
Among other ongoing actions, some Aboriginal communities have instituted proceedings against the governments of Canada and Québec, as well as against Hydro-Québec, based on demands concerning their ancestral rights. In particular, the Innus of Uashat mak Mani-Utenam are demanding $1.5 billion in damages resulting from various operations carried out on land they claim as their own. Hydro-Québec is challenging the legitimacy of these claims.
In June 2009, the Innus of Uashat mak Mani-Utenam filed for an injunction with the Superior Court of Québec to suspend work at the Romaine complex jobsite, and in May 2010, an application was added for an interlocutory injunction to suspend work on the related tie lines. In March 2015, a proposed out-of-court settlement for the injunction proceedings was accepted by a vast majority of the applicants. In November 2015, the Attorney General of Québec presented a motion to have the courts declare as inadmissible the injunctions being brought by dissident claimants. The Superior Court granted this motion in its ruling of February 23, 2016. The dissident claimants appealed the decision, but their appeal was improperly initiated. Given that they did not correct the error within the stipulated six months, the ruling of February 2016 is considered final.
As well, in November 2006, the Innus of Pessamit reactivated a case instituted in 1998 aimed at obtaining, among other things, the recognition of ancestral rights related to Québec lands on which certain hydroelectric generating facilities belonging to the Manic–Outardes complex are located. The Innus of Pessamit are claiming $500 million. Hydro-Québec is challenging the legitimacy of this claim. In July 2015, the Superior Court granted a motion in which the Innus of Pessamit requested that proceedings be suspended until the end of January 2017 so that they could pursue discussions with the Québec government.
| | |
Third Quarter 2016 | | Page 19 |
| Note 11 | Segmented Information |
The following tables present information on segment results and assets:
| | | | | | | | | | | | | | | | | | | | | | | | | | | | |
| | | Three months ended September 30, 2016 | |
| | | Generation | | | Transmission | | | Distribution | | | Construction | | | Corporate
and Other
Activities | | | Intersegment
eliminations
and
adjustments | | | Total | |
| | | | | | | | | | | | | | | | | | | | | | | | | | | | | |
Revenue | | | | | | | | | | | | | | | | | | | | | | | | | | | | |
External customers | | | 444 | | | | 9 | | | | 2,271 | | | | – | | | | 16 | | | | – | | | | 2,740 | |
Intersegment customers | | | 960 | | | | 792 | | | | 18 | | | | 570 | | | | 416 | | | | (2,756 | ) | | | – | |
Net income (loss) | | | 325 | | | | 165 | | | | (215 | ) | | | – | | | | 31 | | | | – | | | | 306 | |
| | | | | | | | | | | | | | | | | | | | | | | | | | | | | |
| | | | | | | |
| | | | | | | | | | | | | | | | | | | | | | | | | | | | |
| | | Three months ended September 30, 2015 | |
| | | Generation | | | Transmission | | | Distribution | | | Construction | | | Corporate
and Other
Activities | | | Intersegment
eliminations
and
adjustments | | | Total | |
| | | | | | | | | | | | | | | | | | | | | | | | | | | | | |
Revenue | | | | | | | | | | | | | | | | | | | | | | | | | | | | |
External customers | | | 445 | | | | 23 | | | | 2,304 | | | | – | | | | 32 | | | | – | | | | 2,804 | |
Intersegment customers | | | 914 | | | | 800 | | | | 19 | | | | 536 | | | | 403 | | | | (2,672 | ) | | | – | |
Net income (loss) | | | 360 | | | | 155 | | | | (215 | ) | | | – | | | | 39 | | | | – | | | | 339 | |
| | |
| | | | | | | |
| | | | | | | | | | | | | | | | | | | | | | | | | | | | |
| | | Nine months ended September 30, 2016 | |
| | | Generation | | | Transmission | | | Distribution | | | Construction | | | Corporate
and Other
Activities | | | Intersegment
eliminations
and
adjustments | | | Total | |
| | | | | | | | | | | | | | | | | | | | | | | | | | | | | |
Revenue | | | | | | | | | | | | | | | | | | | | | | | | | | | | |
External customers | | | 1,363 | | | | 52 | | | | 8,401 | | | | – | | | | 41 | | | | – | | | | 9,857 | |
Intersegment customers | | | 3,456 | | | | 2,355 | | | | 58 | | | | 1,497 | | | | 1,247 | | | | (8,613 | ) | | | – | |
Net income | | | 1,438 | | | | 471 | | | | 215 | | | | – | | | | 72 | | | | – | | | | 2,196 | |
Total assets as at September 30, 2016 | | | 32,934 | | | | 21,110 | | | | 13,203 | | | | 57 | | | | 8,500 | | | | (180 | ) | | | 75,624 | |
| | | | | | | | | | | | | | | | | | | | | | | | | | | | | |
| | | | | | | |
| | | | | | | | | | | | | | | | | | | | | | | | | | | | |
| | | Nine months ended September 30, 2015 | |
| | | Generation | | | Transmission | | | Distribution | | | Construction | | | Corporate
and Other
Activities | | | Intersegment
eliminations
and
adjustments | | | Total | |
| | | | | | | | | | | | | | | | | | | | | | | | | | | | | |
Revenue | | | | | | | | | | | | | | | | | | | | | | | | | | | | |
External customers | | | 1,445 | | | | 74 | | | | 8,785 | | | | – | | | | 38 | | | | – | | | | 10,342 | |
Intersegment customers | | | 3,628 | | | | 2,394 | | | | 61 | | | | 1,396 | | | | 1,207 | | | | (8,686 | ) | | | – | |
Net income | | | 1,753 | | | | 447 | | | | 219 | | | | – | | | | 53 | | | | – | | | | 2,472 | |
Total assets as at September 30, 2015 | | | 32,846 | | | | 20,615 | | | | 13,197 | | | | 66 | | | | 7,641 | | | | (184 | ) | | | 74,181 | |
| | |
| Note 12 | Comparative Information |
Some corresponding period data of the prior year have been reclassified to conform to the presentation adopted in the current periods.
| | |
| Page 20 | | Third Quarter 2016 |
CONSOLIDATED FINANCIAL HIGHLIGHTS
(UNAUDITED)
Amounts shown in tables are in millions of Canadian dollars.
| | | | | | | | | | | | | | | | | | | | | | | | | | | | | | | | |
| | | Three months ended September 30 | | Nine months ended September 30 |
Summary of Operations | | | 2016 | | | | 2015 | | | | | | | Change (%) | | | 2016 | | | | 2015 | | | | | | | Change (%) |
| | | | | | | | | | |
Revenue | | | 2,740 | | | | 2,804 | | | | | | | 2.3 | | i | | | 9,857 | | | | 10,342 | | | | | | | 4.7 | | i |
Expenditure | | | 1,818 | | | | 1,875 | | | | | | | 3.0 | | i | | | 5,766 | | | | 6,035 | | | | | | | 4.5 | | i |
Financial expenses | | | 616 | | | | 590 | | | | | | | 4.4 | | h | | | 1,895 | | | | 1,835 | | | | | | | 3.3 | | h |
Net income | | | 306 | | | | 339 | | | | | | | 9.7 | | i | | | 2,196 | | | | 2,472 | | | | | | | 11.2 | | i |
| | | | | | | | | | | | | | | | | | | | | | | | | | | | | | | | | |
Note: Throughout the Consolidated Financial Highlights, certain comparative figures have been reclassified to conform to the presentation adopted in the current periods.
| | |
Third Quarter 2016 | | Page 21 |
Hydro-Québec, 75, boul. René-Lévesque Ouest, Montréal (Québec) H2Z 1A4
Ce document est également publié en français.
www.hydroquebec.com
ISSN 0848-5836