Exhibit 99.2

First Quarter 2017
| | |
| | Message from the Chairman of the Board and the President and Chief Executive Officer |
| |
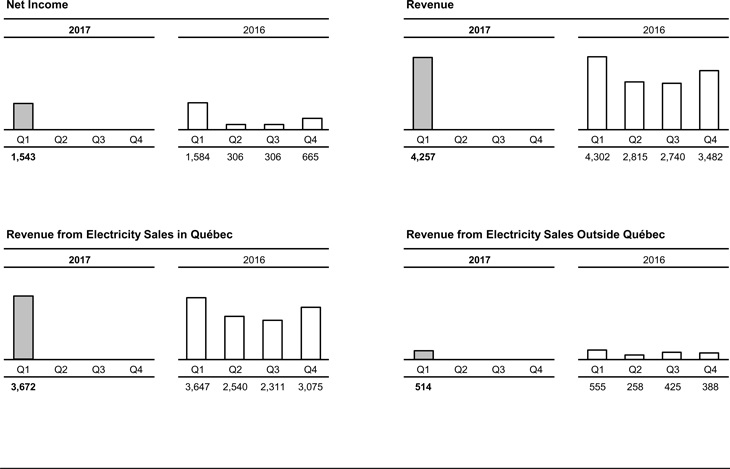
Summary of results | | Hydro-Québec posted net income of $1,543 million for the first quarter of 2017, a result similar to that of first-quarter 2016. This is the fourth time in the company’s history that net income has exceeded the $1.5-billion mark for the first three months of the year. |
| |
| | On markets outside Québec, Hydro-Québec Production’s net electricity exports totaled 10.1 TWh, a historic quarterly high and a 2.0-TWh increase compared to the same period last year. The previous record, set in the third quarter of 2016, was 9.8 TWh. The positive impact of this volume increase was offset, however, by the impact of lower prices on energy markets. The combined effect of these two factors led to a $100-million reduction in net exports compared to 2016. |
| |
| | Financial expenses decreased by $36 million in 2017. Because the Canadian dollar did not appreciate as markedly as in the first quarter of 2016, the exchange loss was lower than last year. |
| |
| | First-quarter net income for 2016 was $1,584 million. |
| |
Consolidated results | | Revenue totaled $4,257 million, compared to $4,302 million a year earlier. Revenue from electricity sales in Québec amounted to $3,672 million, a $25-million increase from 2016 resulting mainly from temperatures, which in particular were 3 degrees Celsius below climate normals in March 2017. Revenue from electricity sales on markets outside Québec was $514 million, a $41-million decrease compared to $555 million in 2016, due to the fact that volume growth in net electricity exports was offset by the impact of lower prices on energy markets. |
| |
| | Total expenditure amounted to $2,097 million, compared to $2,065 million in 2016. The difference is partly due to a $16-million increase in the depreciation and amortization expense essentially related to regulatory assets and liabilities. In addition, water-power royalties increased by $11 million on account of higher output and the indexing of the applicable rate. |
| | |
| | Financial expenses totaled $617 million in 2017, compared to $653 million last year. This decrease is mainly attributable to the foreign currency effect on working capital denominated in U.S. dollars. |
| |
Segmented | | Generation |
results | | Hydro-Québec Production posted net income of $842 million, compared to $849 million in 2016. Net electricity sales to Hydro-Québec Distribution increased by $45 million, primarily because of a higher volume of power supplies. Net electricity exports decreased by $100 million compared to the same period in 2016. The positive impact of the 2.0-TWh volume increase, which led to a new historic high of 10.1 TWh, was offset by the impact of lower prices on energy markets. Financial expenses decreased by $37 million in 2017, essentially because of the appreciation of the Canadian dollar. |
| |
| | Transmission |
| |
| | Hydro-Québec TransÉnergie’s net income was $186 million in 2017, compared to the $151 million recorded in the first three months of 2016. Revenue from native-load transmission service increased by $29 million following a decision handed down by the Régie de l’énergie. |
| |
| | Distribution |
| |
| | Hydro-Québec Distribution’s net income totaled $521 million, compared to $576 million in 2016. Revenue from electricity sales in Québec increased by $25 million, mainly because of temperatures, which in particular were 3 degrees Celsius below climate normals in March 2017. Electricity purchases, the related transmission costs and fuel purchases increased by $91 million. More specifically, supplies purchased from Hydro-Québec Production increased by $45 million, while native-load transmission costs incurred with Hydro-Québec TransÉnergie increased by $29 million. |
| |
| | Construction |
| |
| | The Construction segment includes activities related to the design and execution of construction and refurbishment projects involving power generation and transmission facilities. These projects are carried out by Hydro-Québec Innovation, équipement et services partagés and by Société d’énergie de la Baie James (SEBJ). |
| |
| | The segment’s volume of activity totaled $378 million, compared to $369 million in 2016. Projects under way for Hydro-Québec Production mainly include ongoing construction of the Romaine hydroelectric complex. Work in progress for Hydro-Québec TransÉnergie includes the 735-kV Chamouchouane–Bout-de-l’Île project, expansion of the transmission system in the Minganie region, as well as various projects stemming from continued investment in asset reliability and sustainment, particularly the replacement of PK type circuit breakers. |
| | |
| Page 2 | | First Quarter 2017 |
| | | | |
| |
Investment | | In the first three months of 2017, Hydro-Québec invested $652 million in property, plant and equipment and intangible assets, compared to $618 million in 2016. |
| |
| | Most of Hydro-Québec Production’s investments were allocated to ongoing construction of the Romaine complex. At the same time, the division carried out several projects to ensure the long-term operability of its facilities and optimize their output. For instance, refurbishment is under way at Robert-Bourassa, Beauharnois and Carillon generating stations. |
| |
| | Hydro-Québec TransÉnergie continued investing in its transmission system. This included work to connect the Romaine complex as part of the expansion of the transmission system in the Minganie region as well as to build a 735-kV line extending more than 400 km under the Chamouchouane–Bout-de-l’Île project. The division also carried out upgrading and modernization projects to ensure the reliability and long-term operability of its transmission assets and enhance service quality. These projects include the replacement of PK circuit breakers. |
| |
| | Hydro-Québec Distribution kept up investments to handle the growth of its Québec customer base and to ensure the long-term operability of its facilities. Its growth projects include connecting Judith-Jasmin substation to the distribution system. |
| | |
| | Michael D. Penner | | Éric Martel |
| | |
| | Chairman of the Board | | President and Chief Executive Officer |
| | |
| | May 18, 2017 | | |
| | |
First Quarter 2017 | | Page 3 |
CONSOLIDATED FINANCIAL STATEMENTS
(UNAUDITED)
CONSOLIDATED STATEMENTS OF OPERATIONS
| | | | | | | | | | | | |
| | | | | | | | | | | | | |
In millions of Canadian dollars
(unaudited) | | | | | | | | Three months ended
March 31 |
| | | | | | | | | | | | | |
| | | | |
| | | Notes | | | | | | 2017 | | 2016 |
| | | | | | | | | | | | | |
Revenue | | | | | | | | | | 4,257 | | 4,302 |
| | | | | | | | | | | | | |
Expenditure | | | | | | | | | | | | |
Operations | | | | | | | | | | 669 | | 649 |
Other components of employee future benefit cost | | | 2, 8 | | | | | | | (82) | | (60) |
Electricity and fuel purchases | | | | | | | | | | 569 | | 562 |
Depreciation and amortization | | | 4 | | | | | | | 641 | | 625 |
Taxes | | | | | | | | | | 300 | | 289 |
| | | | | | | | | | | | |
| | | | | | | | | | 2,097 | | 2,065 |
| | | | | | | | | | | | | |
Income before financial expenses | | | | | | | | | | 2,160 | | 2,237 |
Financial expenses | | | 5 | | | | | | | 617 | | 653 |
| | | | | | | | | | | | | |
Net income | | | | | | | | | | 1,543 | | 1,584 |
| | | | | | | | | | | | | |
| | | | |
| CONSOLIDATED STATEMENTS OF COMPREHENSIVE INCOME | | | | | | | | | | | | |
| | | | | | | | | | | | | |
In millions of Canadian dollars (unaudited) | | | | | | | | Three months ended
March 31 |
| | | | | | | | | | | | | |
| | | | |
| | | Note | | | | | | 2017 | | 2016 |
| | | | | | | | | | | | | |
Net income | | | | | | | | | | 1,543 | | 1,584 |
| | | | | | | | | | | | | |
Other comprehensive income | | | | | | | | | | | | |
Change in deferred losses on items designated as cash flow hedges | | | 6 | | | | | | | (90) | | (347) |
Reclassification to results of deferred (gains) losses on items designated as cash flow hedges | | | 6 | | | | | | | (42) | | 310 |
Reclassification to results of net actuarial losses and past service costs (credits) for employee future benefits | | | | | | | | | | 25 | | 29 |
Translation differences in financial statements of foreign operations | | | | | | | | | | (2) | | (1) |
| | | | | | | | | | | | |
| | | | | | | | | | (109) | | (9) |
| | | | | | | | | | | | | |
Comprehensive income | | | | | | | | | | 1,434 | | 1,575 |
| | | | | | | | | | | | | |
The accompanying notes are an integral part of the consolidated financial statements.
| | |
| Page 4 | | First Quarter 2017 |
CONSOLIDATED BALANCE SHEETS
| | | | | | | | | | |
In millions of Canadian dollars (unaudited) | | Notes | | | | | | As at March 31,
2017 | | As at December 31,
2016 |
| | | | | | | | | | | |
ASSETS | | | | | | | | | | |
| | | | | | | | | | | |
Current assets | | | | | | | | | | |
Cash and cash equivalents | | | | | | | | 2,081 | | 1,243 |
Short-term investments | | | | | | | | 738 | | 2,184 |
Accounts receivable and other receivables | | | | | | | | 2,874 | | 2,049 |
Derivative instruments | | 6 | | | | | | 83 | | 100 |
Regulatory assets | | | | | | | | 125 | | 123 |
Materials, fuel and supplies | | | | | | | | 233 | | 219 |
| | | | | | | | | | |
| | | | | | | | 6,134 | | 5,918 |
| | | | | | | | | | | |
Property, plant and equipment | | | | | | | | 62,768 | | 62,691 |
Intangible assets | | | | | | | | 914 | | 938 |
Investments | | | | | | | | 883 | | 884 |
Derivative instruments | | 6 | | | | | | 109 | | 284 |
Regulatory assets | | | | | | | | 4,136 | | 4,237 |
Other assets | | | | | | | | 749 | | 215 |
| | | | | | | | | | | |
| | | | | | | | 75,693 | | 75,167 |
| | | | | | | | | | | |
LIABILITIES | | | | | | | | | | |
| | | | | | | | | | | |
Current liabilities | | | | | | | | | | |
Borrowings | | | | | | | | 2,206 | | 7 |
Accounts payable and accrued liabilities | | | | | | | | 1,942 | | 2,199 |
Dividend payable | | | | | | | | – | | 2,146 |
Accrued interest | | | | | | | | 490 | | 894 |
Asset retirement obligations | | | | | | | | 75 | | 86 |
Derivative instruments | | 6 | | | | | | 49 | | 152 |
Current portion of long-term debt | | 6 | | | | | | 1,365 | | 1,398 |
| | | | | | | | | | |
| | | | | | | | 6,127 | | 6,882 |
| | | | | | | | | | | |
Long-term debt | | 6 | | | | | | 44,227 | | 44,218 |
Asset retirement obligations | | | | | | | | 787 | | 774 |
Derivative instruments | | 6 | | | | | | 5 | | 13 |
Regulatory liabilities | | | | | | | | 377 | | 381 |
Other liabilities | | | | | | | | 2,764 | | 2,902 |
Perpetual debt | | 6 | | | | | | 268 | | 293 |
| | | | | | | | | | |
| | | | | | | | 54,555 | | 55,463 |
| | | | | | | | | | | |
EQUITY | | | | | | | | | | |
| | | | | | | | | | | |
Share capital | | | | | | | | 4,374 | | 4,374 |
Retained earnings | | | | | | | | 18,804 | | 17,261 |
Accumulated other comprehensive income | | | | | | | | (2,040) | | (1,931) |
| | | | | | | | | | |
| | | | | | | | 21,138 | | 19,704 |
| | | | | | | | | | | |
| | | | | | | | 75,693 | | 75,167 |
| | | | | | | | | | | |
Contingencies | | 10 | | | | | | | | |
| | | | | | | | | | | |
The accompanying notes are an integral part of the consolidated financial statements.
| | |
On behalf of the Board of Directors, | | |
| |
/s/ Michelle Cormier | | /s/ Michael D. Penner |
Chair of the Audit Committee | | Chairman of the Board |
| | |
First Quarter 2017 | | Page 5 |
CONSOLIDATED STATEMENTS OF CHANGES IN EQUITY
| | | | | | | | | | | | | | | | | | | | | | |
| | | | | | | | | | | | | | | | | | | | | | | |
In millions of Canadian dollars (unaudited) | | Three months ended March 31 | |
| | | | | | | | | | | | | | | | | | | | | | | |
| | | Note | | | | | Share capital | | | Retained earnings | | | Accumulated
other
comprehensive
income | | | Total equity | |
| | | | | | | | | | | | | | | | | | | | | | | |
| | | | | | |
Balance as at January 1, 2017 | | | | | | | | | 4,374 | | | | 17,261 | | | | (1,931) | | | | 19,704 | |
| | | | | | |
Net income | | | | | | | | | – | | | | 1,543 | | | | – | | | | 1,543 | |
Other comprehensive income | | | 9 | | | | | | – | | | | – | | | | (109) | | | | (109) | |
| | | | | | | | | | | | | | | | | | | | | | | |
| | | | | | |
Balance as at March 31, 2017 | | | | | | | | | 4,374 | | | | 18,804 | | | | (2,040) | | | | 21,138 | |
| | | | | | | | | | | | | | | | | | | | | | | |
| | | | | | |
Balance as at January 1, 2016 | | | | | | | | | 4,374 | | | | 16,546 | | | | (1,445) | | | | 19,475 | |
| | | | | | |
Net income | | | | | | | | | – | | | | 1,584 | | | | – | | | | 1,584 | |
Other comprehensive income | | | 9 | | | | | | – | | | | – | | | | (9) | | | | (9) | |
| | | | | | | | | | | | | | | | | | | | | | | |
| | | | | | |
Balance as at March 31, 2016 | | | | | | | | | 4,374 | | | | 18,130 | | | | (1,454) | | | | 21,050 | |
| | | | | | | | | | | | | | | | | | | | | | | |
The accompanying notes are an integral part of the consolidated financial statements.
| | |
| Page 6 | | First Quarter 2017 |
CONSOLIDATED STATEMENTS OF CASH FLOWS
| | | | | | |
In millions of Canadian dollars (unaudited) | | | | Three months ended
March 31 |
| | | Notes | | 2017 | | 2016 |
Operating activities | | | | | | |
Net income | | | | 1,543 | | 1,584 |
Adjustments to determine net cash flows from operating activities | | | | | | |
Depreciation and amortization | | 4 | | 641 | | 625 |
Amortization of premiums, discounts and issue expenses related to debt securities | | | | 46 | | 42 |
Deficit of net cost recognized with respect to amounts
paid for employee future benefits | | | | (48) | | (51) |
Other | | | | 105 | | 41 |
Regulatory assets and liabilities | | | | (3) | | (8) |
Change in non-cash working capital items | | 7 | | (1,510) | | (1,542) |
| | | | | 774 | | 691 |
Investing activities | | | | | | |
Additions to property, plant and equipment | | | | (633) | | (601) |
Additions to intangible assets | | | | (19) | | (17) |
Net change in short-term investments and sinking fund | | | | 851 | | 475 |
Other | | | | 2 | | (2) |
| | | | | 201 | | (145) |
Financing activities | | | | | | |
Issuance of long-term debt | | | | 39 | | 17 |
Repayment of long-term debt | | | | (67) | | (34) |
Cash receipts arising from credit risk management | | 6 | | 1,752 | | 2,515 |
Cash payments arising from credit risk management | | 6 | | (1,884) | | (2,967) |
Net change in borrowings | | | | 2,174 | | 2,218 |
Dividend paid | | | | (2,146) | | (2,360) |
Other | | | | (4) | | (153) |
| | | | | (136) | | (764) |
Foreign currency effect on cash and cash equivalents | | | | (1) | | (26) |
| | | | | | | |
Net change in cash and cash equivalents | | | | 838 | | (244) |
| | | |
Cash and cash equivalents, beginning of period | | | | 1,243 | | 2,648 |
| | | | | | | |
Cash and cash equivalents, end of period | | | | 2,081 | | 2,404 |
| | | | | | | |
Supplementary cash flow information | | 7 | | | | |
| | | | | | | |
The accompanying notes are an integral part of the consolidated financial statements.
| | |
First Quarter 2017 | | Page 7 |
NOTES TO CONSOLIDATED FINANCIAL STATEMENTS
(UNAUDITED)
For the three-month periods ended March 31, 2017 and 2016
Amounts in tables are in millions of Canadian dollars, unless otherwise indicated.
| Note 1 | Basis of Presentation |
Hydro-Québec’s consolidated financial statements have been prepared in accordance with United States generally accepted accounting principles (U.S. GAAP).
These quarterly consolidated financial statements, including these notes, do not contain all the required information regarding annual consolidated financial statements and should therefore be read in conjunction with the consolidated financial statements and accompanying notes in Hydro-Québec’s Annual Report 2016.
The accounting policies used to prepare the quarterly consolidated financial statements are consistent with those presented in Hydro-Québec’s Annual Report 2016, except for the recent changes.
Management is of the opinion that these quarterly consolidated financial statements present fairly, in all material respects, the consolidated financial position of Hydro-Québec.
Hydro-Québec’s quarterly results are not necessarily indicative of results for the year on account of seasonal temperature fluctuations. Because of higher electricity demand during winter months, revenue from electricity sales in Québec is higher during the first and fourth quarters.
Management has reviewed events occurring until May 18, 2017, the date of approval of these quarterly consolidated financial statements by the Board of Directors, to determine whether circumstances warranted the recording or presentation of events subsequent to the balance sheet date.
| Note 2 | Changes to Accounting Policies |
RECENT CHANGES
Employee future benefits
On January 1, 2017, Hydro-Québec early adopted Accounting Standards Update (ASU) 2017-07, Compensation—Retirement Benefits (Topic 715): Improving the Presentation of Net Periodic Pension Cost and Net Periodic Postretirement Benefit Cost, as issued by the Financial Accounting Standards Board (FASB). This ASU states that current service cost is the only component of net employee future benefit cost that can be presented under Expenditure – Operations, and that only this component is eligible for capitalization in assets.
ASU 2017-07 was applied on a simplified retrospective basis for the presentation of the other components of employee future benefit cost in the consolidated statements of operations. Using the allowed practical expedient, Hydro-Québec applied the amounts disclosed in the “Employee Future Benefits” note to the 2016 consolidated financial statements for the restatement of comparative information. For the three-month period ended March 31, 2017, the new presentation led to a reclassification of $(82) million from Expenditure – Operations to Other components of employee future benefit cost [$(60) million for the three-month period ended March 31, 2016].
The ASU was applied prospectively for the capitalization of related costs in assets. For the three-month period ended March 31, 2017, this amendment resulted in an increase of $5 million in net income and property, plant and equipment.
Investments
On January 1, 2017, Hydro-Québec adopted ASU 2016-07, Investments—Equity Method and Joint Ventures (Topic 323): Simplifying the Transition to the Equity Method of Accounting, as issued by the FASB. This ASU simplifies the application of the equity method of accounting in the case where a reporting entity increases its level of investment in another entity or its degree of influence over such an entity. It was applied prospectively and has not had any impact on Hydro-Québec’s consolidated financial statements.
| | |
| Page 8 | | First Quarter 2017 |
| Note 2 | Changes to Accounting Policies (continued) |
STANDARDS ISSUED BUT NOT YET ADOPTED
Statement of cash flows
In August 2016, the FASB issued ASU 2016-15, Statement of Cash Flows (Topic 230): Classification of Certain Cash Receipts and Cash Payments. This ASU clarifies how certain items are presented and classified in the statement of cash flows. It will apply on a full retrospective basis to interim and annual financial statements for annual periods beginning on or after January 1, 2018, and should not have any significant impact on Hydro-Québec’s consolidated financial statements.
Leases
In February 2016, the FASB issued ASU 2016-02, Leases (Topic 842). This ASU provides guidance on lease definition, recognition and presentation and requires, in particular, the recognition of assets and liabilities by lessees for all operating and finance leases with a term of more than 12 months. It will apply on a modified retrospective basis to interim and annual financial statements for annual periods beginning on or after January 1, 2019. Hydro-Québec is currently examining the impact of this ASU on its consolidated financial statements.
Financial instruments
In January 2016, the FASB issued ASU 2016-01, Financial Instruments—Overall (Subtopic 825-10): Recognition and Measurement of Financial Assets and Financial Liabilities. This ASU provides guidance on the recognition and measurement of financial assets and financial liabilities. It will be applied on a modified retrospective basis to interim and annual financial statements for annual periods beginning on or after January 1, 2018, and should not have any significant impact on Hydro-Québec’s consolidated financial statements.
In June 2016, the FASB issued ASU 2016-13, Financial Instruments—Credit Losses (Topic 326): Measurement of Credit Losses on Financial Instruments. This ASU provides new guidance on the impairment of financial assets that are not accounted for at fair value through net income. It will be applied on a modified retrospective basis to the consolidated financial statements for annual periods beginning on or after January 1, 2020. Hydro-Québec is currently examining the impact of this ASU on its consolidated financial statements, but does not intend early adoption.
Revenue
In May 2014, the FASB issued ASU 2014-09, Revenue from Contracts with Customers (Topic 606). This ASU provides guidance on the recognition of revenue at the time that goods or services are transferred to a client, for an amount that reflects the payment which the entity expects to receive in exchange for the goods or services.
In August 2015, the FASB issued ASU 2015-14, Revenue from Contracts with Customers (Topic 606): Deferral of the Effective Date, which defers the effective date of this guidance by one year.
In March 2016, the FASB issued ASU 2016-08, Revenue from Contracts with Customers (Topic 606): Principal versus Agent Considerations (Reporting Revenue Gross versus Net). This ASU clarifies the guidance used to determine if an entity is acting on its own behalf or as an intermediary.
In April 2016, the FASB issued ASU 2016-10, Revenue from Contracts with Customers (Topic 606): Identifying Performance Obligations and Licensing. This ASU clarifies guidance on identifying performance obligations and the licensing of intellectual property rights.
In May 2016, the FASB issued ASU 2016-12, Revenue from Contracts with Customers (Topic 606): Narrow-Scope Improvements and Practical Expedients. This ASU clarifies the guidance on assessing collectibility, on noncash considerations and on completed contracts on the date of initial application.
These ASUs will apply on a full or modified retrospective basis to consolidated financial statements for annual periods beginning on or after January 1, 2018. Hydro-Québec is currently examining their impact on its consolidated financial statements, but does not intend early adoption.
| | |
First Quarter 2017 | | Page 9 |
DISTRIBUTION
In decision D-2017-034 of March 22, 2017, the Régie de l’énergie (the Régie) authorized an increase of 0.7% in all Hydro-Québec electricity rates except Rate L, for which the increase was set at 0.2%. The new rates are effective as of April 1, 2017. The authorized return on the rate base was set at 6.90%, assuming a capitalization with 35% equity.
In decision D-2017-022 of March 1, 2017, the Régie authorized the Distributor to exceptionally include in its 2017–2018 rates a net amount of $160 million for revenue variances related to climate conditions from 2010 to 2016.
In decision D-2017-037 of March 24, 2017, the Régie authorized the Distributor to create a non-rate-base variance account for the recognition of expenses incurred between that date and December 31, 2017, under the Conversion to Electricity Program, which targets systems using oil or propane in commercial, institutional and industrial buildings. These expenses will bear interest. As at March 31, 2017, no amount had been recorded in this account.
TRANSMISSION
In decision D-2017-049 of April 28, 2017, the Régie set Hydro-Québec’s power transmission rates for 2017. The authorized return on the rate base was set at 6.80%, assuming a capitalization with 30% equity.
In decision D-2017-021 of March 1, 2017, the Régie authorized the Transmission Provider to amortize over a five-year period the deferred account for costs related to the project involving the replacement of PK type circuit breakers.
| Note 4 | Depreciation and Amortization |
| | | | |
| | | Three months ended March 31 |
| | | | | |
| | | 2017 | | 2016 |
| | | | | |
| | |
Property, plant and equipment | | 550 | | 551 |
Intangible assets | | 44 | | 43 |
Regulatory assets and liabilities | | 44 | | 29 |
Retirement of capital assets | | 3 | | 2 |
| | | | | |
| | 641 | | 625 |
| | | | | |
| | | | |
| | | Three months ended March 31 |
| | | | | |
| | | 2017 | | 2016 |
| | | | | |
| | |
Interest on debt securities | | 626 | | 621 |
Net exchange loss | | 2 | | 29 |
Guarantee fees related to debt securities | | 54 | | 55 |
| | | | |
| | 682 | | 705 |
| | | | | |
Less | | | | |
Capitalized financial expenses | | 53 | | 42 |
Net investment income | | 12 | | 10 |
| | | | |
| | 65 | | 52 |
| | | | | |
| | 617 | | 653 |
| | | | | |
| | |
| Page 10 | | First Quarter 2017 |
| Note 6 | Financial Instruments |
In the course of its operations, Hydro-Québec carries out transactions that expose it to certain financial risks, such as market, liquidity and credit risk. Exposure to such risks and the impact on results are reduced through careful monitoring and implementation of strategies that include the use of derivative instruments.
MARKET RISK
Market risk is the risk that the fair value or future cash flows of a financial instrument will fluctuate as a result of changes in market prices. Hydro-Québec is exposed to three main types of market risk: currency risk, interest rate risk and risk associated with energy and aluminum prices. Active integrated management of these three types of risk aims to limit exposure to each risk and reduce their overall impact on results.
MANAGEMENT OF LONG-TERM RISK
Management of risk associated with debt
Currency risk and interest rate risk – Hydro-Québec uses forward contracts and currency swaps to manage the currency risk associated with long-term debt and perpetual debt, as well as forward contracts and interest rate swaps to modify long-term exposure to interest rate risk. When designated as hedging items, these derivative instruments are recognized as cash flow hedges or fair value hedges, depending on the risk hedged. The impact on results of foreign currency hedging transactions and those associated with debt interest rates is recognized in Financial expenses.
The following table shows the notional amounts, expressed in Canadian dollars and foreign currencies, of forward contracts and swaps used to manage long-term risk:
| | | | |
| | | As at March 31, 2017a | | As at December 31, 2016a |
| | | | | |
| | |
Forward contracts | | | | |
U.S. dollars | | 1,206 | | 1,223 |
| | |
Swaps | | | | |
Canadian dollars | | (7,227) | | (7,969) |
U.S. dollars | | 5,730 | | 5,730 |
Yen | | – | | 1,000 |
| | | | | |
| a) | Figures in parentheses represent amounts to be paid. |
MANAGEMENT OF SHORT-TERM RISK
Currency risk – Hydro-Québec uses forward contracts to manage its foreign currency risk exposure over the short term. When designated as hedging items, these derivative instruments are recognized as cash flow hedges. The impact of currency risk hedging transactions on results is recognized in the line item affected by the hedged item, namely Revenue, Electricity and fuel purchases, or Financial expenses. The notional amount of open positions in currency sales and purchase contracts as at March 31, 2017, was US$1,152 million and US$1,595 million, respectively (US$1,175 million in currency sales contracts and no open position in currency purchase contracts as at December 31, 2016).
Interest rate risk – Hydro-Québec uses forward rate agreements and interest rate swaps to manage short-term interest rate risk. When designated as hedging items, these derivative instruments are recognized as cash flow hedges. The impact on results of transactions to hedge short-term interest rate risk is recognized in the line item affected by the hedged item, namely Financial expenses.
Price risk – Hydro-Québec uses mainly commodity futures and swaps to manage risk resulting from fluctuations in energy and aluminum prices. When designated as hedging items, these derivative instruments are recognized as cash flow hedges. The impact on results of transactions to hedge the risk related to energy and aluminum prices is recognized in the line item affected by the hedged item, namely Revenue or Electricity and fuel purchases. In this context, Hydro-Québec has traded electricity futures and swaps for which open positions as at March 31, 2017, totaled 21.6 TWh (19.9 TWh as at December 31, 2016), natural gas futures for which open positions as at March 31, 2017, totaled 1.0 million MMBtu (0.5 million MMBtu as at December 31, 2016), petroleum product swaps for which open positions as at March 31, 2017, totaled 1.2 million litres (2.6 million litres as at December 31, 2016), as well as aluminum swaps for which open positions as at March 31, 2017, totaled 310,200 tonnes (254,050 tonnes as at December 31, 2016).
| | |
First Quarter 2017 | | Page 11 |
| Note 6 | Financial Instruments (continued) |
FAIR VALUE
FAIR VALUE OF DERIVATIVE INSTRUMENTS
The following tables present the fair value of derivative instruments by type and depending on whether they are designated as fair value hedges or cash flow hedges, or not designated as hedges:
| | | | | | | | | | | | | | | | |
| | | | | | | | | As at March 31, 2017 | |
| | | Derivatives
designated as
fair value
hedges | | | Derivatives
designated
as cash flow
hedges | | | Derivatives
not
designated as hedgesa | | | Gross
amounts of derivatives recognizedb | |
Assets | | | | | | | | | | | | | | | | |
Contracts – Currency risk | | | – | | | | 1,108 | | | | 285 | | | | 1,393 | |
Contracts – Currency risk and interest rate risk | | | – | | | | – | | | | – | | | | – | |
Contracts – Interest rate risk | | | 518 | | | | – | | | | 4 | | | | 522 | |
Contracts – Price risk | | | – | | | | 56 | | | | 54 | | | | 110 | |
| | | | 518 | | | | 1,164 | | | | 343 | | | | 2,025 | |
Liabilities | | | | | | | | | | | | | | | | |
Contracts – Currency risk | | | – | | | | (176) | | | | (760) | | | | (936) | |
Contracts – Currency risk and interest rate risk | | | – | | | | – | | | | – | | | | – | |
Contracts – Interest rate risk | | | – | | | | (2) | | | | (1) | | | | (3) | |
Contracts – Price risk | | | – | | | | (122) | | | | (22) | | | | (144) | |
| | | | – | | | | (300) | | | | (783) | | | | (1,083) | |
Total | | | 518 | | | | 864 | | | | (440) | | | | 942 | |
| | | | | | | | | | |
| | | | | | | | | As at December 31, 2016 | |
| | | Derivatives
designated as
fair value
hedges | | | Derivatives
designated
as cash flow
hedges | | | Derivatives
not
designated as hedgesa | | | Gross
amounts of derivatives recognizedb | |
Assets | | | | | | | | | | | | | | | | |
Contracts – Currency risk | | | – | | | | 1,217 | | | | 94 | | | | 1,311 | |
Contracts – Currency risk and interest rate risk | | | 1 | | | | – | | | | – | | | | 1 | |
Contracts – Interest rate risk | | | 540 | | | | – | | | | – | | | | 540 | |
Contracts – Price risk | | | – | | | | 54 | | | | 57 | | | | 111 | |
| | | | 541 | | | | 1,271 | | | | 151 | | | | 1,963 | |
| | | | |
Liabilities | | | | | | | | | | | | | | | | |
Contracts – Currency risk | | | – | | | | (152 | ) | | | (1,028 | ) | | | (1,180 | ) |
Contracts – Currency risk and interest rate risk | | | – | | | | – | | | | – | | | | – | |
Contracts – Interest rate risk | | | – | | | | (2 | ) | | | (3 | ) | | | (5 | ) |
Contracts – Price risk | | | – | | | | (48 | ) | | | (16 | ) | | | (64 | ) |
| | | | – | | | | (202 | ) | | | (1,047 | ) | | | (1,249 | ) |
Total | | | 541 | | | | 1,069 | | | | (896 | ) | | | 714 | |
| a) | These derivative instruments are mainly traded as part of Hydro-Québec’s risk management. As at March 31, 2017, $(577) million was in consideration of amounts received or disbursed [$(1,023) million as at December 31, 2016] with respect to agreements to limit the market value of the main portfolios of derivative instruments. These agreements arise from frameworks applied by Hydro-Québec to reduce its credit risk exposure and limit risk concentration. |
| b) | Except for measurements of listed derivative instruments, which totaled $(1) million as at March 31, 2017 (nil as at December 31, 2016) and are classified as Level 1 measurements, fair value measurements of derivative instruments are Level 2 measurements. These measurements are obtained by discounting future cash flows, which are estimated on the basis of the spot rates, forward rates or forward prices (foreign exchange rates, interest rates, and energy or aluminum prices) in effect on the balance sheet date and take into account the credit risk assessment. The valuation techniques make use of observable market data. |
| | |
| Page 12 | | First Quarter 2017 |
| Note 6 | Financial Instruments (continued) |
The impact of offsetting derivative instruments is presented in the table below:
| | | | | | | | | | | | | | | | | | | | | | | | | | | | | | | | |
| | | | | | | | | As at March 31, 2017 | | | | | | | | | As at December 31, 2016 | |
| | | Gross
amounts of
derivatives recognized | | | Gross
amounts offseta | | | Cash (received) paid as collateralb | | | Net amounts
presented on
the balance
sheet | | | Gross
amounts of
derivatives
recognized | | | Gross
amounts offseta | | | Cash (received) paid as collateralb | | | Net amounts
presented on
the balance
sheet | |
Assets | | | | | | | | | | | | | | | | | | | | | | | | | | | | | | | | |
Current | | | 396 | | | | (303) | | | | (10) | | | | 83 | | | | 223 | | | | (110) | | | | (13) | | | | 100 | |
Long-term | | | 1,629 | | | | (726) | | | | (794) | | | | 109 | | | | 1,740 | | | | (974) | | | | (482) | | | | 284 | |
| | | | 2,025 | | | | (1,029) | | | | (804) | | | | 192 | | | | 1,963 | | | | (1,084) | | | | (495) | | | | 384 | |
Liabilities | | | | | | | | | | | | | | | | | | | | | | | | | | | | | | | | |
Current | | | (890) | | | | 841 | | | | – | | | | (49) | | | | (1,091) | | | | 939 | | | | – | | | | (152) | |
Long-term | | | (193) | | | | 188 | | | | – | | | | (5) | | | | (158) | | | | 145 | | | | – | | | | (13) | |
| | | | (1,083) | | | | 1,029 | | | | – | | | | (54) | | | | (1,249) | | | | 1,084 | | | | – | | | | (165) | |
Total | | | 942 | | | | – | | | | (804) | | | | 138 | | | | 714 | | | | – | | | | (495) | | | | 219 | |
| a) | The gross amounts of derivatives offset are related to contracts traded according to International Swaps and Derivatives Association (ISDA) guidelines and constituting enforceable master netting arrangements. Such master netting arrangements apply to all derivative instrument contracts traded over the counter. |
| b) | Cash amounts offset are amounts received or paid under collateral exchange agreements signed in compliance with ISDA guidelines. |
Moreover, although certain derivatives cannot be offset for lack of enforceable master netting arrangements, margin calls may result in amounts received from or paid to clearing agents, based on the fair value of the instruments concerned. As at March 31, 2017, there was no amount receivable from clearing agents in consideration of net cash payments included in Accounts receivable and other receivables, under Current assets on the balance sheet ($27 million as at December 31, 2016). However, an amount of $51 million payable to clearing agents in consideration of net cash receipts was included in Accounts payable and accrued liabilities, under Current liabilities on the balance sheet ($16 million as at December 31, 2016).
| | |
First Quarter 2017 | | Page 13 |
| Note 6 | Financial Instruments (continued) |
The impact of derivative instruments on results and other comprehensive income is presented in the tables below. It should be noted that most derivative instruments traded are designated as cash flow hedges or fair value hedges and therefore reduce the volatility of results, except for the ineffective portion of the hedges, which is insignificant. Derivative instruments which are not designated as hedges, but which nonetheless provide an economic hedge for at-risk opposite positions, also reduce the volatility of results. The sensitivity of results is thus limited to net exposure to unhedged risks.
| | | | | | | | | | | | | | | | | | | | |
| | | | | | | | | | | | Three months ended
March 31, 2017 | |
| | | Losses (gains) on
derivatives designated
as fair value hedges | | | Losses (gains) on derivatives designated as cash flow hedges | | | Losses (gains)
on derivatives
not designated
as hedges | |
| | | Recognized in results | | | Effective portion
recognized in
Other
comprehensive
income | | | Ineffective
portion
recognized in
results | | | Effective portion
reclassified
from Other
comprehensive
income to
results | | | Recognized in results | |
Contracts – Currency risk | | | – | | | | 115 | | | | (1) | a | | | 49a | | | | (19) | |
Contracts – Currency risk and interest rate risk | | | – | | | | – | | | | – | | | | – | | | | – | |
Contracts – Interest rate risk | | | 3 | | | | – | | | | – | | | | 1b | | | | – | |
Contracts – Price risk | | | – | | | | (25) | | | | 4c | | | | (92) | c | | | (2) | |
| | | | 3d | | | | 90 | | | | 3 | | | | (42) | | | | (21) | e |
Impact of hedged items on results | | | (3) | | | | | | | | | | | | 42 | | | | 17 | |
| | | | | | | | | | | | |
| | | | | | | | | | | | Three months ended
March 31, 2016 | |
| | | Losses (gains) on
derivatives designated
as fair value hedges | | | Losses (gains) on derivatives designated as cash flow hedges | | | Losses (gains)
on derivatives
not designated
as hedges | |
| | | Recognized in results | | | Effective portion
recognized in
Other
comprehensive
income | | | Ineffective
portion
recognized in
results | | | Effective portion
reclassified
from Other
comprehensive
income to
results | | | Recognized in results | |
Contracts – Currency risk | | | – | | | | 586 | | | | – | | | | 597a | | | | 243 | |
Contracts – Currency risk and interest rate risk | | | – | | | | – | | | | – | | | | – | | | | – | |
Contracts – Interest rate risk | | | (116) | | | | (2) | | | | – | | | | 1b | | | | – | |
Contracts – Price risk | | | – | | | | (237) | | | | (7) | c | | | (288) | c | | | (40) | |
| | | | (116) | d | | | 347 | | | | (7) | | | | 310 | | | | 203e | |
Impact of hedged items on results | | | 108 | | | | | | | | | | | | (310) | | | | (239) | |
| a) | In 2017, $(10) million was recognized in Revenue ($73 million in 2016), and $58 million in Financial expenses ($524 million in 2016). |
| b) | In 2017 and 2016, $1 million was recognized in Financial expenses. |
| c) | In 2017, $(88) million was recognized in Revenue [$(295) million in 2016]. |
| d) | This amount, including any ineffective portion, which was nil in 2017 [$(8) million in 2016], was recognized in Financial expenses. |
| e) | These instruments are essentially related to integrated risk management transactions. The impact of these instruments on results is recognized in the line item affected by the managed risk. Therefore, in 2017, $(9) million was recognized in Revenue [$(56) million in 2016], $5 million in Electricity and fuel purchases (nil in 2016), and $(17) million in Financial expenses ($259 million in 2016). |
| | |
| Page 14 | | First Quarter 2017 |
| Note 6 | Financial Instruments (continued) |
During the first three months of 2017 and 2016, Hydro-Québec did not reclassify any amounts from Accumulated other comprehensive income to results after having discontinued cash flow hedges.
As at March 31, 2017, the net loss presented in Accumulated other comprehensive income that would be reclassified to results in the next 12 months was estimated at $40 million (net gain of $200 million as at March 31, 2016).
As at March 31, 2017 and 2016, the maximum period during which Hydro-Québec hedged its exposure to the variability of cash flows related to anticipated transactions was three years.
FAIR VALUE OF OTHER FINANCIAL INSTRUMENTS
Fair value measurements for other financial instruments are Level 2 measurements. Fair value is obtained by discounting future cash flows, based on rates observed on the balance sheet date for similar instruments traded on capital markets.
The fair value of cash equivalents, receivables – accounts receivable, other receivables and financial liabilities approximates their carrying amount because of the short-term nature of these financial instruments, except in the case of the items presented in the table below:
| | | | | | | | | | | | | | | | |
| | | As at March 31, 2017 | | | As at December 31, 2016 | |
| | | Carrying amount | | | Fair value | | | Carrying amount | | | Fair value | |
Long-term debta | | | 45,592 | | | | 60,619 | | | | 45,616 | | | | 60,931 | |
Perpetual debt | | | 268 | | | | 219 | | | | 293 | | | | 217 | |
| a) | Including the current portion. |
ACCOUNTS RECEIVABLE AND OTHER RECEIVABLES
Accounts receivable and other receivables include unbilled electricity deliveries, which totaled $866 million as at March 31, 2017 ($1,206 million as at December 31, 2016).
| Note 7 | Supplementary Cash Flow Information |
| | | | | | | | |
| | | Three months ended March 31 | |
| | | 2017 | | | 2016 | |
Change in non-cash working capital items | | | | | | | | |
Accounts receivable and other receivables | | | (825 | ) | | | (896) | |
Materials, fuel and supplies | | | (13 | ) | | | (4) | |
Accounts payable and accrued liabilities | | | (260 | ) | | | (231) | |
Accrued interest | | | (412 | ) | | | (411) | |
| | | | (1,510 | ) | | | (1,542) | |
Investing activities not affecting cash | | | | | | | | |
Increase in property, plant and equipment | | | 15 | | | | 11 | |
Interest paid | | | 898 | | | | 915 | |
| | |
First Quarter 2017 | | Page 15 |
| Note 8 | Employee Future Benefits |
| | | | | | | | | | | | | | | | |
| | | | | | Three months ended March 31 | |
| | | Pension Plan | | | Other plans | |
| | | | 2017 | | | | 2016 | | | | 2017 | | | | 2016 | |
Current service cost | | | 107 | | | | 106 | | | | 11 | | | | 12 | |
Other components of employee future benefit cost | | | | | | | | | | | | | | | | |
Interest on obligations | | | 198 | | | | 191 | | | | 12 | | | | 12 | |
Expected return on plan assets | | | (355 | ) | | | (334 | ) | | | (1 | ) | | | (1 | ) |
Amortization of net actuarial loss | | | 55 | | | | 62 | | | | 7 | | | | 7 | |
Amortization of past service costs (credits) | | | 3 | | | | 4 | | | | (1 | ) | | | (1 | ) |
| | | | (99 | ) | | | (77 | ) | | | 17 | | | | 17 | |
Net cost recognized | | | 8 | | | | 29 | | | | 28 | | | | 29 | |
| Note 9 | Accumulated Other Comprehensive Income |
| | | | | | | | | | |
| | | | | | | | | | | |
| | | | | | | | | | | Three months ended March 31, 2017 |
| | | | | | | | | | | |
| | | Cash flow
hedges | | | | Employee
future
benefits | | Translation
differences | | Accumulated other
comprehensive
income |
| | | | | | | | | | | |
Balance, beginning of period | | (135) | | | | (1,799) | | 3 | | (1,931) |
| | | | | | | | | | | |
Other comprehensive income before reclassifications | | (90) | | | | – | | (2) | | (92) |
Amounts reclassified to results | | (42) | | | | 25 | | – | | (17) |
| | | | | | | | | | | |
Other comprehensive income | | (132) | | | | 25a | | (2) | | (109) |
| | | | | | | | | | | |
Balance, end of period | | (267) | | | | (1,774) | | 1 | | (2,040) |
| | | | | | | | | | | |
| | | | | | | | | | |
| | | | | | | | | | | |
| | | | | | | | | | | Three months ended March 31, 2016 |
| | | | | | | | | | | |
| | | Cash flow
hedges | | | | Employee
future
benefits | | Translation
differences | | Accumulated other
comprehensive
income |
| | | | | | | | | | | |
Balance, beginning of period | | 233 | | | | (1,678) | | – | | (1,445) |
| | | | | | | | | | | |
Other comprehensive income before reclassifications | | (347) | | | | – | | (1) | | (348) |
Amounts reclassified to results | | 310 | | | | 29 | | – | | 339 |
| | | | | | | | | | | |
Other comprehensive income | | (37) | | | | 29a | | (1) | | (9) |
| | | | | | | | | | | |
Balance, end of period | | 196 | | | | (1,649) | | (1) | | (1,454) |
| | | | | | | | | | | |
| a) | Other comprehensive income includes the change in the employee future benefit regulatory asset, which totaled $(39) million as at March 31, 2017 [$(43) million as at March 31, 2016]. |
| | |
| Page 16 | | First Quarter 2017 |
GUARANTEES
In accordance with the terms and conditions of certain debt securities issued outside Canada, Hydro-Québec has undertaken to increase the amount of interest paid to non-residents in the event of changes to Canadian tax legislation governing the taxation of non-residents’ income. Hydro-Québec cannot estimate the maximum amount it might have to pay under such circumstances. Should an amount become payable, Hydro-Québec has the option of redeeming most of the securities in question. As at March 31, 2017, the amortized cost of the long-term debts concerned was $4,635 million.
LITIGATION
In the normal course of its development and operating activities, Hydro-Québec is sometimes party to claims and legal proceedings. Management is of the opinion that an adequate provision has been made for these legal actions. Consequently, it does not foresee any significant adverse effect of such contingent liabilities on Hydro-Québec’s consolidated operating results or financial position.
Among other ongoing actions, some Aboriginal communities have instituted proceedings against the governments of Canada and Québec, as well as against Hydro-Québec, based on demands concerning their ancestral rights. In particular, the Innus of Uashat mak Mani-Utenam are demanding $1.5 billion in damages resulting from various operations carried out on land they claim as their own. Hydro-Québec is challenging the legitimacy of these claims.
As well, in November 2006, the Innus of Pessamit reactivated a case instituted in 1998 aimed at obtaining, among other things, the recognition of ancestral rights related to Québec lands on which certain hydroelectric generating facilities belonging to the Manic–Outardes complex are located. The Innus of Pessamit are claiming $500 million. Hydro-Québec is challenging the legitimacy of this claim. In July 2015, the Superior Court granted a motion in which the Innus of Pessamit requested that proceedings be suspended until the end of January 2017. In February 2017, the Innus announced that they intended to change counsel. They obtained additional time—up to the end of September 2017—from the case management judge so that their new lawyer could familiarize himself with the case. Until then, no proceedings will be instituted by the parties to the dispute.
| | |
First Quarter 2017 | | Page 17 |
| Note 11 | Segmented Information |
The following tables present information on segment results and assets:
| | | | | | | | | | | | | | | | | | | | | | | | | | | | |
| | | Three months ended March 31, 2017 | |
| | | Generation | | | Transmission | | | Distribution | | | Construction | | | Corporate and Other Activities | | | Intersegment
eliminations
and
adjustments | | | Total | |
| | | | | | | | | | | | | | | | | | | | | | | | | | | | | |
Revenue | | | | | | | | | | | | | | | | | | | | | | | | | | | | |
External customers | | | 558 | | | | 13 | | | | 3,676 | | | | – | | | | 10 | | | | – | | | | 4,257 | |
Intersegment customers | | | 1,499 | | | | 833 | | | | 21 | | | | 378 | | | | 402 | | | | (3,133 | ) | | | – | |
Net income (loss) | | | 842 | | | | 186 | | | | 521 | | | | – | | | | (6 | ) | | | – | | | | 1,543 | |
Total assets as at March 31, 2017 | | | 33,018 | | | | 21,713 | | | | 13,929 | | | | 52 | | | | 7,170 | | | | (189 | ) | | | 75,693 | |
| | | | | | | | | | | | | | | | | | | | | | | | | | | | | |
| | | | | | | | | | | | | | | | | | | | | | | | | | | | |
| | | Three months ended March 31, 2016 | |
| | | Generation | | | Transmission | | | Distribution | | | Construction | | | Corporate and Other Activities | | | Intersegment eliminations and
adjustments | | | Total | |
| | | | | | | | | | | | | | | | | | | | | | | | | | | | | |
Revenue | | | | | | | | | | | | | | | | | | | | | | | | | | | | |
External customers | | | 627 | | | | 21 | | | | 3,641 | | | | – | | | | 13 | | | | – | | | | 4,302 | |
Intersegment customers | | | 1,441 | | | | 783 | | | | 21 | | | | 369 | | | | 421 | | | | (3,035 | ) | | | – | |
Net income | | | 849 | | | | 151 | | | | 576 | | | | – | | | | 8 | | | | – | | | | 1,584 | |
Total assets as at March 31, 2016 | | | 33,124 | | | | 20,900 | | | | 14,059 | | | | 54 | | | | 7,150 | | | | (163 | ) | | | 75,124 | |
| | |
| Note 12 | Comparative Information |
Some corresponding period data of the prior year have been reclassified to conform to the presentation adopted in the current period.
| | |
| Page 18 | | First Quarter 2017 |
CONSOLIDATED FINANCIAL HIGHLIGHTS
(UNAUDITED)
Amounts shown in tables are in millions of Canadian dollars.
| | | | | | | | | | | | | | | | |
| | | Three months ended March 31 |
Summary of Results | | | 2017 | | | | 2016 | | | | | | | Change (%) |
| | | | | |
Revenue | | | 4,257 | | | | 4,302 | | | | | | | 1.0 | | i |
Expenditure | | | 2,097 | | | | 2,065 | | | | | | | 1.5 | | h |
Financial expenses | | | 617 | | | | 653 | | | | | | | 5.5 | | i |
Net income | | | 1,543 | | | | 1,584 | | | | | | | 2.6 | | i |
| | | | | | | | | | | | | | | | | |
| | |
First Quarter 2017 | | Page 19 |
Hydro-Québec, 75, boul. René-Lévesque Ouest, Montréal (Québec) H2Z 1A4
Ce document est également publié en français.
www.hydroquebec.com
ISSN 0848-5836