EXHIBIT 99.1

This description of Hydro-Québec is dated as of March 21, 2019 and appears as Exhibit 99.1 to Hydro-Québec’s annual report on Form 18-K to the U.S. Securities and Exchange Commission for the fiscal year ended December 31, 2018.
This document may be delivered to you at any time but you should assume that the information herein is accurate only as of March 21, 2019. Hydro-Québec’s business, financial condition, results of operations and prospects may have changed since that date.
This document does not constitute an offer to sell or the solicitation of an offer to buy any securities of Hydro-Québec, unless it is included in a registration statement filed under the Securities Act of 1933, as amended.
TABLE OF CONTENTS
| | | | |
| | | Page | |
| |
Where You Can Find More Information | | | 3 | |
| |
Forward-Looking Statements | | | 3 | |
| |
Foreign Exchange | | | 3 | |
| |
Map of Hydro-Québec’s Major Facilities | | | 4 | |
| |
Five-Year Review | | | 5 | |
| |
Hydro-Québec | | | 8 | |
| |
General | | | 8 | |
| |
Generation | | | 10 | |
| |
Generation Operations | | | 11 | |
| |
Wholesale and Energy Marketing Operations | | | 12 | |
| |
Transmission | | | 15 | |
| |
Transmission System | | | 15 | |
| |
Distribution | | | 16 | |
| |
Electricity Rates | | | 17 | |
| |
Electricity Sales and Revenue | | | 18 | |
| |
Construction | | | 19 | |
| |
Corporate and Other Activities | | | 19 | |
| |
Corporate Outlook | | | 20 | |
| |
Development Strategy | | | 20 | |
| |
Water-Power Royalties | | | 20 | |
| |
Capital Investment Program | | | 21 | |
| |
Regulatory Framework | | | 23 | |
| |
Litigation | | | 25 | |
| |
Employees | | | 26 | |
| |
Management’s Discussion and Analysis | | | 27 | |
| |
Overview | | | 27 | |
| |
Consolidated Results | | | 29 | |
| |
Cash and Capital Management | | | 31 | |
| |
Segmented Results | | | 32 | |
| |
Integrated Business Risk Management | | | 40 | |
| |
Independent Auditors’ Report | | | 44 | |
| |
Consolidated Financial Statements | | | 46 | |
| |
Supplementary Information | | | 83 | |
- 2 -
WHERE YOU CAN FIND MORE INFORMATION
This document appears as an exhibit to Hydro-Québec’s annual report filed with the U.S. Securities and Exchange Commission (the “SEC”) on Form 18-K for the fiscal year ended December 31, 2018. Additional information with respect to Hydro-Québec is available in the annual report or in other exhibits or amendments to the annual report.
You may access any document we file with the SEC through the SEC’s Electronic Data Gathering, Analysis, and Retrieval system, which is commonly known by the acronym EDGAR, on the SEC’s website at http://www.sec.gov.
You may request a copy of these filings at no cost by calling Hydro-Québec at (514) 289-2518. This document is also available on our website at www.hydroquebec.com; however, any other information available on our website shall not be deemed to form a part of this document or the annual report to which it appears as an exhibit.
FORWARD-LOOKING STATEMENTS
Various statements made throughout this document are forward looking and contain information about financial results, economic conditions and trends, including, without limitation, the statements under the captions Corporate Outlook and Management’s Discussion and Analysis. The words “estimate,” “believe,” “expect,” “forecast,” “anticipate,” “intend” and “plan” and similar expressions identify forward-looking statements. You are cautioned that any such forward-looking statements are not guarantees of future performance. Forward-looking statements involve risks and uncertainties, and actual results may differ materially from those in the forward-looking statements as a result of various factors. Such factors may include, among others, business risks, such as variations in runoff that affect hydroelectric plant performance, and general levels of economic activity which affect demand for electricity, and risks related to economic parameters, such as changes in interest and exchange rates. You are cautioned not to place undue reliance on these forward-looking statements which speak only as of the date of this document. We undertake no obligation to publicly release the result of any revisions to these forward-looking statements which may be made to reflect events or circumstances after the date hereof or to reflect the occurrence of unanticipated events.
FOREIGN EXCHANGE
Canada maintains a floating exchange rate for the Canadian dollar in order to permit the rate to be determined by fundamental forces without intervention except as required to maintain orderly conditions. Annual average spot exchange rates for the U.S. dollar, in which some debt of Hydro-Québec is denominated, expressed in Canadian dollars, are shown below.
| | | | | | | | | | | | | | | | | | | | | | | | |
Foreign Currency | | | 2014 | | | | 2015 | | | | 2016 | | | | 2017 | | | | 2018 | | | | 2019a | |
United States Dollar | | $ | 1.1045 | | | $ | 1.2788 | | | $ | 1.3256 | | | $ | 1.2984 | | | $ | 1.2962 | | | $ | 1.3265 | |
a) Monthly average through the end of February 2019.
Sources: Bank of Canada (through April 21, 2017) and Bloomberg L.P.
In this document, unless otherwise specified or the context otherwise requires, all dollar amounts are expressed in Canadian dollars.
- 3 -
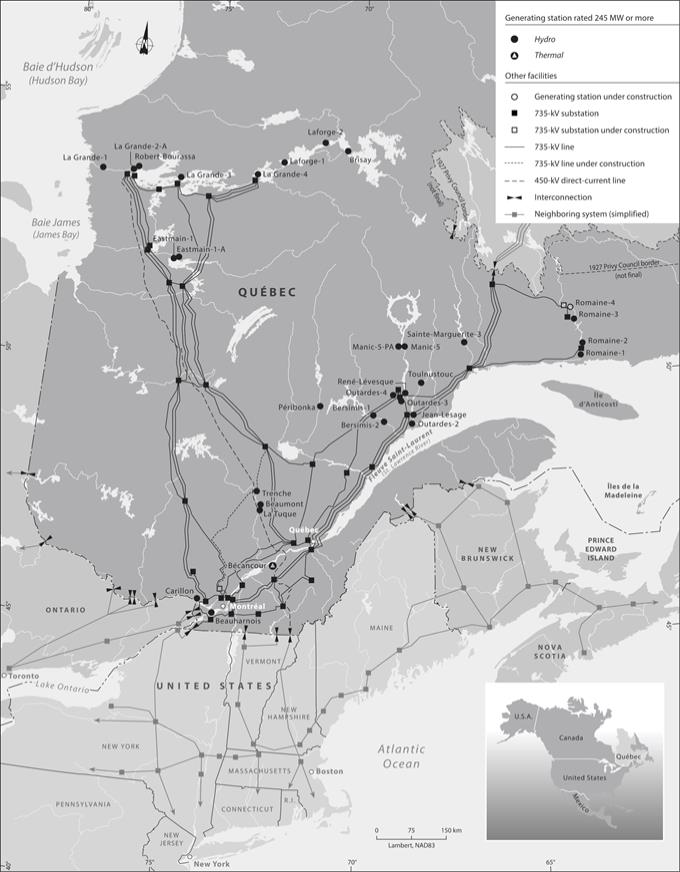
MAP OF HYDRO-QUÉBEC’S MAJOR FACILITIES
- 4 -
FIVE-YEAR REVIEW
| | | | | | | | | | | | | | | | | | | | | | |
| CONSOLIDATEDANDSELECTEDFINANCIALINFORMATION | | | |
| | | Years ended December 31 | | | |
| | | |
| | | 2014 | | | 2015 | | | 2016 | | | 2017 | | | 2018 | | | |
| | |
| | | (in millions of dollars) | | | |
OPERATIONS | | | | | | | | | | | | | | | | | | | | | | |
| | | | | | |
Revenue | | $ | 13,652 | | | $ | 13,754 | | | $ | 13,339 | | | $ | 13,468 | | | $ | 14,370 | | | |
| | | | | | |
Expenditure | | | | | | | | | | | | | | | | | | | | | | |
Operations | | | 2,400 | | | | 2,559 | | | | 2,671 | | | | 2,664 | | | | 2,843 | | | |
Other components of employee future benefit cost | | | (34 | ) | | | (32 | ) | | | (233 | ) | | | (322 | ) | | | (340 | ) | | |
Electricity and fuel purchases | | | 1,968 | | | | 1,938 | | | | 1,866 | | | | 2,005 | | | | 2,167 | | | |
Depreciation and amortization | | | 2,593 | | | | 2,713 | | | | 2,597 | | | | 2,686 | | | | 2,685 | | | |
Taxes | | | 975 | | | | 980 | | | | 1,045 | | | | 1,076 | | | | 1,111 | | | |
| | | |
| | | | 7,902 | | | | 8,158 | | | | 7,946 | | | | 8,109 | | | | 8,466 | | | |
Income before financial expenses | | | 5,750 | | | | 5,596 | | | | 5,393 | | | | 5,359 | | | | 5,904 | | | |
| | | | | | |
Financial expenses | | | 2,425 | | | | 2,449 | | | | 2,532 | | | | 2,513 | | | | 2,712 | | | |
| | | | | | |
Net income | | $ | 3,325 | | | $ | 3,147 | | | $ | 2,861 | | | $ | 2,846 | | | $ | 3,192 | | | |
| | | | | | |
DIVIDEND | | $ | 2,535 | | | $ | 2,360 | | | $ | 2,146 | | | $ | 2,135 | | | $ | 2,394 | | | |
BALANCESHEETSUMMARY | | | | | | | | | | | | | | | | | | | | | | |
Total assets | | $ | 73,108 | | | $ | 75,199 | | | $ | 75,167 | | | $ | 75,769 | | | $ | 76,989 | | | |
Long-term debt, including current portion and perpetual debt | | $ | 44,752 | | | $ | 45,983 | | | $ | 45,909 | | | $ | 45,259 | | | $ | 46,335 | | | |
Equity | | $ | 17,961 | | | $ | 19,475 | | | $ | 19,704 | | | $ | 19,755 | | | $ | 21,209 | | | |
| | | | | | |
INVESTMENTSFORCONTINUINGOPERATIONSAFFECTINGCASH | | | | | | | | | | | | | | | | | | | | | | |
Property, plant and equipment and intangible assets | | $ | 3,815 | | | $ | 3,440 | | | $ | 3,460 | | | $ | 3,754 | | | $ | 3,402 | | | |
| | | | | | |
FINANCIALRATIOS | | | | | | | | | | | | | | | | | | | | | | |
Return on equitya | | | 16.6% | | | | 15.3% | | | | 13.4% | | | | 12.9% | | | | 14.0% | | | |
Capitalizationb | | | 28.9% | | | | 30.1% | | | | 30.5% | | | | 30.7% | | | | 31.8% | | | |
Profit marginc | | | 24.4% | | | | 22.9% | | | | 21.4% | | | | 21.1% | | | | 22.2% | | | |
Interest coveraged | | | 2.23 | | | | 2.20 | | | | 2.16 | | | | 2.13 | | | | 2.18 | | | |
Self-financinge | | | 56.4% | | | | 82.8% | | | | 58.8% | | | | 66.6% | | | | 63.9% | | | |
| a) | Net income divided by average equity for the year less average accumulated other comprehensive income for the year. |
| b) | Equity divided by the sum of equity, long-term debt, current portion of long-term debt, perpetual debt, borrowings and derivative instrument liabilities, less derivative instrument assets and sinking fund. |
| c) | Net income divided by revenue. |
| d) | Sum of income before financial expenses and net investment income divided by interest on debt securities. |
| e) | Cash flows from operating activities less dividend paid, divided by the sum of cash flows from investing activities, excluding net change in short-term investments and sinking fund, and repayment of long-term debt. |
| Note: | Certain comparative figures in the Five-Year Review have been reclassified to conform to the presentation adopted in the current year. |
- 5 -
FIVE-YEAR REVIEW (CONTINUED)
| | | | | | | | | | | | | | | | | | | | | | |
| OPERATINGSTATISTICS | | | | | | | | | | | | | | | | | |
| | | Years ended December 31 |
| | | |
| | | | 2014 | | | | 2015 | | | | 2016 | | | | 2017 | | | | 2018 | | | |
| | |
| | | (in GWh) | | | |
Electricity sales | | | | | | | | | | | | | | | | | | | | | | |
In Québec, by segment | | | | | | | | | | | | | | | | | | | | | | |
Residential | | | 68,074 | | | | 66,558 | | | | 65,065 | | | | 66,111 | | | | 69,566 | | | |
Commercial, institutional and small industrial | | | 45,189 | | | | 45,335 | | | | 45,483 | | | | 45,816 | | | | 47,659 | | | |
Large industrial | | | 55,738 | | | | 54,200 | | | | 53,635 | | | | 53,699 | | | | 50,252 | | | |
Other | | | 5,222 | | | | 5,170 | | | | 5,062 | | | | 5,077 | | | | 5,337 | | | |
| | | |
| | | | 174,223 | | | | 171,263 | | | | 169,245 | | | | 170,703 | | | | 172,814 | | | |
Outside Québec | | | | | | | | | | | | | | | | | | | | | | |
Canada/U.S. | | | 26,624 | | | | 29,864 | | | | 32,744 | | | | 34,935 | | | | 36,524 | | | |
Total electricity sales | | | 200,847 | | | | 201,127 | | | | 201,989 | | | | 205,638 | | | | 209,338 | | | |
| | |
| | | (in millions of dollars) | | | |
Revenue from electricity sales | | | | | | | | | | | | | | | | | | | | | | |
In Québec, by segment | | | | | | | | | | | | | | | | | | | | | | |
Residential | | $ | 5,162 | | | $ | 5,222 | | | $ | 5,155 | | | $ | 5,285 | | | $ | 5,591 | | | |
Commercial, institutional and small industrial | | | 3,657 | | | | 3,774 | | | | 3,842 | | | | 3,873 | | | | 4,016 | | | |
Large industrial | | | 2,389 | | | | 2,350 | | | | 2,265 | | | | 2,288 | | | | 2,196 | | | |
Other | | | 308 | | | | 316 | | | | 311 | | | | 317 | | | | 331 | | | |
| | | |
| | | | 11,516 | | | | 11,662 | | | | 11,573 | | | | 11,763 | | | | 12,134 | | | |
Outside Québec | | | | | | | | | | | | | | | | | | | | | | |
Canada/U.S. | | | 1,629 | | | | 1,700 | | | | 1,626 | | | | 1,651 | | | | 1,731 | | | |
Total revenue from electricity sales | | $ | 13,145 | | | $ | 13,362 | | | $ | 13,199 | | | $ | 13,414 | | | $ | 13,865 | | | |
| | |
| | | (as at December 31) | | | |
Number of customer accounts | | | | | | | | | | | | | | | | | | | | | | |
In Québec, by segment | | | | | | | | | | | | | | | | | | | | | | |
Residential | | | 3,857,782 | | | | 3,890,956 | | | | 3,924,992 | | | | 3,958,300 | | | | 3,994,491 | | | |
Commercial, institutional and small industrial | | | 317,671 | | | | 319,294 | | | | 314,816 | | | | 316,430 | | | | 317,608 | | | |
Large industrial | | | 183 | | | | 181 | | | | 183 | | | | 184 | | | | 185 | | | |
Other | | | 4,214 | | | | 4,290 | | | | 4,550 | | | | 4,582 | | | | 4,630 | | | |
Total customer accounts | | | 4,179,850 | | | | 4,214,721 | | | | 4,244,541 | | | | 4,279,496 | | | | 4,316,914 | | | |
- 6 -
FIVE-YEAR REVIEW (CONTINUED)
| | | | | | | | | | | | | | | | | | | | |
| OPERATINGSTATISTICS (CONTINUED) | | | | | | | | | | | | | | | |
| | | Years ended December 31 | |
| | | | 2014 | | | | 2015 | | | | 2016 | | | | 2017 | | | | 2018 | |
| |
| | | (in MW) | |
Installed capacity | | | | | | | | | | | | | | | | | | | | |
Hydroelectric | | | 36,100 | | | | 36,370 | | | | 36,366 | | | | 36,767 | | | | 36,767 | |
Thermal | | | 543 | | | | 542 | | | | 542 | | | | 542 | | | | 543 | |
Total installed capacity | | | 36,643 | | | | 36,912 | | | | 36,908 | | | | 37,309 | | | | 37,310 | a |
| | |
| | | (in GWh) | |
| | | | | |
Total energy requirementsb | | | 222,045 | | | | 222,172 | | | | 223,143 | | | | 226,824 | | | | 230,795 | |
| |
| | | (in MW) | |
| | | | | |
Peak power demand in Québecc | | | 38,743 | | | | 37,349 | | | | 36,797 | | | | 38,204 | | | | 38,319 | |
| |
| | | (in km *) | |
| | | | | |
Lines (overhead and underground) | | | | | | | | | | | | | | | | | | | | |
Transmission | | | 34,187 | | | | 34,272 | | | | 34,292 | | | | 34,479 | | | | 34,361 | d |
Distribution | | | 219,793 | | | | 220,920 | | | | 221,843 | | | | 224,033 | | | | 224,659 | |
Total lines (overhead and underground) | | | 253,980 | | | | 255,192 | | | | 256,135 | | | | 258,512 | | | | 259,020 | |
| a) | In addition to the generating capacity of our own facilities, we have access to almost all the output from Churchill Falls generating station (5,428 MW) under a contract with Churchill Falls (Labrador) Corporation Limited that will remain in effect until 2041. We also purchase all the output from 41 wind farms (3,876 MW) and 7 small hydropower plants (107 MW) and almost all the output from 8 biomass and 4 biogas cogeneration plants (272 MW) operated by independent power producers. Moreover, 992 MW are available under long-term contracts with other suppliers. |
| b) | Total energy requirements consist of kilowatthours delivered within Québec and to neighboring systems. |
| c) | The values indicated reflect demand at the annual domestic peak for the winter beginning in December, including interruptible power.
The 2018–2019 winter peak occurred at 8:00 a.m. on January 22, 2019. The 2018 figure was valid on February 15, 2019. |
| d) | 34,089 km of lines operated by Hydro-Québec TransÉnergie and 272 km by Hydro-Québec Distribution. |
OTHERINFORMATION
| | | | | | | | | | | | | | | | | | | | |
| | | 2014 | | | 2015 | | | 2016 | | | 2017 | | | 2018 | |
Rate increase as at April 1a | | | 4.3% | | | | 2.9% | | | | 0.7% | | | | 0.7% | | | | 0.3% | |
| | | | As at December 31 | |
Total number of employeesb | | | | | | | | | | | | | | | | | | | | |
Permanent | | | 17,793 | | | | 17,475 | | | | 17,282 | | | | 17,338 | | | | 16,960 | |
Temporary | | | 2,250 | | | | 2,319 | | | | 2,270 | | | | 2,448 | | | | 2,944 | |
| | | | 20,043 | | | | 19,794 | | | | 19,552 | | | | 19,786 | | | | 19,904 | |
| | | | | |
Representation of target groups | | | | | | | | | | | | | | | | | | | | |
Women | | | 29.4% | | | | 29.0% | | | | 28.7% | | | | 28.9% | | | | 28.8% | |
Otherc | | | 6.8% | | | | 7.4% | | | | 7.7% | | | | 8.1% | | | | 8.9% | |
| a) | Excluding Rate L (“Rate L”). Rate L applies to an annual contract whose minimum billing demand is 5,000 kW or more and which is principally related to an industrial activity. |
| b) | Excluding employees of subsidiaries and joint ventures. |
| c) | Self-reported members (men and women) of the following groups: Indigenous peoples, ethnic minorities, visible minorities and people with disabilities. |
UNITSOFMEASURE
| | |
V: volt (a unit for measuring voltage) |
kV: kilovolt (one thousand volts) |
W: watt (a unit for measuring power) | | Wh: watthour (a unit for measuring electric energy) |
kW: kilowatt (one thousand watts) | | kWh: kilowatthour (one thousand watthours) |
MW: megawatt (one million watts) | | MWh: megawatthour (one million watthours) |
GW: gigawatt (one billion watts) | | GWh: gigawatthour (one billion watthours) |
| | | TWh: terawatthour (one trillion watthours) |
- 7 -
HYDRO-QUÉBEC
GENERAL
We operate one of the major systems in Canada for the generation, transmission and distribution of electric power. We supply virtually all electric power distributed in Québec, the largest province in Canada in land area and the second largest in population.
Hydro-Québec was created in 1944 by the Hydro-Québec Act of the Parliament of Québec and is an agent of Québec. All capital stock of Hydro-Québec is held by the Minister of Finance on behalf of the Government of Québec (the “Government”).
Our head office is located at 75 René-Lévesque Boulevard West, Montréal, Québec, Canada.
We carry on our activities in the four reportable business segments defined below. The other business segments and activities are grouped together under Corporate and Other Activities for reporting purposes.
| ● | | Generation: Hydro-Québec Production operates and develops our generating facilities in Québec. Hydro-Québec Production provides Hydro-Québec Distribution with a base volume of up to 165 TWh of heritage pool electricity annually (“Heritage Pool Electricity”). Beginning in 2014, the Heritage Pool Electricity is subject to a yearly indexation (see “Regulatory Framework – Energy Board Act”). The authorized average price was 2.90¢/kWh for 2017 and 2.92¢/kWh for 2018. In addition, Hydro-Québec Production can participate in Hydro-Québec Distribution’s calls for tenders in a context of free market competition. It also sells electricity in markets outside Québec and engages in energy-related arbitrage transactions; |
| ● | | Transmission: Hydro-Québec TransÉnergie operates and develops our power transmission system. It markets system capacity and manages power flows throughout Québec; |
| ● | | Distribution: Hydro-Québec Distribution operates and develops our distribution system and supplies electricity to the Québec market. It also carries out activities related to electricity sales in Québec as well as customer services and promotes energy efficiency; |
| ● | | Construction: Hydro-Québec Innovation, équipement et services partagés and our wholly-owned subsidiary, Société d’énergie de la Baie James (“SEBJ”), design, build and refurbish generating and transmission facilities, mainly for Hydro-Québec Production and Hydro-Québec TransÉnergie. Hydro-Québec Innovation, équipement et services partagés is responsible for projects throughout Québec, except in the territory governed by the James Bay and Northern Québec Agreement (the “JBNQA”). SEBJ builds generating facilities in the territory governed by the JBNQA (north of the 49th parallel) and may also carry out certain projects elsewhere in Québec and outside the province; and |
| ● | | Corporate and Other Activities: The corporate units support our divisions in the achievement of their business objectives. As at December 31, 2018, Corporate and Other Activities included corporate activities, as well as the Vice-présidence – Technologies de l’information et des communications (Information and Communication Technologies Vice Presidency), Vice-présidence – Développement des affaires (Business Development Vice Presidency), Direction principale – Centre de services partagés (Shared Services Center Unit), Direction principale – Approvisionnement stratégique (Strategic Procurement Unit), Direction principale – Institut de recherche d’Hydro-Québec (Hydro-Québec Research Institute Unit), Direction principale – Filiales d’Hydro-Québec (Hydro-Québec Subsidiaries Unit), Center of Excellence in Transportation Electrification and Energy Storage (“CETEES”) and Direction principale – Amélioration continue et planification stratégique d’entreprise (Continuous Improvement and Strategic Planning Unit). |
The mandate of the Vice-présidence – Développement des affaires is to prospect for business opportunities and act on them so that we can not only increase our operating revenue and income from markets outside Québec, but also play a leading role in the global energy transition to a cleaner energy future, in accordance with the strategies laid out in the Strategic Plan 2016–2020. This unit pursues potential international investments in the form of acquisitions, equity stakes or long-term partnerships that will leverage our expertise in hydroelectric generation and power transmission. In addition, it is involved in developing our export markets by highlighting the benefits of Québec hydropower, and it supports our initiatives in transportation electrification, for example by piloting the expansion of the Electric Circuit (public charging network for electric vehicles) in Québec and neighboring markets.
- 8 -
The Direction principale – Centre de services partagés1 offers services pertaining to real estate management and materials management, as well as transportation and other specialized services. The Direction principale – Approvisionnement stratégique1 provides procurement guidelines, products and services to the entire company, in line with best practices. The Direction principale – Institut de recherche d’Hydro-Québec1 develops and adapts leading-edge technology solutions according to our business requirements and objectives. It provides technical assistance to our divisions and carries out innovation projects to support their operations and ensure our long-term development. The Direction principale – Filiales d’Hydro-Québec2, set up in 2018, guides research and development work on battery materials and energy storage systems in collaboration with the CETEES1. It also markets the technologies developed by the CETEES, which conducts research and development on battery materials. The Direction principale – Amélioration continue et planification stratégique d’entreprise2 is tasked with fostering a customer-focused culture. To this end, it develops motivating strategies for enhancing process efficiency and service quality, while progressively deploying a company-wide management system that will help managers and employees address shortcomings, identify problems and implement solutions for reaching and sustaining ambitious levels of customer service and operational efficiency. It also coordinates the preparation and updating of the Strategic Plan and all related work.
Corporate activities consist of the Groupe – Direction financière et du risque (Financial and Risk Management Group), Groupe – Affaires corporatives et juridiques et gouvernance (Corporate and Legal Affairs and Governance Group), Vice-présidence – Communications et affaires gouvernementales (Communications and Governmental Affairs Vice Presidency), Vice-présidence – Ressources humaines (Human Resources Vice Presidency) and Direction – Santé et sécurité (Health and Safety Unit).
Following organizational adjustments that took effect in February 2019, the activities handled by the Direction – Électrification des transports (Transportation Electrification Unit), including those related to the Electric Circuit, now fall under the responsibility of the Vice-présidence – Communications et affaires gouvernementales, which was renamed Vice-présidence – Communications et affaires gouvernementales et autochtones (Communications and Government and Indigenous Affairs Vice Presidency). In addition, the Vice-présidence – Développement des affaires was renamed the Vice-présidence – Stratégies, croissance des exportations, fusions et acquisitions (Strategy, Export Growth, Mergers and Acquisitions Vice Presidency). The Direction principale – Amélioration continue et planification stratégique d’entreprise has been dissolved and its strategic planning activities are now handled by the Vice-présidence – Stratégies, croissance des exportations, fusions et acquisitions. The aim of this restructuring was to ensure that our growth activities are in line with our long-term vision.
1 This structural unit reports to the President of Hydro-Québec Innovation, équipement et services partagés.
2 This structural unit reports to Hydro-Québec’s Chief Operating Officer.
- 9 -
GENERATION
Hydro-Québec Production generates power to supply the Québec market and sells power on wholesale markets.
The following subsidiaries, affiliates and interests are also part of this segment:
| ● | | Churchill Falls (Labrador) Corporation Limited (“CF(L)Co”) (34.2% interest; hydroelectric generation activities); |
| ● | | HQ Manicouagan inc. (wholly-owned; holds a 60% interest in Manicouagan Power Limited Partnership, which owns and operates a generating station (McCormick) located on the Rivière Manicouagan); |
| ● | | Marketing d’énergie HQ inc. (HQ Energy Marketing Inc.) (“HQEM”) (wholly-owned; conducts energy transactions in other Canadian provinces and holds shares in energy trading companies in Canada and the United States); |
| ● | | H.Q. Energy Services (U.S.) Inc. (“HQUS”) (wholly-owned subsidiary of HQEM; power marketer in the United States); and |
| ● | | Hydro Renewable Energy Inc. (“HRE”) (wholly-owned subsidiary of HQEM; participates in the development of new projects in the United States). |
- 10 -
GENERATION OPERATIONS
Facilities
In Québec, our electric generation system comprises 87 generating stations currently in service, of which 63 are hydroelectric and 24 are thermal; with a total installed capacity of 37,310 MW as of December 31, 2018.
The following table lists the generating stations in service as of such date.
GENERATING STATIONS IN SERVICE IN QUÉBEC
| | | | | | | | |
| | | |
| Name of Facility | | Years Commissioneda | | | Capacity | |
| | | | | | (MW) | |
Hydroelectricb | | | | | | | | |
Robert-Bourassa | | | 1979-1981 | | | | 5,616 | |
La Grande-4 | | | 1984-1986 | | | | 2,779 | |
La Grande-3 | | | 1982-1984 | | | | 2,417 | |
La Grande-2-A | | | 1991-1992 | | | | 2,106 | |
Beauharnois | | | 1932-1961 | | | | 1,900 | |
Manic-5 | | | 1970-1971 | | | | 1,596 | |
La Grande-1 | | | 1994-1995 | | | | 1,436 | |
René-Lévesque (Manic-3) | | | 1975-1976 | | | | 1,326 | |
Jean-Lesage (Manic-2) | | | 1965-1967 | | | | 1,229 | |
Bersimis-1 | | | 1956-1959 | | | | 1,178 | |
Manic-5-PA | | | 1989-1990 | | | | 1,064 | |
Outardes-3 | | | 1969 | | | | 1,026 | |
Sainte-Marguerite-3 | | | 2003-2004 | | | | 882 | |
Laforge-1 | | | 1993-1994 | | | | 878 | |
Bersimis-2 | | | 1959-1960 | | | | 845 | |
Outardes-4 | | | 1969 | | | | 785 | |
Eastmain-1-A | | | 2011-2012 | | | | 768 | |
Carillon | | | 1962-1964 | | | | 753 | |
Romaine-2 | | | 2014 | | | | 640 | |
Toulnustouc | | | 2005 | | | | 526 | |
Outardes-2 | | | 1978 | | | | 523 | |
Eastmain-1 | | | 2006 | | | | 480 | |
Brisay | | | 1993 | | | | 469 | |
Romaine-3 | | | 2017 | | | | 395 | |
Péribonka | | | 2007-2008 | | | | 385 | |
Laforge-2 | | | 1996 | | | | 319 | |
Trenche | | | 1950-1955 | | | | 302 | |
La Tuque | | | 1940-1955 | | | | 294 | |
Romaine-1 | | | 2015 | | | | 270 | |
Beaumont | | | 1958-1959 | | | | 270 | |
McCormick | | | 1951-1965 | | | | 235 | |
Rocher-de-Grand-Mère | | | 2004 | | | | 230 | |
Paugan | | | 1928-1956 | | | | 226 | |
Rapide-Blanc | | | 1934-1955 | | | | 204 | |
Shawinigan-2 | | | 1911-1929 | | | | 200 | |
Shawinigan-3 | | | 1948-1949 | | | | 194 | |
Manic-1 | | | 1966-1967 | | | | 184 | |
Rapides-des-Îles | | | 1966-1973 | | | | 176 | |
Chelsea | | | 1927-1939 | | | | 152 | |
Sarcelle | | | 2013 | | | | 150 | |
La Gabelle | | | 1924-1931 | | | | 131 | |
Première-Chute | | | 1968-1975 | | | | 131 | |
Les Cèdres | | | 1914-1924 | | | | 113 | |
Rapides-des-Quinze | | | 1923-1955 | | | | 109 | |
Rapides-Farmer | | | 1927-1947 | | | | 104 | |
Other (18 generating stations rated less than 100 MW) | | | 1915-2009 | | | | 771 | |
Total | | | | | | | 36,767 | |
Thermal | | | | | | | | |
Bécancour (gas turbine) | | | 1992-1993 | | | | 411 | |
Other (23 diesel plants on off-grid systems)c | | | 1967-2015 | | | | 132 | |
Total | | | | | | | 543 | |
| a) | Indicates years when facilities began commercial operation. |
| b) | 62 facilities are managed by Hydro-Québec Production and one facility is managed by Hydro-Québec Distribution. |
| c) | Managed by Hydro-Québec Distribution. |
- 11 -
Electricity Purchases
We purchase energy and capacity from the Churchill Falls generating station in Labrador through agreements with CF(L)Co. Under an initial power contract signed in 1969 with CF(L)Co, we agreed to purchase annually, through the year 2041, 4,083 MW of power (the “1969 Power Contract”). In June 1999, we signed another agreement with CF(L)Co to guarantee us the availability of 682 MW of additional power until 2041 for each November 1 to March 31 period. In 2018, the energy received totaled 31.0 TWh at a cost of $97 million as compared to 26.2 TWh in 2017.
We have a power agreement with Rio Tinto Alcan Inc., which was amended in 2006, for the purchase of 365 MW of peak power and 375 MW of additional peak power until December 31, 2045. Under this 2006 amendment, we also agreed to purchase from Rio Tinto Alcan Inc. an additional 150 MW of peak power until December 31, 2045.
In addition, we purchase energy and capacity under 59 long-term contracts with independent producers located in Québec. During 2018, 2.7 TWh were purchased under these contracts, at a total cost of $213 million. For 2019, we expect to purchase approximately 2.9 TWh. Hydro-Québec Distribution also has long-term contracts with independent producers (see “Distribution”).
We also purchase energy and capacity in connection with our energy marketing operations (see “Wholesale and Energy Marketing Operations”).
Peak
We use energy purchased from our neighboring systems, which experience different demand patterns, to meet a portion of our peak power needs in Québec (see “Wholesale and Energy Marketing Operations”). The following table summarizes our peak power demand in Québec and installed capacity as at December 31 for the years 2014 through 2018.
| | | | | | | | | | | | | | | |
| | | | |
| | | Peak Power Demanda | | Installed Capacity | | Total Average Loadc |
| | | (MW) |
| | | |
2014 | | | | 38,743 | | | | | 36,643 | | | | | 25,348 | |
2015 | | | | 37,349 | | | | | 36,912 | | | | | 25,362 | |
2016 | | | | 36,797 | | | | | 36,908 | | | | | 25,403 | |
2017 | | | | 38,204 | | | | | 37,309 | | | | | 25,893 | |
2018 | | | | 38,319 | | | | | 37,310b | | | | | 26,346 | |
| a) | The values indicated correspond to the needs for the winter beginning in December, including interruptible power. The 2018-2019 winter peak was 38,319 MW and occurred at 8:00 a.m. on January 22, 2019. The 2018 figure was valid on February 15, 2019. |
| b) | In addition to the generating capacity of our own facilities, we have access to almost all the output from Churchill Falls generating station (5,428 MW) under a contract with Churchill Falls (Labrador) Corporation Limited that will remain in effect until 2041. We also purchase all the output from 41 wind farms (3,876 MW) and 7 small hydropower plants (107 MW) and almost all the output from 8 biomass and 4 biogas cogeneration plants (272 MW) operated by independent power producers. Moreover, 992 MW are available under long-term contracts with other suppliers. |
| c) | Total energy requirements (consisting of kilowatthours delivered within Québec and to neighboring systems), divided by the number of hours in the year. |
WHOLESALEAND ENERGY MARKETING OPERATIONS
Québec Wholesale Market
The Québec wholesale electricity market has been open since May 1, 1997. This market is comprised of 11 distributors: Hydro-Québec Distribution, nine distributors operating municipal systems and one regional electricity cooperative. As a result of the opening of the wholesale market, the municipal systems can, subject to the Government’s authorization, purchase electricity from suppliers other than Hydro-Québec Distribution, and independent generators in Québec can sell their electricity on the wholesale market using Hydro-Québec TransÉnergie’s transmission facilities.
In addition to the Heritage Pool Electricity, Hydro-Québec Production provides other power supplies and products to Hydro-Québec Distribution, including a call for tenders issued in 2002 for the supply of 600 MW over a 20-year period starting in March 2007 and a 20-year capacity supply of 500 MW resulting from a call for tenders issued in 2015, which began in December 2018.
- 12 -
Markets Outside Québec
Our main markets outside Québec consist of neighboring networks located in Canada and the United States.
HQUS is a member of New York ISO, ISO New England (which includes all or parts of Connecticut, Maine, Massachusetts, New Hampshire, Rhode Island and Vermont), Midcontinent ISO (which includes all or parts of Arkansas, Illinois, Indiana, Iowa, Kentucky, Louisiana, Michigan, Minnesota, Mississippi, Missouri, Montana, North Dakota, South Dakota, Texas, Wisconsin and Manitoba (Canada)) and PJM Interconnection (which includes all or parts of Delaware, Illinois, Indiana, Kentucky, Maryland, Michigan, New Jersey, North Carolina, Ohio, Pennsylvania, Tennessee, Virginia, West Virginia and the District of Columbia). HQUS is also a participant in the electricity markets operated by Southwest Power Pool Inc. (which includes all or parts of Arkansas, Iowa, Kansas, Louisiana, Minnesota, Missouri, Montana, Nebraska, New Mexico, North Dakota, Oklahoma, South Dakota, Texas and Wyoming). ISOs, or Independent Systems Operators, and RTOs, or Regional Transmission Organizations, enable participants to buy and sell energy, schedule bilateral transactions and reserve transmission service. HQUS holds a permit from the U.S. Federal Energy Regulatory Commission to sell at market-based rates.
HQEM is a participant of the Ontario Independent Electricity System Operator (the “Ontario IESO”). HQEM sells and buys energy in Manitoba, Ontario, New Brunswick and Nova Scotia, and has transmission service agreements with Manitoba Hydro and New Brunswick Power Corporation to reserve transmission service on their respective systems.
We have long-term export contracts for the sale of electricity. The following table summarizes our principal energy export agreements.
PRINCIPAL ENERGY EXPORT AGREEMENTS
| | | | | | | | | | | | | | | |
| | | | |
| Counterparties | | Expiry Date | | Maximum Capacity | | Maximum Annual
Deliveries |
| | | | | (MW) | | (TWh) |
Cornwall Electric – Canadaa | | | | 2019 | | | | | 45 | | | | | 0.2 | |
Cornwall Electric – Canadaa | | | | 2019 | | | | | 100 | | | | | 0.4b | |
Vermont Joint Owners | | | | 2020 | | | | | 335 | | | | | 2.1 | |
Ontario IESO | | | | 2023 | | | | | N/A | | | | | 2.0 | |
Vermont power distributorsc | | | | 2038 | | | | | 225 | | | | | 1.3 | |
| a) | In addition to those contracts, in October 2016, HQEM signed a power supply contract with Cornwall Electric – Canada. This contract will be in effect from 2020 to 2030 and we anticipate sales of power totaling up to approximately 145 MW. |
| b) | Based on historical data. |
| c) | Green Mountain Power Corporation, Vermont Electric Cooperative, Inc., Vermont Public Power Supply Authority, the Town of Stowe Electric Department and City of Burlington, Vermont Electric Department. |
We are continuing talks regarding participation in projects to build transmission lines between Québec and certain states in the northeastern United States. These interconnections would enable us to increase our exports to those markets.
On February 1, 2018, Massachusetts Electric Distribution Companies (“EDC”) selected a transmission line project, the New England Clean Energy Connect (“NECEC”) led by Central Maine Power, in which we are a partner to supply 9.45 TWh of clean hydroelectricity power over a 20-year period.
The NECEC project involves the construction of a new 1,200-MW transmission line from the Québec-Maine border to the City of Lewiston, Maine. All relevant contracts were executed on June 13, 2018. Subject to regulatory approval of the contracts and NECEC obtaining the required permits, we expect this transmission line to begin operation in December 2022.
- 13 -
Electricity Sales and Revenue
The following table summarizes electricity sales and revenue outside Québec, for the years 2014 through 2018.
ELECTRICITY SALES AND REVENUE OUTSIDE QUÉBEC
| | | | | | | | | | | | | | | | | | | | |
| | | Years ended December 31 | |
| | | 2014 | | | 2015 | | | 2016 | | | 2017 | | | 2018 | |
| | | | | |
Electricity Sales (GWh) | | | 26,624 | | | | 29,864 | | | | 32,744 | | | | 34,935 | | | | 36,524 | |
Revenue from Electricity Sales ($M) | | | 1,629 | | | | 1,700 | | | | 1,626 | | | | 1,651 | | | | 1,731 | |
- 14 -
TRANSMISSION
Hydro-Québec TransÉnergie provides the following services:
| ● | | transmission of electricity to supply Québec’s native load; the native load is made up of the total transmission requirements of the Québec wholesale market (see “Generation – Québec Wholesale Market”) but excludes customers in remote communities; Hydro-Québec Distribution is Hydro-Québec TransÉnergie’s largest customer; |
| ● | | point-to-point transmission service; as of the end of 2018, Hydro-Québec TransÉnergie had signed transmission service agreements with 23 customers, including Hydro-Québec Production, the largest customer for this service; and |
| ● | | connection of privately-owned generating facilities to Hydro-Québec TransÉnergie’s transmission system; Hydro-Québec TransÉnergie currently serves 66 of these generating stations. |
This segment includes our holding in Cedars Rapids Transmission Company, Limited, a transmission provider that owns and operates a 325 MW interconnection line linking Hydro-Québec TransÉnergie’s grid at Les Cèdres and Langlois substations in Québec with the Cornwall Electric system in Ontario and the National Grid system in New York State.
TRANSMISSION SYSTEM
Most generating complexes in Québec are located at substantial distances from consumer centers. As a result, Hydro-Québec TransÉnergie’s transmission system is one of the most extensive in North America, totaling approximately 21,000 miles of lines. The system includes the following facilities as at December 31, 2018.
| | | | | | | | |
| | | |
| Voltage | | Substations | | | Lines (miles)a | |
765 kV and 735 kV | | | 41 | | | | 7,405 | |
450 kV DC | | | 2 | | | | 757 | |
315 kV | | | 80 | | | | 3,416 | |
230 kV | | | 53 | | | | 2,021 | |
161 kV | | | 43 | | | | 1,330 | |
120 kV | | | 219 | | | | 4,328 | |
69 kV or less | | | 94b | | | | 2,094c | |
TOTAL | | | 532 | | | | 21,351 | |
| a) | Miles covered by the transmission system. Many facilities carry two circuits on the same infrastructure. |
| b) | 83 substations operated by Hydro-Québec TransÉnergie and 11 by Hydro-Québec Distribution. |
| c) | 1,925 miles of lines operated by Hydro-Québec TransÉnergie and 169 miles by Hydro-Québec Distribution. |
Hydro-Québec TransÉnergie provides open access to its transmission grid in accordance with the Hydro-Québec Open Access Transmission Tariff. Consequently, electricity distributors, producers and marketers in and outside Québec have the option to enter into transactions with distributors, producers and marketers to buy or sell electricity and to wheel in, wheel out or wheel through Hydro-Québec TransÉnergie’s transmission grid at specified rates.
Hydro-Québec TransÉnergie’s Direction – Contrôle des mouvements d’énergie (System Control Unit) is responsible for energy dispatching, power flow supervision and system security monitoring and it acts as Reliability Coordinator for transmission systems in Québec. Hydro-Québec TransÉnergie’s transmission system is linked through interconnections with other major power systems in Canada (Ontario, New Brunswick and Churchill Falls) and the northeastern United States (New York and New England).
The following table shows existing interconnection capacity with neighboring systems outside Québec as at December 31, 2018. Available transfer capacities are posted on the OASIS (Open Access Same-Time Information System) website.
INTERCONNECTIONS WITH NEIGHBORING SYSTEMS OUTSIDE QUÉBEC
| | | | | | | | | | | | | | | | | |
| | | | | |
| | | | | Maximum Export Capacity | | Maximum Import Capacity | | Voltage |
| | | | | (MW) | | (MW) | | (kV) |
CANADA | | Ontario | | | | 2,705 | | | | | 1,920 | | | 120, 230 and 240 |
| | New Brunswick | | | | 1,200 | | | | | 785 | | | 230, 315 and 345 |
| | Churchill Falls | | | | – | | | | | 5,150 | | | 735 |
| | | | |
UNITED STATES | | New York | | | | 1,999 | | | | | 1,100 | | | 120 and 765 |
| | | New England | | | | 2,342 | | | | | 2,170 | | | 120 and ±450 DC |
- 15 -
DISTRIBUTION
Hydro-Québec Distribution provides a secure, reliable supply of electricity and related services to the Québec market. To fulfill this responsibility, Hydro-Québec Distribution relies primarily on the Heritage Pool Electricity supplied by Hydro-Québec Production. Hydro-Québec Distribution also purchases additional electricity under market conditions by issuing calls for tenders from suppliers in the market (see “Regulatory Framework – Energy Board Act”).
Our distribution system is comprised of 73,403 miles of medium voltage lines (almost exclusively 25 kV), as well as 66,194 miles of low voltage lines. Approximately 10% of all such lines are underground.
Hydro-Québec Distribution sells to a wide range of customers, from large industrial users, which accounted for 29.1% of sales volume in 2018, to residential customers, which represented 40.3% of sales volume in the same period. Revenues are also derived from sales to commercial, institutional and small industrial customers as well as distributors operating municipal electric systems.
Hydro-Québec Distribution has developed some flexibility in the management of our system and currently has 907 MW of interruptible power, 296 MW of demand-side management and 550 MW of concurrent peak-saving capacity in our residential dual-energy market.
Hydro-Québec Distribution has entered into special agreements with nine industrial customers for whom electricity costs represent a substantial proportion of total production costs. Some of these agreements provide for the sale, on a long-term basis, of firm energy at prices that vary in accordance with a formula based on the market price of aluminum. We manage the exposure to fluctuations in aluminum prices resulting from these contracts by entering into financial transactions, such as futures or swaps (see “Note 15 to the 2018 Consolidated Financial Statements”). In 2018, deliveries under these agreements accounted for 44% of the total energy deliveries to large industrial users.
Hydro-Québec Distribution relies on various sources to supply the Québec market. Hydro-Québec Distribution relies primarily on the Heritage Pool Electricity of 165 TWh, which it purchases from Hydro-Québec Production, and also issues short- and long-term calls for tenders. For requirements of less than three months, it may also buy electricity directly on the market, without tendering, under an authorization granted by the Régie de l’énergie (the “Energy Board”). For unforeseen needs that cannot be met otherwise, it relies on a framework agreement with Hydro-Québec Production, also approved by the Energy Board, that covers the period from January 1, 2017, to December 31, 2019.
Further to calls for tenders issued since 2002, Hydro-Québec Distribution signed five contracts with Hydro-Québec Production for the supply of 1,100 MW (two contracts totaling 600 MW over a 20-year period beginning in March 2007 and three contracts totaling 500 MW over a 20-year period beginning in December 2018) and 71 contracts with independent producers for the supply of 4,700 MW (including 3,722 MW of wind-generated electricity) for deliveries beginning between 2006 and 2021. Hydro-Québec Production also has long-term contracts with independent producers (see “Generation – Electricity Purchases”).
- 16 -
The following table summarizes these contracts as at December 31, 2018.
LONG-TERM CONTRACTS AWARDED
| | | | | | | | | | | | | | | | | | | | |
| | | | | | | | | | |
| Type of power | | Number of
Contracts | | | | | | | | Capacity | | | | | Starting Date | | | | Expiry Date |
| | | | | | | | | | | (MW) | | | | | | | | | |
Hydroelectric | | 12 | | | | In service | | | | | 1,203 | | | | | 2007-2018 | | | | 2027-2038 |
| | 2 | | | | Under development | | | | | 19 | | | | | 2021 | | | | 2041 |
| | | | | | | | | |
Natural gas cogeneration | | 1 | | | | In service | | | | | 507 | | | | | 2006 | | | | 2026 |
| | | | | | | | | |
Wind | | 36 | | | | In service | | | | | 3,668 | | | | | 2006-2018 | | | | 2026-2043 |
| | 3a | | | | Under development | | | | | 54 | | | | | 2019-2021 | | | | 2039-2041 |
| | | | | | | | | |
Forest biomass cogeneration | | 12 | | | | In service | | | | | 236 | | | | | 2007-2017 | | | | 2023-2040 |
| | 6 | | | | Under development | | | | | 89 | | | | | 2019-2021 | | | | 2044-2046 |
| | | | | | | | | |
Biomass cogeneration | | 4 | | | | In service | | | | | 25 | | | | | 2012-2017 | | | | 2032-2042 |
| | | 76 | | | | | | | | | 5,800b | | | | | | | | | |
| a) | One (1) wind-generated electricity contract is on off-grid systems. |
| b) | Total may differ due to rounding. |
Hydro-Québec Distribution manages its flexible and diversified energy portfolio to deal with fluctuations in demand. Every three years, Hydro-Québec Distribution prepares a supply plan covering the next 10 years. This supply plan presents forecasts of Hydro-Québec Distribution’s customers’ electricity requirements, taking into account energy efficiency measures, along with the various means that Hydro-Québec Distribution intends to use to ensure a secure supply of electricity for Québec. The Electricity Supply Plan 2017–2026 was filed with the Energy Board in November 2016 and a final decision was issued on December 20, 2017. The second progress report of the Electricity Supply Plan 2017–2026 was filed with the Energy Board on November 1, 2018. The Electricity Supply Plan 2020–2029 is currently being prepared and is expected to be filed with the Energy Board by November 2019.
Hydro-Québec Distribution has taken various measures to ensure balance between supply and demand in Québec, including:
| ● | | Further to a call for tenders issued in July 2015, a three-year contract for wind integration services beginning on September 1, 2016 was signed with Hydro-Québec Production in January 2016 and approved by the Energy Board in June 2016. On November 23, 2018, the Energy Board agreed to extend this contract for an additional year, until August 31, 2020. A call for tenders for wind integration services during a new three-year period is expected to be issued in 2019 following the approval by the Energy Board of the service characteristics as filed by Hydro-Québec Distribution on August 23, 2018. |
| ● | | An agreement for the suspension of electricity production at TransCanada Energy’s Bécancour generating station was approved by the Energy Board in May 2014 (the accounting for this agreement is described in “Note 3 to the 2018 Consolidated Financial Statements” under “Regulatory Assets – Costs related to a suspension agreement”); and |
| ● | | 0.8 TWh of short-term transactions in 2018. |
Additional calls for tenders could be made in the coming years in order to maintain this balance (see “Regulatory Framework – Energy Board Act”).
ELECTRICITY RATES
Under the applicable provisions of the Energy Board Act, rates are fixed or modified by the Energy Board (see “Regulatory Framework – Energy Board Act”). Rates are fixed to allow recovery of authorized service costs, including estimated supply costs, and a reasonable rate of return on shareholder’s equity.
In March 2019, the Energy Board authorized an electricity rate increase of 0.9% applicable to all customers except for Rate L customers, for which the increase is 0.3%. The new rates are effective as of April 1, 2019.
- 17 -
The following table shows the rate change which took effect in each year and the average rate increase for the year, from 2014 to 2019, as well as annual inflation rates:
| | | | | | | | | | | | | | | | | | | | | | | | |
| | | | 2014 | | | | 2015 | | | | 2016 | | | | 2017 | | | | 2018 | | | | 2019 | |
Rate increase as of April 1 | | | 4.27%a | | | | 2.86%a | | | | 0.7%a | | | | 0.7%a | | | | 0.3%a | | | | 0.9%a | |
Average rate increase from January 1 to December 31 | | | 3.8%b | | | | 3.2%b | | | | 1.2%b | | | | 0.7%b | | | | 0.4%b | | | | 0.8%b | |
Inflation Ratec | | | 2.0% | | | | 1.1% | | | | 1.4% | | | | 1.6% | | | | 2.3% | | | | 1.7%d | |
| a) | Excluding Rate L, for which the increase is 3.45% in 2014, 2.49% in 2015, 0% in 2016, 0.2% in 2017, 0% in 2018 and 0.3% in 2019. |
| c) | Canadian Consumer Price Index for the calendar year. |
ELECTRICITY SALESAND REVENUE
The following table summarizes consolidated electricity sales and revenue in Québec, by customer segments, for the years 2014 through 2018.
| | | | | | | | | | | | | | | | | | | | |
OPERATING STATISTICS | | | |
| | | Years ended December 31 | |
| | | | 2014 | | | | 2015 | | | | 2016 | | | | 2017 | | | | 2018 | |
| |
| | | (in GWh) | |
Electricity Sales | | | | | | | | | | | | | | | | | | | | |
In Québec, by segment | | | | | | | | | | | | | | | | | | | | |
Residential | | | 68,074 | | | | 66,558 | | | | 65,065 | | | | 66,111 | | | | 69,566 | |
Commercial, institutional and small industrial | | | 45,189 | | | | 45,335 | | | | 45,483 | | | | 45,816 | | | | 47,659 | |
Large industrial | | | 55,738 | | | | 54,200 | | | | 53,635 | | | | 53,699 | | | | 50,252 | |
Other | | | 5,222 | | | | 5,170 | | | | 5,062 | | | | 5,077 | | | | 5,337 | |
Total Electricity Sales | | | 174,223 | | | | 171,263 | | | | 169,245 | | | | 170,703 | | | | 172,814 | |
| | | (in millions of dollars) | |
Revenue from Electricity Sales | | | | | | | | | | | | | | | | | | | | |
In Québec, by segment | | | | | | | | | | | | | | | | | | | | |
Residential | | $ | 5,162 | | | $ | 5,222 | | | $ | 5,155 | | | $ | 5,285 | | | $ | 5,591 | |
Commercial, institutional and small industrial | | | 3,657 | | | | 3,774 | | | | 3,842 | | | | 3,873 | | | | 4,016 | |
Large industrial | | | 2,389 | | | | 2,350 | | | | 2,265 | | | | 2,288 | | | | 2,196 | |
Other | | | 308 | | | | 316 | | | | 311 | | | | 317 | | | | 331 | |
Total Revenue from Electricity Sales | | $ | 11,516 | | | $ | 11,662 | | | $ | 11,573 | | | $ | 11,763 | | | $ | 12,134 | |
| | | (as at December 31) | |
Number of Customer Accounts | | | | | | | | | | | | | | | | | | | | |
In Québec, by segment | | | | | | | | | | | | | | | | | | | | |
Residential | | | 3,857,782 | | | | 3,890,956 | | | | 3,924,992 | | | | 3,958,300 | | | | 3,994,491 | |
Commercial, institutional and small industrial | | | 317,671 | | | | 319,294 | | | | 314,816 | | | | 316,430 | | | | 317,608 | |
Large industrial | | | 183 | | | | 181 | | | | 183 | | | | 184 | | | | 185 | |
Other | | | 4,214 | | | | 4,290 | | | | 4,550 | | | | 4,582 | | | | 4,630 | |
Total Customer Accounts | | | 4,179,850 | | | | 4,214,721 | | | | 4,244,541 | | | | 4,279,496 | | | | 4,316,914 | |
- 18 -
CONSTRUCTION
The Construction segment consists of activities related to projects carried out by Hydro-Québec Innovation, équipement et services partagés and SEBJ.
Hydro-Québec Innovation, équipement et services partagés is responsible for construction and refurbishment projects throughout Québec, except in the territory governed by the JBNQA. SEBJ builds generating facilities in the territory governed by the JBNQA (north of the 49th parallel) and may also carry out certain projects elsewhere in Québec and outside the province.
As engineering, construction and environmental specialists, Hydro-Québec Innovation, équipement et services partagés and SEBJ offer Hydro-Québec Production and Hydro-Québec TransÉnergie a variety of services needed for draft-design studies, impact assessments and other undertakings in the context of energy-related projects. These services include technical and scientific surveys, planning, cost estimates and cost control, design, architecture, geomatics and quality control.
CORPORATEAND OTHER ACTIVITIES
Corporate activities consist of the Financial and Risk Management Group, the Corporate and Legal Affairs and Governance Group, the Communications and Governmental Affairs Vice Presidency, the Human Resources Vice Presidency and the Health and Safety Unit. Other activities include Information and Communication Technologies Vice Presidency, Business Development Vice Presidency, Shared Services Center Unit, Strategic Procurement Unit, Hydro-Québec Research Institute Unit, Hydro-Québec Subsidiaries Unit, CETEES and Continuous Improvement and Strategic Planning Unit.
The following are included under Corporate and Other Activities:
| ● | | Hydro-Québec CapiTech inc. (“Hydro-Québec CapiTech”) (wholly-owned; a venture capital company investing in businesses that provide energy-related high-technology products and services); |
| ● | | Hydro-Québec IndusTech inc. (“Hydro-Québec IndusTech”) (wholly-owned; the corporation’s mission is to partner with the private sector in industrializing and marketing technologies resulting from our research activities); and |
| ● | | Institut de recherche d’Hydro-Québec (“IREQ”) (our energy-technology research and development unit). |
- 19 -
CORPORATE OUTLOOK
DEVELOPMENT STRATEGY
We plan to invest approximately $3.7 billion in 2019, most of which would be allocated to the operations of Hydro-Québec TransÉnergie ($1.5 billion), Hydro-Québec Production ($1.1 billion) and Hydro-Québec Distribution ($0.8 billion). More than 60% of the total amount is expected to be earmarked for facility maintenance and improvements. The remainder is expected to go toward growth and development activities.
The 2019 borrowing program is expected to be $3.5 billion. The funds raised are intended to be used to support a large part of the investment program and to refinance maturing debt.
Hydro-Québec Production intends to continue its work on the Romaine complex jobsites in the course of developing Québec’s hydroelectric potential. Three of the four generating stations in this major project, namely Romaine-2, Romaine-1 and Romaine-3, were commissioned in 2014, 2015 and 2017, respectively, and Romaine-4 is scheduled to come on stream in 2021. At the same time, the division expects to continue investing to ensure the long-term operability of its facilities and optimize their output. For instance, refurbishment is under way at Robert-Bourassa and Beauharnois generating stations.
Hydro-Québec TransÉnergie intends to devote a large part of its investments to erecting transmission lines, in particular some 400 km of 735-kV lines that will connect Chamouchouane substation, in the Saguenay–Lac-Saint-Jean region, to the Montréal metropolitan loop, with commissioning scheduled for 2019. In addition, it expects to continue connecting the Romaine complex in the Minganie region, and building 315/25-kV Patriotes substation, in the Basses-Laurentides region. The division also plans to continue investing in upgrading and modernizing its facilities to ensure the reliability and long-term operability of its transmission assets and maintain service quality. Some examples of this include the projects to replace the grid control systems, special protection systems, and substation protections and controls, as well as the ongoing work on the architecture development plan for the 315-kV system on the island of Montréal.
Hydro-Québec Distribution intends to continue delivering reliable power and high-quality services to all Québec customers. It plans to make further investments to better meet customer needs, including connecting the Côte-Nord region communities of La Romaine and Unamen Shipu, currently served by an off-grid system. The division also plans to pursue projects to maintain and improve the quality of its facilities, such as replacing the distribution grid control system.
We continue to pursue the strategies set out in our Strategic Plan 2016-2020 with a view to enhancing our profitability. The growth avenues we are exploring involve developing our export markets, commercializing our technological innovations and building partnerships, making acquisitions or acquiring interests outside Québec.
WATER-POWER ROYALTIES
As stipulated in the Watercourses Act (Québec), Hydro-Québec Production pays the same statutory royalties as those paid by private producers of hydro-electricity in Québec. These water-power royalties, earmarked for the Government’s Generations Fund, consist of a statutory royalty for the electricity delivered during the year and a contractual royalty payable pursuant to the contract awarded for the operation of a generating station.
For 2019, these royalties, indexed annually to the Consumer Price Index, consist of:
| ● | | a statutory royalty of $3.32 ($3.25, $3.20 and $3.16, for 2018, 2017 and 2016, respectively) per thousand kilowatthours of electricity produced; and |
| ● | | a contractual royalty of $0.78 ($0.76, $0.75 and $0.74, for 2018, 2017 and 2016, respectively) per thousand kilowatthours of electricity produced. |
These royalties totaled $699 million in 2018, $695 million in 2017 and $667 million in 2016.
- 20 -
CAPITAL INVESTMENT PROGRAM
The capital investment program includes capital expenditure for fixed and intangible assets. The following table is a summary of our capital investments affecting cash for the years 2014 through 2018. Over the 2019–2023 period, we plan to invest approximately $3.9 billion in fixed and intangible assets per year, including an estimated $3.7 billion in 2019, as stated in the table below.
CAPITAL INVESTMENTS AFFECTING CASH
| | | | | | | | | | | | | | | | | | | | | | | | |
| | | | | | | |
| | | 2014 | | | 2015 | | | 2016 | | | 2017 | | | 2018 | | | Estimated
2019 | |
| | | (in millions of dollars) | |
Fixed and Intangible Assets | | | | | | | | | | | | | | | | | | | | | | | | |
Generation | | $ | 1,204 | | | $ | 957 | | | $ | 906 | | | $ | 963 | | | $ | 792 | | | $ | 1,141 | |
Transmissiona | | | 1,623 | | | | 1,587 | | | | 1,757 | | | | 1,971 | | | | 1,782 | | | | 1,542 | |
Distribution | | | 825 | | | | 756 | | | | 657 | | | | 650 | | | | 664 | | | | 838 | |
Construction | | | 11 | | | | 1 | | | | 8 | | | | 13 | | | | 10 | | | | 4 | |
Corporate and Other Activities | | | 152 | | | | 139 | | | | 132 | | | | 157 | | | | 154 | | | | 216 | |
Total Investments | | $ | 3,815 | | | $ | 3,440 | | | $ | 3,460 | | | $ | 3,754 | | | $ | 3,402 | | | $ | 3,741 | |
| a) | Including sub-transmission facilities. |
Our investments totaled $3,402 million in 2018. Most of this amount was allocated to large-scale development projects in the generation and transmission segments, as well as to major refurbishment projects to maintain and improve the quality of our assets.
In 2018, we continued working on the Romaine complex jobsites in the course of developing Québec’s hydroelectric potential. On the last jobsite—Romaine-4 (245 MW), excavation of the water intake and spillway was completed and excavation of the generating station cavern is continuing, along with construction of the switchyard. The first three of the four generating stations in this 1,550-MW project—Romaine-2 (640 MW), Romaine-1 (270 MW) and Romaine-3 (395 MW), —were brought on stream in 2014, 2015 and 2017, respectively, and the last generating station, Romaine-4 (245 MW), is scheduled to come on stream in 2021.
Work also continued on the 735-kV Chamouchouane–Bout-de-l’Île project. This project has two components: first, the construction of about 400 km of 735-kV lines between Chamouchouane substation, in the Saguenay–Lac-Saint-Jean region, and the Montréal metropolitan loop, along with the rerouting of a short segment of 735-kV line to Bout-de-l’Île substation in Montréal; and second, the construction of a new 735-kV substation, Judith-Jasmin, in Terrebonne (Lanaudière region). Nearly 90% of work on the lines is complete. The 735-kV section of Judith-Jasmin substation was commissioned in 2018, and the work is expected to be finished in 2019.
We also carried out several projects in all our business segments to ensure the long-term operability of our facilities and optimize their performance.
- 21 -
Allocation of Capital Expenditure for the Generation, Transmission and Distribution Business Segments
The following tables summarize the allocation of estimated capital expenditure for 2019 among our three major business segments:
GENERATION BUSINESS SEGMENT
| | | | | | | | | | | | |
| | | | | |
| | | Available
Power | | | Planned Date
of Operation | | | | Estimated Capital Expenditure
2019 | |
| | | (MW) | | | | | | | (in millions of dollars) | |
ASSET SUSTAINMENTAND OPTIMIZATION | | | | | | | | | | | | |
Refurbishment and refitting of generating stations | | | – | | | Continuous program | | $ | | | 625 | |
| | | | |
DEVELOPMENT PROJECTS | | | | | | | | | | | | |
Romaine complex | | | 1,550 | | | 2014–2021 | | | | | 473 | |
Other generation projects | | | – | | | – | | | | | 43 | |
| | | | | | | | | | | | 516 | |
Total | | | | | | | | $ | | | 1,141 | |
TRANSMISSION BUSINESS SEGMENTa | |
| | | | | |
| | | | | | Planned Date
of Operation | | | | Estimated Capital Expenditure
2019 | |
| | | | |
| | | | | | | | | | (in millions of dollars) | |
ASSET SUSTAINMENTAND OPTIMIZATION | | | | | | | | | | | | |
Reliability and long-term operability | | | | | | Continuous program | | $ | | | 1,104 | |
| | | | |
SYSTEM GROWTH PROJECTS | | | | | | | | | | | | |
Patriotes substation | | | | | | 2020 | | | | | 61 | |
Wind power integration – 3rd call for tenders (291 MW) | | | | | | 2013–2021 | | | | | 50 | |
Chamouchouane–Bout-de-l’Île 735-kV project | | | | | | 2017–2019 | | | | | 43 | |
Expansion of transmission system in Minganie | | | | | | 2014–2021 | | | | | 37 | |
Other | | | | | | | | | | | 247 | |
| | | | | | | | | | | | 438 | |
Total | | | | | | | | $ | | | 1,542 | |
| a) | Including sub-transmission facilities. |
| | | | | | | | | | |
DISTRIBUTION BUSINESS SEGMENTa | |
| | | | | |
| | | | | | | | | Estimated Capital Expenditure
2019 | |
| | | | | | | | | (in millions of dollars) | |
ASSET SUSTAINMENTAND OPTIMIZATION | | | | | | | | | | |
Reliability and long-term operability | | | | | | $ | | | 374 | |
| | | | |
DEVELOPMENT PROJECTS | | | | | | | | | 464 | |
Total | | | | | | $ | | | 838 | |
| a) | Including investments in distribution facilities as well as investments in generating and transmission facilities in our off-grid systems. |
Cash Requirements
The total estimated cash requirements for 2019 are approximately $9.3 billion, broken down as follows: approximately $3.7 billion for capital investments, approximately $3.2 billion for long-term debt repayment and approximately $2.4 billion for the payment of the dividend declared for 2018. Our self-financing ratio (defined as cash flows from operating activities less dividend paid, divided by the sum of cash flows from investing activities, excluding net change in short-term investments and sinking fund, and repayment of long-term debt) is expected to be 45.7% in 2019, compared to 63.9% in 2018.
- 22 -
REGULATORY FRAMEWORK
Hydro-Québec Act
Under the provisions of the Hydro-Québec Act, we are mandated to supply power and to pursue endeavors in energy-related research and promotion, energy conversion and conservation, and any field connected with or related to power or energy.
Under the Hydro-Québec Act, the Government is entitled to declare a dividend from Hydro-Québec when certain financial criteria are met (see “Note 16 to the 2018 Consolidated Financial Statements”). Our dividend policy is to distribute 75% of our net income.
Energy Board Act
The Act respecting the Régie de l’énergie (the “Energy Board Act”), enacted in 1996, grants the Energy Board exclusive authority to fix or modify our rates and conditions for the transmission and distribution of electric power in Québec. Hydro-Québec TransÉnergie and Hydro-Québec Distribution’s activities in Québec are therefore regulated. Under this legislation, rates are set by reasoned decision of three commissioners after public hearings. Moreover, the Energy Board Act stipulates that rates are determined on a basis that allows for recovery of the cost of service including a reasonable return on the rate base.
The Energy Board consists of twelve full-time members appointed by the Government and, in the exercise of its functions, is charged with reconciling the public interest, consumer protection and the fair treatment of the electric power carrier and of distributors.
Under the Energy Board Act, we have been granted exclusive rights for the distribution of electric power throughout Québec, excluding the territories served by distributors operating a municipal or private electric system as of May 13, 1997.
The Energy Board has the authority to:
| ● | | fix, or modify, after holding public hearings, our rates and conditions for the transmission and distribution of electric power; |
| ● | | approve our electric power supply plan; |
| ● | | designate a reliability coordinator for Québec and adopt the reliability standards submitted by the designated reliability coordinator; |
| ● | | authorize our transmission and distribution investment projects; |
| ● | | approve our distribution commercial programs; and |
| ● | | rule upon complaints from customers concerning application of rates or conditions of services. |
The Energy Board Act was amended in 2010 to allow a gradual increase of the cost of the Heritage Pool Electricity starting in 2014. The Energy Board Act was subsequently amended by replacing the gradual increases of the average cost of the Heritage Pool Electricity with the indexation of the average cost of the Heritage Pool Electricity.
In accordance with its authority relating to rate determination, the Energy Board is implementing performance-based regulation mechanisms for Hydro-Québec Distribution and Hydro-Québec TransÉnergie, effective from 2018 and 2019 respectively.
Effective 2017, surplus earnings realized from carrying on transmission and distribution activities in Québec are subject to an earnings sharing mechanism. Earnings in excess of the authorized rate of return are shared with customers in the following proportions:
| ● | | 50/50 sharing for the first 100 basis points above the authorized rate of return; and |
| ● | | 75% customers and 25% Hydro-Québec, beyond 100 basis points. |
Any shortfall is absorbed by us.
- 23 -
Generation
The Energy Board’s jurisdiction does not extend to generation.
Transmission
Transmission rates and service conditions are subject to approval by the Energy Board.
In December 2018, the Energy Board approved the interim transmission rates, to be effective January 1, 2019, as follows: $80.06/kW/year for firm long-term point-to-point transmission service and an amount payable for the native-load transmission service of $3,067.3 million per year. The interim revenue for rate setting purposes totaled $3,480.0 million for short- and long-term point-to-point transmission services and native-load. The Energy Board’s final decision is pending.
The Direction – Contrôle des mouvements d’énergie (System Control Unit) of Hydro-Québec TransÉnergie is Reliability Coordinator for transmission systems in Québec as designated by the Energy Board.
Distribution
Electricity required to meet Québec’s needs in excess of the Heritage Pool Electricity must be purchased through a competitive bidding process. Purchase contracts for electricity in excess of the Heritage Pool Electricity are subject to the approval of the Energy Board.
In March 2019, the Energy Board authorized an electricity rate increase, beginning April 1, 2019, of 0.9% applicable to all customers except for Rate L customers, for which the increase is 0.3%.
National Energy Board Act
Our exports of electric power are subject to the National Energy Board Act which provides that a permit or license must be obtained from the National Energy Board of Canada (the “National Board”) for such exports. We hold the following permits for short-term exports (contracts of five years or less):
| ● | | one permit expiring on December 31, 2020 authorizing us to export annually up to 30 TWh of combined firm and interruptible energy to the United States; |
| ● | | one permit granted to our subsidiary, HQEM, expiring on April 7, 2019. This permit authorizes HQEM, as a power marketer, to export annually up to 30 TWh of firm and interruptible energy and up to 6,000 MW of power from interconnections located in other provinces. |
| ● | | one permit issued on October 4, 2018 to our subsidiary, HQEM. The term of this permit will commence on April 8, 2019 and end on April 7, 2029. This permit authorizes HQEM, as a power marketer, to export annually up to 30 TWh of firm and interruptible energy and up to 6,000 MW of power over any of the international power lines located in Canada. |
Each of these permits allows us to take advantage of the spot market in the United States; however, long-term export contracts (more than five years) require prior issuance of specific permits or licenses by the National Board.
The National Board also regulates international power lines and we operate our interconnections with the United States in accordance with the terms and conditions of Certificates of Public Convenience and Necessity issued by the National Board.
Environmental Regulation
Our activities are subject to federal and provincial environmental laws and regulations, and, to some extent, municipal by-laws.
Before beginning new construction, our projects are subject to environmental impact assessment studies as well as information and consultation processes. The studies are submitted for review and approval to government departments and agencies responsible for issuing governmental authorizations. In some instances, the approval process includes public hearings by an independent body.
- 24 -
Environmental protection and conservation are among Hydro-Québec’s main priorities. In 2018, our management system, which has an environmental component, was certified to ISO 14001:2015. ISO 14001:2015 is the environmental management standard of the International Organization for Standardization. In addition, we annually review our management of environmental risks and issues and publish a Sustainability Report.
The Government adopted the Sustainable Development Act (the “Sustainable Act”) in April 2006 and the Government Sustainable Development Strategy covering the period 2015-2020 (the “Government Strategy”) in 2015. As a Government-owned corporation, we are subject to the Sustainable Act and the Government Strategy and we published our own Sustainable Development Action Plan, covering the period 2015-2020, in July 2015.
LITIGATION
Innus of Uashat mak Mani-Utenam
The Innus of Uashat mak Mani-Utenam (the “Uashaunnuat”) have filed lawsuits seeking judicial recognition of an aboriginal title and aboriginal rights as well as $1.5 billion in damages relating to an area of land in Québec where some of our hydroelectric facilities are located, part of which is within the territory subject to the JBNQA. The Uashaunnuat, who claim not to be party to the JBNQA, allege that the JBNQA and certain federal and provincial laws are illegal, inoperative, unconstitutional and not binding upon them. The Uashaunnuat also seek various orders, including rendering of accounts and revenue sharing for the alleged unlawful use and management of the lands, notably in respect of hydroelectric facilities on these lands. The file has been mostly inactive since March 2016, although no Court-ordered suspension has been rendered. The file can therefore be reactivated at any time either by the Court, or by the Uashaunnuat’s counsel.
Innus of Pessamit
The Innus of Pessamit have filed lawsuits seeking judicial recognition of an aboriginal title and aboriginal rights as well as $500 million in damages relating to an area of land in Québec where some of our hydroelectric facilities are located. They also seek compensation based on revenue sharing to be determined by the Court, for the revenues generated by our facilities located in the contested area. The proceedings are ongoing and, along with the Attorney-General of Canada and the Attorney-General of Québec, we are contesting these claims.
CF(L)Co
On February 23, 2010, CF(L)Co instituted proceedings against us seeking the modification of the pricing terms under the 1969 Power Contract (see “Generation Operations – Electricity Purchases”) by increasing the amounts payable by us to CF(L)Co. Alternatively, CF(L)Co was seeking the cancellation of the 1969 Power Contract with effect six months from the date of judgment. In July 2014, the Superior Court of Québec rendered its decision dismissing CF(L)Co’s request and confirming Hydro-Québec’s rights under the 1969 Power Contract. On appeal, in August 2016, the Québec Court of Appeal rendered its decision dismissing CF(L)Co’s request and confirming Hydro-Québec’s rights under the 1969 Power Contract. On further appeal, to the Supreme Court of Canada, on November 2, 2018, the Supreme Court dismissed CF(L)Co’s appeal, giving full force to Hydro-Québec’s interpretation of the 1969 Power Contract with regards to the pricing terms.
In July 2013, we instituted proceedings against CF(L)Co before the Superior Court of Québec to determine the interpretation of two essential rights, which are provided in the 1969 Power Contract. In August 2016, the Superior Court of Québec rendered its decision, confirming Hydro-Québec’s rights (this decision was rectified on November 8, 2016 but did not change its conclusions). In September 2016, CF(L)Co filed an appeal before the Québec Court of Appeal. The hearing took place on December 4, 2018 and the parties are now awaiting the decision of the Court of Appeal of Québec.
- 25 -
EMPLOYEES
We had 19,904 employees as at December 31, 2018 composed of 16,960 permanent employees and 2,944 temporary employees. These numbers do not include employees of our subsidiaries and joint ventures. Unionized employees represent 83% of our work force.
Eight collective agreements govern the working conditions of our unionized employees. Seven of these agreements were renewed in 2018, for five-year periods extending until 2023 or 2024. Negotiations are ongoing with our engineers regarding a new collective agreement that would extend until 2023.
- 26 -
MANAGEMENT’S DISCUSSION AND ANALYSIS
This Management’s Discussion and Analysis should be read in conjunction with our consolidated financial statements and the notes thereto. The financial information and tabular amounts presented herein are expressed in Canadian dollars, unless otherwise indicated. The consolidated financial statements take into account the decisions handed down by the Energy Board with respect to the transmission and distribution of electricity.
This analysis contains statements based on estimates and assumptions concerning future results and the course of events. Given the risks and uncertainties inherent in any forward-looking statements, our actual future results could differ from those anticipated. Finally, the information contained herein takes into account any significant event that occurred on or before the date of publication of this Annual Report.
OVERVIEW
In 2018, we posted net income of $3,192 million, a $346-million or 12% increase compared to 2017. This increase is mainly due to the recognition of a gain on the sale, during the second quarter, of a majority interest in our subsidiary TM4 to the multinational company Dana Incorporated (Dana). It is also attributable to a larger volume of electricity supplied by Hydro-Québec Production on the Québec market.
We expect to pay a dividend of $2,394 million to our shareholder, the Québec government.
Strategic partnership
In June 2018, we reached an agreement with Dana under which we sold to Dana a 55% equity interest in TM4. The gain on this transaction amounted to $277 million. The partnership created is part of a strategy aimed at seizing growth opportunities outside Québec in a number of ways, including acquisitions or equity stakes, more exports and the commercialization of innovations.
Sales in Québec
On the Québec market, electricity supplies provided by Hydro-Québec Production to Hydro-Québec Distribution increased by $153 million over the previous year. This growth is mainly due to the impact of temperatures, which were colder in 2018 than in 2017 during certain months.
Exports
In 2018, net electricity exports reached a volume of 36.1 TWh and contributed $744 million to net income. As a result of an effective sales strategy, the smooth operation of generation and transmission facilities and high runoff, net exports increased by 1.7 TWh over the previous record, set in 2017.
Investments
Our investments totaled $3,402 million in 2018. Most of this amount was allocated to large-scale development projects in the generation and transmission segments, as well as to major refurbishment projects to maintain and improve the quality of our assets.
The main projects under way include the construction and connection of the Romaine hydroelectric complex (1,550 MW) in the Côte-Nord region. Three of the four reservoir generating stations in this complex, with 1,305 MW of total installed capacity, are already in operation. On the last jobsite—Romaine-4 generating station (245 MW), scheduled to be brought on stream in 2021—excavation of the water intake and spillway was completed in 2018 and excavation of the generating station cavern is continuing, along with construction of the switchyard. Romaine-3 generating station (395 MW) was commissioned in fall 2017 and put to good use shortly thereafter, both to help meet Québec demand during peak consumption periods in winter 2017–2018 and for export purposes.
Work also continued on the 735-kV Chamouchouane–Bout-de-l’Île project, which is expected to enhance the reliability of the main transmission system, reinforce energy supply to the Montréal region and meet demand growth in the city’s north shore suburbs. The project has two components: first, deployment of 735-kV lines extending approximately 400 km between Chamouchouane substation, in the Saguenay–Lac-Saint-Jean region, and the Montréal metropolitan loop, as well as the rerouting of a short segment of 735-kV line to Bout-de-l’Île substation, in Montréal; and, second, construction of 735/120/25-kV Judith-Jasmin substation in Terrebonne, in the Lanaudière region.
- 27 -
The substation’s 735-kV section and the rerouted line segment were completed, commissioned and integrated into the metropolitan loop in 2018, and the other facilities are planned to follow in 2019.
We also carried out several projects in all our business segments to ensure the long-term operability of our facilities and optimize their performance.
Contribution to Public Finances
For a sixth consecutive year, our contribution to the Québec government’s revenue exceeded $4 billion, totaling $4.5 billion. This contribution includes our net income, water-power royalties, the public utilities tax, guarantee fees related to debt securities, and contributions to various government funds and agencies.
- 28 -
CONSOLIDATED RESULTS
Net income
We recorded net income of $3,192 million in 2018, a $346-million increase over the $2,846 million posted the previous year. This growth is mainly due to the recognition of a $277-million gain on the partial sale of our subsidiary TM4. In addition, on the Québec market, electricity supplies provided by Hydro-Québec Production to Hydro-Québec Distribution increased by $153 million compared to 2017, mainly as a result of temperature variances. Net electricity exports rose by 1.7 TWh to a historic high of 36.1 TWh, but the positive impact of this volume growth was offset by the impact of the lower average export price obtained.
Revenue
Revenue1 totaled $14,370 million, compared to $13,468 million the previous year. Revenue from ordinary activities was $14,062 million compared to $13,603 million in 2017, a $459-million increase resulting from growth of $451 million in electricity sales. In Québec, electricity sales rose by $371 million to $12,134 million, while on external markets, they reached $1,731 million, an increase of $80 million. Revenue from other activities increased by $443 million over 2017.
Three main factors explain the $371-million increase in electricity sales in Québec. First, temperatures had a positive impact of $246 million. This impact was most pronounced in January and October, when temperatures were 2°C and 3°C, respectively, below climate normals in 2018, whereas they had been more than 3°C above the normals in 2017. For these two months alone, temperatures resulted in additional sales of $232 million compared to the previous year. Second, demand grew in the residential segment and in the commercial, institutional and small industrial segment, particularly because of the strength of the economy, an increase in housing starts, and our market development initiatives aimed in part at attracting new data centers to the province. However, this growth was offset by the negative impact of an ongoing labor conflict at a large aluminum smelter in the Centre-du-Québec region, which began in January 2018 and led to a reduction in electricity sales to large industrial customers compared to the previous year. Third, the April 1, 2017 and 2018 rate adjustments resulted in a $41-million increase in revenue. Rates are determined by the Energy Board on a basis that allows for recovery of the cost of service plus a reasonable return on the rate base.
Revenue from electricity sales on markets outside Québec amounted to $1,731 million, compared to $1,651 million in 2017. This $80-million increase is due to volume growth in electricity exports by Hydro-Québec Production.
Revenue from other activities increased by $443 million. This significant growth is basically due to two factors. First, the sale to Dana of a 55% interest in TM4 as part of a strategic partnership generated a $277-million gain. Second, there was a $192-million change, compared to 2017, in the net amounts recognized as earnings variances as well as variances between the actual revenue and costs for certain items and the forecasts in the rate filings, particularly on account of the amortization of variances from previous years. The impact of this factor was partially offset by an increase in the regulatory liability recognized under the earnings-sharing mechanism, which amounted to $120 million in 2018, compared to $45 million in 2017. Under the earnings-sharing mechanism, which was implemented in 2017, Hydro-Québec TransÉnergie and Hydro-Québec Distribution share with customers any surplus over and above their respective rates of return authorized by the Energy Board. The overall amount recognized for 2018 is expected to reduce the April 1, 2020 rate adjustment, while the amount recognized for 2017 will reduce the April 1, 2019 rate adjustment.
Expenditure
Total expenditure was $8,466 million in 2018, compared to $8,109 million in 2017.
Operational expenditure totaled $2,843 million, a $179-million increase compared to the $2,664 million recorded in 2017. This increase is partly the result of the impact of inflation and salary indexing as well as growth in activities, due in particular to the commissioning of Romaine-3 generating station in September 2017, development of the transmission system, and the larger number of customer accounts. Moreover, our objective to maintain service quality and reliability for all customers led us to step up our maintenance activities in 2018, especially in the transmission segment. Finally, weather events were more frequent and more intense than in the previous year, leading to a greater number of power outages.
| 1 | Following the adoption of a new accounting standard, Revenue now includes revenue from ordinary activities, almost entirely composed of electricity sales, as well as revenue from other activities. The prior year’s data have been reclassified to conform to the presentation adopted in the current year. |
- 29 -
In the line item Other components of employee future benefit cost, created following the 2017 adoption of an amendment to an accounting standard, a credit amount of $340 million was recognized in 2018, which is comparable to the $322 million recognized in 2017.
Electricity and fuel purchases totaled $2,167 million, a $162-million increase compared to $2,005 million in 2017. This change is mainly due to a $145-million increase in Hydro-Québec Distribution’s electricity purchases from third parties. The division’s wind energy supplies increased by 1.4 TWh or $115 million, particularly as a result of the commissioning of two new wind farms during the first quarter of 2018.
Depreciation and amortization expense amounted to $2,685 million, comparable to the $2,686 million recorded in 2017. The $73-million increase in depreciation of property, plant and equipment resulting from the commissioning of Romaine-3 generating station in fall 2017, among other things, was partially offset by a $54-million decrease in amortization of intangible assets, due primarily to the fact that the amortization of Hydro-Québec Distribution’s customer information system ended at the beginning of 2018.
Taxes were $1,111 million, compared to $1,076 million in 2017, essentially as a result of a $17-million increase in the company’s financial contribution to Transition énergétique Québec for energy efficiency programs and initiatives, as well as a $14-million rise in the public utilities tax due to an increase in the tax base, itself attributable to growth in the net value of taxable assets. Water-power royalties reached $705 million, comparable to the $701 million recorded in 2017.
Financial expenses totaled $2,712 million in 2018, a $199-million increase compared to $2,513 million in 2017. This change is due to four main factors: the impact of the 2017 and 2018 borrowing programs; higher interest rates; a $34-million decrease in capitalized financial expenses, essentially related to the commissioning of Romaine-3 generating station in September 2017; and the partial redemption, in the fourth quarter, of a debt maturing in 2020 and bearing interest at a rate of 11%. This redemption mitigated the credit risk associated with short-term investments while also reducing future refinancing requirements.
| | | | | | | | |
| | | 2018 | | | 2017 | |
OPERATIONS AND DIVIDEND ($M) | | | | | | | | |
Revenue | | | 14,370 | | | | 13,468 | |
Income before financial expenses | | | 5,904 | | | | 5,359 | |
Net income | | | 3,192 | | | | 2,846 | |
Dividend | | | 2,394 | | | | 2,135 | |
BALANCE SHEETS ($M) | | | | | | | | |
Total assets | | | 76,989 | | | | 75,769 | |
Property, plant and equipment | | | 64,966 | | | | 63,990 | |
Long-term debt, including current portion and perpetual debt | | | 46,335 | | | | 45,259 | |
Equity | | | 21,209 | | | | 19,755 | |
FINANCIAL RATIOS | | | | | | | | |
Return on equity (%)a | | | 14.0 | | | | 12.9 | |
Capitalization (%)b | | | 31.8 | | | | 30.7 | |
Profit margin (%)c | | | 22.2 | | | | 21.1 | |
Interest coveraged | | | 2.18 | | | | 2.13 | |
Self-financing (%)e | | | 63.9 | | | | 66.6 | |
| a) | Net income divided by average equity for the year less average accumulated other comprehensive income for the year. |
| b) | Equity divided by the sum of equity, long-term debt, current portion of long-term debt, perpetual debt, borrowings and derivative instrument liabilities, less derivative instrument assets and sinking fund. |
| c) | Net income divided by revenue. |
| d) | Sum of income before financial expenses and net investment income divided by interest on debt securities. |
| e) | Cash flows from operating activities less dividend paid, divided by the sum of cash flows from investing activities, excluding net change in short-term investments and sinking fund, and repayment of long-term debt. |
- 30 -
CASHAND CAPITAL MANAGEMENT
Operating activities
Cash flows from operating activities totaled $5.3 billion in 2018, compared to $5.6 billion in 2017. These funds were used to pay the dividend for 2017 and to finance a large portion of the investment program, among other things.
Investing activities
In 2018, we invested $3.4 billion in property, plant and equipment and intangible assets, compared to $3.8 billion in 2017. Of the total, $1.3 billion was allocated to development projects and $2.1 billion to maintaining or improving the quality of assets.
Hydro-Québec Production’s investments totaled $792 million, of which $386 million went to development activities, mainly the ongoing construction of the Romaine hydroelectric complex, and $406 million to asset maintenance and improvement, such as refurbishment work at Robert-Bourassa and Beauharnois generating stations.
Capital spending at Hydro-Québec TransÉnergie totaled $1,782 million. Of this amount, $614 million was used to connect new generating facilities to the grid and increase transmission capacity. Examples of this include the ongoing 735-kV Chamouchouane–Bout-de-l’Île project, which alone accounted for $368 million in 2018, as well as the connection of the Romaine complex, which accounted for $32 million. Another $1,168 million was allocated to transmission asset sustainment and reliability projects, especially equipment replacement and facility modernization. In this connection, the division invested $83 million in ongoing work on the architecture development plan for the 315-kV system on the island of Montréal.
Hydro-Québec Distribution invested $664 million, mainly to handle its growing customer base and ensure the long-term operability of the distribution system.
The engineering, construction and refurbishment projects of Hydro-Québec Production and Hydro-Québec TransÉnergie are executed by Hydro-Québec Innovation, équipement et services partagés and SEBJ.
Financing activities
In 2018, we made three bond issues maturing in 2055 on the Canadian capital market, at an average cost of 3.06%.
These issues raised a total of $1.8 billion. The proceeds were used to support part of our investment program and to refinance maturing debt.
SOURCESOFFINANCING
| | | | | | |
Type of financing | | Amount authorized by the Board of Directors | | Market | | Outstanding as at December 31, 2018 |
Operating credit lines | | C$ or US$1,000 milliona | | | | – |
Credit facilityb | | US$2,000 millionc | | | | – |
Commercial paperb | | US$3,500 million or equivalent in C$ | | United States or Canada | | C$8 million |
Medium-term notesb | | US$3,000 million or equivalent in other currencies C$20,000 million or equivalent in US$ | | United States Canada | | US$340 milliond C$13,078 milliond |
| a) | Of this amount, available balances of US$200 million and $276 million in Canadian or U.S. dollars are covered by operating credit line agreements with the financial institutions concerned. |
| b) | Guaranteed by the Québec government. |
| c) | Includes a US$750-million swing loan. |
| d) | Corresponds to net proceeds from the issuance of medium-term notes. |
- 31 -
Dividend and capitalization
The dividend payable to the Québec government for 2018 is $2,394 million. Once this dividend is factored in, the capitalization rate was 31.8% as at December 31, 2018.
Under the Hydro-Québec Act, the dividend cannot exceed 75% of net income. Moreover, the Québec government may not declare, in respect of a given year, a dividend in an amount that would have the effect of reducing the capitalization rate to less than 25% at the end of the year.
SEGMENTED RESULTS
Operating Segments
As in 2017, we had four operating segments in 2018, namely Generation, Transmission, Distribution and Construction, as well as activities grouped under Corporate and Other Activities.
Generation: Hydro-Québec Production operates and develops our generating facilities. It generates electricity for the Québec market and exports power to wholesale markets in northeastern North America.
Transmission: Hydro-Québec TransÉnergie operates and develops our power transmission system. It markets system capacity and manages power flows throughout Québec.
Distribution: Hydro-Québec Distribution operates and develops our distribution system and ensures the supply of electricity to the Québec market. It also carries on activities related to electricity sales in Québec, provides customer services and promotes energy efficiency.
Construction: Hydro-Québec Innovation, équipement et services partagés and SEBJ design, build and refurbish generating and transmission facilities, mainly for Hydro-Québec Production and Hydro-Québec TransÉnergie.
The following tables present information on segment results and assets:
| | | | | | | | | | | | | | | | | | | | | | | | |
| | | | | | | | | | | | | | | | | | 2018 | |
| Segmented financial information ($M) | | Generation | | | Transmission | | | Distribution | | | Construction | | | Corporate
and Other
Activities | | | Hydro-Québec | |
Revenuea | | | 6,704 | | | | 3,517 | | | | 12,209 | | | | 2,141 | | | | 2,159 | | | | 14,370 | |
Net income | | | 1,998 | | | | 554 | | | | 362 | | | | – | | | | 278 | | | | 3,192 | |
Total assets | | | 32,994 | | | | 23,288 | | | | 13,976 | | | | 44 | | | | 6,847 | | | | 76,989 | b |
| | | | | | | |
| | | | | | | | | | | | | | | | | | | | | | | | |
| | | | | | | | | | | | | | | | | 2017 | |
| Segmented financial information ($M) | | Generation | | | Transmission | | | Distribution | | | Construction | | | Corporate
and Other
Activities | | | Hydro-Québec | |
Revenuea | | | 6,516 | | | | 3,307 | | | | 11,701 | | | | 2,480 | | | | 1,752 | | | | 13,468 | |
Net income | | | 1,948 | | | | 554 | | | | 333 | | | | – | | | | 11 | | | | 2,846 | |
Total assets | | | 32,944 | | | | 22,494 | | | | 13,677 | | | | 39 | | | | 6,768 | | | | 75,769 | b |
| a) | Segment data include revenue from both external and intersegment customers as presented in Note 20 to the consolidated financial statements, whereas Hydro-Québec’s revenue figure reflects the intersegment eliminations and adjustments presented in that same note. |
| b) | This figure reflects the intersegment eliminations and adjustments presented in Note 20 to the consolidated financial statements. |
| Note: | Some of the prior year’s data have been reclassified to conform to the presentation adopted in the current year. |
Generation
Under the Energy Board Act, Hydro-Québec Production is required to provide Hydro-Québec Distribution with a base volume of up to 165 TWh of heritage pool electricity annually and may also compete for contracts under Hydro-Québec Distribution’s open tendering process. It sells electricity on wholesale markets as well.
The division’s generating fleet includes 63 power plants, 28 large reservoirs with a combined storage capacity of 176.5 TWh, 681 dams and 98 control structures.
- 32 -
Operating Results
Hydro-Québec Production posted net income of $1,998 million in 2018, a $50-million increase compared to the previous year. Net electricity exports earned $1,575 million, the same amount as in 2017 and one of the division’s best-ever performances in this regard. In terms of volume, net exports reached a historic level in 2018. As a result of an effective sales strategy, careful management of generating and transmission facilities, and high runoff, they totaled 36.1 TWh, a 1.7-TWh increase over the previous record, set in 2017. Net electricity sales to Hydro-Québec Distribution amounted to $5,010 million, a $153-million increase mainly due to temperature variances. Depreciation and amortization and financial expenses increased by $14 million and $77 million, respectively.
Electricity sales in Québec
Sales to Hydro-Québec Distribution
The volume of electricity sales to Hydro-Québec Distribution was 161.9 TWh in 2018, compared to 159.2 TWh in 2017. Revenue from these sales rose by $153 million from the $4,857 million posted in 2017, partly on account of a greater supply volume, which in turn resulted in particular from temperature variances, mainly in January and October. The increase is also attributable to indexing of the heritage pool price in accordance with the Energy Board Act.
Net electricity exports
Net electricity exports generated $1,575 million in 2018, the same amount as in 2017. Their volume reached a historic high of 36.1 TWh, a 1.7-TWh increase over the previous year. The impact of this volume increase was offset, however, by the effect of the lower average export price obtained.
Depreciation and amortization
Depreciation and amortization expense stood at $819 million in 2018, a $14-million increase compared to $805 million the previous year, mainly due to the commissioning of the two units at Romaine-3 generating station in September 2017.
Financial expenses
Financial expenses totaled $1,250 million in 2018, compared to $1,173 million in 2017. This change is partly the result of a reduction in capitalized financial expenses, mainly due to the commissioning of the two units at Romaine-3 generating station.
Investing Activities
Investments in property, plant and equipment and intangible assets totaled $792 million in 2018. Of this amount, $386 million went toward development activities, mainly the continued construction of the Romaine hydroelectric complex.
Hydro-Québec Production also invested $406 million in asset sustainment and optimization. Ongoing work included refurbishment at Robert-Bourassa and Beauharnois generating stations.
Transmission
Hydro-Québec TransÉnergie operates and develops our power transmission system, one of the most extensive in North America. It markets system capacity and manages power flows throughout Québec, offering non-discriminatory access to its system to all market participants in compliance with applicable regulatory requirements.
The division’s operations are regulated by the Energy Board.
Rate Cases
For 2018, the revenue authorized by the Energy Board for transmission rate-setting purposes totaled $3,341 million, namely $2,940 million for native-load transmission and $401 million for short- and long-term point-to-point transmission services. These amounts represent increases of $81 million and $12 million, respectively, compared to 2017.
- 33 -
For 2019, Hydro-Québec TransÉnergie filed an application with the Energy Board requesting revenue of $3,486.5 million, namely $3,073.1 million for native-load transmission and $413.4 million for short-and long-term point-to-point transmission services. The Energy Board’s final decision is expected to be issued in the first quarter of 2019 (see Energy Board decision in “Regulatory Framework – Transmission”).
Operating Results
Hydro-Québec TransÉnergie’s net income amounted to $554 million in 2018, the same as in 2017. The $81-million increase in revenue from native-load transmission service was offset by a $90-million increase in financial expenses.
Since 2017, transmission rates have been subject to an earnings-sharing mechanism approved by the Energy Board, under which we share with customers any surplus during the year over and above the division’s authorized rate of return. In 2018, Hydro-Québec TransÉnergie recognized a regulatory liability of $14 million in this connection, compared to $27 million the previous year.
Investing Activities
In 2018, Hydro-Québec TransÉnergie invested $1,782 million in property, plant and equipment and intangible assets, namely $614 million for growth projects and $1,168 million for asset sustainment and reliability projects. The purpose of growth projects is to connect new generating facilities to the grid and to increase transmission capacity in response to higher load demand or new customer requests. Asset sustainment and reliability projects involve keeping facilities in good operating condition, maintaining and improving service quality and complying with the legal and regulatory requirements for operating a power transmission system.
In the growth category, Hydro-Québec TransÉnergie invested $368 million in 2018 in continuing the Chamouchouane–Bout-de-l’Île project: $278 million for the deployment of 735-kV lines extending approximately 400 km between Chamouchouane substation, in the Saguenay–Lac-Saint-Jean region, and the Montréal metropolitan loop, as well as the rerouting of a short segment of 735-kV line to Bout-de-l’Île substation, in Montréal, and $90 million for the construction of 735/120/25-kV Judith-Jasmin substation in the Lanaudière region (these amounts also include the project component related to transmission system sustainment and reliability). The division allocated a further $32 million to ongoing work, especially construction of Romaine-4 substation, to connect the Romaine complex as part of the expansion of the transmission system in the Minganie region. Finally, it continued to integrate the output from wind farms built in response to the calls for tenders issued by Hydro-Québec Distribution, for a total investment of $167 million.
In the asset sustainment and reliability category, Hydro-Québec TransÉnergie invested $83 million (including the growth component) in various activities involved in the architecture development plan for the 315-kV system on the island of Montréal. It also allocated $35 million to the installation of 735-kV and 315-kV shunt reactors in the Laurentides, Chaudière-Appalaches and Côte-Nord regions, as well as $33 million to reinforce the Sherbrooke regional system (including the growth component).
Distribution
Hydro-Québec Distribution provides electricity to the Québec market and delivers reliable power and quality services to its customers with a view to efficiency and sustainable development. In this context, it also promotes energy efficiency among its customers.
The division’s activities are regulated by the Energy Board, which has exclusive jurisdiction to set electricity rates. These rates are established in such a way as to permit service cost recovery and a reasonable return on the rate base. Since January 1, 2018, rates have been subject to performance-based regulation (PBR), which is planned to apply for an initial period of four years. Under PBR, rates for the 2018–2019 rate year were set using the cost of service method, whereas the rates for the three following years are expected to be determined using a parametric formula. PBR applies in addition to the earnings-sharing mechanism implemented in 2017.
Rate Cases
In March 2018, the Energy Board authorized an average increase of 0.3% in all our electricity rates except the large-power industrial rate (Rate L), which remained unchanged. In accordance with the Energy Board Act, the indexing of the price of heritage pool electricity does not apply to Rate L customers. The new rates went into effect on April 1, 2018.
- 34 -
In July, Hydro-Québec Distribution filed an application with the Energy Board for a 0.8% rate adjustment for all customers except those at Rate L, for which the requested adjustment is 0.2%. The new rates will take effect on April 1, 2019. The main reasons for the 0.8% adjustment are the higher cost of electricity purchases; the impact of investments in the high-voltage transmission system and Hydro-Québec TransÉnergie’s maintenance activities, which should ensure secure, reliable service; and the increase in certain distribution costs. Other factors, such as electricity sales growth resulting partly from the market development strategy, the impact of the temperature variances in the winters of 2016–2017 and 2017–2018, and the sharing of 2017 earnings with customers, limited the requested increase.
The cumulative average rate adjustment index for 1998 to 2018 is 131.3, while the Consumer Price Index for the same period is 146.1.
The Energy Board’s ruling on the rate application was issued in March 2019 (see Energy Board decision in “Regulatory Framework – Distribution”).
Supplying the Québec Market
Hydro-Québec Distribution depends on various sources to supply the Québec market, mainly the heritage pool of 165 TWh, which it purchases from Hydro-Québec Production. It also issues short- and long-term calls for tenders.
For requirements of less than three months, the division may also buy electricity directly on the market, without tendering, under an authorization granted by the Energy Board. For unforeseen needs that cannot be met otherwise, it relies on a framework agreement with Hydro-Québec Production that covers the period from January 1, 2017, to December 31, 2019. The Energy Board approved this agreement in September 2016.
In November 2018, Hydro-Québec Distribution filed a second progress report on the Electricity Supply Plan 2017–2026 with the Energy Board. This follow-up provided an updated demand forecast for the Québec market and outlined the events that have influenced supply planning and the division’s actions since the first progress report was filed in October 2017.
Finally, Hydro-Québec Distribution is continuing its efforts to promote energy efficiency. Among other things, it has developed an integrated offer based on an educational approach that encourages customers to make lasting changes in their habits.
Operating Results
Hydro-Québec Distribution posted net income of $362 million in 2018, or $29 million more than the $333 million recorded in 2017. Revenue from electricity sales increased by $371 million on account of three main factors: the impact of temperatures, especially in January and October, when they were significantly colder than in 2017; higher baseload demand in the residential segment and the commercial, institutional and small industrial segment; and the rate adjustments of April 1, 2017 and 2018. In addition, the change in net amounts recognized as earnings variances as well as variances between the actual revenue and costs for certain items and the forecasts in the rate filings had a positive impact of $81 million on revenue from other activities. Electricity purchases, the related transmission costs and fuel purchases were $414 million higher because of an increase in supplies purchased from Hydro-Québec Production and from third parties, as well as a rise in transmission costs incurred with Hydro-Québec TransÉnergie. Depreciation and amortization expense decreased by $55 million, whereas financial expenses increased by $30 million.
- 35 -
ELECTRICITYSALESIN QUÉBECBYSEGMENT
| | | | | | | | | | | | | | | | | | | | | | | | |
| | | | | | Sales volume | | | | | | Sales revenue | |
| | | 2018 | | | 2018-2017 change | | | 2018 | | | 2018-2017 change | |
| Market segment | | TWh | | | TWh | | | % | | | $M | | | $M | | | % | |
Residential | | | 69.5 | | | | 3.4 | | | | 5.1 | | | | 5,591 | | | | 306 | | | | 5.8 | |
Commercial, institutional and small industrial | | | 47.7 | | | | 1.9 | | | | 4.1 | | | | 4,016 | | | | 143 | | | | 3.7 | |
Large industrial | | | 50.3 | | | | (3.4 | ) | | | (6.3 | ) | | | 2,196 | | | | (92 | ) | | | (4.0 | ) |
Other | | | 5.3 | | | | 0.2 | | | | 3.9 | | | | 331 | | | | 14 | | | | 4.4 | |
Total | | | 172.8 | | | | 2.1 | | | | 1.2 | | | | 12,134 | | | | 371 | | | | 3.2 | |
FACTORSINTHE 2018–2017CHANGEINSALESBYSEGMENT
| | | | | | | | | | | | | | | | | | | | | | | | | | | | | | | | | | | | |
| | | Volume effects | | | Price effects | | | Total | |
| | | Baseload demand | | | Temperatures | | | Total | | | Rate adjustments | | | Other | | | Total | | | | |
| Market segment | | TWh | | | $M | | | TWh | | | $M | | | $M | | | $M | | | $M | | | $M | | | $M | |
Residential | | | 0.8 | | | | 73 | | | | 2.6 | | | | 205 | | | | 278 | | | | 22 | | | | 6 | | | | 28 | | | | 306 | |
Commercial, institutional and small industrial | | | 1.3 | | | | 90 | | | | 0.6 | | | | 37 | | | | 127 | | | | 16 | | | | – | | | | 16 | | | | 143 | |
Large industrial | | | (3.4 | ) | | | (160 | ) | | | – | | | | – | | | | (160 | ) | | | 1 | | | | 67 | | | | 68 | | | | (92) | |
Other | | | 0.1 | | | | 6 | | | | 0.1 | | | | 4 | | | | 10 | | | | 2 | | | | 2 | | | | 4 | | | | 14 | |
Total | | | (1.2 | ) | | | 9 | | | | 3.3 | | | | 246 | | | | 255 | | | | 41 | | | | 75 | | | | 116 | | | | 371 | |
Electricity sales in Québec
Electricity sales revenue reached $12,134 million, a $371-million increase over 2017 mainly due to temperature variances, higher baseload demand in the residential segment and the commercial, institutional and small industrial segment, as well as the rate adjustments of April 1, 2017 and 2018.
Sales volume totaled 172.8 TWh compared to 170.7 TWh in 2017, an increase of 2.1 TWh. First, temperature variances led to a 3.3-TWh or $246-million increase in electricity sales. These variances were most pronounced in January and October, when temperatures were 2°C and 3°C, respectively, below climate normals in 2018, whereas they had been more than 3°C above the normals in 2017. For these two months alone, temperatures resulted in additional sales of $232 million compared to the previous year. Second, baseload demand grew in the residential segment and in the commercial, institutional and small industrial segment because of the strength of the Québec economy, an increase in housing starts and our market development initiatives. However, growth in these segments’ baseload demand was offset by a shortfall resulting from a labor conflict at a large aluminum smelter in the Centre-du-Québec region. The combined effect of these factors led to a 1.2-TWh decrease in baseload demand compared to 2017.
Revenue from other activities
With regard to revenue from other activities, the change compared to 2017 in net amounts recognized as earnings variances as well as variances between the actual revenue and costs for certain items and the forecasts in the rate filings was $81 million, particularly because of the amortization of variances from previous years. The impact of this factor was partially offset by an increase in the regulatory liability recognized under the earnings-sharing mechanism, which amounted to $106 million in 2018, compared to $18 million in 2017. Under the earnings-sharing mechanism, which was approved by the Energy Board and implemented in 2017, we are required to share with customers any surplus over and above the division’s authorized rate of return.
Electricity purchases, transmission costs and fuel purchases
Electricity purchases, the related transmission costs and fuel purchases increased by $414 million compared to 2017. First, supplies purchased from Hydro-Québec Production increased by $153 million under the combined effect of temperatures and the indexing of the heritage pool price in accordance with the Energy Board Act. In addition, supplies from third parties rose by $145 million on account of a $115-million, or 1.4-TWh, increase in wind power purchases, mainly due to the commissioning of two new wind farms at the beginning of 2018. Finally, costs incurred for native-load transmission provided by Hydro-Québec TransÉnergie increased by $81 million.
- 36 -
Depreciation and amortization
Depreciation and amortization expense totaled $697 million, compared to $752 million the previous year. This $55-million decrease is mainly due to the fact that amortization of the customer information system ended at the beginning of 2018.
Investing Activities
In 2018, Hydro-Québec Distribution’s investments in property, plant and equipment and intangible assets totaled $664 million.
Of this amount, $304 million was allocated to handling growth in the Québec customer base, including $219 million for customer connections. The division also invested $295 million in asset sustainment.
Construction
The Construction segment consists of activities related to projects carried out by Hydro-Québec Innovation, équipement et services partagés1 and by SEBJ.
Hydro-Québec Innovation, équipement et services partagés is responsible for construction and refurbishment projects throughout Québec, except in the territory governed by the JBNQA. SEBJ builds generating facilities in the territory governed by the JBNQA (north of the 49th parallel) and may also carry out certain projects elsewhere in Québec and outside the province.
As engineering, construction and environmental specialists, Hydro-Québec Innovation, équipement et services partagés and SEBJ offer Hydro-Québec Production and Hydro-Québec TransÉnergie a variety of services needed for draft-design studies, impact assessments and other undertakings in the context of energy-related projects. These services include technical and scientific surveys, planning, cost estimates and cost control, design, architecture, geomatics and quality control.
Volume of Activity
Hydro-Québec Innovation, équipement et services partagés and SEBJ carried out projects worth a total of $2,141 million in 2018, compared to $2,480 million the previous year. The high volume is attributable to several large-scale projects. Work done for Hydro-Québec Production totaled $653 million, compared to $744 million in 2017, while work done for Hydro-Québec TransÉnergie totaled $1,404 million, compared to $1,671 million.
Main projects
In the area of power generation, Hydro-Québec Innovation, équipement et services partagés continued construction of the Romaine hydroelectric complex, as well as refurbishment of units at Beauharnois generating station and upgrading of station services at Carillon generating station. The division also completed refurbishment of a fourth unit at Robert-Bourassa generating station. For Hydro-Québec TransÉnergie, ongoing mandates included the 735-kV Chamouchouane–Bout-de-l’Île project, where the 735-kV section of Judith-Jasmin substation was completed, the substation integrated into the Montréal metropolitan loop, and a short segment of 735-kV line rerouted to Bout-de-l’Île substation. Connection of the Romaine complex also advanced, particularly the construction of Romaine-4 substation. At the same time, the division worked on upgrading various facilities in the main transmission system while pursuing other projects to increase transmission capacity.
Corporate and Other Activities
The Corporate and Other Activities heading includes all corporate activities, as well as the Vice-présidence – Technologies de l’information et des communications, Vice-présidence – Développement des affaires, Direction principale – Centre de services partagés, Direction principale – Approvisionnement stratégique, Direction principale – Institut de recherche d’Hydro-Québec, Direction principale – Filiales d’Hydro-Québec, Center of Excellence in Transportation Electrification and Energy Storage, and Direction principale – Amélioration continue et planification stratégique d’entreprise.
| 1 | The activities of the Direction principale – Centre de services partagés, Direction principale – Approvisionnement stratégique and Direction principale – Institut de recherche d’Hydro-Québec, as well as of the Center of Excellence in Transportation Electrification and Energy Storage, are included under Corporate and Other Activities. |
- 37 -
Results
Corporate and Other Activities recorded net income of $278 million in 2018, an increase of $267 million compared to the $11 million recorded in 2017, due to the partial sale of our subsidiary TM4, which generated a gain of $277 million.
Corporate activities
Corporate activities consist of the Groupe – Direction financière et du risque, Groupe – Affaires corporatives et juridiques et gouvernance, Vice-présidence – Communications et affaires gouvernementales, Vice-présidence – Ressources humaines, and Direction – Santé et sécurité.
The Groupe – Direction financière et du risque is responsible for all our financial functions, specifically including accounting, control, treasury, budget planning, financing and relations with our bondholders and rating agencies, taxation, risk management, preparation of financial statements and reports, as well as pension plan and pension fund management. As at December 31, 2017, the date of the most recent actuarial valuation, the pension plan showed a funding surplus of $6.6 billion, which means that the assets held on that date were sufficient to cover future pension costs as well as the stabilization provision established under the requirements of the Supplemental Pension Plans Act. The pension plan’s funding ratio was 135.7% at that time.
The Groupe – Affaires corporatives et juridiques et gouvernance provides administrative support to our Board of Directors and the boards of our subsidiaries, as well as legal services, advice and opinions to the entire company. It negotiates, drafts and reviews the contracts and agreements required in the course of our operations and protects our interests in business matters and disputes, including court cases and matters involving regulators such as the Energy Board. It also develops strategies and guidelines and provides advisory services in the areas of corporate affairs, governance and ethics, access to information, the environment and sustainable development, as well as document management.
The Vice-présidence – Communications et affaires gouvernementales develops strategies and provides support and advisory services in the areas of communications and public affairs, as well as relations with governments, communities and partner organizations. It is also tasked with monitoring our corporate image and reputation.
The Vice-présidence – Ressources humaines develops strategies, guidelines, frameworks, corporate programs and objectives in matters pertaining to human resources management, labor relations, compensation and employee benefits, organizational performance, as well as training and skills development. It also makes sure that Management can count on optimum conditions regarding human resources. Moreover, it is responsible for all measures to ensure the protection of personnel and third parties as well as the security of our facilities and assets, including information and communication technologies.
The Direction – Santé et sécurité1 is in charge of occupational health and safety, one of our top priorities. Its mission is to foster a culture of prevention predicated on managers taking a proactive approach, showing strong leadership and engaging daily with health and safety risks and issues, as well as adherence to common values at all levels of the workforce. To do so, it develops strategies and provides advisory services pertaining to the prevention of accidents and illness, and promotes best practices in health and safety.
Vice-présidence – Technologies de l’information et des communications
The Vice-présidence – Technologies de l’information et des communications1 designs, builds, deploys, operates and evolves our information and telecommunications networks, systems, applications and infrastructure. As part of its mandate, it implements an integrated vision with respect to governance, architecture, development and operations, with particular attention to cybersecurity. It also develops leading-edge technology solutions designed to increase our productivity and facilitate our digital transformation, including increased automation of the grid and our processes, big data analysis, mobility and cloud computing.
This unit’s volume of activity totaled $706 million in 2018, compared to $645 million in 2017.
| 1 | This structural unit reports to Hydro-Québec’s Chief Operating Officer. |
- 38 -
Investing activities
In 2018, the investments of the Vice-présidence – Technologies de l’information et des communications totaled $105 million and were allocated to maintaining asset quality.
Vice-présidence – Développement des affaires
The mandate of the Vice-présidence – Développement des affaires is to prospect for business opportunities and act on them so that we can not only increase our operating revenue and income from markets outside Québec, but also play a leading role in the global energy transition. In concrete terms, the unit is constantly on the lookout for potential international investments in the form of acquisitions, equity stakes or long-term partnerships that are expected to leverage our expertise in hydroelectric generation and power transmission. In addition, it is actively involved in developing our export markets by highlighting the benefits of Québec hydropower, and it supports our initiatives in transportation electrification, for example by piloting the expansion of the Electric Circuit in Québec and neighboring markets.
Direction principale – Centre de services partagés and Direction principale – Approvisionnement stratégique
The Direction principale – Centre de services partagés1 offers services pertaining to real estate management and materials management, as well as transportation and other specialized services, in order to contribute to our performance. The Direction principale – Approvisionnement stratégique1 provides procurement guidelines, products and services to the entire company, in line with best practices.
These two units’ combined volume of activity amounted to $514 million in 2018, compared to $480 million in 2017.
Direction principale – Institut de recherche d’Hydro-Québec
The Direction principale – Institut de recherche d’Hydro-Québec (IREQ)1 develops and adapts leading-edge technology solutions according to our business requirements and objectives. It provides technical assistance to our divisions and also carries out innovation projects to support their operations and ensure our long-term development.
Direction principale – Filiales d’Hydro-Québec
The primary mandate of the Direction principale – Filiales d’Hydro-Québec2 set up in 2018, is to guide research and development work on battery materials and energy storage systems in collaboration with the Center of Excellence in Transportation Electrification and Energy Storage. It also markets the technologies developed by the Center of Excellence.
Center of Excellence in Transportation Electrification and Energy Storage
The Center of Excellence in Transportation Electrification and Energy Storage (CETEES)1 conducts research and development on battery materials.
Direction principale – Amélioration continue et planification stratégique d’entreprise
The Direction principale – Amélioration continue et planification stratégique d’entreprise2 is tasked with fostering a customer-focused culture. To this end, it develops motivating strategies for enhancing process efficiency and service quality, while progressively deploying a company-wide management system that is expected to help managers and employees address shortcomings, identify problems and implement solutions for reaching and sustaining ambitious levels of customer service and operational efficiency. It also coordinates the preparation and updating of the Strategic Plan and all related work.
| 1 | This structural unit reports to the President of Hydro-Québec Innovation, équipement et services partagés. |
| 2 | This structural unit reports to Hydro-Québec’s Chief Operating Officer. |
- 39 -
INTEGRATED BUSINESS RISK MANAGEMENT
We apply an integrated business risk management process as part of its ongoing activities. This process is supported by various control, communication and assessment mechanisms that enable it to ensure dynamic monitoring of risk developments.
Our structural units, namely our divisions and corporate units, are central to the process. As part of their ongoing activities, they manage the risks to which they are exposed and reassess them on a regular basis, daily in some cases. In concrete terms, each structural unit must identify and assess its main risks and then develop and apply mitigation measures to ensure that residual risks are at a level acceptable to us. Our structural units report monthly on their risk management and monitoring activities to the Management Committee, which then acts as a risk management committee to provide overall monitoring of business risks. This approach makes it possible to create a consolidated portfolio of residual business risks during the annual planning process. The consolidated portfolio is presented to our Board of Directors with the Business Plan, which includes a sensitivity analysis indicating the impact of certain risks on projected net income.
Financial risks
In the course of our operations, we carry out transactions that expose us to certain financial risks, such as market, liquidity and credit risk. Systematic monitoring and the adoption of strategies that include the use of derivative instruments considerably reduce exposure to such risks and their impact on our results.
To manage market and credit risk, a team of specialists that is independent of the units carrying out the transactions constantly monitors a number of indicators related to financial and energy transactions, recommends strategies and applies controls aimed at reducing risk.
Market risk
Our results are subject to three main types of market risk: currency risk, interest rate risk and risk associated with energy and aluminum prices. Fluctuations in the Canadian dollar’s exchange rate relative to the U.S. dollar affect revenue from sales denominated in U.S. dollars, as well as the cost of U.S. dollar–denominated debt. Interest rate fluctuations affect financial expenses and pension costs. Finally, energy price fluctuations affect revenue from wholesale markets, while aluminum price fluctuations have an impact on revenue from special contracts with certain large industrial customers in Québec.
The three types of market risk are the subject of active integrated management based mainly on the use of derivative financial instruments. The purpose of such management is to limit the impact of market risk on our results, according to strategies and criteria established based on our risk tolerance. In addition, market risk over the medium and long term is mitigated by the offsetting effect between the impact of a general increase or decrease in interest rates on financial expenses, on the one hand, and the impact of such an increase or decrease on pension costs, on the other.
Our pension costs are also subject to the risk of fluctuation in the fair value of investments held in the pension fund portfolio. To manage this risk, we rely on asset diversification and on investment management strategies that include the use of derivatives.
Liquidity risk
Liquidity risk is the risk that an entity will encounter difficulty in meeting obligations associated with its financial liabilities. This type of risk may translate into difficulties accessing sources of financing for its investment program.
Our liquidity risk is mitigated by several factors, including substantial cash flows from operating activities, access to a preauthorized standby credit facility and a diversified portfolio of highly liquid financial instruments.
Credit risk
Credit risk is the risk that a counterparty may not meet its contractual obligations. We are exposed to credit risk related to receivables through ongoing electricity sales in Québec. These sales are billed at rates that provide for cost recovery according to terms approved by the Energy Board. We are also exposed to credit risk related to the cash equivalents, short-term investments and derivative instruments traded with financial institutions and other issuers and, to a lesser extent, with North American energy companies under Hydro-Québec Distribution supply contracts and Hydro-Québec Production energy transactions on markets outside Québec.
- 40 -
Exposure to credit risk is mitigated by the implementation of limits and frameworks for risk concentration and level of exposure by counterparty. To ensure compliance with such limits and frameworks, we take a proactive approach based on various controls and monitoring reports. These enable us to react quickly to any event that could have an impact on the financial position of our counterparties. In addition, we generally do business with counterparties that have a high credit rating. We also enter into agreements to keep the market value of the main portfolios of derivative instruments below a predetermined threshold.
Regulatory risks
We are exposed to regulatory risks because, under the Energy Board Act, our activities related to electricity transmission and distribution are regulated. The decisions handed down by the Energy Board may therefore affect the results of Hydro-Québec TransÉnergie and Hydro-Québec Distribution. In particular, the Act stipulates that rates are determined on a basis that allows for recovery of the cost of service and provides a reasonable return on the rate base.
Various measures have been put in place to reduce the impact of regulatory risks on these two divisions’ results. These measures include submitting complete and well-argued files to the Energy Board and maintaining a constructive dialogue with the Energy Board and the intervenors, particularly during working sessions.
Operational risks
Generation
One of the principal uncertainties that we face relates to natural water inflows. Hydro-Québec Production must ensure that it is able to meet its commitments to supply an annual base volume of up to 165 TWh of heritage pool electricity to Hydro-Québec Distribution and fulfill its contractual obligations. In concrete terms, this means being able to cover a natural inflow deficit of 64 TWh over two consecutive years, and 98 TWh over four consecutive years. To manage this risk, the division applies a variety of mitigation measures and closely monitors them. It therefore manages its reservoir storage on a multiyear basis and maintains an adequate margin between its generating capacity and its commitments. This allows the division to compensate for variations in runoff, replenish its reserves or take advantage of business opportunities. We regularly report to the Energy Board on the generating capacity and energy reserve of Hydro-Québec Production.
In addition to runoff uncertainties, Hydro-Québec Production’s export activities on wholesale markets are subject to market risk and the risk of unavailability of generating and transmission equipment. Market risk results from fluctuations in energy prices on markets outside Québec, and is mitigated by ongoing monitoring of trends in wholesale markets and the use of hedging derivative instruments. The risk of unavailability of generating and transmission equipment is mitigated through maintenance and upgrade programs.
Hydro-Québec Production is also exposed to risk arising from variances between forecast and actual temperatures and market demand in Québec. Such variances have an impact on the division’s electricity sales to Hydro-Québec Distribution and may affect the volume available for its export sales.
The risks related to Hydro-Québec Production’s export activities are quantified in an integrated fashion by a team of specialists that is independent of the unit carrying out the transactions. This team sees to the application of controls, presents daily reports to Senior Management and seeks to ensure compliance with the limits approved by Management and our Board of Directors.
Transmission
Several factors, such as extreme weather events and equipment failure, may cause service interruptions or result in the unavailability of part of the transmission system. The multifaceted strategy adopted by Hydro-Québec TransÉnergie to prevent these problems includes implementing the standards of the North American Electric Reliability Corporation (NERC) as well as measures to maintain and reinforce its transmission facilities and ensure that assets continue to operate smoothly throughout their useful lives. It is worth noting in this regard that Hydro-Québec TransÉnergie’s Direction – Contrôle des mouvements d’énergie (system control unit) is Reliability Coordinator for transmission systems in Québec, a role it was assigned by the Energy Board in 2007.
Hydro-Québec TransÉnergie must provide adequate transmission capacity to supply Hydro-Québec Distribution and other customers, while also ensuring transmission system security and reliability. To do so, it carefully manages the annual peak load and invests in modernizing its transmission facilities based on an asset management model. It has also undertaken major projects to replace the grid control systems, special protection systems, and substation protections and controls.
- 41 -
Distribution
The main risk to which Hydro-Québec Distribution is exposed relates to continuity of service. To maintain power quality, the division makes ongoing investments in its system to modernize and automate it and enhance its security. It also relies on vegetation control, the implementation of an asset maintenance program and a strategy for asset renewal, as well as compliance with applicable standards for overhead and underground systems. To reduce the duration of service interruptions, the vast majority of which are caused by adverse weather conditions, the division has adopted new technologies for rapid detection of outages, faster service restoration and remote management of certain incidents.
Even under normal weather conditions, economic and market factors cause fluctuations in demand, which impact Hydro-Québec Distribution’s results. When demand is lower than the forecasts presented in the rate filing, the division cannot recover from customers all the costs related to power distribution and the cost of transmission through the Hydro-Québec TransÉnergie system. To counter the impact of this risk, the division constantly fine-tunes its method of forecasting demand for electricity.
Construction
One of the key risks that Hydro-Québec Innovation, équipement et services partagés must deal with is occupational health and safety (OHS) on its jobsites. In 2017, the division initiated a significant transformation in this regard, with the ambition of becoming a model for health and safety in Québec���s construction industry. To this end, it developed an OHS action plan in line with the corporate one and teamed up with the other divisions to achieve a common goal: provide a safe, healthy and respectful work environment.
Pressure on construction project costs is another risk to which the division is constantly exposed. This pressure is due to such factors as the rising cost of labor in the construction industry, higher prices for certain materials or products, and factors that affect project schedules (late deliveries, poor quality, work stoppages).
To meet its commitments and continue to apply high safety and quality standards, the division has implemented a number of measures to reduce its risk exposure. Specifically, it closely monitors project schedules, costs and the main deliverables, an approach that enables it to ensure that projects are progressing as planned or to take any necessary corrective action. It also maintains ongoing relations with the relevant organizations and government departments to stay abreast of future amendments to laws and regulations that could affect projects. In addition, it develops procurement strategies that promote competition, secure long-term supplies and continuity of expertise in its markets, and it adjusts its project completion strategies according to economic conditions, in consultation with its customers.
Finally, trade agreements between Québec and Ontario and between Canada and the European Union may affect our procurement processes, particularly regarding security, confidentiality of information and how requirements are defined.
Corporate and Other Activities
Occupational health and safety
We have always maintained very high OHS standards. However, in light of the recommendations made by the consulting firm that we engaged in 2017 to analyze our OHS practices, we made a commitment to review our procedures and do more than simply meet our legal obligations in this regard, both on jobsites and company-wide. Moreover, we decided to go further and do our utmost to ensure that occupational health and safety becomes a fundamental value for all our personnel and subcontractors.
For this reason, we launched several concrete initiatives that we intend to continue over the coming years. These initiatives are intended to build a culture of prevention based on everyone’s commitment and cooperation. The transformation under way relies on sound behaviors and shared values, unifying leadership and increased manager presence on the ground, as well as optimizing our ability to identify risks, implement effective means of control and learn from any health and safety–related incidents.
- 42 -
Safety of individuals and security of assets and revenue
The physical safety of individuals (employees, suppliers and the public) and the security of our assets, as well as cybersecurity, are key concerns for us. To manage these issues, we rely on a multidisciplinary team of experts who continuously monitor our facilities, systems and information and telecommunications networks, anticipate and analyze threats, maintain a close watch on related risks, regularly assess the mitigation measures in place and deploy new strategies based on changes in our business environment and emerging trends in security. Our model of protection is based on anticipation, detection, deterrence, response and recovery. It is also rooted in an integrated security culture that relies on cooperation and awareness on the part of our managers and employees, as well as internal and external partners.
Protection of our revenue is another major challenge. In the coming years, we plan to pay special attention to electricity theft, intellectual property infringement and attempts to compromise the power grid, particularly through cyberattacks. A new analytical method for detecting electricity theft, increased security at strategic facilities including research centers, as well as continued surveillance by the corporate ICT (information and communication technologies) security monitoring center in collaboration with partners are just a few examples of the methods being implemented to reduce these risks.
In addition, we have a corporate emergency response plan to ensure the continuity of our operations and our mission in case of an exceptional event. The corporate plan integrates our structural units’ emergency response plans and activities with the aim of strengthening and improving coordination of the efforts of all internal and external responders, including public authorities.
Business development and investment outside Québec
In keeping with the strategies set out in our Strategic Plan 2016–2020, we have undertaken to expand our operations on markets outside Québec with a view to enhancing our profitability. The growth avenues we are exploring involve developing our export markets, commercializing our technological innovations and building partnerships, making acquisitions or acquiring interests outside Québec. To successfully implement our international expansion projects, we adopted a business opportunity analysis process that should enable us to identify the related risks and manage them proactively.
Environment
Environmental protection and conservation are also among our main priorities. In 2018, our management system, which has an environmental component, was certified to ISO 14001:2015. Furthermore, every year, we review our management of environmental risks and issues and provide an overview in our Sustainability Report.
Climate change
Given the extent to which climate change could affect our operations, we decided, in late 2018, to develop a plan to address this issue. The actual and anticipated impacts of climate change, as well as the measures we take to meet the related challenges and reduce greenhouse gas emissions in Québec, are presented in our Sustainability Report.
- 43 -
INDEPENDENT AUDITORS’ REPORT
To the Minister of Finance of Québec:
REPORT ON THE AUDIT OF THE CONSOLIDATED FINANCIAL STATEMENTS
Opinion
We have audited the consolidated financial statements of Hydro-Québec (“the Group”), which comprise the consolidated balance sheets as at December 31, 2018 and 2017, and the consolidated statements of operations, consolidated statements of comprehensive income, consolidated statements of changes in equity and consolidated statements of cash flows for each of the years in the three-year period ended December 31, 2018, and notes to the consolidated financial statements, including a summary of significant accounting policies.
In our opinion, the accompanying consolidated financial statements present fairly, in all material respects, the consolidated financial position of the Group as at December 31, 2018 and 2017, and its consolidated results of operations and its consolidated cash flows for each of the years in the three-year period ended December 31, 2018, in accordance with United States generally accepted accounting principles (“U.S. GAAP”).
Basis for Opinion
We conducted our audit in accordance with Canadian generally accepted auditing standards. Our responsibilities under those standards are further described in the Auditors’ Responsibilities for the Audit of the Consolidated Financial Statements section of our report. We are independent of the Group in accordance with the ethical requirements that are relevant to our audit of the consolidated financial statements in Canada, and we have fulfilled our other ethical responsibilities in accordance with these requirements. We believe that the audit evidence we have obtained is sufficient and appropriate to provide a basis for our opinion.
Other Information
Management is responsible for the other information. Other information comprises:
| | ● | | The information, other than the consolidated financial statements and our auditors’ report thereon, included in the Annual Report. |
| | ● | | The information, other than the consolidated financial statements and our auditors’ report thereon, included in a document likely to be entitled Annual Report – Form 18-K. |
Our opinion on the consolidated financial statements does not cover the other information and we do not and will not express any form of assurance conclusion thereon.
In connection with our audit of the consolidated financial statements, our responsibility is to read the other information identified above and, in doing so, consider whether the other information is materially inconsistent with the consolidated financial statements or our knowledge obtained in the audit or otherwise appears to be materially misstated.
We obtained the Annual Report prior to the date of this auditors’ report. If, based on the work we have performed on the other information included in this Annual Report, we conclude that there is a material misstatement of this other information, we are required to report that fact in this auditors’ report. We have nothing to report in this regard.
The document likely to be entitled Annual Report – Form 18-K is expected to be made available to us after the date of the auditors’ report. If, based on the work we will perform on the other information included in this document, we conclude that there is a material misstatement of this other information, we are required to report that fact to those charged with governance.
Responsibilities of Management and Those Charged with Governance for the Consolidated Financial Statements
Management is responsible for the preparation and fair presentation of the consolidated financial statements in accordance with U.S. GAAP, and for such internal control as Management determines is necessary to enable the preparation of consolidated financial statements that are free from material misstatement, whether due to fraud or error.
In preparing the consolidated financial statements, Management is responsible for assessing the Group’s ability to continue as a going concern, disclosing, as applicable, matters related to going concern and using the going concern basis of accounting unless Management either intends to liquidate the Group or to cease operations, or has no realistic alternative but to do so.
Those charged with governance are responsible for overseeing the Group’s financial reporting process.
- 44 -
Auditors’ Responsibilities for the Audit of the Consolidated Financial Statements
Our objectives are to obtain reasonable assurance about whether the consolidated financial statements as a whole are free from material misstatement, whether due to fraud or error, and to issue an auditors’ report that includes our opinion. Reasonable assurance is a high level of assurance, but is not a guarantee that an audit conducted in accordance with Canadian generally accepted auditing standards will always detect a material misstatement when it exists. Misstatements can arise from fraud or error and are considered material if, individually or in the aggregate, they could reasonably be expected to influence the economic decisions of users taken on the basis of these consolidated financial statements.
As part of an audit in accordance with Canadian generally accepted auditing standards, we exercise professional judgment and maintain professional skepticism throughout the audit. We also:
| | ● | | Identify and assess the risks of material misstatement of the consolidated financial statements, whether due to fraud or error, design and perform audit procedures responsive to those risks, and obtain audit evidence that is sufficient and appropriate to provide a basis for our opinion. The risk of not detecting a material misstatement resulting from fraud is higher than for one resulting from error, as fraud may involve collusion, forgery, intentional omissions, misrepresentations, or the override of internal control. |
| | ● | | Obtain an understanding of internal control relevant to the audit in order to design audit procedures that are appropriate in the circumstances, but not for the purpose of expressing an opinion on the effectiveness of the Group’s internal control. |
| | ● | | Evaluate the appropriateness of accounting policies used and the reasonableness of accounting estimates and related disclosures made by Management. |
| | ● | | Conclude on the appropriateness of Management’s use of the going concern basis of accounting and, based on the audit evidence obtained, whether a material uncertainty exists related to events or conditions that may cast significant doubt on the Group’s ability to continue as a going concern. If we conclude that a material uncertainty exists, we are required to draw attention in our auditors’ report to the related disclosures in the consolidated financial statements or, if such disclosures are inadequate, to modify our opinion. Our conclusions are based on the audit evidence obtained up to the date of our auditors’ report. However, future events or conditions may cause the Group to cease to continue as a going concern. |
| | ● | | Evaluate the overall presentation, structure and content of the consolidated financial statements, including the disclosures, and whether the consolidated financial statements represent the underlying transactions and events in a manner that achieves fair presentation. |
| | ● | | Obtain sufficient appropriate audit evidence regarding the financial information of the entities or business activities within the Group to express an opinion on the consolidated financial statements. We are responsible for the direction, supervision and performance of the group audit. We remain solely responsible for our audit opinion. |
We communicate with those charged with governance regarding, among other matters, the planned scope and timing of the audit and significant audit findings, including any significant deficiencies in internal control that we identify during our audit.
We also provide those charged with governance with a statement that we have complied with relevant ethical requirements regarding independence, and to communicate with them all relationships and other matters that may reasonably be thought to bear on our independence, and where applicable, related safeguards.
REPORT ON OTHER LEGAL AND REGULATORY REQUIREMENTS
As required by the Auditor General Act (CQLR, c. V-5.01), we report that, in our opinion, except for the changes in accounting policies described in Note 2 to the consolidated financial statements, these principles have been applied for the year ended December 31, 2018, on a basis consistent with the preceding year.
The engagement partners from KPMG LLP and from Ernst & Young LLP on the audit resulting in this independent auditors’ report are respectively [REDACTED] and [REDACTED].
| | | | |
/s/ KPMG LLP1 | | /s/ Ernst & Young LLP2 | | /s/ Guylaine Leclerc, FCPA auditor, FCA |
| | | | Auditor General of Québec |
Montréal, Québec | | | | |
February 15, 2019 | | | | |
|
| 1. FCPA auditor, FCA, public accountancy permit No. A110618 |
2. CPA auditor, CA, public accountancy permit No. A129122 |
- 45 -
CONSOLIDATED FINANCIAL STATEMENTS
CONSOLIDATED STATEMENTS OF OPERATIONS
| | | | | | | | | | | | | | | | |
| | | | | |
Years ended December 31 In millions of Canadian dollars | | Notes | | | 2018 | | | 2017 | | | 2016 | |
| | | | |
Revenue | | | 20 | | | | 14,370 | | | | 13,468 | | | | 13,339 | |
| | | | |
Expenditure | | | | | | | | | | | | | | | | |
Operations | | | | | | | 2,843 | | | | 2,664 | | | | 2,671 | |
Other components of employee future benefit cost | | | 18 | | | | (340 | ) | | | (322 | ) | | | (233 | ) |
Electricity and fuel purchases | | | | | | | 2,167 | | | | 2,005 | | | | 1,866 | |
Depreciation and amortization | | | 4 | | | | 2,685 | | | | 2,686 | | | | 2,597 | |
Taxes | | | 5 | | | | 1,111 | | | | 1,076 | | | | 1,045 | |
| | | | | | | | 8,466 | | | | 8,109 | | | | 7,946 | |
| | | | |
Income before financial expenses | | | | | | | 5,904 | | | | 5,359 | | | | 5,393 | |
Financial expenses | | | 6 | | | | 2,712 | | | | 2,513 | | | | 2,532 | |
| | | | |
Net income | | | | | | | 3,192 | | | | 2,846 | | | | 2,861 | |
|
CONSOLIDATED STATEMENTS OF COMPREHENSIVE INCOME | |
| | | | | |
Years ended December 31 In millions of Canadian dollars | | Notes | | | 2018 | | | 2017 | | | 2016 | |
| | | | |
Net income | | | | | | | 3,192 | | | | 2,846 | | | | 2,861 | |
| | | | |
Other comprehensive income | | | 16 | | | | | | | | | | | | | |
Net change in items designated as cash flow hedges | | | 15 | | | | 215 | | | | (271 | ) | | | (368 | ) |
Net change in employee future benefits | | | 18 | | | | 469 | | | | (387 | ) | | | (121 | ) |
Translation differences in financial statements of foreign operations | | | | | | | 3 | | | | (2 | ) | | | 3 | |
| | | | | | | | 687 | | | | (660 | ) | | | (486 | ) |
| | | | |
Comprehensive income | | | | | | | 3,879 | | | | 2,186 | | | | 2,375 | |
The accompanying notes are an integral part of the consolidated financial statements.
- 46 -
CONSOLIDATED BALANCE SHEETS
| | | | | | | | | | | | |
| | | | |
As at December 31 In millions of Canadian dollars | | Notes | | | 2018 | | | 2017 | |
| | | |
ASSETS | | | | | | | | | | | | |
Current assets | | | | | | | | | | | | |
Cash and cash equivalents | | | | | | | 1,335 | | | | 537 | |
Short-term investments | | | | | | | 884 | | | | 1,112 | |
Accounts receivable and other receivables | | | 15 | | | | 2,713 | | | | 2,487 | |
Derivative instruments | | | 15 | | | | 72 | | | | 69 | |
Regulatory assets | | | 3 | | | | 203 | | | | 133 | |
Materials, fuel and supplies | | | | | | | 264 | | | | 228 | |
| | | | | | | | 5,471 | | | | 4,566 | |
| | | |
Property, plant and equipment | | | 7 | | | | 64,966 | | | | 63,990 | |
Intangible assets | | | 8 | | | | 877 | | | | 871 | |
Investments | | | 9 | | | | 1,022 | | | | 890 | |
Derivative instruments | | | 15 | | | | 121 | | | | 19 | |
Regulatory assets | | | 3 | | | | 3,863 | | | | 4,747 | |
Other assets | | | 10 | | | | 669 | | | | 686 | |
| | | | | | | | 76,989 | | | | 75,769 | |
| | | |
LIABILITIES | | | | | | | | | | | | |
Current liabilities | | | | | | | | | | | | |
Borrowings | | | | | | | 8 | | | | 8 | |
Accounts payable and accrued liabilities | | | | | | | 2,135 | | | | 2,439 | |
Dividend payable | | | 16 | | | | 2,394 | | | | 2,135 | |
Accrued interest | | | | | | | 914 | | | | 895 | |
Asset retirement obligations | | | 11 | | | | 62 | | | | 65 | |
Derivative instruments | | | 15 | | | | 80 | | | | 187 | |
Regulatory liabilities | | | 3 | | | | 80 | | | | 78 | |
Current portion of long-term debt | | | 12 | | | | 3,151 | | | | 1,183 | |
| | | | | | | | 8,824 | | | | 6,990 | |
| | | |
Long-term debt | | | 12 | | | | 42,910 | | | | 43,825 | |
Asset retirement obligations | | | 11 | | | | 811 | | | | 799 | |
Derivative instruments | | | 15 | | | | 28 | | | | 22 | |
Regulatory liabilities | | | 3 | | | | 714 | | | | 478 | |
Other liabilities | | | 13 | | | | 2,219 | | | | 3,649 | |
Perpetual debt | | | 14 | | | | 274 | | | | 251 | |
| | | | | | | | 55,780 | | | | 56,014 | |
| | | |
EQUITY | | | 16 | | | | | | | | | |
Share capital | | | | | | | 4,374 | | | | 4,374 | |
Retained earnings | | | | | | | 18,741 | | | | 17,972 | |
Accumulated other comprehensive income | | | | | | | (1,906 | ) | | | (2,591 | ) |
| | | | | | | | 21,209 | | | | 19,755 | |
| | | | | | | | 76,989 | | | | 75,769 | |
| | | |
Commitments and contingencies | | | 19 | | | | | | | | | |
The accompanying notes are an integral part of the consolidated financial statements.
On behalf of the Board of Directors,
| | |
| /s/ Geneviève Brouillette | | /s/ Jacynthe Côté |
| Member of the Audit Committee | | Chair of the Board |
- 46 -
CONSOLIDATED STATEMENTS OF CHANGES IN EQUITY
| | | | | | | | | | | | | | | | | | | | | | |
| | | | | | | |
Years ended December 31 In millions of Canadian dollars | | Notes | | | | | Share capital | | | Retained earnings | | | Accumulated
other
comprehensive
income | | | Total equity | |
| | | | | | |
Balance as at December 31, 2017 | | | | | | | | | 4,374 | | | | 17,972 | | | | (2,591 | ) | | | 19,755 | |
| | | | | | |
Adjustments related to a change in accounting policy | | | 2 | | | | | | – | | | | (29 | ) | | | (2 | ) | | | (31 | ) |
| | | | | | |
Net income | | | | | | | | | – | | | | 3,192 | | | | – | | | | 3,192 | |
Other comprehensive income | | | 16 | | | | | | – | | | | – | | | | 687 | | | | 687 | |
Dividend | | | 16 | | | | | | – | | | | (2,394 | ) | | | – | | | | (2,394 | ) |
Balance as at December 31, 2018 | | | | | | | | | 4,374 | | | | 18,741 | | | | (1,906 | ) | | | 21,209 | |
| | | | | | |
Balance as at December 31, 2016 | | | | | | | | | 4,374 | | | | 17,261 | | | | (1,931 | ) | | | 19,704 | |
| | | | | | |
Net income | | | | | | | | | – | | | | 2,846 | | | | – | | | | 2,846 | |
Other comprehensive income | | | 16 | | | | | | – | | | | – | | | | (660 | ) | | | (660 | ) |
Dividend | | | 16 | | | | | | – | | | | (2,135 | ) | | | – | | | | (2,135 | ) |
Balance as at December 31, 2017 | | | | | | | | | 4,374 | | | | 17,972 | | | | (2,591 | ) | | | 19,755 | |
| | | | | | |
Balance as at December 31, 2015 | | | | | | | | | 4,374 | | | | 16,546 | | | | (1,445 | ) | | | 19,475 | |
| | | | | | |
Net income | | | | | | | | | – | | | | 2,861 | | | | – | | | | 2,861 | |
Other comprehensive income | | | 16 | | | | | | – | | | | – | | | | (486 | ) | | | (486 | ) |
Dividend | | | 16 | | | | | | – | | | | (2,146 | ) | | | – | | | | (2,146 | ) |
Balance as at December 31, 2016 | | | | | | | | | 4,374 | | | | 17,261 | | | | (1,931 | ) | | | 19,704 | |
The accompanying notes are an integral part of the consolidated financial statements.
- 48 -
CONSOLIDATED STATEMENTS OF CASH FLOWS
| | | | | | | | | | | | | | | | |
| | | | | |
Years ended December 31 In millions of Canadian dollars | | Notes | | | 2018 | | | 2017 | | | 2016 | |
| | | | |
Operating activities | | | | | | | | | | | | | | | | |
Net income | | | | | | | 3,192 | | | | 2,846 | | | | 2,861 | |
Adjustments to determine net cash flows from operating activities | | | | | | | | | | | | | | | | |
Depreciation and amortization | | | 4 | | | | 2,685 | | | | 2,686 | | | | 2,597 | |
Amortization of premiums, discounts and issue expenses related to debt securities | | | | | | | 203 | | | | 190 | | | | 173 | |
Deficit of net cost recognized with respect to amounts paid for employee future benefits | | | | | | | (146 | ) | | | (200 | ) | | | (146 | ) |
Gain on partial sale of a subsidiary | | | 9 | | | | (277 | ) | | | – | | | | – | |
Other | | | | | | | 118 | | | | 255 | | | | 230 | |
Regulatory assets and liabilities | | | | | | | (57 | ) | | | 137 | | | | (46 | ) |
Change in non-cash working capital items | | | 17 | | | | (420 | ) | | | (336 | ) | | | (165 | ) |
| | | | | | | | 5,298 | | | | 5,578 | | | | 5,504 | |
| | | | |
Investing activities | | | | | | | | | | | | | | | | |
Additions to property, plant and equipment | | | | | | | (3,292 | ) | | | (3,647 | ) | | | (3,363 | ) |
Additions to intangible assets | | | | | | | (110 | ) | | | (107 | ) | | | (97 | ) |
Partial sale of a subsidiary, net of cash transferred | | | | | | | 160 | | | | – | | | | – | |
Net change in short-term investments and sinking fund | | | 10 | | | | 215 | | | | 492 | | | | (272 | ) |
Other | | | | | | | 70 | | | | 15 | | | | 39 | |
| | | | | | | | (2,957 | ) | | | (3,247 | ) | | | (3,693 | ) |
| | | | |
Financing activities | | | | | | | | | | | | | | | | |
Issuance of long-term debt | | | | | | | 1,828 | | | | 1,207 | | | | 2,011 | |
Repayment of long-term debt | | | | | | | (1,778 | ) | | | (1,417 | ) | | | (1,927 | ) |
Cash receipts arising from credit risk management | | | | | | | 3,737 | | | | 4,964 | | | | 10,312 | |
Cash payments arising from credit risk management | | | | | | | (3,200 | ) | | | (5,596 | ) | | | (11,093 | ) |
Net change in borrowings | | | | | | | (18 | ) | | | (8 | ) | | | (6 | ) |
Dividend paid | | | | | | | (2,135 | ) | | | (2,146 | ) | | | (2,360 | ) |
Other | | | | | | | 13 | | | | (31 | ) | | | (137 | ) |
| | | | | | | | (1,553 | ) | | | (3,027 | ) | | | (3,200 | ) |
Foreign currency effect on cash and cash equivalents | | | | | | | 10 | | | | (10 | ) | | | (16 | ) |
| | | | |
Net change in cash and cash equivalents | | | | | | | 798 | | | | (706 | ) | | | (1,405 | ) |
| | | | |
Cash and cash equivalents, beginning of year | | | | | | | 537 | | | | 1,243 | | | | 2,648 | |
| | | | |
Cash and cash equivalents, end of year | | | | | | | 1,335 | | | | 537 | | | | 1,243 | |
| | | | |
Supplementary cash flow information | | | 17 | | | | | | | | | | | | | |
The accompanying notes are an integral part of the consolidated financial statements.
- 49 -
NOTES TO CONSOLIDATED FINANCIAL STATEMENTS
Years ended December 31, 2018, 2017 and 2016
Amounts in tables are in millions of Canadian dollars, unless otherwise indicated.
Under the provisions of the Hydro-Québec Act, Hydro-Québec is mandated to supply power and to pursue endeavors in energy-related research and promotion, energy conversion and conservation, and any field connected with or related to power or energy. Hydro-Québec is required, in particular, to supply a base volume of up to 165 TWh a year of heritage pool electricity for the Québec market, as set out in the Act respecting the Régie de l’énergie. As a government corporation, Hydro-Québec is exempt from paying income taxes in Canada.
| Note 1 | Significant Accounting Policies |
Hydro-Québec’s consolidated financial statements have been prepared in accordance with United States generally accepted accounting principles (“U.S. GAAP”).
Management is of the opinion that these consolidated financial statements present fairly, in all material respects, the consolidated financial position of Hydro-Québec.
Management has reviewed events occurring until February 15, 2019, the date of approval of these consolidated financial statements by the Board of Directors, to determine whether circumstances warranted consideration of events subsequent to the balance sheet date.
REGULATION
The Act respecting the Régie de l’énergie grants the Régie de l’énergie (the “Régie”) exclusive authority to determine or modify the rates and conditions under which electricity is transmitted and distributed by Hydro-Québec. Hydro-Québec’s electricity transmission and distribution activities in Québec are therefore regulated. Under this legislation, rates are set by reasoned decision of three commissioners after public hearings. The Act also stipulates that rates are set on a basis that allows for recovery of the cost of service and provides a reasonable return on the rate base. The Transmission Provider’s rates are set according to a method based solely on the cost of service. In the case of the Distributor, since January 1, 2018, its rates have been subject to performance-based regulation, which will apply for an initial period of four years. Under this type of regulation, the rates for the 2018–2019 rate year were set using the cost of service method, while those for the following three years will be set according to a parametric formula.
Moreover, the rates of the Transmission Provider and the Distributor are subject to an earnings-sharing mechanism.
Under U.S. GAAP, it is acknowledged that rate regulation may affect the timing of the recognition of certain transactions in the consolidated results, giving rise to the recognition of regulatory assets and liabilities, which Hydro-Québec considers it is likely to recover or settle subsequently through the rate-setting process.
When the Transmission Provider or the Distributor determines that certain costs incurred may likely be recovered in future rates, such costs are deferred and recognized as assets. When it is probable that the Transmission Provider or the Distributor will be required to reimburse customers, or when costs have been recovered but will be incurred in the future, a liability is recognized. The balances of these assets and liabilities are amortized over the recovery periods approved by the Régie.
The risks and uncertainties related to regulatory assets and liabilities are monitored and assessed from time to time. When Hydro-Québec deems that the net carrying amount of a regulatory asset or liability is no longer likely to be taken into account in establishing future rates, a loss or gain is recognized in the results for the period during which the judgment is made.
SCOPE OF CONSOLIDATION
The consolidated financial statements include the accounts of Hydro-Québec and its subsidiaries as well as those of variable interest entities where Hydro-Québec is the primary beneficiary. All intercompany balances and transactions are eliminated at the time of consolidation.
Investments over which Hydro-Québec has joint control or significant influence are accounted for on an equity basis. These investments are initially recognized at cost, and their carrying amount is increased or decreased by an amount equal to Hydro-Québec’s share of the changes in their net assets after the date of acquisition. Hydro-Québec’s share of the results of these investments is recognized in results. Dividends received are applied against the carrying amount of the investments.
- 50 -
| Note 1 | Significant Accounting Policies (continued) |
USE OF ESTIMATES
The preparation of financial statements in accordance with U.S. GAAP requires that Management make estimates and assumptions that affect the amounts recognized as assets and liabilities, the disclosures regarding contingent assets and liabilities at the date of the consolidated financial statements and the amounts recognized as revenue and expenditure for the years at issue. The estimates relate, among other things, to revenue, which includes estimated amounts for electricity delivered but not billed; the carrying amount of regulatory assets and liabilities; fair value measurements of financial instruments; the useful life of property, plant and equipment and intangible assets for calculating the depreciation and amortization expense; as well as cash flows, the expected timing of payments, and the discount rates used to determine asset retirement obligations and employee future benefit liabilities. These rates are based on economic and actuarial assumptions. Actual results could differ from those estimates and such differences could be significant.
REVENUE
Hydro-Québec supplies the Québec market with electricity and also sells power on wholesale markets in Canada and the United States. Substantially all revenue from ordinary activities is derived from electricity sales contracts with customers. These sales are recognized over time, based on the electricity delivered and the amount that Hydro-Québec is entitled to charge customers in accordance with regulated rates or contractual provisions.
FOREIGN CURRENCY TRANSLATION
Monetary assets and liabilities denominated in foreign currencies are translated into Canadian dollars at the exchange rate in effect at the balance sheet date, whereas non-monetary items denominated in foreign currencies are translated at the historical exchange rate. Revenue and expenditure arising from foreign currency transactions are translated into Canadian dollars at the exchange rate in effect at the transaction date. The exchange gains or losses resulting from the translation of monetary items are included in results.
The financial statements of foreign operations whose functional currency is not the Canadian dollar are translated according to the current rate method. Under this method, assets and liabilities are translated into Canadian dollars at the exchange rate in effect at the balance sheet date, whereas revenue and expenditure are translated at the average exchange rate in effect during the period. The exchange gains or losses resulting from the translation of the financial statements of these foreign operations are presented in Other comprehensive income.
FINANCIAL INSTRUMENTS
Cash and cash equivalents
Cash and cash equivalents include investments with a maturity of three months or less from the date of acquisition.
Short-term investments
Short-term investments, classified as available-for-sale debt securities, consist of money market instruments with a maturity of more than three months from the date of acquisition and are recognized at fair value. Changes in fair value are recorded in Other comprehensive income until they are realized, at which time they are reclassified to results. Revenue from these investments, calculated using the effective interest method, is recognized in results.
Receivables – Accounts receivable
Accounts receivable are recognized at the amount invoiced, net of the allowance for doubtful accounts. This allowance is based on the status of customer files and the recovery experience for each age group of accounts. Receivables are written off during the period in which the accounts are deemed uncollectible.
- 51 -
| Note 1 | Significant Accounting Policies (continued) |
Other receivables and financial liabilities
Other receivables presented under Accounts receivable and other receivables, long-term bonds held in the sinking fund, which are presented in Other assets, less any impairment losses, as well as borrowings, financial liabilities presented under Accounts payable and accrued liabilities, the dividend payable, accrued interest, long-term debt, financial liabilities presented under Other liabilities, and perpetual debt, are measured at amortized cost using the effective interest method. Amortized cost includes issue expenses as well as premiums and discounts, if applicable. Interest is recognized in results.
Derivative instruments
Derivative instruments are recognized at fair value at the balance sheet date. Changes in fair value are recognized in results for the period in which they occur, except in the case of derivative instruments designated as hedges in a cash flow hedging relationship. The net balances of derivative instruments that are transacted with the same counterparty, that are the subject of an enforceable master netting arrangement, net of cash received or paid under collateral exchange agreements, and that meet the conditions for set-off are presented on the balance sheet.
As part of its integrated business risk management, Hydro-Québec uses derivative instruments to manage its market risk, consisting of currency risk, interest rate risk and risk resulting from fluctuating energy and aluminum prices. It applies cash flow or fair value hedge accounting to eligible hedging relationships that it designates as hedges, and formally documents these relationships. Among other things, this process involves associating derivative instruments with specific assets or liabilities on the balance sheet, or with probable anticipated transactions. Hydro-Québec ensures that hedging relationships are highly effective in hedging the designated risk exposure initially and then monthly thereafter. In addition, for hedges of anticipated transactions, it assesses the probability of the occurrence of those transactions designated as hedged items at least on a quarterly basis.
In the case of a cash flow hedge, changes in the fair value of an instrument designated as a hedge are recognized under Other comprehensive income. Such amounts are reclassified to results, under the line item affected by the hedged item, during the periods in which the hedged item affects results. If a derivative instrument no longer satisfies hedging conditions, if it has expired or is sold, terminated or exercised, or if Hydro-Québec cancels its designation as a hedging item, hedge accounting ceases to be applied on a prospective basis. Gains and losses previously accumulated in Other comprehensive income continue to be deferred and are later reclassified to results during the same periods as the hedged item. If the hedged item ceases to exist or if it becomes likely that the hedged anticipated transactions will not occur, the deferred gains or losses are immediately reclassified to results.
In the case of a fair value hedge, changes in the fair value of the derivative instrument are recognized in results under the line item affected by the hedged item. Offsetting changes in the fair value of the hedged item attributable to the hedged risk are recognized as adjustments to this item’s carrying amount and are offset against results.
Cash flows attributable to derivative instruments designated as hedges are presented in the statement of cash flows based on the same classification as the hedged item.
Hydro-Québec assesses its contracts to determine if they meet the definition of a derivative or if they include an embedded derivative, which must be separated from its host contract. If such is the case, the contract or the embedded derivative is recognized at fair value on the balance sheet.
All futures or forward contracts on non-financial items that can be settled on a net basis and whose price is closely tied to the non-financial item bought or sold are recorded at the settlement date if there is a probability of receipt or delivery in accordance with expected requirements.
FAIR VALUE
Fair value is the price that would be received to sell an asset or paid to transfer a liability in an orderly transaction between market participants at the measurement date.
In accordance with the applicable standards, Hydro-Québec classifies the fair value measurements of assets and liabilities according to a three-level hierarchy, based on the type of inputs used in making these measurements:
| | | | |
| • | | Level 1: | | Quoted prices (unadjusted) on active markets for identical assets or liabilities that Hydro-Québec can access at the measurement date; |
• | | Level 2: | | Inputs other than quoted prices included within Level 1 that are observable either directly or indirectly; and |
• | | Level 3: | | Unobservable inputs. |
- 52 -
| Note 1 | Significant Accounting Policies (continued) |
MATERIALS, FUEL AND SUPPLIES
Inventories of materials, fuel and supplies are valued at the lower of cost and net realizable value. Cost is determined by the weighted average cost method.
PROPERTY, PLANT AND EQUIPMENT
Property, plant and equipment are carried at cost, which comprises materials, labor, other costs directly related to construction activities, and financial expenses capitalized during construction. Property, plant and equipment also include draft-design costs for projects whose technical feasibility has been demonstrated, whose profitability has been estimated, and for which Management deems that it will in all likelihood have the necessary resources for completion. The present value of retirement obligations related to property, plant and equipment, as well as that of agreements with local communities concerned by certain investment projects that fall within the definition of a liability, are added to the carrying amount of the property, plant and equipment at issue. Moreover, contributions from third parties are applied against the cost of the related property, plant and equipment.
Property, plant and equipment are depreciated over their useful life, using the straight-line method, starting in the month following the date of commissioning. The depreciation periods for the principal categories of property, plant and equipment are as follows:
| | | | |
| Hydraulic generation | | 40–120 years | | |
| Thermal generation | | 15–50 years | | |
| Transmission substations and lines | | 30–85 years | | |
| Distribution substations and lines | | 25–70 years | | |
| Other property, plant and equipment | | 5–50 years | | |
When property, plant and equipment are retired, their cost, net of accumulated depreciation and salvage value, is recognized in the results for the year.
Maintenance and repair costs are recognized in results when incurred.
LEASES
Capital leases, which have the effect of transferring substantially all the risks and benefits incident to ownership of the leased property to Hydro-Québec, are presented in Property, plant and equipment. They are recognized on their effective date at the fair value of the leased property or, if it is lower, at the present value of the minimum lease payments. Capital leases are amortized over the useful life of the asset or over the term of the lease, if it is less.
Payments under operating leases, where the lessor does not transfer substantially all the risks and benefits incident to ownership of property, are recognized in results throughout the term of the lease.
INTANGIBLE ASSETS
Intangible assets are recognized at cost.
The cost of internally developed computer software is capitalized when it meets capitalization criteria. The related financial expenses are capitalized during the development period.
Intangible assets with an indefinite useful life are not amortized. These assets are tested for impairment annually or more frequently if events indicate a potential impairment loss. Any amount by which the carrying amount exceeds the fair value is recognized in results for the period in which the impairment is determined.
Intangible assets with a finite useful life, such as software and licences, are amortized over their useful life according to the straight-line method. The amortization period for these assets varies from 3 to 24 years.
CAPITALIZED FINANCIAL EXPENSES
Financial expenses capitalized in property, plant and equipment under construction and in internally developed computer software are determined on the basis of the cost of debt and recognized as a deduction from financial expenses in the consolidated results. Capitalized financial expenses related to rate-regulated transmission or distribution activities also take into account the return on equity of the activities concerned. The portion that corresponds to return on equity is included in Revenue in the consolidated results.
- 53 -
| Note 1 | Significant Accounting Policies (continued) |
IMPAIRMENT OF LONG-LIVED ASSETS
Hydro-Québec reviews the carrying amount of its property, plant and equipment and its amortizable intangible assets whenever events or changes in circumstances indicate that the expected undiscounted net cash flows could be lower than the carrying amount of the property and assets. An impairment loss corresponding to the amount by which the carrying amount exceeds fair value is recognized, if applicable.
EMPLOYEE FUTURE BENEFITS
Hydro-Québec offers all its employees a contributory pension plan based on final pay (the “Pension Plan”), as well as other post-retirement benefits and post-employment benefits (collectively, the “Other plans”). All Hydro-Québec’s employee future benefit plans are defined-benefit plans.
Pension plan and other post-retirement benefits
The Pension Plan is a fully funded contributory plan that provides pension benefits based on the number of years of service and an average of the best five years of earnings. These benefits are indexed annually based on a rate which is the greater of the inflation rate, up to a maximum of 2%, and the inflation rate less 3%.
The other post-retirement benefits are provided by group life, medical and hospitalization insurance plans, which are contributory plans with contributions adjusted annually.
Hydro-Québec accounts for its obligations under the Pension Plan and other post-retirement benefits after deducting the fair value of their respective assets.
Benefit costs and obligations under the Pension Plan and other post-retirement benefits provided in exchange for current service are calculated according to the projected benefit method prorated on years of service. They are determined using a discount rate and are based on Management’s best estimates, in particular concerning the expected return on plan assets, salary escalation, the increase in health care costs, and employees’ retirement ages. Plan assets are measured at fair value at the balance sheet date.
In order to establish the benefit costs and its obligations under the Pension Plan and other post-retirement benefits, Hydro-Québec has adopted the following policies:
| • | | Discount rates used to determine the projected benefit obligations and to estimate the current service cost and the interest on obligations are based on the interest rate curve on the measurement date, namely December 31, of high-quality Canadian corporate bonds. These discount rates take into account the amount and different payment maturity dates of the projected benefit obligations for each plan. |
| • | | Actuarial gains and losses are initially recognized in Other comprehensive income. Thereafter, amortization of actuarial gains or losses is recognized under Other components of employee future benefit cost if the unamortized net actuarial gain or loss at the beginning of the year exceeds 10% of the value of the projected benefit obligations or 10% of the market-related value of the plan assets, whichever is greater. The amortization corresponds to the excess divided by active employees’ average remaining years of service. |
| • | | Past service costs (credits) arising from amendments to the Pension Plan and other post-retirement benefits are initially recognized in Other comprehensive income. Thereafter, they are amortized under Other components of employee future benefit cost using the straight-line method over periods not exceeding active employees’ average remaining years of service. |
| • | | The expected return on Pension Plan assets is based on a market-related value determined by using a five-year moving average value for equity securities and by measuring other asset classes at fair value. |
The current service cost component of net plan costs for the year is recognized as an operational expenditure, net of the amount capitalized in assets.
Interest on obligations, expected return on plan assets, amortization of net actuarial loss and amortization of past service costs (credits) are recognized under Other components of employee future benefit cost. These components are not capitalized in assets.
The unamortized balances of net actuarial losses and of past service costs (credits) recognized in Accumulated other comprehensive income for employee future benefits to be recovered in future rates are recognized as a regulatory asset.
- 54 -
| Note 1 | Significant Accounting Policies (continued) |
Post-employment benefits
Post-employment benefits are under non-contributory salary insurance plans, which pay short- and long-term disability benefits. Most of these plans are not funded, with the exception of the long-term disability plan, which is fully funded.
The post-employment benefit cost and obligation are recognized at the time of the event giving rise to the obligation to pay benefits. The cost of these benefits is recognized in results for the period. Actuarial gains and losses are accounted for in the same way as for the Pension Plan and other post-retirement benefits, the only difference being that the amortization period is determined based on the average remaining years of disability.
ASSET RETIREMENT OBLIGATIONS
Hydro-Québec accounts for asset retirement obligations in the period in which the legal obligations with respect thereto arise, provided that a reasonable estimate of their fair value can be made. The corresponding costs of asset retirement are added to the carrying amount of the related long-lived asset and are amortized over its useful life. In subsequent years, any change due to the passage of time is recognized as an operational expenditure (i.e., an accretion expense) for the current year, and the corresponding amount is added to the carrying amount of the liability. Changes resulting from revisions to the timing or the amount of the undiscounted cash flows are recognized as an increase or decrease in the carrying amount of the liability arising from asset retirement obligations, and the corresponding amount is added to the carrying amount of the related asset or deducted up to a maximum of its carrying amount, with any excess then being recognized in results. When the asset reaches the end of its useful life, any change is immediately recognized in results. The actual costs incurred to settle asset retirement obligations are applied against liabilities. During the final settlement of such an obligation, the difference between the balance of the obligation and the actual cost incurred is recognized as a gain or a loss in results.
The cash flows required to settle asset retirement obligations are estimated on the basis of studies that use various assumptions concerning the methods and timing to be adopted for the retirement. Hydro-Québec periodically reviews the measurement of these obligations in light of the underlying assumptions and estimates, potential technological advances, and changes in applicable standards, laws and regulations.
AGREEMENTS WITH LOCAL COMMUNITIES
Hydro-Québec has entered into various agreements with the local communities concerned by certain investment projects. The amounts under these agreements are recognized in Long-term debt if they fall within the definition of a liability, and the offsetting item is recognized in Property, plant and equipment. The recognized amounts are determined by discounting the future cash flows related to these agreements. The discount rate used is the interest rate on Hydro-Québec bonds at the date of initial recognition. Subsequently, in the case of agreements with indexed cash flows, the cash flows are subject to an annual re-estimate that can result in a change in the discount rate.
RELATED PARTY TRANSACTIONS
In the normal course of business, Hydro-Québec sells electricity and enters into other business transactions with its sole shareholder, the Québec government, and its agencies, as well as with other government corporations. These transactions are measured at the exchange amount.
In addition, as a government corporation, Hydro-Québec provides the Québec government with financial data prepared in accordance with International Financial Reporting Standards so that it can prepare its consolidated financial statements.
- 55 -
| Note 2 | Changes to Accounting Policies |
RECENT CHANGES
Hedge accounting
On January 1, 2018, Hydro-Québec early adopted Accounting Standards Update (“ASU”) 2017-12, Derivatives and Hedging (Topic 815): Targeted Improvements to Accounting for Hedging Activities, issued by the Financial Accounting Standards Board (“FASB”). This ASU amends the requirements related to hedging relationships in order to simplify the application of hedge accounting and improve the transparency of information provided in the financial statements regarding an entity’s risk management activities.
ASU 2017-12 was applied on a modified retrospective basis. For cash flow hedging relationships, its adoption led to the nonrecognition of the ineffective portion of existing relationships in results. As at January 1, 2018, this change resulted in a $2-million increase in retained earnings and an equivalent decrease in accumulated other comprehensive income. Moreover, the ASU simplifies the application of hedge accounting for fair value hedges, which translated into a $31-million increase in long-term debt and an equivalent decrease in retained earnings. Prior-year figures have not been restated.
Statement of cash flows
On January 1, 2018, Hydro-Québec adopted ASU 2016-15, Statement of Cash Flows (Topic 230): Classification of Certain Cash Receipts and Cash Payments. This ASU clarifies how certain items are presented and classified in the statement of cash flows. It was applied on a full retrospective basis and did not have an impact on Hydro-Québec’s consolidated financial statements.
Financial instruments
On January 1, 2018, Hydro-Québec adopted ASU 2016-01, Financial Instruments—Overall (Subtopic 825-10): Recognition and Measurement of Financial Assets and Financial Liabilities. This ASU provides guidance on the recognition and measurement of financial assets and financial liabilities. It was applied on a modified retrospective basis and did not have an impact on Hydro-Québec’s consolidated financial statements.
Revenue
On January 1, 2018, Hydro-Québec adopted Accounting Standards Codification (“ASC”) 606, Revenue from Contracts with Customers. This ASC provides guidance on the recognition of revenue at the time that goods or services are transferred to a client, for an amount that reflects the payment which the entity expects to receive in exchange for the goods or services. ASC 606 was applied on a modified retrospective basis to contracts not yet completed as at January 1, 2018, and it did not have a material impact on Hydro-Québec’s consolidated financial statements.
Intangible assets
On September 1, 2018, Hydro-Québec early adopted ASU 2018-15, Intangibles—Goodwill and Other—Internal-Use Software (Subtopic 350-40): Customer’s Accounting for Implementation Costs Incurred in a Cloud Computing Arrangement That Is a Service Contract. This ASU specifies that an entity must apply the guidance for internally developed software to determine whether the implementation costs incurred in a cloud computing arrangement (hosting arrangement) that is a service contract must be recognized as an operational expenditure or deferred and amortized over the term of the arrangement. It was applied on a prospective basis and did not have a material impact on Hydro-Québec’s consolidated financial statements.
- 56 -
| NOTE 2 | Changes to Accounting Policies (continued) |
STANDARDS ISSUED BUT NOT YET ADOPTED
Leases
In February 2016, the FASB issued ASU 2016-02, Leases (Topic 842). This ASU provides guidance on lease definition, recognition and presentation and requires the recognition of assets and liabilities by lessees for all operating and finance leases with a term of more than 12 months.
In January 2018, the FASB issued ASU 2018-01, Leases (Topic 842): Land Easement Practical Expedient for Transition to Topic 842. This ASU provides a practical expedient to not evaluate under ASC 842, Leases, existing or expired easement agreements as at the date this standard is adopted, namely January 1, 2019, and which were not previously accounted for as leases under ASC 840, Leases. Furthermore, it requires that easement agreements be analyzed under ASC 842 before applying the guidance set forth in ASC 350, Intangibles—Goodwill and Other, to determine whether they meet the definition of a lease.
In July 2018, the FASB issued ASU 2018-11, Leases (Topic 842): Targeted Improvements. This ASU offers entities an additional transition method allowing the cumulative effect of initially applying ASC 842 to be recognized as an adjustment to the opening balance of retained earnings as at the adoption date of the standard, namely January 1, 2019. It also specifies that, under certain conditions, lessors may apply a practical expedient allowing them not to separate lease and nonlease components in a contract.
These ASUs will be applied on a modified retrospective basis to the financial statements for interim and annual periods beginning on or after January 1, 2019. Hydro-Québec intends to apply the practical expedient to not evaluate its easement agreements and maintain the classification for leases evaluated under ASC 840. It also plans to opt for the additional transition method proposed by ASU 2018-11. Hydro-Québec is completing its analysis and considers that the adoption of these ASUs will lead to an immaterial increase in assets and liabilities as at January 1, 2019.
Financial instruments
In June 2016, the FASB issued ASU 2016-13, Financial Instruments—Credit Losses (Topic 326): Measurement of Credit Losses on Financial Instruments. This ASU provides new guidance on the impairment of financial assets that are not accounted for at fair value in results. It will be applied on a modified retrospective basis to the financial statements for interim and annual periods beginning on or after January 1, 2021. Hydro-Québec is currently examining the impact of this ASU on its consolidated financial statements.
- 57 -
RATES
Transmission
Hydro-Québec’s power transmission rates for 2018, 2017 and 2016 were determined in Régie decisions D-2018-035, D-2017-049 and D-2016-046, effective January 1, 2018, January 1, 2017 and January 1, 2016, respectively. The authorized return on the rate base was set at 7.0% in 2018, 6.80% in 2017 and 6.85% in 2016, assuming a capitalization with 30% equity.
Distribution
Hydro-Québec’s electricity rates for the rate years beginning on April 1, 2018, April 1, 2017 and April 1, 2016, respectively, were determined in decisions D-2018-030, D-2017-034 and D-2016-047, in which the Régie authorized increases of 0.3% in 2018, 0.7% in 2017 and 0.7% in 2016 for all rates except Rate L, which remained unchanged in 2018 and 2016, but for which an increase of 0.2% was authorized in 2017. The authorized return on the rate base was set at 7.08% in 2018, 6.90% in 2017 and 6.95% in 2016, assuming a capitalization with 35% equity.
The following information describes the impact on the consolidated financial statements of the regulatory accounting policies and practices adopted by Hydro-Québec in accordance with the Régie’s decisions with respect to its rate-regulated activities.
REGULATORY ASSETS AND LIABILITIES
| | | | | | | | | | | | |
| | | Expected years of
amortization | | | 2018 | | | 2017 | |
Regulatory assets | | | | | | | | | | | | |
Employee future benefits | | | As of 2019 | | | | 2,880 | | | | 3,667 | |
Costs related to a suspension agreement | | | 2019–2022 | | | | 473 | | | | 482 | |
Costs related to energy efficiency initiatives | | | 2019–2028 | | | | 472 | | | | 572 | |
Costs related to the project involving the replacement of PK type circuit breakers | | | 2019–2021 | | | | 76 | | | | 99 | |
Variances related to electricity suppliesa | | | 2019 | | | | 37 | | | | – | |
Variances in pension costa | | | 2019–2020 | | | | 12 | | | | 2 | |
Revenue variances related to climate conditionsa | | | | | | | – | | | | 3 | |
Other | | | 2019–2047 | | | | 116 | | | | 55 | |
| | | | | | | | 4,066 | | | | 4,880 | |
Less | | | | | | | | | | | | |
Current portion | | | | | | | 203 | | | | 133 | |
| | | | | | | | 3,863 | | | | 4,747 | |
Regulatory liabilities | | | | | | | | | | | | |
Depreciation of property, plant and equipment | | | 2019–2115 | | | | 375 | | | | 351 | |
Revenue variances related to climate conditionsa | | | 2019–2024 | | | | 179 | | | | 4 | |
Earnings variances to be shared with customersa | | | 2019–2020 | | | | 167 | | | | 45 | |
Variances related to amendments to ASC 715, Compensation—Retirement Benefitsa | | | 2019 | | | | 6 | | | | 42 | |
Variances related to electricity suppliesa | | | 2020 | | | | 4 | | | | 40 | |
Variances in pension costa | | | 2020 | | | | 2 | | | | 40 | |
Other | | | 2019–2022 | | | | 61 | | | | 34 | |
| | | | | | | | 794 | | | | 556 | |
Less | | | | | | | | | | | | |
Current portion | | | | | | | 80 | | | | 78 | |
| | | | | | | | 714 | | | | 478 | |
| a) | The offsetting item is recognized under Revenue in the consolidated statements of operations. |
Regulatory assets and liabilities are not included in the rate base, except in the case of costs related to energy efficiency initiatives.
- 58 -
| Note 3 | Regulation (continued) |
Employee future benefits
The unamortized balances of net actuarial losses and of past service costs (credits) to be recovered in future rates are recognized as a non-interest-bearing regulatory asset, which is amortized when the unamortized balances are reclassified as a cost component of employee future benefits.
Costs related to a suspension agreement
The Régie authorized an agreement regarding the temporary suspension of deliveries from a generating station in 2014. The offsetting entry for the financial liability recorded for this agreement was recognized as a non-interest-bearing regulatory asset, and the adjustments related to subsequent changes in this liability are also recognized in this asset. The costs related to the suspension agreement are recovered in the rates on an annual basis, according to the amounts billed.
Costs related to energy efficiency initiatives
Eligible costs incurred with regard to energy efficiency initiatives are recognized as a regulatory asset and bear interest at the rate of return authorized by the Régie on the rate base until such time as they are included in the rate base and amortization begins.
Costs related to the project involving the replacement of PK type circuit breakers
The eligible expenses incurred as of April 11, 2016, as part of the project involving the replacement of PK type circuit breakers are recognized as a regulatory asset and bear interest at the rates prescribed by the Régie.
Variances related to electricity supplies
Variances in volume and price between actual electricity supplies and those forecast in rate filings and recognized by the Régie for electricity rate-setting purposes are accounted for as a regulatory asset or a regulatory liability, as the case may be. These variances result from climate conditions, among other things. They bear interest at the rates prescribed by the Régie until such time as amortization begins.
Variances in pension cost
Variances between the pension cost recognized and the cost forecast in the rate filings for power transmission and distribution rate-setting purposes are recognized as a regulatory asset or a regulatory liability, as the case may be. They bear interest at the rates prescribed by the Régie until such time as amortization begins.
Revenue variances related to climate conditions
Variances between the Distributor’s actual transmission and distribution revenue and the forecast revenue in rate filings, which is based on climate normals, are recognized as a regulatory asset or a regulatory liability, as the case may be. They bear interest at the rates prescribed by the Régie until such time as amortization begins.
Depreciation of property, plant and equipment
Prior to July 10, 2015, the useful life of property, plant and equipment was limited to 50 years for rate-setting purposes. Since then, this limit no longer applies, provided that the weighted average useful life of all property, plant and equipment of the Transmission Provider, on the one hand, and of the Distributor, on the other hand, does not exceed 50 years. The differences in the depreciation expense resulting from the application of useful lives limited to 50 years for rate-setting purposes until July 9, 2015, were recognized as a non-interest-bearing regulatory liability and are amortized at the same rate as the property, plant and equipment concerned.
Earnings variances to be shared with customers
An earnings-sharing mechanism applied since 2017 provides for earnings variances to be shared with customers. Under this mechanism, any return in excess of the authorized returns of the Transmission Provider and the Distributor is shared equally with customers for the first 100 basis points and is split 75/25 in their favor for any portion of the variance exceeding 100 basis points. These amounts bear interest at the rates prescribed by the Régie until such time as amortization begins.
Variances related to amendments to ASC 715, Compensation—Retirement Benefits
Variances arising from the application by the Transmission Provider and the Distributor of amendments to ASC 715, Compensation—Retirement Benefits, early adopted by Hydro-Québec on January 1, 2017, are recognized as a regulatory liability. Such amounts bear interest at the rates prescribed by the Régie until such time as amortization begins.
- 59 -
| Note 3 | Regulation (continued) |
OTHER REGULATORY PRACTICES
The compensation granted by the Québec government for the 1998 ice storm was applied against the cost of newly constructed property, plant and equipment. It is amortized over the remaining useful life of the retired assets, using the straight-line method of depreciation.
Financial expenses are capitalized in property, plant and equipment under construction related to rate-regulated activities according to the authorized rates of return on the rate bases. Set using methods approved by the Régie, these rates take into account a component associated with the cost of the debt and a component associated with the return on equity. The component associated with return on equity totaled $56 million in 2018 and $53 million in 2017.
The cost of dismantling retired and replaced transmission assets for which no asset retirement obligation was recognized is added, net of the salvage value, to the cost of the newly constructed assets. The cost of restoring sites associated with replaced assets is also added to the cost of newly constructed assets.
Finally, contributions received for relocation or modification projects relating to certain transmission grid assets are recorded in a separate account and applied against property, plant and equipment. These contributions are amortized over the average useful life of assets for each project, using the straight-line method.
- 60 -
| Note 4 | Depreciation and Amortization |
| | | | | | | | | | | | |
| | | | |
| | | 2018 | | | 2017 | | | 2016 | |
| | | |
Property, plant and equipment | | | 2,299 | | | | 2,226 | | | | 2,209 | |
Intangible assetsa | | | 121 | | | | 175 | | | | 178 | |
Regulatory assets and liabilities | | | 198 | | | | 176 | | | | 120 | |
Retirement of capital assets | | | 67 | | | | 109 | | | | 90 | |
| | | | 2,685 | | | | 2,686 | | | | 2,597 | |
| a) | For the period from 2019 to 2023, amortization of intangible assets that have already been recognized should be as follows: $90 million in 2019, $62 million in 2020, $41 million in 2021, $22 million in 2022 and $16 million in 2023. |
| | | | | | | | | | | | |
| | | | |
| | | 2018 | | | 2017 | | | 2016 | |
| | | |
Water-power royaltiesa | | | 705 | | | | 701 | | | | 673 | |
Public utilities taxb | | | 298 | | | | 284 | | | | 284 | |
Municipal, school and other taxesc | | | 108 | | | | 91 | | | | 88 | |
| | | | 1,111 | | | | 1,076 | | | | 1,045 | |
| a) | Water-power royalties payable to the Québec government totaled $699 million in 2018 ($695 million in 2017 and $667 million in 2016), including a balance due of $5 million as at December 31, 2018 ($83 million as at December 31, 2017 and $68 million as at December 31, 2016). |
| b) | The public utilities tax is payable to the Québec government. |
| c) | Including two amounts payable to the Québec government in 2018, namely $53 million under the Act respecting Transition énergétique Québec ($36 million in 2017 and $36 million in 2016 under the Act respecting energy efficiency and innovation), of which a balance of $2 million was outstanding as at December 31, 2018 (nil as at December 31, 2017 and 2016), and $15 million under the Act to establish the Northern Plan Fund ($15 million in 2017 and 2016), which was outstanding as at December 31, 2018, 2017 and 2016. |
| | | | | | | | | | | | |
| | | | |
| | | 2018 | | | 2017 | | | 2016 | |
| | | |
Interest on debt securities | | | 2,741 | | | | 2,532 | | | | 2,510 | |
Net exchange (gain) loss | | | (6 | ) | | | 10 | | | | 32 | |
Guarantee fees related to debt securitiesa | | | 215 | | | | 217 | | | | 218 | |
| | | | 2,950 | | | | 2,759 | | | | 2,760 | |
Less | | | | | | | | | | | | |
Capitalized financial expenses | | | 169 | | | | 203 | | | | 194 | |
Net investment income | | | 69 | | | | 43 | | | | 34 | |
| | | | 238 | | | | 246 | | | | 228 | |
| | | | 2,712 | | | | 2,513 | | | | 2,532 | |
| a) | Guarantee fees related to debt securities are charged at a rate of 0.5% and are paid to the Québec government. |
- 61 -
| Note 7 | Property, Plant and Equipment |
| | | | | | | | | | | | | | | | |
| | | | | | | | | | | | 2018 | |
| | | In service | | | Accumulated
depreciation | | | Under
construction | | | Net carrying
amount | |
Generation | | | | | | | | | | | | | | | | |
Hydraulic | | | 48,254 | | | | 18,894 | | | | 1,329 | | | | 30,689 | |
Other | | | 1,180 | | | | 835 | | | | 41 | | | | 386 | |
| | | | 49,434 | | | | 19,729 | | | | 1,370 | | | | 31,075 | |
Transmission | | | | | | | | | | | | | | | | |
Substations and lines | | | 32,761 | | | | 12,718 | | | | 1,828 | | | | 21,871 | |
Other | | | 2,636 | | | | 1,553 | | | | 127 | | | | 1,210 | |
| | | | 35,397 | | | | 14,271 | | | | 1,955 | | | | 23,081 | |
Distribution | | | | | | | | | | | | | | | | |
Substations and lines | | | 15,039 | | | | 7,044 | | | | 366 | | | | 8,361 | |
Other | | | 3,563 | | | | 1,916 | | | | 113 | | | | 1,760 | |
| | | | 18,602 | | | | 8,960 | | | | 479 | | | | 10,121 | |
Other | | | 1,455 | | | | 870 | | | | 104 | | | | 689 | |
| | | | 104,888 | a | | | 43,830 | a | | | 3,908 | | | | 64,966 | |
| | | | | | | | | | | | | | | | |
| | | | | | | | | | | | | | | | |
| | | | | | | | | | | | 2017 | |
| | | In service | | | Accumulated
depreciation | | | Under
construction | | | Net carrying
amount | |
Generation | | | | | | | | | | | | | | | | |
Hydraulic | | | 47,957 | | | | 18,154 | | | | 917 | | | | 30,720 | |
Other | | | 1,207 | | | | 862 | | | | 23 | | | | 368 | |
| | | | 49,164 | | | | 19,016 | | | | 940 | | | | 31,088 | |
Transmission | | | | | | | | | | | | | | | | |
Substations and lines | | | 31,587 | | | | 12,172 | | | | 1,699 | | | | 21,114 | |
Other | | | 2,557 | | | | 1,485 | | | | 98 | | | | 1,170 | |
| | | | 34,144 | | | | 13,657 | | | | 1,797 | | | | 22,284 | |
Distribution | | | | | | | | | | | | | | | | |
Substations and lines | | | 14,612 | | | | 6,760 | | | | 361 | | | | 8,213 | |
Other | | | 3,490 | | | | 1,822 | | | | 100 | | | | 1,768 | |
| | | | 18,102 | | | | 8,582 | | | | 461 | | | | 9,981 | |
Other | | | 1,375 | | | | 868 | | | | 130 | | | | 637 | |
| | | | 102,785 | a | | | 42,123 | a | | | 3,328 | | | | 63,990 | |
| a) | As at December 31, 2018, the cost and accumulated depreciation of property, plant and equipment in service under capital leases amounted to $1,034 million and $250 million, respectively ($896 million and $205 million as at December 31, 2017). |
- 62 -
| | | | | | | | | | | | | | | | | | | | | | | | |
| | | 2018 | | | 2017 | |
| | | Cost | | | Accumulated
amortization | | | Net carrying
amount | | | Cost | | | Accumulated
amortization | | | Net carrying
amount | |
Amortizable | | | | | | | | | | | | | | | | | | | | | | | | |
Software, licences and other | | | 2,051 | | | | 1,658 | | | | 393 | | | | 1,972 | | | | 1,571 | | | | 401 | |
Unamortizable | | | | | | | | | | | | | | | | | | | | | | | | |
Easements and other | | | | | | | | | | | 484 | | | | | | | | | | | | 470 | |
| | | | | | | | | | | | 877 | | | | | | | | | | | | 871 | |
Additions consisting of internally developed software totaled $90 million in 2018 ($87 million in 2017 and $81 million in 2016).
| | | | | | | | |
| | | 2018 | | | 2017 | |
At equity | | | | | | | | |
Société en commandite Hydroélectrique Manicouagan (60.0%)a, b | | | 594 | | | | 601 | |
Churchill Falls (Labrador) Corporation Limited (34.2%)b | | | 278 | | | | 264 | |
TM4 Inc. (45% in 2018, 100% in 2017) | | | 135 | | | | – | |
| | | | 1,007 | | | | 865 | |
Other | | | 15 | | | | 25 | |
| | | | 1,022 | | | | 890 | |
| a) | This investment includes the unamortized excess of the purchase price over the underlying net carrying amount of the assets of Société en commandite Hydroélectrique Manicouagan (“SCHM”) as at the acquisition date, which consisted of unamortizable intangible assets of $282 million and amortizable assets of $241 million as at December 31, 2018 (respectively, $282 million and $252 million as at December 31, 2017). |
| b) | In 2018, electricity purchases from SCHM and Churchill Falls (Labrador) Corporation Limited [“CF(L)Co”] totaled $81 million and $97 million, respectively ($81 million and $96 million in 2017 and $103 million and $81 million in 2016). |
PARTIAL SALE OF A SUBSIDIARY
On June 22, 2018, Hydro-Québec sold 55% of the shares of its subsidiary TM4 Inc. (“TM4”) to an independent third party for a cash consideration of $165 million. As a result of this transaction, Hydro-Québec ceased to consolidate TM4, and the 45% interest retained was measured at fair value. A $277-million gain on the partial sale of TM4, including $125 million resulting from the fair value measurement of the interest retained, was recognized in Revenue. The investment in TM4 is now accounted for using the equity method.
| | | | | | | | | | |
| | | Notes | | 2018 | | | 2017 | |
Sinking funda | | 12 | | | 650 | | | | 605 | |
Government reimbursement for the 1998 ice stormb | | 15 | | | – | | | | 66 | |
Other | | | | | 19 | | | | 15 | |
| | | | | | 669 | | | | 686 | |
| a) | The sinking fund, allocated to repaying the long-term debt, consists of bonds issued by the Québec government, including primarily long-term bonds maturing in 2021 and 2026 as well as short-term bonds presented in Short-term investments, which totaled $75 million as at December 31, 2018 ($126 million as at December 31, 2017). In 2018, short-term investments in this fund were replaced by long-term bonds of $50 million ($605 million in 2017). |
| b) | Since the Québec government will pay the full amount no later than October 15, 2019, the reimbursement was reclassified as a current asset in Accounts receivable and other receivables as at December 31, 2018. |
- 63 -
| Note 11 | Asset Retirement Obligations |
Liabilities arising from asset retirement obligations relate to the costs of dismantling the Gentilly-2 facilities, the removal of spent nuclear fuel resulting from their operation, and the dismantling of thermal generating stations and certain fuel tanks and transmission substations.
The aggregate carrying amount of the asset retirement obligations is as follows:
| | | | | | | | | | | | | | | | |
| | | 2018 | |
| | | Dismantling of Gentilly-2 facilitiesa | | | Removal of spent nuclear fuela | | | Dismantling of other assets | | | Total | |
Balance, beginning of year | | | 463 | | | | 261 | | | | 140 | | | | 864 | |
Liabilities incurred | | | – | | | | – | | | | 12 | | | | 12 | |
Accretion expense | | | 25 | | | | 16 | | | | 4 | | | | 45 | |
Liabilities settled | | | (25) | | | | (1) | | | | (9 | ) | | | (35 | ) |
Revision of estimated cash flows and expected timing of payments | | | – | | | | (17) | | | | 4 | | | | (13 | ) |
Balance, end of year | | | 463 | | | | 259 | | | | 151 | | | | 873 | |
Less | | | | | | | | | | | | | | | | |
Current portion | | | 48 | | | | 5 | | | | 9 | | | | 62 | |
| | | | 415 | | | | 254 | | | | 142 | | | | 811 | |
| | | | | | | | | | | | | | | | |
| | | | | | | | | | | | | | | | |
| | | 2017 | |
| | | Dismantling of Gentilly-2 facilitiesa | | | Removal of spent nuclear fuela | | | Dismantling of other assets | | | Total | |
Balance, beginning of year | | | 468 | | | | 248 | | | | 144 | | | | 860 | |
Liabilities incurred | | | – | | | | – | | | | 14 | | | | 14 | |
Accretion expense | | | 25 | | | | 15 | | | | 4 | | | | 44 | |
Liabilities settled | | | (30) | | | | (2) | | | | (24 | ) | | | (56 | ) |
Revision of estimated cash flows and expected timing of payments | | | – | | | | – | | | | 2 | | | | 2 | |
Balance, end of year | | | 463 | | | | 261 | | | | 140 | | | | 864 | |
Less | | | | | | | | | | | | | | | | |
Current portion | | | 41 | | | | 8 | | | | 16 | | | | 65 | |
| | | | 422 | | | | 253 | | | | 124 | | | | 799 | |
| a) | The Canadian Nuclear Safety Commission requires a financial guarantee to secure performance of Hydro-Québec’s obligations with regard to the cost of dismantling the Gentilly-2 facilities and the removal of spent nuclear fuel. This guarantee consists of investments held by the Hydro-Québec Trust for Management of Nuclear Fuel Waste, as well as an irrevocable financial guarantee of up to $685 million from the Québec government. |
The following table presents the discount rates used to determine the carrying amount of the asset retirement obligations, which correspond to the credit-adjusted risk-free rates:
| | | | | | | | | | | | |
| % | | Dismantling of
Gentilly-2 facilities | | | Removal of spent nuclear fuel | | | Dismantling of other assets | |
Initial recognition of obligations Subsequent recognition of obligations | |
| 6.4
Between 4.3 and 5.7 |
| |
| 6.4
Between 3.1 and 5.7 |
| |
| Between 1.1 and 4.6
Between 0.8 and 4.6 |
|
- 63 -
| Note 11 | Asset Retirement Obligations (continued) |
HYDRO-QUÉBEC TRUST FOR MANAGEMENT OF NUCLEAR FUEL WASTE
Under the Nuclear Fuel Waste Act (“NFWA”), which came into force in 2002, the owners of nuclear fuel waste in Canada were required to set up a management organization, the Nuclear Waste Management Organization, and each of them was required to establish a trust fund to finance the cost of long-term management of its nuclear fuel waste.
In April 2009, the Government of Canada approved a formula for financing the costs of the approach adopted for long-term nuclear fuel waste management. The amounts deposited in the trust funds can only be used to finance the implementation of this approach.
Hydro-Québec has made all the payments required under the NFWA. As at December 31, 2018, the investments held in the Hydro-Québec trust fund were composed of debt securities issued by Hydro-Québec, the fair value of which totaled $167 million ($163 million as at December 31, 2017).
The Hydro-Québec Trust for Management of Nuclear Fuel Waste is considered a variable interest entity of which Hydro-Québec is the primary beneficiary.
Long-term debt is mainly composed of bonds, medium-term notes and other debts, including liabilities under agreements entered into with local communities. The following table presents a breakdown of the debt, including the current portion, at amortized cost, by currency at the time of issue and at the time of repayment. Currency swaps traded for purposes of managing currency risk related to long-term debt were taken into account in determining the percentages of debt by currency at the time of repayment.
| | | | | | | | | | | | | | | | | | | | | | | | | | | | | | | | |
| | | 2018 | | | 2017 | |
| | | | |
| | | At time of issue | | | At time of
repayment | | | At time of issue | | | At time of
repayment | |
| | | | | | | | |
| | | In
Canadian
dollars
and other
currencies | | | At closing
exchange
rates as at
the
balance
sheet date | | | % | | | % | | | In
Canadian
dollars
and other
currencies | | | At closing
exchange
rates as at
the
balance
sheet date | | | % | | | % | |
| | | | | | | | |
Canadian dollarsa, b | | | 38,016 | | | | 38,016 | | | | 83 | | | | 100 | | | | 37,607 | | | | 37,607 | | | | 84 | | | | 100 | |
U.S. dollars | | | 5,707 | | | | 7,789 | | | | 17 | | | | – | | | | 5,704 | | | | 7,142 | | | | 16 | | | | – | |
| | | | | | | | 45,805 | | | | 100 | | | | 100 | | | | | | | | 44,749 | | | | 100 | | | | 100 | |
Plus | | | | | | | | | | | | | | | | | | | | | | | | | | | | | | | | |
Adjustment for fair value hedged risk | | | | | | | 256 | | | | | | | | | | | | | | | | 259 | | | | | | | | | |
| | | | | | | | 46,061 | | | | | | | | | | | | | | | | 45,008 | | | | | | | | | |
Less | | | | | | | | | | | | | | | | | | | | | | | | | | | | | | | | |
Current portion | | | | | | | 3,151 | | | | | | | | | | | | | | | | 1,183 | | | | | | | | | |
| | | | | | | | 42,910 | | | | | | | | | | | | | | | | 43,825 | | | | | | | | | |
| a) | Including non-interest-bearing debts other than bonds and medium-term notes whose present value was $1,543 million as at December 31, 2018 ($1,482 million as at December 31, 2017). |
| b) | Certain debts carry sinking fund requirements. This fund, presented in Short-term investments and Other assets, totaled $725 million as at December 31, 2018 ($731 million as at December 31, 2017). |
- 65 -
| Note 12 | Long-Term Debt (continued) |
The amortized cost, at the balance sheet date, of the tranches of long-term debt maturing over the 2019–2023 period is as follows: $3,151 million in 2019, $2,256 million in 2020, $2,426 million in 2021, $3,407 million in 2022 and $7 million in 2023.
INTEREST RATES
The following table presents interest rates on bonds and medium-term notes, which take into account contractual rates, premiums, discounts and issue expenses, as well as the effect of forward contracts and swaps traded to manage long-term risks related to debt. As at December 31, 2018, the variable-rate portion of the bonds and notes totaled 9.3% (12.0% as at December 31, 2017).
| | | | | | | | | | | | | | | | |
% | | | 2018 | | | | 2017 | |
Maturity | |
| Canadian
dollars |
| |
| U.S.
dollars |
| |
| Weighted
average |
| |
| Weighted
average |
|
| | | | |
1–5 years | | | 9.10 | | | | 9.03 | | | | 9.08 | | | | 8.29 | |
6–10 years | | | 4.49 | | | | 8.30 | | | | 8.20 | | | | 8.24 | |
11–15 years | | | 5.42 | | | | 10.07 | | | | 8.31 | | | | 7.62 | |
16–20 years | | | 5.93 | | | | – | | | | 5.93 | | | | 5.63 | |
21–25 years | | | 5.11 | | | | – | | | | 5.11 | | | | 5.11 | |
26–30 years | | | 4.89 | | | | – | | | | 4.89 | | | | 4.89 | |
31–35 years | | | 4.47 | | | | – | | | | 4.47 | | | | 4.47 | |
36–40 years | | | 3.28 | | | | – | | | | 3.28 | | | | 3.46 | |
41–45 years | | | 6.53 | | | | – | | | | 6.53 | | | | 6.53 | |
| | | | |
Weighted average | | | 4.83 | | | | 9.32 | | | | 5.08 | | | | 5.22 | |
CREDIT FACILITY AND LINES OF CREDIT
Hydro-Québec has an undrawn credit facility of US$2,000 million, including a US$750-million swing loan, which will expire in 2023. Any related debt securities will bear interest at a rate based on the London Interbank Offered Rate (“LIBOR”), except for the swing loan, which is at the U.S. base rate. Hydro-Québec also has access to operating lines of credit, which are renewed automatically in the absence of notice to the contrary and bear interest at the prime rate. As at December 31, 2018, the available balances on these lines of credit were US$200 million and $276 million in Canadian or U.S. dollars (US$200 million and $243 million in Canadian or U.S. dollars as at December 31, 2017).
| | | | | | | | | | | | | | |
| | | | | Note | | | | 2018 | | | 2017 | |
| | | | | |
Employee future benefit liabilities | | | | 18 | | | | | 1,726 | | | | 3,127 | |
| Accounts payable | | | | | | | | 493 | | | 522 | |
| | | | | | | | | | 2,219 | | | | 3,649 | |
Accounts payable include a $354-million financial liability ($358 million as at December 31, 2017) related to an agreement regarding the temporary suspension of deliveries from a generating station. The current portion, presented under Accounts payable and accrued liabilities, totaled $119 million as at December 31, 2018 ($124 million as at December 31, 2017). This financial liability, including the current portion, represented a discounted amount of $473 million as at December 31, 2018 ($482 million as at December 31, 2017). It included an outstanding amount, payable in U.S. dollars, of $25 million (US$19 million) as at December 31, 2018 ($24 million, or US$20 million, as at December 31, 2017). As at December 31, 2018, the effective rate of this liability was 1.85% (1.35% as at December 31, 2017).
- 66 -
Perpetual notes in the amount of $274 million (US$201 million) as at December 31, 2018, and of $251 million (US$201 million) as at December 31, 2017, bear interest at LIBOR, plus 0.0625%, as calculated semiannually. As at December 31, 2018 and 2017, the rates applicable to the perpetual notes were 2.7% and 1.6%, respectively.
The perpetual notes are redeemable at Hydro-Québec’s option. In 2018, no tranche was redeemed. In 2017, a tranche of $23 million (US$17 million) was redeemed on the secondary market and then canceled. Forward contracts are used to mitigate the currency risk associated with the perpetual debt.
| Note 15 | Financial Instruments |
In the course of its operations, Hydro-Québec carries out transactions that expose it to certain financial risks, such as market, liquidity and credit risk. Exposure to such risks and the impact on results are reduced through careful monitoring and implementation of strategies that include the use of derivative instruments.
MARKET RISK
Market risk is the risk that the fair value or future cash flows of a financial instrument will fluctuate as a result of changes in market prices. Hydro-Québec is exposed to three main types of market risk: currency risk, interest rate risk and risk associated with energy and aluminum prices. Active integrated management of these three types of risk aims to limit exposure to each risk and reduce their overall impact on results.
MANAGEMENT OF LONG-TERM RISK
Management of risk associated with debt
Currency risk and interest rate risk – Hydro-Québec uses forward contracts and currency swaps to manage the currency risk associated with long-term debt and perpetual debt, as well as forward contracts and interest rate swaps to modify long-term exposure to interest rate risk. When designated as hedging items, these derivative instruments are recognized as cash flow hedges or fair value hedges, depending on the risk hedged. The impact on results of foreign currency hedging transactions and those associated with debt interest rates is recognized in Financial expenses.
The following table presents the notional amounts, expressed in Canadian dollars and foreign currencies, of forward contracts and swaps used to manage long-term risk:
| | | | | | | | |
| | | |
| | | 2018a | | | 2017a | |
| | |
Forward contracts | | | | | | | | |
Canadian dollars | | | (1,000 | ) | | | (70 | ) |
U.S. dollars | | | 204 | | | | 202 | |
| | |
Swaps | | | | | | | | |
Canadian dollars | | | (6,844 | ) | | | (6,938 | ) |
U.S. dollars | | | 5,730 | | | | 5,730 | |
| a) | Figures in parentheses represent amounts to be paid. |
MANAGEMENT OF SHORT-TERM RISK
Currency risk – Hydro-Québec uses forward contracts to manage its foreign currency risk exposure over the short term. When designated as hedging items, these derivative instruments are recognized as cash flow hedges. The impact of currency risk hedging transactions on results is recognized in the line item affected by the hedged item, namely Revenue, Electricity and fuel purchases, or Financial expenses. In this context, Hydro-Québec traded foreign currency sales contracts for which the notional amount of open positions as at December 31, 2018, totaled US$1,800 million (US$885 million as at December 31, 2017).
Interest rate risk – Hydro-Québec uses forward rate agreements and interest rate swaps to manage short-term interest rate risk. When designated as hedging items, these derivative instruments are recognized as cash flow hedges. The impact on results of transactions to hedge short-term interest rate risk is recognized in the line item affected by the hedged item, namely Financial expenses.
- 67 -
| Note 15 | Financial Instruments (continued) |
Price risk – Hydro-Québec uses mainly commodity futures and swaps to manage risk resulting from fluctuations in energy and aluminum prices. When designated as hedging items, these derivative instruments are recognized as cash flow hedges. The impact on results of transactions to hedge the risk related to energy and aluminum prices is recognized in the line item affected by the hedged item, namely Revenue or Electricity and fuel purchases. In this context, Hydro-Québec traded electricity futures and swaps for which open positions as at December 31, 2018, totaled 23.2 TWh (22.5 TWh as at December 31, 2017), natural gas futures for which open positions as at December 31, 2018, totaled 0.4 million MMBtu (0.5 million MMBtu as at December 31, 2017), petroleum product swaps for which open positions as at December 31, 2018, totaled 9.1 million litres (no open positions as at December 31, 2017), as well as aluminum swaps for which open positions as at December 31, 2018, totaled 240,825 tonnes (410,125 tonnes as at December 31, 2017).
LIQUIDITY RISK
Liquidity risk is the risk that an entity will encounter difficulty in meeting obligations associated with its financial liabilities.
Hydro-Québec’s exposure to this risk is reduced by significant cash flows from operating activities; a diversified portfolio of highly liquid or readily convertible instruments traded with high-quality counterparties; preauthorized sources of financing; the ability to access capital markets; the diversification of financing sources; and management of the volume of floating-rate debt and debt repayable in foreign currency.
Moreover, as at December 31, 2018, $43,971 million in long-term debt, perpetual debt and borrowings, net of the sinking fund ($42,942 million as at December 31, 2017) was guaranteed by the Québec government.
CREDIT RISK
Credit risk is the risk that one party to a financial asset will fail to meet its obligations.
Hydro-Québec is exposed to credit risk related to accounts receivable and other receivables, which arises primarily from its day-to-day electricity sales in and outside Québec. It is also exposed to credit risk related to cash and cash equivalents, short-term investments and the sinking fund, as well as to derivative instruments traded with financial institutions. Credit risk is limited to the carrying amount of the related assets presented on the balance sheet, which approximates fair value.
Accounts receivable and other receivables
Exposure to credit risk from electricity sales is limited due to Hydro-Québec’s large and diverse customer base. Management believes that Hydro-Québec is not exposed to a significant credit risk, particularly because sales in Québec are billed at rates that allow for recovery of costs based on the terms and conditions set by the Régie. Moreover, Hydro-Québec holds as collateral customer deposits totaling $132 million ($124 million as at December 31, 2017), of which $46 million ($35 million as at December 31, 2017) is recognized in Accounts payable and accrued liabilities and $86 million ($89 million as at December 31, 2017) in Other liabilities.
The value of accounts receivable and other receivables, net of the related allowance for doubtful accounts, is presented in the following table:
| | | | | | | | |
| | | 2018 | | | 2017 | |
| | |
Accounts receivablea | | | 2,124 | | | | 2,030 | |
Other receivablesb | | | 589 | c | | | 457 | |
| | | | 2,713 | d | | | 2,487 | d |
| a) | Including unbilled electricity deliveries, which totaled $1,390 million as at December 31, 2018 ($1,496 million as at December 31, 2017). |
| b) | Including a $139-million financial guarantee ($118 million in 2017) covering certain derivative instruments held at year end. |
| c) | Including the government reimbursement for the 1998 ice storm, which totaled $66 million as at December 31, 2018. The corresponding amount as at December 31, 2017, is presented in Other assets. |
| d) | Including US$255 million (US$284 million in 2017) translated at the exchange rate in effect at the balance sheet date. |
The allowance for doubtful accounts amounted to $241 million as at December 31, 2018 ($239 million as at December 31, 2017).
Other financial assets
In order to reduce its exposure to credit risk associated with cash and cash equivalents, short-term investments, the sinking fund and derivative instruments, Hydro-Québec deals with a number of issuers and financial institutions with high credit ratings, most of which are Canadian. In addition, it applies policies to limit risk concentration as well as various monitoring programs and sets credit limits for each counterparty. Through prior agreements, it can also limit the market value of the main derivative instrument portfolios. Any variation in market value beyond the agreed-upon limit results in a cash receipt or payment. As at December 31, 2018, substantially all counterparties dealing with Hydro-Québec had a credit rating of A or higher, and none of them had defaulted on their obligations to Hydro-Québec.
- 68 -
| Note 15 | Financial Instruments (continued) |
FAIR VALUE
FAIR VALUE OF DERIVATIVE INSTRUMENTS
The following tables present the fair value of derivative instruments by type and depending on whether they are designated as fair value hedges or cash flow hedges, or not designated as hedges:
| | | | | | | | | | | | | | | | | | |
| | | | | | | | | 2018 | | | |
| | | | | |
| | | Derivatives
designated as
fair value
hedges | | | Derivatives
designated as
cash flow
hedges | | | Derivatives not
designated as hedgesa | | | Gross amounts of derivatives recognizedb | | | |
| | | | | |
Assets | | | | | | | | | | | | | | | | | | |
Contracts – Currency risk | | | – | | | | 1,280 | | | | 14 | | | | 1,294 | | | |
Contracts – Interest rate risk | | | 372 | | | | 2 | | | | – | | | | 374 | | | |
Contracts – Price risk | | | – | | | | 159 | | | | 49 | | | | 208 | | | |
| | | | 372 | | | | 1,441 | | | | 63 | | | | 1,876 | | | |
| | | | | |
Liabilities | | | | | | | | | | | | | | | | | | |
Contracts – Currency risk | | | – | | | | (162 | ) | | | (116) | | | | (278) | | | |
Contracts – Interest rate risk | | | – | | | | (55 | ) | | | – | | | | (55) | | | |
Contracts – Price risk | | | – | | | | (104 | ) | | | (13) | | | | (117) | | | |
| | | | – | | | | (321 | ) | | | (129) | | | | (450) | | | |
Total | | | 372 | | | | 1,120 | | | | (66) | | | | 1,426 | | | |
| | | | | |
| | | | | | | | | | | | | | | | | | |
| | | | | | | | | 2017 | | | |
| | | | | |
| | | Derivatives
designated as
fair value
hedges | | | Derivatives
designated as
cash flow
hedges | | | Derivatives not designated as hedgesa | | | Gross amounts of derivatives recognizedb | | | |
| | | | | |
Assets | | | | | | | | | | | | | | | | | | |
Contracts – Currency risk | | | – | | | | 769 | | | | 51 | | | | 820 | | | |
Contracts – Interest rate risk | | | 420 | | | | 3 | | | | 2 | | | | 425 | | | |
Contracts – Price risk | | | – | | | | 8 | | | | 61 | | | | 69 | | | |
| | | | 420 | | | | 780 | | | | 114 | | | | 1,314 | | | |
| | | | | |
Liabilities | | | | | | | | | | | | | | | | | | |
Contracts – Currency risk | | | – | | | | (266 | ) | | | (251) | | | | (517) | | | |
Contracts – Interest rate risk | | | – | | | | – | | | | – | | | | – | | | |
Contracts – Price risk | | | – | | | | (267 | ) | | | (24) | | | | (291) | | | |
| | | | – | | | | (533 | ) | | | (275) | | | | (808) | | | |
Total | | | 420 | | | | 247 | | | | (161) | | | | 506 | | | |
| a) | These derivative instruments are mainly traded as part of Hydro-Québec’s risk management. As at December 31, 2018, $(116) million was in consideration of amounts received or disbursed [$(210) million as at December 31, 2017] with respect to agreements to limit the market value of the main portfolios of derivative instruments. These agreements arise from frameworks applied by Hydro-Québec to reduce its credit risk exposure and limit risk concentration. |
| b) | Fair value measurements of derivative instruments are Level 2 measurements. These measurements are obtained by discounting future cash flows, which are estimated on the basis of the spot rates, forward rates or forward prices (foreign exchange rates, interest rates, and energy or aluminum prices) in effect on the balance sheet date and take into account the credit risk assessment. The valuation techniques make use of observable market data. |
- 69 -
| Note 15 | Financial Instruments (continued) |
The impact of offsetting derivative instruments is presented in the table below:
| | | | | | | | | | | | | | | | | | | | | | | | | | | | | | | | |
| | | | | | 2018 | | | | | | 2017 | |
| | | Gross
amounts of
derivatives recognized | | | Gross
amounts offseta | | | Cash
(received)
paid as collateralb | | | Net amounts
presented on
the balance
sheet | | | Gross
amounts of
derivatives
recognized | | | Gross
amounts offseta | | | Cash
(received)
paid as collateralb | | | Net amounts
presented on
the balance
sheet | |
Assets | | | | | | | | | | | | | | | | | | | | | | | | | | | | | | | | |
Current | | | 217 | | | | (97) | | | | (48) | | | | 72 | | | | 143 | | | | (68) | | | | (6) | | | | 69 | |
Long-term | | | 1,659 | | | | (215) | | | | (1,323) | | | | 121 | | | | 1,171 | | | | (527) | | | | (625) | | | | 19 | |
| | | | 1,876 | | | | (312) | | | | (1,371) | | | | 193 | | | | 1,314 | | | | (595) | | | | (631) | | | | 88 | |
Liabilities | | | | | | | | | | | | | | | | | | | | | | | | | | | | | | | | |
Current | | | (350 | ) | | | 240 | | | | 30 | | | | (80 | ) | | | (509 | ) | | | 321 | | | | 1 | | | | (187 | ) |
Long-term | | | (100 | ) | | | 72 | | | | – | | | | (28 | ) | | | (299 | ) | | | 274 | | | | 3 | | | | (22 | ) |
| | | | (450 | ) | | | 312 | | | | 30 | | | | (108 | ) | | | (808 | ) | | | 595 | | | | 4 | | | | (209 | ) |
Total | | | 1,426 | | | | – | | | | (1,341) | | | | 85 | | | | 506 | | | | – | | | | (627) | | | | (121 | ) |
| a) | The gross amounts of derivatives offset are related to contracts traded according to International Swaps and Derivatives Association (“ISDA”) guidelines and constituting enforceable master netting arrangements. Such master netting arrangements apply to all derivative instrument contracts traded over the counter. |
| b) | Cash amounts offset are amounts received or paid under collateral exchange agreements signed in compliance with ISDA guidelines. |
Moreover, although certain derivatives cannot be offset for lack of enforceable master netting arrangements, margin calls may result in amounts received from or paid to clearing agents, based on the fair value of the instruments concerned. As at December 31, 2018, $129 million receivable from clearing agents in consideration of net cash payments was included in Accounts receivable and other receivables ($111 million as at December 31, 2017), while $10 million payable to clearing agents in consideration of net cash receipts was included in Accounts payable and accrued liabilities (nil as at December 31, 2017).
- 70 -
| Note 15 | Financial Instruments (continued) |
The impact of derivative instruments on results and other comprehensive income is presented in the tables below. It should be noted that most derivative instruments traded are designated as cash flow hedges or fair value hedges and therefore reduce the volatility of results. Derivative instruments which are not designated as hedges, but which nonetheless provide an economic hedge for at-risk opposite positions, also reduce the volatility of results. The sensitivity of results is thus limited to net exposure to unhedged risks.
| | | | | | | | | | | | | | | | | | | | |
| | | | | | | | | | | | | | | 2018 | |
| | | Losses (gains) on
derivatives designated
as fair value hedges | | | Losses (gains) on derivatives designated as cash flow hedges | | | Losses (gains)
on derivatives
not designated
as hedges | |
| | | Recognized in results | | | Recognized in Other
comprehensive incomea | | | Reclassified from Other
comprehensive income to results | | | Recognized
in results | |
Contracts – Currency risk | | | – | | | | (590 | ) | | | | | | | (651 | )b | | | (84 | ) |
Contracts – Interest rate risk | | | 40 | | | | 47 | | | | | | | | 4 | c | | | 1 | |
Contracts – Price risk | | | – | | | | (142 | ) | | | | | | | 177 | d | | | 24 | |
| | | | 40 | c, e | | | (685) | | | | | | | | (470 | )e | | | (59 | )e, f |
Impact of hedged items on results | | | (34 | ) | | | | | | | | | | | 472 | | | | 86 | |
| | | | | | | | | | | | | |
| | | | | | | | | | | | 2017 | |
| | | Losses (gains) on
derivatives designated
as fair value hedges | | | Losses (gains) on derivatives designated as cash flow hedges | | | Losses (gains)
on derivatives
not designated
as hedges | |
| | | Recognized in results | | | Effective portion
recognized
in Other
comprehensive income | | | Ineffective
portion
recognized
in results | | | Effective portion
reclassified
from Other
comprehensive
income to results | | | Recognized
in results | |
Contracts – Currency risk | | | – | | | | 473 | | | | (1 | )b | | | 443 | b | | | 29 | |
Contracts – Interest rate risk | | | 117 | | | | (6 | ) | | | – | | | | 3 | c | | | (5 | ) |
Contracts – Price risk | | | – | | | | 177 | | | | 10 | d | | | (73 | )d | | | (48 | ) |
| | | | 117 | c, e | | | 644 | | | | 9 | | | | 373 | e | | | (24 | )e, f |
Impact of hedged items on results | | | (113) | | | | | | | | | | | | (373 | ) | | | (36 | ) |
- 71 -
| Note 15 | Financial Instruments (continued) |
| | | | | | | | | | | | | | | | | | | | |
| | | 2016 | |
| | | |
| | | Losses (gains) on
derivatives designated
as fair value hedges | | | Losses (gains) on derivatives designated as cash flow hedges | | | Losses (gains)
on derivatives
not designated
as hedges | |
| | | | | |
| | | Recognized in results | | | Effective portion
recognized in Other
comprehensive
income | | | Ineffective
portion
recognized
in results | | | Effective portion
reclassified from Other
comprehensive
income to results | | | Recognized in results | |
| | | | | |
Contracts – Currency risk | | | – | | | | 428 | | | | (1 | )b | | | 272 | b | | | 133 | |
Contracts – Interest rate risk | | | 32 | | | | – | | | | – | | | | 3 | c | | | 1 | |
Contracts – Price risk | | | – | | | | (177 | ) | | | (4 | )d | | | (392 | )d | | | (47 | ) |
| | | | 32 | c, e | | | 251 | | | | (5 | ) | | | (117 | )e | | | 87 | e, f |
Impact of hedged items on results | | | (32 | ) | | | | | | | | | | | 117 | | | | (126 | ) |
| a) | Following the adoption of ASU 2017-12, the amounts for 2018 include the ineffective portion of the hedging relationships, which was previously presented in results. |
| b) | In 2018, no amount was recognized in Revenue [$(70) million in 2017 and $13 million in 2016], whereas $(651) million was recognized in Financial expenses ($512 million in 2017 and $258 million in 2016). |
| c) | These amounts were recognized in Financial expenses. |
| d) | These amounts were recognized in Revenue. |
| e) | In 2018, the items Revenue, Electricity and fuel purchases, and Financial expenses totaled $14,370 million, $2,167 million and $2,712 million, respectively ($13,468 million, $2,005 million and $2,513 million in 2017 and $13,339 million, $1,866 million and $2,532 million in 2016) |
| f) | These instruments are essentially related to integrated risk management transactions. The impact of these instruments on results is recognized in the line item affected by the managed risk. Therefore, in 2018, $41 million was recognized in Revenue [$(36) million in 2017 and $(49) million in 2016], $(9) million in Electricity and fuel purchases [$(14) million in 2017 and $(16) million in 2016] and $(91) million in Financial expenses ($26 million in 2017 and $152 million in 2016). |
In 2018, Hydro-Québec reclassified a net loss of $2 million from Accumulated other comprehensive income to results after having discontinued cash flow hedges (nil in 2017 and 2016).
As at December 31, 2018, Hydro-Québec estimated the net amount of losses presented in Accumulated other comprehensive income that would be reclassified to results in the next 12 months to be $13 million ($203 million as at December 31, 2017 and a net gain of $17 million as at December 31, 2016).
As at December 31, 2018, the maximum period during which Hydro-Québec hedged its exposure to the variability of cash flows related to anticipated transactions was three years (two years as at December 31, 2017 and 2016).
FAIR VALUE OF OTHER FINANCIAL INSTRUMENTS
Fair value measurements for other financial instruments are Level 2 measurements. Fair value is obtained by discounting future cash flows, based on rates observed on the balance sheet date for similar instruments traded on capital markets.
The fair value of cash equivalents, receivables – accounts receivable, other receivables and financial liabilities approximates their carrying amount because of the short-term nature of these financial instruments, except for the items presented in the table below:
| | | | | | | | | | | | | | | | |
| | | |
| | | 2018 | | | 2017 | |
| | | | |
| | | Carrying amount | | | Fair value | | | Carrying amount | | | Fair value | |
| | | | |
Long-term debta | | | 46,061 | b | | | 59,876 | | | | 45,008 | b | | | 61,271 | |
Perpetual debt | | | 274 | | | | 252 | | | | 251 | | | | 204 | |
| a) | Including the current portion. |
| b) | Including an amount of $2,000 million ($1,829 million in 2017) for debts subject to a fair value hedge, which resulted in an adjustment of $350 million ($359 million in 2017) in connection with the hedged risk for existing hedging relationships and of $(94) million [$(100) million in 2017] for discontinued relationships. |
- 72 -
SHARE CAPITAL
The authorized share capital consists of 50,000,000 shares with a par value of $100 each, of which 43,741,090 shares were issued and paid up as at December 31, 2018 and 2017.
RETAINED EARNINGS
Under the Hydro-Québec Act, the dividends to be paid by Hydro-Québec are declared once a year by the Québec government, which also determines the terms and conditions of payment. For a given year, the dividend cannot exceed the distributable surplus, equal to 75% of net income. This calculation is based on the consolidated financial statements. However, in respect of a given year, no dividend may be declared in an amount that would have the effect of reducing the capitalization rate to less than 25% at the end of the year. All or a portion of the distributable surplus that has not been subject to a dividend declaration may no longer be distributed to the shareholder as a dividend.
For 2018, the dividend is $2,394 million ($2,135 million for 2017 and $2,146 million for 2016).
ACCUMULATED OTHER COMPREHENSIVE INCOME
| | | | | | | | | | | | | | | | | | | | |
| | | | | | |
| | | | | | | | | | | | | 2018 | |
| | | | | | |
| | | Note | | | | Cash flow
hedges | | | Employee future benefits | | | Translation
differences | | | Accumulated
other
comprehensive
income | |
| | | | | | |
Balance, end of prior year | | | | | | | (406 | ) | | | (2,186 | ) | | | 1 | | | | (2,591 | ) |
| | | | | | |
Adjustments related to a change in accounting policy | | 2 | | | | | (2 | ) | | | – | | | | – | | | | (2 | ) |
| | | | | | |
| | | | | | | | (408 | ) | | | (2,186 | ) | | | 1 | | | | (2,593 | ) |
| | | | | | |
Other comprehensive income before reclassifications | | | | | | | 685 | | | | 351 | | | | 3 | | | | 1,039 | |
| | | | | | |
Amounts reclassified to results | | | | | | | (470 | ) | | | 118 | | | | – | | | | (352 | ) |
| | | | | | |
Other comprehensive income | | | | | | | 215 | | | | 469 | a | | | 3 | | | | 687 | |
| | | | | | |
Balance, end of current year | | | | | | | (193 | ) | | | (1,717 | ) | | | 4 | | | | (1,906 | ) |
| | | | | | | | | | | | | | | | | | | | |
| | | | | | |
| | | | | | | | | | | | | 2017 | |
| | | | | | |
| | | | | | | Cash flow
hedges | | | Employee future benefits | | | Translation
differences | | | Accumulated
other
comprehensive
income | |
| | | | | | |
Balance, end of prior year | | | | | | | (135 | ) | | | (1,799 | ) | | | 3 | | | | (1,931 | ) |
| | | | | | |
Other comprehensive income before reclassifications | | | | | | | (644 | ) | | | (485 | ) | | | (2 | ) | | | (1,131 | ) |
| | | | | | |
Amounts reclassified to results | | | | | | | 373 | | | | 98 | | | | – | | | | 471 | |
| | | | | | |
Other comprehensive income | | | | | | | (271 | ) | | | (387 | )a | | | (2 | ) | | | (660 | ) |
| | | | | | |
Balance, end of current year | | | | | | | (406 | ) | | | (2,186 | ) | | | 1 | | | | (2,591 | ) |
| | | | | | | | | | | | | | | | | | | | |
| | | | | | |
| | | | | | | | | | | | | 2016 | |
| | | | | | |
| | | | | | | Cash flow
hedges | | | Employee future benefits | | | Translation
differences | | | Accumulated
other
comprehensive
income | |
| | | | | | |
Balance, end of prior year | | | | | | | 233 | | | | (1,678 | ) | | | – | | | | (1,445 | ) |
| | | | | | |
Other comprehensive income before reclassifications | | | | | | | (251 | ) | | | (234 | ) | | | 3 | | | | (482 | ) |
| | | | | | |
Amounts reclassified to results | | | | | | | (117 | ) | | | 113 | | | | – | | | | (4 | ) |
| | | | | | |
Other comprehensive income | | | | | | | (368 | ) | | | (121 | )a | | | 3 | | | | (486 | ) |
| | | | | | |
Balance, end of current year | | | | | | | (135 | ) | | | (1,799 | ) | | | 3 | | | | (1,931 | ) |
| a) | Other comprehensive income includes the change in the employee future benefit regulatory asset, which totaled $(787) million in 2018 ($545 million in 2017 and $245 million in 2016). |
- 73 -
| Note 17 | Supplementary Cash Flow Information |
| | | | | | | | | | | | | | | | |
| | | | | | 2018 | | | 2017 | | | 2016 | |
| | | | |
Change in non-cash working capital items | | | | | | | | | | | | | | | | |
Accounts receivable and other receivables | | | | | | | (132 | ) | | | (490 | ) | | | (4 | ) |
Materials, fuel and supplies | | | | | | | (41 | ) | | | (9 | ) | | | (6 | ) |
Accounts payable and accrued liabilities | | | | | | | (223 | ) | | | 203 | | | | (96 | ) |
Accrued interest | | | | | | | (24 | ) | | | (40 | ) | | | (59 | ) |
| | | | | | | | (420 | ) | | | (336 | ) | | | (165 | ) |
| | | | |
Investing activities not affecting cash | | | | | | | | | | | | | | | | |
Increase in property, plant and equipment and intangible assets | | | | | | | 119 | | | | 77 | | | | 173 | |
| | | | |
Interest paid | | | | | | | 2,219 | | | | 2,084 | | | | 2,112 | |
| Note 18 | Employee Future Benefits |
The projected benefit obligations, valued by independent actuaries, and the assets of employee future benefit plans, at fair value, are valued as at December 31 of each year. The most recent actuarial valuation of the Pension Plan for funding purposes was as at December 31, 2017. The next valuation is required to be as at December 31, 2018.
CHANGES IN PROJECTED BENEFIT OBLIGATIONS AND IN PLAN ASSETS, AT FAIR VALUE
| | | | | | | | | | | | | | | | |
| | | |
| | | Pension Plan | | | Other plans | |
| | | | |
| | | 2018 | | | 2017 | | | 2018 | | | 2017 | |
| | | | |
Projected benefit obligations | | | | | | | | | | | | | | | | |
Balance, beginning of year | | | 26,400 | | | | 24,003 | | | | 1,582 | | | | 1,471 | |
Current service cost | | | 505 | | | | 430 | | | | 49 | | | | 44 | |
Employee contributions | | | 196 | | | | 179 | | | | – | | | | – | |
Benefit payments and refunds | | | (1,034 | ) | | | (999 | ) | | | (74 | ) | | | (72 | ) |
Interest on obligations | | | 837 | | | | 792 | | | | 51 | | | | 49 | |
Actuarial (gain) loss | | | (1,793 | ) | | | 1,995 | | | | (148 | ) | | | 90 | |
Balance, end of year | | | 25,111 | | | | 26,400 | | | | 1,460 | | | | 1,582 | |
| | | | |
Plan assets, at fair value | | | | | | | | | | | | | | | | |
Balance, beginning of year | | | 24,706 | | | | 22,935 | | | | 88 | | | | 83 | |
Actual return on plan assetsa | | | 541 | | | | 2,316 | | | | 2 | | | | – | |
Employee contributions | | | 196 | | | | 179 | | | | – | | | | – | |
Contributions by Hydro-Québec | | | 279 | | | | 275 | | | | 18 | | | | 18 | |
Benefit payments and refunds | | | (1,034 | ) | | | (999 | ) | | | (12 | ) | | | (13 | ) |
Balance, end of year | | | 24,688 | | | | 24,706 | | | | 96 | | | | 88 | |
| | | | |
Funded status – Plan deficits | | | 423 | | | | 1,694 | | | | 1,364 | | | | 1,494 | |
| | | | |
Presented as: | | | | | | | | | | | | | | | | |
Accounts payable and accrued liabilities | | | – | | | | – | | | | 61 | | | | 61 | |
Other liabilities | | | 423 | | | | 1,694 | | | | 1,303 | | | | 1,433 | |
| a) | Administrative and management expenses billed to the Pension Plan by Hydro-Québec amounted to $18 million in 2018 ($16 million in 2017). |
As at December 31, 2018, accumulated benefit obligations under the Pension Plan totaled $23,550 million ($24,706 million as at December 31, 2017). Unlike projected benefit obligations, accumulated benefit obligations do not take into account the salary escalation rate assumption.
- 74 -
| Note 18 | Employee Future Benefits (continued) |
PENSION PLAN ASSETS
Investments and their associated risks are managed in accordance with the Hydro-Québec Pension Fund Investment Management Policy (the “Investment Policy”), which is approved every year by the Board of Directors. These risks include market risk, credit risk and liquidity risk. The Investment Policy provides for diversification of benchmark portfolio securities in order to maximize the expected return within an acceptable risk interval that takes into account the volatility of the Pension Plan’s surplus or deficit. Additional frameworks define the approval process for each type of transaction and establish rules governing the active management of the different portfolios as well as credit risk management. Compliance with the Investment Policy and the additional frameworks is monitored on a regular basis. The Investment Policy allows the use of derivative instruments such as forward contracts, options and swaps.
The target allocation of Pension Plan investments, as established by the Investment Policy in effect as at December 31, 2018, was as follows:
| | | | |
| % | | Target allocation | |
| |
Fixed-income securities | | | 38 | |
Equities | | | 46 | |
Alternative investmentsa | | | 16 | |
| | | | 100 | |
| a) | Alternative investments include real estate investments, private equity investments and commercial mortgages. |
The fair value of net Pension Plan investments as at December 31, according to the fair value hierarchy and based on the type of securities, was as follows:
| | | | | | | | | | | | | | | | | | | | | | | | | | | | | | | | |
| | | | 2018 | | | | 2017 | |
| | | | Level 1 | | | | Level 2 | | | | Level 3 | | | | Total | | | | Level 1 | | | | Level 2 | | | | Level 3 | | | | Total | |
| | | | | | | | |
Cash | | | 192 | | | | – | | | | – | | | | 192 | | | | 200 | | | | – | | | | – | | | | 200 | |
Short-term investmentsa | | | – | | | | 1,559 | | | | – | | | | 1,559 | | | | – | | | | 343 | �� | | | – | | | | 343 | |
Bondsa, b | | | 242 | | | | 6,567 | | | | – | | | | 6,809 | | | | 1,076 | | | | 7,277 | | | | – | | | | 8,353 | |
Listed shares | | | 9,438 | | | | – | | | | – | | | | 9,438 | | | | 10,553 | | | | – | | | | – | | | | 10,553 | |
Real estate investmentsa, c | | | – | | | | 40 | | | | 3,303 | | | | 3,343 | | | | 233 | | | | 68 | | | | 2,856 | | | | 3,157 | |
Private equity investmentsd | | | – | | | | – | | | | 826 | | | | 826 | | | | – | | | | – | | | | 573 | | | | 573 | |
Hedge fundse | | | 470 | | | | 2,103 | | | | – | | | | 2,573 | | | | 392 | | | | 981 | | | | – | | | | 1,373 | |
Derivative instruments – Assetsf | | | 1 | | | | 252 | | | | – | | | | 253 | | | | – | | | | 63 | | | | – | | | | 63 | |
Derivative instruments – Liabilitiesf | | | (24 | ) | | | (301 | ) | | | – | | | | (325 | ) | | | (7 | ) | | | (41 | ) | | | – | | | | (48 | ) |
Other | | | 58 | | | | 20 | | | | – | | | | 78 | | | | 19 | | | | 153 | | | | – | | | | 172 | |
| | | | | | | | |
| | | | 10,377 | | | | 10,240 | | | | 4,129 | | | | 24,746 | g | | | 12,466 | | | | 8,844 | | | | 3,429 | | | | 24,739 | g |
| a) | The fair value of Level 2 short-term investments, bonds and real estate investments is essentially measured by discounting net future cash flows, based on the current market rate of return. |
| b) | Pension Plan assets include securities issued by Hydro-Québec, as well as by the Québec government and some of its agencies, for a total of $957 million ($846 million in 2017). |
| c) | The fair value of Level 3 real estate investments is measured by independent appraisers. The main method used to determine the fair value of these investments is discounting future cash flows. This method is based on observable and unobservable inputs, in particular the discount rate and future cash flows. |
| d) | The fair value of private equity investments is measured by various techniques including future cash flow discounting or using data such as earnings multiples or the price of recent comparable transactions. |
| e) | Hedge funds are measured at the values provided by the fund managers, which are determined on the basis of the fair value of the underlying investments or of the net asset value. |
| f) | Level 2 derivatives are measured using the market closing prices of the underlying products or by discounting net future cash flows. |
| g) | The fair value of investments does not take into account the net amount of payables and receivables, which is an amount payable of $58 million ($33 million in 2017). |
- 75 -
| Note 18 | Employee Future Benefits (continued) |
A reconciliation of the opening and closing balances of Level 3 investments is presented in the table below:
| | | | | | | | | | | | | | | | | | | | | | | | |
| | | | | | | |
| | | | | | | | | 2018 | | | | | | | | | 2017 | |
| | | | | | |
| | | Real estate
investments | | | Private equity
investments | | | Total | | | Real estate
investments | | | Private
equity
investments | | | Total | |
| | | | | | |
Balance, beginning of year | | | 2,856 | | | | 573 | | | | 3,429 | | | | 2,703 | | | | 360 | | | | 3,063 | |
Acquisitions and disposals | | | 149 | | | | 121 | | | | 270 | | | | 74 | | | | 152 | | | | 226 | |
Realized net gains | | | 4 | | | | 2 | | | | 6 | | | | 6 | | | | 2 | | | | 8 | |
Unrealized net gains | | | 294 | | | | 130 | | | | 424 | | | | 73 | | | | 59 | | | | 132 | |
| | | | | | |
Balance, end of year | | | 3,303 | | | | 826 | | | | 4,129 | | | | 2,856 | | | | 573 | | | | 3,429 | |
In 2018 and 2017, there was no reclassification between Level 3 and Levels 1 and 2.
OTHER PLAN ASSETS
Other plan assets as at December 31, 2018, were composed of bonds issued by Hydro-Québec for a total of $87 million ($83 million as at December 31, 2017), as well as cash amounting to $9 million ($5 million as at December 31, 2017). Bonds are classified at Level 2 in the fair value hierarchy.
PLAN COSTS
NET COST COMPONENTS RECOGNIZED FOR THE YEAR
| | | | | | | | | | | | | | | | | | | | | | | | |
| | | |
| | | Pension Plan | | | Other plans | |
| | | 2018 | | | 2017 | | | 2016 | | | 2018 | | | 2017 | | | 2016 | |
| | | | | | |
| Current service cost | | | 505 | | | | 430 | | | | 424 | | | | 49 | | | | 44 | | | | 45 | |
Other components of employee future benefit cost | | | | | | | | | | | | | | | | | | | | | | | | |
Interest on obligations | | | 837 | | | | 792 | | | | 766 | | | | 51 | | | | 49 | | | | 48 | |
Expected return on plan assets | | | (1,533 | ) | | | (1,422 | ) | | | (1,337 | ) | | | (3 | ) | | | (3 | ) | | | (3 | ) |
Amortization of net actuarial loss | | | 275 | | | | 222 | | | | 247 | | | | 30 | | | | 26 | | | | 26 | |
Amortization of past service costs (credits) | | | 7 | | | | 11 | | | | 16 | | | | (4 | ) | | | (5 | ) | | | (5 | ) |
Actuarial loss on long-term disability plan | | | – | | | | – | | | | – | | | | – | | | | 8 | | | | 9 | |
| | | | (414 | ) | | | (397 | ) | | | (308 | ) | | | 74 | | | | 75 | | | | 75 | |
| | | | | | |
Net cost recognized for the year | | | 91 | | | | 33 | | | | 116 | | | | 123 | | | | 119 | | | | 120 | |
- 76 -
| Note 18 | Employee Future Benefits (continued) |
COMPONENTS OF OTHER COMPREHENSIVE INCOME FOR THE YEAR
| | | | | | | | | | | | | | | | | | | | | | | | |
| | | |
| | | Pension Plan | | | Other plans | |
| | | | 2018 | | | | 2017 | | | | 2016 | | | | 2018 | | | | 2017 | | | | 2016 | |
Actuarial (gain) loss | | | (801 | ) | | | 1,101 | | | | 636 | | | | (147 | ) | | | 85 | | | | 14 | |
Amortization of net actuarial loss | | | (275 | ) | | | (222 | ) | | | (247 | ) | | | (30 | ) | | | (26 | ) | | | (26 | ) |
Amortization of past service (costs) credits | | | (7 | ) | | | (11 | ) | | | (16 | ) | | | 4 | | | | 5 | | | | 5 | |
Total (increase) decrease in Other comprehensive income | | | (1,083 | ) | | | 868 | | | | 373 | | | | (173 | ) | | | 64 | | | | (7 | ) |
Less (Decrease) increase in the employee future benefit regulatory asset | | | (678 | ) | | | 509 | | | | 249 | | | | (109 | ) | | | 36 | | | | (4 | ) |
Net (increase) decrease in Other comprehensive income | | | (405 | ) | | | 359 | | | | 124 | | | | (64 | ) | | | 28 | | | | (3 | ) |
|
COMPONENTS OF ACCUMULATED OTHER COMPREHENSIVE INCOME | |
| | | |
| | | Pension Plan | | | Other plans | |
| | | 2018 | | | 2017 | | | 2016 | | | 2018 | | | 2017 | | | 2016 | |
Unamortized net actuarial loss | | | 4,302 | | | | 5,378 | | | | 4,499 | | | | 291 | | | | 468 | | | | 409 | |
Unamortized past service costs (credits) | | | 25 | | | | 32 | | | | 43 | | | | (21 | ) | | | (25 | ) | | | (30 | ) |
Aggregate of amounts recognized in Accumulated other comprehensive income | | | 4,327 | | | | 5,410 | | | | 4,542 | | | | 270 | | | | 443 | | | | 379 | |
Less
Employee future benefit regulatory asset | | | 2,710 | | | | 3,388 | | | | 2,879 | | | | 170 | | | | 279 | | | | 243 | |
Net amount recognized in Accumulated other comprehensive income | | | 1,617 | | | | 2,022 | | | | 1,663 | | | | 100 | | | | 164 | | | | 136 | |
For 2019, the amortization of the net actuarial loss and the past service costs (credits) in the net cost recognized for the year should amount to $91 million and $7 million, respectively, for the Pension Plan, and to $16 million and $(5) million, respectively, for the Other plans.
- 77 -
| Note 18 | Employee Future Benefits (continued) |
SIGNIFICANT ACTUARIAL ASSUMPTIONS
The following actuarial assumptions, used to determine the projected benefit obligations and net cost recognized for the plans, result from a weighted average.
| | | | | | | | | | | | | | | | | | | | | | | | |
| | | |
| | | Pension Plan | | | Other plans | |
| | | | | | | |
| | | 2018 | | | 2017 | | | 2016 | | | 2018 | | | 2017 | | | 2016 | |
Projected benefit obligations | | | | | | | | | | | | | | | | | | | | | | | | |
Rate at end of year (%) | | | | | | | | | | | | | | | | | | | | | | | | |
Discount rate – Projected benefits | | | 3.91 | | | | 3.42 | | | | 3.83 | | | | 3.95 | | | | 3.43 | | | | 3.84 | |
Salary escalation ratea | | | 3.24 | | | | 3.10 | | | | 3.14 | | | | – | | | | – | | | | – | |
Net cost recognized | | | | | | | | | | | | | | | | | | | | | | | | |
Rate at end of prior year (%) | | | | | | | | | | | | | | | | | | | | | | | | |
Discount rate – Current service cost | | | 3.47 | | | | 3.94 | | | | 4.00 | | | | 3.45 | | | | 3.89 | | | | 4.00 | |
Discount rate – Interest on obligations | | | 3.19 | | | | 3.33 | | | | 3.34 | | | | 3.24 | | | | 3.39 | | | | 3.41 | |
Expected long-term rate of return on plan assetsb | | | 6.50 | | | | 6.50 | | | | 6.50 | | | | 2.32 | | | | 3.37 | | | | 3.95 | |
Salary escalation ratea | | | 3.10 | | | | 3.14 | | | | 3.21 | | | | – | | | | – | | | | – | |
Active employees’ average remaining years of service | | | 13 | | | | 13 | | | | 13 | | | | 12 | | | | 12 | | | | 12 | |
| a) | This rate takes salary increases into account as well as promotion opportunities while in service. |
| b) | The expected long-term rate of return on the Pension Plan assets is the average of the expected long-term return on the various asset classes, weighted according to their respective target weightings, plus a rebalancing, diversification and active management premium, net of expected management and administrative fees. |
As at December 31, 2018, health care costs were based on an annual growth rate of 5.00% for 2019. According to the assumption used, this rate will increase on a linear basis to reach 6.50% in 2022 and subsequently decrease to a final rate of 4.50% in 2037. A change of 1% in this annual growth rate would have had the following impact in 2018 and 2017:
| | | | | | | | | | | | | | | | |
| | | |
| | | 1% increase | | | 1% decrease | |
| | | | |
| | | 2018 | | | 2017 | | | 2018 | | | 2017 | |
Impact on current service cost and interest cost on projected benefit obligations for the year | | | 10 | | | | 5 | | | | (7 | ) | | | (3 | ) |
Impact on projected benefit obligations at end of year | | | 108 | | | | 121 | | | | (85 | ) | | | (94 | ) |
BENEFITS TO BE PAID IN NEXT 10 YEARS
| | | | | | | | |
| | | |
| | | Pension Plan | | | Other plans | |
2019 | | | 1,098 | | | | 68 | |
2020 | | | 1,146 | | | | 70 | |
2021 | | | 1,193 | | | | 72 | |
2022 | | | 1,240 | | | | 74 | |
2023 | | | 1,286 | | | | 77 | |
2024–2028 | | | 7,128 | | | | 424 | |
In 2019, Hydro-Québec expects to make contributions of $259 million and $19 million, respectively, to the Pension Plan and the Other plans.
- 78 -
| Note 19 | Commitments and Contingencies |
COMMITMENTS
Electricity purchases
On May 12, 1969, Hydro-Québec signed a contract with CF(L)Co whereby Hydro-Québec undertook to purchase substantially all the output from Churchill Falls generating station, which has a rated capacity of 5,428 MW. In 2016, this contract was automatically renewed for a further 25 years in accordance with the contract provisions. On June 18, 1999, Hydro-Québec and CF(L)Co entered into a contract to guarantee the availability of 682 MW of additional power until 2041 for the November 1 to March 31 winter period.
As at December 31, 2018, Hydro-Québec was also committed under contracts to purchase electricity from other power producers. Based on the renewal clauses, the terms of these contracts extend through 2052. Hydro-Québec had also undertaken to purchase power transmission rights.
On the basis of all these commitments, Hydro-Québec expects to make the following payments over the coming years:
| | |
| 2019 | | 1,841 |
| 2020 | | 1,900 |
| 2021 | | 1,911 |
| 2022 | | 1,941 |
| 2023 | | 2,068 |
| 2024 and thereafter | | 25,838 |
Investments
As part of its development projects and activities aimed at maintaining or improving the quality of its assets, Hydro-Québec plans to invest approximately $3.9 billion in property, plant and equipment and intangible assets per year in Québec over the period from 2019 to 2023.
CONTINGENCIES
Guarantees
In accordance with the terms and conditions of certain debt securities issued outside Canada, Hydro-Québec has undertaken to increase the amount of interest paid to non-residents in the event of changes to Canadian tax legislation governing the taxation of non-residents’ income. Hydro-Québec cannot estimate the maximum amount it might have to pay under such circumstances. Should an amount become payable, Hydro-Québec has the option of redeeming most of the securities in question. As at December 31, 2018, the amortized cost of the long-term debts concerned was $3,314 million ($3,289 million as at December 31, 2017).
Litigation
In the normal course of its development and operating activities, Hydro-Québec is sometimes party to claims and legal proceedings. Management is of the opinion that an adequate provision has been made for these legal actions. Consequently, it does not foresee any significant adverse effect of such contingent liabilities on Hydro-Québec’s consolidated results or financial position.
Among other ongoing actions, some Indigenous communities have instituted proceedings against the governments of Canada and Québec, as well as against Hydro-Québec, based on demands concerning their ancestral rights. In particular, the Innus of Uashat mak Mani-Utenam are demanding $1.5 billion in damages resulting from various activities carried out on land they claim as their own. Hydro-Québec is challenging the legitimacy of these claims.
As well, in November 2006 the Innus of Pessamit reactivated an action brought in 1998, aimed at obtaining, among other things, the recognition of ancestral rights related to Québec lands on which certain hydroelectric generating facilities of the Manic–Outardes complex are located. This community is claiming $500 million. Hydro-Québec is challenging the legitimacy of this claim. In 2015, the Superior Court granted a motion in which the Innus of Pessamit requested a stay of proceedings. In November 2017, the parties agreed on a new timetable for the resumption of proceedings, allowing the Innus of Pessamit until June 2019 to have expert assessments prepared for them to file. A case management conference will then be convened.
- 79 -
| Note 20 | Segmented Information |
Hydro-Québec carries on its activities in the four reportable business segments defined below. The non-reportable business segments and other activities are grouped together under Corporate and Other Activities for reporting purposes.
Generation: Hydro-Québec Production operates and develops Hydro-Québec’s generating facilities. It provides Hydro-Québec Distribution with an annual base volume of up to 165 TWh of heritage pool electricity, and can participate in that division’s calls for tenders in a context of free market competition. In addition, it sells electricity and engages in arbitrage transactions on external markets.
Transmission: Hydro-Québec TransÉnergie operates and develops Hydro-Québec’s power transmission system. It markets system capacity and manages power flows throughout Québec.
Distribution: Hydro-Québec Distribution operates and develops Hydro-Québec’s distribution system and ensures the supply of electricity to the Québec market. It also engages in activities related to selling electricity in Québec, delivering customer services and promoting energy efficiency.
Construction: Hydro-Québec Innovation, équipement et services partagés and Société d’énergie de la Baie James (“SEBJ”) design, build and refurbish generating and transmission facilities, mainly for Hydro-Québec Production and Hydro-Québec TransÉnergie. Hydro-Québec Innovation, équipement et services partagés is responsible for projects throughout Québec, except in the territory governed by the James Bay and Northern Québec Agreement (“JBNQA”). SEBJ builds generating facilities in the territory governed by the JBNQA (north of the 49th parallel) and may also carry out certain projects elsewhere in Québec or outside the province.
Corporate and Other Activities: The corporate units help the business segments carry out their operations.
The amounts presented for each segment are based on the financial information used to prepare the consolidated financial statements. The accounting policies used to calculate these amounts are as described in Note 1, Significant Accounting Policies, and Note 3, Regulation.
Intersegment transactions related to electricity sales are recorded based on the supply and transmission rates provided for by the Act respecting the Régie de l’énergie. The Act sets a supply rate for an annual base volume of up to 165 TWh of heritage pool electricity for the Québec market.
Intersegment products and services are measured at full cost, which includes all costs directly associated with product or service delivery.
Most of Hydro-Québec’s revenue is from Québec, and substantially all its property, plant and equipment are related to its Québec operations. In 2018, revenue from outside Québec amounted to $1,767 million, with $1,231 million originating from the United States ($1,773 million and $1,368 million, respectively, in 2017 and $1,771 million and $1,405 million, respectively, in 2016).
- 80 -
| Note 20 | Segmented Information (continued) |
The following tables present information related to results, assets and investing activities by segment:
| | | | | | | | | | | | | | | | | | | | | | | | | | | | |
| | | | | | | | | | | | | | | | | | | | | 2018 | |
| | | Generation | | | Transmission | | | Distribution | | | Construction | | | Corporate
and Other
Activities | | | Intersegment
eliminations
and
adjustments | | | Total | |
Revenue | | | | | | | | | | | | | | | | | | | | | | | | | | | | |
External customers | | | 1,792 | | | | 130 | | | | 12,124 | | | | 1 | | | | 323 | | | | – | | | | 14,370 | a |
Intersegment customers | | | 4,912 | | | | 3,387 | | | | 85 | | | | 2,140 | | | | 1,836 | | | | (12,360 | ) | | | – | |
Depreciation and amortization | | | 819 | | | | 1,030 | | | | 697 | | | | 5 | | | | 134 | | | | – | | | | 2,685 | |
Financial expenses | | | 1,250 | | | | 953 | | | | 480 | | | | (1 | ) | | | 35 | | | | (5 | ) | | | 2,712 | |
Net income | | | 1,998 | | | | 554 | | | | 362 | | | | – | | | | 278 | | | | – | | | | 3,192 | |
Total assets | | | 32,994 | | | | 23,288 | | | | 13,976 | | | | 44 | | | | 6,847 | | | | (160 | ) | | | 76,989 | |
Investments in property, plant and equipment and intangible assets affecting cash | | | 792 | | | | 1,782 | | | | 664 | | | | 10 | | | | 154 | | | | – | | | | 3,402 | |
| a) | Including $308 million from sources other than contracts with customers, of which $(241) million relate to alternative revenue programs involving certain regulatory assets and liabilities. |
| | | | | | | | | | | | | | | | | | | | | | | | | | | | |
| | | | | | | | | | | | | | | | | | | | | 2017 | |
| | | Generation | | | Transmission | | | Distribution | | | Construction | | | Corporate
and Other
Activities | | | Intersegment
eliminations
and
adjustments | | | Total | |
Revenue | | | | | | | | | | | | | | | | | | | | | | | | | | | | |
External customers | | | 1,790 | | | | 10 | | | | 11,621 | | | | 1 | | | | 46 | | | | – | | | | 13,468 | |
Intersegment customers | | | 4,726 | | | | 3,297 | | | | 80 | | | | 2,479 | | | | 1,706 | | | | (12,288 | ) | | | – | |
Depreciation and amortization | | | 805 | | | | 998 | | | | 752 | | | | 4 | | | | 127 | | | | – | | | | 2,686 | |
Financial expenses | | | 1,173 | | | | 863 | | | | 450 | | | | – | | | | 32 | | | | (5 | ) | | | 2,513 | |
Net income | | | 1,948 | | | | 554 | | | | 333 | | | | – | | | | 11 | | | | – | | | | 2,846 | |
Total assets | | | 32,944 | | | | 22,494 | | | | 13,677 | | | | 39 | | | | 6,768 | | | | (153 | ) | | | 75,769 | |
Investments in property, plant and equipment and intangible assets affecting cash | | | 963 | | | | 1,971 | | | | 650 | | | | 13 | | | | 157 | | | | – | | | | 3,754 | |
- 81 -
| Note 20 | Segmented Information (continued) |
| | | | | | | | | | | | | | | | | | | | | | | | | | | | |
| | | | | | | | | | | | | | | | | | | | | 2016 | |
| | | Generation | | | Transmission | | | Distribution | | | Construction | | | Corporate
and Other
Activities | | | Intersegment
eliminations
and
adjustments | | | Total | |
Revenue | | | | | | | | | | | | | | | | | | | | | | | | | | | | |
External customers | | | 1,766 | | | | 75 | | | | 11,434 | | | | 3 | | | | 61 | | | | – | | | | 13,339 | |
Intersegment customers | | | 4,716 | | | | 3,140 | | | | 80 | | | | 2,222 | | | | 1,753 | | | | (11,911 | ) | | | – | |
Depreciation and amortization | | | 775 | | | | 917 | | | | 779 | | | | 4 | | | | 122 | | | | – | | | | 2,597 | |
Financial expenses | | | 1,205 | | | | 839 | | | | 460 | | | | – | | | | 33 | | | | (5 | ) | | | 2,532 | |
Net income | | | 1,870 | | | | 561 | | | | 342 | | | | 1 | | | | 87 | | | | – | | | | 2,861 | |
Investments in property, plant and equipment and intangible assets affecting cash | | | 906 | | | | 1,757 | | | | 657 | | | | 8 | | | | 132 | | | | – | | | | 3,460 | |
| Note 21 | Comparative Information |
Some of the prior years’ data have been reclassified to conform to the presentation adopted in the current year. In particular, the financial assets and liabilities related to regulated activities, which were formerly integrated into Other liabilities and Accounts receivable and other receivables, are now classified as regulatory assets and liabilities. For 2017, this reclassification led to increases of $9 million in current regulatory assets, $30 million in long-term regulatory assets, $78 million in current regulatory liabilities and $112 million in long-term regulatory liabilities.
- 82 -
SUPPLEMENTARY INFORMATION
(UNAUDITED)
Long-term debt is shown at amortized cost (see “Note 1 to the 2018 Consolidated Financial Statements” under “Financial Instruments – Other receivables and financial liabilities”).
The following table sets forth the non-consolidated and outstanding long-term debt by issue of Hydro-Québec, as of December 31, 2018, expressed in Canadian dollars and in currency units:
LONG-TERM DEBT BY ISSUE
| | | | | | | | | | | | | | | | | | | | | | | | | | | | | | | | | |
Series | | Maturity
Date | | Issue Datea | | Interest
Rate % | | | | Amortized Cost
in Canadian Dollars | | | | Nominal
Amount in
Canadian
Dollars | | CUSIP Number
or ISIN Code | | Referencesb |
|
Payable in Canadian Dollars | |
HG | | | | 2019-11-22 | | | | | 1989-11-22 | | | | | 10.000 | | | $ | | 100,006,584 | | $ | | 100,000,000 | | | | 448814 DE 0 | | | | | | |
II | | | | 2020-01-10 | | | | | 1993-07-27 | | | | | 10.250 | | | | | 151,831,964 | | | | 150,000,000 | | | | 448814 EF 6 | | | | | | |
HL | | | | 2020-08-15 | | | | | 1990-08-15 | | | | | 11.000 | | | | | 606,571,754 | | | | 610,000,000 | | | | 448814 DG 5 | | | | | | |
HM | | | | 2020-08-15 | | | | | 1990-08-15 | | | | | — | | | | | 1,462,392,659 | | | | 1,729,000,000 | | | | 448814 DK 6 | | | | | | |
HX | | | | 2021-10-15 | | | | | 1991-10-15 | | | | | 10.500 | | | | | 1,097,173,664 | | | | 1,100,000,000 | | | | 448814 DW 0 | | | | | | |
IC | | | | 2022-07-15 | | | | | 1992-07-15 | | | | | 9.625 | | | | | 1,942,701,274 | | | | 1,950,000,000 | | | | 448814 DZ 3 | | | | | | |
IH | | | | 2031-02-26 | | | | | 1993-07-27 | | | | | 11.000 | | | | | 218,122,164 | | | | 190,000,000 | | | | 448814 EG 4 | | | | | | |
JG | | | | 2031-08-15 | | | | | 1999-01-26 | | | | | 6.000 | | | | | 826,584,089 | | | | 825,675,000 | | | | 448814 GY 3 | | | | | | |
JM | | | | 2045-02-15 | | | | | 2006-10-17 | | | | | 5.000 | | | | | 5,080,894,404 | | | | 5,000,000,000 | | | | CA448814 HZ 92 | | | | | | |
JN | | | | 2050-02-15 | | | | | 2009-01-15 | | | | | 5.000 | | | | | 7,836,892,885 | | | | 7,000,000,000 | | | | CA448814 JA 24 | | | | | | |
JQ | | | | 2055-02-15 | | | | | 2014-11-04 | | | | | 4.000 | | | | | 3,496,387,436 | | | | 3,000,000,000 | | | | CA448814 8V 86 | | | | | | |
|
Medium-term notes issued under Canadian MTN program | |
| | | | | | | | | |
| 0067 | | | | 2019-03-01 | | | | | 2016-03-01 | | | | | 1.020 | | | | | 16,959,034 | | | | 16,959,034 | | | | CA44889Z EP 77 | | | | | | |
| 0057 | | | | 2019-03-02 | | | | | 2009-03-02 | | | | | 4.678 | | | | | 14,600,000 | | | | 14,600,000 | | | | CA44889Z ED 48 | | | | | | |
| 0072 | | | | 2019-04-29 | | | | | 2017-04-27 | | | | | — | | | | | 53,994,479 | | | | 54,193,000 | | | | CA44889Z EU 62 | | | | | | |
| 0068 | | | | 2019-05-25 | | | | | 2016-05-25 | | | | | 1.000 | | | | | 999,331,708 | | | | 1,000,000,000 | | | | CA44889Z EQ 50 | | | | | | |
| 0066 | | | | 2019-12-01 | | | | | 2014-08-28 | | | | | Floating | | | | | 1,999,517,254 | | | | 2,000,000,000 | | | | CA44889Z EN 20 | | | | | | |
| 0073 | | | | 2021-03-02 | | | | | 2018-03-02 | | | | | 2.14 | | | | | 19,056,000 | | | | 19,056,000 | | | | CA44889Z EV 46 | | | | | | |
| 0003 | | | | 2021-08-15 | | | | | 1996-09-27 | | | | | — | | | | | 21,371,693 | | | | 24,000,000 | | | | — | | | | | 1 | |
| 0060 | | | | 2022-04-15 | | | | | 2009-10-14 | | | | | — | | | | | 56,312,283 | | | | 65,160,000 | | | | CA44889Z EG 78 | | | | | | |
| 0070 | | | | 2024-03-02 | | | | | 2017-03-02 | | | | | 2.032 | | | | | 9,336,000 | | | | 9,336,000 | | | | CA44889Z ES 17 | | | | | | |
| 0065 | | | | 2024-03-07 | | | | | 2014-03-07 | | | | | 3.308 | | | | | 12,000,000 | | | | 12,000,000 | | | | CA44889Z EM 47 | | | | | | |
| 0005 | | | | 2024-11-07 | | | | | 1996-11-07 | | | | | 7.500 | | | | | 25,000,000 | | | | 25,000,000 | | | | CA44889Z DZ 68 | | | | | | |
| 0071 | | | | 2027-03-02 | | | | | 2017-03-02 | | | | | 2.461 | | | | | 15,000,000 | | | | 15,000,000 | | | | CA44889Z ET 99 | | | | | | |
| 0061 | | | | 2027-04-15 | | | | | 2009-10-14 | | | | | — | | | | | 42,427,145 | | | | 65,450,000 | | | | CA44889Z EH 51 | | | | | | |
| 0017 | | | | 2029-01-16 | | | | | 1999-02-02 | | | | | 6.500 | | | | | 78,291,038 | | | | 75,000,000 | | | | CA44889Z CK 09 | | | | | | |
| 0038 | | | | 2031-08-15 | | | | | 2001-01-17 | | | | | 6.000 | | | | | 4,140,241 | | | | 4,325,000 | | | | CA44889Z DG 87 | | | | | | |
| 0009 | | | | 2035-01-16 | | | | | 1998-02-03 | | | | | 6.500 | | | | | 706,822,689 | | | | 686,500,000 | | | | CA44889Z BF 23 | | | | | | |
| 0011 | | | | 2035-01-16 | | | | | 1998-02-18 | | | | | Various | | | | | 41,996,950 | | | | 50,000,000 | | | | CA44889Z BH 88 | | | | | 2 | |
| 0016 | | | | 2035-01-16 | | | | | 1998-07-27 | | | | | Various | | | | | 135,497,106 | | | | 170,000,000 | | | | CA44889Z CJ 36 | | | | | 3 | |
| 0019 | | | | 2035-02-15 | | | | | 1999-04-30 | | | | | 6.500 | | | | | 4,041,201,878 | | | | 3,794,000,000 | | | | CA44889Z CM 64 | | | | | | |
| 0012 | | | | 2035-07-16 | | | | | 1998-06-05 | | | | | Various | | | | | 103,152,925 | | | | 150,000,000 | | | | CA44889Z BJ 45 | | | | | 4 | |
| 0014 | | | | 2035-07-16 | | | | | 1998-07-15 | | | | | — | | | | | 37,066,937 | | | | 73,500,000 | | | | — | | | | | 5 | |
| 0020 | | | | 2040-02-15 | | | | | 1999-05-14 | | | | | 6.000 | | | | | 4,200,639,580 | | | | 3,770,500,000 | | | | CA44889Z CN 48 | | | | | | |
| 0032 | | | | 2050-02-15 | | | | | 2000-08-01 | | | | | 6.000 | | | | | 47,617,745 | | | | 50,000,000 | | | | CA44889Z DA 18 | | | | | | |
| 0033 | | | | 2060-02-15 | | | | | 2000-11-02 | | | | | Various | | | | | 612,180,706 | | | | 200,000,000 | | | | CA44889Z DB 90 | | | | | 6 | |
| 0037 | | | | 2060-02-15 | | | | | 2001-01-12 | | | | | Various | | | | | 97,628,568 | | | | 10,000,000 | | | | CA44889Z DF 05 | | | | | 7 | |
| 0039 | | | | 2060-02-15 | | | | | 2001-01-19 | | | | | Various | | | | | 369,246,048 | | | | 121,000,000 | | | | CA44889Z DH 60 | | | | | 8 | |
| 0040 | | | | 2060-02-15 | | | | | 2001-01-24 | | | | | Various | | | | | 45,218,121 | | | | 30,000,000 | | | | CA44889Z DJ 27 | | | | | 9 | |
Present value of lease obligations for regional offices and service facilities | | | | | 136,627,937 | | | | | | | | | | | | | | |
Others | | | | | 1,407,872,866 | | | | | | | | | | | | | | |
| | | | | | | | | | | | | | | | | | | | | | | | | | | | | | | | | |
Debt classified by currency of issue | | | | | 38,169,665,808 | | | | | | | | | | | | | | |
| | | | | | | | | | | | | | | | | | | | | | | | | | | | | | | | | |
Debt classified by currency of repaymentd | | | | | 45,958,764,328 | | | | | | | | | | | | | | |
| | | | | | | | | | | | | | | | | | | | | | | | | | | | | | | | | |
- 83 -
| | | | | | | | | | | | | | | | | | | | | | | | | | | | | | | | | |
Series | | Maturity
Date | | Issue Datea | | Interest
Rate % | | | | Amortized Cost
in Canadian Dollarsc | | | | Nominal
Amount in
Canadian
Dollars | | CUSIP Number
or ISIN Code | | Referencesb |
|
Payable in U.S. Dollars | |
| | | | | | | | | |
HS | | | | 2021-02-01 | | | | | 1991-02-12 | | | | | 9.400 | | | $ | | 1,224,336,697 | | US$ | | 900,000,000 | | | | 448814 DM 2 | | | | | | |
HY | | | | 2022-01-15 | | | | | 1992-01-30 | | | | | 8.400 | | | | | 1,359,466,661 | | | | 1,000,000,000 | | | | 448814 DX 8 | | | | | | |
IO | | | | 2024-07-07 | | | | | 1994-07-07 | | | | | 8.050 | | | | | 1,361,554,583 | | | | 999,950,000 | | | | 448814 EJ 8 | | | | | | |
GF | | | | 2026-03-01 | | | | | 1986-03-13 | | | | | 8.875 | | | | | 339,193,128 | | | | 250,000,000 | | | | 448814 CP 6 | | | | | 10 | |
GH | | | | 2026-04-15 | | | | | 1986-04-30 | | | | | 8.250 | | | | | 338,693,096 | | | | 250,000,000 | | | | 448814 CS 0 | | | | | 10 | |
GQ | | | | 2027-01-15 | | | | | 1987-01-29 | | | | | 8.250 | | | | | 338,861,789 | | | | 250,000,000 | | | | 448814 CT 8 | | | | | | |
HE | | | | 2029-06-15 | | | | | 1989-06-22 | | | | | 8.625 | | | | | 339,511,122 | | | | 250,000,000 | | | | 448814 DB 6 | | | | | | |
HH | | | | 2029-12-01 | | | | | 1989-12-07 | | | | | 8.500 | | | | | 677,773,702 | | | | 500,000,000 | | | | 448814 DC 4 | | | | | | |
HK | | | | 2030-04-15 | | | | | 1990-04-18 | | | | | 9.375 | | | | | 678,243,190 | | | | 500,000,000 | | | | 448814 DF 7 | | | | | | |
HQ | | | | 2030-11-15 | | | | | 1990-11-20 | | | | | 9.500 | | | | | 676,003,672 | | | | 500,000,000 | | | | 448814 DL 4 | | | | | | |
|
Medium-term notes issued under U.S. MTN program | |
| | | | | | | | | |
B-7 | | | | 2020-12-11 | | | | | 1990-12-10 | | | | | 9.400 | | | | | 13,630,814 | | | | 10,000,000 | | | | 44881H AF 1 | | | | | | |
B-48 | | | | 2021-12-20 | | | | | 1991-12-19 | | | | | 8.680 | | | | | 68,129,659 | | | | 50,000,000 | | | | 44881H BX 1 | | | | | | |
B-49 | | | | 2022-02-15 | | | | | 1992-02-24 | | | | | 9.800 | | | | | 70,249,798 | | | | 50,000,000 | | | | 44881H BY 9 | | | | | | |
B-64 | | | | 2022-05-10 | | | | | 1992-04-30 | | | | | 9.750 | | | | | 28,028,366 | | | | 20,000,000 | | | | 44881H CL 6 | | | | | | |
B-124 | | | | 2024-11-18 | | | | | 1994-11-18 | | | | | 8.910 | | | | | 34,660,561 | | | | 25,000,000 | | | | 44881H ET 7 | | | | | | |
B-125 | | | | 2025-03-28 | | | | | 1995-03-28 | | | | | 8.400 | | | | | 76,182,143 | | | | 55,000,000 | | | | 44881H EU 4 | | | | | | |
B-127 | | | | 2026-01-03 | | | | | 1996-01-03 | | | | | 6.270 | | | | | 68,078,643 | | | | 50,000,000 | | | | 44881H EW 0 | | | | | | |
B-63 | | | | 2027-04-30 | | | | | 1992-04-30 | | | | | 9.500 | | | | | 28,354,302 | | | | 20,000,000 | | | | 44881H CK 8 | | | | | | |
B-130 | | | | 2028-07-13 | | | | | 1998-07-13 | | | | | 6.625 | | | | | 68,146,594 | | | | 50,000,000 | | | | 44881H EZ 3 | | | | | | |
| | | | | | | | | | | | | | | | | | | | | | | | | | | | | | | | | |
Debt classified by currency of issue | | | | | 7,789,098,520 | | | | | | | | | | | | | | |
| | | | | | | | | | | | | | | | | | | | | | | | | | | | | | | | | |
Debt classified by currency of repaymentd | | | | | – | | | | | | | | | | | | | | |
| | | | | | | | | | | | | | | | | | | | | | | | | | | | | | | | | |
Total Long-term Debt | | | $ | | 45,958,764,328 | | | | | | | | | | | | | | |
| | | | | | | | | | | | | | | | | | | | | | | | | | | | | | | | | |
- 84 -
| a) | If more than one issue date, the date of the first issue is indicated. |
| b) | Not redeemable unless otherwise specified. |
| c) | Translated at rates in effect at December 31, 2018 (U.S. Dollar: $1.3644). |
| d) | Takes into account swaps related to long-term debt (see Notes 12 and 15 to the 2018 Consolidated Financial Statements). |
| 1) | Maturing semi-annually from February 15, 2011 to August 15, 2021 in equal payments. |
| 2) | From January 16, 2022, fixed coupon amounts of $1.6 million payable semi-annually. |
| 3) | From January 16, 1999 to January 16, 2014, interest coupons of $3 million payable semi-annually. From January 16, 2024 to January 16, 2035, interest coupons of $5.525 million payable semi-annually. |
| 4) | Fixed rate coupon of 6.5% semi-annually commencing on January 16, 2026. |
| 5) | Maturing semi-annually from January 16, 2025 to July 16, 2035 in various payment amounts. |
| 6) | No interest payment until February 15, 2030 exclusive. Commencing on February 15, 2030, fixed rate coupon of 45% payable semi-annually. |
| 7) | No interest payment until February 15, 2041 exclusive. From February 15, 2041 to February 15, 2045, interest coupons of $50 million payable annually. From February 15, 2046 to February 15, 2050, interest coupons of $35 million payable annually. From February 15, 2051 to February 15, 2055, interest coupons of $20 million payable annually. From February 15, 2056 to February 15, 2059, interest coupons of $10 million payable annually. |
| 8) | No interest payment until February 15, 2040 exclusive. Commencing on February 15, 2040, fixed rate coupon of 100% payable semi-annually. |
| 9) | No interest payment until February 15, 2050 exclusive. From February 15, 2050 to February 15, 2052, interest coupons of $45 million payable annually. From February 15, 2053 to February 15, 2055, interest coupons of $40 million payable annually. From February 15, 2056 to February 15, 2058, interest coupons of $35 million payable annually. On February 15, 2059, interest coupon of $30 million is payable. |
| 10) | Sinking fund debentures. As disclosed, in the 2018 Consolidated Financial Statements, an amount of $75 million was reported under Short-term investments for this purpose and an amount of $650 million was reported under Other assets. |
- 85 -