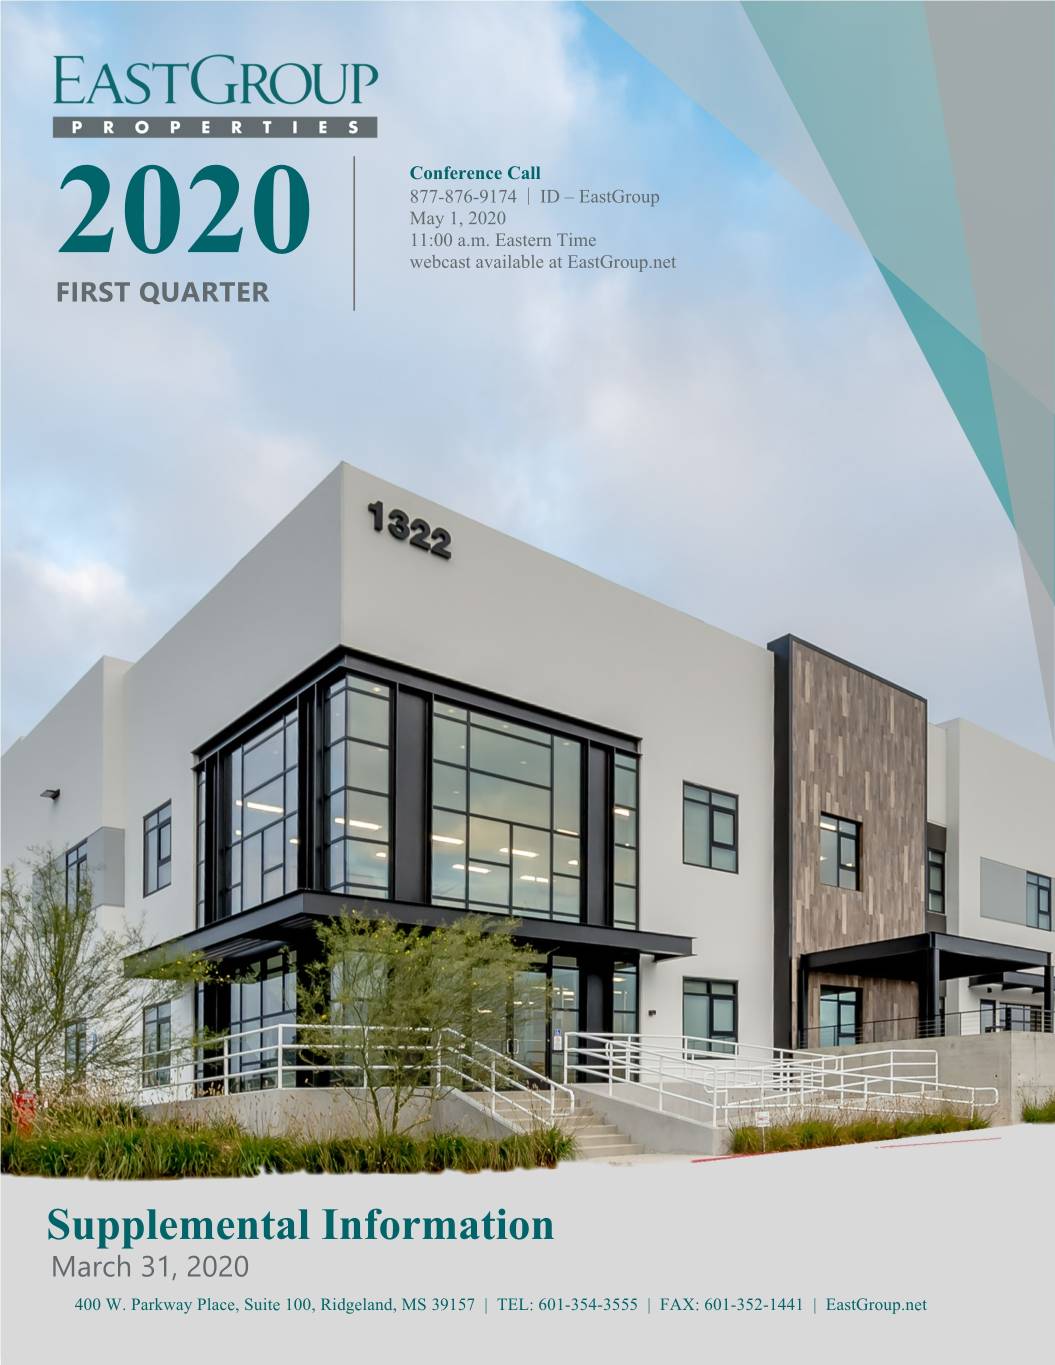
Table of Contents Conference Call 877-876-9174 | ID – EastGroup May 1, 2020 11:00 a.m. Eastern Time 2020 webcast available at EastGroup.net FIRST QUARTER Supplemental Information March 31, 2020 400 W. Parkway Place, Suite 100, Ridgeland, MS 39157 | TEL: 601-354-3555 | FAX: 601-352-1441 | EastGroup.net Page 1 of 24
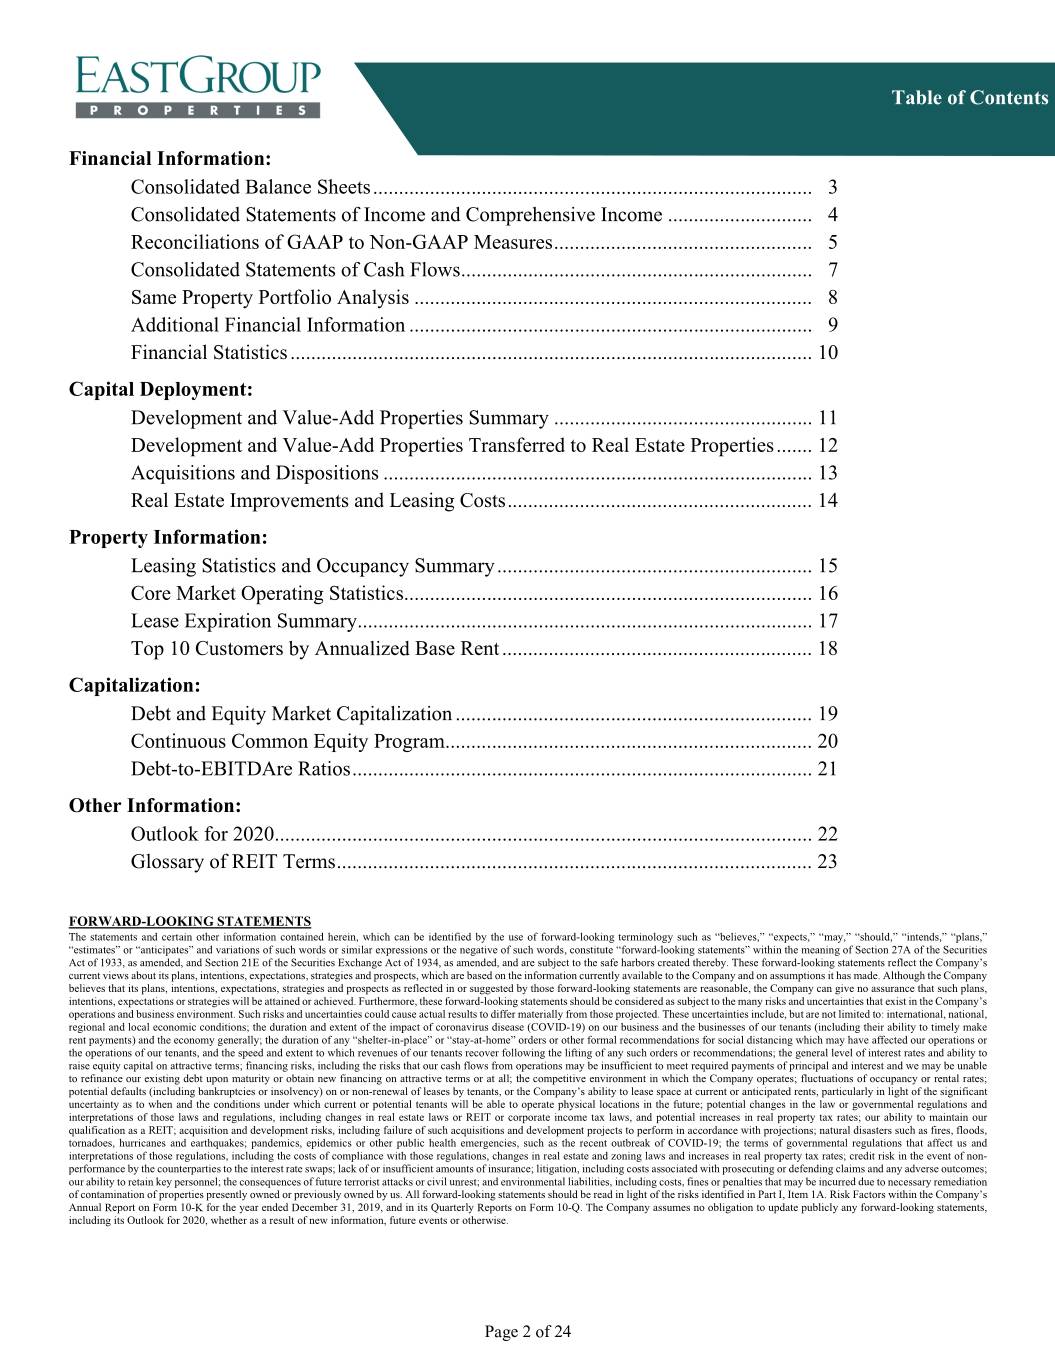
Table of Contents Financial Information: Consolidated Balance Sheets ..................................................................................... 3 Consolidated Statements of Income and Comprehensive Income ............................ 4 Reconciliations of GAAP to Non-GAAP Measures .................................................. 5 Consolidated Statements of Cash Flows .................................................................... 7 Same Property Portfolio Analysis ............................................................................. 8 Additional Financial Information .............................................................................. 9 Financial Statistics ..................................................................................................... 10 Capital Deployment: Development and Value-Add Properties Summary .................................................. 11 Development and Value-Add Properties Transferred to Real Estate Properties ....... 12 Acquisitions and Dispositions ................................................................................... 13 Real Estate Improvements and Leasing Costs ........................................................... 14 Property Information: Leasing Statistics and Occupancy Summary ............................................................. 15 Core Market Operating Statistics ............................................................................... 16 Lease Expiration Summary ........................................................................................ 17 Top 10 Customers by Annualized Base Rent ............................................................ 18 Capitalization: Debt and Equity Market Capitalization ..................................................................... 19 Continuous Common Equity Program ....................................................................... 20 Debt-to-EBITDAre Ratios ......................................................................................... 21 Other Information: Outlook for 2020 ........................................................................................................ 22 Glossary of REIT Terms ............................................................................................ 23 FORWARD-LOOKING STATEMENTS The statements and certain other information contained herein, which can be identified by the use of forward-looking terminology such as “believes,” “expects,” “may,” “should,” “intends,” “plans,” “estimates” or “anticipates” and variations of such words or similar expressions or the negative of such words, constitute “forward-looking statements” within the meaning of Section 27A of the Securities Act of 1933, as amended, and Section 21E of the Securities Exchange Act of 1934, as amended, and are subject to the safe harbors created thereby. These forward-looking statements reflect the Company’s current views about its plans, intentions, expectations, strategies and prospects, which are based on the information currently available to the Company and on assumptions it has made. Although the Company believes that its plans, intentions, expectations, strategies and prospects as reflected in or suggested by those forward-looking statements are reasonable, the Company can give no assurance that such plans, intentions, expectations or strategies will be attained or achieved. Furthermore, these forward-looking statements should be considered as subject to the many risks and uncertainties that exist in the Company’s operations and business environment. Such risks and uncertainties could cause actual results to differ materially from those projected. These uncertainties include, but are not limited to: international, national, regional and local economic conditions; the duration and extent of the impact of coronavirus disease (COVID-19) on our business and the businesses of our tenants (including their ability to timely make rent payments) and the economy generally; the duration of any “shelter-in-place” or “stay-at-home” orders or other formal recommendations for social distancing which may have affected our operations or the operations of our tenants, and the speed and extent to which revenues of our tenants recover following the lifting of any such orders or recommendations; the general level of interest rates and ability to raise equity capital on attractive terms; financing risks, including the risks that our cash flows from operations may be insufficient to meet required payments of principal and interest and we may be unable to refinance our existing debt upon maturity or obtain new financing on attractive terms or at all; the competitive environment in which the Company operates; fluctuations of occupancy or rental rates; potential defaults (including bankruptcies or insolvency) on or non-renewal of leases by tenants, or the Company’s ability to lease space at current or anticipated rents, particularly in light of the significant uncertainty as to when and the conditions under which current or potential tenants will be able to operate physical locations in the future; potential changes in the law or governmental regulations and interpretations of those laws and regulations, including changes in real estate laws or REIT or corporate income tax laws, and potential increases in real property tax rates; our ability to maintain our qualification as a REIT; acquisition and development risks, including failure of such acquisitions and development projects to perform in accordance with projections; natural disasters such as fires, floods, tornadoes, hurricanes and earthquakes; pandemics, epidemics or other public health emergencies, such as the recent outbreak of COVID-19; the terms of governmental regulations that affect us and interpretations of those regulations, including the costs of compliance with those regulations, changes in real estate and zoning laws and increases in real property tax rates; credit risk in the event of non- performance by the counterparties to the interest rate swaps; lack of or insufficient amounts of insurance; litigation, including costs associated with prosecuting or defending claims and any adverse outcomes; our ability to retain key personnel; the consequences of future terrorist attacks or civil unrest; and environmental liabilities, including costs, fines or penalties that may be incurred due to necessary remediation of contamination of properties presently owned or previously owned by us. All forward-looking statements should be read in light of the risks identified in Part I, Item 1A. Risk Factors within the Company’s Annual Report on Form 10-K for the year ended December 31, 2019, and in its Quarterly Reports on Form 10-Q. The Company assumes no obligation to update publicly any forward-looking statements, including its Outlook for 2020, whether as a result of new information, future events or otherwise. Page 2 of 24
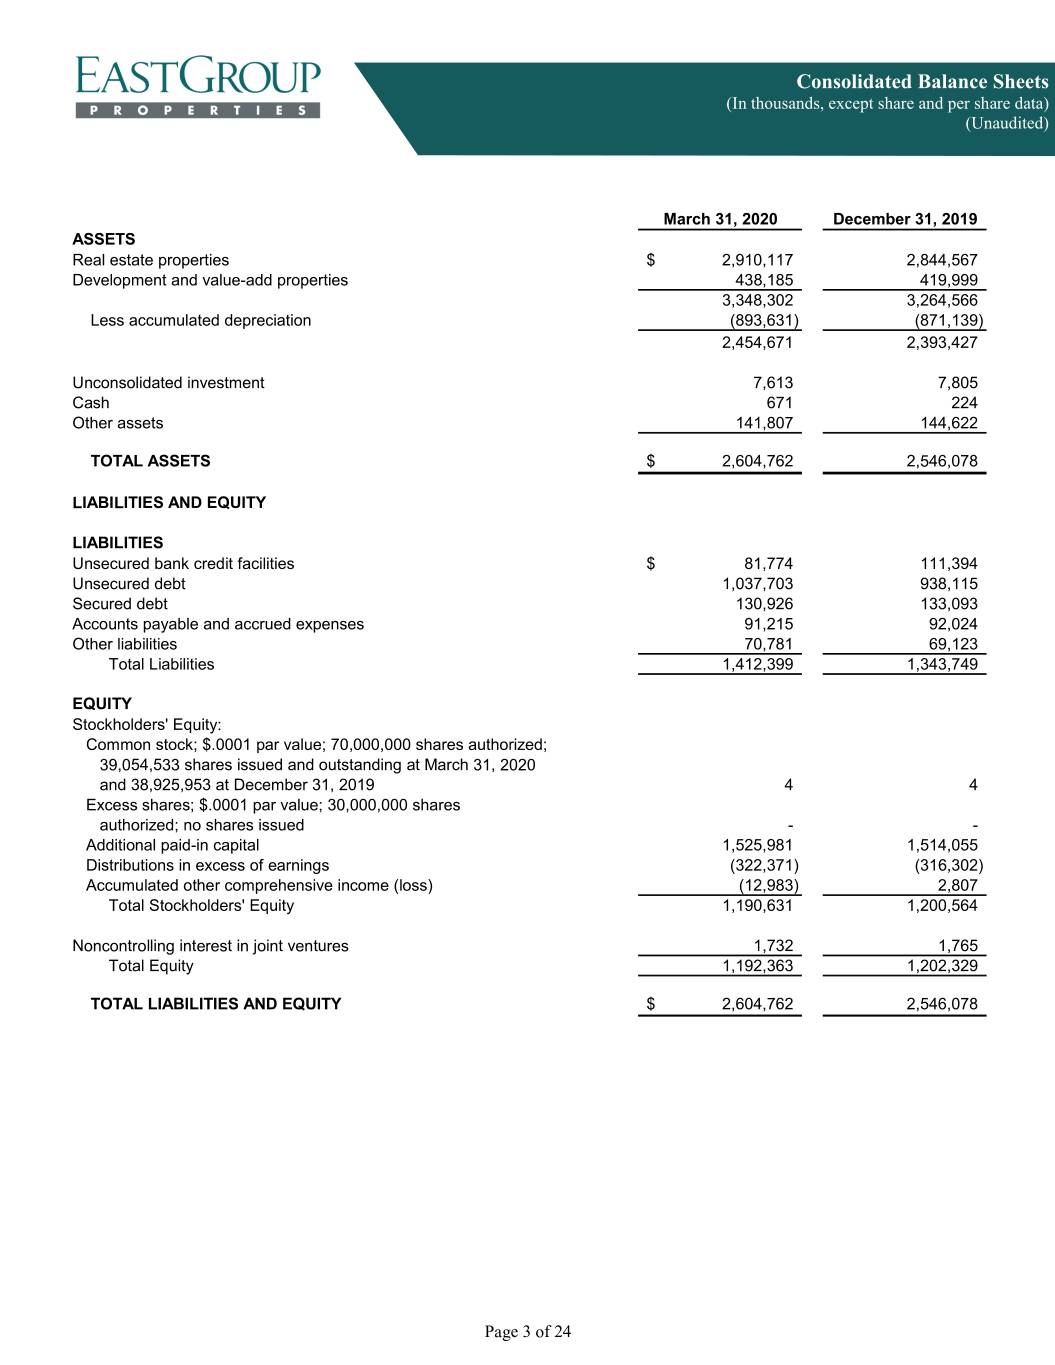
Consolidated Balance Sheets (In thousands, except share and per share data) (Unaudited) March 31, 2020 December 31, 2019 ASSETS Real estate properties$ 2,910,117 2,844,567 Development and value-add properties 438,185 419,999 3,348,302 3,264,566 Less accumulated depreciation (893,631) (871,139) 2,454,671 2,393,427 Unconsolidated investment 7,613 7,805 Cash 671 224 Other assets 141,807 144,622 TOTAL ASSETS $ 2,604,762 2,546,078 LIABILITIES AND EQUITY LIABILITIES Unsecured bank credit facilities$ 81,774 111,394 Unsecured debt 1,037,703 938,115 Secured debt 130,926 133,093 Accounts payable and accrued expenses 91,215 92,024 Other liabilities 70,781 69,123 Total Liabilities 1,412,399 1,343,749 EQUITY Stockholders' Equity: Common stock; $.0001 par value; 70,000,000 shares authorized; 39,054,533 shares issued and outstanding at March 31, 2020 and 38,925,953 at December 31, 2019 4 4 Excess shares; $.0001 par value; 30,000,000 shares authorized; no shares issued - - Additional paid-in capital 1,525,981 1,514,055 Distributions in excess of earnings (322,371) (316,302) Accumulated other comprehensive income (loss) (12,983) 2,807 Total Stockholders' Equity 1,190,631 1,200,564 Noncontrolling interest in joint ventures 1,732 1,765 Total Equity 1,192,363 1,202,329 TOTAL LIABILITIES AND EQUITY $ 2,604,762 2,546,078 Page 3 of 24
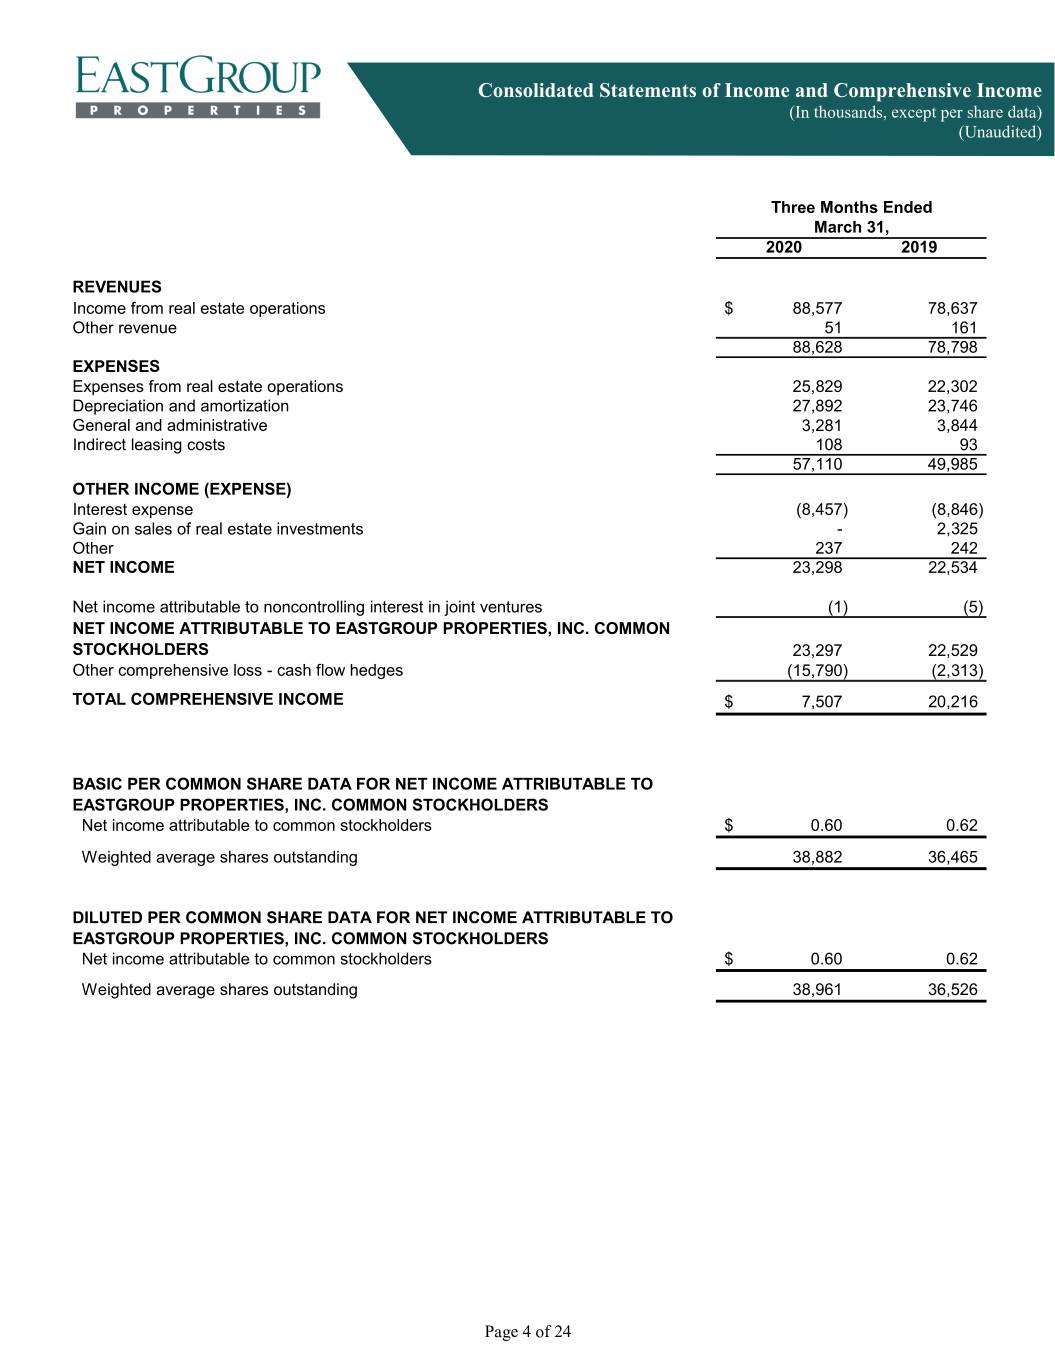
Consolidated Statements of Income and Comprehensive Income (In thousands, except per share data) (Unaudited) Three Months Ended March 31, 2020 2019 REVENUES Income from real estate operations$ 88,577 78,637 Other revenue 51 161 88,628 78,798 EXPENSES Expenses from real estate operations 25,829 22,302 Depreciation and amortization 27,892 23,746 General and administrative 3,281 3,844 Indirect leasing costs 108 93 57,110 49,985 OTHER INCOME (EXPENSE) Interest expense (8,457) (8,846) Gain on sales of real estate investments - 2,325 Other 237 242 NET INCOME 23,298 22,534 Net income attributable to noncontrolling interest in joint ventures (1) (5) NET INCOME ATTRIBUTABLE TO EASTGROUP PROPERTIES, INC. COMMON STOCKHOLDERS 23,297 22,529 Other comprehensive loss - cash flow hedges (15,790) (2,313) TOTAL COMPREHENSIVE INCOME $ 7,507 20,216 BASIC PER COMMON SHARE DATA FOR NET INCOME ATTRIBUTABLE TO EASTGROUP PROPERTIES, INC. COMMON STOCKHOLDERS Net income attributable to common stockholders$ 0.60 0.62 Weighted average shares outstanding 38,882 36,465 DILUTED PER COMMON SHARE DATA FOR NET INCOME ATTRIBUTABLE TO EASTGROUP PROPERTIES, INC. COMMON STOCKHOLDERS Net income attributable to common stockholders$ 0.60 0.62 Weighted average shares outstanding 38,961 36,526 Page 4 of 24

Reconciliations of GAAP to Non-GAAP Measures (In thousands, except per share data) (Unaudited) Three Months Ended March 31, 2020 2019 NET INCOME ATTRIBUTABLE TO EASTGROUP PROPERTIES, INC. COMMON STOCKHOLDERS $ 23,297 22,529 Depreciation and amortization 27,892 23,746 Company's share of depreciation from unconsolidated investment 35 35 Depreciation and amortization from noncontrolling interest (42) (47) Gain on sales of real estate investments - (2,325) FUNDS FROM OPERATIONS ("FFO") ATTRIBUTABLE TO COMMON STOCKHOLDERS 51,182 43,938 Gain on casualties and involuntary conversion - (100) FFO EXCLUDING GAIN ON CASUALTIES AND INVOLUNTARY CONVERSION $ 51,182 43,838 NET INCOME $ 23,298 22,534 Interest expense (1) 8,457 8,846 Depreciation and amortization 27,892 23,746 Company's share of depreciation from unconsolidated investment 35 35 EARNINGS BEFORE INTEREST, TAXES, DEPRECIATION AND AMORTIZATION ("EBITDA") 59,682 55,161 Gain on sales of real estate investments - (2,325) EBITDA for Real Estate ("EBITDAre") $ 59,682 52,836 DILUTED PER COMMON SHARE DATA FOR NET INCOME ATTRIBUTABLE TO EASTGROUP PROPERTIES, INC. COMMON STOCKHOLDERS Net income attributable to common stockholders $ 0.60 0.62 FFO attributable to common stockholders $ 1.31 1.20 FFO Excluding Gain on Casualties and Involuntary Conversion attributable to common stockholders$ 1.31 1.20 Weighted average shares outstanding for EPS and FFO purposes 38,961 36,526 (1) Net of capitalized interest of $2,561 and $2,036 for the three months ended March 31, 2020 and 2019, respectively. Page 5 of 24
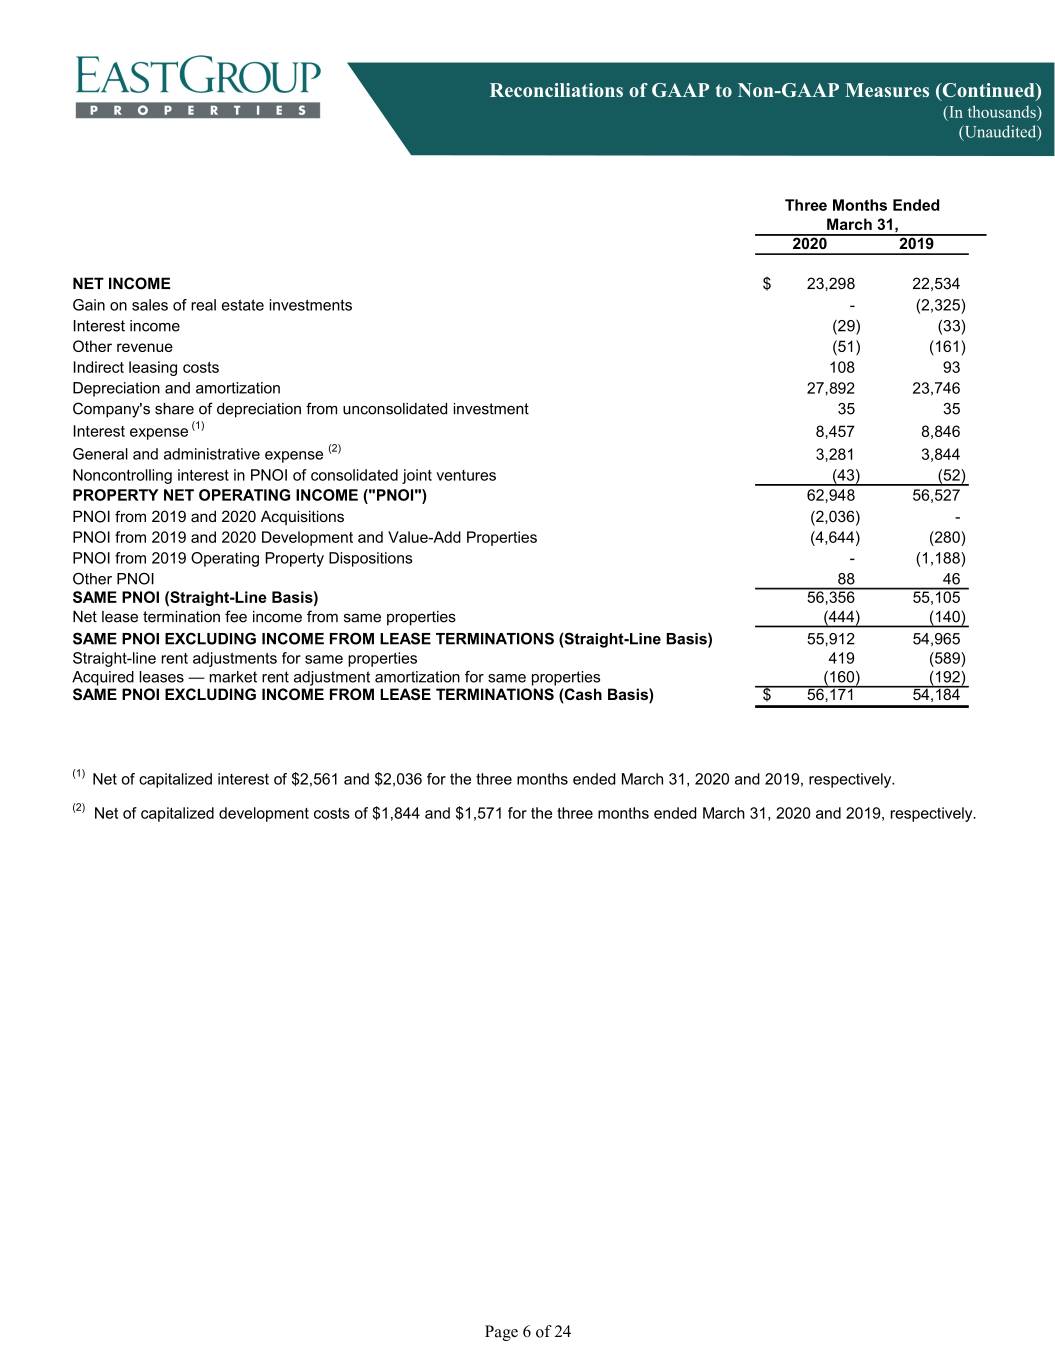
Reconciliations of GAAP to Non-GAAP Measures (Continued) (In thousands) (Unaudited) Three Months Ended March 31, 2020 2019 NET INCOME $ 23,298 22,534 Gain on sales of real estate investments - (2,325) Interest income (29) (33) Other revenue (51) (161) Indirect leasing costs 108 93 Depreciation and amortization 27,892 23,746 Company's share of depreciation from unconsolidated investment 35 35 Interest expense (1) 8,457 8,846 General and administrative expense (2) 3,281 3,844 Noncontrolling interest in PNOI of consolidated joint ventures (43) (52) PROPERTY NET OPERATING INCOME ("PNOI") 62,948 56,527 PNOI from 2019 and 2020 Acquisitions (2,036) - PNOI from 2019 and 2020 Development and Value-Add Properties (4,644) (280) PNOI from 2019 Operating Property Dispositions - (1,188) Other PNOI 88 46 SAME PNOI (Straight-Line Basis) 56,356 55,105 Net lease termination fee income from same properties (444) (140) SAME PNOI EXCLUDING INCOME FROM LEASE TERMINATIONS (Straight-Line Basis) 55,912 54,965 Straight-line rent adjustments for same properties 419 (589) Acquired leases — market rent adjustment amortization for same properties (160) (192) SAME PNOI EXCLUDING INCOME FROM LEASE TERMINATIONS (Cash Basis) $ 56,171 54,184 (1) Net of capitalized interest of $2,561 and $2,036 for the three months ended March 31, 2020 and 2019, respectively. (2) Net of capitalized development costs of $1,844 and $1,571 for the three months ended March 31, 2020 and 2019, respectively. Page 6 of 24

Consolidated Statements of Cash Flows (In thousands) (Unaudited) Three Months Ended March 31, 2020 2019 OPERATING ACTIVITIES Net income $ 23,298 22,534 Adjustments to reconcile net income to net cash provided by operating activities: Depreciation and amortization 27,892 23,746 Stock-based compensation expense 1,226 1,065 Net gain on sales of real estate investments and non-operating real estate - (2,325) Gain on casualties and involuntary conversion on real estate assets - (100) Changes in operating assets and liabilities: Accrued income and other assets 1,090 2,153 Accounts payable, accrued expenses and prepaid rent (2,572) (5,919) Other 505 328 NET CASH PROVIDED BY OPERATING ACTIVITIES 51,439 41,482 INVESTING ACTIVITIES Development and value-add properties (69,687) (42,846) Purchases of real estate (6,231) - Real estate improvements (9,396) (5,610) Net proceeds from sales of real estate investments and non-operating real estate - 3,679 Repayments on mortgage loans receivable 7 3 Changes in accrued development costs 1,437 701 Changes in other assets and other liabilities (14,754) (4,857) NET CASH USED IN INVESTING ACTIVITIES (98,624) (48,930) FINANCING ACTIVITIES Proceeds from unsecured bank credit facilities 221,777 144,635 Repayments on unsecured bank credit facilities (251,524) (207,497) Proceeds from unsecured debt 100,000 80,000 Repayments on secured debt (2,220) (2,916) Debt issuance costs (564) (153) Distributions paid to stockholders (not including dividends accrued) (29,947) (26,787) Proceeds from common stock offerings 14,734 24,400 Proceeds from dividend reinvestment plan - 54 Other (4,624) (2,831) NET CASH PROVIDED BY FINANCING ACTIVITIES 47,632 8,905 INCREASE IN CASH AND CASH EQUIVALENTS 447 1,457 CASH AND CASH EQUIVALENTS AT BEGINNING OF PERIOD 224 374 CASH AND CASH EQUIVALENTS AT END OF PERIOD $ 671 1,831 SUPPLEMENTAL CASH FLOW INFORMATION Cash paid for interest, net of amounts capitalized of $2,561 and $2,036 for 2020 and 2019, respectively $ 8,181 6,646 Cash paid for operating lease liabilities 361 281 NON-CASH OPERATING ACTIVITY Operating lease liabilities arising from obtaining right of use assets$ 495 12,417 Page 7 of 24
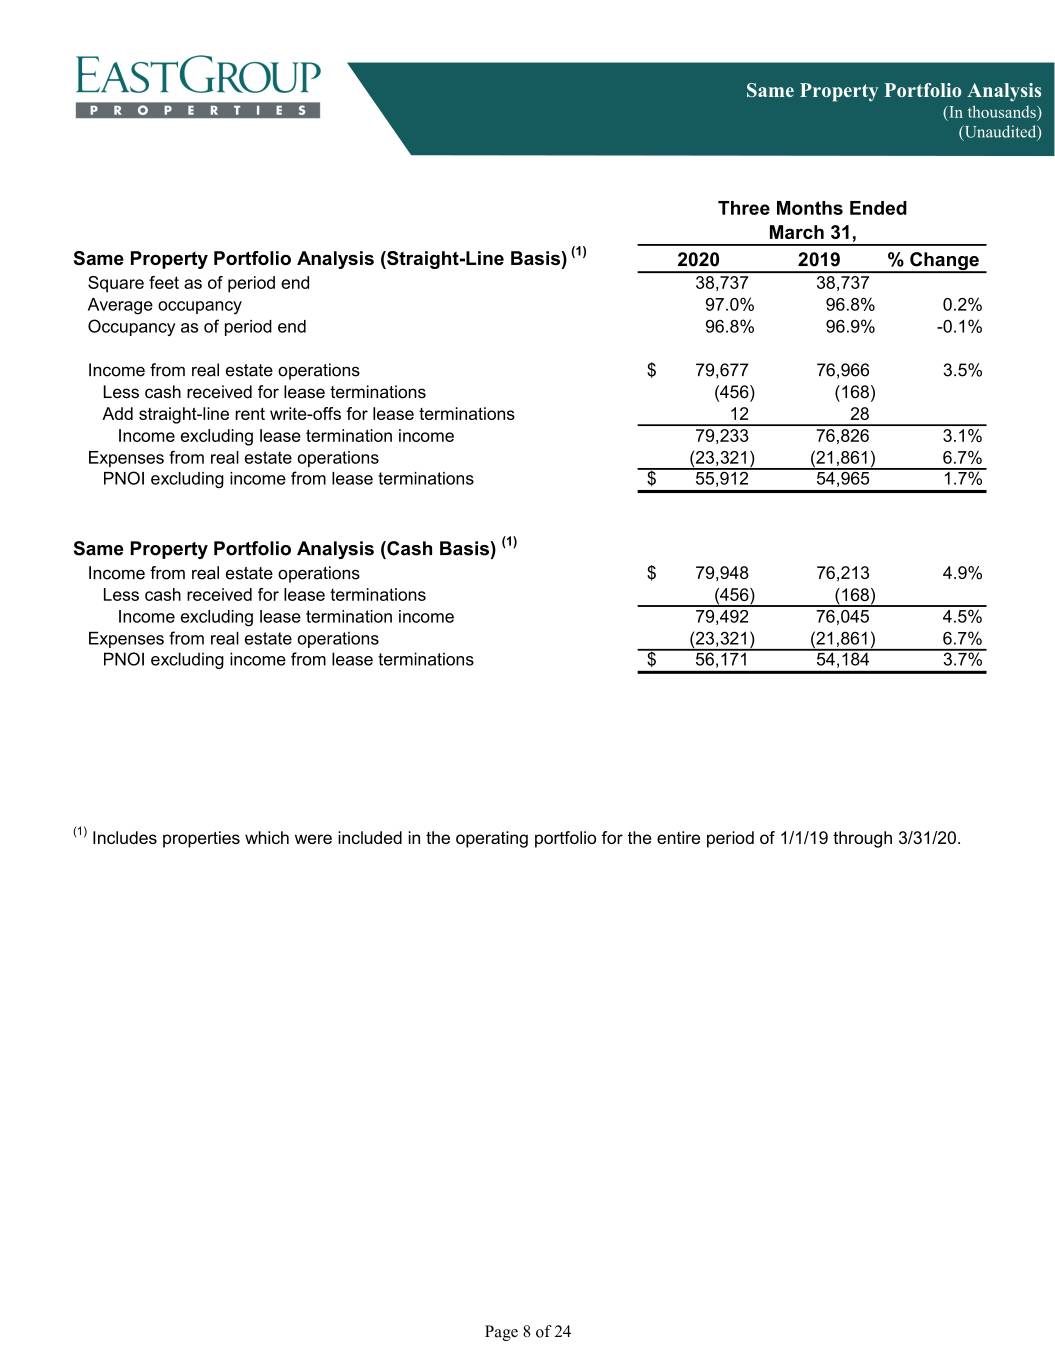
Same Property Portfolio Analysis (In thousands) (Unaudited) Three Months Ended March 31, Same Property Portfolio Analysis (Straight-Line Basis) (1) 2020 2019 % Change Square feet as of period end 38,737 38,737 Average occupancy 97.0% 96.8% 0.2% Occupancy as of period end 96.8% 96.9% -0.1% Income from real estate operations$ 79,677 76,966 3.5% Less cash received for lease terminations (456) (168) Add straight-line rent write-offs for lease terminations 12 28 Income excluding lease termination income 79,233 76,826 3.1% Expenses from real estate operations (23,321) (21,861) 6.7% PNOI excluding income from lease terminations$ 55,912 54,965 1.7% Same Property Portfolio Analysis (Cash Basis) (1) Income from real estate operations$ 79,948 76,213 4.9% Less cash received for lease terminations (456) (168) Income excluding lease termination income 79,492 76,045 4.5% Expenses from real estate operations (23,321) (21,861) 6.7% PNOI excluding income from lease terminations$ 56,171 54,184 3.7% (1) Includes properties which were included in the operating portfolio for the entire period of 1/1/19 through 3/31/20. Page 8 of 24

Additional Financial Information (In thousands) (Unaudited) Three Months Ended March 31, 2020 2019 (Items below represent increases or SELECTED INCOME STATEMENT INFORMATION (decreases) in FFO) Straight-line (S/L) rent income adjustment$ 1,290 798 Reserves for uncollectible S/L rent (367) (13) Net straight-line rent adjustment 923 785 Cash received for lease terminations 456 168 Less S/L rent write-offs (12) (28) Net lease termination fee income 444 140 Reserves for uncollectible cash rent (128) (116) Stock-based compensation expense (1,226) (1,065) Debt issuance costs amortization (336) (342) Indirect leasing costs (108) (93) Gain on casualties and involuntary conversion (1) - 100 Acquired leases - market rent adjustment amortization 374 192 Assumed mortgages - fair value adjustment amortization 5 6 Three Months Ended March 31, 2020 2019 WEIGHTED AVERAGE COMMON SHARES Weighted average common shares 38,882 36,465 BASIC SHARES FOR EARNINGS PER SHARE (EPS) 38,882 36,465 Potential common shares: Unvested restricted stock 79 61 DILUTED SHARES FOR EPS AND FFO 38,961 36,526 (1) Included in Other revenue on the Consolidated Statements of Income and Comprehensive Income; included in FFO. Page 9 of 24

Financial Statistics ($ in thousands, except per share data) (Unaudited) Quarter Ended Years Ended 3/31/2020 2019 2018 2017 2016 ASSETS/MARKET CAPITALIZATION Assets$ 2,604,762 2,546,078 2,131,705 1,953,221 1,825,764 Equity Market Capitalization 4,080,418 5,164,306 3,348,269 3,071,927 2,461,251 (1) Total Market Capitalization (Debt and Equity) 5,334,578 6,350,438 4,458,037 4,183,620 3,566,865 Shares Outstanding - Common 39,054,533 38,925,953 36,501,356 34,758,167 33,332,213 Price per share$ 104.48 132.67 91.73 88.38 73.84 FFO CHANGE FFO per diluted share (2) $ 1.31 4.98 4.66 4.25 4.00 Change compared to same period prior year 9.2% 6.9% 9.6% 6.3% 9.0% COMMON DIVIDEND PAYOUT RATIO Dividend distribution$ 0.75 2.94 2.72 2.52 2.44 FFO per diluted share (2) 1.31 4.98 4.66 4.25 4.00 Dividend payout ratio 57% 59% 58% 59% 61% COMMON DIVIDEND YIELD Dividend distribution$ 0.75 2.94 2.72 2.52 2.44 Price per share 104.48 132.67 91.73 88.38 73.84 Dividend yield 2.87% 2.22% 2.97% 2.85% 3.30% FFO MULTIPLE FFO per diluted share (2) $ 1.31 4.98 4.66 4.25 4.00 Price per share 104.48 132.67 91.73 88.38 73.84 Multiple 19.94 26.64 19.68 20.80 18.46 INTEREST & FIXED CHARGE COVERAGE RATIOS EBITDAre$ 59,682 221,517 200,788 180,214 166,463 Interest expense 8,457 34,463 35,106 34,775 35,213 Interest and fixed charge coverage ratios 7.06 6.43 5.72 5.18 4.73 DEBT-TO-EBITDAre RATIO Debt$ 1,250,403 1,182,602 1,105,787 1,108,282 1,101,333 EBITDAre 59,682 221,517 200,788 180,214 166,463 Debt-to-EBITDAre ratio 5.24 5.34 5.51 6.15 6.62 Adjusted debt-to-pro forma EBITDAre ratio 3.95 3.92 4.73 5.45 6.05 DEBT-TO-TOTAL MARKET CAPITALIZATION (1) 23.5% 18.7% 24.9% 26.6% 31.0% ISSUER RATINGS (3) Issuer Rating Outlook Moody's Investors Service Baa2 Stable (1) Before deducting unamortized debt issuance costs. (2) In connection with the Company's adoption of the Nareit Funds from Operations White Paper - 2018 Restatement, the Company now excludes from FFO the gains and losses on sales of non-operating real estate and assets incidental to the Company's business and therefore adjusted the prior years results to conform to the updated definition of FFO. (3) A security rating is not a recommendation to buy, sell or hold securities and may be subject to revision or withdrawal at any time by the assigning rating agency. Page 10 of 24

Development and Value-Add Properties Summary ($ in thousands) (Unaudited) Costs Incurred Anticipated 1st Qtr Cumulative Projected Conversion % Leased (1) Square Feet (SF) 2020 at 3/31/20 Total Costs Date 4/29/20 Lease-up Horizon VIII & IX Orlando, FL 216,000 $ 708 17,309 19,100 04/20 100% Ten West Crossing 8 Houston, TX 132,000 67 9,831 10,900 04/20 65% Tri-County Crossing 1 & 2 San Antonio, TX 203,000 189 15,575 16,300 04/20 82% CreekView 121 5 & 6 Dallas, TX 139,000 2,050 15,201 16,200 06/20 100% Gateway 5 Miami, FL 187,000 697 23,802 25,500 07/20 100% Parc North 6 Dallas, TX 96,000 899 9,189 11,100 07/20 100% Arlington Tech Centre 1 & 2 (2) Dallas, TX 151,000 435 13,712 15,100 08/20 0% Steele Creek IX Charlotte, NC 125,000 480 9,600 11,100 08/20 100% Grand Oaks 75 2 (2) Tampa, FL 150,000 406 13,521 13,600 09/20 0% Southwest Commerce Center (2) Las Vegas, NV 196,000 901 27,514 30,100 10/20 48% SunCoast 6 Ft Myers, FL 81,000 168 8,102 9,200 10/20 100% Rocky Point 2 (2) San Diego, CA 109,000 250 19,525 20,600 12/20 0% Gilbert Crossroads A & B Phoenix, AZ 140,000 1,286 15,236 16,900 01/21 57% Total Lease-up 1,925,000 8,536 198,117 215,700 66% Wgt Avg % Lease-Up: Projected Stabilized Yield (3) 7.0% Under Construction SunCoast 8 Ft Myers, FL 77,000 3,550 8,034 9,000 05/20 100% Hurricane Shoals 3 Atlanta, GA 101,000 1,283 7,912 8,800 04/21 0% Gateway 4 Miami, FL 197,000 18,873 18,873 23,800 05/21 0% Interstate Commons 2 (2) Phoenix, AZ 142,000 1,354 11,236 11,800 05/21 26% Tri-County Crossing 3 & 4 San Antonio, TX 203,000 2,804 11,502 14,700 05/21 0% World Houston 44 Houston, TX 134,000 2,275 7,065 9,100 05/21 0% CreekView 121 7 & 8 Dallas, TX 137,000 3,448 10,247 16,300 07/21 0% Northwest Crossing 1-3 Houston, TX 278,000 5,112 16,647 25,700 07/21 0% Ridgeview 1 & 2 San Antonio, TX 226,000 3,911 10,442 18,500 07/21 0% Settlers Crossing 3 & 4 Austin, TX 173,000 3,750 11,839 18,400 07/21 0% LakePort 1-3 Dallas, TX 194,000 2,920 10,982 22,500 10/21 0% SunCoast 7 Ft Myers, FL 77,000 4,182 4,182 8,400 10/21 0% Total Under Construction 1,939,000 53,462 128,961 187,000 6% Wgt Avg % (3) Under Construction: Projected Stabilized Yield 7.2% 36% Wgt Avg % Development: Projected Stabilized Yield (3) 7.3% Value-Add: Projected Stabilized Yield (3) 6.3% Prospective Development Acres Projected SF Phoenix, AZ 13 178,000 454 4,827 Ft Myers, FL (4) 20 252,000 (3,232) 4,271 Miami, FL (4) 34 266,000 (14,626) 19,559 Orlando, FL 123 1,488,000 21,214 22,289 Tampa, FL 33 349,000 79 5,880 Jackson, MS 3 28,000 - 706 Charlotte, NC 43 475,000 84 7,411 Dallas, TX 79 1,074,000 2,499 22,087 Houston, TX 84 1,223,000 206 19,654 San Antonio, TX 24 373,000 224 4,423 Total Prospective Development 456 5,706,000 6,902 111,107 456 9,570,000 $ 68,900 438,185 (1) Development properties will transfer from Development and Value-Add properties to the operating portfolio at the earlier of 90% occupancy or one year after shell completion. Value-Add properties will transfer at the earlier of 90% occupancy or one year after acquisition. (2) These value-add projects were acquired by EastGroup. (3) Weighted average yield based on property net operating income at 100% occupancy and rents computed on a straight-line basis. (4) Negative amounts represent land inventory costs transferred to Under Construction. Page 11 of 24
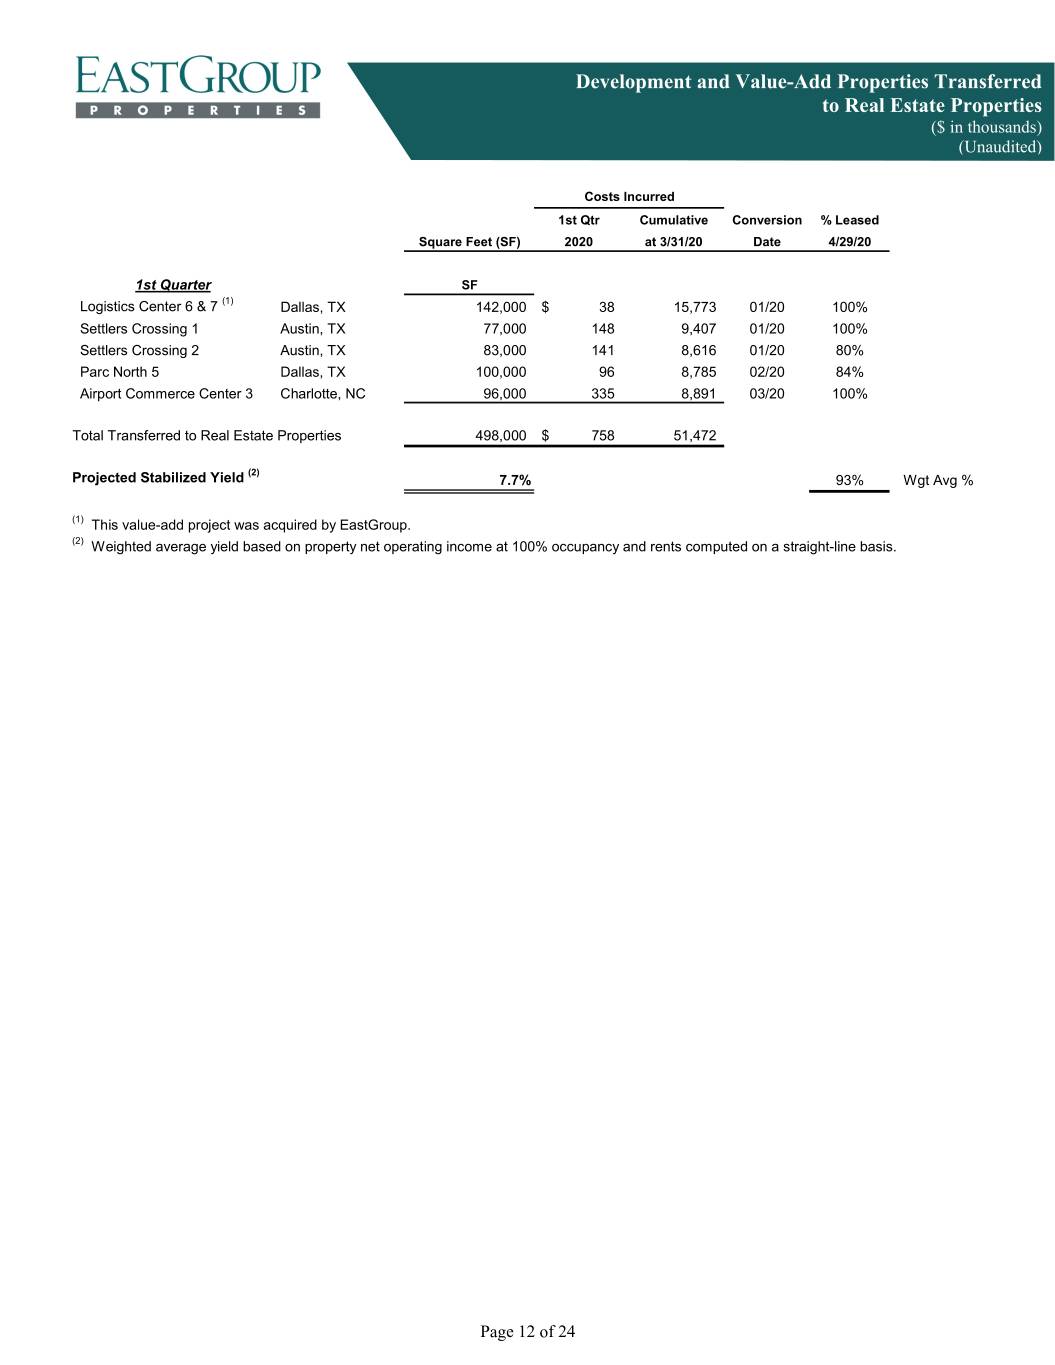
Development and Value-Add Properties Transferred to Real Estate Properties ($ in thousands) (Unaudited) Costs Incurred 1st Qtr Cumulative Conversion % Leased Square Feet (SF) 2020 at 3/31/20 Date 4/29/20 1st Quarter SF Logistics Center 6 & 7 (1) Dallas, TX 142,000 $ 38 15,773 01/20 100% Settlers Crossing 1 Austin, TX 77,000 148 9,407 01/20 100% Settlers Crossing 2 Austin, TX 83,000 141 8,616 01/20 80% Parc North 5 Dallas, TX 100,000 96 8,785 02/20 84% Airport Commerce Center 3 Charlotte, NC 96,000 335 8,891 03/20 100% Total Transferred to Real Estate Properties 498,000 $ 758 51,472 (2) Projected Stabilized Yield 7.7% 93% Wgt Avg % (1) This value-add project was acquired by EastGroup. (2) Weighted average yield based on property net operating income at 100% occupancy and rents computed on a straight-line basis. Page 12 of 24

Acquisitions and Dispositions Through March 31, 2020 ($ in thousands) (Unaudited) ACQUISITIONS Purchase Date Property Name Location Size Price (1) 1st Quarter 01/16/20 Arlington Tech Centre Land Dallas, TX 6.7 Acres$ 1,725 02/28/20 Wells Point One Austin, TX 50,000 SF 6,231 03/16/20 Horizon West Land Orlando, FL 121.5 Acres 20,528 50,000 SF Total Acquisitions 128.2 Acres$ 28,484 DISPOSITIONS Date Property Name Location Size Gross Sales Price Realized Gain 1st Quarter None (1) Represents acquisition price plus closing costs. Page 13 of 24

Real Estate Improvements and Leasing Costs (In thousands) (Unaudited) Three Months Ended March 31, REAL ESTATE IMPROVEMENTS 2020 2019 Upgrade on Acquisitions $ 24 297 Tenant Improvements: New Tenants 3,044 2,917 Renewal Tenants 1,329 500 Other: Building Improvements 1,218 849 Roofs 937 1,596 Parking Lots 36 8 Other 347 284 TOTAL REAL ESTATE IMPROVEMENTS (2) $ 6,935 6,451 CAPITALIZED LEASING COSTS (Principally Commissions) (1) Development and Value-Add $ 1,763 1,572 New Tenants 1,027 1,630 Renewal Tenants 2,933 667 TOTAL CAPITALIZED LEASING COSTS $ 5,723 3,869 (1) Included in Other Assets . (2) Reconciliation of Total Real Estate Improvements to Real Estate Improvements on the Consolidated Statements of Cash Flows: Three Months Ended March 31, 2020 2019 Total Real Estate Improvements$ 6,935 6,451 Change in Real Estate Property Payables 337 (1,690) Change in Construction in Progress 2,124 849 Real Estate Improvements on the Consolidated Statements of Cash Flows $ 9,396 5,610 Page 14 of 24
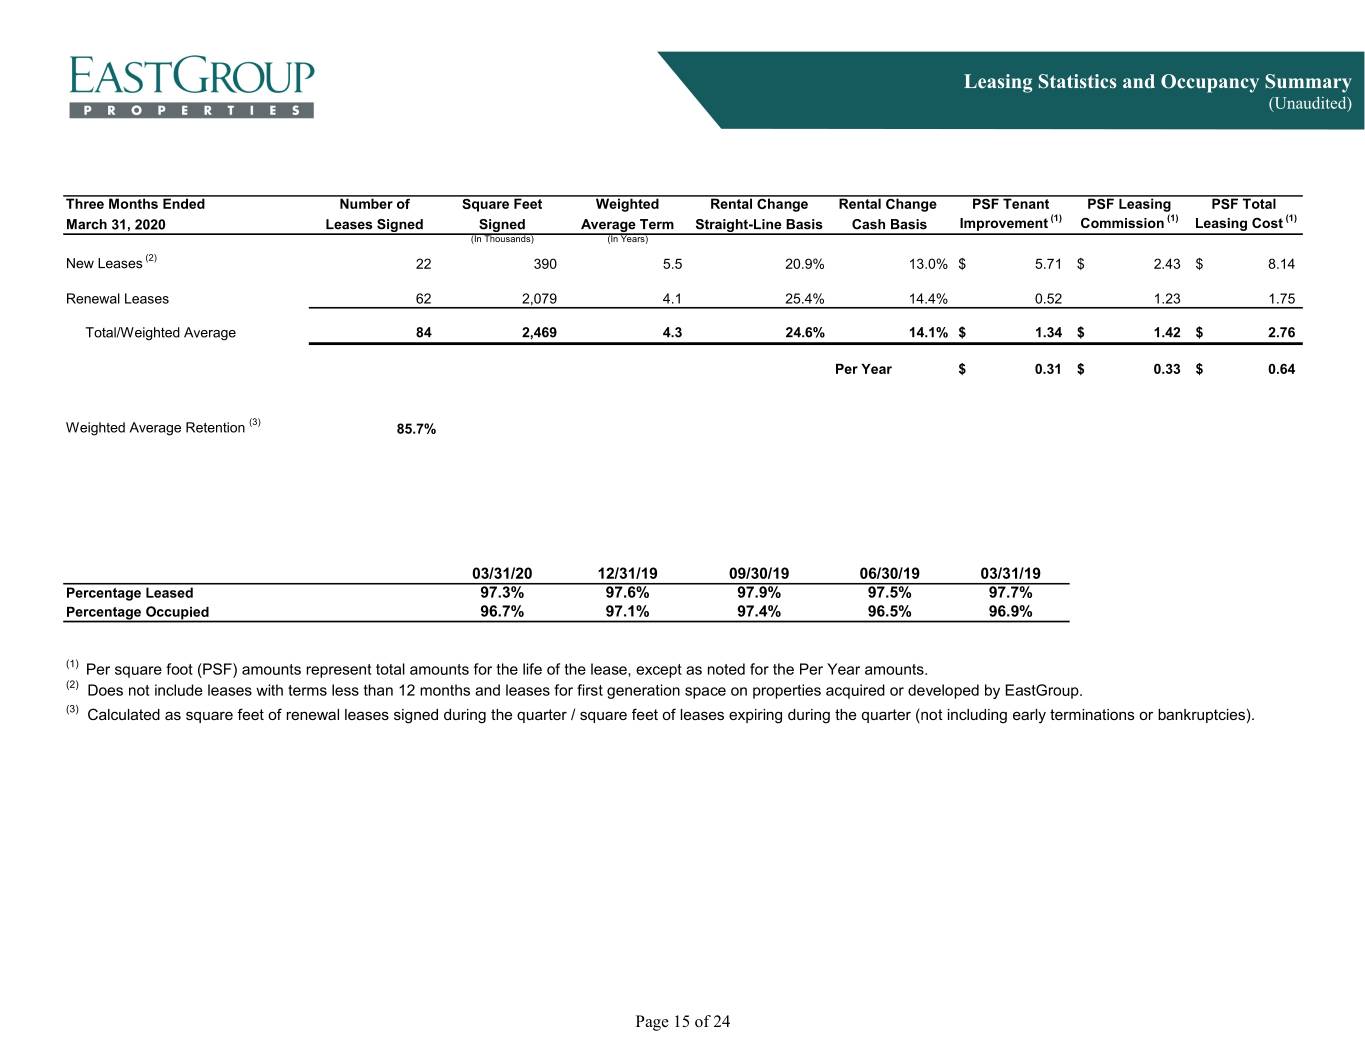
Leasing Statistics and Occupancy Summary (Unaudited) Three Months Ended Number of Square Feet Weighted Rental Change Rental Change PSF Tenant PSF Leasing PSF Total March 31, 2020 Leases Signed Signed Average Term Straight-Line Basis Cash Basis Improvement (1) Commission (1) Leasing Cost (1) (In Thousands) (In Years) New Leases (2) 22 390 5.5 20.9% 13.0%$ 5.71 $ 2.43 $ 8.14 Renewal Leases 62 2,079 4.1 25.4% 14.4% 0.52 1.23 1.75 Total/Weighted Average 84 2,469 4.3 24.6% 14.1%$ 1.34 $ 1.42 $ 2.76 Per Year$ 0.31 $ 0.33 $ 0.64 (3) Weighted Average Retention 85.7% 03/31/20 12/31/19 09/30/19 06/30/19 03/31/19 Percentage Leased 97.3% 97.6% 97.9% 97.5% 97.7% Percentage Occupied 96.7% 97.1% 97.4% 96.5% 96.9% (1) Per square foot (PSF) amounts represent total amounts for the life of the lease, except as noted for the Per Year amounts. (2) Does not include leases with terms less than 12 months and leases for first generation space on properties acquired or developed by EastGroup. (3) Calculated as square feet of renewal leases signed during the quarter / square feet of leases expiring during the quarter (not including early terminations or bankruptcies). Page 15 of 24

Core Market Operating Statistics March 31, 2020 (Unaudited) Same Property PNOI Change Rental Change (excluding income from lease terminations) New and Renewal Leases (3) Total Lease Expirations QTR QTR Square Feet % Annualized % % in Square Feet Straight-Line Cash Straight-Line Cash (2) of Properties of Total Base Rent (1) Leased Occupied 2020 2021 Basis Basis (4) Basis Basis (4) Florida Tampa 4,346,000 10.4% 9.6% 97.5% 96.2% 458,000 893,000 3.1% 4.4% 12.2% 7.0% Orlando 3,469,000 8.3% 8.9% 97.5% 96.0% 363,000 429,000 -1.5% -0.9% 41.2% 24.0% Jacksonville 2,273,000 5.4% 4.2% 95.8% 95.8% 385,000 526,000 2.1% 1.8% 15.7% 4.1% Miami/Ft. Lauderdale 1,272,000 3.1% 3.5% 94.8% 94.8% 119,000 128,000 12.4% 8.2% 16.8% 9.7% Ft. Myers 392,000 0.9% 1.2% 100.0% 100.0% 21,000 103,000 1.9% -2.8% N/A N/A 11,752,000 28.1% 27.4% 97.0% 96.0% 1,346,000 2,079,000 2.2% 2.2% 21.3% 12.2% Texas Dallas 3,969,000 9.5% 8.3% 98.0% 96.7% 398,000 346,000 4.2% 4.1% 36.5% 29.3% Houston 5,743,000 13.7% 13.8% 98.7% 98.7% 370,000 1,127,000 4.2% 6.3% 12.3% 0.4% San Antonio 3,460,000 8.3% 9.1% 97.0% 96.7% 298,000 477,000 -0.9% -0.6% 13.4% 5.7% Austin 953,000 2.3% 2.8% 95.1% 95.1% 43,000 75,000 -1.0% 0.8% 15.6% 12.8% El Paso 957,000 2.3% 1.7% 99.0% 99.0% 73,000 113,000 9.4% 9.3% 59.7% 43.3% 15,082,000 36.1% 35.7% 97.9% 97.5% 1,182,000 2,138,000 2.8% 3.8% 19.9% 10.8% California San Francisco 1,045,000 2.5% 2.7% 86.7% 86.7% 45,000 173,000 -11.6% -19.1% 58.8% 38.9% (5) Los Angeles 2,323,000 5.6% 7.0% 100.0% 100.0% 182,000 1,217,000 -6.5% 3.0% 39.5% 27.9% Fresno 398,000 0.9% 0.7% 97.4% 97.4% 75,000 129,000 -6.0% -12.9% 14.3% 4.6% San Diego 758,000 1.8% 3.0% 95.6% 95.6% 15,000 112,000 7.8% 64.0% N/A N/A 4,524,000 10.8% 13.4% 96.0% 96.0% 317,000 1,631,000 -5.8% 1.5% 52.8% 34.8% Arizona Phoenix 2,502,000 6.0% 5.8% 94.1% 92.4% 225,000 395,000 -7.3% -7.2% 15.9% 9.1% Tucson 848,000 2.0% 2.0% 100.0% 100.0% 26,000 33,000 0.0% 1.5% 14.7% 2.5% 3,350,000 8.0% 7.8% 95.6% 94.3% 251,000 428,000 -5.3% -4.9% 15.4% 6.2% Other Core Atlanta 891,000 2.1% 1.8% 100.0% 100.0% 105,000 70,000 86.7% 128.5% N/A N/A Charlotte 3,281,000 7.9% 6.9% 98.1% 98.1% 265,000 513,000 0.5% 2.5% 12.5% 4.5% Denver 886,000 2.1% 2.5% 97.9% 96.2% 107,000 191,000 9.3% 16.2% 24.0% 13.9% Las Vegas 558,000 1.3% 1.6% 100.0% 100.0% - 221,000 1.4% 3.6% N/A N/A 5,616,000 13.4% 12.8% 98.6% 98.3% 477,000 995,000 9.5% 13.6% 14.4% 6.0% Total Core Markets 40,324,000 96.4% 97.1% 97.3% 96.7% 3,573,000 7,271,000 1.5% 3.4% 24.8% 14.3% Total Other Markets (5) 1,494,000 3.6% 2.9% 96.4% 96.4% 100,000 140,000 9.3% 13.0% 8.2% 3.1% Total Operating Properties 41,818,000 100.0% 100.0% 97.3% 96.7% 3,673,000 7,411,000 1.7% 3.7% 24.6% 14.1% (1) Based on the Annualized Base Rent as of the reporting period for occupied square feet (without S/L Rent). (2) Square Feet expiring during the remainder of the year, including month-to-month leases. (3) Does not include leases with terms less than 12 months and leases for first generation space on properties acquired or developed by EastGroup. (4) Excludes straight-line rent adjustments and amortization of above/below market rent intangibles. (5) Includes the Company's share of its less-than-wholly-owned real estate investments. Page 16 of 24

Lease Expiration Summary Total Square Feet of Operating Properties Based On Leases Signed Through March 31, 2020 ($ in thousands) (Unaudited) Annualized Current % of Total Base Rent of Base Rent of Square Footage of % of Leases Expiring Leases Expiring LEASE EXPIRATION Leases Expiring Total SF (without S/L Rent) (without S/L Rent) Vacancy 1,137,000 2.7%$ - 0.0% 2020 - remainder of year (1) 3,673,000 8.8% 23,865 9.3% 2021 7,411,000 17.7% 46,721 18.3% 2022 7,265,000 17.4% 44,527 17.4% 2023 5,437,000 13.0% 33,625 13.2% 2024 6,193,000 14.8% 41,407 16.2% 2025 3,990,000 9.5% 22,741 8.9% 2026 2,291,000 5.5% 15,327 6.0% 2027 1,492,000 3.6% 9,596 3.8% 2028 1,044,000 2.5% 5,940 2.3% 2029 and beyond 1,885,000 4.5% 11,741 4.6% TOTAL 41,818,000 100.0%$ 255,490 100.0% (1) Includes month-to-month leases. Page 17 of 24

Top 10 Customers by Annualized Base Rent As of March 31, 2020 (Unaudited) % of Total # of Total SF % of Total Annualized Customer Leases LocationLeased Portfolio Base Rent (1) 1 The Chamberlain Group 2 Tucson, AZ 350,000 1 Charlotte, NC 11,000 0.9% 1.0% 2 WNA Comet West, Inc. 1Los Angeles, CA 411,000 1.0% 1.0% 3 Essendant Co. 1 Orlando, FL 404,000 1.0% 0.9% 4 Mattress Firm 1 Houston, TX 202,000 1 Tampa, FL 109,000 1 Jacksonville, FL 49,000 1 Ft. Myers, FL 25,000 0.9% 0.8% 5 Kuehne & Nagel, Inc. 2 Houston, TX 172,000 2 Charlotte, NC 106,000 0.7% 0.8% 6 Price Transfer 1Los Angeles, CA 262,000 0.6% 0.7% 7 Oceaneering International, Inc. 3 Orlando, FL 259,000 0.6% 0.7% 8 Iron Mountain Information 2 Tampa, FL 184,000 Management, Inc. 2 Phoenix, AZ 59,000 1 Ft. Lauderdale, FL 45,000 1 Jacksonville, FL 40,000 0.8% 0.6% 9 U.S. Postal Service 1 Houston, TX 110,000 1 New Orleans, LA 99,000 2 Tampa, FL 59,000 0.6% 0.6% 10 Arizona Nutritional 2 Phoenix, AZ 228,000 0.5% 0.6% Supplements LLC 29 3,184,000 7.6% 7.7% (1) Calculation: Customer Annualized Base Rent as of 03/31/20 (without S/L Rent) / Total Annualized Base Rent (without S/L Rent). Page 18 of 24
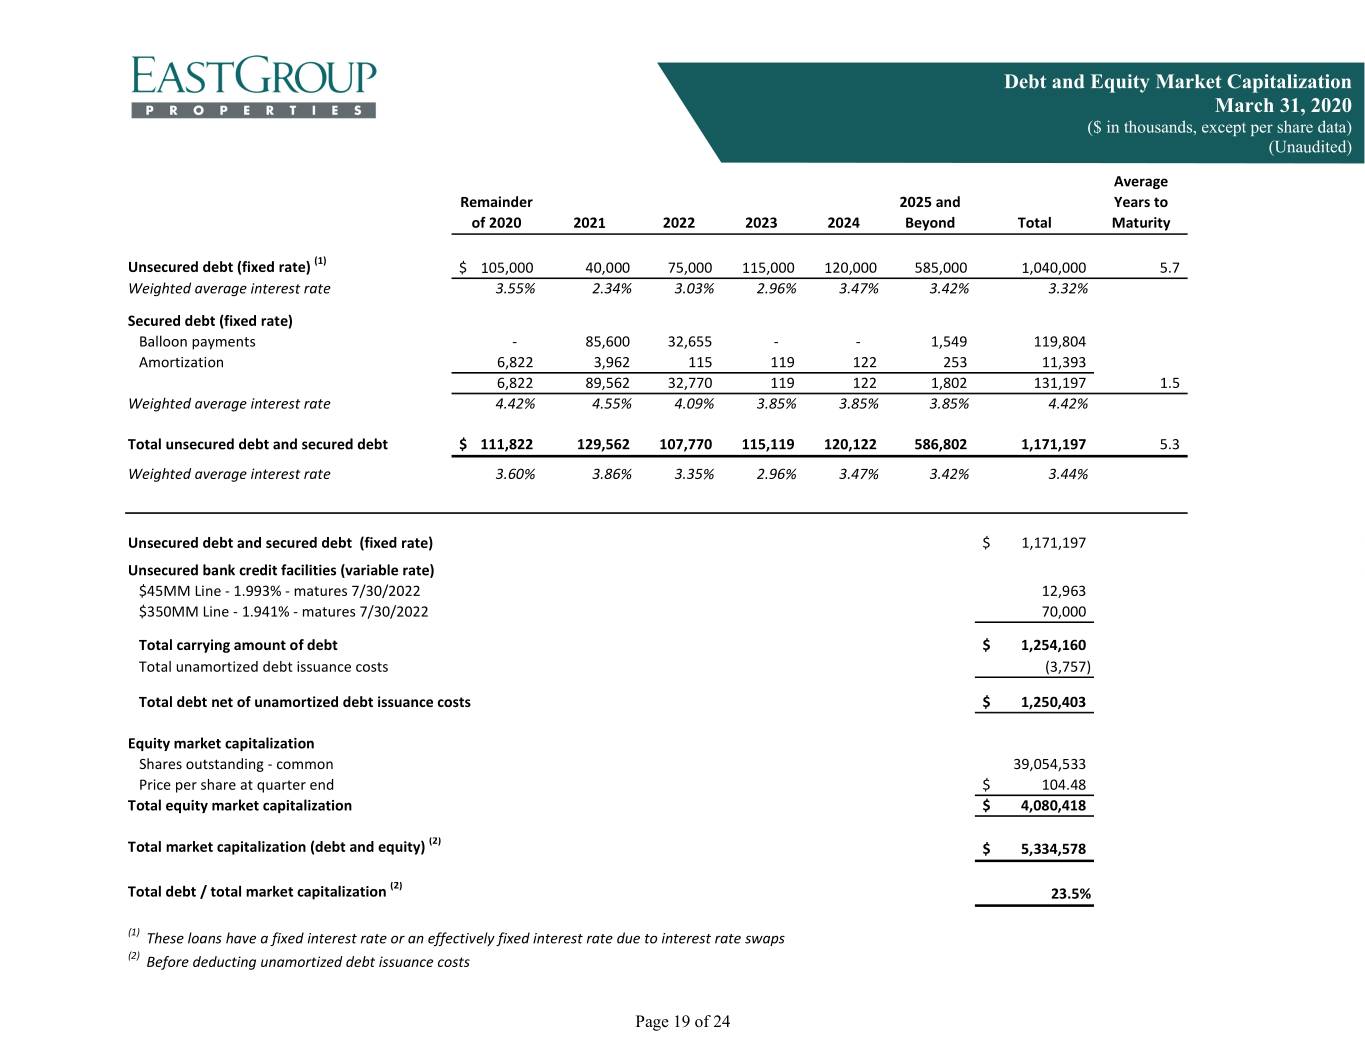
Debt and Equity Market Capitalization March 31, 2020 ($ in thousands, except per share data) (Unaudited) Average Remainder 2025 and Years to of 2020 2021 2022 2023 2024 Beyond Total Maturity Unsecured debt (fixed rate) (1) $ 105,000 40,000 75,000 115,000 120,000 585,000 1,040,000 5.7 Weighted average interest rate 3.55% 2.34% 3.03% 2.96% 3.47% 3.42% 3.32% Secured debt (fixed rate) Balloon payments ‐ 85,600 32,655 ‐ ‐ 1,549 119,804 Amortization 6,822 3,962 115 119 122 253 11,393 6,822 89,562 32,770 119 122 1,802 131,197 1.5 Weighted average interest rate 4.42% 4.55% 4.09% 3.85% 3.85% 3.85% 4.42% Total unsecured debt and secured debt$ 111,822 129,562 107,770 115,119 120,122 586,802 1,171,197 5.3 Weighted average interest rate 3.60% 3.86% 3.35% 2.96% 3.47% 3.42% 3.44% Unsecured debt and secured debt (fixed rate) $ 1,171,197 Unsecured bank credit facilities (variable rate) $45MM Line ‐ 1.993% ‐ matures 7/30/2022 12,963 $350MM Line ‐ 1.941% ‐ matures 7/30/2022 70,000 Total carrying amount of debt $ 1,254,160 Total unamortized debt issuance costs (3,757) Total debt net of unamortized debt issuance costs $ 1,250,403 Equity market capitalization Shares outstanding ‐ common 39,054,533 Price per share at quarter end $ 104.48 Total equity market capitalization $ 4,080,418 (2) Total market capitalization (debt and equity) $ 5,334,578 (2) Total debt / total market capitalization 23.5% (1) These loans have a fixed interest rate or an effectively fixed interest rate due to interest rate swaps (2) Before deducting unamortized debt issuance costs Page 19 of 24
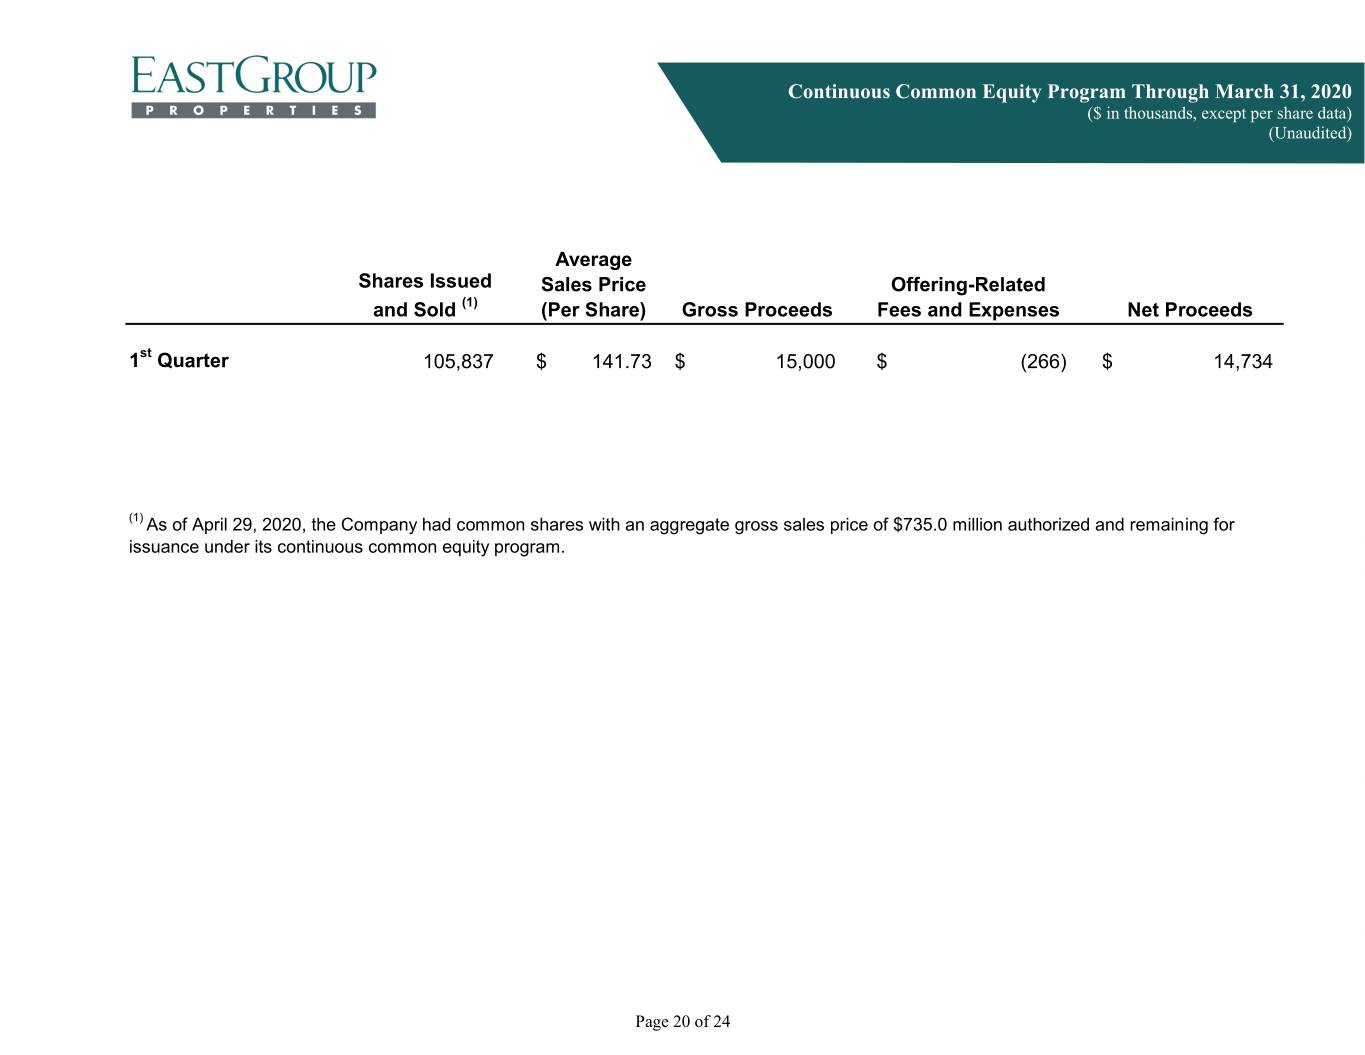
Continuous Common Equity Program Through March 31, 2020 ($ in thousands, except per share data) (Unaudited) Average Shares Issued Sales Price Offering-Related and Sold (1) (Per Share) Gross Proceeds Fees and Expenses Net Proceeds 1st Quarter 105,837 $ 141.73 $ 15,000 $ (266) $ 14,734 (1) As of April 29, 2020, the Company had common shares with an aggregate gross sales price of $735.0 million authorized and remaining for issuance under its continuous common equity program. Page 20 of 24
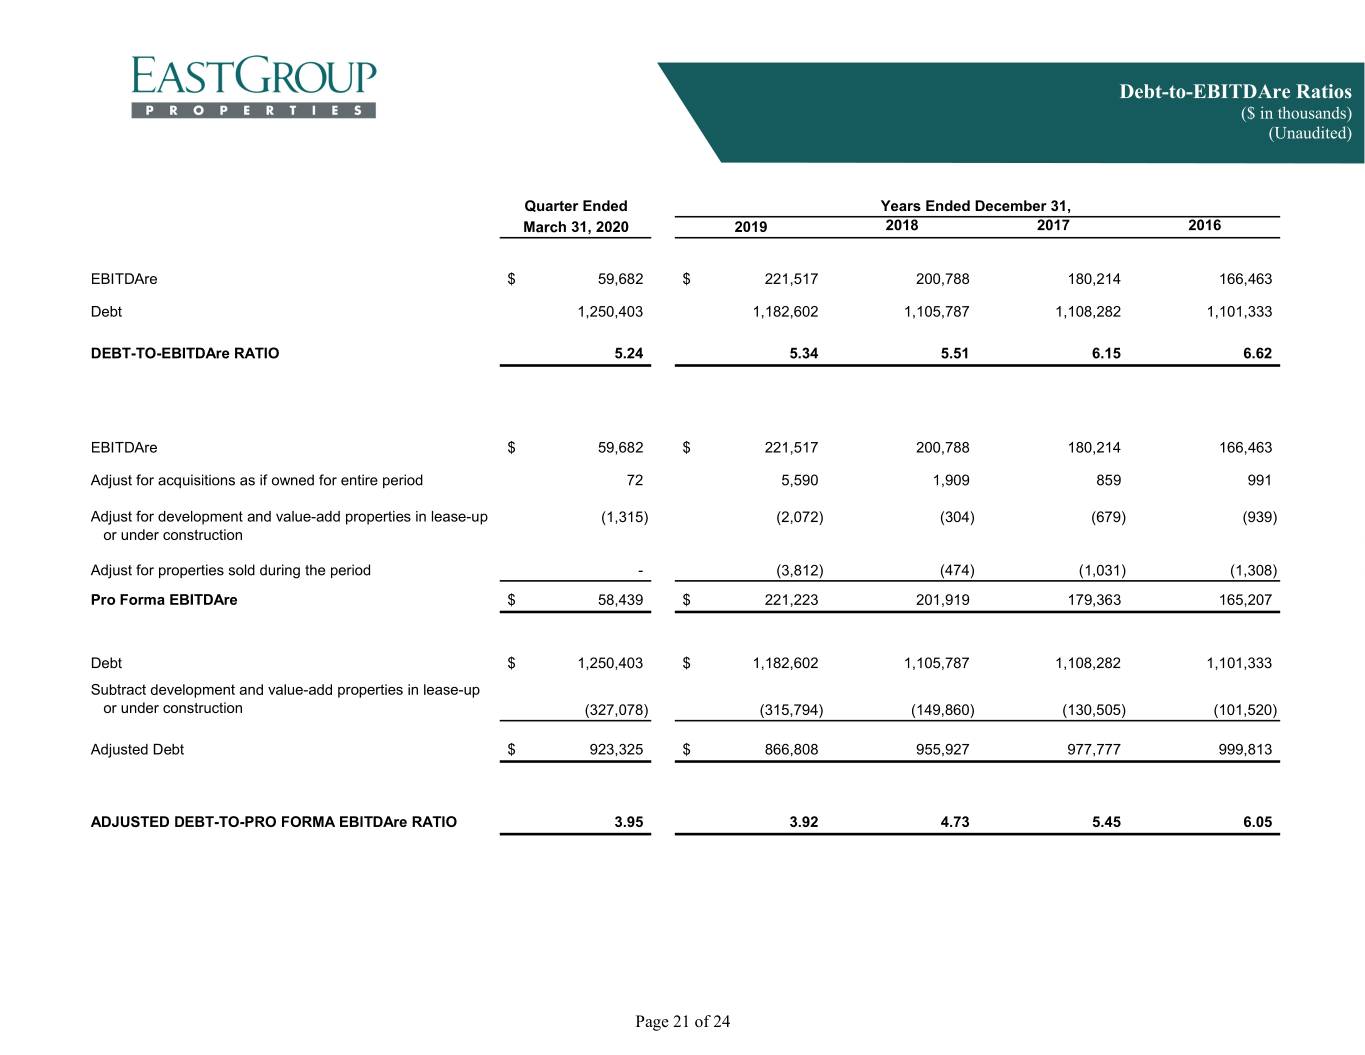
Debt-to-EBITDAre Ratios ($ in thousands) (Unaudited) Quarter Ended Years Ended December 31, March 31, 2020 2019 2018 2017 2016 EBITDAre$ 59,682 $ 221,517 200,788 180,214 166,463 Debt 1,250,403 1,182,602 1,105,787 1,108,282 1,101,333 DEBT-TO-EBITDAre RATIO 5.24 5.34 5.51 6.15 6.62 EBITDAre$ 59,682 $ 221,517 200,788 180,214 166,463 Adjust for acquisitions as if owned for entire period 72 5,590 1,909 859 991 Adjust for development and value-add properties in lease-up (1,315) (2,072) (304) (679) (939) or under construction Adjust for properties sold during the period - (3,812) (474) (1,031) (1,308) Pro Forma EBITDAre $ 58,439 $ 221,223 201,919 179,363 165,207 Debt$ 1,250,403 $ 1,182,602 1,105,787 1,108,282 1,101,333 Subtract development and value-add properties in lease-up or under construction (327,078) (315,794) (149,860) (130,505) (101,520) Adjusted Debt$ 923,325 $ 866,808 955,927 977,777 999,813 ADJUSTED DEBT-TO-PRO FORMA EBITDAre RATIO 3.95 3.92 4.73 5.45 6.05 Page 21 of 24

Outlook for 2020 (Unaudited) Low Range High Range Q2 2020 Y/E 2020 Q2 2020 Y/E 2020 (In thousands, except per share data) Net income attributable to common stockholders$ 18,554 80,535 20,112 85,213 Depreciation and amortization 30,270 118,517 30,270 118,517 Funds from operations attributable to common stockholders$ 48,824 199,052 50,382 203,730 Diluted shares 38,947 38,982 38,947 38,982 Per share data (diluted): Net income attributable to common stockholders$ 0.48 2.07 0.52 2.19 Funds from operations attributable to common stockholders 1.25 5.11 1.29 5.23 The following assumptions were used for the mid-point: Revised Guidance for Initial Guidance Actual for Year Metrics Year 2020 for Year 2020 2019 FFO per share $5.11 - $5.23 $5.25 - $5.35 $4.98 FFO per share increase over prior year period 3.8% 6.4% 6.9% Same PNOI growth: cash basis (1) (2) .5% - 1.5% 2.5% - 3.5% 4.7% Average month-end occupancy 95.2% (3) 96.3% 96.9% Lease termination fee income $500,000 $500,000 $1.3 million Reserves for uncollectible rent $3.8 million $800,000 $448,000 Development starts: Square feet 1.1 million 1.6 million 2.7 million Projected total investment $100 million $150 million $262 million Value-add property acquisitions (projected total investment) $10 million $30 million $108 million Operating property acquisitions $6 million $65 million $142 million Operating property dispositions none $40 million $66 million Unsecured debt closing in period $275 million at $100 million at $290 million at 3.26% weighted 3.75% 3.45% weighted average interest average interest rate rate Common stock issuances $15 million $170 million $288 million General and administrative expense $15.2 million $16.4 million $16.4 million (1) Includes properties which have been in the operating portfolio since 1/1/19 and are projected to be in the operating portfolio through 12/31/20; includes 38,737,000 square feet. (2) Excludes straight-line rent adjustments, amortization of market rent intangibles for acquired leases, and income from lease terminations. Includes $2.0 million of reserves for uncollectible rent. (3) Average occupancy for the three months ended March 31, 2020 was 96.8%. Guidance for April through December 2020 includes an average occupancy of 94.7%. Page 22 of 24

Glossary of REIT Terms Listed below are definitions of commonly used real estate investment trust (“REIT”) industry terms. For additional information on REITs, please see the National Association of Real Estate Investment Trusts (“Nareit”) web site at www.reit.com. Adjusted Debt-to-Pro Forma EBITDAre Ratio: A ratio calculated by dividing a company’s adjusted debt by its pro forma EBITDAre. Debt is adjusted by subtracting the cost of development and value-add properties in lease-up or under construction. EBITDAre is further adjusted by adding an estimate of NOI for significant acquisitions as if the acquired properties were owned for the entire period, and by subtracting NOI from development and value-add properties in lease-up or under construction and from properties sold during the period. The Adjusted Debt-to-Pro Forma EBITDAre Ratio is a non-GAAP financial measure used to analyze the Company’s financial condition and operating performance relative to its leverage, on an adjusted basis, so as to normalize and annualize property changes during the period. Cash Basis: The Company adjusts its GAAP reporting to exclude straight-line rent adjustments and amortization of market rent intangibles for acquired leases. The cash basis is an indicator of the rents charged to customers by the Company during the periods presented and is useful in analyzing the embedded rent growth in the Company’s portfolio. Debt-to-EBITDAre Ratio: A ratio calculated by dividing a company’s debt by its EBITDAre; this non-GAAP measure is used to analyze the Company’s financial condition and operating performance relative to its leverage. Debt-to-Total Market Capitalization Ratio: A ratio calculated by dividing a company’s debt by the total amount of a company’s equity (at market value) and debt. Earnings Before Interest Taxes Depreciation and Amortization for Real Estate (“EBITDAre”): Earnings, defined as Net Income, excluding gains or losses from sales of real estate investments and non-operating real estate, plus interest, taxes, depreciation and amortization. EBITDAre is a non-GAAP financial measure used to measure the Company’s operating performance and its ability to meet interest payment obligations and pay quarterly stock dividends on an unleveraged basis. Funds From Operations (“FFO”): FFO is the most commonly accepted reporting measure of a REIT’s operating performance, and the Company computes FFO in accordance with standards established by Nareit in the Nareit Funds from Operations White Paper — 2018 Restatement. It is equal to a REIT’s net income (loss) attributable to common stockholders computed in accordance with generally accepted accounting principles (“GAAP”), excluding gains and losses from sales of real estate property (including other assets incidental to the Company’s business) and impairment losses, adjusted for real estate related depreciation and amortization, and after adjustments for unconsolidated partnerships and joint ventures. FFO is a non-GAAP financial measure used to evaluate the performance of the Company’s investments in real estate assets and its operating results. FFO Excluding Gain on Casualties and Involuntary Conversion: A reporting measure calculated as FFO (as defined above), adjusted to exclude gain on casualties and involuntary conversion. The Company believes that the exclusion of gain on casualties and involuntary conversion presents a more meaningful comparison of operating performance. Industrial Properties: Generally consisting of four concrete walls tilted up on a slab of concrete. An internal office component is then added. Business uses include warehousing, distribution, light manufacturing and assembly, research and development, showroom, office, or a combination of some or all of the aforementioned. Leases Expiring and Renewal Leases Signed of Expiring Square Feet: Includes renewals during the period with terms commencing during the period and after the end of the period. Operating Land: Land with no buildings or improvements that generates income from leases with tenants; included in Real estate properties on the Consolidated Balance Sheets. Operating Properties: Stabilized real estate properties (land including buildings and improvements) in the Company’s operating portfolio; included in Real estate properties on the Consolidated Balance Sheets. Percentage Leased: The percentage of total leasable square footage for which there is a signed lease, including month-to-month leases, as of the close of the reporting period. Space is considered leased upon execution of the lease. Page 23 of 24
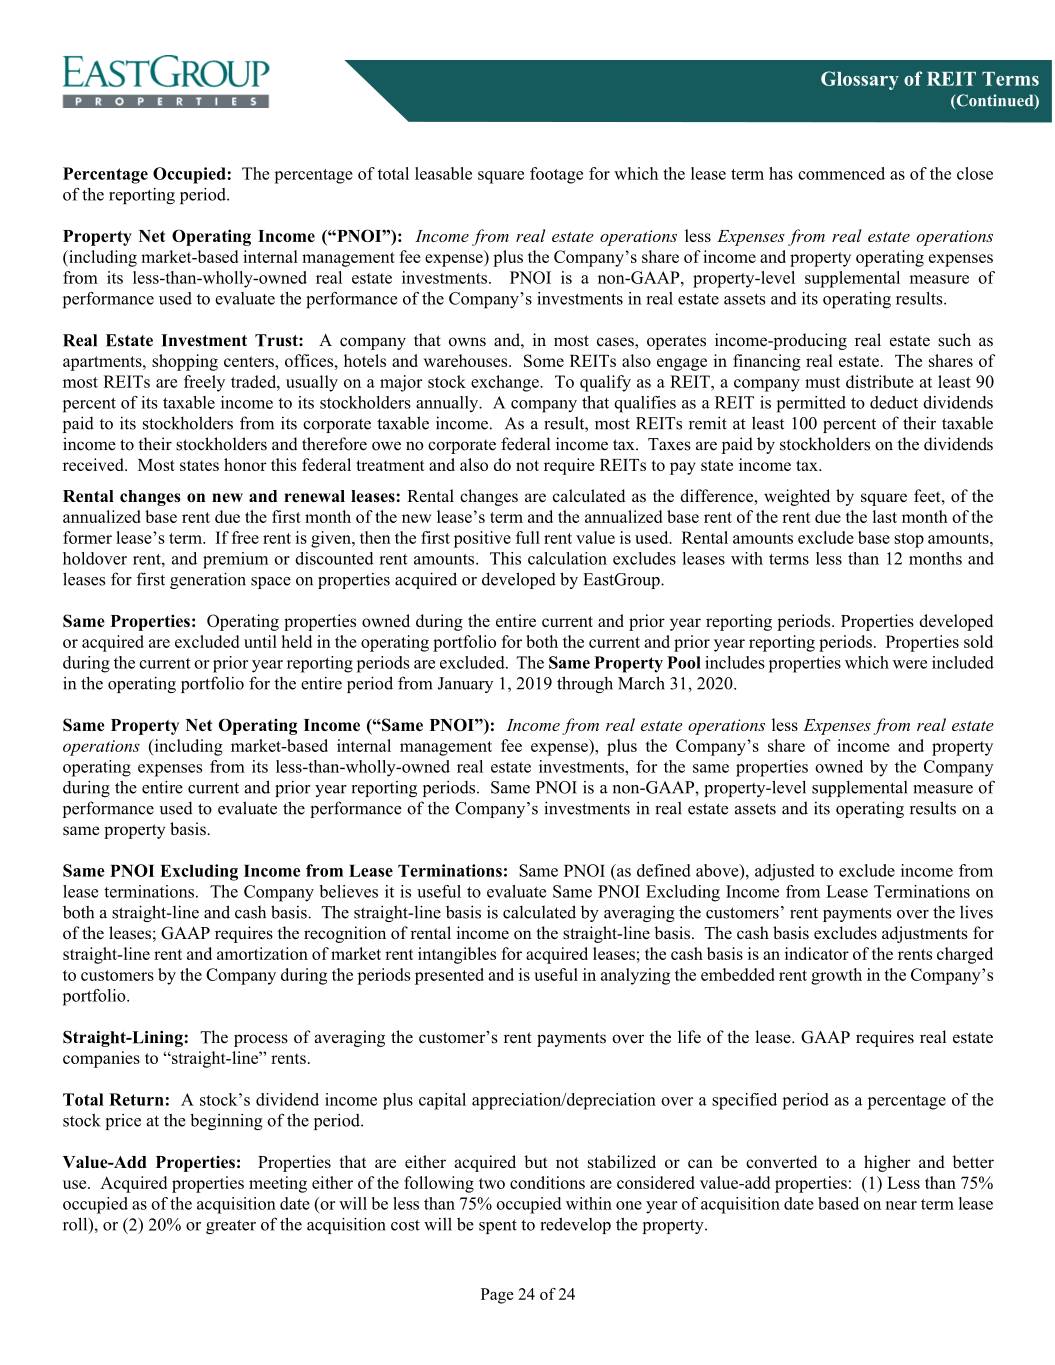
Glossary of REIT Terms (Continued) Percentage Occupied: The percentage of total leasable square footage for which the lease term has commenced as of the close of the reporting period. Property Net Operating Income (“PNOI”): Income from real estate operations less Expenses from real estate operations (including market-based internal management fee expense) plus the Company’s share of income and property operating expenses from its less-than-wholly-owned real estate investments. PNOI is a non-GAAP, property-level supplemental measure of performance used to evaluate the performance of the Company’s investments in real estate assets and its operating results. Real Estate Investment Trust: A company that owns and, in most cases, operates income-producing real estate such as apartments, shopping centers, offices, hotels and warehouses. Some REITs also engage in financing real estate. The shares of most REITs are freely traded, usually on a major stock exchange. To qualify as a REIT, a company must distribute at least 90 percent of its taxable income to its stockholders annually. A company that qualifies as a REIT is permitted to deduct dividends paid to its stockholders from its corporate taxable income. As a result, most REITs remit at least 100 percent of their taxable income to their stockholders and therefore owe no corporate federal income tax. Taxes are paid by stockholders on the dividends received. Most states honor this federal treatment and also do not require REITs to pay state income tax. Rental changes on new and renewal leases: Rental changes are calculated as the difference, weighted by square feet, of the annualized base rent due the first month of the new lease’s term and the annualized base rent of the rent due the last month of the former lease’s term. If free rent is given, then the first positive full rent value is used. Rental amounts exclude base stop amounts, holdover rent, and premium or discounted rent amounts. This calculation excludes leases with terms less than 12 months and leases for first generation space on properties acquired or developed by EastGroup. Same Properties: Operating properties owned during the entire current and prior year reporting periods. Properties developed or acquired are excluded until held in the operating portfolio for both the current and prior year reporting periods. Properties sold during the current or prior year reporting periods are excluded. The Same Property Pool includes properties which were included in the operating portfolio for the entire period from January 1, 2019 through March 31, 2020. Same Property Net Operating Income (“Same PNOI”): Income from real estate operations less Expenses from real estate operations (including market-based internal management fee expense), plus the Company’s share of income and property operating expenses from its less-than-wholly-owned real estate investments, for the same properties owned by the Company during the entire current and prior year reporting periods. Same PNOI is a non-GAAP, property-level supplemental measure of performance used to evaluate the performance of the Company’s investments in real estate assets and its operating results on a same property basis. Same PNOI Excluding Income from Lease Terminations: Same PNOI (as defined above), adjusted to exclude income from lease terminations. The Company believes it is useful to evaluate Same PNOI Excluding Income from Lease Terminations on both a straight-line and cash basis. The straight-line basis is calculated by averaging the customers’ rent payments over the lives of the leases; GAAP requires the recognition of rental income on the straight-line basis. The cash basis excludes adjustments for straight-line rent and amortization of market rent intangibles for acquired leases; the cash basis is an indicator of the rents charged to customers by the Company during the periods presented and is useful in analyzing the embedded rent growth in the Company’s portfolio. Straight-Lining: The process of averaging the customer’s rent payments over the life of the lease. GAAP requires real estate companies to “straight-line” rents. Total Return: A stock’s dividend income plus capital appreciation/depreciation over a specified period as a percentage of the stock price at the beginning of the period. Value-Add Properties: Properties that are either acquired but not stabilized or can be converted to a higher and better use. Acquired properties meeting either of the following two conditions are considered value-add properties: (1) Less than 75% occupied as of the acquisition date (or will be less than 75% occupied within one year of acquisition date based on near term lease roll), or (2) 20% or greater of the acquisition cost will be spent to redevelop the property. Page 24 of 24


