UNITED STATES
SECURITIES AND EXCHANGE COMMISSION
Washington, D.C. 20549
Form 10-K | | | | | |
| ☑ | ANNUAL REPORT PURSUANT TO SECTION 13 OR 15(d) OF THE SECURITIES EXCHANGE ACT OF 1934 |
| For the fiscal year ended December 31, 2024 |
OR
| | | | | |
| ☐ | TRANSITION REPORT PURSUANT TO SECTION 13 OR 15(d) OF THE SECURITIES EXCHANGE ACT OF 1934 |
| For the transition period from to |
Commission File No. 1-7657
American Express Company
(Exact name of registrant as specified in its charter) | | | | | |
| New York | 13-4922250 |
| (State or other jurisdiction of incorporation or organization) | (I.R.S. Employer Identification No.) |
200 Vesey Street New York, New York | 10285 |
| (Address of principal executive offices) | (Zip Code) |
Registrant’s telephone number, including area code: (212) 640-2000
Securities registered pursuant to Section 12(b) of the Act: | | | | | | | | |
| Title of each class | Trading Symbol(s) | Name of each exchange on which registered |
| Common Shares (par value $0.20 per Share) | AXP | New York Stock Exchange |
Securities registered pursuant to section 12(g) of the Act: None
Indicate by check mark if the registrant is a well-known seasoned issuer, as defined in Rule 405 of the Securities Act. Yes þ No o
Indicate by check mark if the registrant is not required to file reports pursuant to Section 13 or Section 15(d) of the Act. Yes o No þ
Indicate by check mark whether the registrant (1) has filed all reports required to be filed by Section 13 or 15(d) of the Securities Exchange Act of 1934 during the preceding 12 months (or for such shorter period that the registrant was required to file such reports) and (2) has been subject to such filing requirements for the past 90 days. Yes þ No o
Indicate by check mark whether the registrant has submitted electronically every Interactive Data File required to be submitted pursuant to Rule 405 of Regulation S-T (§ 232.405 of this chapter) during the preceding 12 months (or for such shorter period that the registrant was required to submit such files). Yes þ No o
Indicate by check mark whether the registrant is a large accelerated filer, an accelerated filer, a non-accelerated filer, a smaller reporting company, or an emerging growth company. See the definitions of “large accelerated filer,” “accelerated filer,” “smaller reporting company” and “emerging growth company” in Rule 12b-2 of the Exchange Act. | | | | | | | | | | | | | | |
Large accelerated filer þ | Accelerated filer o | Non-accelerated filer o | Smaller reporting company ☐ | Emerging growth company ☐ |
If an emerging growth company, indicate by check mark if the registrant has elected not to use the extended transition period for complying with any new or revised financial accounting standards provided pursuant to Section 13(a) of the Exchange Act. o
Indicate by check mark whether the registrant has filed a report on and attestation to its management’s assessment of the effectiveness of its internal control over financial reporting under section 404(b) of the Sarbanes-Oxley Act (15 U.S.C. 7262(b)) by the registered public accounting firm that prepared or issued its audit report. þ
If securities are registered pursuant to Section 12(b) of the Act, indicate by check mark whether the financial statements of the registrant included in the filing reflect the correction of an error to previously issued financial statements. o
Indicate by check mark whether any of those error corrections are restatements that required a recovery analysis of incentive-based compensation received by any of the registrant’s executive officers during the relevant recovery period pursuant to § 240.10D-1(b). o
Indicate by check mark whether the registrant is a shell company (as defined in Rule 12b-2 of the Act). Yes ☐ No þ
As of June 30, 2024, the aggregate market value of the registrant’s voting shares held by non-affiliates of the registrant was approximately $164.7 billion based on the closing sale price as reported on the New York Stock Exchange.
As of January 31, 2025, there were 702,532,111 common shares of the registrant outstanding.
DOCUMENTS INCORPORATED BY REFERENCE
Part III: Portions of Registrant’s Proxy Statement to be filed with the Securities and Exchange Commission in connection with the Annual Meeting of Shareholders to be held on April 29, 2025.
TABLE OF CONTENTS
| | | | | | | | |
Form 10-K
Item Number | | Page |
| | |
| | |
| | |
| | |
| | |
| | |
| | |
| | |
| | |
| | |
| | |
| | |
| | |
| | |
| | |
| | |
| | |
| | |
| | |
| | |
| | |
| | |
| | |
| | |
| | |
| | |
| | |
| | |
| | |
| | |
| | |
| | |
| | |
| | |
| 9C. | | |
| | |
| | |
| | |
| | |
| | |
| | |
| | |
| | |
| | |
| | |
| | |
| | |
This Annual Report on Form 10-K, including the “Management’s Discussion and Analysis of Financial Condition and Results of Operations,” contains forward-looking statements within the meaning of the Private Securities Litigation Reform Act of 1995 that are subject to risks and uncertainties. You can identify forward-looking statements by words such as “believe,” “expect,” “anticipate,” “intend,” “plan,” “aim,” “will,” “may,” “should,” “could,” “would,” “likely,” “estimate,” “potential,” “continue” or other similar expressions. We discuss certain factors that affect our business and operations and that may cause our actual results to differ materially from these forward-looking statements under “Risk Factors” and “Cautionary Note Regarding Forward-Looking Statements.” You are cautioned not to place undue reliance on these forward-looking statements, which speak only as of the date on which they are made. We undertake no obligation to update publicly or revise any forward-looking statements.
This report includes trademarks, such as American Express®, which are protected under applicable intellectual property laws and are the property of American Express Company or its subsidiaries. This report also contains trademarks, service marks, copyrights and trade names of other companies, which are the property of their respective owners. Solely for convenience, our trademarks and trade names referred to in this report may appear without the ® or ™ symbols, but such references are not intended to indicate, in any way, that we will not assert, to the fullest extent under applicable law, our rights or the right of the applicable licensor to these trademarks and trade names.
Throughout this report the terms “American Express,” “we,” “our” or “us,” refer to American Express Company and its subsidiaries on a consolidated basis, unless stated or the context implies otherwise. The use of the term “partner” or “partnering” in this report does not mean or imply a formal legal partnership, and is not meant in any way to alter the terms of American Express’ relationship with any third parties. Refer to the “Glossary of Selected Terminology” under “MD&A” for the definitions of other key terms used in this report.
PART I
ITEM 1. BUSINESS
Overview
American Express is a globally integrated payments company with card-issuing, merchant-acquiring and card network businesses that offer products and services to a broad range of customers, including consumers, small businesses, mid-sized companies and large corporations around the world.
Our range of products and services includes:
•Credit card, charge card, banking and other payment and financing products
•Merchant acquisition and processing, servicing and settlement, fraud prevention, and point-of-sale marketing and information products and services
•Network services
•Travel and lifestyle services
•Expense management products and services
•Other services, such as the design and operation of customer loyalty programs
These products and services are offered through various channels, including mobile and online applications, affiliate marketing, customer referral programs, third-party service providers and business partners, in-house sales teams, direct mail, telephone and direct response advertising.
We were founded in 1850 as a joint stock association and were incorporated in 1965 as a New York corporation. American Express Company and its principal operating subsidiary, American Express Travel Related Services Company, Inc. (TRS), are bank holding companies under the Bank Holding Company Act of 1956, as amended (the BHC Act), subject to supervision and examination by The Board of Governors of the Federal Reserve System (the Federal Reserve).
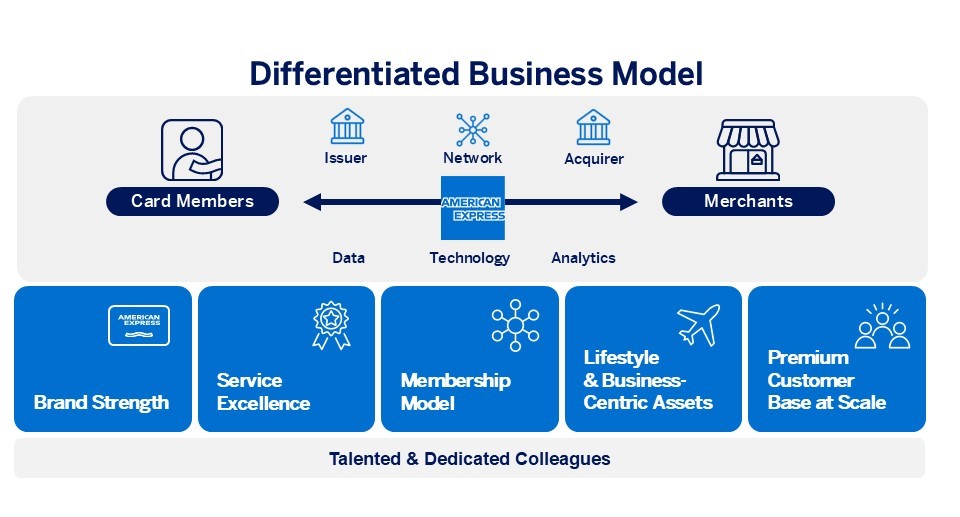
We principally engage in businesses comprising four reportable operating segments: U.S. Consumer Services (USCS), Commercial Services (CS), International Card Services (ICS) and Global Merchant and Network Services (GMNS). Corporate functions and certain other businesses are included in Corporate & Other. Our businesses function together to form our end-to-end integrated payments platform, which we believe is a differentiator that underpins our business model. For further information about our reportable operating segments, see “Business Segment Results of Operations” under “MD&A.”
Our Integrated Payments Platform and Technology
Through our card-issuing, merchant-acquiring and card network businesses, we are able to connect participants and provide differentiated value across the commerce path. We maintain direct relationships with Card Members (as a card issuer) and merchants (as an acquirer), which provides us with access to information at both ends of the card transaction, distinguishing our integrated payments platform from the bankcard networks. Through contractual relationships, we also obtain information from third-party card issuers, merchant acquirers, aggregators and processors with whom we do business.
Our integrated payments platform and the systems and infrastructure that underlie it provide us with data and analytics, while maintaining our commitment to respect Card Member preferences and protect Card Member and merchant data in compliance with applicable policies and legal requirements. Our models and analytical tools help us reduce fraud and underwrite risk, such as in determinations regarding the extension of credit. We also leverage our technology to provide differentiated value to customers, such as special offers and benefits to Card Members and targeted marketing and other information services for merchants and partners, as well as to develop and improve our service capabilities to continue to deliver a high-quality customer experience.
Card Issuing Businesses
We are a leader in providing general purpose credit and charge cards to consumers, small businesses, mid-sized companies and large corporations. We offer a broad set of card products, rewards and services to this premium consumer and broad commercial customer base, in the United States and internationally, through our USCS, CS and ICS reportable operating segments. We focus on differentiating American Express Membership through premium products, lifestyle services for consumers and business-centric solutions for our commercial customers, and benefits for our Card Members that we co-create and co-fund with our business partners. We believe the many benefits that come with American Express Membership build a strong, emotional connection with our brand across generations and geographies.
We acquire and retain high-spending, engaged and creditworthy Card Members by:
•Designing innovative credit, charge and debit card products and payment and lending solutions that appeal to our target customer base and meet their spending and borrowing needs
•Using incentives to drive spending on our various card products and increase customer engagement, including our Membership Rewards® and Amex Offers™ programs, cash-back reward features, statement credits for purchases with partners, interest rates offered on deposits and participation in loyalty programs sponsored by our cobrand and other partners
•Providing digital and mobile services and an array of benefits and experiences across card products, such as lounge access, dining experiences and other travel and lifestyle benefits
•Creating world-class service experiences by delivering exceptional customer care
•Developing a wide range of partner relationships, including designing, cobranding and distributing certain of our cards and providing benefits and services to our Card Members
We have a number of products that complement our card products, such as our business checking and consumer rewards checking account products, expense management and business-to-business (B2B) payment products and other non-card payment and financing products. Our complementary products also include digital capabilities, such as our Business Blueprint digital cash flow management hub and our Resy® dining platform, which we are enhancing through our acquisitions in 2024 of Tock, a reservation, table and event management technology provider and Rooam, a technology company that powers systems used by restaurants and entertainment venues.
We are focused on enhancing the value propositions of our products to increase engagement with existing customers and attract new customers, including Millennial and Gen Z consumers as well as customers internationally. Jurisdictions that represent a significant portion of our billed business outside of the United States include the United Kingdom (UK), the European Union (EU), Australia, Japan, Canada and Mexico.
For the year ended December 31, 2024, worldwide billed business (spending on American Express cards issued by us) was $1,551 billion and as of December 31, 2024, we had 83.6 million proprietary cards-in-force worldwide.
Merchant Acquiring Business
Our GMNS reportable operating segment builds and manages relationships with millions of merchants around the world that choose to accept American Express cards. This includes signing new merchants to accept our cards, agreeing on the discount rate (a fee charged to the merchant for accepting our cards) and handling servicing for merchants. We also build and maintain relationships with merchant acquirers, aggregators and processors to manage aspects of our merchant services business. For example, through our OptBlue® merchant-acquiring program, third-party processors contract directly with small merchants for card acceptance on our network and determine merchant pricing. We continue to grow merchant acceptance of American Express cards around the world and work with merchant partners so that our Card Members are warmly welcomed and encouraged to spend in the millions of places where their American Express cards are accepted. We also seek to drive greater usage of the American Express network by deepening merchant engagement and increasing Card Member awareness through initiatives such as our Shop Small® campaigns and expanding our payment options such as through debit and B2B capabilities.
GMNS also provides fraud-prevention tools, marketing solutions, data analytics and other programs and services to merchants and other partners that leverage the capabilities of our integrated payments platform.
Card Network Business
We operate a payments network through which we establish and maintain relationships with third-party banks and other institutions in approximately 120 countries and territories, licensing the American Express brand and extending the reach of our global network. These network partners are licensed to issue local currency American Express-branded cards in their countries and/or serve as the merchant acquirer for local merchants on our network.
For the year ended December 31, 2024, worldwide network services processed volume (spending on American Express cards issued by third parties) was $213.9 billion and as of December 31, 2024, we had 62.8 million cards-in-force issued by third parties worldwide.
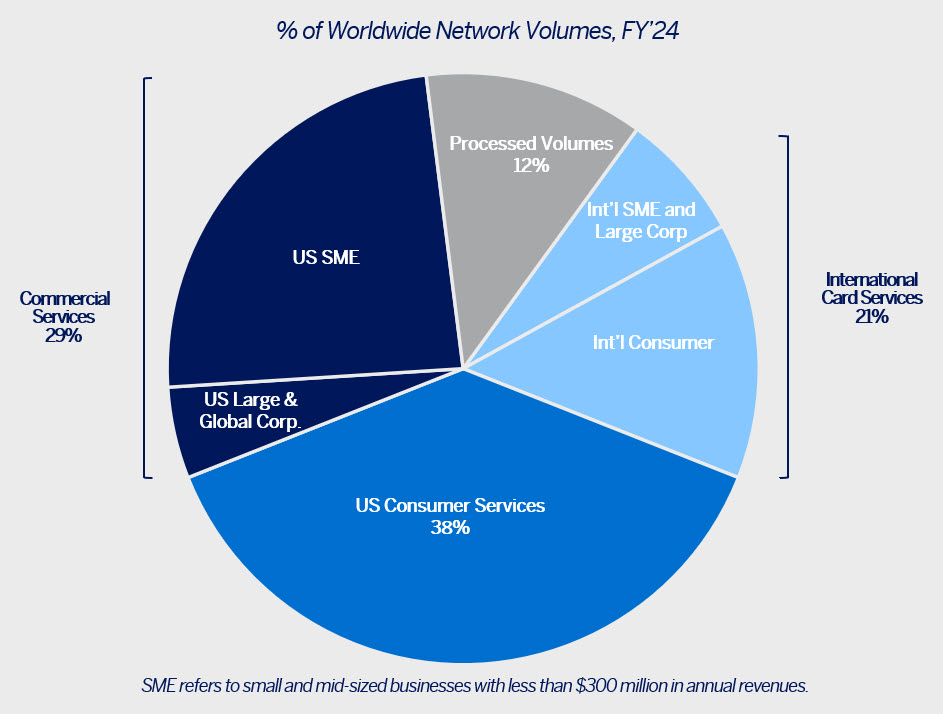
Diverse Customer Base and Global Footprint
The following chart provides a summary of our diverse set of customers and broad geographic footprint based on worldwide network volumes:
Partners and Relationships
Our integrated payments platform allows us to work with a range of business partners, and our partners in return help drive the scale and relevance of the platform.
There are many examples of how we work with partners, including: issuing cards under cobrand arrangements with other corporations and institutions (e.g., Delta Air Lines (Delta), Hilton Worldwide Holdings, Marriott International and British Airways); providing greater value to our Card Members (e.g., Amex Offers and statement credits for purchases with partners); offering innovative ways for our Card Members to earn and use points with our merchants (e.g., Pay with Points at Amazon.com); expanding merchant acceptance with third-party acquirers and processors (e.g., OptBlue partners); operating through joint ventures in certain jurisdictions (e.g., in China, the Middle East and Switzerland); developing new capabilities and features with our digital partners (e.g., PayPal and i2c); enhancing our travel benefits and services (e.g., Fine Hotels and Resorts®); and providing experiences and entertainment for Card Members (e.g., via Formula 1 and AEG Worldwide). We also have an ownership position in, and commercial arrangements with, Global Business Travel Group, Inc. (GBTG), which provides business travel-related services.
Delta is our largest strategic partner. Our relationships with, and revenues and expenses related to, Delta are significant and represent an important source of value for our Card Members. We issue cards under cobrand arrangements with Delta and the Delta cobrand portfolio continued to represent approximately 12 percent of worldwide billed business and approximately 21 percent of worldwide Card Member loans as of December 31, 2024. The Delta cobrand portfolio generates fee revenue and interest income from Card Members and discount revenue from Delta and other merchants for spending on Delta cobrand cards. The current Delta cobrand agreement runs through the end of 2029 and we expect to continue to make significant investments in this partnership. Among other things, Delta is also a key participant in our Membership Rewards program, provides travel-related benefits and services, including airport lounge access for certain American Express Card Members, accepts American Express cards as a merchant and is a corporate payments customer.
Working with all of our partners, we seek to provide value, choice and unique experiences across our customer base.
Our Spend-Centric Model and Revenue Mix
Our “spend-centric” business model focuses on generating revenues primarily by driving spending on our cards and secondarily through finance charges and fees. Spending on our cards, which is higher on average on a per-card basis versus our network competitors, offers superior value to merchants in the form of loyal customers and larger transactions, and attracts partners to provide value to our Card Members and merchants. Because of the revenues generated from having high-spending Card Members and the annual card fees we charge on many of our products, we are able to invest in attractive rewards and other benefits for Card Members, as well as targeted marketing and other programs and investments for merchants. This creates incentives for Card Members to spend more on their cards and positively differentiates American Express cards.
We believe our spend-centric model gives us the ability to provide differentiated value to Card Members, merchants and business partners.
The American Express Brand and Service Excellence
Our brand and its attributes—trust, security and service—are key assets. We invest heavily in managing, marketing, promoting and protecting our brand, including through the delivery of our products and services in a manner consistent with our brand promise. The American Express brand is ranked among the most valuable brands in the world. We place significant importance on trademarks, service marks and patents, and seek to secure our intellectual property rights around the world.
We aim to provide the world’s best customer experience every day and our reputation for world-class service has been recognized by numerous awards over the years. Our customer care professionals, travel consultants and partners treat servicing interactions as an opportunity to bring the brand to life for our customers, add meaningful value and deepen relationships.
Our Business Strategies
We seek to grow our business by focusing on four strategic imperatives:
First, we aim to expand our leadership in the premium consumer space by continuing to deliver membership benefits that span our customers’ everyday spending, borrowing, travel and lifestyle needs, expanding our roster of business partners around the globe and developing a range of experiences that attract high-spending customers.
Second, we seek to build on our strong position in commercial payments by evolving our card value propositions, further differentiating our corporate card and accounts payable expense management solutions and designing innovative products and features, including financing, banking and payment solutions for our business customers.
Third, we are focused on strengthening our global, integrated network by continuing to increase merchant acceptance, providing merchants with fraud protection services, marketing insights and connections to higher-spending Card Members and working with our network partners to offer expanded products and services.
Finally, we want to continue to build on our unique global position, seeking ways to use our differentiated business model and global presence as we progress against our other strategic imperatives.
We have completed the environmental, social and governance goals under our 2021–2024 strategy, other than our continued work in support of Small Business Saturday and other Shop Small campaigns that will progress in 2025 and beyond. We are reviewing our approach on these topics as mandatory reporting requirements evolve globally.
Our Colleagues
Our colleagues are integral to executing our business strategies and to our overall success. As of December 31, 2024, we employed approximately 75,100 people, whom we refer to as colleagues, with approximately 25,800 colleagues in the United States and approximately 49,300 colleagues outside the United States. As of December 31, 2024, women represented 52.6 percent of our global workforce; Asian, Black/African American and Hispanic/Latino/a people represented 22.4 percent, 14.2 percent and 14.5 percent, respectively, of our U.S. workforce based on preliminary data for our 2024 U.S. EEO-1 submission; and 55 percent of our Executive Committee were women or from diverse races and ethnic backgrounds.
We believe that maintaining our strong workplace culture, adhering to our Blue Box values and ensuring that our people feel included, valued, recognized and backed helps us attract, retain and develop the right talent for American Express’ success. We conduct an annual Colleague Experience Survey and in 2024, 90 percent of colleagues who participated in the survey said they would recommend American Express as a great place to work.
We strive to offer a compelling colleague value proposition, which represents the many ways in which we support our colleagues to be and deliver their best. In 2024, we continued to invest in our colleagues, building on a wide range of learning and development opportunities and enhancing our competitive benefits in key areas including total compensation and holistic health and wellness.
We continuously invest in programs, benefits and resources to foster the personal and professional growth of our colleagues. We start with opportunities for colleagues to learn on the job, build cross-functional skills and grow in their careers through a defined, collaborative process for performance management. Colleagues have access to a wide variety of resources: career coaching, mentoring, professional networking, and rotation opportunities, as well as courses on-demand and with classroom-style instruction.
We aim to provide our colleagues with competitive compensation and leading benefits and take a holistic approach to well-being, providing resources that address the physical, financial and mental health of our colleagues. Our financial well-being program, Smart Saving, provides tools and resources to help colleagues build their knowledge and skills for all life stages. We support our colleagues’ physical health and well-being through our corporate wellness program, Healthy Living and we provide resources and support to increase awareness about mental health among our colleagues through our Healthy Minds Program. We also have policies and processes in place to help ensure we compensate colleagues fairly and equitably. We review our compensation practices regularly and have conducted an annual pay equity review since 2017, assessing pay on a statistical basis and considering key factors known to affect compensation, such as role, level, tenure, performance and geography. In 2024, we maintained 100 percent pay equity, meaning no statistical differences in pay, for colleagues across genders globally and across races and ethnicities in the United States.
Information About Our Executive Officers
Set forth below, in alphabetical order, is a list of our executive officers as of February 7, 2025, including each executive officer’s principal occupation and employment during the past five years. None of our executive officers has any family relationship with any other executive officer, and none of our executive officers became an officer pursuant to any arrangement or understanding with any other person. Each executive officer has been elected to serve until the next annual election of officers or until his or her successor is elected and qualified. Each officer’s age is indicated by the number in parentheses next to his or her name.
| | | | | |
| DOUGLAS E. BUCKMINSTER — | Vice Chairman |
| Mr. Buckminster (64) has been Vice Chairman since April 2021. Prior thereto, he had been Group President, Global Consumer Services Group since February 2018. |
| |
| HOWARD GROSFIELD — | Group President, U.S. Consumer Services |
| Mr. Grosfield (56) has been Group President, U.S. Consumer Services since February 2025. Prior thereto, he had been President, U.S. Consumer Services since May 2022, Executive Vice President and General Manager of U.S. Consumer Marketing and Global Premium Services since February 2021 and Executive Vice President and General Manager of U.S. Consumer Marketing Services from January 2016 to February 2021. |
| |
| MONIQUE HERENA — | Chief Colleague Experience Officer |
| Ms. Herena (53) has been Chief Colleague Experience Officer since April 2019. |
| |
| RAYMOND JOABAR — | Group President, Global Commercial Services |
| Mr. Joabar (59) has been Group President, Global Commercial Services since February 2025. Prior thereto, he had been Group President, Global Merchant and Network Services since April 2021 and President, Global Risk and Compliance and Chief Risk Officer since September 2019. |
|
| CHRISTOPHE Y. LE CAILLEC — | Chief Financial Officer |
| Mr. Le Caillec (59) has been Chief Financial Officer (CFO) since August 2023. Prior thereto, he had been Deputy CFO since December 2021 and Head of Corporate Planning since February 2019. |
| |
| RAFAEL MARQUEZ — | President, International Card Services |
| Mr. Marquez (53) has been President, International Card Services since May 2022. Prior thereto, he had been President, International Consumer Services and Global Loyalty Coalition since September 2019. |
| |
| ANNA MARRS — | Group President, Global Merchant and Network Services |
| Ms. Marrs (51) has been Group President, Global Merchant and Network Services since February 2025. Prior thereto, she had been Group President, Global Commercial Services and Credit & Fraud Risk since April 2021 and President, Global Commercial Services since September 2018. |
| |
| GLENDA MCNEAL — | Chief Partner Officer |
| Ms. McNeal (64) has been Chief Partner Officer since February 2024. Prior thereto, she had been President, Enterprise Strategic Partnerships since March 2017. |
| |
| DENISE PICKETT — | President, Enterprise Shared Services |
| Ms. Pickett (59) has been President, Enterprise Shared Services since February 2025. Prior thereto, she had been President, Global Services Group since September 2019. |
| |
| |
| |
|
| |
| |
|
| |
| |
|
| |
| |
|
| |
| |
|
| |
| |
|
| | | | | |
| RAVI RADHAKRISHNAN — | Chief Information Officer |
| Mr. Radhakrishnan (53) has been Chief Information Officer since January 2022. Mr. Radhakrishnan joined American Express from Wells Fargo & Company, where he served as Chief Information Officer for the Commercial Banking and Corporate & Investment Banking businesses since May 2020. Prior thereto, he had been Chief Information Officer, Wholesale, Wealth & Investment Management and Innovation from May 2019 to May 2020. |
| |
| ELIZABETH RUTLEDGE — | Chief Marketing Officer |
| Ms. Rutledge (63) has been Chief Marketing Officer since February 2018. |
| |
| LAUREEN E. SEEGER — | Chief Legal Officer |
| Ms. Seeger (63) has been Chief Legal Officer since July 2014. |
| |
| JENNIFER SKYLER — | Chief Corporate Affairs Officer |
| Ms. Skyler (48) has been Chief Corporate Affairs Officer since October 2019. |
| |
| STEPHEN J. SQUERI — | Chairman and Chief Executive Officer |
| Mr. Squeri (65) has been Chairman and Chief Executive Officer since February 2018. |
| |
| DOUGLAS TABISH — | Chief Risk Officer |
| Mr. Tabish (55) has been Chief Risk Officer since April 2024. Prior thereto, he had been Executive Vice President and General Manager of Global Card & Risk Operations since January 2020. |
COMPETITION
We compete in the global payments industry with networks, issuers, acquirers and other payment service providers and methods of payment, including paper-based transactions (e.g., cash and checks) and electronic transfers (e.g., wire transfers and Automated Clearing House (ACH)), as well as evolving and growing alternative mechanisms, systems and products that leverage new technologies, business models and customer relationships to create payment, financing or banking solutions. The payments industry continues to undergo dynamic changes in response to evolving technologies, consumer habits and merchant needs.
As a card issuer, we compete with financial institutions that issue general-purpose credit and debit cards, as well as businesses that issue private label cards, operate mobile wallets, provide payment services or extend credit. We face intense competition in the premium space and for cobrand relationships, as both card issuer and network competitors have targeted high-spending customers and key business partners with attractive value propositions. We also face competition for partners and other differentiated offerings, such as lounge space in U.S. and global hub airports, dining and event reservation and operational capabilities and other experiential offerings to customers. Our banking products also face strong competition, such as with respect to the rates offered on deposits.
Our global card network competes in the global payments industry with other card networks, including, among others, Visa, China UnionPay, Mastercard, JCB, Discover and Diners Club International (which is owned by Discover). We are the fourth largest general-purpose card network globally based on purchase volume, behind Visa, China UnionPay and Mastercard. In addition to such networks, we compete against a range of companies globally, including merchant acquirers, processors and web- and mobile-based payment platforms (e.g., Alipay, PayPal and Shop Pay), as well as regional payment networks (such as the National Payments Corporation of India).
The principal competitive factors that affect card-issuing, merchant and network businesses include:
•The features, value and quality of the products and services, including customer care, rewards programs and offers, partnerships, travel and lifestyle-related benefits (including lounges, dining and other entertainment), banking services and digital and mobile services, as well as the costs associated with providing such features and services
•Reputation and brand recognition
•The number, spending characteristics and credit performance of customers
•The quantity, diversity and quality of the establishments where the cards can be used
•The attractiveness of the value proposition to card issuers, merchant acquirers, third-party processors, cardholders, corporate clients, merchants and other payment intermediaries (including the relative cost and ease of using or accepting the products and services, and capabilities such as fraud prevention and data analytics)
•The number, quality and cost of other cards and other forms of payment and financing available to customers, as well as the integration and connectivity of those products
•The security of cardholder, merchant and network partner information
•The success of marketing and promotional campaigns
•The speed of innovation and investment in systems, technologies and product and service offerings
•The nature and quality of expense management tools, electronic payment methods and data capture and reporting capabilities, particularly for business customers
Another aspect of competition is the dynamic and rapid growth of alternative payment and financing mechanisms, systems and products, which include payment facilitators and aggregators, digital payment, open banking and electronic wallet platforms, point-of-sale lenders and buy now, pay later products, real-time settlement and processing systems, financial technology companies, digital currencies developed by both central banks and the private sector, blockchain and similar distributed ledger technologies, prepaid systems and gift cards, and systems linked to customer accounts or that provide payment solutions. The integration of new or evolving technologies, such as generative artificial intelligence, has the potential to create new or better competitor products, alter the competitive environment and disintermediate our relationship with customers. Additionally, various competitors are integrating more financial services into their product offerings and competitors are seeking to attain the benefits of an integrated payments platform, such as ours.
In addition to the discussion in this section, see “Our operating results may materially suffer because of substantial and increasingly intense competition worldwide in the payments industry” under “Risk Factors” for further discussion of the potential impact of competition on our business, and “Our business is subject to evolving and comprehensive government regulation and supervision, which could materially adversely affect our results of operations and financial condition” and “Legal proceedings regarding provisions in our merchant contracts, including non-discrimination and honor-all-cards provisions, could have a material adverse effect on our business and result in additional litigation and/or arbitrations, changes to our merchant agreements and/or business practices, substantial monetary damages and damage to our reputation and brand” under “Risk Factors” for a discussion of the potential impact on our ability to compete effectively due to government regulations or if ongoing legal proceedings limit our ability to prevent merchants from engaging in various actions to discriminate against our card products.
SUPERVISION AND REGULATION
Overview
We are subject to evolving and extensive government regulation and supervision in jurisdictions around the world, and the costs of ongoing compliance are substantial. The financial services industry is subject to rigorous scrutiny, high regulatory expectations, a range of regulations and a stringent and unpredictable enforcement environment.
Governmental authorities have focused, and we believe will continue to focus, considerable attention on reviewing compliance by financial services firms and payment systems with laws and regulations, and as a result, we continually work to evolve and improve our risk management framework, governance structures, practices and procedures. Reviews by us and governmental authorities to assess compliance with laws and regulations, as well as our own internal reviews to assess compliance with internal policies, including errors or misconduct by colleagues or third parties or control failures, have resulted in, and are likely to continue to result in, changes to our products, practices and procedures, restitution to our customers and increased costs related to regulatory oversight, supervision and examination. We have also been subject to regulatory actions and may continue to be the subject of such actions, including governmental inquiries, investigations, enforcement proceedings and the imposition of fines or civil money penalties, in the event of noncompliance or alleged noncompliance with laws or regulations. For example, as previously disclosed, we entered into agreements to resolve governmental investigations related to historical sales practices for certain U.S. small business customers, which are described in more detail in Note 12 to the “Consolidated Financial Statements.” In addition, various regulatory agencies have announced they are reviewing credit card rewards programs for compliance with consumer protection laws and regulations. We have identified certain issues related to the rewards and benefits we provide including, as previously disclosed, that certain U.S. Card Members were not credited certain Membership Rewards points they had earned. We have taken actions to remediate these issues and enhance our related procedures and controls. We are cooperating with ongoing regulatory inquiries concerning our rewards and benefits programs.
Policymakers around the world continue to propose and adopt new and increasingly complex laws and regulations governing a wide variety of issues that may impact our business or change our operating environment in substantial and unpredictable ways. For example, legislators and regulators in various countries in which we operate have focused on the offering of consumer financial products and the operation of payment networks, resulting in changes to certain practices or pricing of card issuers, merchant acquirers and payment networks, and, in some cases, the establishment of broad and ongoing regulatory oversight regimes.
The following discussion summarizes elements of the extensive regulatory environment in which we operate; it does not purport to be complete or to describe all of the laws or regulations to which we are subject or all possible or proposed changes in laws or regulations that may become applicable to us. See “Operational and Compliance/Legal Risks” under “Risk Factors” for a discussion of the potential impact that changes in applicable law or regulation, and in their interpretation and application by regulatory agencies and other governmental authorities, may have on our business, results of operations and financial condition.
Banking Regulation
American Express entities are subject to banking regulation in the United States and in certain jurisdictions internationally. U.S. federal and state banking laws, regulations and policies extensively regulate the Company, TRS and our U.S. bank subsidiary, American Express National Bank (AENB). For purposes of this Supervision and Regulation section, the “Company” refers only to American Express Company, a bank holding company, and does not include its subsidiaries. Both the Company and TRS are subject to comprehensive consolidated supervision, regulation and examination by the Federal Reserve and AENB is supervised, regulated and examined by the Office of the Comptroller of the Currency (OCC). The Company and its subsidiaries are also subject to the rulemaking, enforcement and examination authority of the Consumer Financial Protection Bureau (CFPB). Banking regulators have broad examination and enforcement powers, including the power to impose substantial fines, limit dividends and other capital distributions, restrict operations and acquisitions and require divestitures, any of which could compromise our competitive position. Many aspects of our business also are subject to rigorous regulation by other U.S. federal and state regulatory agencies and by non-U.S. government agencies and regulatory bodies. For example, non-U.S. regulators supervising our international regulated financial institutions use many of the same principles of regulation and supervision that are used by U.S. federal bank regulators.
Activities
The BHC Act generally limits bank holding companies to activities that are considered to be banking activities and certain closely related activities. As noted above, each of the Company and TRS is a bank holding company and each has elected to become a financial holding company, which is authorized to engage in a broader range of financial and related activities. In order to remain eligible for financial holding company status, the Company and TRS must meet certain eligibility requirements. Those requirements include that each of the Company and AENB must be “well capitalized” and “well managed,” and AENB must have received at least a “satisfactory” rating on its most recent assessment under the Community Reinvestment Act of 1977 (the CRA). The Company, TRS and their subsidiaries engage in various activities permissible only for financial holding companies, including, in particular, providing travel agency services, acting as a finder and engaging in certain insurance underwriting and agency services. If the Company fails to meet eligibility requirements for financial holding company status, it and its subsidiaries are likely to be barred from engaging in new types of financial activities or making certain types of acquisitions or investments in reliance on its status as a financial holding company, and ultimately could be required to either discontinue the broader range of activities permitted to financial holding companies or divest AENB. In addition, the Company and its subsidiaries are prohibited by law from engaging in practices that regulatory authorities deem unsafe or unsound (which such authorities generally interpret broadly) and regulatory authorities have discretion in determining whether new or modified activities can be conducted in a safe and sound manner.
Acquisitions and Investments
Applicable federal and state laws place limitations on the ability of persons to invest in or acquire control of us without providing notice to or obtaining the approval of one or more of our regulators. In addition, we are subject to banking laws and regulations that limit our investments and acquisitions and, in some cases, subject them to the prior review and approval of our regulators, including the Federal Reserve and the OCC. Federal banking regulators have broad discretion in evaluating proposed acquisitions and investments that are subject to their prior review or approval.
Enhanced Prudential Standards
The Company is subject to the U.S. federal bank regulatory agencies’ rules that tailor the application of enhanced prudential standards to bank holding companies and depository institutions with $100 billion or more in total consolidated assets. Under these rules, each such bank holding company is assigned to one of four categories based on its status as a U.S. global systemically important banking organization and five other risk-based indicators: (i) total assets, (ii) cross-jurisdictional activity, (iii) non-bank assets, (iv) off-balance sheet exposure, and (v) weighted short-term wholesale funding, with the most stringent requirements applying to Category I firms and the least stringent requirements applying to Category IV firms. Under these rules, the Company became a Category III firm in the third quarter of 2024 as a result of the Company’s total consolidated assets exceeding $250 billion, calculated based on a daily average of total consolidated assets for the four quarters ended June 30, 2024. Category III firms are subject to heightened capital, liquidity and prudential requirements, single-counterparty credit limits and additional stress tests, which in some cases are subject to a transition period. AENB, as a depository institution subsidiary of a Category III firm, is also subject to certain enhanced prudential standards under these tailoring rules as described below.
Further changes in the levels of risk-based indicators described above, such as if we have $75 billion or more in cross-jurisdictional activity (based on a four-quarter trailing average), could result in the Company becoming a Category II firm and subject to more stringent capital, liquidity and prudential requirements. Our cross-jurisdictional activity was $66 billion as of December 31, 2024, and the four-quarter trailing average was $67 billion.
Capital and Liquidity Regulation
Capital Rules
The Company and AENB are required to comply with the applicable capital adequacy rules established by federal banking regulators. These rules are intended to ensure that bank holding companies and depository institutions (collectively, banking organizations) have adequate capital given their level of assets and off-balance sheet obligations. The federal banking regulators’ current capital rules (the Capital Rules) implement the Basel Committee on Banking Supervision’s framework for strengthening international capital regulation, known as Basel III. For additional information regarding our capital ratios, see “Consolidated Capital Resources and Liquidity” under “MD&A.”
Under the Capital Rules, banking organizations are required to maintain minimum ratios for Common Equity Tier 1 (CET1 capital), Tier 1 capital (that is, CET1 capital plus additional Tier 1 capital) and Total capital (that is, Tier 1 capital plus Tier 2 capital) to risk-weighted assets. We report our capital adequacy ratios using risk-weighted assets calculated under the standardized approach. Category III firms such as the Company are not subject to the advanced approaches capital requirements, whereas Category II firms are subject to the advanced approaches capital requirements under current capital rules, which introduce additional complexities in the methodologies used to calculate risk-weighted assets for purposes of determining capital adequacy ratios.
On July 27, 2023, the U.S. federal bank regulatory agencies issued a notice of proposed rulemaking that would significantly revise U.S. regulatory capital requirements for large banking organizations, including the Company and AENB. The proposed rules would apply a new expanded risk-based approach to calculating risk-based capital ratios, and large banking organizations would be required to calculate their risk-based capital ratios under both (i) the standardized approach and (ii) the expanded risk-based approach and use the lower of the two ratio calculations to determine binding capital constraints under each risk-based capital ratio. The expanded risk-based approach to calculating risk-weighted assets would apply more granular risk-weighting methodologies for credit risk, include a new standardized methodology for operational risk, include new approaches for calculating market and credit valuation adjustment risk and revise the treatment of equity exposures not subject to market risk capital requirements. The new approach to calculating market risk also would apply to calculations under the standardized approach. The methodology for operational risk would include differential treatment of fee and other non-interest revenues as compared to interest income for purposes of determining operational risk-weighted assets. The proposed rules would also include additional credit risk capital requirements for certain “unconditionally cancellable commitments” such as unused portions of committed lines of credit (e.g., credit cards) and would create a proxy methodology to assign capital requirements to credit exposure on products that carry no pre-set spending limits such as charge cards. The Federal Reserve has issued public statements indicating that it intends to work with other U.S. federal bank regulatory agencies on a revised proposal; however, any future rulemaking with respect to Basel III standards remains uncertain. The ultimate impact of any such rulemaking will depend on a number of factors, including the content of the final rulemaking, future minimum regulatory requirements and management decisions regarding our product constructs, capital distributions and target capital levels, and such rulemaking could result in significantly higher regulatory capital requirements for the Company and AENB.
The Company and AENB must each maintain CET1 capital, Tier 1 capital and Total capital ratios of at least 4.5 percent, 6.0 percent and 8.0 percent, respectively. On top of these minimum capital ratios, the Company is subject to a dynamic stress capital buffer (SCB) composed entirely of CET1 capital with a floor of 2.5 percent and AENB is subject to a static 2.5 percent capital conservation buffer (CCB). The SCB equals (i) the difference between a bank holding company’s starting and minimum projected CET1 capital ratios under the supervisory severely adverse scenario under the Federal Reserve’s stress tests described below, plus (ii) one year of planned common stock dividends as a percentage of risk-weighted assets. As a Category III firm, the required minimum capital ratios for the Company may be further increased by a countercyclical capital buffer of up to an additional 2.5 percent of risk-weighted assets, if enacted by the Federal Reserve, which must be held in the form of CET1 capital. The countercyclical capital buffer is currently set at zero percent; however it could change in the future. If the Federal Reserve were to raise the countercyclical capital buffer, covered banking organizations such as the Company would generally have 12 months after the announcement of such increase to meet the increased buffer requirement, unless the Federal Reserve sets an earlier effective date.
On August 28, 2024, the Federal Reserve confirmed the SCB for the Company of 2.5 percent, which remained unchanged from the level announced in July 2023. As a result, the effective minimum ratios for the Company (taking into account the SCB requirement) and AENB (taking into account the CCB requirement) are 7.0 percent, 8.5 percent and 10.5 percent for the CET1 capital, Tier 1 capital and Total capital ratios, respectively. Banking organizations with ratios of CET1 capital, Tier 1 capital or Total capital to risk-weighted assets below these effective minimum ratios face constraints on discretionary distributions such as dividends, repurchases and redemptions of capital securities and executive compensation. A bank holding company’s SCB requirement is effective on October 1 of each year and will remain in effect through September 30 of the following year unless it is reset in connection with resubmission of a capital plan, as discussed below.
The Company is also required to comply with minimum leverage ratio requirements. The leverage ratio is the ratio of a banking organization’s Tier 1 capital to its average total consolidated assets (as defined for regulatory purposes). The Company is also subject to a minimum supplementary leverage ratio, which is the ratio of Tier 1 capital to an expanded concept of leverage exposure that takes into account both on‐balance sheet assets and certain off‐balance sheet exposures. All banking organizations are required to maintain a leverage ratio of at least 4.0 percent, and Category III banking organizations such as the Company are required to maintain a minimum supplementary leverage ratio of 3.0 percent.
Liquidity Regulation
The Company and AENB are subject to two standards for liquidity risk supervision as implemented by the Federal Reserve and OCC: the minimum liquidity coverage ratio (LCR) and the net stable funding ratio (NSFR). The LCR is designed to ensure that a banking entity maintains an adequate level of unencumbered high-quality liquid assets to meet its liquidity needs for a 30-day time horizon under an acute liquidity stress scenario specified by supervisors. The LCR measures the ratio of a firm’s high-quality liquid assets to its projected net outflows. The NSFR requires a minimum amount of longer-term funding sources based on the assets, commitments and derivative exposures of banking entities. As a Category III firm with less than $75 billion in weighted short-term wholesale funding, the Company, and its depository institution subsidiary, AENB, are subject to LCR and NSFR requirements at 85 percent of the full requirements. The Company and AENB are required to calculate the LCR and NSFR on a daily basis and the Company is required to make public disclosures related to its LCR on a quarterly basis and NSFR on a semi-annual basis, in each case, subject to applicable transition periods following the Company becoming a Category III firm. Category II firms and their depository institution subsidiaries are subject to the full requirements of the LCR and NSFR, as well as a requirement to submit a liquidity monitoring report on a daily (rather than monthly) basis.
In addition, the Federal Reserve’s enhanced prudential standards rule includes heightened liquidity and risk management requirements. The rule requires the maintenance of a liquidity buffer, consisting of highly liquid assets, that is sufficient to meet projected net outflows for 30 days over a range of liquidity stress scenarios. In contrast to the LCR, which is a standardized approach, the liquidity buffer requirement is calculated based on the Company’s own models.
Proposed Long-Term Debt Requirements
On August 29, 2023, the U.S. federal bank regulatory agencies issued a notice of proposed rulemaking that, if adopted as proposed, would require covered bank holding companies such as the Company to issue and maintain minimum amounts of eligible external long-term debt with specific terms for purposes of absorbing losses or recapitalizing the covered bank holding company and its operating subsidiaries. The notice of proposed rulemaking also proposed requiring certain insured depository institutions that have at least $100 billion in consolidated assets, such as AENB, to maintain minimum amounts of eligible internal long-term debt for purposes of absorbing losses or recapitalizing the insured depository institution.
Stress Testing and Capital Planning
Under the Federal Reserve’s regulations, the Company is subject to annual supervisory stress testing requirements and biennial company-run stress testing requirements (commonly referred to as Dodd-Frank Act Stress Tests or “DFASTs”) that are designed to evaluate whether a bank holding company has sufficient capital on a total consolidated basis to absorb losses and support operations under adverse economic conditions.
As part of the Comprehensive Capital Analysis and Review (CCAR), the Federal Reserve uses pro-forma capital positions and ratios under such stress scenarios to determine the size of the SCB for each CCAR participating firm. As a Category III firm, the Company is required to develop and submit to the Federal Reserve an annual capital plan and stress testing results on or before April 5 of each year.
The Company may be required to revise and resubmit its capital plan following certain events or developments, such as a significant acquisition or an event that could result in a material change in its risk profile or financial condition. If the Company is required to resubmit its capital plan, it must receive prior approval from the Federal Reserve for any capital distributions (including common stock dividend payments and share repurchases), other than a capital distribution on a newly issued capital instrument.
Dividends and Other Capital Distributions
The Company and TRS, as well as AENB and the Company’s insurance and other regulated subsidiaries, are limited in their ability to pay dividends by statutes, regulations and supervisory policy.
Common stock dividend payments and share repurchases by the Company are subject to the oversight of the Federal Reserve and the outcome of the annual CCAR stress testing exercise, as described above. The Company will be subject to limitations and restrictions on capital distributions if, among other things, (i) the Company’s regulatory capital ratios do not satisfy applicable minimum requirements and buffers or (ii) the Company is required to resubmit its capital plan.
In general, federal laws and regulations prohibit, without first obtaining the OCC’s approval, AENB from making dividend distributions to TRS, if such distributions are not paid out of available recent earnings or would cause AENB to fail to meet capital adequacy standards. In addition to specific limitations on the dividends AENB can pay to TRS, federal banking regulators have authority to prohibit or limit the payment of a dividend if, in the banking regulator’s opinion, payment of a dividend would constitute an unsafe or unsound practice in light of the financial condition of the institution.
Prompt Corrective Action
The Federal Deposit Insurance Act (FDIA) requires, among other things, that federal banking regulators take prompt corrective action in respect of depository institutions insured by the FDIC (such as AENB) that do not meet minimum capital requirements. The FDIA establishes five capital categories for FDIC-insured banks: well capitalized, adequately capitalized, undercapitalized, significantly undercapitalized and critically undercapitalized. The FDIA imposes progressively more restrictive constraints on operations, management and capital distributions, depending on the capital category in which an institution is classified. In order to be considered “well capitalized,” AENB must maintain CET1 capital, Tier 1 capital, Total capital and Tier 1 leverage ratios of 6.5 percent, 8.0 percent, 10.0 percent and 5.0 percent, respectively.
Under the FDIA, AENB could be prohibited from accepting brokered deposits (i.e., deposits raised through third-party brokerage networks) or offering interest rates on any deposits significantly higher than the prevailing rate in its normal market area or nationally (depending upon where the deposits are solicited), unless (1) it is well capitalized or (2) it is adequately capitalized and receives a waiver from the FDIC. A portion of our outstanding U.S. retail deposits are considered brokered deposits for bank regulatory purposes. If a federal regulator determines that we are in an unsafe or unsound condition or that we are engaging in unsafe or unsound banking practices, the regulator may reclassify our capital category or otherwise place restrictions on our ability to accept or solicit brokered deposits.
Resolution and Recovery Planning
Certain bank holding companies are required to submit resolution plans to the Federal Reserve and FDIC providing for the company’s strategy for rapid and orderly resolution in the event of its material financial distress or failure. As a Category III firm, the Company is required to submit a holding company resolution plan every three years, with submissions alternating between a full plan and a plan targeted on certain areas or subjects identified by the Federal Reserve and the FDIC. The Company’s next holding company resolution plan is required to be submitted by October 1, 2025. If the Federal Reserve and the FDIC determine that the Company’s plan is not credible and we fail to cure the deficiencies, we may be subject to more stringent capital, leverage or liquidity requirements; may be subject to more restrictions on our growth, activities or operations; or may ultimately be required to divest certain assets or operations to facilitate an orderly resolution.
AENB continues to be required to prepare and provide a separate resolution plan to the FDIC that would enable the FDIC, as receiver, to effectively resolve AENB under the FDIA in the event of failure. In June 2024, the FDIC issued a final rule revising its resolution plan requirements for insured depository institutions, which requires certain insured depository institutions with $100 billion or more in assets, including AENB, to submit full resolution plans every three years with interim supplements in non-submission years. Under the final rule, resolution plans are subject to more stringent standards with respect to their assumptions and content, as well as enhanced credibility standards for the FDIC’s evaluation of resolution plans and expanded expectations regarding engagement and capabilities testing. AENB will be required to submit its initial resolution plan under the final rule on or before July 1, 2026, with its initial interim supplement due on or before July 1, 2025.
In October 2024, the OCC issued final revisions to its recovery planning guidelines, which expand the recovery planning guidelines to apply to insured national banks with $100 billion or more in total consolidated assets, including AENB. The OCC’s recovery planning guidelines require a covered bank to develop, maintain and test a recovery plan that, among other things, identifies a range of options that could be undertaken by the covered bank to restore its financial strength and viability when it experiences considerable financial or operational stress, but has not deteriorated to the point that resolution is imminent. AENB will be required to develop a recovery plan by December 31, 2025 and test it by December 31, 2026, with testing then required periodically (but not less than annually) and following any significant changes to the recovery plan made in response to a material event.
Orderly Liquidation Authority
The Company could become subject to the Orderly Liquidation Authority (OLA), a resolution regime under which the Treasury Secretary may appoint the FDIC as receiver to liquidate a systemically important financial institution, if the Company is in danger of default and is determined to present a systemic risk to U.S. financial stability. As under the FDIC resolution model, under the OLA, the FDIC has broad power as receiver. Substantial differences exist, however, between the OLA and the U.S. Bankruptcy Code, including the right of the FDIC under the OLA to disregard the strict priority of creditor claims in limited circumstances, the use of an administrative claims procedure to determine creditor claims (as opposed to the judicial procedure used in bankruptcy proceedings), and the right of the FDIC to transfer claims to a “bridge” entity.
The FDIC has developed a strategy under OLA, referred to as the “single point of entry” or “SPOE” strategy, under which the FDIC would resolve a failed financial holding company by transferring its assets (including shares of its operating subsidiaries) and, potentially, very limited liabilities to a “bridge” holding company; utilize the resources of the failed financial holding company to recapitalize the operating subsidiaries; and satisfy the claims of unsecured creditors of the failed financial holding company and other claimants in the receivership by delivering securities of one or more new financial companies that would emerge from the bridge holding company. Under this strategy, management of the failed financial holding company would be replaced and its shareholders and creditors would bear the losses resulting from the failure.
FDIC Powers upon Insolvency of AENB
If the FDIC is appointed the conservator or receiver of AENB, the FDIC has the power to: (1) transfer any of AENB’s assets and liabilities to a new obligor without the approval of AENB’s creditors; (2) enforce the terms of AENB’s contracts pursuant to their terms; or (3) repudiate or disaffirm any contract or lease to which AENB is a party, the performance of which is determined by the FDIC to be burdensome and the disaffirmation or repudiation of which is determined by the FDIC to promote the orderly administration of AENB. In addition, the claims of holders of U.S. deposit liabilities and certain claims for administrative expenses of the FDIC against AENB would be afforded priority over other general unsecured claims against AENB, including claims of debt holders and depositors in non-U.S. offices, in the liquidation or other resolution of AENB. As a result, regardless of whether the FDIC ever sought to repudiate any debt obligations of AENB, the debt holders and depositors in non-U.S. offices would be treated differently from, and could receive substantially less, if anything, than the depositors in the U.S. offices of AENB.
Other Banking Regulations
Source of Strength
The Company is required to act as a source of financial and managerial strength to its U.S. bank subsidiary, AENB, and may be required to commit capital and financial resources to support AENB. Such support may be required at times when, absent this requirement, the Company otherwise might determine not to provide it. Capital loans by the Company to AENB are subordinate in right of payment to deposits and to certain other indebtedness of AENB. In the event of the Company’s bankruptcy, any commitment by the Company to a federal banking regulator to maintain the capital of AENB will be assumed by the bankruptcy trustee and entitled to a priority of payment.
Transactions Between AENB and its Affiliates
Certain transactions (including loans and credit extensions from AENB) between AENB and its affiliates (including the Company, TRS and their other subsidiaries) are subject to quantitative and qualitative limitations, collateral requirements and other restrictions imposed by statute and regulation. Transactions subject to these restrictions are generally required to be made on an arm’s-length basis.
FDIC Deposit Insurance and Insurance Assessments
AENB accepts deposits that are insured by the FDIC up to the applicable limits. Under the FDIA, the FDIC may terminate the insurance of an institution’s deposits upon a finding that the institution has engaged in unsafe or unsound practices; is in an unsafe or unsound condition to continue operations; or has violated any applicable law, regulation, rule, order or condition imposed by the FDIC. We do not know of any practice, condition or violation that would lead to termination of deposit insurance at AENB. The FDIC’s deposit insurance fund is funded by assessments on insured depository institutions, including AENB, which are subject to adjustment by the FDIC.
Community Reinvestment Act
AENB is subject to the CRA, which imposes affirmative, ongoing obligations on depository institutions to meet the credit needs of their local communities, including low- and moderate-income neighborhoods, consistent with the safe and sound operation of the institution. AENB is currently designated a “limited purpose bank” under CRA regulations. In October 2023, the U.S. federal bank regulatory agencies adopted a final rule that makes extensive revisions to the CRA regulatory framework, including to the definition of “limited purpose bank,” which could impact AENB and alter its CRA compliance obligations. In March 2024, a preliminary injunction was granted postponing the effectiveness of the final rule and the implementation dates until the resolution of litigation challenging the final rule; whether the final rule will ultimately be implemented and any related compliance deadlines remain uncertain.
Climate Risk Management
In October 2023, the U.S. federal bank regulatory agencies issued “Principles for Climate-Related Financial Risk Management for Large Financial Institutions.” The principles apply to financial institutions with more than $100 billion in total consolidated assets, like the Company and AENB, and are broadly designed to provide a high-level framework for the safe and sound management of exposures to climate-related financial risks consistent with existing U.S. federal bank regulatory agencies’ rules and guidance. The principles outline six key aspects of climate-related financial risk management: governance; policies, procedures and limits; strategic planning; risk management; data, risk measurement and reporting; and scenario analysis. In addition, the principles offer risk assessment guidance for incorporating climate-related financial risks in various traditional risk categories.
Consumer Financial Products Regulation
Our consumer-oriented activities are subject to regulation and supervision in the United States and internationally. In the United States, our marketing, sale and servicing of consumer financial products and our compliance with certain federal consumer financial laws are supervised and examined by the CFPB, which has broad rulemaking and enforcement authority over providers of credit, savings and payment services and products, and authority to prevent “unfair, deceptive or abusive” acts or practices. The CFPB has the authority to write regulations under federal consumer financial protection laws, to enforce those laws and to examine for compliance. It is also authorized to collect fines and require consumer restitution in the event of violations, engage in consumer financial education, track consumer complaints, request data and promote the availability of financial services to underserved consumers and communities. In addition, a number of U.S. states have significant consumer credit protection, disclosure and other laws (in certain cases more stringent than U.S. federal laws). U.S. federal law also regulates abusive debt collection practices, which, along with bankruptcy and debtor relief laws, can affect our ability to collect amounts owed to us or subject us to regulatory scrutiny.
The CFPB and other regulators have recently had a heightened focus on fees, rewards and other practices related to credit cards. For example, in March 2024, the CFPB issued a final rule lowering the safe harbor amount for credit card late fees that would be considered “reasonable and proportional” to the costs incurred by credit card issuers for late payments to eight dollars, eliminating a higher late fee safe harbor amount for subsequent late payments and eliminating the annual inflation adjustment for the safe harbor amount. In May 2024, a preliminary injunction was granted staying the effectiveness of the final rule; however, whether the final rule will ultimately be implemented remains uncertain. In addition, the CFPB and the U.S. Department of Transportation (DOT) have launched inquiries focused on credit card and airline rewards programs, with the CFPB issuing a circular to other agencies in December 2024 addressing the design, marketing and administration of credit card rewards programs.
In March 2023, the CFPB adopted a final rule requiring covered financial institutions, such as us, to collect and report data to the CFPB regarding certain small business credit applications. Based on our small business credit transaction volume, we will be required to comply with this rule by July 18, 2025 and begin reporting data to the CFPB by July 1, 2026.
In October 2024, the CFPB issued a final rule on personal financial data rights that requires financial institutions, including us, and other financial service providers (collectively referred to as data providers) to provide consumers and consumer-authorized third parties with access to consumers’ financial data in electronic form free of charge. At the earliest, for certain products, we will be required to comply with the rule beginning on April 1, 2026; however, the compliance timeline is subject to change due to the outcome of pending litigation challenging the rule. While the impact of the rule will depend upon a number of factors, including consumer behavior and the actions of data providers and recipients, open banking initiatives like this final rule have the potential to change the competitive landscape, presenting challenges to our business model, such as limiting advantages provided by our integrated payments platform, as well as opportunities since we may also act as an authorized third party and receive data from data providers.
We are also regulated in the United States under the “money transmitter” or “sale of check” laws in effect in most states. In addition, we are required by the laws of many states to comply with unclaimed and abandoned property laws, under which we must pay to states the face amount of any Travelers Cheque or prepaid card that is uncashed or unredeemed after a period of time depending on the type of product. Additionally, we are regulated under insurance laws in the United States and other countries where we offer insurance services. Our merchant acquiring business, and the third-party merchant acquirers, aggregators and processors with whom we have relationships, are also subject to certain aspects of regulation under consumer protection laws, such as by the Federal Trade Commission.
In countries outside the United States, regulators continue to focus on a number of key areas impacting our card-issuing businesses, particularly consumer protection (such as in the European Union (EU), the United Kingdom and Canada) and responsible lending (such as in Australia, Mexico, New Zealand and Singapore), with increasing importance on and attention to customers and outcomes rather than just ensuring compliance with local rules and regulations. For example, the Financial Conduct Authority’s Consumer Duty in the United Kingdom, among other things, requires firms to act to deliver “good outcomes” for retail customers with respect to products and services, price and value, consumer understanding and consumer support. Regulators’ expectations of firms in relation to their compliance, risk and control frameworks continue to increase and regulators are placing significant emphasis on a firm’s systems and controls relating to the identification and resolution of issues.
Payments Regulation
Legislators and regulators in various countries in which we operate have focused on the operation of card networks, including through enforcement actions, legislation and regulations to change certain practices or pricing of card issuers, merchant acquirers and payment networks, and, in some cases, to establish broad regulatory regimes for payment systems.
Pricing for card acceptance, including interchange fees (that is, the fee paid by the bankcard merchant acquirer to the card issuer in payment networks like Visa and Mastercard), has been a focus of legislators and regulators in Australia, Canada, the EU, the United States and other jurisdictions. Recently, certain states in the United States have passed or are considering laws prohibiting interchange from being charged on all or certain components of transactions, such as sales tax and gratuities. Jurisdictions have also sought to regulate various other aspects of network operations and contract terms and practices governing merchant card acceptance, including information associated with electronic transactions, such as state legislation regarding the use of specific merchant categories codes or limiting the use of transaction data.
Regulation and other governmental actions relating to operations, pricing or practices could affect all networks and/or acquirers directly or indirectly, as well as adversely impact consumers and merchants. Among other things, regulation of bankcard fees has negatively impacted, and may continue to negatively impact, the discount revenue we earn, including as a result of downward pressure on our merchant discount rates from decreases in competitor pricing in connection with caps on interchange fees. In some cases, regulations also extend to certain aspects of our business, such as network and cobrand arrangements or the terms of card acceptance for merchants. For example, we exited our network business in the EU and Australia as a result of regulation in those jurisdictions. In addition, there is uncertainty as to when or how interchange fee caps and other provisions of the EU payments legislation might apply when we work with cobrand partners and agents in the EU. In 2018, the EU Court of Justice (CJEU) confirmed the validity of fee capping and other provisions in circumstances where three-party networks issue cards with a cobrand partner or through an agent, although its ruling provided only limited guidance as to when or how the provisions might apply in such circumstances and remains subject to differing interpretations by regulators and participants in cobrand arrangements. In December 2024, the CJEU held a hearing on questions referred by the Dutch Trade and Industry Appeals Tribunal regarding the interpretation of the application of the interchange fee caps in connection with an administrative proceeding by the Netherlands Authority for Consumers and Markets regarding our cobrand relationship with KLM Royal Dutch Airlines; the CJEU has not yet issued a decision. Given differing interpretations by regulators and participants in cobrand arrangements, we are subject to regulatory action, penalties and the possibility we will not be able to maintain our existing cobrand and agent relationships in the EU. See “Our business is subject to evolving and comprehensive government regulation and supervision, which could materially adversely affect our results of operations and financial condition” under “Risk Factors.”
In various countries, such as certain Member States in the EU, Australia and Canada (other than in the Province of Quebec), merchants are permitted by law to surcharge card purchases. In addition, the laws of a number of states in the United States that prohibit surcharging have been overturned and certain states have passed or are considering laws to permit surcharging by merchants. In jurisdictions allowing surcharging, we have seen an increase in merchant surcharging on American Express cards, particularly in certain merchant categories. Surcharging is an adverse customer experience and could have a material adverse effect on us, particularly where it only or disproportionately impacts credit card usage or card usage generally, our Card Members or our business. In addition, we also encounter steering or differential acceptance practices by merchants, which could also have a material adverse effect on us. See “Surcharging, steering or other differential acceptance practices by merchants could materially adversely affect our business and results of operations” under “Risk Factors.”
In some countries, governments have established regulatory regimes that require international card networks to be locally licensed and/or to localize aspects of their operations. For example, the Reserve Bank of India, which has broad power under the Payment and Settlement Systems Act, 2007 to regulate the membership and operations of card networks, issued a mandate requiring payment systems operators in India to store certain payments data locally. In 2021, it imposed restrictions on American Express Banking Corp. from engaging in certain card issuing activities in India, which were lifted in 2022 following significant investment in technology, infrastructure and resources to comply with the regulation. The development and enforcement of these and other similar laws, regulations and policies may adversely affect our ability to compete effectively and maintain and extend our global network.
Privacy, Data Protection, Data Management, Artificial Intelligence, Resiliency, Information Security and Cybersecurity
Regulatory and legislative activity in the areas of privacy, data protection, data management, artificial intelligence, resiliency, information security and cybersecurity continues to increase worldwide. We have established, and continue to maintain, policies and a governance framework to comply with applicable privacy, data protection, data management, artificial intelligence, resiliency, information security and cybersecurity laws and requirements, meet evolving customer and industry expectations and support and enable business innovation and growth; however, our policies and governance framework may be insufficient given the size and complexity of our business and heightened regulatory scrutiny.
Our regulators are increasingly focused on ensuring that our privacy, data protection, data management, artificial intelligence, resiliency and cybersecurity-related policies and practices are adequate to inform customers of our data collection, use, sharing and/or security practices, to provide them with choices, if required, about how we use and share their information, and to appropriately safeguard their personal information and account access. Regulators are also focused on end-to-end management of data, technology infrastructure and architecture, technology operations, resiliency and business continuity, and third-party risk management policies and practices, with regulatory expectations continuing to increase as we grow in size. For example, the EU Digital Operational Resilience Act, which applies as of January 2025, requires EU financial entities to have a comprehensive governance and risk management framework for information and communications technology risk. In addition, regulators and legislators have heightened their focus on the use of artificial intelligence and machine learning through the application of existing laws and regulations as well as by adopting new laws and regulations, such as the EU’s AI Act and state artificial intelligence legislation (e.g., Colorado AI Act). These new and emerging laws and regulations are reshaping how we develop, deploy and manage artificial intelligence systems, including by imposing new obligations related to data use, recordkeeping, transparency and human oversight.
In the United States, certain of our businesses are subject to the privacy, disclosure and safeguarding provisions of the Gramm-Leach-Bliley Act (GLBA) and its implementing regulations and guidance. Among other things, GLBA imposes certain limitations on our ability to share consumers’ nonpublic personal information with nonaffiliated third parties and requires us to develop, implement and maintain a written comprehensive information security program containing safeguards that are appropriate to the size and complexity of our business, the nature and scope of our activities and the sensitivity of customer information that we process. We also have expanded privacy-related obligations with respect to California residents who are not covered by GLBA, pursuant to the California Consumer Privacy Act of 2018, as amended by the California Privacy Rights Act of 2020. Various regulators and other U.S. states and territories are considering similar requirements or have adopted laws, rules and regulations pertaining to privacy and/or information security and cybersecurity that may be more stringent and/or expansive than federal requirements.
We are also subject to certain privacy, data protection, data management, artificial intelligence, resiliency, information security and cybersecurity laws in other countries in which we operate (including Member States in the EU, Australia, Canada, China, Japan, Hong Kong, India, Indonesia, Mexico, Singapore, Thailand and the United Kingdom), some of which are more stringent and/or expansive than those in the United States and may conflict with each other. Some jurisdictions have instituted or are considering instituting requirements that make it onerous to transfer personal data to other jurisdictions, and certain countries require in-country data processing and/or in-country storage of data. Compliance with such laws results in higher technology, administrative and other costs for us, could limit our ability to optimize the use of our data, and could require use of local technology services. Some of these laws also require us to provide foreign governments and other third parties broader access to our data and intellectual property. Data breach and operational outage notification laws or regulatory activities to encourage such notifications and regulatory activity and laws around resiliency, business continuity and third-party risk management are also becoming more prevalent in jurisdictions outside the United States in which we operate.
The EU and UK General Data Protection Regulations (GDPR) impose legal and compliance obligations on companies that process personal data of individuals in the EU and UK, irrespective of the geographical location of the company, with the potential for significant fines for non-compliance (up to 4 percent of total annual worldwide revenue). These laws include, among other things, a requirement for prompt notice of data breaches, in certain circumstances, to affected individuals and supervisory authorities and restrictions on the cross-border transfers of EU or UK personal data. We rely on a variety of compliant transfer mechanisms to transfer this personal data, including the use of binding corporate rules and standard contractual clauses. In 2023, the EU and UK regulators approved the EU-U.S. Data Privacy Framework and the UK Data Bridge, enabling easier transfers of EU and UK personal data to participating companies in the United States. We are also subject to certain data protection laws in Member States in the EU, which may be more stringent than the EU GDPR. Our data protection programs have become the subject of heightened scrutiny in certain Member States in the EU and we continue to make changes to our privacy practices and data management to comply with these requirements.
Anti-Money Laundering, Countering the Financing of Terrorism, Economic Sanctions and Anti-Corruption Compliance
We are subject to significant supervision and regulation, and an increasingly stringent enforcement environment, with respect to compliance with anti-money laundering (AML), countering the financing of terrorism (CFT), sanctions and anti-corruption laws and regulations. Failure to maintain and implement adequate programs and policies and procedures for AML/CFT, sanctions and anti-corruption compliance could have material financial, legal and reputational consequences. Additionally, our AML/CFT, sanctions and anti-corruption compliance programs may limit our ability to pursue certain business opportunities or affect our relationships with certain partners, service providers and other third parties.
Anti-Money Laundering and Countering the Financing of Terrorism
We are subject to a significant number of AML/CFT laws and regulations globally.
In the United States, the majority of AML/CFT requirements are derived from the Currency and Foreign Transactions Reporting Act and the accompanying regulations issued by the U.S. Department of the Treasury (collectively referred to as the Bank Secrecy Act), as amended by the USA PATRIOT Act of 2001. The Anti-Money Laundering Act of 2020 (the AMLA), enacted in January 2021, amended the Bank Secrecy Act and is intended to comprehensively reform and modernize U.S. AML/CFT laws. Many of the statutory provisions in the AMLA will require additional rulemakings, reports and other measures, and the impact of the AMLA will depend on, among other things, rulemaking and implementation guidance.
In Europe, AML/CFT requirements are largely the result of countries transposing the 5th and 6th EU Anti-Money Laundering Directives (and preceding EU Anti-Money Laundering Directives) into local laws and regulations. Numerous other countries have also enacted or proposed new or enhanced AML/CFT legislation and regulations applicable to American Express.
Among other things, these laws and regulations generally require us to establish AML/CFT programs that meet certain standards, including policies and procedures to collect information from and verify the identities of our customers, and to monitor for and report suspicious transactions, in addition to other information gathering and recordkeeping requirements. Our AML/CFT programs have become the subject of heightened scrutiny and any errors, failures or delays in complying with AML/CFT laws, deficiencies in our AML/CFT programs or association of our business with money laundering, terrorist financing, tax fraud or other illicit activity can give rise to significant supervisory, criminal and civil proceedings and lawsuits, which could result in significant penalties and forfeiture of assets, loss of licenses or restrictions on business activities, or other enforcement actions.
Economic Sanctions
National governments and international bodies, such as the United Nations and the EU, have imposed economic sanctions against individuals, entities, vessels, governments, regions and countries that endanger their interests or violate international norms of behavior. Sanctions have been used to advance a range of foreign policy goals, including conflict resolution, counterterrorism, counternarcotics and promotion of democracy and human rights, among other national and international interests. We maintain a global sanctions compliance program designed to meet the requirements of applicable sanctions regimes. Failure to comply with such requirements could subject us to serious legal and reputational consequences, including criminal penalties.
The United States has imposed economic sanctions that affect transactions involving targeted jurisdictions, parties or activities. The U.S. Department of the Treasury’s Office of Foreign Assets Control (OFAC) administers most U.S. sanctions. OFAC regulations prohibit U.S. persons from engaging in financial transactions with or relating to, or other dealings involving, a targeted individual, entity, vessel, government or country without a license or other authorization. OFAC regulations require U.S. persons to block property and property interests of parties on OFAC’s Specially Designated Nationals and Blocked Persons List and entities owned 50 percent or more by one or more Specially Designated Nationals. Blocked property (e.g., bank deposits or other financial assets) cannot be paid out, withdrawn, set off or transferred in any manner without a license from OFAC. Regulatory authorities in other international jurisdictions, such as the United Kingdom and Member States in the EU, administer similar programs to U.S. sanction programs.
Pursuant to Section 219 of the Iran Threat Reduction and Syria Human Rights Act of 2012, which added Section 13(r) to the Securities Exchange Act of 1934, as amended (the Exchange Act), an issuer is required to disclose in its annual or quarterly reports, as applicable, whether it or any of its affiliates knowingly engaged in certain activities, transactions or dealings relating to Iran or with individuals or entities designated pursuant to certain Executive Orders. Disclosure is generally required even where the activities, transactions or dealings were conducted outside the United States by non-U.S. affiliates in compliance with applicable law and whether or not the activities are sanctionable under U.S. law.
In 2024, we became aware that a third-party automated teller machine (ATM) network provider maintained a relationship with an Iranian bank identified on the Specially Designated Nationals and Blocked Persons list. As a result, American Express Card Members had the ability to access ATMs located outside of Iran that were operated by the Iranian bank through our ATM authorization program. We have identified approximately 37 such ATM transactions by Card Members. We had negligible gross revenues and net profits attributable to these transactions. We immediately suspended our relationship with the ATM network provider and do not intend to continue to engage in this activity.
In 2024, we also identified approximately 30 consumer accounts of individuals that may be, or may have been, employed by the Government of Iran. We believe the accounts were used only for personal expenses. We had negligible gross revenues and net profits attributable to these accounts. All of the accounts are closed and we do not intend to continue to engage in this activity.
We voluntarily reported the above transactions and accounts to OFAC.
Anti-Corruption
We are subject to complex anti-corruption laws and regulations, including the U.S. Foreign Corrupt Practices Act (the FCPA), the UK Bribery Act and other laws that prohibit the making or offering of improper payments. The FCPA makes it illegal to corruptly offer or provide anything of value to foreign government officials, political parties or political party officials for the purpose of obtaining or retaining business or an improper advantage. The FCPA also requires us to strictly comply with certain accounting and internal controls standards. The UK Bribery Act also prohibits commercial bribery and the receipt of a bribe, and makes it a corporate offense to fail to prevent bribery by an associated person, in addition to prohibiting improper payments to foreign government officials. Failure by us or our colleagues, contractors or agents to comply with the FCPA, the UK Bribery Act and other similar laws can expose us and/or individual colleagues to investigation, prosecution and potentially severe criminal and civil penalties.
Compensation Practices
Our compensation practices are subject to oversight by the Federal Reserve and the OCC. The federal banking regulators’ guidance on sound incentive compensation practices sets forth three key principles for incentive compensation arrangements that are designed to help ensure that incentive compensation plans do not encourage imprudent risk-taking and are consistent with the safety and soundness of banking organizations. The three principles provide that a banking organization’s incentive compensation arrangements should (1) provide incentives that appropriately balance risk and financial results in a manner that does not encourage employees to expose their organizations to imprudent risks, (2) be compatible with effective internal controls and risk management and (3) be supported by strong corporate governance, including active and effective oversight by the organization’s board of directors. Any deficiencies in our compensation practices that are identified by the banking regulators in connection with their review of our compensation practices may be incorporated into our supervisory ratings, which can affect our ability to make acquisitions or perform other actions. Enforcement actions may be taken against us if our incentive compensation arrangements or related risk-management control or governance processes are determined to pose a risk to our safety and soundness, and we have not taken prompt and effective measures to correct the deficiencies.
The Dodd-Frank Act requires U.S. financial regulators, including the Federal Reserve and the Securities and Exchange Commission (SEC), to adopt rules on incentive-based payment arrangements at specified regulated entities having at least $1 billion in total assets. In 2016, the federal banking regulators, the SEC, the Federal Housing Finance Agency and the National Credit Union Administration proposed revised rules on incentive-based compensation practices, which were reproposed by certain of those agencies in 2024, but have not yet been finalized. If these or other regulations are adopted in a form similar to what has been proposed, they will impose limitations on the manner in which we may structure compensation for our colleagues, which could adversely affect our ability to hire, retain and motivate key colleagues.
ADDITIONAL INFORMATION
We maintain an Investor Relations website at https://ir.americanexpress.com. We make available free of charge, on or through this website, our annual, quarterly and current reports and any amendments to those reports as soon as reasonably practicable following the time they are electronically filed with or furnished to the SEC.
In addition, we routinely post financial and other information, some of which could be material to investors, on our Investor Relations website. Information regarding our corporate sustainability initiatives and related disclosures are available on the Corporate Sustainability section of our website at https://go.amex/esg.
The content of any of our websites referred to in this report is not incorporated by reference into this report or any other report filed with or furnished to the SEC. We have included such website addresses only as inactive textual references and do not intend them to be active links.
Our business as a whole has not experienced significant seasonal fluctuations, although billed business tends to be moderately higher in the fourth quarter than in other quarters. As a result, the amount of Card Member loans and receivables outstanding tend to be moderately higher during that quarter. Additionally, we tend to have a higher proportion of retail-related billed business in the fourth quarter, which on average has a slightly lower merchant discount rate.
ITEM 1A. RISK FACTORS
This section highlights certain risks that could affect us and our businesses, broadly categorized in accordance with the risk types identified in our Enterprise Risk Management (ERM) Framework: “Strategic & Business, Reputational and Country Risks,” “Operational and Compliance/Legal Risks” and “Model, Credit, Market and Funding & Liquidity Risks.” You should carefully consider each of the following risks and all of the other information set forth in this Annual Report on Form 10-K, including in “Risk Management” under “MD&A,” which describes our approach to identifying, monitoring and managing the risks we assume in conducting our businesses and provides certain quantitative and qualitative disclosures about market risks. Although we have devoted significant resources to develop our risk management policies and procedures and expect to continue to do so in the future, these policies and procedures, as well as our risk management techniques, may not be fully effective in managing the risks to which we are exposed. For example, while we are currently conducting a comprehensive assessment and uplift of our risk management capabilities and control environment, the outcome may not meet our or our regulators’ expectations.
The risks and uncertainties we face are not limited to those described below. Additional risks and uncertainties not presently known to us or that we currently believe to be immaterial may also adversely affect our business.
Strategic & Business, Reputational and Country Risks
Business and economic conditions are a major driver of our results of operations and difficult conditions in the business and economic environment may materially adversely affect our business.
We offer a broad array of products and services to consumers, small businesses, mid-sized companies and large corporations and thus are very dependent upon the level of consumer and business activity and the demand for payment and financing products. Slow economic growth, economic contraction or shifts in broader consumer and business trends significantly impact customer behaviors, including spending on our cards, the ability and willingness of Card Members to borrow and pay amounts owed to us, demand for fee-based products and services and levels of customers’ deposits with us.
Factors such as consumer spending and confidence, household income and housing prices, unemployment rates, business investment and inventory levels, bankruptcies, geopolitical instability, public policy decisions, government spending, international trade relationships, tariffs, interest rates, taxes, inflation and deflation (including the effects of related governmental responses), energy costs and availability of capital and credit all affect the economic environment and, ultimately, our profitability. Additionally, sustained periods of high inflation may, among other things, increase certain of our expenses and erode consumer purchasing power, confidence and spending. An economic downturn or recession may result in higher unemployment and lower household income, consumer spending, corporate earnings and business investment, which may negatively impact spending on our cards and demand for our products, and increase delinquencies and write-off rates.
Spending by our premium consumer Card Members, for example, is sensitive to personal discretionary spending levels and tends to decline during general economic downturns. Likewise, spending by small business and corporate clients, which comprised approximately 42 percent of our worldwide billed business during 2024, depends in part on the economic environment and a favorable climate for continued business investment and new business formation. The consequences of negative circumstances impacting us or the economic environment generally can be sudden and severe and can impact customer types and geographies in which we operate in very different ways.
Our business is subject to the effects of geopolitical conditions, weather, natural disasters and other catastrophic events.
Geopolitical conditions, terrorist attacks, military conflicts, supply chain issues, natural disasters, severe weather, widespread health emergencies or pandemics, information or cybersecurity incidents (including intrusion into or degradation or unavailability of systems or technology by cyberattacks), operational incidents and other catastrophic events can have a material adverse effect on our business. Political and social conditions, including geopolitical instability (such as from tensions involving China and the U.S.), fiscal and monetary policies (including developments related to the U.S. federal deficit, debt ceiling, government shutdowns and other budgetary issues), trade wars and tariffs, labor shortages, regional or domestic hostilities, economic sanctions and the prospect or occurrence of more widespread conflicts could also negatively affect our business, operations and partners, consumer and business spending, including travel patterns and business investment, and demand for credit. Pandemics and other health emergencies can have widespread and unpredictable impacts on global society, economic conditions and consumer and business behavior, which may reoccur or occur over an extended duration, such as the macroeconomic and behavioral impacts during the COVID-19 pandemic. Because we derive a portion of our revenues from travel-related spending and many of our partners’ businesses relate to travel, our business is sensitive to impacts to travel and tourism, such as health and safety concerns and limitations on travel and mobility. In addition, disruptions in air travel and other forms of travel can result in the payment of claims under travel protection products we offer.
A number of actions are taking place across the globe that impact geopolitical stability. Several countries are considering or have implemented tariffs or other trade barriers or restrictions, as well as other measures affecting cross-border commerce and the flow of information, which could have broad economic consequences, impact global supply chains and negatively affect our business, customers and partners. There are multiple ongoing military conflicts (such as the Russia-Ukraine and Middle East conflicts) and geopolitical tensions may result in additional conflicts or escalate existing conflicts. Following the Russian invasion of Ukraine, we announced that we suspended business operations in Russia and Belarus, and these conflicts have led to economic uncertainty and market disruptions, including the imposition of sanctions and export controls. The broader consequences remain uncertain, but geopolitical conditions may adversely affect macroeconomic conditions and our business in a number of ways, including regional
instability, increased prevalence and sophistication of cyberattacks, potential retaliatory action against companies such as us, further sanctions activity and related regulatory scrutiny, increased inflation, further increases or fluctuations in commodity and energy prices, decreases in global travel and further disruptions to the global supply chain. If international political instability and geopolitical tensions continue or increase, our business and results of operations could be harmed.
Hurricanes, wildfires and other natural disasters have impacted, and may continue to impact, spending and credit performance in the areas affected. For example, there can be no assurance as to the ultimate impact of the Los Angeles area wildfires on spending levels and credit performance. Disasters and catastrophic events, and the impact of such events on certain industries or the overall economy, could have a negative effect on our business, results of operations and infrastructure, including our technology and systems. Climate-related risks may exacerbate certain of these threats, including the frequency and severity of weather-related events. Card Members in California, Florida, New York, Texas, Georgia and New Jersey account for a significant portion of U.S. consumer and small business billed business and Card Member loans, and our results of operations could be impacted by events or conditions that disproportionately or specifically affect one or more of those states.
Our operating results may materially suffer because of substantial and increasingly intense competition worldwide in the payments industry.
The payments industry is highly competitive, and we compete with networks, issuers, acquirers, and other payment service providers and methods of payment, including paper-based transactions (e.g., cash and checks) and electronic transfers (e.g., wire transfers and ACH), as well as evolving and growing alternative mechanisms, systems and products (e.g., web- and mobile-based payment platforms). If we are not able to differentiate ourselves from our competitors, develop compelling value propositions for our customers and/or effectively grow in areas such as digital payments and emerging technologies, we may not be able to compete effectively.
We believe Visa and Mastercard are larger than we are in most countries based on purchase volume. As a result, card issuers and acquirers on the Visa and Mastercard networks may be able to benefit from the dominant position, scale, resources, marketing and pricing of those networks. Our business may also be negatively affected if we are unable to continue increasing merchant acceptance (including by merchants that accept cards on the Visa and Mastercard networks) and perceptions of coverage, or if our Card Members do not experience welcome acceptance of our cards.
Some of our competitors have substantially greater scale and resources than we have and may offer richer value propositions or a wider range of programs and services than we offer or may use more effective strategies to acquire and retain more customers, capture a greater share of spending and borrowings, develop more attractive cobrand card and other partner programs, obtain more favorable terms with merchants and maintain greater merchant acceptance than we have. Competition may also intensify as participants in the payments industry merge or enter into joint ventures or other business combinations that compete with our products and services. Government actions or initiatives may also provide competitors with increased opportunities to derive competitive advantages and may create new competitors, including in some cases a government entity. We may not be able to compete effectively against these threats or respond or adapt to changes in consumer spending and borrowing or merchant acceptance as effectively as our competitors. Costs such as Card Member rewards and Card Member services expenses could continue to increase as we evolve our value propositions, including in response to increased competition.
Spending on our cards could continue to be impacted by increasing usage of credit and debit cards issued on other networks and real-time settlement transactions, such as bank transfers, as well as adoption of alternative payment mechanisms, systems and products. The fragmentation of customer spending, such as to take advantage of different merchant or card incentives, as a result of point-of-sale practices that impact merchant acceptance (e.g., surcharging or differential acceptance) or for convenience with technological solutions, may continue to increase. Revolving credit balances on our cards could also be impacted by alternative financing providers, such as point-of-sale lenders and buy now, pay later products. To the extent other payment and financing mechanisms, systems and products continue to successfully expand, our discount revenues earned from Card Member spending and our net interest income earned from Card Member borrowing could be negatively impacted. In addition, companies that control access to consumer and merchant payment method choices at the point of sale or through digital wallets, commerce-related experiences, mobile applications or other technologies could choose not to accept, suppress use of, or degrade the experience of using our products or could restrict our access to our customers and transaction data. Such companies could also require payments from us to participate in such digital wallets, experiences or applications or negotiate incentives or pricing concessions, impacting our profitability on transactions.
The competitive value of our data and demand for our products and services may also be diminished as traditional and non-traditional competitors use other, new data sources and technologies to derive similar insights and by certain regulations. Open banking initiatives that are increasingly being promoted by governments and regulators may result in a number of challenges to our business model, such as disintermediating us from our customers, steering customers away from our products and services or decreasing our attractiveness to partners. Competitors have also sought to create their own integrated payments platforms, and may have competitive advantages in doing so as compared to our business.
To the extent we expand into, or further grow in, new business areas, such as new products and services that complement our card products, and new geographic regions, we will face competitors with more experience and more established relationships with relevant customers, regulators and industry participants, which could adversely affect our ability to compete. Laws and business practices that favor local competitors, require card transactions to be routed over domestic networks or prohibit or limit foreign ownership of certain businesses could limit our growth in international regions.
We may face additional compliance and regulatory risks to the extent that we expand into new business areas, and we may need to dedicate more expense, time and resources to comply with regulatory requirements than our competitors, particularly those that are not regulated financial institutions.
Many of our competitors are subject to different, and in some cases, less stringent, legislative and regulatory regimes, and some may have lower cost structures and more agile business models and systems. More restrictive laws and regulations that do not apply to all of our competitors can put us at a disadvantage, including prohibiting us from engaging in certain transactions, regulating our business practices or adversely affecting our cost structure.
We face intense competition for partner relationships, which could result in a loss or renegotiation of these arrangements that could have a material adverse impact on our business and results of operations.
In the ordinary course of our business we enter into different types of contractual arrangements with business partners in a variety of industries. For example, we work with partners such as Delta, Hilton, Marriott and British Airways to offer cobranded cards for consumers and small businesses, and with partners in many industries, including Delta, to offer benefits and rewards to Card Members. See “Partners and Relationships” under “Business” for additional information on our business partnerships, including with Delta.
Competition for relationships with key business partners is very intense and there can be no assurance we will be able to grow or maintain these partner relationships or that they will remain as profitable or valued by our customers. Establishing and retaining attractive cobrand card partnerships is particularly competitive among card issuers and networks as these partnerships typically appeal to high-spending loyal customers. All of our cobrand portfolios in the aggregate accounted for approximately 25 percent of our worldwide billed business for the year ended December 31, 2024. Card Member loans related to our cobrand portfolios accounted for approximately 36 percent of our worldwide Card Member loans as of December 31, 2024.
Cobrand arrangements are entered into for a fixed period, generally ranging from five to ten years, and will terminate in accordance with their terms, including at the end of the fixed period unless extended or renewed at the option of the parties, or upon early termination as a result of an event of default or otherwise. We face the risk that we could lose partner relationships, even after we have invested significant resources in the relationships. Additionally, partners may make changes to the products and services they offer or otherwise become less desirable to our customers, which may lower the value of our products, such as the cobranded cards we issue to our customers. We may also choose not to renew certain cobrand relationships. Billed business could decline and Card Member attrition could increase, in each case, significantly as a result of the termination of one or more cobrand partnership relationships. In addition, some of our cobrand arrangements provide that, upon expiration or termination, the cobrand partner may purchase or designate a third party to purchase the loans generated with respect to such cobranded card portfolio, which could result in the loss of the card accounts and a significant decline in our Card Member loans outstanding.
We regularly seek to extend or renew cobrand arrangements in advance of the end of the contract term and face the risk that existing relationships will be renegotiated with less favorable terms for us or that we may be unable to renegotiate on terms that are acceptable to us, as competition for such relationships continues to increase. We make payments to our cobrand partners, which can be significant, based primarily on the amount of Card Member spending and corresponding rewards earned on such spending and, under certain arrangements, on the number of accounts acquired and retained. The amount we pay to our cobrand partners has increased, particularly in the United States, and may continue to increase as arrangements are renegotiated due to increasingly intense competition for cobrand partners among card issuers and networks.
The loss of exclusivity arrangements with business partners, the loss of the partner relationship altogether (whether by non-renewal at the end of the contract period, such as the end of our relationship with Costco in the United States in 2016, or as the result of a merger, legal or regulatory action or otherwise) or the renegotiation of existing partnerships with terms that are significantly worse for us could have a material adverse impact on our business and results of operations. See “Our business is subject to evolving and comprehensive government regulation and supervision, which could materially adversely affect our results of operations and financial condition” above for information on the uncertainty regarding our cobrand and agent relationships in the EU. In addition, any publicity associated with the loss of any of our key business partners could harm our reputation, making it more difficult to attract and retain Card Members and merchants, and could weaken our negotiating position with our remaining and prospective business partners.
Arrangements with our business partners represent a significant portion of our business. We are exposed to risks associated with our business partners, including reputational issues, business slowdowns, bankruptcies, liquidations, restructurings, consolidations and outages, and the possible obligation to make payments to our partners.
Our success is, in many ways, dependent on the success of our partners. From customer acquisition to cobranding arrangements, from participation in our rewards programs to facilitating B2B supplier payments for our corporate clients, we rely on our business partners across many aspects of our company and our arrangements with business partners represent a significant portion of our business. For example, our two largest redemption partners are Amazon and Delta. Some of our partners manage certain aspects of our customer relationships, such as our OptBlue partners. To the extent any of our partners fail to effectively promote and support our products, experience a slowdown in their business, operational disruptions, reputational issues or loss of consumer confidence, or are otherwise unable to meet our expectations or those of their other stakeholders, our business may be materially negatively impacted. For example, the operational rights relating to our prepaid reloadable and gift card business are owned by a business partner and the reloadable operations have experienced disruptions and compliance issues that impacted the ability of our prepaid customers to load and use their cards. If such operations are interrupted, suspended, terminated or otherwise experience further issues in the future, it could further negatively impact our customers’ experience, result in additional costs, litigation and regulatory action, and harm our business and reputation. We also face the risk that existing relationships will be renegotiated with less favorable terms for us or that we may be unable to renegotiate on terms that are acceptable to us. In addition, we may be obligated to make or accelerate payments to certain business partners such as cobrand partners upon the occurrence of certain triggering events such as a shortfall in certain performance and revenue levels. If we are not able to effectively manage these triggering events, we could unexpectedly have to make payments to these partners, which could have a negative effect on our
financial condition and results of operations. See Note 12 to the “Consolidated Financial Statements” for additional information on financial commitments related to agreements with certain cobrand partners.
Similarly, we are exposed to risk from bankruptcies, liquidations, insolvencies, financial distress, restructurings, consolidations, operational outages, cybersecurity incidents and other similar events that may occur in any industry representing a significant portion of our billed business, which could negatively impact particular card products and services (and volumes generally) and our financial condition and results of operations. We have previously and may in the future pre-purchase loyalty points from certain of our cobrand partners, the value of which may diminish to the extent such partners cease operations or such points become less desirable to our customers. We could also be materially impacted if we were obligated or elected to reimburse Card Members for products and services purchased from merchants that have ceased operations or stopped accepting our cards. For example, we are exposed to credit risk in the airline industry to the extent we protect Card Members against non-delivery of purchases, such as where we have remitted payment to an airline for a Card Member purchase of tickets that have not yet been used or “flown.” If we are unable to collect the amount from the airline, we may bear the loss for the amount credited to the Card Member. Spending at airline merchants accounted for approximately 7 percent of our worldwide billed business for the year ended December 31, 2024.
For additional information relating to operational risks of our business partners, see “We rely on third-party providers for acquiring and servicing customers, technology, platforms and other services integral to the operations of our businesses. These third parties may act in ways that could materially harm our business” below.
We face continued intense competitive pressure that may materially impact the prices we charge for accepting our cards for payment, as well as the risk of losing merchant relationships, which could have a material adverse impact on our business and results of operations.
We face pressure from competitors that primarily rely on sources of revenue other than discount revenue or have lower costs that can make their pricing for card acceptance more attractive. Merchants, business partners and third-party merchant acquirers, aggregators and processors are also able to negotiate incentives, pricing concessions and other favorable contractual provisions from us as a condition to accepting our cards, being cobrand partners, offering benefits to our Card Members or signing merchants to accept American Express cards. As these parties become even larger (such as the largest tech companies), we may have to increase the amount of incentives and/or concessions we provide to them. We also face the risk of losing relationships with these parties or that they limit acceptance of our cards, which could materially adversely affect spending on our cards and our ability to retain current Card Members and attract new Card Members and therefore, our business and results of operations.
Our merchant discount rates have been impacted by regulatory changes affecting competitor pricing in certain international countries and U.S. states and may in the future be impacted by pricing regulation. We have also experienced erosion of our merchant discount rates as we increase merchant acceptance. We may not be successful in significantly expanding merchant acceptance or offsetting rate erosion with volumes at new merchants. In addition, the regulatory environment and differentiated payment models and technologies from non-traditional players in the alternative payments space could pose challenges to our traditional payment model and adversely impact our merchant discount rates. Some merchants, including large tech companies and other large merchants, continue to invest in their own payment and financing solutions, such as proprietary-branded digital wallets, using both traditional and new technology platforms. If merchants are able to drive broad consumer adoption and usage, it could adversely impact our merchant discount rates and network and loan volumes.
A continuing priority of ours is to drive greater and differentiated value to our merchants that, if not successful, could negatively impact our discount revenue and financial results. We may not succeed in maintaining merchant discount rates or offsetting the impact of declining merchant discount rates, for the reasons discussed above and others, which could materially and adversely affect our revenues and profitability, and therefore our ability to invest in innovation and in value-added services for merchants, business partners and Card Members.
Surcharging, steering or other differential acceptance practices by merchants could materially adversely affect our business and results of operations.
In certain countries, such as Australia, Canada (other than in the Province of Quebec) and certain Member States in the EU, and in certain states in the United States, merchants are permitted by law to engage in surcharging, steering or other differential acceptance practices for certain card purchases and certain merchants and merchant organizations continue to push for these practices in other jurisdictions. In jurisdictions allowing surcharging, we have seen an increase in merchant surcharging on American Express cards, particularly in certain merchant categories, and in some cases, either the surcharge is greater than that applied to Visa and Mastercard cards or Visa and Mastercard cards are not surcharged at all (practices that are known as differential surcharging), even though there are many cards issued on competing networks that have an equal or greater cost of acceptance for the merchant.
We also encounter merchants that accept our cards, but tell their customers that they prefer to accept another type of payment or otherwise seek to suppress use of our cards or certain of our cards, such as limiting the use of our cards for certain transactions. Our Card Members value the ability to use their cards where and when they want to, and we, therefore, take steps to meet our Card Members’ expectations and to protect the American Express brand by prohibiting discrimination through provisions in our merchant contracts, including non-discrimination and honor-all-cards provisions, subject to local legal requirements. We have increasingly relied on merchant acquirers, aggregators and processors to manage certain aspects of our merchant relationships. When we work with such third parties, we are dependent on them to promote and support the acceptance and usage of our cards, but they may have business interests, strategies or goals that are inconsistent with ours.
Recently introduced products, such as debit cards on the American Express network, could fail to gain market acceptance and American Express cards could become less desirable to consumers and businesses generally due to surcharging, steering or other
forms of discrimination, which could result in a decrease in cards-in-force, coverage and transaction volumes. The impact could vary depending on such factors as: the industry or manner in which a surcharge is levied; how Card Members are surcharged or steered to other card products or payment forms at the point of sale; the ease and speed of implementation for merchants, merchant acquirers, aggregators, processors or other merchant service providers, including as a result of new or emerging technologies; the size and recurrence of the underlying charges; and whether and to what extent these actions are applied to other forms of payment, including whether it varies depending on the type of card (e.g., credit or debit), product, network, acquirer or issuer. Discrimination against American Express cards could have a material adverse effect on our business, financial condition and results of operations, particularly where it only or disproportionately impacts credit card usage or card usage generally, our Card Members or our business.
We may not be successful in our efforts to promote card usage or attract new Card Members, including through marketing and promotion, merchant acceptance and Card Member rewards and services, or to effectively control the costs of such investments, all of which may materially impact our profitability.
Revenue growth is dependent on increasing consumer and business spending on our cards, growing loan balances and increasing fee revenue. We have been investing in a number of growth initiatives, including to attract new Card Members, retain existing Card Members and capture a greater share of customers’ total spending and borrowings. There can be no assurance that our investments will continue to be effective, particularly as consumer and business behaviors continue to change. In addition, to the extent our products or offers attract customers looking for short-term incentives rather than incentivize long-term loyalty, Card Member attrition and costs could increase. Increasing spending on our cards also depends on our continued expansion of merchant acceptance of our cards. If we are unable to continue growing merchant acceptance and perceptions of coverage, or if merchants decide to no longer accept American Express cards or more greatly engage in surcharging, steering or other differential acceptance practices, our business could suffer. Expanding our product and service offerings, adding customer acquisition channels and forming new partnerships or renewing current partnerships could have higher costs than our current arrangements, fail to resonate with customers, adversely impact our merchant discount rates or dilute our brand.
Another way we invest in customer value is through our Membership Rewards program, as well as other Card Member benefits. Any significant change in, or failure by management to reasonably estimate, actual redemptions of Membership Rewards points and associated redemption costs could adversely affect our profitability. We rely on third parties for certain redemption options, Card Member offers and other rewards and benefits, and we may modify or not be able to continue to offer such rewards and benefits in the future, which could diminish the value of the program for our Card Members. In addition, many credit card issuers and certain other companies have instituted rewards and cobrand programs and other benefits and services that are similar to ours and may be more attractive. An inability to differentiate our products and services could materially adversely affect us.
We may not be able to cost-effectively manage and expand Card Member benefits, including containing the growth of marketing, promotion, rewards and Card Member services expenses in the future, and our ability to do so will depend in part on our ability to attract value from partners. If such expenses increase beyond our expectations, we will need to find ways to offset the financial impact by increasing other areas of revenues such as fee-based revenues, decreasing operating expenses or other investments in our business, or both. We may not succeed in doing so, particularly in the current competitive and regulatory environment, which has included heightened scrutiny on credit card rewards programs. In addition, increased costs as a result of business and economic conditions may require that we reduce investments in other areas.
Our brand and reputation are key assets of our Company, and our business may be materially affected by how we are perceived in the marketplace.
Our brand and its attributes are key assets, and we believe our continued success depends on our ability to preserve, grow and realize the benefits of the value of our brand. Our ability to attract and retain consumer and small business Card Members and corporate clients is highly dependent upon the external perceptions of our level of service, trustworthiness, business practices, privacy and data protection, management, workplace culture, merchant acceptance, financial condition, response to political and social issues or catastrophic events and other subjective qualities. Negative perceptions or publicity regarding these matters — even if related to seemingly isolated incidents and whether or not factually correct—could erode trust and confidence and damage our reputation among existing and potential Card Members, corporate clients, merchants and partners, which could make it difficult for us to attract new customers and maintain existing ones, and could subject us to heightened legal and regulatory scrutiny. Negative public opinion could result from actual or alleged conduct in any number of activities or circumstances, including card practices, regulatory compliance, the use and protection of customer information, conduct by our colleagues and policy engagement, including activities of the American Express Company Political Action Committee, and from actions taken by regulators or others in response thereto. Moreover, the speed with which information spreads through social media, enhanced technology and other news sources and the ease with which customers transact may amplify the onset and negative effects from such perceptions.
Our brand and reputation may also be harmed by actions taken by third parties that are outside our control. For example, any shortcoming of or controversy related to a third-party service provider, business partner, merchant acquirer or network partner may be attributed by Card Members and merchants to us, thus damaging our reputation and brand value. Our brand may also be negatively impacted by acceptance of American Express cards by merchants in certain industries, when American Express cards are used for payment for legal, but controversial, products and services or any government inquiries or legislative scrutiny related to card acceptance or usage. The lack of acceptance, suppression of card usage or surcharging by merchants can also negatively impact perceptions of our brand and our products, lower overall transaction volume and increase the attractiveness of other payment products or systems. Adverse developments with respect to our industry, including the creation and implementation of new merchant categories codes, may also negatively impact our reputation, or result in greater regulatory or legislative scrutiny or litigation against us. Furthermore, as a corporation with headquarters and operations located in the United States and a brand name
referring to the United States, a negative perception of the United States arising from its political or other positions could harm the perception of our company and our brand. These risks to our brand and reputation, as well as other risks described in this Risk Factors section, are heightened by the increasing sophistication and availability of artificial intelligence technology, including by assisting with the creation of deepfakes and increasing the velocity of distribution of disinformation. Although we monitor developments for areas of potential risk to our reputation and brand, negative perceptions or publicity could materially and adversely affect our business volumes, revenues and profitability.
We face increased scrutiny from stakeholders who have diverging views related to business practices and company activities, which could result in reputational harm, litigation, enforcement actions and other adverse consequences. In addition, we are subject to increasing regulatory requirements and legal risks related to environmental, social and governance topics, such as those arising from new disclosure requirements in certain jurisdictions. Inaccurate perceptions or mischaracterizations of disclosures on these topics, or our goals and initiatives, while outside of our control, could impact our reputation, colleague hiring and retention and public perceptions of our business.
If we are not able to successfully invest in, and compete with respect to, technological developments and new products and services across all our businesses, our revenue and profitability could be materially adversely affected.
Our industry is subject to rapid and significant technological changes. In order to compete in our industry, we need to continue to invest in technology across all areas of our business, including in transaction processing, data management and analytics, machine learning and artificial intelligence, customer interactions and communications, open banking and alternative payment and financing mechanisms, authentication technologies and digital identification, tokenization, real-time settlement and risk management and compliance systems. Incorporating new technologies into our products and services, including developing the appropriate governance and controls consistent with regulatory expectations, requires substantial expenditures and takes considerable time, and may have unintended consequences or ultimately be unsuccessful. We expect that new technologies in the payments industry will continue to emerge, and these new technologies may be superior to, or render obsolete, our existing technology.
The process of developing new products and services, enhancing existing products and services and adapting to technological changes and evolving industry standards is complex, costly and uncertain, and any failure by us to anticipate customers’ changing needs and emerging technological trends accurately could significantly impede our ability to compete effectively. Our competitors may develop products, platforms or technologies that become more widely adopted by consumers, merchants or service providers than ours, including as a result of increased involvement by technology companies in the payments industry and our competitors’ greater scale or ability to pursue and adopt new technologies. In addition, we may underestimate the resources needed and overestimate our ability to develop new products and services, particularly beyond our traditional card products and travel-related services.
The use of artificial intelligence and machine learning technologies, including generative artificial intelligence, has increased rapidly with the increasing sophistication and applications of the technology. Our and our partners’ use of artificial intelligence and machine learning is subject to various risks including flaws in models or datasets that may result in biased or inaccurate results, unintended or unexpected outcomes, ethical considerations regarding artificial intelligence, infringement of intellectual property rights, exposure of proprietary or personal information, heightened security risks and the ability to safely deploy and implement governance and controls for artificial intelligence systems. The complexity of these technologies can make it difficult to assess proper operation, reduce error, or understand and explain their outputs. Adverse consequences of artificial intelligence and machine learning remain uncertain but could include flaws in the decisions, predictions, outputs or analysis such technologies produce and subjecting us to competitive harm, legal liability, heightened regulatory scrutiny and brand or reputational harm.
Our ability to adopt new technologies may be inhibited by the emergence of industry-wide standards, a changing legislative and regulatory environment, an inability to develop appropriate governance and controls, a lack of internal product and engineering expertise, resistance to change from Card Members, merchants or service providers, lack of appropriate change management processes or the complexity of our systems. In addition, our adoption of new technologies and our introduction of new products and services may increase operational complexity and risk, and expose us to new or enhanced risks, particularly in areas where we have less experience or our existing governance and control systems may be insufficient, which could require us to make substantial expenditures or subject us to legal liability, heightened regulatory scrutiny and brand or reputational harm.
We may not be successful in realizing the benefits associated with our acquisitions, strategic alliances, joint ventures and investment activity, and our business and reputation could be materially adversely affected.
We have acquired a number of businesses and have made a number of strategic investments, and continue to evaluate potential transactions. There is no assurance that we will be able to successfully identify suitable candidates, value potential investment or acquisition opportunities accurately, negotiate acceptable terms for those opportunities, or complete proposed acquisitions and investments. The process of integrating an acquired company, business or technology could create unforeseen operating difficulties and expenditures, including in integrating systems and personnel or further developing the acquired business or technology, result in unanticipated liabilities, including legal claims, violations of laws, commercial disputes and information security vulnerabilities or breaches (including from not integrating the acquired company, business or technology quickly or appropriately, from activities that occurred prior to the acquisition, from inadequate systems or controls of the acquired company, and from exposure to third party relationships of the acquired company or business or new laws and regulations), and harm our business generally. Expanding to new businesses, geographies or customer types through acquisitions may subject us to new risks and we may not have the relevant expertise or business structure to achieve the desired results. It may take us longer than expected to fully realize the anticipated benefits of these transactions, and those benefits may ultimately be smaller than anticipated or may not be realized at all, which could materially adversely affect our business and operating results, including as a result of write-downs of goodwill and other intangible assets.
Joint ventures, including our joint ventures in China, the Middle East and Switzerland, and minority investments in companies such as GBTG inherently involve a lesser degree of control over business operations, thereby potentially increasing the financial, legal, operational and/or compliance risks associated with the joint venture or minority investment, including as a result of being subject to different laws or regulations. Joint ventures and other partnerships or minority investments operating in foreign jurisdictions may also face risks from adverse regulatory actions, which could adversely affect their operations or our investment. In addition, we may be dependent on joint venture partners, controlling shareholders or management who may have business interests, strategies or goals that are inconsistent with ours and we have been and may in the future be involved in litigation with our joint venture partners and other shareholders and parties related to the joint ventures and investments. We have commercial arrangements with GBTG, including, among other things, a long-term trademark license agreement pursuant to which GBTG uses select American Express marks. GBTG also supports certain of our strategic partnerships and our Commercial Services business. Business decisions or other actions or omissions of a joint venture partner, other shareholders or management of our joint ventures and companies in which we have minority investments may adversely affect the value of our investment or any commercial benefit to us from the relationship, result in litigation or regulatory action against us and otherwise damage our reputation and brand. In addition, trade secrets and other proprietary information we may provide to a joint venture may become available to third parties beyond our control. The ability to enforce intellectual property and contractual rights to prevent disclosure of our trade secrets and other proprietary information may be limited in certain jurisdictions.
Additionally, from time to time we may decide to divest certain businesses or assets. These divestitures may involve significant uncertainty and execution complexity, which may cause us not to achieve our strategic objectives, realize expected cost savings or obtain other benefits from the divestiture and may result in unexpected losses of colleagues or harm to our brand, customers or other partners. Further, during the pendency of a divestiture, we may be subject to risks such as that the transaction may not close or the business to be divested may decline, and if a divestiture is not completed, we may not be able to find another acquiror on similar terms.
Operational and Compliance/Legal Risks
We may not be able to effectively manage the operational and compliance risks to which we are exposed.
We consider operational risk to be the risk of loss due to, among other things, inadequate or failed processes, people or information systems, or impacts from the external environment, including failures to comply with laws and regulations as well as impacts from relationships with third parties. Operational risk includes, among others, the risk that error or misconduct could result in a material financial misstatement, a failure to monitor a third party’s compliance with regulatory or legal requirements, a failure to adequately monitor and control access to, or use of, data in our systems we grant to third parties or a failure to satisfy our obligations to our customers with respect to our products and services (e.g., rewards and benefits). As processes or organizations are changed or become more complex, we grow in size, new products and services are introduced, such as new lending features, banking products, dining capabilities and digital collectibles, or we become subject to more stringent or complicated regulatory requirements, we may not identify or address new operational risks. Through human error, fraud or malfeasance, conduct risk can result in harm to customers, legal liability, fines, sanctions, customer remediation and brand damage.
Compliance risk arises from violations of, or failure to conform or comply with, laws, rules, regulations, internal policies and procedures and ethical standards. We need to continually update and enhance our control environment to address operational and compliance risks, and our control environment and related systems have in certain instances not sufficiently detected, and may in the future not sufficiently detect, errors or omissions. Operational and compliance failures, deficiencies in our control environment or an inability to maintain high standards of business conduct can expose us to reputational and legal risks as well as fines, civil money penalties or payment of damages and can lead to diminished business opportunities and diminished ability to expand key operations.
A major information or cybersecurity incident or an increase in fraudulent activity could lead to reputational damage to our brand and material legal, regulatory and financial exposure, and could reduce the use and acceptance of our products and services.
We and third parties collect, process, transfer, host, store, analyze, retain, provide access to and dispose of account information, payment transaction information, and certain types of personally identifiable and other information pertaining to our customers and colleagues in connection with our cards and other products and in the normal course of our business.
Global financial institutions like us, as well as our customers, colleagues, regulators, service providers and other third parties, have experienced a significant increase in information security and cybersecurity risk in recent years and will likely continue to be the target of increasingly sophisticated cyberattacks, including computer viruses, malicious or destructive code, ransomware, social engineering attacks (including phishing, impersonation and identity takeover attempts), artificial intelligence-assisted deepfake attacks and disinformation campaigns, corporate espionage, hacking, website defacement, denial-of-service attacks, exploitation of vulnerabilities and other attacks and similar disruptions from the misconfiguration or unauthorized use of or access to computer systems and company accounts. These threats have arisen from external parties, as well as insiders who knowingly or unknowingly engage in or enable malicious cyber activities. There are a number of motivations for cyber threat actors, including criminal activities such as fraud, identity theft and ransom, corporate or nation-state espionage, political agendas, public embarrassment with the intent to cause financial or reputational harm, intent to disrupt information technology systems and supply chains, and to expose and exploit potential security and privacy vulnerabilities in corporate systems and websites. Cyber threat actors, including state-sponsored and nation state actors, have rapidly evolved their techniques and increasingly utilize advanced capabilities, including the integration of advanced forms of artificial intelligence and other new technology, which can increase the efficacy, severity, frequency and ease of execution of cyberattacks.
Our and our partners’ networks and systems are subject to constant attempts to disrupt business operations and capture, destroy, manipulate or expose various types of information relating to corporate trade secrets, customer information (including Card Member, travel and loyalty program data), colleague information and other sensitive business information (including acquisition activity, non-public financial results and intellectual property). For example, we and other U.S. financial services providers have been the target of attacks, such as denial of service attacks, social engineering and the impersonation of current or prospective employees and contractors. We develop and maintain systems and processes aimed at detecting and preventing information security and cybersecurity incidents and fraudulent activity, including our cyber crisis response procedures, which require significant investment, maintenance and ongoing monitoring and updating as technologies and regulatory requirements change, new vulnerabilities and exploits are discovered and as efforts to overcome security measures become more sophisticated.
Despite our efforts and the efforts of third parties that process, transmit or store our data and data of our customers and colleagues or support our operations, such as service providers, merchants and regulators, the possibility of information, operational and cybersecurity incidents, malicious social engineering, password mismanagement, corporate espionage, fraudulent or other malicious activities and human error or malfeasance cannot be eliminated entirely and will evolve as new and emerging technology is deployed by threat actors, including the use of artificial intelligence and quantum computing, and we increasingly use platforms that are outside of our network and control environments. For example, we are aware that certain of our third-party service providers and joint ventures have been the victims of ransomware and other cyberattacks, in some instances that affected our data or services provided to us. In addition, recently introduced products and services, such as checking accounts and non-card lending, may lead to an increase in the number or types of cyberattacks and our exposure to fraud and other malfeasance. Risks associated with such incidents and activities include theft of funds and other monetary loss, disruption of our operations and the unauthorized disclosure, release, gathering, monitoring, misuse, modification, loss or destruction of confidential, proprietary, trade secret or other information (including account data information). An incident may not be detected until well after it occurs and the severity and potential impact may not be fully known for a substantial period of time after it has been discovered. We are subject to varied cybersecurity regulations and incident reporting requirements, which could require us to disclose incidents that may not have been resolved or fully investigated at the time of disclosure, leading to customer confusion, regulatory scrutiny and negative publicity and exacerbating risks related to the incident itself. Our ability to address incidents may also depend on the timing and nature of assistance that may be provided from relevant governmental or law enforcement agencies.
Information, operational or cybersecurity incidents, fraudulent activity and other actual or perceived failures to maintain confidentiality, integrity, availability of services and data, privacy and/or security has led to increased regulatory scrutiny and may lead to regulatory investigations and intervention (such as mandatory card reissuance), consent decrees, increased litigation (including class action litigation), response costs (including notification and remediation costs), fines, negative assessments of us and our subsidiaries by banking regulators and rating agencies, reputational and financial damage to our brand, negative impacts to our partner relationships, and reduced usage of our products and services, all of which could have a material adverse impact on our business. The disclosure of sensitive company information could also undermine our competitive advantage and divert management attention and resources.
Successful cyberattacks, data breaches, disruptions or other incidents related to the actual or perceived failures to maintain confidentiality, integrity, availability of services and data, privacy and/or security at other large financial institutions, large retailers, travel and hospitality companies, government agencies or other market participants, whether or not we are impacted, could lead to a general loss of customer confidence that could negatively affect us, including harming the market perception of the effectiveness of our security measures or harming the reputation of the financial system in general, which could result in reduced use of our products and services. Such events could also result in legislation and additional regulatory requirements. Although we maintain cyber insurance, there can be no assurance that liabilities or losses we may incur will be covered under such policies or that the amount of insurance will be adequate.
The uninterrupted operation of our information systems is critical to our success and a significant disruption could have a material adverse effect on our business and results of operations.
We rely extensively on our information technology systems and those of our third parties, including our transaction authorization, clearing and settlement systems, and data centers, which have experienced and may continue to experience service disruptions or degradation that may result from technology malfunction, sudden increases in processing or other volumes, natural disasters and weather events, fires, accidents, technology change management issues, power outages, internet outages, telecommunications failures, fraud, denial-of-service, ransomware and other cyberattacks, inadequate infrastructure in lesser-developed markets, technology capacity management issues, terrorism, computer viruses, vulnerabilities or failures in hardware or software, physical or electronic break-ins, or similar events. Due to the interconnectivity and complexity of information systems and their reliance on common systems, software and vendors, disruptions or degradations have had, and will likely continue to have, wide-reaching consequences, including the potential to disrupt the overall financial system and other key systems in the global economy. Service disruptions or degradations impacting us or our partners can prevent access to online services and account information, compromise or limit access to company or customer data, impede or prevent transaction processing, communications to customers and financial reporting, disrupt ordinary business operations, result in contractual penalties or obligations, trigger regulatory reporting obligations, and lead to regulatory investigations and fines, increased regulatory oversight, and litigation (including class action litigation). Any such service disruption or degradation could adversely affect the perception of the reliability of our products and services and materially adversely affect our overall business, reputation and results of operations.
Our business is subject to evolving and comprehensive government regulation and supervision, which could materially adversely affect our results of operations and financial condition.
We face significantly heightened regulatory expectations and scrutiny in the U.S. and globally, which significantly affects our business and requires continual enhancement of our compliance efforts. Supervision efforts and the enforcement of existing laws
and regulations impact the scope and profitability of our existing business activities, limit our ability to pursue certain business opportunities and adopt new technologies, compromise our competitive position, and affect our relationships with Card Members, partners, merchants, service providers and other third parties. New laws or regulations could similarly affect our business, increase the costs and complexity of doing business, impact what we are able to charge for, or offer in connection with, our products and services, impose conflicting obligations, and require us to change certain of our business practices and invest significant management attention and resources, all of which could adversely affect our results of operations and financial condition. Political developments can result in legislative and regulatory uncertainty and changes to supervisory and enforcement priorities. In addition, legislators and regulators around the world are aware of each other’s approaches to the regulation of the financial services industry. Consequently, a development in one country, state or region may influence regulatory approaches in another.
If we fail to satisfy regulatory requirements or maintain our financial holding company status, our financial condition and results of operations could be adversely affected, and we may be restricted in our ability to take certain capital actions (such as declaring dividends or repurchasing outstanding shares) or engage in certain business activities or acquisitions, which could compromise our competitive position. Additionally, our banking regulators have wide discretion in the examination and the enforcement of applicable banking statutes and regulations and may restrict our ability to engage in certain business activities or acquisitions or require us to maintain more capital. In 2024, we became a Category III firm for purposes of the U.S. federal bank regulatory agencies’ tailoring framework, resulting in us becoming subject to heightened regulatory expectations and more stringent regulatory requirements. As we continue to grow, these expectations and requirements may further increase, such as if we become a Category II firm, which may increase our compliance costs and adversely affect our business.
Legislators and regulators continue to focus on the operation of card networks, including interchange fees paid to card issuers in payment networks such as Visa and Mastercard, network routing practices and the fees merchants are charged to accept cards. While in some cases our business is subject to exemptions related to certain of these regulations, there is no guarantee that such exemptions will continue to be available and even where we are not directly regulated, regulation of bankcard fees significantly negatively impacts the discount revenue derived from our business, including as a result of downward pressure on our discount rate from decreases in competitor pricing in connection with caps on interchange fees. In some cases, regulations also extend, or may extend, to certain aspects of our business, such as network and cobrand arrangements, new products or services we may offer, or the terms of card acceptance for merchants, including terms relating to non-discrimination and honor-all-cards. For example, we have exited our network licensing businesses in the EU and Australia as a result of regulation in those jurisdictions. In addition, there is uncertainty as to when or how interchange fee caps and other provisions of payments legislation might apply when we work with cobrand partners and agents in the EU. See “Supervision and Regulation — Payments Regulation” under “Business” for more information. Given differing interpretations by regulators and participants in cobrand arrangements, we are subject to regulatory action, penalties and the possibility we will not be able to maintain our existing cobrand and agent relationships in the EU. In addition, a number of federal and state laws to regulate various aspects of network operations are being considered or have passed, including regarding information associated with electronic transactions (such as the use of specific merchant categories codes or limitations on the use of transaction data) and pricing of electronic transactions (such as interchange fees on sales tax or gratuities).
Legislators and regulators also continue to focus on consumer protection, including product design and pricing constructs, account management and security, credit bureau reporting, disclosure rules, marketing and debt collection practices. This focus has included fees associated with card and banking products, such as a rule issued by the CFPB related to credit card fees for late payments (which is currently stayed); interest rates, such as recent proposals to cap credit card interest rates; rewards programs, such as the recent inquiries by the CFPB and DOT focused on credit card and airline rewards programs; and factors considered by financial institutions in providing services, such as “fair access” laws. Any new requirements or increased enforcement of existing requirements could materially and adversely impact our revenue growth and profitability, including, as a result of increased scrutiny of our pricing, underwriting and account management practices; the imposition of fines and customer remediation; higher compliance costs; reputational harm; restrictions on our ability to issue cards, appropriately price for the value of our products or work with certain business partners; and changes to our business practices generally.
We are subject to significant supervision and regulation with respect to compliance with AML/CFT laws, sanctions regimes and anti-corruption laws in numerous jurisdictions. As regulators increase their focus in these areas, new technologies such as digital currencies develop, near real-time money movement solutions are adopted, we introduce new products like checking accounts and geopolitical tensions increase, we face increased costs related to oversight, supervision and potential fines. Our AML/CFT, sanctions and anti-corruption compliance programs have become the subject of heightened scrutiny, and we are working to make enhancements to our existing programs, policies and procedures and to identify and remediate deficiencies. For example, we recently voluntarily reported certain transactions and accounts to OFAC, some of which related to Iran, as described in “Supervision and Regulation — Anti-Money Laundering, Countering the Financing of Terrorism, Economic Sanctions and Anti-Corruption Compliance” under “Business.” Errors, failures or delays in complying with AML/CFT, sanctions and anti-corruption laws, deficiencies in our related compliance programs or association of our business with money laundering, terrorist financing, tax fraud or other illicit activities or sanctioned persons, entities, governments or countries can give rise to significant supervisory, criminal and civil proceedings and lawsuits, which could result in significant penalties and forfeiture of assets, loss of licenses or restrictions on business activities, or other enforcement actions, and our reputation may suffer due to our customers’ association with certain countries, persons or entities or the existence of any such transactions. Additionally, our AML/CFT, sanctions and anti-corruption compliance programs may limit our ability to pursue certain business opportunities or affect our relationships with certain partners, service providers and other third parties.
See “Supervision and Regulation” under “Business” for more information about certain laws and regulations to which we are subject and their impact on us.
Litigation and regulatory actions could subject us to significant fines, penalties, judgments and/or requirements resulting in significantly increased expenses, damage to our reputation and/or a material adverse effect on our business and results of operations.
At any given time, we are involved in a number of legal proceedings, including class action lawsuits, mass arbitrations and similar actions. Many of these actions include claims for substantial compensatory or punitive damages and require us to incur significant costs for legal representation, arbitration fees or other legal or related services. While we have historically relied on our arbitration clause in agreements with customers to limit our exposure to class action litigation, there can be no assurance that we will continue to be successful in enforcing our arbitration clause in the future, including as a result of legal challenges to, and new regulations affecting, our arbitration provisions, and claims of the type we previously arbitrated could be subject to the complexities, risks and costs associated with class action cases. The continued focus of merchants on issues relating to the acceptance of various forms of payment may lead to additional litigation and other legal actions. Given the inherent uncertainties involved in litigation, and the very large or indeterminate damages sought in some matters asserted against us, there is significant uncertainty as to the ultimate liability we may incur from litigation.
We expect that financial institutions, such as us, will continue to face significant regulatory scrutiny, with regulators taking formal enforcement actions against financial institutions in addition to addressing supervisory concerns through non-public supervisory actions or findings, which could involve restrictions on our activities, among other limitations, that could adversely affect our business. In addition, a violation of law or regulation by another financial institution could give rise to an investigation by regulators and other governmental agencies of the same or similar practices by us. Further, a single event may give rise to numerous and overlapping investigations and proceedings. External publicity concerning investigations can increase the scope and scale of investigations and lead to further regulatory inquiries.
We are also involved at any given time with governmental and regulatory inquiries, investigations and proceedings. Regulatory scrutiny has continued to increase in a number of areas, and regulatory action could subject us to significant fines, penalties or other requirements resulting in Card Member reimbursements, increased expenses, limitations or conditions on our business activities, and damage to our reputation and our brand, all of which could materially adversely affect our business and results of operations. For example, as previously disclosed, we entered into agreements to resolve governmental investigations related to historical sales practices for certain U.S. small business customers, which are described in more detail in Note 12 to the “Consolidated Financial Statements.” In addition, we are cooperating with ongoing regulatory inquiries concerning our rewards and benefits programs, as described in “Supervision and Regulation” under “Business.”
Legal proceedings regarding provisions in our merchant contracts, including non-discrimination and honor-all-cards provisions, could have a material adverse effect on our business and result in additional litigation and/or arbitrations, changes to our merchant agreements and/or business practices, substantial monetary damages and damage to our reputation and brand.
We are, and have been in the past, a defendant in a number of actions, including legal proceedings, arbitrations and proposed class actions, challenging certain provisions of our card acceptance agreements. See Note 12 to the “Consolidated Financial Statements” for a description of certain outstanding legal proceedings.
An adverse outcome in these proceedings could have a material adverse effect on our business and results of operations, require us to change our merchant agreements in a way that could expose our cards to increased merchant steering and other forms of discrimination that could impair the Card Member experience, result in additional litigation and/or arbitrations, impose substantial monetary damages and damage our reputation and brand. Even if we were not required to change our merchant agreements, changes in Visa’s and Mastercard’s policies or practices as a result of legal proceedings, lawsuit settlements or regulatory actions pending against them could result in changes to our business practices and materially and adversely impact our profitability. For example, in 2024 Visa and Mastercard proposed a lawsuit settlement agreement that would have, among other things, required reductions and caps on interchange fees and streamlined requirements for merchants who wish to impose a surcharge on credit transactions. While the settlement agreement was not approved by the court, Visa and Mastercard may ultimately agree or be subject to changes in policies or practices that result in greater surcharging generally or downward pressure on our merchant discount rates from decreases in competitor pricing in connection with reductions and caps on interchange fees.
We rely on third-party providers for acquiring and servicing customers, technology, platforms and other services integral to the operations of our businesses. These third parties may act in ways that could materially harm our business.
We rely on third-party service providers, cobrand partners, merchants, affiliate marketing firms, processors, aggregators, network partners and other third parties for services that are integral to our operations and are subject to the risk that activities of such third parties may adversely affect our business. As outsourcing, specialization of functions, third-party digital services and technology innovation within the payments industry increase (including with respect to mobile technologies, tokenization, big data, artificial intelligence and cloud-based solutions), more third parties are involved in processing card transactions, handling our data and supporting our operations. For example, we rely on third parties for the timely transmission of accurate information across our global network, card acquisition and provision of services to our customers.
We have experienced in certain limited circumstances and may continue to experience disruptions or other events at our third parties or our third parties’ service providers, including their failure to fulfill their obligations and the information, cybersecurity and operational incidents described above. Such disruptions or other events could interrupt or compromise the quality of our services to customers, impact the confidentiality, integrity, availability and security of our data, lead to fraudulent transactions on our cards or other products, impact our business, cause brand or reputational damage, and lead to costs associated with responding to such a disruption, including notification and remediation costs, costs to switch service providers or move operations in house, regulatory investigations and fines and increased regulatory oversight and litigation. Third parties may face similar or greater risks as us, including as a result of their relationship with us; however, they may be less prepared to mitigate those risks and may be
targeted by bad actors as a result, which can result in greater disruptions and other risk events. Third parties may also act in other ways that are inconsistent with our interests or contrary to our strategic or technological initiatives, such as ceasing to provide data to us or using our data in a way that was not authorized or diminishes the value of the transaction data we receive through our integrated payments platform.
The management and oversight of an increasing number of third parties increases our operational complexity and governance challenges and decreases our control. Additionally, third-party oversight and practices related to third parties such as outsourcing have become subject to heightened regulatory scrutiny both in the United States and internationally, including in some cases restricting or requiring approval for outsourcing. A failure to exercise adequate oversight over third parties, including compliance with service level agreements or regulatory or legal requirements, could result in regulatory actions, fines, litigation, sanctions or economic and reputational harm to us. In addition, we may not be able to effectively monitor or mitigate operational risks relating to our third-party providers’ service providers. We are also exposed to the risk that a service disruption at a service provider common to our third parties could impede their ability to provide services to us. Notwithstanding any attempts to diversify our reliance on third parties, in certain cases there may be limited alternatives or high costs for diversification, and we also may not be able to effectively mitigate operational risks relating to the service providers of our third-party providers.
Our success is dependent on maintaining a culture of integrity and respect and upon our executive officers and other key personnel, and misconduct by or loss of personnel could materially adversely affect our business.
We rely upon our colleagues not only for business success, but also to act with integrity and promote a culture of respect. To the extent our colleagues behave in a manner that does not comport with our company’s values, the consequences to our brand and reputation could be severe and could negatively affect our financial condition and results of operations.
The market for qualified, highly motivated individuals with diverse perspectives is highly competitive and we may not be able to attract and retain such individuals. The unexpected loss of key personnel could disrupt our business and have an adverse impact on our future performance. Changes in immigration and work permit laws and regulations or the administration or enforcement of such laws or regulations or other changes in the legal or regulatory environment can also impair our ability to attract and retain qualified personnel, or to employ colleagues in the location(s) of our choice. Our compensation practices are subject to review and oversight by the Federal Reserve and the compensation practices of AENB are subject to review and oversight by the OCC. This regulatory review and oversight could further affect our ability to attract and retain our executive officers and other key personnel. Our inability to attract, develop and retain highly skilled, motivated and diverse personnel could materially adversely affect our business and our culture.
Regulation in the areas of privacy, data protection, data management, resiliency, data transfer, third party oversight, account access, artificial intelligence and machine learning and information security and cybersecurity could increase our costs and affect or limit our business opportunities and how we collect and/or use personal information.
Legislators and regulators in the United States and other countries in which we operate are increasingly adopting or revising privacy, data protection, data management, resiliency, data transfer, third party oversight, account access, artificial intelligence and machine learning and information security and cybersecurity laws, including data localization, authentication and notification laws. As such laws are interpreted and applied (in some cases, with significant differences or conflicting requirements across jurisdictions), compliance and technology costs will continue to increase, particularly in the context of ensuring that adequate privacy, data protection, data management, incident management, resiliency, third party management, data transfer, security controls, account access mechanisms and controls related to artificial intelligence and machine learning are in place. Additionally, new laws and regulations related to automated decision making, artificial intelligence and machine learning as well as the application of existing laws and regulations to these technologies may restrict or impose burdensome and costly requirements on our ability to use them or impact other aspects of our business.
Compliance with current or future laws in the aforementioned areas could significantly impact our business operations, including our collection, use, sharing, retention and safeguarding of consumer and/or colleague information and could restrict our ability to fully maximize our integrated payments platform or provide certain products and services or work with certain service providers, which could materially and adversely affect our profitability. Our failure to comply with such laws or to maintain sufficient governance and control structures could result in potentially significant regulatory and/or governmental investigations and/or actions, litigation, fines, sanctions, ongoing regulatory monitoring, customer attrition, decreases in the use or acceptance of our cards and damage to our reputation and our brand. In recent years, there has been increasing regulatory enforcement and litigation activity in the areas of privacy, data protection, data management, artificial intelligence and machine learning and information security and cybersecurity in the United States, the EU and various other countries in which we operate and our data protection and governance programs have become the subject of heightened scrutiny.
For more information on regulatory and legislative activity in this area, see “Supervision and Regulation — Privacy, Data Protection, Data Management, Artificial Intelligence, Resiliency, Information Security and Cybersecurity” under “Business.”
If we are not able to protect our intellectual property, or successfully defend against any infringement or misappropriation assertions brought against us, our revenue and profitability could be negatively affected.
We rely on a variety of measures to protect our intellectual property and control access to, and distribution of, our trade secrets and other proprietary information. These measures may not prevent infringement of our intellectual property rights or misappropriation of our proprietary information and a resulting loss of competitive advantage. The ability to enforce intellectual property rights to prevent disclosure of our trade secrets and other proprietary information may be limited in certain jurisdictions. In addition, competitors or other third parties may allege that our products, systems, processes or technologies infringe on their intellectual property rights. Given the complex, rapidly changing and competitive technological and business environments in which we operate, and the potential risks and uncertainties of intellectual property-related litigation, a future assertion of an infringement or
misappropriation claim against us could cause us to lose significant revenues, incur significant defense, license, royalty or technology development expenses, and/or pay significant monetary damages. Furthermore, given intellectual property ownership and license rights surrounding artificial intelligence, such as generative artificial intelligence, are currently not fully addressed by courts or regulators, we may not be able to protect our intellectual property against infringing use and our use or adoption of artificial intelligence may result in exposure to claims by third parties.
Tax legislative initiatives or assessments could adversely affect our results of operations and financial condition.
We are subject to income and other taxes in the United States and in various foreign jurisdictions. The laws and regulations related to tax matters are extremely complex, require significant judgment and are subject to varying interpretations. Although management believes our positions are reasonable, they are subject to challenge by the Internal Revenue Service in the United States and by tax authorities in other jurisdictions in which we conduct business operations, which could have an adverse impact on our tax liabilities. Refer to Note 20 to the “Consolidated Financial Statements” for information on the U.S. federal income tax audit of transfer pricing arrangements between our U.S. and foreign subsidiaries.
We are being challenged in a number of countries regarding our application of value-added taxes (VAT) to certain transactions. While we believe we comply with all applicable VAT and other tax laws, rules and regulations in the relevant jurisdictions, the tax authorities may determine that we owe additional taxes or apply existing laws and regulations more broadly, which could result in a significant increase in liabilities for taxes and interest in excess of accrued liabilities.
Legislative action or inaction in the countries in which we have operations could increase our effective tax rate. For example, new guidelines issued by the Organization for Economic Cooperation and Development (OECD) will impact how multinational enterprises (MNEs) are taxed on their global profits. In particular, the OECD’s guidelines on a global minimum tax of 15 percent will impact the effective tax rate for many MNEs. Many countries have already implemented these minimum tax guidelines, with effective dates commencing in 2024. We expect that these minimum tax guidelines in their current form would increase our effective tax rate in future years. Furthermore, various provisions of the Tax Cut and Jobs Act will expire in 2025 unless extended. As a result, U.S. Congress may seek to enact significant tax legislation in the new session of Congress, which could result in higher levels of U.S. tax on our global operations, increasing our effective tax rate.
Jurisdictions may also make changes related to the tax treatment of card transactions, such as imposing taxes on Card Member rewards or prohibiting interchange fees on sales tax, which could decrease the value we provide to customers and adversely impact our business.
Our operations, business, customers and partners could be adversely affected by climate-related risks.
There are increasing and rapidly evolving concerns over climate-related risks and related environmental sustainability and recovery matters. We face physical risks related to climate, including rising average global temperatures, rising sea levels and an increase in the frequency and severity of extreme weather events and natural disasters. Such events and disasters could disrupt our operations or the operations of customers or third parties on which we rely and could result in market volatility or negatively impact our customers’ spending behaviors or ability to pay outstanding loans. Additionally, we may face risks related to the transition to a low-carbon economy. Changes in consumer preferences, travel patterns and legal requirements could impact our revenues or expenses or otherwise adversely affect our business, our customers and partners.
We may not be able to effectively identify, measure or control our exposure to climate-related risks, particularly given that the timing, nature and severity of the impacts of these risks may not be predictable. We could be criticized for the timing, scope or nature of our climate-related initiatives and goals. There can be no assurance that we will achieve these goals, which depend in part on third-party performance, data that is outside of our control and methodologies that may evolve over time. We could be required to change our business, management practices and partnerships, incur expenses from changes to our technology, operations, products and services, and experience reputational harm as a result of negative public sentiment, regulatory scrutiny and reduced stakeholder confidence, due to our response or perceived lack of response to climate and environmental issues.
Model, Credit, Market and Funding & Liquidity Risks
Our use of models to manage risk and make business decisions may not be effective.
We use models and automation throughout our business, including to inform and support decision making, manage risks and estimate financial values. Although we have a governance framework for model development and independent model validation, the modeling methodology or key assumptions could be erroneous or the models could be misused. In addition, issues with the quality or effectiveness of our data aggregation and validation procedures, as well as the quality and integrity of data inputs, could result in ineffective or inaccurate model outputs and reports. For example, models based on historical data sets might not be accurate predictors of future outcomes, such as because of changes in the credit profile of our Card Members, and they may not be able to predict future outcomes. Additionally, we increasingly use models that leverage artificial intelligence, which are subject to additional risks such as biased or inaccurate results or lowered interpretability. Our models also may not be able to function properly in the current geopolitical and macroeconomic environment given the lack of recent precedent. Certain models, such as models for credit loss accounting under Current Expected Credit Loss (CECL) and Membership Rewards liability, require us to make difficult, subjective and complex judgments, and utilize forward-looking information. If our business decisions or financial estimates are based on incorrect or misused models and assumptions or we fail to manage data inputs effectively and to aggregate or analyze data in an accurate and timely manner, our results of operations and financial condition may be materially adversely affected.
We are exposed to credit risk and trends that affect Card Member spending and the ability of customers and partners to pay us, which could have a material adverse effect on our results of operations and financial condition.
We are exposed to both individual credit risk, principally from consumer and small business Card Member loans and receivables, and institutional credit risk, principally from corporate Card Member loans and receivables, merchants, network partners, loyalty coalition partners and treasury and investment counterparties. Third parties may default on their obligations to us due to bankruptcy, lack of liquidity, operational failure or other reasons. General economic factors, such as recession, unemployment, inflation and interest rates, may result in greater delinquencies that lead to greater credit losses. A customer’s ability and willingness to repay us can be negatively impacted not only by economic, market, political and social conditions but also by a customer’s other payment obligations, and increasing leverage can result in a higher risk that customers will default or become delinquent in their obligations to us.
We rely principally on the customer’s creditworthiness for repayment of loans or receivables and therefore often have no other recourse for collection. Our ability to assess creditworthiness may be impaired as a result of changes in our underwriting practices or if the criteria or models we use to manage our credit risk prove inaccurate in predicting future losses, which could have a negative impact on our results of operations. This may be exacerbated to the extent information we have historically relied upon to make credit decisions does not accurately portray a customer’s creditworthiness, including as a result of the current interest rate and economic conditions. Further, our pricing strategies, particularly for new lending features and non-card lending products, may not offset the negative impact on profitability caused by increases in delinquencies and losses; thus any material increases in delinquencies and losses beyond our current estimates could have a material adverse impact on us. Although we make estimates to provide for credit losses in our outstanding portfolio of loans and receivables, these estimates may not be accurate. In addition, the information we use in managing our credit risk may be inaccurate or incomplete.
Rising delinquencies and rising rates of bankruptcy are often precursors of future write-offs and may require us to increase our reserve for credit losses. Higher write-off rates and the resulting increase in our reserves for credit losses adversely affect our profitability and the performance of our securitizations, and may increase our cost of funds.
Although we regularly review our credit exposure to specific clients and counterparties and to specific industries, countries and regions that we believe may present credit concerns, default risk may arise from events or circumstances that are difficult to foresee or detect, such as fraud. In addition, our ability to manage credit risk or collect amounts owed to us may be adversely affected by legal or regulatory changes (such as restrictions on collections or changes in bankruptcy laws, minimum payment regulations and re-age guidance) or changes in customer behavior (such as the increased use of debt settlement companies). Increased credit risk, whether resulting from underestimating the credit losses inherent in our portfolio of loans and receivables, deteriorating economic conditions (particularly in the United States, as U.S. Card Members were responsible for approximately 88 percent of our total Card Member loans outstanding as of December 31, 2024), increases in the level of loan balances, changes in our mix of business or otherwise, could require us to increase our provisions for losses and could have a material adverse effect on our results of operations and financial condition.
Interest rate changes could materially adversely affect our earnings.
We had net interest income of approximately $15.5 billion for the year ended December 31, 2024. If the rate of interest we pay on our borrowings increases more or decreases less than the rate of interest we earn on our loans, our net interest yield, and consequently our net interest income, could decrease. We expect the rates we pay on our deposits will change as benchmark interest rates change. For example, the Federal Reserve and other central banks have raised interest rates in response to heightened inflationary pressures. In addition, interest rate changes may affect customer behavior, such as impacting the loan balances Card Members carry on their credit cards or their ability to make payments as higher interest rates lead to higher payment requirements, further impacting our results of operations. For a further discussion of our interest rate risk, see “Risk Management ― Market Risk Management Process” under “MD&A.”
We are subject to capital adequacy and liquidity rules, and if we fail to meet these rules, our business would be materially adversely affected.
Failure to meet current or future capital or liquidity requirements could compromise our competitive position and could result in restrictions imposed by the Federal Reserve, or the OCC with respect to AENB, including limiting our ability to pay dividends, repurchase our capital stock, invest in our business, expand our business or engage in acquisitions. Some elements of the capital and liquidity regimes are not yet final and certain developments could significantly impact the requirements applicable to financial institutions. For example, in 2023 the U.S. federal bank regulatory agencies proposed capital rules that would result in significantly higher regulatory capital requirements for us and rules that would require us and AENB to issue and/or maintain minimum amounts of eligible long-term debt with specific terms. In addition, it may be necessary for us to hold additional capital because of an increase in the SCB requirement based on results from a supervisory stress test.
Compliance with capital adequacy and liquidity rules requires a material investment of resources. An inability to meet regulatory expectations regarding our compliance with applicable capital adequacy and liquidity rules or supervisory expectations regarding capital and liquidity risk management capabilities and practices may also negatively impact the assessment of us and AENB by federal banking regulators. Additionally, we are subject to more stringent capital and liquidity requirements as a result of becoming a Category III firm, which may further increase if we grow to become a Category II firm.
For more information on capital adequacy requirements, see “Supervision and Regulation — Capital and Liquidity Regulation” under “Business.”
We are subject to restrictions that limit our ability to pay dividends and repurchase our capital stock. Our subsidiaries are also subject to restrictions that limit their ability to pay dividends to us, which may adversely affect our liquidity.
We are limited in our ability to pay dividends and repurchase capital stock by our regulators, who have broad authority to prohibit any action that would be considered an unsafe or unsound banking practice. We are subject to a requirement to submit capital plans to the Federal Reserve for review that include, among other things, projected dividend payments and repurchases of capital stock. As part of the capital planning and stress testing process, our proposed capital actions are assessed against our ability to satisfy applicable capital requirements in the event of a stressed market environment. If we fail to satisfy applicable capital requirements, including the stress capital buffer, our ability to undertake capital actions may be restricted.
Our ability to declare or pay dividends on, or to purchase, redeem or otherwise acquire, shares of our common stock will be prohibited, subject to certain exceptions, in the event that we do not declare and pay in full dividends for the last preceding dividend period of our preferred stock.
We rely on dividends from our subsidiaries for liquidity, and such dividends may be limited by law, regulation or supervisory policy. For example, AENB is subject to various statutory and regulatory limitations on its declaration and payment of dividends. These limitations may hinder our ability to access funds we may need to make payments on our obligations, make dividend payments or otherwise achieve strategic objectives.
Any future reduction or elimination of our common stock dividend or share repurchase program could adversely affect the market price of our common stock and market perceptions of American Express. For more information on bank holding company and depository institution dividend restrictions, see “Supervision and Regulation — Stress Testing and Capital Planning” and “— Dividends and Other Capital Distributions” under “Business,” as well as “Consolidated Capital Resources and Liquidity — Dividends and Share Repurchases” under “MD&A” and Note 22 to the “Consolidated Financial Statements.”
Adverse market conditions may significantly affect our access to, and cost of, capital and ability to meet liquidity needs.
Our ability to obtain financing in the debt capital markets for unsecured term debt and asset securitizations is dependent on financial market conditions. Disruptions, uncertainty or volatility across the financial markets, as well as adverse developments affecting our competitors and the financial industry generally, could negatively impact market liquidity and limit our access to funding required to operate our business. Such market conditions may also limit our ability to replace, in a timely manner, maturing liabilities, satisfy regulatory capital requirements and access the funding necessary to grow our business. In some circumstances, we may incur an unattractive cost to raise capital, which could decrease profitability and significantly reduce financial flexibility. Additional factors affecting the extent to which we may securitize loans and receivables in the future include the overall credit quality of our loans and receivables, the costs of securitizing our loans and receivables, the demand for credit card asset-backed securities and the legal, regulatory, accounting or tax rules affecting securitization transactions and asset-backed securities, generally. Our liquidity and cost of funds would also be adversely affected by the occurrence of events that could result in the early amortization of our existing securitization transactions. For a further discussion of our liquidity and funding needs, see “Consolidated Capital Resources and Liquidity” under “MD&A.”
Any reduction in our credit ratings could increase the cost of our funding from, and restrict our access to, the capital markets and have a material adverse effect on our results of operations and financial condition.
Ratings of our long-term and short-term debt and deposits are based on a number of factors, including financial strength, as well as factors not within our control, including conditions affecting the financial services industry, and the macroeconomic environment. Our ratings could be downgraded at any time and without any notice by any of the rating agencies, which could, among other things, adversely limit our access to the capital markets and adversely affect the cost and other terms upon which we are able to obtain funding. Our ability to raise funding through the securitization market also depends, in part, on the credit ratings of the securities we issue from our securitization trusts. If we are not able to satisfy rating agency requirements to confirm the ratings of our asset-backed securities, it could limit our ability to access the securitization markets.
Adverse currency fluctuations and foreign exchange controls could decrease earnings we receive from our international operations.
During 2024, approximately 22 percent of our total revenues net of interest expense were generated from activities outside the United States. We are exposed to foreign exchange risk from our international operations, and accordingly the revenue we generate outside the United States is subject to unpredictable fluctuations if the values of other currencies change relative to the U.S. dollar, which could have a material adverse effect on our results of operations.
Political and economic conditions could continue to cause changes in the values of currencies and a further strengthening of the U.S. dollar will negatively impact our net revenues. Substantial and sudden devaluation of local Card Members’ currency can also affect their ability to make payment to us. Foreign exchange regulations or capital controls might restrict or prohibit the conversion of other currencies into U.S. dollars or our ability to transfer them and the availability of foreign exchange could further impact our results of operations.
An inability to accept or maintain deposits due to market demand or regulatory constraints could materially adversely affect our liquidity position and our ability to fund our business.
Our U.S. bank subsidiary, AENB, accepts deposits and uses the proceeds as a source of funding, with our direct retail deposits becoming a larger proportion of our funding over time. We continue to face strong competition with regard to deposits, and pricing and product changes may adversely affect our ability to attract and retain cost-effective deposit balances. To the extent we offer higher interest rates to attract or maintain deposits, our funding costs will be adversely impacted. Additionally, a decrease in confidence in the soundness of us or in the banking sector more broadly, such as following the occurrence of bank failures, or in the level of insurance available on deposits may cause rapid deposit withdrawals or an unwillingness to maintain deposits with us,
which could materially adversely affect us and our ability to fund our business. The use of social media and similar channels has the potential to intensify and accelerate such a decrease in confidence in soundness.
Our ability to obtain deposit funding and offer competitive interest rates on deposits is also dependent on AENB’s capital levels. The FDIA’s brokered deposit provisions and related FDIC rules in certain circumstances prohibit banks from accepting or renewing brokered deposits and apply other restrictions, such as a cap on interest rates that can be paid. Additionally, our regulators can adjust applicable capital requirements at any time and have authority to place limitations on our deposit businesses. An inability to attract or maintain deposits in the future could materially adversely affect our ability to fund our business.
The value of our investments may be adversely impacted by economic, political or market conditions.
Market risk includes the loss in value of portfolios and financial instruments due to adverse changes in market variables, which could negatively impact our financial condition. We have experienced realized and unrealized losses in our Amex Ventures™ equity investments and may experience further losses in the future. As of December 31, 2024, we held approximately $1.2 billion of investment securities, primarily consisting of debt securities, and equity investments, including certain equity method investments, totaling approximately $2.0 billion. Negative market conditions, changes in valuations or increases in default rates or bankruptcies with respect to these investments, due to economic conditions, business performance or otherwise, could have a material adverse impact on the value of our investments, potentially resulting in impairment charges. Defaults, threats of defaults or economic disruptions, even in countries or territories in which we do not have material investment exposure, conduct business or have operations, could adversely affect us.
ITEM 1B. UNRESOLVED STAFF COMMENTS
Not applicable.
ITEM 1C. CYBERSECURITY
We maintain an information security and cybersecurity program and a cybersecurity governance framework that are designed to protect our information systems against operational risks related to cybersecurity.
Cybersecurity Risk Management and Strategy
We define information security and cybersecurity risk as the risk that the confidentiality, integrity or availability of our information and information systems are impacted by unauthorized or unintended access, use, disclosure, disruption, modification or destruction. Information security and cybersecurity risk is an operational risk that is measured and managed as part of our operational risk framework. Operational risk is incorporated into our comprehensive Enterprise Risk Management (ERM) program, which we use to identify, aggregate, monitor, report and manage risks. For more information on our ERM program, see “Risk Management” under “MD&A.”
Our Technology Risk and Information Security (TRIS) program, which is our enterprise information security and cybersecurity program incorporated in our ERM program and led by our Chief Information Security Officer (CISO), is designed to (i) ensure the security, confidentiality, integrity and availability of our information and information systems; (ii) protect against any anticipated threats or hazards to the security, confidentiality, integrity or availability of such information and information systems; and (iii) protect against unauthorized access to or use of such information or information systems that could result in substantial harm or inconvenience to us, our colleagues or our customers. The TRIS program is built upon a foundation of advanced security technology, employs a highly trained team of experts and is designed to operate in alignment with global regulatory requirements. The program deploys multiple layers of controls, including embedding security into our technology investments, designed to identify, protect, detect, respond to and recover from information security and cybersecurity incidents. Those controls are measured and monitored by a combination of subject matter experts and a security operations center with integrated cyber detection, response and recovery capabilities. The TRIS program includes our Enterprise Incident Response Program, which manages information security incidents involving compromises of sensitive information, and our Cyber Crisis Response Plan, which provides a documented framework for handling high-severity security incidents and facilitates coordination across multiple parts of the Company to manage response efforts. We also routinely perform simulations and drills at both a technical and management level, and our colleagues receive annual cybersecurity awareness training.
In addition, we incorporate reviews by our Internal Audit Group and external expertise in our TRIS program, including an independent third-party assessment of our cybersecurity measures and controls and a third-party cyber maturity assessment of our TRIS program against the Cyber Risk Institute Profile standards for the financial sector. We also invest in threat intelligence, collaborate with our peers in areas of threat intelligence, vulnerability management, incident response and drills, and are active participants in industry and government forums.
Cybersecurity risks related to third parties are managed as part of our Third Party Management Policy, which sets forth the procurement, risk management and contracting framework for managing third-party relationships commensurate with their risk and complexity. Our Third Party Lifecycle Management (TLM) program sets guidelines for identifying, measuring, monitoring, and reporting the risks associated with third parties through the life cycle of the relationships, which includes planning, due diligence and third-party selection, contracting, ongoing monitoring and termination. Our TLM program includes the identification of third parties with risks related to information security. Third parties that access, process, collect, share, create, store, transmit or destroy our information or have access to our systems may have additional security requirements depending on the levels of risk, such as enhanced risk assessments and monitoring, and additional contractual controls.
While we do not believe that our business strategy, results of operations or financial condition have been materially adversely affected by any cybersecurity incidents, cybersecurity threats are pervasive and, similar to other global financial institutions, we, as well as our customers, colleagues, regulators, service providers and other third parties, have experienced a significant increase in information security and cybersecurity risk in recent years and will likely continue to be the target of cyberattacks. We continue to assess the risks and changes in the cyber environment, invest in enhancements to our cybersecurity capabilities, and engage in industry and government forums to promote advancements in our cybersecurity capabilities, as well as the broader financial services cybersecurity ecosystem. For more information on risks to us from cybersecurity threats, see “A major information or cybersecurity incident or an increase in fraudulent activity could lead to reputational damage to our brand and material legal, regulatory and financial exposure, and could reduce the use and acceptance of our products and services.” under “Risk Factors.”
Cybersecurity Governance
Under our cybersecurity governance framework, our Board and Risk Committee are primarily responsible for overseeing and governing the development, implementation and maintenance of our TRIS program, with our Board designating our Risk Committee to provide oversight and governance of technology and cybersecurity risks. Our Board receives an update on cybersecurity at least once a year from our CISO or their designee. Our Risk Committee receives reports on cybersecurity at least twice a year, including in at least one joint meeting with our Audit and Compliance Committee, and our Board and these committees all receive ad hoc updates as needed. In addition, our Risk Committee annually approves our TRIS program.
We have multiple internal management committees that are responsible for the oversight of cybersecurity risk. Our Operational Risk Management Committee (ORMC), chaired by our Chief Operational Risk Officer, provides oversight and governance for our information security risk management activities, including those related to cybersecurity. This includes efforts to identify, measure, manage, monitor and report information security risks associated with our information and information systems and potential impacts to the American Express brand. The ORMC escalates risks to our Enterprise Risk Management Committee (ERMC), chaired by our Chief Risk Officer, or our Board based on the escalation criteria provided in our enterprise-wide risk appetite framework. Members of management with cybersecurity oversight responsibilities are informed about cybersecurity risks and incidents through a number of channels, including periodic and annual reports, with the annual report also provided to our Risk Committee, the ORMC and ERMC.
Our CISO leads the strategy, engineering and operations of cybersecurity across the Company and is responsible for providing annual updates to our Board, the ERMC and the ORMC on our TRIS program, as well as ad hoc updates on information security and cybersecurity matters. Our current CISO has held a series of roles in telecommunications, networking and information security at American Express, including promotion to the CISO role in 2013, and is also responsible for technology risk management. Prior to joining American Express, our current CISO served in a variety of technology leadership roles at a public pharmaceutical and biotechnology company for 14 years. Our CISO reports to the Chief Information Officer, information about whom is included in “Information About Our Executive Officers” under “Business.”
For more information on our risk governance structure, see “Risk Management — Governance” and “Risk Management —Operational Risk Management Process” under “MD&A.”
ITEM 2. PROPERTIES
Our principal executive offices are in a 2.2 million square foot building located in lower Manhattan on land leased from the Battery Park City Authority for a term expiring in 2069. We have an approximately 49 percent ownership interest in the building and an affiliate of Brookfield Financial Properties owns the remaining approximately 51 percent interest in the building. We also lease space in the building from Brookfield’s affiliate.
Other owned or leased principal locations include American Express offices in Phoenix, Arizona, Sunrise, Florida, Gurgaon and Bangalore, India, Manila, Philippines, Brighton, England, Tokyo, Japan, Kuala Lumpur, Malaysia, Rome, Italy and Sydney, Australia; the American Express data centers in Phoenix, Arizona and Greensboro, North Carolina; the headquarters for AENB in Sandy, Utah; the headquarters for American Express Services Europe Limited in London, England; the headquarters for American Express Europe, S.A. in Madrid, Spain; the headquarters for Amex Bank of Canada and Amex Canada Inc. in Toronto, Ontario, Canada; and the headquarters for American Express Company (Mexico) S.A. de C.V. in Mexico City, Mexico. We also lease and operate multiple lounges as a benefit for our Card Members, including in major U.S. and global hub airports.
ITEM 3. LEGAL PROCEEDINGS
Refer to Note 12 to the “Consolidated Financial Statements,” which is incorporated herein by reference.
ITEM 4. MINE SAFETY DISCLOSURES
Not applicable.
PART II
ITEM 5. MARKET FOR REGISTRANT’S COMMON EQUITY, RELATED STOCKHOLDER MATTERS AND ISSUER PURCHASES OF EQUITY SECURITIES
(a)Our common stock trades principally on The New York Stock Exchange under the trading symbol AXP. As of December 31, 2024, we had 16,641 common shareholders of record. You can find dividend information concerning our common stock in the Consolidated Statements of Shareholders’ Equity in the “Consolidated Financial Statements.” For information on dividend restrictions, see “Supervision and Regulation — Dividends and Other Capital Distributions” under “Business” and Note 22 to the “Consolidated Financial Statements.” You can find information on securities authorized for issuance under our equity compensation plans under the caption “Executive Compensation — Equity Compensation Plans” to be contained in our definitive 2025 proxy statement for our Annual Meeting of Shareholders, which is scheduled to be held on April 29, 2025. The information to be found under such caption is incorporated herein by reference. Our definitive 2025 proxy statement for our Annual Meeting of Shareholders is expected to be filed with the SEC in March 2025 (and, in any event, not later than 120 days after the close of our most recently completed fiscal year).
Stock Performance Graph
The information contained in this Stock Performance Graph section shall not be deemed to be “soliciting material” or “filed” or incorporated by reference in future filings with the SEC, or subject to the liabilities of Section 18 of the Exchange Act, except to the extent that we specifically incorporate it by reference into a document filed under the Securities Act or the Exchange Act.
The following graph compares the cumulative total shareholder return on our common shares with the total return on the S&P 500 Index and the S&P Financial Index for the last five years. It shows the growth of a $100 investment on December 31, 2019, including the reinvestment of all dividends.
| | | | | | | | | | | | | | | | | | | | | | | | | | | | | | | | | | | | | | |
| Year-end Data | | 2019 | | 2020 | | 2021 | | 2022 | | 2023 | | 2024 |
| American Express | | $ | 100.00 | | | $ | 98.85 | | | $ | 135.31 | | | $ | 123.77 | | | $ | 159.28 | | | $ | 255.35 | |
| S&P 500 Index | | $ | 100.00 | | | $ | 118.39 | | | $ | 152.34 | | | $ | 124.73 | | | $ | 157.48 | | | $ | 196.85 | |
| S&P Financial Index | | $ | 100.00 | | | $ | 98.24 | | | $ | 132.50 | | | $ | 118.49 | | | $ | 132.83 | | | $ | 173.35 | |
(b) Not applicable.
(c) Issuer Purchases of Securities
The table below sets forth the information with respect to purchases of our common stock made by or on behalf of us during the three months ended December 31, 2024. | | | | | | | | | | | | | | | | | | | | | | | | | | |
| | Total Number of Shares
Purchased | | Average Price Paid Per Share (c) | | Total Number of Shares Purchased as Part of Publicly Announced Plans or Programs(d) | | Maximum Number of
Shares that May
Yet Be
Purchased Under the
Plans
or Programs |
| October 1-31, 2024 | | | | | | | | |
Repurchase program(a) | | 387,722 | | | $ | 270.74 | | | 387,722 | | | 78,271,238 | |
Employee transactions(b) | | 16,467 | | | $ | 273.50 | | | N/A | | N/A |
| November 1-30, 2024 | | | | | | | | |
Repurchase program(a) | | 1,137,974 | | | $ | 289.86 | | | 1,137,974 | | | 77,133,264 | |
Employee transactions(b) | | — | | | $ | — | | | N/A | | N/A |
| December 1-31, 2024 | | | | | | | | |
Repurchase program(a) | | 1,962,445 | | | $ | 301.08 | | | 1,962,445 | | | 75,170,819 | |
Employee transactions(b) | | — | | | $ | — | | | N/A | | N/A |
| Total | | | | | | | | |
Repurchase program(a) | | 3,488,141 | | | $ | 294.05 | | | 3,488,141 | | | 75,170,819 | |
Employee transactions(b) | | 16,467 | | | $ | 273.50 | | | N/A | | N/A |
(a)On March 8, 2023, the Board of Directors authorized the repurchase of up to 120 million common shares from time to time, subject to market conditions and in accordance with our capital plans. This authorization replaced the prior repurchase authorization. See “Consolidated Capital Resources and Liquidity” under “MD&A” for additional information regarding share repurchases.
(b)Includes: (i) shares surrendered by holders of employee stock options who exercised options (granted under our incentive compensation plans) in satisfaction of the exercise price and/or tax withholding obligation of such holders and (ii) restricted shares withheld (under the terms of grants under our incentive compensation plans) to offset tax withholding obligations that occur upon vesting and release of restricted shares. Our incentive compensation plans provide that the value of the shares delivered or attested to, or withheld, be based on the price of our common stock on the date the relevant transaction occurs.
(c)The average price paid per share does not reflect costs and taxes associated with the purchase of shares.
(d)Share purchases under publicly announced programs are made pursuant to open market purchases, plans intended to satisfy the affirmative defense conditions of Rule 10b5-1(c) under the Exchange Act, privately negotiated transactions or other purchases, including block trades, accelerated share repurchase programs or any combination of such methods as market conditions warrant and at prices we deem appropriate.
ITEM 6. [RESERVED]
ITEM 7. MANAGEMENT’S DISCUSSION AND ANALYSIS OF FINANCIAL CONDITION AND RESULTS OF OPERATIONS (MD&A)
EXECUTIVE OVERVIEW
BUSINESS INTRODUCTION
We are a globally integrated payments company with four reportable operating segments: U.S. Consumer Services (USCS), Commercial Services (CS), International Card Services (ICS) and Global Merchant and Network Services (GMNS). Corporate functions and certain other businesses and operations are included in Corporate & Other.
Our range of products and services includes:
•Credit card, charge card, banking and other payment and financing products
•Merchant acquisition and processing, servicing and settlement, fraud prevention, and point-of-sale marketing and information products and services for merchants
•Network services
•Travel and lifestyle services
•Expense management products and services
•Other services, such as the design and operation of customer loyalty programs
The following types of revenue are generated from our various products and services:
•Discount revenue, our largest revenue source, primarily represents the amount we earn and retain from the merchant payable for facilitating transactions between Card Members and merchants on payment products issued by American Express. The amount of fees charged for accepting our cards as payment, or merchant discount, varies with, among other factors, the industry in which the merchant conducts business, the merchant’s overall American Express-related transaction volume, the method of payment, the settlement terms with the merchant, the method of submission of transactions and, in certain instances, the geographic scope for the card acceptance agreement between the merchant and us (e.g., local or global) and the transaction amount. In some instances, an additional flat transaction fee is assessed as part of the merchant discount, and additional fees may be charged such as a variable fee for card-not-present transactions or for transactions using cards issued outside the United States at merchants located in the United States;
•Interest income, principally represents interest earned on outstanding loan balances;
•Net card fees, represent revenue earned from annual card membership fees, which vary based on the type of card and the number of cards for each account;
•Service fees and other revenue, primarily represent service fees earned from merchants and other customers, foreign currency-related fees charged to Card Members, Card Member delinquency fees, travel commissions and fees, and income (losses) from our investments in which we have significant influence; and
•Processed revenue, primarily represents revenues related to network partnership agreements, comprising royalties, fees and amounts earned for facilitating transactions on cards issued by network partners.
Refer to the “Glossary of Selected Terminology” below for the definitions of certain key terms and related information appearing within this Form 10-K and “Critical Accounting Estimates” below for a discussion of certain of our accounting policies requiring significant management assumptions and judgements.
NON-GAAP MEASURES
We prepare our Consolidated Financial Statements in accordance with accounting principles generally accepted in the United States of America (GAAP). However, certain information included within this report constitutes non-GAAP financial measures. Our calculations of non-GAAP financial measures may differ from the calculations of similarly titled measures by other companies.
TABLE 1: SUMMARY OF FINANCIAL PERFORMANCE | | | | | | | | | | | | | | | | | | | | | | | | | | | | | | | | | | | | | | | | | | | | |
| Years Ended December 31, | | | | | | | | Change | | Change |
| (Millions, except percentages, per share amounts and where indicated) | | 2024 | | 2023 | | 2022 | | 2024 vs. 2023 | | 2023 vs. 2022 |
| Selected Income Statement Data | | | | | | | | | | | | | | |
| Total revenues net of interest expense | | $ | 65,949 | | $ | 60,515 | | $ | 52,862 | | $ | 5,434 | | | 9 | % | | $ | 7,653 | | | 14 | % |
Total revenues net of interest expense (FX-adjusted) (a) | | | | 60,179 | | 52,833 | | 5,770 | | | 10 | | | 7,682 | | | 15 | |
| Provisions for credit losses | | 5,185 | | 4,923 | | 2,182 | | 262 | | | 5 | | | 2,741 | | | # |
| Total expenses | | 47,869 | | 45,079 | | 41,095 | | 2,790 | | | 6 | | | 3,984 | | | 10 | |
| Pretax income | | 12,895 | | 10,513 | | 9,585 | | 2,382 | | | 23 | | | 928 | | | 10 | |
| Income tax provision | | 2,766 | | 2,139 | | 2,071 | | 627 | | | 29 | | | 68 | | | 3 | |
| Net income | | 10,129 | | 8,374 | | 7,514 | | 1,755 | | | 21 | | | 860 | | | 11 | |
Earnings per common share — diluted (b) | | $ | 14.01 | | $ | 11.21 | | $ | 9.85 | | $ | 2.80 | | | 25 | % | | $ | 1.36 | | | 14 | % |
| | | | | | | | | | | | | | |
| Selected Balance Sheet Data | | | | | | | | | | | | | | |
| Cash and cash equivalents | | $ | 40,640 | | $ | 46,596 | | $ | 33,914 | | $ | (5,956) | | | (13) | % | | $ | 12,682 | | | 37 | % |
| Card Member receivables | | 59,411 | | 60,411 | | 57,613 | | (1,000) | | | (2) | | | 2,798 | | | 5 | |
| Card Member loans | | 139,674 | | 125,995 | | 107,964 | | 13,679 | | | 11 | | | 18,031 | | | 17 | |
| Customer deposits | | 139,413 | | 129,144 | | 110,239 | | 10,269 | | | 8 | | | 18,905 | | | 17 | |
| Long-term debt | | $ | 49,715 | | $ | 47,866 | | $ | 42,573 | | $ | 1,849 | | | 4 | % | | $ | 5,293 | | | 12 | % |
| | | | | | | | | | | | | | |
Common Share Statistics (c) | | | | | | | | | | | | | | |
| Cash dividends declared per common share | | $ | 2.80 | | $ | 2.40 | | $ | 2.08 | | $ | 0.40 | | | 17 | % | | $ | 0.32 | | | 15 | % |
| Average common shares outstanding: | | | | | | | | | | | | | | |
| Basic | | 712 | | 735 | | 751 | | (23) | | | (3) | | | (16) | | | (2) | |
| Diluted | | 713 | | 736 | | 752 | | (23) | | | (3) | % | | (16) | | | (2) | % |
| | | | | | | | | | | | | | |
| Selected Metrics and Ratios | | | | | | | | | | | | | | |
Network volumes (billions) | | $ | 1,764.8 | | $ | 1,680.1 | | $ | 1,552.8 | | $ | 85 | | | 5 | % | | $ | 127 | | | 8 | % |
Billed business (billions) | | 1,550.9 | | 1,459.6 | | 1,338.3 | | 91 | | | 6 | | | 121 | | | 9 | |
Total loans and Card Member receivables (d) | | 208,317 | | 193,492 | | 170,993 | | 14,825 | | | 8 | | | 22,499 | | | 13 | |
Total loans and Card Member receivables (FX-adjusted) (a)(d) | | | | $ | 190,826 | | $ | 171,594 | | $ | 17,491 | | | 9 | % | | $ | 21,898 | | | 13 | % |
| Card Member loans and receivables | | | | | | | | | | | | | | |
Net write-off rate — principal, interest and fees (e) | | 2.3 | % | | 2.0 | % | | 1.0 | % | | | | | | | | |
Net write-off rate — principal only — consumer and small business (e)(f) | | 2.0 | % | | 1.8 | % | | 0.9 | % | | | | | | | | |
30+ days past due as a % of total — consumer and small business (g) | | 1.3 | % | | 1.3 | % | | 1.1 | % | | | | | | | | |
| Effective tax rate | | 21.5 | % | | 20.3 | % | | 21.6 | % | | | | | | | | |
Return on average equity (h) | | 34.6 | % | | 31.5 | % | | 32.3 | % | | | | | | | | |
| Common Equity Tier 1 | | 10.5 | % | | 10.5 | % | | 10.3 | % | | | | | | | | |
| # Denotes a variance of 100 percent or more |
(a)The foreign currency adjusted information assumes a constant exchange rate between the periods being compared for purposes of currency conversion into U.S. dollars (i.e., assumes the foreign exchange rates used to determine results for the current period apply to the corresponding prior year period against which such results are being compared). FX-adjusted Total revenues net of interest expense and Total loans and Card Member receivables are non-GAAP measures. We believe the presentation of information on a foreign currency adjusted basis is helpful to investors by making it easier to compare our performance in one period to that of another period without the variability caused by fluctuations in currency exchange rates.
(b)Represents net income, less (i) earnings allocated to participating share awards of $76 million, $64 million and $57 million for the years ended December 31, 2024, 2023 and 2022, respectively, and (ii) dividends on preferred shares of $58 million, $58 million and $57 million for the years ended December 31, 2024, 2023 and 2022, respectively. Refer to Note 16 and Note 21 to the “Consolidated Financial Statements” for further details on preferred shares and earnings per common share (EPS), respectively.
(c)Our common stock trades principally on The New York Stock Exchange under the trading symbol AXP.
(d)Total loans reflects Card Member loans and Other loans.
(e)We present a net write-off rate based on principal losses only (i.e., excluding interest and/or fees) to be consistent with industry convention. In addition, as our practice is to include uncollectible interest and/or fees as part of our total provision for credit losses, a net write-off rate including principal, interest and/or fees is also presented.
(f)A net write-off rate based on principal losses only is not available for corporate receivables due to system constraints.
(g)For corporate receivables, delinquency data is tracked based on days past billing status rather than days past due. Refer to Table 12 for 90+ days past billing metrics for corporate receivables.
(h)Return on average equity (ROE) is calculated by dividing (i) net income for the period by (ii) average shareholders’ equity for the period.
BUSINESS PERFORMANCE
Our strong results for the year reflect the momentum and earnings power of our business model and our continued investments for growth. We saw record levels of annual Card Member spending, strong new card acquisitions, excellent credit performance and disciplined expense management. Net income for the year was $10.1 billion, or $14.01 per share, compared with net income of $8.4 billion, or $11.21 per share, a year ago. Our full year results reflect the sale of Accertify Inc. (Accertify), which resulted in a gain of $531 million ($479 million after tax or $0.66 per share).
Billed business grew by 6 percent, reflecting a stable spend environment for most of the year with an acceleration in the fourth quarter. This growth was broad-based across geographies and across both G&S and T&E categories. U.S. Consumer Services billed business grew by 7 percent year-over-year, with continued strength in spending by Millennial and Gen-Z Card Members as our products continue to resonate with these cohorts. Commercial Services billed business grew by 2 percent on a year-over-year basis, reflecting continued modest growth from U.S. small and mid-sized enterprise (SME) Card Members. Spending by existing U.S. SME Card Members declined slightly year-over-year, although we saw an improvement in small business sentiment in the fourth quarter and strong new card acquisitions for the year. International Card Services billed business grew by 11 percent year-over-year (14 percent on an FX-adjusted basis), driven by continued strong growth in spend across all regions and customer types outside the United States.1 The continued global expansion of our merchant network contributed to our growth, as we added millions of new merchant locations globally in 2024 and continued to increase coverage across our top international countries.
Total revenues net of interest expense increased 9 percent year-over-year (10 percent on an FX-adjusted basis).1 Growth in billed business drove a 5 percent increase in Discount revenue, our largest revenue line. Net card fees increased 16 percent year-over-year, reflecting high levels of new card acquisitions and Card Member retention, as well as the ongoing execution of our product refresh strategy. Net interest income increased 18 percent versus the prior year, outpacing growth in Total loans and Card Member receivables of 8 percent year-over-year, primarily due to higher growth in our revolving loan balances. The growth in Total loans and Card Member receivables and revolving loan balances both moderated over the course of the year. During the fourth quarter, we reclassified $758 million of Card Member loans related to the Lowe’s small business cobrand portfolio from held for investment to held for sale (HFS).
Provisions for credit losses increased, primarily driven by higher net write-offs, partially offset by a lower reserve build compared to last year. Net write-off and delinquency rates were relatively stable throughout the year and remain best-in-class supported by our premium global customer base, our strong focus on risk management and disciplined growth strategy.
Card Member rewards, Card Member services and Business development expenses, which are generally correlated to volumes or are variable based on usage, collectively grew slightly faster than revenues as we continue to enhance our value propositions, drive Card Member engagement and acquire more Card Members on premium products. Marketing expense increased 16 percent year-over-year, as we invested at an elevated level in growth initiatives, including acquiring high spending, high credit-quality customers. During the year we acquired a record 13 million proprietary new cards. Operating expenses decreased 2 percent, primarily reflecting the gain recognized on the sale of Accertify and our continued operating expense discipline. We remain focused on driving marketing and operating expense efficiencies over time.
During the year, we maintained our capital ratios within our current target range of 10 to 11 percent and returned $7.9 billion of capital to our shareholders in the form of share repurchases and common stock dividends. We plan to continue to return to shareholders the excess capital we generate while managing our CET1 capital ratio within our target range and supporting balance sheet growth. We also expect to increase the regular quarterly dividend on common shares outstanding by approximately 17 percent beginning with the first quarter 2025 dividend declaration. Our robust capital, funding and liquidity positions provide us with significant flexibility to maintain a strong balance sheet.
Our performance continues to give us confidence in our business model and while we recognize the uncertainty of the geopolitical and macroeconomic environment and the evolving regulatory and competitive landscape, we remain committed to executing on our strategy to deliver sustainable and profitable long-term growth.
See “Supervision and Regulation” under “Business” for information on legislative and regulatory changes that could have a material adverse effect on our results of operations and financial condition and “Risk Factors” and “Cautionary Note Regarding Forward-Looking Statements” for information on potential impacts of macroeconomic, geopolitical and competitive conditions and certain litigation and regulatory matters on our business.
1 The foreign currency adjusted information assumes a constant exchange rate between the periods being compared for purposes of currency conversion into U.S. dollars (i.e., assumes the foreign exchange rates used to determine results for the current period apply to the corresponding prior year period against which such results are being compared). FX-adjusted revenues is a non-GAAP measure. We believe the presentation of information on a foreign currency adjusted basis is helpful to investors by making it easier to compare our performance in one period to that of another period without the variability caused by fluctuations in currency exchange rates.
CONSOLIDATED RESULTS OF OPERATIONS
The discussions in both “Consolidated Results of Operations” and “Business Segment Results of Operations” provide commentary on the variances for the year ended December 31, 2024 compared to the year ended December 31, 2023, as presented in the accompanying tables. For a discussion of the financial condition and results of operations for 2023 compared to 2022, please refer to Part II, Item 7. “Management’s Discussion and Analysis of Financial Condition and Results of Operations” in our Annual Report on Form 10-K for the year ended December 31, 2023, filed with the SEC on February 9, 2024.
TABLE 2: TOTAL REVENUES NET OF INTEREST EXPENSE SUMMARY | | | | | | | | | | | | | | | | | | | | | | | | | | | | | | | | | | | | | | | | | | | | |
| Years Ended December 31, | | | | | | | | Change | | Change |
| (Millions, except percentages) | | 2024 | | 2023 | | 2022 | | 2024 vs. 2023 | | 2023 vs. 2022 |
| Discount revenue | | $ | 35,192 | | | $ | 33,416 | | | $ | 30,739 | | | $ | 1,776 | | | 5 | % | | $ | 2,677 | | | 9 | % |
| Net card fees | | 8,449 | | | 7,255 | | | 6,070 | | | 1,194 | | | 16 | | | 1,185 | | | 20 | |
| Service fees and other revenue | | 5,129 | | | 5,005 | | | 4,521 | | | 124 | | | 2 | | | 484 | | | 11 | |
| Processed revenue | | 1,636 | | | 1,705 | | | 1,637 | | | (69) | | | (4) | | | 68 | | | 4 | |
| Total non-interest revenues | | 50,406 | | | 47,381 | | | 42,967 | | | 3,025 | | | 6 | | | 4,414 | | | 10 | |
| Total interest income | | 23,795 | | | 19,983 | | | 12,658 | | | 3,812 | | | 19 | | | 7,325 | | | 58 | |
| Total interest expense | | 8,252 | | | 6,849 | | | 2,763 | | | 1,403 | | | 20 | | | 4,086 | | | # |
| Net interest income | | 15,543 | | | 13,134 | | | 9,895 | | | 2,409 | | | 18 | | | 3,239 | | | 33 | |
| Total revenues net of interest expense | | $ | 65,949 | | | $ | 60,515 | | | $ | 52,862 | | | $ | 5,434 | | | 9 | % | | $ | 7,653 | | | 14 | % |
| # Denotes a variance of 100 percent or more |
TOTAL REVENUES NET OF INTEREST EXPENSE
Discount revenue increased, primarily driven by an increase in billed business of 6 percent. See Tables 5 and 6 for more details on billed business performance.
Net card fees increased, primarily driven by growth in our premium card portfolios. See Table 5 for more details on proprietary new card acquisitions, proprietary cards-in-force and average fee per card.
Service fees and other revenue increased, primarily driven by increases in foreign exchange related revenues associated with Card Member cross-currency spending, loyalty coalition-related fees and merchant service fees, partially offset by Accertify revenues included in the prior year.
Processed revenue decreased, and was relatively flat on an FX-adjusted basis.2 See Tables 5 and 6 for more details on processed volume performance.
Interest income increased, primarily driven by growth in revolving loan balances and higher interest rates.
Interest expense increased, primarily driven by higher interest rates paid on, and growth in, customer deposits and long-term debt.
2 Refer to footnote 1 on page 45 for details regarding foreign currency adjusted information.
TABLE 3: PROVISIONS FOR CREDIT LOSSES SUMMARY | | | | | | | | | | | | | | | | | | | | | | | | | | | | | | | | | | | | | | | | | | | | |
| Years Ended December 31, | | | | | | | | Change | | Change |
| (Millions, except percentages) | | 2024 | | 2023 | | 2022 | | 2024 vs. 2023 | | 2023 vs. 2022 |
| Card Member loans | | | | | | | | | | | | | | |
| Net write-offs | | $ | 3,515 | | | $ | 2,486 | | | $ | 1,066 | | | $ | 1,029 | | | 41 | % | | $ | 1,420 | | | # % |
Reserve build (release) (a) | | 594 | | | 1,353 | | | 448 | | | (759) | | | (56) | | | 905 | | | # |
| Total | | 4,109 | | | 3,839 | | | 1,514 | | | 270 | | | 7 | | | 2,325 | | | # |
| Card Member receivables | | | | | | | | | | | | | | |
| Net write-offs | | 773 | | | 937 | | | 462 | | | (164) | | | (18) | | | 475 | | | # |
Reserve build (release) (a) | | 1 | | | (57) | | | 165 | | | 58 | | | # | | (222) | | | # |
| Total | | 774 | | | 880 | | | 627 | | | (106) | | | (12) | | | 253 | | | 40 |
| Other | | | | | | | | | | | | | | |
| Net write-offs — Other loans | | 187 | | | 107 | | | 22 | | | 80 | | | 75 | | | 85 | | | # |
| Net write-offs — Other receivables | | 44 | | | 25 | | | 15 | | | 19 | | | 76 | | | 10 | | | 67 |
Reserve build (release) — Other loans (a) | | 69 | | | 67 | | | 7 | | | 2 | | | 3 | | | 60 | | | # |
Reserve build (release) — Other receivables (a) | | 2 | | | 5 | | | (3) | | | (3) | | | (60) | | | 8 | | | # |
| Total | | 302 | | | 204 | | | 41 | | | 98 | | | 48 | | | 163 | | | # |
| Total provisions for credit losses | | $ | 5,185 | | | $ | 4,923 | | | $ | 2,182 | | | $ | 262 | | | 5 | % | | $ | 2,741 | | | # % |
| # Denotes a variance of 100 percent or more |
(a)Refer to the “Glossary of Selected Terminology” below for a definition of reserve build (release).
PROVISIONS FOR CREDIT LOSSES
Card Member loans provision for credit losses increased, primarily due to higher net write-offs driven by growth in loans outstanding, partially offset by a lower reserve build in the current year. The reserve build in the current year was primarily driven by an increase in loans outstanding. The reserve build in the prior year was primarily driven by an increase in loans outstanding and higher delinquencies.
Card Member receivables provision for credit losses decreased, primarily due to lower net write-offs, partially offset by a reserve release in the prior year. The reserve release in the prior year was primarily driven by lower delinquencies, partially offset by an increase in receivables outstanding.
Other provision for credit losses increased, primarily due to higher net write-offs.
TABLE 4: EXPENSES SUMMARY | | | | | | | | | | | | | | | | | | | | | | | | | | | | | | | | | | | | | | | | | | | | |
| Years Ended December 31, | | | | | | | | Change | | Change |
| (Millions, except percentages) | | 2024 | | 2023 | | 2022 | | 2024 vs. 2023 | | 2023 vs. 2022 |
| Card Member rewards | | $ | 16,599 | | | $ | 15,367 | | | $ | 14,002 | | | $ | 1,232 | | | 8 | % | | $ | 1,365 | | | 10 | % |
| Business development | | 5,886 | | | 5,657 | | | 4,943 | | | 229 | | | 4 | | | 714 | | | 14 | |
| Card Member services | | 4,782 | | | 3,968 | | | 2,959 | | | 814 | | | 21 | | | 1,009 | | | 34 | |
| Marketing | | 6,040 | | | 5,213 | | | 5,458 | | | 827 | | | 16 | | | (245) | | | (4) | |
| Salaries and employee benefits | | 8,198 | | | 8,067 | | | 7,252 | | | 131 | | | 2 | | | 815 | | | 11 | |
| Other, net | | 6,364 | | | 6,807 | | | 6,481 | | | (443) | | | (7) | | | 326 | | | 5 | |
| Total expenses | | $ | 47,869 | | | $ | 45,079 | | | $ | 41,095 | | | $ | 2,790 | | | 6 | % | | $ | 3,984 | | | 10 | % |
|
EXPENSES
Card Member rewards expense increased, driven by increases in Membership Rewards and cash back rewards expenses, collectively, of $705 million, and cobrand rewards expense of $527 million, all of which were primarily driven by higher billed business. In the second half of the year, the increase in Membership Rewards expense was also driven by an increase in the Ultimate Redemption Rate (URR) and slightly higher redemption costs reflecting a shift in the mix of Card Member redemptions.
The Membership Rewards URR for current program participants was 96 percent (rounded down) at both December 31, 2024 and 2023.
Business development expense increased, primarily due to increased partner payments driven by higher network volumes, partially offset by lower client incentives and a prior-year charge related to revenue allocated to a joint venture partner.
Card Member services expense increased, primarily due to growth in premium card accounts, contributing to a higher usage of travel-related benefits.
Marketing expense increased, reflecting higher levels of spending on customer acquisition and other growth initiatives.
Salaries and employee benefits expense increased, primarily driven by higher incentive and compensation costs, partially offset by lower restructuring costs.
Other expenses decreased, primarily driven by the gain recognized on the sale of Accertify, foreign exchange-related gains and net gains on Amex Ventures investments, partially offset by an increase in legal reserves, higher professional service costs and a charge associated with an increase in international non-income tax reserves.
INCOME TAXES
The effective tax rate was 21.5 percent and 20.3 percent for 2024 and 2023, respectively. The increase in the effective tax rate primarily reflected discrete tax benefits in the prior year.
TABLE 5: SELECTED CARD-RELATED STATISTICAL INFORMATION | | | | | | | | | | | | | | | | | | | | | | | | | | | | | | | | |
| | | | | | | | Change | | Change |
| Years Ended December 31, | | 2024 | | 2023 | | 2022 | | 2024 vs. 2023 | | 2023 vs. 2022 |
Network volumes (billions) | | $ | 1,764.8 | | $ | 1,680.1 | | $ | 1,552.8 | | 5 | % | | 8 | % |
| Billed business | | $ | 1,550.9 | | $ | 1,459.6 | | $ | 1,338.3 | | 6 | | | 9 | |
| Processed volumes | | $ | 213.9 | | $ | 220.5 | | $ | 214.5 | | (3) | | | 3 | |
Cards-in-force (millions) | | 146.5 | | 141.2 | | 133.3 | | 4 | | | 6 | |
| Proprietary cards-in-force | | 83.6 | | 80.2 | | 76.7 | | 4 | | | 5 | |
Basic cards-in-force (millions) | | 123.3 | | 118.7 | | 111.5 | | 4 | | | 6 | |
| Proprietary basic cards-in-force | | 64.3 | | 61.7 | | 59.1 | | 4 | | | 4 | |
Average proprietary basic Card Member spending (dollars) | | $ | 24,608 | | $ | 24,059 | | $ | 23,496 | | 2 | | | 2 | |
Average fee per card (dollars) (a) | | $ | 103 | | $ | 92 | | $ | 82 | | 12 | % | | 12 | % |
Proprietary new cards acquired (millions) | | 13.0 | | 12.2 | | 12.5 | | | | |
| Discount revenue as a % of Billed business | | 2.27% | | 2.29% | | 2.30% | | | | |
|
(a)Average fee per card is computed on an annualized basis based on proprietary Net card fees divided by average proprietary total cards-in-force.
TABLE 6: NETWORK VOLUMES-RELATED STATISTICAL INFORMATION | | | | | | | | | | | | | | | | | | | | | | | | | | |
| | 2024 | | 2023 |
| | Year over Year Percentage Increase
(Decrease) | | Percentage Increase (Decrease) Assuming No Changes in FX Rates(a) | | Year over Year Percentage Increase
(Decrease) | | Percentage Increase (Decrease) Assuming No Changes in FX Rates(a) |
| Network volumes | | 5 | % | | 6 | % | | 8 | % | | 9 | % |
| Total billed business | | 6 | | | 7 | | | 9 | | | 9 | |
| U.S. Consumer Services | | 7 | | | | | 10 | | | |
| Commercial Services | | 2 | | | 2 | | | 3 | | | 3 | |
| International Card Services | | 11 | | | 14 | | | 17 | | | 18 | |
| Processed volumes | | (3) | | | — | | | 3 | | | 6 | |
| | | | | | | | |
| Merchant industry billed business metrics | | | | | | | | |
| G&S spend (73% and 72% of billed business for 2024 and 2023, respectively) | | 7 | | | 6 | | | 6 | | | 6 | |
| T&E spend (27% and 28% of billed business for 2024 and 2023, respectively) | | 5 | % | | 8 | % | | 19 | % | | 19 | % |
| | | | | | | | |
| | | | | | | | |
| | | | | | | | |
(a)The foreign currency adjusted information assumes a constant exchange rate between the periods being compared for purposes of conversion into U.S. dollars (i.e., assumes the foreign exchange rates used to determine results for the current year apply to the corresponding prior-year period against which such results are being compared).
TABLE 7: SELECTED CREDIT-RELATED STATISTICAL INFORMATION | | | | | | | | | | | | | | | | | | | | | | | | | | | | | | | | |
| As of or for the Years Ended December 31, | | | | | | | | Change | | Change |
| (Millions, except percentages) | | 2024 | | 2023 | | 2022 | | 2024 vs. 2023 | | 2023 vs. 2022 |
| Card Member loans and receivables: | | | | | | | | | | |
Net write-off rate — principal, interest and fees (a) | | 2.3 | % | | 2.0 | % | | 1.0 | % | | | | |
Net write-off rate — principal only — consumer and small business (a)(b) | | 2.0 | % | | 1.8 | % | | 0.9 | % | | | | |
30+ days past due as a % of total — consumer and small business (c) | | 1.3 | % | | 1.3 | % | | 1.1 | % | | | | |
| | | | | | | | | | |
| Card Member loans: | | | | | | | | | | |
| Card Member loans | | $ | 139,674 | | | $ | 125,995 | | | $ | 107,964 | | | 11 | % | | 17 | % |
| Credit loss reserves: | | | | | | | | | | |
| Beginning balance | | $ | 5,118 | | | $ | 3,747 | | | $ | 3,305 | | | 37 | | | 13 | |
| Provisions — principal, interest and fees | | 4,109 | | | 3,839 | | | 1,514 | | | 7 | | | # |
| Net write-offs — principal less recoveries | | (2,894) | | | (2,043) | | | (837) | | | 42 | | | # |
| Net write-offs — interest and fees less recoveries | | (621) | | | (443) | | | (229) | | | 40 | | | 93 | |
Other (d) | | (33) | | | 18 | | | (6) | | | # | | # |
| Ending balance | | $ | 5,679 | | | $ | 5,118 | | | $ | 3,747 | | | 11 | | | 37 | |
| % of loans | | 4.1 | % | | 4.1 | % | | 3.5 | % | | | | |
| % of past due | | 288 | % | | 297 | % | | 348 | % | | | | |
| Average loans | | $ | 130,758 | | | $ | 114,816 | | | $ | 95,369 | | | 14 | | | 20 | |
Net write-off rate — principal, interest and fees (a) | | 2.7 | % | | 2.2 | % | | 1.1 | % | | | | |
Net write-off rate — principal only (a) | | 2.2 | % | | 1.8 | % | | 0.9 | % | | | | |
| 30+ days past due as a % of total | | 1.4 | % | | 1.4 | % | | 1.0 | % | | | | |
| | | | | | | | | | |
| Card Member receivables: | | | | | | | | | | |
| Card Member receivables | | $ | 59,411 | | | $ | 60,411 | | | $ | 57,613 | | | (2) | | | 5 | |
| Credit loss reserves: | | | | | | | | | | |
| Beginning balance | | $ | 174 | | | $ | 229 | | | $ | 64 | | | (24) | | | # |
| Provisions — principal and fees | | 774 | | | 880 | | | 627 | | | (12) | | | 40 | |
| Net write-offs — principal and fees less recoveries | | (773) | | | (937) | | | (462) | | | (18) | | | # |
Other (d) | | (4) | | | 2 | | | — | | | # | | — | |
| Ending balance | | $ | 171 | | | $ | 174 | | | $ | 229 | | | (2) | % | | (24) | % |
| % of receivables | | 0.3 | % | | 0.3 | % | | 0.4 | % | | | | |
Net write-off rate — principal and fees (a) | | 1.3 | % | | 1.6 | % | | 0.8 | % | | | | |
Net write-off rate — principal only — consumer and small business (a)(b) | | 1.5 | % | | 1.8 | % | | 0.9 | % | | | | |
30+ days past due as a % of total — consumer and small business (c) | | 0.9 | % | | 1.1 | % | | 1.3 | % | | | | |
| # Denotes a variance of 100 percent or more |
(a)We present a net write-off rate based on principal losses only (i.e., excluding interest and/or fees) to be consistent with industry convention. In addition, as our practice is to include uncollectible interest and/or fees as part of our total provision for credit losses, a net write-off rate including principal, interest and/or fees is also presented.
(b)A net write-off rate based on principal losses only is not available for corporate receivables due to system constraints.
(c)For corporate receivables, delinquency data is tracked based on days past billing status rather than days past due. Refer to Table 12 for 90+ days past billing metrics for corporate receivables.
(d)Other includes foreign currency translation adjustments.
TABLE 8: NET INTEREST YIELD ON AVERAGE CARD MEMBER LOANS | | | | | | | | | | | | | | | | | | | | |
| Years Ended December 31, | | | | | | |
| (Millions, except percentages) | | 2024 | | 2023 | | 2022 |
| Net interest income | | $ | 15,543 | | | $ | 13,134 | | | $ | 9,895 | |
| Exclude: | | | | | | |
Interest expense not attributable to our Card Member loan portfolio (a) | | 3,599 | | | 2,943 | | | 1,268 | |
Interest income not attributable to our Card Member loan portfolio (b) | | (3,599) | | | (2,896) | | | (1,023) | |
Adjusted net interest income (c) | | $ | 15,543 | | | $ | 13,181 | | | $ | 10,140 | |
Average Card Member loans including loans held for sale (d) | | $ | 130,817 | | | $ | 114,816 | | | $ | 95,369 | |
Net interest income divided by average Card Member loans (c) | | 11.9 | % | | 11.4 | % | | 10.4 | % |
Net interest yield on average Card Member loans (c) | | 11.9 | % | | 11.5 | % | | 10.6 | % |
(a)Primarily represents interest expense attributable to maintaining our corporate liquidity pool and funding Card Member receivables.
(b)Primarily represents interest income attributable to Other loans, interest-bearing deposits and the fixed income investment portfolios.
(c)Adjusted net interest income and net interest yield on average Card Member loans are non-GAAP measures. Refer to the “Glossary of Selected Terminology” below for the definitions of these terms. We believe adjusted net interest income is useful to investors because it represents the interest expense and interest income attributable to our Card Member loan portfolio and is a component of net interest yield on average Card Member loans, which provides a measure of profitability of our Card Member loan portfolio. Net interest yield on average Card Member loans reflects adjusted net interest income divided by average Card Member loans, computed on an annualized basis. Net interest income divided by average Card Member loans, computed on an annualized basis, a GAAP measure, includes elements of total interest income and total interest expense that are not attributable to the Card Member loan portfolio, and thus is not representative of net interest yield on average Card Member loans.
(d)For purposes of the calculation of net interest yield on Card Member loans, average loans includes loans held for sale (HFS) as we continue to recognize interest income on these loans until they are sold. Refer to Note 1 to the Consolidated Financial Statements for further information on loans HFS.
BUSINESS SEGMENT RESULTS OF OPERATIONS
We consider a combination of factors when evaluating the composition of our reportable operating segments, including the results reviewed by the chief operating decision maker, economic characteristics, products and services offered, classes of customers, product distribution channels, geographic considerations (primarily United States versus outside the United States) and regulatory considerations. Refer to Note 24 to the “Consolidated Financial Statements” and “Business” for additional discussion of products and services that comprise each segment.
Results of the reportable operating segments generally treat each segment as a stand-alone business. The management reporting process that derives these results allocates revenue and expense using various methodologies as described below.
TOTAL REVENUES NET OF INTEREST EXPENSE
We allocate discount revenue and certain other revenues among segments using a transfer pricing methodology. Within the USCS, CS and ICS segments, discount revenue generally reflects the issuer component of the overall discount revenue generated by each segment’s Card Members; within the GMNS segment, discount revenue generally reflects the network and acquirer component of the overall discount revenue being allocated.
Net card fees, processed revenue and certain other revenues are directly attributable to the segment in which they are reported.
Interest and fees on loans and certain investment income is directly attributable to the segment in which it is reported. Interest expense represents an allocated funding cost based on a combination of segment funding requirements and internal funding rates.
PROVISIONS FOR CREDIT LOSSES
The provisions for credit losses are directly attributable to the segment in which they are reported.
EXPENSES
Card Member rewards and Card Member services expenses are included in each segment based on the actual expenses incurred. Business development and Marketing expenses are included in each segment based on the actual expenses incurred. Global brand advertising is primarily allocated to the segments based on the relative levels of revenue.
Salaries and employee benefits and other expenses reflect both costs incurred directly within each segment, as well as allocated expenses. The allocated expenses include service costs, which primarily reflect salaries and benefits associated with our technology and customer servicing groups, and overhead expenses. Service costs are allocated based on activities directly attributable to the segment, and overhead expenses are allocated based on the relative levels of revenue and Card Member loans and receivables. As a proportion of Salaries and employee benefits and other expenses, allocated costs remain relatively consistent from period to period. Increases in expenses year-over-year driven by allocated costs primarily reflect the changes in salaries and employee benefit costs and other costs related to our technology or servicing organizations and the growth in business volume within our operating segments.
U.S. CONSUMER SERVICES
TABLE 9: USCS SELECTED INCOME STATEMENT DATA | | | | | | | | | | | | | | | | | | | | | | | | | | | | | | | | | | | | | | | | | | | | |
| Years Ended December 31, | | | | | | | | Change | | Change |
| (Millions, except percentages) | | 2024 | | 2023 | | 2022 | | 2024 vs. 2023 | | 2023 vs. 2022 |
| Revenues | | | | | | | | | | | | | | |
| Non-interest revenues | | $ | 20,137 | | | $ | 18,464 | | | $ | 16,440 | | | $ | 1,673 | | | 9 | % | | $ | 2,024 | | | 12 | % |
| Interest income | | 14,430 | | | 12,336 | | | 8,457 | | | 2,094 | | | 17 | | | 3,879 | | | 46 | |
| Interest expense | | 3,140 | | | 2,684 | | | 983 | | | 456 | | | 17 | | | 1,701 | | | # |
| Net interest income | | 11,290 | | | 9,652 | | | 7,474 | | | 1,638 | | | 17 | | | 2,178 | | | 29 | |
| Total revenues net of interest expense | | 31,427 | | | 28,116 | | | 23,914 | | | 3,311 | | | 12 | | | 4,202 | | | 18 | |
| Provisions for credit losses | | 3,029 | | | 2,855 | | | 1,021 | | | 174 | | | 6 | | 1,834 | | | # |
| Total revenues net of interest expense after provisions for credit losses | | 28,398 | | | 25,261 | | | 22,893 | | | 3,137 | | | 12 | | | 2,368 | | | 10 | |
| Expenses | | | | | | | | | | | | | | |
| Card Member rewards, business development and Card Member services | | 14,329 | | | 12,808 | | | 10,791 | | | 1,521 | | | 12 | | | 2,017 | | | 19 | |
| Marketing | | 3,051 | | | 2,585 | | | 2,744 | | | 466 | | | 18 | | | (159) | | | (6) | |
| Salaries and employee benefits and other operating expenses | | 4,641 | | | 4,435 | | | 3,958 | | | 206 | | | 5 | | | 477 | | | 12 | |
| Total expenses | | 22,021 | | | 19,828 | | | 17,493 | | | 2,193 | | | 11 | | | 2,335 | | | 13 | |
| Pretax segment income | | $ | 6,377 | | | $ | 5,433 | | | $ | 5,400 | | | $ | 944 | | | 17 | % | | $ | 33 | | | 1 | % |
| # Denotes a variance of 100 percent or more |
USCS issues a wide range of proprietary consumer cards and provides services to U.S. consumers, including travel and lifestyle services as well as banking and non-card financing products. USCS also manages our dining platform that provides digital tools for restaurants and reservation bookings for diners.
TOTAL REVENUES NET OF INTEREST EXPENSE
Non-interest revenues increased across all revenue categories, primarily driven by higher Discount revenue and Net card fees.
Discount revenue increased 7 percent, primarily driven by an increase in U.S. consumer billed business. See Tables 5, 6 and 10 for more details on billed business performance.
Net card fees increased 18 percent, primarily driven by growth in our premium card portfolios.
Service fees and other revenue increased 5 percent, primarily driven by revenue from the sale of reward points and higher delinquency fees, partially offset by lower travel commissions and fees from our Amex Travel business.
Interest income increased, primarily driven by growth in revolving loan balances and higher interest rates.
Interest expense increased, primarily driven by a higher cost of funds due to segment net asset growth and higher interest rates.
PROVISIONS FOR CREDIT LOSSES
Card Member loans provision for credit losses increased, primarily due to higher net write-offs, partially offset by a lower reserve build in the current year. The reserve build in the current year was primarily driven by an increase in loans outstanding. The reserve build in the prior year was primarily driven by an increase in loans outstanding and higher delinquencies.
Card Member receivables provision for credit losses decreased, primarily due to a higher reserve release and lower net write-offs in the current year. The reserve releases in both the current and prior years were primarily driven by lower delinquencies and a decrease in receivables outstanding.
Other provision for credit losses increased, primarily due to higher net write-offs and a higher reserve build in the current year. The reserve builds in both the current and prior years were primarily driven by increases in Other loans outstanding.
EXPENSES
Total expenses increased, primarily driven by higher Card Member rewards, Card Member services and Marketing expenses.
Card Member rewards expense increased, primarily driven by higher billed business. In the second half of the year, the increase in Membership Rewards expense was also driven by an increase in the URR and slightly higher redemption costs reflecting a shift in the mix of Card Member redemptions.
Business development expense increased, primarily due to increased partner payments driven by higher billed business.
Card Member services expense increased, primarily due to growth in premium card accounts, contributing to a higher usage of travel-related benefits.
Marketing expense increased, reflecting higher levels of spending on customer acquisition and other growth initiatives.
Salaries and employee benefits and other expenses increased, primarily due to an increase in allocated service costs.
TABLE 10: USCS SELECTED STATISTICAL INFORMATION | | | | | | | | | | | | | | | | | | | | | | | | | | | | | | | | |
| As of or for the Years Ended December 31, | | | | | | | | Change | | Change |
| (Millions, except percentages and where indicated) | | 2024 | | 2023 | | 2022 | | 2024 vs. 2023 | | 2023 vs. 2022 |
Billed business (billions) | | $ | 654.8 | | $ | 610.8 | | $ | 553.0 | | 7 | % | | 10 | % |
| Proprietary cards-in-force | | 46.3 | | 43.8 | | 41.7 | | 6 | | | 5 | |
| Proprietary basic cards-in-force | | 32.5 | | 30.7 | | 29.2 | | 6 | | | 5 | |
Average proprietary basic Card Member spending (dollars) | | $ | 20,707 | | $ | 20,303 | | $ | 19,514 | | 2 | | | 4 | |
| Total segment assets | | $ | 114,228 | | $ | 107,158 | | $ | 94,444 | | 7 | | | 13 | |
| Card Member loans: | | | | | | | | | | |
| Total loans | | $ | 92,632 | | $ | 83,207 | | $ | 72,660 | | 11 | | | 15 | |
| Average loans | | $ | 85,264 | | $ | 75,975 | | $ | 63,720 | | 12 | | | 19 | |
Net write-off rate — principal, interest and fees (a) | | 2.7 | % | | 2.2 | % | | 1.1 | % | | | | |
Net write-off rate — principal only (a) | | 2.2 | % | | 1.7 | % | | 0.9 | % | | | | |
| 30+ days past due as a % of total | | 1.4 | % | | 1.4 | % | | 1.0 | % | | | | |
| Calculation of Net Interest Yield on Average Card Member Loans: | | | | | | | | | | |
| Net interest income | | $ | 11,290 | | $ | 9,652 | | $ | 7,474 | | | | |
| Exclude: | | | | | | | | | | |
Interest expense not attributable to our Card Member loan portfolio (b) | | 198 | | 192 | | 139 | | | | |
Interest income not attributable to our Card Member loan portfolio (c) | | (557) | | (386) | | (228) | | | | |
Adjusted net interest income (d) | | $ | 10,931 | | $ | 9,458 | | $ | 7,385 | | | | |
Average Card Member loans | | $ | 85,264 | | $ | 75,975 | | $ | 63,720 | | | | |
Net interest income divided by average Card Member loans (d) | | 13.2 | % | | 12.7 | % | | 11.7 | % | | | | |
Net interest yield on average Card Member loans (d) | | 12.8 | % | | 12.4 | % | | 11.6 | % | | | | |
| Card Member receivables: | | | | | | | | | | |
Total receivables | | $ | 14,419 | | $ | 14,789 | | $ | 14,263 | | (3) | % | | 4 | % |
Net write-off rate — principal and fees (a) | | 1.2 | % | | 1.3 | % | | 0.6 | % | | | | |
Net write-off rate — principal only (a) | | 1.1 | % | | 1.2 | % | | 0.6 | % | | | | |
| 30+ days past due as a % of total | | 0.6 | % | | 0.8 | % | | 0.9 | % | | | | |
|
(a)Refer to Table 7 footnote (a).
(b)Refer to Table 8 footnote (a).
(c)Refer to Table 8 footnote (b).
(d)Refer to Table 8 footnote (c).
COMMERCIAL SERVICES
TABLE 11: CS SELECTED INCOME STATEMENT DATA | | | | | | | | | | | | | | | | | | | | | | | | | | | | | | | | | | | | | | | | | | | | |
| Years Ended December 31, | | | | | | | | Change | | Change |
| (Millions, except percentages) | | 2024 | | 2023 | | 2022 | | 2024 vs. 2023 | | 2023 vs. 2022 |
| Revenues | | | | | | | | | | | | | | |
| Non-interest revenues | | $ | 13,219 | | | $ | 12,931 | | | $ | 12,196 | | | $ | 288 | | | 2 | % | | $ | 735 | | | 6 | % |
| Interest income | | 4,374 | | | 3,328 | | | 2,070 | | | 1,046 | | | 31 | | | 1,258 | | | 61 | |
| Interest expense | | 1,734 | | | 1,483 | | | 697 | | | 251 | | | 17 | | | 786 | | | # |
| Net interest income | | 2,640 | | | 1,845 | | | 1,373 | | | 795 | | | 43 | | | 472 | | | 34 | |
| Total revenues net of interest expense | | 15,859 | | | 14,776 | | | 13,569 | | | 1,083 | | | 7 | | | 1,207 | | | 9 | |
| Provisions for credit losses | | 1,389 | | | 1,313 | | | 565 | | | 76 | | | 6 | | | 748 | | | # |
| Total revenues net of interest expense after provisions for credit losses | | 14,470 | | | 13,463 | | | 13,004 | | | 1,007 | | | 7 | | | 459 | | | 4 | |
| Expenses | | | | | | | | | | | | | | |
| Card Member rewards, business development and Card Member services | | 6,504 | | | 6,332 | | | 6,116 | | | 172 | | | 3 | | | 216 | | | 4 | |
| Marketing | | 1,319 | | | 1,090 | | | 1,122 | | | 229 | | | 21 | | | (32) | | | (3) | |
| Salaries and employee benefits and other operating expenses | | 3,142 | | | 3,180 | | | 2,886 | | | (38) | | | (1) | | | 294 | | | 10 | |
| Total expenses | | 10,965 | | | 10,602 | | | 10,124 | | | 363 | | | 3 | | | 478 | | | 5 | |
| Pretax segment income | | $ | 3,505 | | | $ | 2,861 | | | $ | 2,880 | | | $ | 644 | | | 23 | % | | $ | (19) | | | (1) | % |
| # Denotes a variance of 100 percent or more |
CS issues a wide range of proprietary corporate and small business cards and provides services to U.S. businesses, including payment and expense management, banking and non-card financing products. CS also issues proprietary corporate cards and provides services to select global corporate clients.
TOTAL REVENUES NET OF INTEREST EXPENSE
Non-interest revenues increased, primarily driven by higher Discount revenue and Net card fees.
Discount revenue increased 2 percent, primarily driven by an increase in commercial billed business. See Tables 5, 6 and 12 for more details on billed business performance.
Net card fees increased 12 percent, primarily driven by growth in our premium card portfolios.
Service fees and other revenue decreased 7 percent, primarily driven by lower travel commissions and fees from our Amex Travel business.
Interest income increased, primarily driven by growth in revolving loan balances and higher interest rates.
Interest expense increased, primarily driven by a higher cost of funds due to segment net asset growth and higher interest rates.
PROVISIONS FOR CREDIT LOSSES
Card Member loans provision for credit losses increased, primarily due to higher net write-offs, partially offset by a lower reserve build in the current year. The reserve build in the current year was primarily driven by an increase in loans outstanding. The reserve build in the prior year was primarily driven by an increase in loans outstanding and higher delinquencies.
Card Member receivables provision for credit losses decreased, primarily due to lower net write-offs, partially offset by a reserve release in the prior year. The reserve release in the prior year was primarily driven by lower delinquencies and a decrease in receivables outstanding.
EXPENSES
Total expenses increased, primarily driven by higher Marketing and Card Member rewards expenses, partially offset by a decrease in Operating expenses and Business development expense.
Card Member rewards expense increased, primarily driven by higher billed business and slightly higher redemption costs in the second half of the year, partially offset by a decrease in the Membership Rewards URR.
Business development expense decreased, primarily due to lower client incentives, partially offset by increased partner payments due to higher billed business.
Card Member services expense increased, primarily due to growth in premium card accounts, contributing to a higher usage of travel-related benefits.
Marketing expense increased, reflecting higher levels of spending on customer acquisition and other growth initiatives.
Salaries and employee benefits and other expenses decreased, primarily driven by a decrease in allocated service costs and lower restructuring costs, partially offset by higher compensation.
TABLE 12: CS SELECTED STATISTICAL INFORMATION | | | | | | | | | | | | | | | | | | | | | | | | | | | | | | | | |
| As of or for the Years Ended December 31, | | | | | | | | Change | | Change |
| (Millions, except percentages and where indicated) | | 2024 | | 2023 | | 2022 | | 2024 vs. 2023 | | 2023 vs. 2022 |
Billed business (billions) | | $ | 526.5 | | $ | 516.0 | | $ | 499.5 | | 2 | % | | 3 | % |
| Proprietary cards-in-force | | 15.4 | | 15.4 | | 14.9 | | — | | | 3 | |
Average Card Member spending (dollars) | | $ | 34,130 | | $ | 33,745 | | $ | 35,202 | | 1 | | | (4) | |
| Total segment assets | | $ | 58,969 | | $ | 55,361 | | $ | 51,411 | | 7 | | | 8 | |
| Card Member loans: | | | | | | | | | | |
| Total loans | | $ | 29,647 | | $ | 25,838 | | $ | 21,406 | | 15 | | | 21 | |
| Average loans | | $ | 28,518 | | $ | 23,877 | | $ | 19,271 | | 19 | | | 24 | |
Net write-off rate — principal, interest and fees (a) | | 2.7 | % | | 2.0 | % | | 0.8 | % | | | | |
Net write-off rate — principal only (a) | | 2.3 | % | | 1.7 | % | | 0.7 | % | | | | |
| 30+ days past due as a % of total | | 1.5 | % | | 1.4 | % | | 0.9 | % | | | | |
| Calculation of Net Interest Yield on Average Card Member Loans: | | | | | | | | | | |
| Net interest income | | $ | 2,640 | | $ | 1,845 | | $ | 1,373 | | | | |
| Exclude: | | | | | | | | | | |
Interest expense not attributable to our Card Member loan portfolio (b) | | 765 | | 711 | | 430 | | | | |
Interest income not attributable to our Card Member loan portfolio (c) | | (325) | | (204) | | (89) | | | | |
Adjusted net interest income (d) | | $ | 3,080 | | $ | 2,352 | | $ | 1,714 | | | | |
Average Card Member loans including loans held for sale (e) | | $ | 28,576 | | $ | 23,877 | | $ | 19,271 | | | | |
Net interest income divided by average Card Member loans(d) | | 9.2 | % | | 7.7 | % | | 7.1 | % | | | | |
Net interest yield on average Card Member loans(d) | | 10.8 | % | | 9.9 | % | | 8.9 | % | | | | |
| Card Member receivables: | | | | | | | | | | |
| Total receivables | | $ | 24,945 | | $ | 26,222 | | $ | 26,876 | | (5) | % | | (2) | % |
Net write-off rate — principal and fees (f) | | 1.3 | % | | 1.5 | % | | 0.7 | % | | | | |
Net write-off rate — principal only (a) — small business | | 1.9 | % | | 2.1 | % | | 0.9 | % | | | | |
| 30+ days past due as a % of total — small business | | 1.3 | % | | 1.5 | % | | 1.6 | % | | | | |
90+ days past billing as a % of total (f) — corporate | | 0.4 | % | | 0.4 | % | | 0.6 | % | | | | |
|
(a)Refer to Table 7 footnote (a).
(b)Refer to Table 8 footnote (a).
(c)Refer to Table 8 footnote (b).
(d)Refer to Table 8 footnote (c).
(e)Refer to Table 8 footnote (d).
(f)For corporate receivables, delinquency data is tracked based on days past billing status rather than days past due. A Card Member account is considered 90 days past billing if payment has not been received within 90 days of the Card Member’s billing statement date. In addition, if we initiate collection procedures on an account prior to the account becoming 90 days past billing, the associated Card Member receivable balance is classified as 90 days past billing. Corporate receivables delinquency data for periods other than 90+ days past billing and the net write-off rate based on principal losses only are not available due to system constraints.
INTERNATIONAL CARD SERVICES
TABLE 13: ICS SELECTED INCOME STATEMENT DATA | | | | | | | | | | | | | | | | | | | | | | | | | | | | | | | | | | | | | | | | | | | | |
| Years Ended December 31, | | | | | | | | Change | | Change |
| (Millions, except percentages) | | 2024 | | 2023 | | 2022 | | 2024 vs. 2023 | | 2023 vs. 2022 |
| Revenues | | | | | | | | | | | | | | |
| Non-interest revenues | | $ | 10,369 | | | $ | 9,472 | | | $ | 8,262 | | | $ | 897 | | | 9 | % | | $ | 1,210 | | | 15 | % |
| Interest income | | 2,331 | | | 2,076 | | | 1,453 | | | 255 | | | 12 | | | 623 | | | 43 | |
| Interest expense | | 1,239 | | | 1,118 | | | 654 | | | 121 | | | 11 | | | 464 | | | 71 | |
| Net interest income | | 1,092 | | | 958 | | | 799 | | | 134 | | | 14 | | | 159 | | | 20 | |
| Total revenues net of interest expense | | 11,461 | | | 10,430 | | | 9,061 | | | 1,031 | | | 10 | | | 1,369 | | | 15 | |
| Provisions for credit losses | | 726 | | | 727 | | | 584 | | | (1) | | | — | | | 143 | | | 24 | |
| Total revenues net of interest expense after provisions for credit losses | | 10,735 | | | 9,703 | | | 8,477 | | | 1,032 | | | 11 | | | 1,226 | | | 14 | |
| Expenses | | | | | | | | | | | | | | |
| Card Member rewards, business development and Card Member services | | 5,243 | | | 4,588 | | | 3,816 | | | 655 | | | 14 | | | 772 | | | 20 | |
| Marketing | | 1,235 | | | 1,081 | | | 1,146 | | | 154 | | | 14 | | | (65) | | | (6) | |
| Salaries and employee benefits and other operating expenses | | 3,226 | | | 3,061 | | | 2,937 | | | 165 | | | 5 | | | 124 | | | 4 | |
| Total expenses | | 9,704 | | | 8,730 | | | 7,899 | | | 974 | | | 11 | | | 831 | | | 11 | |
| Pretax segment income | | $ | 1,031 | | | $ | 973 | | | $ | 578 | | | $ | 58 | | | 6 | % | | $ | 395 | | | 68 | % |
|
ICS issues a wide range of proprietary consumer, small business and corporate cards outside the United States. ICS also provides services to our international customers, including travel and lifestyle services, and manages certain international joint ventures and our loyalty coalition business.
TOTAL REVENUES NET OF INTEREST EXPENSE
Non-interest revenues increased, primarily driven by higher Discount revenue and Net card fees.
Discount revenue increased 10 percent (13 percent on an FX-adjusted basis), primarily reflecting an increase in billed business.3 See Tables 5, 6 and 14 for more details on billed business performance.
Net card fees increased 16 percent (20 percent on an FX-adjusted basis), primarily driven by growth in our premium card portfolios.3
Service fees and other revenue increased 2 percent, primarily driven by higher foreign exchange related revenues associated with Card Member cross-currency spending and loyalty coalition-related fees, partially offset by a benefit in the prior year related to a portion of the revenue allocated to a joint venture partner as described in Business development expense below, as well as lower delinquency fees.
Interest income increased, primarily driven by growth in revolving loan balances, partially offset by lower interest rates.
Interest expense increased, primarily driven by a higher cost of funds due to segment net asset growth.
PROVISIONS FOR CREDIT LOSSES
Card Member loans provision for credit losses increased, primarily due to higher net write-offs, partially offset by a lower reserve build in the current year. The reserve build in the current year was primarily driven by an increase in loans outstanding, partially offset by lower delinquencies. The reserve build in the prior year was primarily driven by an increase in loans outstanding, partially offset by the performance of portfolios in certain international markets.
Card Member receivables provision for credit losses decreased, primarily due to lower net write-offs, partially offset by a reserve build in the current year versus a reserve release in the prior year. The reserve build in the current year was primarily driven by an increase in receivables outstanding. The reserve release in the prior year was primarily driven by lower delinquencies, partially offset by an increase in receivables outstanding.
3 Refer to footnote 1 on page 45 for details regarding foreign currency adjusted information.
EXPENSES
Total expenses increased, primarily driven by higher Card Member rewards, Card Member services and Operating expenses.
Card Member rewards expense increased, primarily driven by higher billed business and an increase in the Membership Rewards URR, partially offset by lower redemption costs.
Business development expense increased, primarily due to increased partner payments driven by higher billed business, partially offset by a prior-year charge related to revenue allocated to a joint venture partner.
Card Member services expense increased, primarily due to growth in premium card accounts, contributing to a higher usage of travel-related benefits.
Marketing expense increased, reflecting higher levels of spending on customer acquisition and other growth initiatives.
Salaries and employee benefits and other expenses increased, primarily due to a charge associated with an increase in international non-income tax reserves and higher allocated service costs, partially offset by a one-time fee from a partner.
TABLE 14: ICS SELECTED STATISTICAL INFORMATION | | | | | | | | | | | | | | | | | | | | | | | | | | | | | | | | |
| As of or for the Years Ended December 31, | | | | | | | | Change | | Change |
| (Millions, except percentages and where indicated) | | 2024 | | 2023 | | 2022 | | 2024 vs. 2023 | | 2023 vs. 2022 |
Billed business (billions) | | $ | 366.9 | | $ | 329.5 | | $ | 281.6 | | 11 | % | | 17 | % |
| Proprietary cards-in-force | | 21.9 | | 21.0 | | 20.1 | | 4 | | | 4 | |
| Proprietary basic cards-in-force | | 16.4 | | 15.6 | | 14.9 | | 5 | | | 5 | |
Average proprietary basic Card Member spending (dollars) | | $ | 22,965 | | $ | 21,550 | | $ | 19,519 | | 7 | | | 10 | |
| Total segment assets | | $ | 42,879 | | $ | 42,234 | | $ | 36,891 | | 2 | | | 14 | |
| Card Member loans - consumer and small business: | | | | | | | | | | |
| Total loans | | $ | 17,395 | | $ | 16,950 | | $ | 13,844 | | 3 | | | 22 | |
| Average loans | | $ | 16,976 | | $ | 14,964 | | $ | 12,314 | | 13 | | | 22 | |
Net write-off rate — principal, interest and fees(a) | | 2.5 | % | | 2.5 | % | | 1.4 | % | | | | |
Net write-off rate — principal only(a) | | 2.1 | % | | 2.1 | % | | 1.2 | % | | | | |
| 30+ days past due as a % of total | | 1.2 | % | | 1.3 | % | | 1.2 | % | | | | |
| Calculation of Net Interest Yield on Average Card Member Loans: | | | | | | | | | | |
| Net interest income | | $ | 1,092 | | $ | 958 | | $ | 799 | | | | |
| Exclude: | | | | | | | | | | |
Interest expense not attributable to our Card Member loan portfolio(b) | | 496 | | 475 | | 270 | | | | |
Interest income not attributable to our Card Member loan portfolio(c) | | (56) | | (62) | | (28) | | | | |
Adjusted net interest income(d) | | $ | 1,532 | | $ | 1,371 | | $ | 1,041 | | | | |
| Average Card Member loans | | $ | 16,976 | | $ | 14,964 | | $ | 12,378 | | | | |
Net interest income divided by average Card Member loans(d) | | 6.4 | % | | 6.4 | % | | 6.5 | % | | | | |
Net interest yield on average Card Member loans(d) | | 9.0 | % | | 9.2 | % | | 8.4 | % | | | | |
| Card Member receivables: | | | | | | | | | | |
| Total receivables | | $ | 20,047 | | $ | 19,400 | | $ | 16,474 | | 3 | % | | 18 | % |
Net write-off rate — principal and fees(e) | | 1.4 | % | | 2.1 | % | | 1.3 | % | | | | |
Net write-off rate — principal only(a) — consumer and small business | | 1.5 | % | | 2.2 | % | | 1.4 | % | | | | |
| 30+ days past due as a % of total — consumer and small business | | 0.8 | % | | 1.0 | % | | 1.3 | % | | | | |
90+ days past billing as a % of total(e) — corporate | | 0.4 | % | | 0.5 | % | | 0.5 | % | | | | |
|
(a)Refer to Table 7 footnote (a).
(b)Refer to Table 8 footnote (a).
(c)Refer to Table 8 footnote (b).
(d)Refer to Table 8 footnote (c).
(e)For corporate receivables, delinquency data is tracked based on days past billing status rather than days past due. A Card Member account is considered 90 days past billing if payment has not been received within 90 days of the Card Member’s billing statement date. In addition, if we initiate collection procedures on an account prior to the account becoming 90 days past billing, the associated Card Member receivable balance is classified as 90 days past billing. Corporate receivables delinquency data for periods other than 90+ days past billing and the net write-off rate based on principal losses only are not available due to system constraints.
GLOBAL MERCHANT AND NETWORK SERVICES
TABLE 15: GMNS SELECTED INCOME STATEMENT AND OTHER DATA | | | | | | | | | | | | | | | | | | | | | | | | | | | | | | | | | | | | | | | | | | | | |
| Years Ended December 31, | | | | | | | | Change | | Change |
| (Millions, except percentages and where indicated) | | 2024 | | 2023 | | 2022 | | 2024 vs. 2023 | | 2023 vs. 2022 |
| Revenues | | | | | | | | | | | | | | |
| Non-interest revenues | | $ | 6,729 | | | $ | 6,620 | | | $ | 6,123 | | | $ | 109 | | | 2 | % | | $ | 497 | | | 8 | % |
| Interest income | | 52 | | | 57 | | | 23 | | | (5) | | | (9) | | | 34 | | | # |
| Interest expense | | (703) | | | (719) | | | (329) | | | 16 | | | 2 | | | (390) | | | # |
| Net interest income | | 755 | | | 776 | | | 352 | | | (21) | | | (3) | | | 424 | | | # |
| Total revenues net of interest expense | | 7,484 | | | 7,396 | | | 6,475 | | | 88 | | | 1 | | | 921 | | | 14 | |
| Provisions for credit losses | | 42 | | | 27 | | | 7 | | | 15 | | | 56 | | | 20 | | | # |
| Total revenues net of interest expense after provisions for credit losses | | 7,442 | | | 7,369 | | | 6,468 | | | 73 | | | 1 | | | 901 | | | 14 | |
| Expenses | | | | | | | | | | | | | | |
| Business development and Card Member services | | 1,148 | | | 1,218 | | | 1,192 | | | (70) | | | (6) | | | 26 | | | 2 | |
| Marketing | | 411 | | | 437 | | | 419 | | | (26) | | | (6) | | | 18 | | | 4 | |
| Salaries and employee benefits and other operating expenses | | 1,485 | | | 2,058 | | | 1,903 | | | (573) | | | (28) | | | 155 | | | 8 | |
| Total expenses | | 3,044 | | | 3,713 | | | 3,514 | | | (669) | | | (18) | | | 199 | | | 6 | |
| Pretax segment income | | 4,398 | | | 3,656 | | | 2,954 | | | 742 | | | 20 | | | 702 | | | 24 | |
Network volumes (billions) | | 1,764.8 | | | 1,680.1 | | | 1,552.8 | | | $ | 85 | | | 5 | | | $ | 127 | | | 8 | |
| Total segment assets | | $ | 17,712 | | | $ | 23,714 | | | $ | 20,005 | | | | | (25) | % | | | | 19 | % |
| # Denotes a variance of 100 percent or more |
GMNS operates a global payments network that processes and settles card transactions, acquires merchants and provides multi-channel marketing programs and capabilities, services and data analytics, leveraging our global integrated network. GMNS manages our partnership relationships with third-party card issuers, merchant acquirers and a prepaid reloadable and gift card program manager, licensing the American Express brand and extending the reach of the global network.
TOTAL REVENUES NET OF INTEREST EXPENSE
Non-interest revenues increased, primarily driven by higher Discount revenue, partially offset by lower Processed revenue.
Discount revenue increased 3 percent, primarily driven by an increase in billed business, partially offset by lower average merchant discount rates. See Tables 5 and 6 for more details on billed business performance.
Service fees and other revenue increased 1 percent, primarily driven by higher merchant service fees and foreign exchange-related revenues associated with Card Member cross-currency spending, largely offset by Accertify revenues included in the prior year.
Processed revenue decreased 2 percent and increased 4 percent on an FX-adjusted basis.4
GMNS receives an interest expense credit relating to internal transfer pricing due to its merchant payables. Net interest income decreased, primarily due to a lower interest expense credit, largely driven by a decrease in interest rates in international markets, partially offset by higher average merchant payables.
4 Refer to footnote 1 on page 45 for details regarding foreign currency adjusted information.
EXPENSES
Total expenses decreased, primarily driven by lower Operating expenses.
Business development expense decreased, primarily due to decreased partner payments driven by lower volumes from certain network issuing partners.
Marketing expense decreased, reflecting lower levels of spending on merchant engagement and other growth initiatives.
Salaries and employee benefits and other expenses decreased, primarily driven by the gain recognized on the sale of Accertify included in the Other, net component of operating expenses, partially offset by an increase in allocated service costs.
CORPORATE & OTHER
Corporate functions and certain other businesses are included in Corporate & Other.
Corporate & Other pretax loss was $2.4 billion in both 2024 and 2023. Increases in foreign exchange gains and net gains on Amex Ventures investments year-over-year were offset largely by an increase in legal reserves.
CONSOLIDATED CAPITAL RESOURCES AND LIQUIDITY
Our balance sheet management objectives are to maintain:
•A solid and flexible equity capital profile;
•A broad, deep and diverse set of funding sources to finance our assets and meet operating requirements; and
•Liquidity programs that enable us to continuously meet expected future financing obligations and business requirements for at least a twelve-month period under a variety of adverse circumstances.
We continue to see volatility in the capital markets due to a variety of factors and manage our balance sheet to reflect evolving circumstances.
CAPITAL STRATEGY
We believe capital allocated to growing businesses with a return on risk-adjusted equity in excess of our costs will generate shareholder value. Our objective is to retain sufficient levels of capital generated through net income and other sources, such as the issuance of subordinated debt and preferred shares, as well as the exercise of stock options by colleagues, to maintain a strong balance sheet, provide flexibility to support future business growth and distribute excess capital to shareholders through dividends and share repurchases. See “Dividends and Share Repurchases” below.
The level and composition of our consolidated capital position are determined through our Internal Capital Adequacy Assessment Process, which takes into account our business activities, as well as marketplace conditions and requirements or expectations of credit rating agencies, regulators and shareholders, among others. As a bank holding company, we are subject to regulatory requirements administered by the U.S. federal bank regulatory agencies. The Federal Reserve has established specific capital adequacy guidelines that involve quantitative measures of assets, liabilities and certain off-balance sheet items. Failure to maintain minimum regulatory capital levels at American Express or our U.S. bank subsidiary, American Express National Bank (AENB), could affect our status as a financial holding company and cause the banking regulators with oversight of American Express or AENB to take actions that could limit our business operations.
We seek to maintain capital levels and ratios in excess of our minimum regulatory requirements, specifically within a 10 to 11 percent target range for American Express Company’s Common Equity Tier 1 (CET1) risk-based capital ratio.
We maintain certain flexibility to shift capital across our businesses as appropriate. For example, we may infuse additional capital into subsidiaries to maintain capital at targeted levels in consideration of debt ratings and regulatory requirements. These infused amounts can affect the capital and liquidity positions at American Express Company or at our subsidiaries.
We report our capital ratios using the Basel III capital definitions and the Basel III standardized approach for calculating risk-weighted assets.
As discussed above, we became a Category III firm in the third quarter of 2024 and thus are subject to a CET1 countercyclical capital buffer requirement (if enacted by the Federal Reserve) and a minimum supplementary leverage ratio. See “Supervision and Regulation — Capital and Liquidity Regulation” under “Business” for more information.
The following table presents our regulatory risk-based capital and leverage ratios and those of AENB, as of December 31, 2024:
TABLE 16: REGULATORY RISK-BASED CAPITAL AND LEVERAGE RATIOS | | | | | | | | | | | | | | |
| | Effective Minimum (a) | | Ratios as of December 31, 2024 |
| Risk-Based Capital | | | | |
| Common Equity Tier 1 | | 7.0 | % | | |
| American Express Company | | | | 10.5 | % |
| American Express National Bank | | | | 11.6 |
| Tier 1 | | 8.5 | | |
| American Express Company | | | | 11.2 |
| American Express National Bank | | | | 11.6 |
| Total | | 10.5 | | |
| American Express Company | | | | 13.2 |
| American Express National Bank | | | | 13.2 |
| Tier 1 Leverage | | 4.0 | | |
| American Express Company | | | | 9.8 |
| American Express National Bank | | | | 9.6 |
| Supplementary Leverage Ratio | | 3.0 | % | | |
| American Express Company | | | | 8.3 |
| American Express National Bank | | | | 8.0 | % |
(a)Represents Basel III minimum requirements and applicable regulatory buffers as defined by the federal banking regulators, which includes the stress capital buffer (SCB) for American Express Company and the capital conservation buffer for AENB. Refer to “Supervision and Regulation — Capital and Liquidity Regulation” under “Business” and Note 22 to the “Consolidated Financial Statements” for additional information.
The following table presents American Express Company’s regulatory risk-based capital and risk-weighted assets as of December 31, 2024:
TABLE 17: REGULATORY RISK-BASED CAPITAL COMPONENTS AND RISK-WEIGHTED ASSETS | | | | | | | | |
American Express Company ($ in Billions) | | December 31, 2024 |
| Risk-Based Capital | | |
| Common Equity Tier 1 | | $ | 24.9 | |
| Tier 1 Capital | | 26.4 | |
| Tier 2 Capital | | 4.7 | |
| Total Capital | | 31.1 | |
| | |
| Risk-Weighted Assets | | 235.8 | |
| Average Total Assets to calculate the Tier 1 Leverage Ratio | | 268.8 | |
| Total Leverage Exposure to calculate the Supplementary Leverage Ratio | | $ | 317.0 | |
The following are definitions for our regulatory risk-based capital and leverage ratios, which are calculated as per standard regulatory guidance:
Risk-Weighted Assets — Assets are weighted for risk according to a formula used by the Federal Reserve to conform to capital adequacy guidelines. On- and off-balance sheet items are risk weighted, with off-balance sheet items converted to balance sheet equivalents, using risk conversion factors, before being assigned a risk weight. Off-balance sheet exposures comprise a minimal part of the total risk-weighted assets.
Common Equity Tier 1 Risk-Based Capital Ratio — Calculated as CET1 capital, divided by risk-weighted assets. CET1 capital is common shareholders’ equity, adjusted for ineligible goodwill and intangible assets and certain deferred tax assets. CET1 capital is also adjusted for the CECL final rules, as described below.
Tier 1 Risk-Based Capital Ratio — Calculated as Tier 1 capital divided by risk-weighted assets. Tier 1 capital is the sum of CET1 capital, preferred shares and third-party non-controlling interests in consolidated subsidiaries, adjusted for capital held by insurance subsidiaries. We have $1.6 billion of preferred shares outstanding to help address a portion of the Tier 1 capital requirements in excess of common equity requirements. See Note 16 to the “Consolidated Financial Statements” for additional information on our preferred shares.
Total Risk-Based Capital Ratio — Calculated as the sum of Tier 1 capital and Tier 2 capital divided by risk-weighted assets. Tier 2 capital is the sum of the allowable allowance for credit losses adjusted for the CECL final rules, and $1,750 million of eligible subordinated notes, adjusted for capital held by insurance subsidiaries. The $1,750 million of eligible subordinated notes includes the $500 million subordinated debt issued in April 2024, the $500 million subordinated debt issued in July 2023 and the $750 million subordinated debt issued in May 2022.
Tier 1 Leverage Ratio — Calculated as Tier 1 capital divided by average total consolidated assets for the most recent quarter.
Supplementary Leverage Ratio — Calculated as Tier 1 capital divided by total leverage exposure. Total leverage exposure includes total average on-balance sheet assets and certain off-balance sheet exposures, less amounts permitted to be deducted from Tier 1 capital.
We elected to delay the recognition of $0.7 billion of reduction in regulatory capital from the adoption of the CECL methodology for two years, followed by a three-year phase-in period at 25 percent once per year beginning January 1, 2022, pursuant to rules issued by federal banking regulators (the CECL final rules). As of January 1, 2025, we have phased in 100 percent of such amount.
We continue to include accumulated other comprehensive income (loss) in regulatory capital.
We participated in the Federal Reserve’s supervisory stress tests in 2024. We submitted our annual capital plan to the Federal Reserve in April 2024. On August 28, 2024, the Federal Reserve confirmed our SCB of 2.5 percent, which resulted in a minimum CET1 ratio of 7 percent, effective October 1, 2024 to September 30, 2025.
DIVIDENDS AND SHARE REPURCHASES
We return capital to common shareholders through dividends and share repurchases. The share repurchases reduce common shares outstanding and generally more than offset the issuance of new shares as part of employee compensation plans.
During the year ended December 31, 2024, we returned $7.9 billion to our shareholders in the form of share repurchases of $5.9 billion and common stock dividends of $2.0 billion. We repurchased 23.9 million common shares at an average price of $242.65 in 2024. These dividend and share repurchase amounts collectively represent approximately 76 percent of total capital generated during the year.
We plan to increase the regular quarterly dividend on our common shares outstanding by 17 percent, from 70 cents to 82 cents per share, beginning with the first quarter 2025 dividend declaration.
In addition, during the year ended December 31, 2024, we paid $58 million in dividends on non-cumulative perpetual preferred shares outstanding. Refer to Note 16 to the “Consolidated Financial Statements” for additional information on our preferred shares.
Our decisions on capital distributions depend on various factors, including: our capital levels and regulatory capital requirements; regulatory guidance or restrictions; actual and forecasted business results; economic and market conditions; revisions to, or revocation of, the Federal Reserve’s authorization of our capital plan; and the supervisory stress test process. We may conduct share repurchases through a variety of methods, including open market purchases, plans intended to satisfy the affirmative defense conditions of Rule 10b5-1(c) under the Exchange Act, privately negotiated transactions or other purchases, including block trades, accelerated share repurchase programs or any combination of such methods as market conditions warrant and at prices we deem appropriate.
FUNDING STRATEGY
Our principal funding objective is to maintain broad and well-diversified funding sources to allow us to finance our global businesses and to maintain a strong liquidity profile. Our funding strategy and activities are integrated into our asset-liability management activities. We have in place a funding policy covering American Express Company and all of our subsidiaries.
Our financing needs are in large part a consequence of our proprietary card-issuing businesses, where we generally pay merchants for card transactions prior to reimbursement by Card Members and therefore fund the merchant payments during the period Card Member loans and receivables are outstanding. In addition, we maintain a liquidity position to meet regulatory requirements and support our business activities.
We aim to satisfy these financing needs with a diverse set of funding sources. The diversity of funding sources by type of instrument, by tenor and by investor base, among other factors, mitigates the impact of disruptions in any one type of instrument, tenor or investor. We seek to achieve diversity and cost efficiency in our funding sources by maintaining scale and market relevance in deposits, unsecured debt and asset securitizations and access to secured borrowing facilities and a committed bank credit facility. In particular, we are focused on continuing to grow our direct deposit program as a funding source.
Our funding plan is primarily driven by the size and mix of business asset growth, our liquidity position and choice of funding sources, as well as cash requirements generated by withdrawals of deposits by our customers, the maturities of debt outstanding and related interest payments. In executing our funding plan, we aim to maintain a balanced debt maturity profile with an appropriate mix of short-term and long-term refinancing requirements.
FUNDING PROGRAMS AND ACTIVITIES
We had the following customer deposits and consolidated debt outstanding as of December 31:
TABLE 18: SUMMARY OF CUSTOMER DEPOSITS AND CONSOLIDATED DEBT | | | | | | | | | | | | | | |
| (Billions) | | 2024 | | 2023 |
| Customer deposits | | $ | 139.4 | | | $ | 129.1 | |
| Short-term borrowings | | 1.4 | | | 1.3 | |
| Long-term debt | | 49.7 | | | 47.9 | |
| Total customer deposits and debt | | $ | 190.5 | | | $ | 178.3 | |
We may redeem from time to time certain debt securities prior to the original contractual maturity dates in accordance with the optional redemption provisions of those debt securities.
Our funding plan for the full year 2025 includes, among other sources, approximately $9.0 billion to $13.0 billion of unsecured term debt issuance and approximately $6.0 billion to $10.0 billion of secured term debt issuance. Actual funding activities can vary from our plans due to various factors, such as future business growth, the impact of global economic, political and other events on market capacity and funding needs, demand for securities offered by us, regulatory changes, ability to securitize and sell loans and receivables, and the performance of loans and receivables previously sold in securitization transactions. Many of these factors are beyond our control.
Our equity capital and funding strategies are designed, among other things, to maintain appropriate and stable unsecured debt ratings from the major credit rating agencies: Moody’s Investor Services (Moody’s), Standard & Poor’s (S&P) and Fitch Ratings (Fitch). Such ratings help support our access to cost-effective unsecured funding as part of our overall funding strategy. Our asset securitization activities are rated separately.
TABLE 19: UNSECURED DEBT RATINGS | | | | | | | | | | | | | | |
| American Express Entity | | Moody’s | S&P | Fitch |
| American Express Company | Long Term | A2 | A- | A |
| Short Term | N/R | A-2 | F1 |
| Outlook | Stable | Stable | Stable |
| American Express Travel Related Services Company, Inc. | Long Term | A2 | A | A |
| Short Term | P-1 | A-1 | F1 |
| Outlook | Stable | Stable | Stable |
| American Express National Bank | Long Term | A3 | A | A |
| Short Term | P-1 | A-1 | F1 |
| Outlook | Stable | Stable | Stable |
| American Express Credit Corporation | Long Term | A2 | A | A |
| Short Term | N/R | N/R | N/R |
| Outlook | Stable | Stable | Stable |
These ratings are not a recommendation to buy or hold any of our securities and they may be revised or revoked at any time at the sole discretion of the rating organization.
Downgrades in the ratings of our unsecured debt or asset securitization program securities could result in higher funding costs, as well as higher fees related to borrowings under our unused credit facilities. Declines in credit ratings could also reduce our borrowing capacity in the unsecured debt and asset securitization capital markets. We believe our funding mix, including the proportion of U.S. direct deposits insured by the FDIC to total funding, should reduce the impact that credit rating downgrades would have on our funding capacity and costs.
In August, 2023, the U.S. federal bank regulatory agencies issued a notice of proposed rulemaking that would require covered bank holding companies such as American Express Company to issue and maintain minimum amounts of eligible external long-term debt and certain insured depository institutions such as AENB to issue and maintain minimum amounts of eligible internal long-term debt. See “Supervision and Regulation — Capital and Liquidity Regulation” under “Business” for more information.
DEPOSIT PROGRAMS
We offer deposits within our U.S. bank subsidiary, AENB. These funds are currently insured up to an amount that is at least $250,000 per depositor, per ownership category through the FDIC; as of December 31, 2024, approximately 92 percent of these deposits were insured. Our ability to obtain deposit funding and offer competitive interest rates is dependent on, among other factors, the capital level of AENB. The direct deposit program offered by AENB is our primary deposit product channel, which makes FDIC-insured high-yield savings account, certificates of deposit (CDs), business checking and consumer rewards checking account products available directly to customers. As of December 31, 2024, our direct deposit program had approximately 3.3 million accounts. AENB also sources deposits through third-party distribution channels as needed to meet our overall funding objectives. CDs carry stated maturities while high-yield savings account, checking account and third-party sweep deposit products do not. We manage the duration of our maturing obligations, including CDs, to reduce concentration and refinancing risk.
As of December 31, 2024, we had $139.4 billion in deposits. Refer to Note 7 to the “Consolidated Financial Statements” for a further description of these deposits and scheduled maturities of certificates of deposits.
The following table sets forth the average interest rates we paid on different types of deposits during the years ended December 31, 2024, 2023 and 2022. Changes in the average interest rate we paid on our deposits were primarily due to the impact of higher market interest rates offered for retail deposits.
TABLE 20: AVERAGE INTEREST RATES PAID ON DEPOSITS | | | | | | | | | | | | | | | | | | | | | | | | | | | | | | | | | | | | | | |
| | Year ended December 31, |
| | 2024 | | 2023 | | 2022 |
(Millions, except percentages) | | Average Balance | Interest Expense | Average Interest Rate | Average Balance | Interest Expense | Average Interest Rate | | Average Balance | Interest Expense | Average Interest Rate |
| Savings accounts | | $ | 101,705 | | $ | 4,210 | | 4.1 | % | | $ | 84,913 | | $ | 3,320 | | 3.9 | % | | $ | 70,990 | | $ | 961 | | 1.4 | % |
| Checking accounts | | 1,677 | 29 | 1.7 | | | 1,189 | 37 | 3.1 | | | 468 | 6 | 1.3 | |
| Certificates of deposit: | | | | | | | | | | | | |
| Direct | | 4,978 | 211 | 4.2 | | | 4,407 | 159 | 3.6 | | | 1,708 | 33 | 1.9 | |
| Third-party (brokered) | | 9,718 | 397 | 4.1 | | | 13,945 | 518 | 3.7 | | | 7,649 | 221 | 2.9 | |
| Sweep accounts — Third-party (brokered) | | 15,419 | 845 | 5.5 | | | 15,676 | 824 | 5.3 | | | 15,039 | 301 | 2.0 | |
| Total U.S. interest-bearing deposits | | $ | 133,497 | | $ | 5,692 | | 4.3 | % | | $ | 120,130 | | $ | 4,858 | | 4.0 | % | | $ | 95,854 | | $ | 1,522 | | 1.6 | % |
SHORT-TERM FUNDING PROGRAMS
Short-term borrowings, such as commercial paper, are defined as any debt with an original maturity of twelve months or less, as well as interest-bearing overdrafts with banks. Our short-term funding programs are used primarily to fund working capital needs, such as managing seasonal variations in receivables balances. The amount of short-term borrowings issued in the future will depend on our funding strategy, our needs and market conditions. We had no commercial paper outstanding at any point during 2024. Refer to Note 8 to the “Consolidated Financial Statements” for a further description of these borrowings.
LONG-TERM DEBT AND ASSET SECURITIZATION PROGRAMS
As of December 31, 2024, we had $49.7 billion in long-term debt outstanding, including unsecured debt and asset-backed securities. Refer to Note 8 to the “Consolidated Financial Statements” for a further description of these borrowings and scheduled maturities of long-term debt obligations.
We periodically securitize Card Member loans and receivables arising from our U.S. card business, as the securitization market provides us with cost-effective funding. Securitization of Card Member loans and receivables is accomplished through the transfer of those assets to a trust, which in turn issues securities collateralized by the transferred assets to third-party investors. The proceeds from issuance are distributed to us, through our wholly owned subsidiaries, as consideration for the transferred assets. Refer to Note 5 to the “Consolidated Financial Statements” for a further description of our asset securitizations.
TABLE 21: DEBT ISSUANCES | | | | | | | | |
| (Billions) | | 2024 |
| American Express Company: | | |
| | |
Floating Rate Senior Notes (compounded SOFR(a) plus weighted-average spread of 90 basis points) | | $ | 1.1 | |
Fixed-to-Floating Rate Senior Notes (weighted-average coupon of 5.31% during the fixed rate period and compounded SOFR(a) plus weighted-average spread of 106 basis points during the floating rate period) | | 7.3 | |
Fixed-to-Floating Rate Subordinated Notes (coupon of 5.92% during the fixed rate period and compounded SOFR(a) plus spread of 163 basis points during the floating rate period) | | 0.5 | |
| American Express Credit Account Master Trust: | | |
| Fixed Rate Class A Certificates (weighted-average coupon of 5.02%) | | 3.2 | |
| Total | | $ | 12.1 | |
(a)Secured overnight financing rate (SOFR).
LIQUIDITY MANAGEMENT
Our liquidity objective is to maintain access to a diverse set of on- and off-balance sheet liquidity sources. We seek to maintain liquidity sources in amounts sufficient to meet our expected future financial obligations and business requirements for liquidity for a period of at least twelve months under a variety of adverse circumstances. These include, but are not limited to, an event where we are unable to raise new funds under our regular funding programs during a substantial weakening in economic conditions.
Our liquidity management strategy includes a number of elements, including, but not limited to:
•Maintaining diversified funding sources (refer to “Funding Strategy” above for more details);
•Maintaining unencumbered liquid assets and off-balance sheet liquidity sources;
•Projecting cash inflows and outflows under a variety of economic and market scenarios; and
•Establishing clear objectives for liquidity risk management, including compliance with regulatory requirements.
We seek to maintain access to a diverse set of on-balance sheet and off-balance sheet liquidity sources, including cash and other liquid assets, secured borrowing facilities and a committed bank credit facility. Through our U.S. bank subsidiary, AENB, we have also pledged collateral eligible for use at the Federal Reserve’s discount window.
The amount and type of liquidity resources we maintain can vary over time, based upon the results of stress scenarios required under the Dodd-Frank Wall Street Reform and Consumer Protection Act, as well as additional stress scenarios required under our liquidity risk policy. These stress scenarios possess distinct characteristics, varying by cash flow assumptions, time horizon and qualifying liquidity sources, among other factors. Scenarios under our liquidity risk policy include market-wide, firm-specific and combined liquidity stresses. Additionally, as discussed above, we became a Category III firm in the third quarter of 2024 and thus are subject to the regulatory requirements under LCR and NSFR rules, subject to applicable transition periods. See “Supervision and Regulation — Enhanced Prudential Standards” under “Business” for more information. We consider other factors in determining the amount and type of liquidity we maintain, such as economic and financial market conditions, seasonality in business operations, growth in our businesses, potential acquisitions or dispositions, the cost and availability of alternative liquidity sources and credit rating agency guidelines and requirements. We believe that we currently maintain sufficient liquidity to meet all internal and regulatory liquidity requirements.
As of December 31, 2024 and 2023, we had $40.6 billion and $46.6 billion in Cash and cash equivalents, respectively. The year-over-year decline was primarily due to the deployment of cash to fund the growth of our business. Refer to “Cash Flows” below for a discussion of the major drivers impacting cash flows for the year ended December 31, 2024. Depending on the interest rate environment, our funding composition and the amount of liquidity resources we maintain, the level of future net interest income or expense associated with our liquidity resources will vary. During 2024, interest income exceeded the interest expense associated with the liquidity portfolio.
Securitized Borrowing Capacity
As of December 31, 2024, we maintained our committed, revolving, secured borrowing facility, with a maturity date of July 15, 2026, which gives us the right to sell up to $3.0 billion face amount of eligible AAA notes from the American Express Issuance Trust II (the Charge Trust). We also maintained our committed, revolving, secured borrowing facility, with a maturity date of September 15, 2026, which gives us the right to sell up to $3.0 billion face amount of eligible AAA certificates from the American Express Credit Account Master Trust (the Lending Trust). These facilities enhance our contingent funding resources and are also used in the ordinary course of business to fund working capital needs. As of December 31, 2024, no amounts were drawn on the Charge Trust facility or the Lending Trust facility.
Committed Bank Credit Facility
As of December 31, 2024, we maintained a committed syndicated bank credit facility of $4.0 billion with a maturity date of October 30, 2026. The availability of the credit facility is subject to our maintenance of a minimum CET1 risk-based capital ratio of 4.5 percent, with certain restrictions in relation to either accessing the facility or distributing capital to common shareholders in the event our CET1 risk-based capital ratio falls between 4.5 percent and 6.5 percent. It does not contain a material adverse change clause, which might otherwise preclude borrowing under the facility, nor is it dependent on our credit rating. As of December 31, 2024, we were in compliance with the covenants contained in the credit facility and no amounts were drawn on this facility. This facility enhances our contingent funding resources and is also used in the ordinary course of business to fund working capital needs. Any undrawn portion of this facility could serve as a backstop for the amount of commercial paper outstanding.
Other Sources of Liquidity
In addition to cash and other liquid assets and the secured borrowing facilities and committed bank credit facility described above, as an insured depository institution, AENB may borrow from the Federal Reserve Bank of San Francisco through the discount window against the U.S. credit card loans and charge card receivables that it pledged.
As of December 31, 2024, AENB had available borrowing capacity of $76.9 billion based on the amount and collateral valuation of receivables that were pledged to the Federal Reserve Bank of San Francisco. Whether specific assets will be considered qualifying collateral and the amount that may be borrowed against the collateral remain at the discretion of the Federal Reserve and can change from time to time. Due to regulatory restrictions, liquidity generated by AENB can generally be used only to fund obligations within AENB, and transfers to the parent company or non-bank affiliates may be subject to prior regulatory approval.
Off-balance Sheet Arrangements
We have certain off-balance sheet obligations that include guarantees, indemnifications and certain Card Member and partner arrangements that may have a material current or future effect on our financial condition, changes in financial condition, results of operations, or liquidity and capital resources. For more information on these obligations, refer to Note 12, Note 15 and Note 23 to the “Consolidated Financial Statements.”
CASH FLOWS
The following table summarizes our cash flow activity, followed by a discussion of the major drivers impacting operating, investing and financing cash flows for the year ended December 31, 2024 compared to the year ended December 31, 2023:
TABLE 22: CASH FLOWS | | | | | | | | | | | | | | | | | | | | |
| (Billions) | | 2024 | | 2023 | | 2022 |
| Total cash provided by (used in): | | | | | | |
| Operating activities | | $ | 14.0 | | | $ | 18.5 | | | $ | 21.1 | |
| Investing activities | | (24.4) | | | (24.4) | | | (33.7) | |
| Financing activities | | 4.4 | | | 18.4 | | | 24.5 | |
| Effect of foreign currency exchange rates on cash and cash equivalents | | — | | | 0.2 | | | — | |
| Net (decrease) increase in cash and cash equivalents | | $ | (6.0) | | | $ | 12.7 | | | $ | 11.9 | |
Cash Flows from Operating Activities
Our cash flows from operating activities primarily include net income adjusted for (i) non-cash items included in net income, such as provisions for credit losses, depreciation and amortization, stock-based compensation, deferred taxes and other non-cash items and (ii) changes in the balances of operating assets and liabilities, which can vary significantly in the normal course of business due to the amount and timing of payments.
In 2024, the net cash provided by operating activities was driven by cash generated from net income for the period, partially offset by lower net operating liabilities, primarily driven by lower book overdrafts due to timing differences arising in the ordinary course of business.
In 2023, the net cash provided by operating activities was primarily driven by cash generated from net income for the period and higher net operating liabilities, primarily driven by higher book overdrafts due to timing differences arising in the ordinary course of business and higher accounts payable to merchants.
Cash Flows from Investing Activities
Our cash flows from investing activities primarily include changes in loans and Card Member receivables, as well as changes in our available-for-sale investment securities portfolio.
In both 2024 and 2023, the net cash used in investing activities was primarily driven by higher Loans and Card Member receivables outstanding, partially offset by net maturities of investment securities.
Cash Flows from Financing Activities
Our cash flows from financing activities primarily include changes in customer deposits, long-term debt and short-term borrowings, as well as dividend payments and share repurchases.
In both 2024 and 2023, the net cash provided by financing activities was primarily driven by growth in customer deposits and net proceeds from long-term debt, partially offset by share repurchases and dividend payments.
RISK MANAGEMENT
GOVERNANCE
Risk management is overseen by our Board of Directors through three Board committees: the Risk Committee, the Audit and Compliance Committee, and the Compensation and Benefits Committee. Each committee consists entirely of independent directors and provides regular reports to the full Board regarding matters reviewed at their committee. The committees meet regularly in private sessions with our Chief Risk Officer, the Chief Compliance Officer, the Chief Audit Executive and other senior management with regard to our risk management processes, risk profile and performance, controls, talent and capabilities. The Board monitors the “tone at the top,” our risk culture, and oversees emerging and strategic risks.
We use our comprehensive Enterprise Risk Management (ERM) program to identify, aggregate, monitor, measure, report and manage risks. The program also defines our risk appetite, governance, culture and capabilities. The implementation and execution of the ERM program is headed by our Chief Risk Officer. The Risk Committee reviews and concurs with the appointment, replacement, performance and compensation of our Chief Risk Officer and receives regular updates from the Chief Risk Officer on key risks and exposures.
The Risk Committee of our Board of Directors provides oversight of our ERM framework, processes and methodologies. The Risk Committee approves our ERM and select other risk policies. The ERM policy defines and governs risk governance, risk oversight and risk appetite, including credit risk (at both the individual and institutional levels), operational risk (e.g., operations and process, legal, conduct, third-party, information technology, information security, data management, privacy and people risks), compliance risk, reputational risk, market risk, funding and liquidity risk, model risk, strategic and business risk and country risk. The ERM policy also guides the monitoring of emerging risks, as appropriate. Risk appetite defines the authorized risk limits to control exposures within our risk capacity and risk tolerance, including stressed forward-looking scenarios. In addition, it establishes principles for risk taking in the aggregate and for each risk type, and is supported by a comprehensive system for monitoring performance (including limits and escalation triggers) and assessing control programs. On an ongoing basis, the Risk Committee reviews our risk profile against the tolerances specified in the Risk Appetite Framework, including significant risk exposures, risk trends in our portfolios and major risk concentrations.
The Risk Committee also provides oversight of our compliance with Regulatory capital and liquidity standards, and our Internal Capital Adequacy Assessment Process, including the CCAR submissions.
The Audit and Compliance Committee of our Board of Directors reviews and approves compliance policies, which include our Compliance Risk Tolerance Statement. In addition, the Audit and Compliance Committee reviews the effectiveness of our Corporate-wide Compliance Risk Management Program. More broadly, this committee is responsible for assisting the Board in its oversight responsibilities relating to the integrity of our financial statements and financial reporting process, internal and external auditing, including the qualifications and independence of the independent registered public accounting firm and the performance of our internal audit services function, and the integrity of our systems of internal controls.
The Audit and Compliance Committee provides oversight of our Internal Audit Group. The Audit and Compliance Committee reviews and concurs with the appointment, replacement, performance and compensation of our Chief Audit Executive, who reports to the Audit and Compliance Committee, and approves Internal Audit’s annual audit plan, charter, policies, budget and staffing levels, and overall risk assessment methodology. The Audit and Compliance Committee also receives regular updates on the audit plan’s status and results, including significant reports issued by Internal Audit and the status of our corrective actions.
The Compensation and Benefits Committee of our Board of Directors works with the Chief Risk Officer to ensure our overall compensation programs, as well as those covering our risk-taking employees, appropriately balance risk with business incentives and that business performance is achieved without taking imprudent or excessive risk. Our Chief Risk Officer is actively involved in setting risk goals for the Company. Our Chief Risk Officer also reviews the risk profiles of each business unit and, in conjunction with the Chief Audit Executive, provides input into performance evaluation through the Risk Performance Program. The Chief Risk Officer meets with the Compensation and Benefits Committee and attests whether performance goals and results have been achieved without taking imprudent risks. The Compensation and Benefits Committee uses a risk-balanced incentive compensation framework to decide on our bonus pools and the compensation of senior executives.
There are several internal management committees, including the Enterprise Risk Management Committee (ERMC), chaired by our Chief Risk Officer. The ERMC is the highest-level management committee to oversee all firm-wide risks and is responsible for risk governance, risk oversight and risk appetite. It maintains the enterprise-wide risk appetite framework and monitors compliance with limits and escalations defined in it. The ERMC oversees implementation of risk policies Company-wide. The ERMC reviews key risk exposures, trends and concentrations, significant compliance matters, and provides guidance on the steps to monitor, control and report major risks. In addition, the Asset Liability Committee, chaired by our Chief Financial Officer, is responsible for managing our capital, funding and liquidity, investment, market risk and asset/liability activities in accordance with our policies and in compliance with applicable regulatory requirements.
As defined in the ERM policy, we follow the “three lines of defense” approach to risk management. The first line of defense comprises functions and management committees directly initiating risk taking. The Chief Executive Officer, business unit presidents and the Chief Financial Officer are part of the first line of defense. The second line comprises independent functions overseeing risk-taking activities of the first line. The Chief Risk Officer, the Chief Compliance Officer, the Chief Operational Risk Officer and certain control groups, both at the enterprise level and within regulated entities, are part of the second line of defense. The global risk oversight team oversees the policies, strategies, frameworks, models, processes and capabilities deployed by the first line teams and provides challenges and independent assessments on how the first line of defense is managing risks. Our Internal Audit Group constitutes the third line of defense and provides independent assessments and effective challenge of the first and second lines of defense.
CREDIT RISK MANAGEMENT PROCESS
We define credit risk as loss due to default or changes in the credit quality of a customer, obligor or security. Our credit risks are divided into two broad categories: individual and institutional. Each has distinct risk management profiles, capabilities, strategies, and tools. Business units that create individual or institutional credit risk exposures of significant importance are supported by dedicated risk management teams, each led by a Chief Credit Officer.
Individual Credit Risk
Individual credit risk arises from consumer and small business charge cards, credit cards, and term loans. These portfolios consist of millions of customers across multiple geographies, industries and levels of net worth. We benefit from the high-quality profile of our customers, which is driven by our brand, premium customer servicing, product features and risk management capabilities, which span underwriting, customer management and collections. The risk in these portfolios is generally correlated to broad economic trends, such as unemployment rates and gross domestic product (GDP) growth.
The business unit leaders and their Chief Credit Officers take the lead in managing the credit risk process. These Chief Credit Officers are guided by the Individual Credit Risk Committee (ICRC), which is responsible for implementation and enforcement of the Individual Credit Risk Management Policy. The ICRC ensures compliance with ERMC guidelines and procedures and escalates to the ERMC as appropriate.
Credit risk management is supported by sophisticated proprietary scoring and decision-making models that use up-to-date information on prospects and customers, such as spending and payment history and data feeds from credit bureaus. We have developed data-driven economic decision logic for customer interactions to better serve our customers.
Institutional Credit Risk
Institutional credit risk arises principally within our CS, ICS and GMNS businesses, as well as investment and liquidity management activities. Unlike individual credit risk, institutional credit risk is characterized by a lower loss frequency but higher severity. It is affected both by general economic conditions and by client-specific events. The absence of large losses in any given year or over several years is not necessarily representative of the level of risk of institutional portfolios, given the infrequency of loss events in such portfolios.
Similar to individual credit risk, business units taking institutional credit risks are supported by Chief Credit Officers. These officers are guided by the Institutional Risk Management Committee (IRMC), which is responsible for implementation and enforcement of the Institutional Credit Risk Management Policy and for providing guidance to the credit officers of each business unit with substantial institutional credit risk exposures. The committee, along with the business unit Chief Credit Officers, makes investment decisions in core risk capabilities, ensures proper implementation of the underwriting standards and contractual rights for risk mitigation, monitors risk exposures, and determines risk mitigation actions. The IRMC formally reviews large institutional risk exposures to ensure compliance with ERMC guidelines and procedures and escalates them to the ERMC as appropriate. At the same time, the IRMC provides guidance to the business unit risk management teams to optimize risk-adjusted returns on capital. A centralized risk rating unit provides risk assessment of our institutional obligors.
OPERATIONAL RISK MANAGEMENT PROCESS
We consider operational risk to be the risk of loss due to, among other things, inadequate or failed processes, people or information systems, or impacts from the external environment, including failures to comply with laws and regulations as well as impacts from relationships with third parties. Operational risk is inherent in all business activities and can impact an organization through direct or indirect financial loss, brand damage, customer dissatisfaction, or legal and regulatory penalties.
To appropriately measure and manage operational risk, we have implemented a comprehensive operational risk framework that is defined in the Operational Risk Management Policy approved by the ERMC. The Operational Risk Management Committee (ORMC), chaired by the Chief Operational Risk Officer, coordinates with all control groups on effective risk assessments and controls. It also oversees the preventive, responsive and mitigation efforts by control management teams in the business units and staff groups.
We use the operational risk framework to identify, measure, monitor and report inherent and emerging operational risks. The framework includes programs established for risk management activities related to processes and the launch of new products and services. The framework also defines guidelines and risk management requirements for the (a) identification of issues and operational risk events, (b) related control enhancements and (c) reporting of key trends and escalation of risks. Outcomes from the operational risk framework are discussed and escalated to various risk management committees and incorporated within our accountability framework for executive compensation.
Information Security and Cybersecurity
We define information security and cybersecurity risk as the risk that the confidentiality, integrity or availability of American Express information and information systems are impacted by unauthorized or unintended access, use, disclosure, modification or destruction.
Our Technology Risk and Information Security (TRIS) program, which is our enterprise information security and cybersecurity program, is designed to (i) ensure the security, confidentiality, integrity and availability of our information and information systems; (ii) protect against any anticipated threats or hazards to the security, confidentiality, integrity or availability of such information; and (iii) protect against unauthorized access to or use of such information that could result in substantial harm or inconvenience to us, our colleagues or our customers. The program is built upon a foundation of advanced security technology, employs a highly trained team of experts, and is designed to operate in alignment with global regulatory requirements. The TRIS program includes controls designed to identify, protect, detect, respond to and recover from information security and cybersecurity incidents. We continue to assess the risks and changes in the cyber environment, invest in enhancements to our cybersecurity capabilities and engage in industry and government forums to promote advancements in our cybersecurity capabilities as well as the broader financial services cybersecurity ecosystem.
See “Cybersecurity” and “A major information or cybersecurity incident or an increase in fraudulent activity could lead to reputational damage to our brand and material legal, regulatory and financial exposure, and could reduce the use and acceptance of our products and services” under “Risk Factors” for additional information.
Information Technology
We define information technology risk as the risk that events or circumstances could compromise the processing, stability, capacity, performance, or resilience of information technology and cause financial, reputational, and/or regulatory impacts.
We manage information technology risk through our policies, procedures, governance structure, and control framework to preserve the confidentiality, integrity, and availability of systems and processes across our Company.
See “The uninterrupted operation of our information systems is critical to our success and a significant disruption could have a material adverse effect on our business and results of operations” under “Risk Factors” for additional information.
Privacy
We define privacy risk as the risk of financial loss, reputational damage, or regulatory or legal action resulting from decisions related to the violation of applicable laws, rules, regulations, contractual obligations, or the non-adherence to privacy policies, disclosures, or standards that apply to the processing of personal data.
The Global Privacy Policy, which establishes the privacy framework and defines the American Express Data Protection & Privacy Principles, governs the way we collect, use, store, share, transmit, delete or otherwise process our customer and colleague personal data globally. Chaired by the Chief Privacy Officer, the Privacy Risk Management Committee, a sub-committee of the ORMC, provides oversight and governance for our privacy program.
Data Management and Governance
We define data management and governance risk as the risk of financial, reputational, and/or regulatory impacts due to inadequate data governance and/or data management practices adversely impacting the accuracy, completeness, timeliness, comprehensiveness or usability of data throughout its lifecycle.
Our Enterprise Data Governance Policy establishes the framework for defining in-scope critical data and the requirements for managing such data effectively throughout its lifecycle as a critical corporate asset. This policy is approved by the ERMC.
Chaired by the Chief Data Officer, our Enterprise Data Committee, a sub-committee of the ERMC, provides governance and oversight for our enterprise-wide data governance and management activities.
Third Party Risk
We define third party risk as the risk that relationships with third parties (including their significant subcontractors) create unexpected outcomes and deviations from expectations or stated obligations. The Third Party Management Policy is approved by the Risk Committee of our Board and the ERMC. It sets forth the procurement, risk management, and contracting framework for managing third-party relationships commensurate with their risk and complexity. Our Third Party Lifecycle Management program sets guidelines for identifying, measuring, monitoring, and reporting the risk associated with third parties through the life cycle of the relationships, which includes planning, due diligence and third-party selection, contracting, ongoing monitoring and termination.
Conduct Risk
We define conduct risk as the risk that colleagues, intentionally or unintentionally, fail to fulfill their responsibilities to American Express, our customers, colleagues or stakeholders in a manner consistent with our Code of Conduct, policies and values as well as applicable laws and regulations. Conduct issues also have the potential to increase several other risk types, including reputational risk, which may undermine the integrity and trust upon which our brand is built.
The Conduct Risk Management Policy is approved by the ERMC. It establishes the governance framework for conduct risk across the Company. The policy requires annual risk assessments, implementation of detective and preventive controls, colleague training and timely escalations of conduct issues. It also provides guidance on consequence management for any substantiated cases of misconduct. The Conduct Risk Committee oversees conduct risk related topics and escalates such matters to the ERMC, as appropriate.
COMPLIANCE RISK MANAGEMENT PROCESS
We define compliance risk as the risk of legal or reputational harm, fines, monetary penalties and payment of damages or other forms of sanction as a result of non-compliance with applicable laws and/or regulations, internal policies and procedures and related practices, or ethical standards.
We view our ability to effectively mitigate compliance risk as an important aspect of our business model. Our Global Compliance and Ethics organization is responsible for establishing and maintaining our corporate-wide Compliance Risk Management Program. Pursuant to this program, we seek to manage and mitigate compliance risk by assessing, controlling, monitoring, measuring and reporting the legal and regulatory risks to which we are exposed. The Compliance Risk Management Committee (CRMC), chaired by the Chief Compliance Officer, is responsible for identifying, evaluating, managing, and escalating compliance risks. The CRMC has a dual reporting relationship to both the Risk Committee (through the ERMC) and the Audit and Compliance Committee.
Additionally, we have a comprehensive Anti-Money Laundering program that monitors and reports suspicious activity to the appropriate government authorities. The program includes an independent risk assessment of the rules used by the Anti-Money Laundering team.
REPUTATIONAL RISK MANAGEMENT PROCESS
We define reputational risk as the risk that negative stakeholder reaction to our products, services, client and partner relationships, business activities and policies, management and workplace culture, or our response to unexpected events, could cause sustained critical media coverage, a decline in revenue or investment, talent attrition, litigation, or government or regulatory scrutiny.
We view protecting our reputation for excellent customer service, trust, security and high integrity as core to our vision of providing the world’s best customer experience and fundamental to our long-term success.
Our business leaders are responsible for considering the reputational risk implications of business activities and strategies and ensuring the relevant subject matter experts are engaged as needed. The ERMC is responsible for ensuring reputational risk considerations are included in the scope of appropriate subordinate risk policies and committees and properly reflected in all decisions escalated to the ERMC.
MARKET RISK MANAGEMENT PROCESS
We define market risk as the risk to earnings or asset and liability values resulting from movements in market prices. Our market risk exposures include (i) interest rate risk due to changes in the relationship between the interest rates on our assets (such as loans, receivables and investment securities) and the interest rates on our liabilities (such as debt and deposits) and (ii) foreign exchange risk related to transactions, funding, investments and earnings in currencies other than the U.S. dollar.
Our risk policies establish the framework that guides and governs market risk management, including quantitative limits and escalation triggers. These policies are approved by the ERMC, Asset Liability Committee or Market Risk Management Committee.
Market risk is managed by the Market Risk Management Committee. The Market Risk Oversight Officer provides an independent risk assessment and oversight over the policies and exposure management for market risk and Asset Liability Management activities.
Interest Rate Risk
We analyze a variety of interest rate scenarios to inform us of the potential impacts from interest rate changes on earnings and the value of assets, liabilities and the economic value of equity. Our interest rate exposure can vary over time as a result of, among other things, the proportion of our total funding provided by variable and fixed-rate debt and deposits compared to our Card Member loans and receivables. Interest rate swaps are used from time to time to effectively convert debt issuances to variable-rate from fixed-rate, or vice versa. Refer to Note 13 to the “Consolidated Financial Statements” for further discussion of our derivative financial instruments.
To measure the sensitivity of net interest income to interest rate changes, we first project net interest income over the following twelve-month time horizon considering forecasted business growth and anticipated future market interest rates. The impact from rate changes is then measured by instantaneously increasing or decreasing the anticipated future interest rates by the amounts set forth in Table 23 below. Our current net interest income sensitivity analysis shows higher interest rates would have a detrimental impact on our net interest income. Our estimated repricing risk assumes that our interest-rate sensitive assets and liabilities that reprice within the twelve-month horizon generally reprice by the same magnitude, subject to applicable interest rate caps or floors, as benchmark rates change. It is further assumed that, within our interest-rate sensitive liabilities, certain deposits reprice at lower magnitudes than benchmark rate movements, and the magnitude of this repricing in turn could depend on, among other factors, the direction of rate movements. These assumptions are consistent with historical deposit repricing experience in the industry and within our own portfolio. Actual changes in our net interest income will depend on many factors, and therefore may differ from our estimated risk to changes in market interest rates.
TABLE 23: SENSITIVITY ANALYSIS OF INTEREST RATE CHANGES ON ANNUAL NET INTEREST INCOME AS OF DECEMBER 31, 2024 | | | | | | | | | | | | | | | | | | | | | | | | | | | | | |
| (Millions) | Instantaneous Parallel Rate Shocks (a) |
| | +200bps | | +100bps | | -100bps | | -200bps | |
| | $ | (560) | | $ | (224) | | | $ | 225 | | | $ | 457 | | |
(a)Negative values represent a reduction in net interest income.
We use economic value of equity to inform us of the potential impacts from interest rate changes on the net present value of our assets and liabilities under a variety of interest rate scenarios. Economic value of equity is calculated based on our existing assets, liabilities and derivatives, and does not incorporate projected changes in our balance sheet. Key assumptions used in this calculation include the term structure of interest rates, as well as deposit repricing and liquidation profiles used to inform duration and cash flow schedules. The economic value of equity is calculated under multiple interest rate scenarios, including baseline and immediate upward and immediate downward interest rate shocks, to assess its sensitivity to changes in interest rates. Our current sensitivity profile demonstrates that our economic value of equity generally decreases in a declining interest rate scenario and increases in an increasing interest rate scenario. The level of this sensitivity is managed within board-approved policy limits.
Foreign Exchange Risk
Foreign exchange exposures arise in four principal ways: (1) Card Member spending in currencies that are not the billing currency, (2) cross-currency transactions and balances from our funding activities, (3) cross-currency investing activities, such as in the equity of foreign subsidiaries, and (4) revenues generated and expenses incurred in foreign currencies, which impact earnings.
These foreign exchange risks are managed primarily by entering into foreign exchange spot transactions or hedged with foreign exchange forward contracts when the hedge costs are economically justified and in notional amounts designed to offset pretax impacts from currency movements in the period in which they occur. As of December 31, 2024, foreign currency derivative instruments with total notional amounts of approximately $43 billion were outstanding.
With respect to Card Member spending and cross-currency transactions, including related foreign exchange forward contracts outstanding, the impact of a hypothetical 10 percent strengthening of the U.S. dollar would have been immaterial to projected earnings as of December 31, 2024. With respect to translation exposure of foreign subsidiary equity balances, including related foreign exchange forward contracts outstanding, a hypothetical 10 percent strengthening of the U.S. dollar would result in an immaterial reduction in other comprehensive income and equity as of December 31, 2024. With respect to anticipated earnings denominated in foreign currencies for the next twelve months, the adverse impact on pretax income of a hypothetical 10 percent strengthening of the U.S. dollar, net of hedges, would be approximately $136 million as of December 31, 2024.
The actual impact of interest rate and foreign exchange rate changes will depend on, among other factors, the timing of rate changes, the extent to which different rates do not move in the same direction or in the same direction to the same degree, changes in the cost, volume and mix of our hedging activities and changes in the volume and mix of our businesses.
FUNDING & LIQUIDITY RISK MANAGEMENT PROCESS
We define funding and liquidity risk as our inability to meet our ongoing financial and business obligations at a reasonable cost as they become due.
Our Board-approved Liquidity Risk Policy establishes the framework that guides and governs liquidity risk management.
Funding and liquidity risk is managed by the Funding and Liquidity Committee. To manage this risk, we seek to maintain access to a diverse set of cash, readily-marketable securities and contingent sources of liquidity, such that we can continuously meet our business requirements and expected future financing obligations for at least a twelve-month period under a variety of adverse circumstances. These include, but are not limited to, an event where we are unable to raise new funds under our regular funding programs during a substantial weakening in economic conditions. We consider the trade-offs between maintaining too much liquidity, which can be costly and limit financial flexibility, and having inadequate liquidity, which may result in financial distress during a liquidity event.
Funding and liquidity risk is managed at an aggregate consolidated level as well as at certain subsidiaries in order to ensure that sufficient and accessible liquidity resources are maintained. The Funding and Liquidity Committee reviews forecasts of our aggregate and subsidiary cash positions and financing requirements, approves funding plans designed to satisfy those requirements under normal and stressed conditions, establishes guidelines to identify the amount of liquidity resources required and monitors positions and determines any actions to be taken.
Our liquidity risk management processes are designed in alignment with regulatory guidelines. As a Category III firm under U.S. federal bank regulatory agencies’ rules, we are subject to heightened capital, liquidity and prudential requirements, including more stringent liquidity risk management requirements. See “Supervision and Regulation – Capital and Liquidity Regulation” under “Business” for more information.
MODEL RISK MANAGEMENT PROCESS
We define model risk as the risk of adverse consequences, such as financial loss, poor business and strategic decision making, damage to our reputation or customer harm, from decisions based on incorrect or misused model outputs and outcomes.
The Enterprise-Wide Model Risk Policy establishes the comprehensive framework for governing model risk. This policy is approved by the ERMC. The comprehensive risk management and governance framework includes procedures for model development, independent model validation, model risk reporting and change management capabilities that seek to minimize erroneous model methodology, outputs, and misuse. We also assess model performance and model- related issues on an ongoing basis and seek to address deficiencies in a timely manner. In addition, we utilize artificial intelligence and machine learning (AI/ML) models, including Generative AI tools, for a variety of business use cases. We perform extensive reviews and testing to reduce the risk that these AI/ML techniques result in adverse consequences.
STRATEGIC AND BUSINESS RISK MANAGEMENT PROCESS
We define strategic and business risk as the risk related to our inability to achieve our business objectives due to poor strategic decisions, including decisions related to the launch or modification of products, mergers, acquisitions, and divestitures, poor implementation of strategic decisions or declining demand for our products and services.
Strategic decisions are reviewed and approved by business leaders and various committees and must be aligned with company policies. We seek to manage strategic and business risks through risk controls embedded in these processes as well as overall risk management oversight over business goals. Launch of key new products as well as existing product performance is reviewed periodically by committees and business leaders to inform business decisions as appropriate. Mergers, acquisitions and divestitures can only be approved following Executive Committee due diligence, a comprehensive risk assessment by operational, market, credit and oversight leaders provided to the Chief Risk Officer and approval by either the Chief Risk Officer or appropriate risk committees. All new and material changes to products and services are reviewed and approved by the New Products Committee and appropriate credit or risk committees.
COUNTRY RISK MANAGEMENT PROCESS
We define country risk as the risk that economic, social, and/or political conditions and events in a country present. They might adversely impact us, primarily as a result of greater credit losses, increased operational or market risk or the inability to repatriate capital.
We manage country risk as part of the normal course of business. Policies and procedures establish country risk escalation thresholds to control and limit exposure, driven by processes that enable the monitoring of conditions in countries where we have exposure.
EMERGING RISKS
We also identify, monitor and report on emerging risks through our risk governance framework. Emerging risks arise due to changes in the external environment or internal initiatives and may manifest across multiple risk types. For example, climate-related risk is currently identified as an emerging risk and may manifest as credit risk, operational risk, market risk, liquidity risk or other risk types. Emerging risks are monitored and reported periodically to members of management, as well as to the ERMC and the Risk Committee of our Board of Directors.
CRITICAL ACCOUNTING ESTIMATES
Refer to Note 1 to the “Consolidated Financial Statements” for a summary of our significant accounting policies. Certain of our accounting policies requiring significant management assumptions and judgments are as follows:
RESERVES FOR CARD MEMBER CREDIT LOSSES
Reserves for Card Member credit losses represent our best estimate of the expected credit losses in our outstanding portfolio of Card Member loans and receivables as of the balance sheet date. The CECL methodology requires us to estimate lifetime expected credit losses by incorporating historical loss experience, as well as current and future economic conditions over a reasonable and supportable period (R&S Period) beyond the balance sheet date.
In estimating expected credit losses, we use a combination of statistically based models and analysis of the results produced by these models to determine the quantitative and qualitative components of our total balance sheet reserves for credit losses. These quantitative and qualitative components entail a significant amount of judgment. The primary areas of judgment used in measuring the quantitative components of our reserves relate to the determination of the appropriate R&S Period, the modeling of the probability of and exposure at default, and the methodology to incorporate current and future economic conditions. We use these models and assumptions, combined with historical loss experience, to determine the reserve rates that are applied to the outstanding loan or receivable balances to produce our reserves for expected credit losses for the R&S Period. The qualitative component is intended to capture expected losses that may not have been fully captured in the quantitative component. Through an established governance structure, we consider certain external and internal factors, including emerging portfolio characteristics and trends, which consequentially may increase or decrease the reserves for Card Member credit losses.
The R&S Period, which is approximately three years, represents the maximum time-period beyond the balance sheet date over which we can reasonably estimate expected credit losses, using all available portfolio information, current economic conditions and forecasts of future economic conditions. Card Member loan products do not have a contractual term and balances can revolve if minimum required payments are made, causing some balances to remain outstanding beyond the R&S Period. To determine expected credit losses beyond the R&S Period, we immediately revert to long-term average loss rates. Card Member receivable products are contractually required to be paid in full; therefore, we have assumed the balances will be either paid or written-off no later than 180 days past due.
Within the R&S Period, our models use past loss experience and current and future economic conditions to estimate the probability of default, exposure at default and expected recoveries to estimate net losses at default. A significant area of judgment relates to how we apply future Card Member payments to the reporting period balances when determining the exposure at default. The nature of revolving loan products inherently includes a relationship between future payments and spend behavior, which creates complexity in the application of how future payments are either partially or entirely attributable to the existing balance at the end of the reporting period. Using historical customer behavior and other factors, we have assumed that future payments are first allocated to interest and fees associated with the reporting period balance and future spend. We then allocate a portion of the payment to the estimated higher minimum payment amount due because of any future spend. Any remaining portion of the future payment is then allocated to the remaining reporting period balance.
CECL requires that the R&S Period include an assumption about current and future economic conditions. We incorporate multiple macroeconomic scenarios provided to us by an independent third party. The estimated credit losses calculated from each macroeconomic scenario are reviewed each period and weighted to reflect management’s judgment about uncertainty surrounding these scenarios. These macroeconomic scenarios contain certain variables, including unemployment rates and real GDP, that are significant to our models.
Macroeconomic Sensitivity
To demonstrate the sensitivity of estimated credit losses to the macroeconomic scenarios, we compared our modeled estimates under a baseline scenario to that under a pessimistic downside scenario. As of December 31, 2024, for every 10 percentage points change in weighting from the baseline scenario to the pessimistic downside scenario, the estimated credit losses increased by approximately $230 million.
The modeled estimates under these scenarios were influenced by the duration, severity and timing of changes in economic variables within each scenario and these macroeconomic scenarios, under different conditions or using different assumptions, could result in significantly different estimated credit losses. It is difficult to estimate how potential changes in specific factors might affect the estimated credit losses, and current results may not be indicative of the potential future impact of macroeconomic forecast changes.
In addition, this sensitivity analysis relates only to the modeled credit loss estimates under two scenarios without considering management’s judgment on the relative weighting for those and other scenarios, including the weight that has been placed on the downside scenario at the balance sheet date, or any potential changes in other adjustments to the quantitative reserve component or the impact of management judgment for the qualitative reserve component, which may have a positive or negative effect on the results. Thus, the results of this sensitivity analysis are hypothetical and are not intended to estimate or reflect our expectations of any changes in the overall reserves for credit losses due to changes in the macroeconomic environment.
Refer to Note 3 to the “Consolidated Financial Statements” for further information on the range of macroeconomic scenario key variables used, in conjunction with other inputs described above, to calculate reserves for Card Member credit losses.
The process of estimating these reserves requires a high degree of judgment. To the extent our expected credit loss models are not indicative of future performance, actual losses could differ significantly from our judgments and expectations, resulting in either higher or lower future provisions for credit losses in any period.
LIABILITY FOR MEMBERSHIP REWARDS
The Membership Rewards program is our largest card-based rewards program. Card Members can earn points for purchases charged on their enrolled card products. A significant portion of our cards, by their terms, allow Card Members to earn bonus points for purchases at merchants in particular industry categories. Membership Rewards points are redeemable for a broad variety of rewards, including, but not limited to, travel, shopping, gift cards, and statement credits. Points typically do not expire, and there is no limit on the number of points a Card Member may earn. Membership Rewards expense is driven by charge volume on enrolled cards, customer participation in the program and contractual arrangements with redemption partners.
We record a Membership Rewards liability that represents our best estimate of the cost of points earned that are expected to be redeemed by Card Members in the future. The Membership Rewards liability is impacted over time by enrollment levels, attrition, the volume of points earned and redeemed, and the associated redemption costs. We estimate the Membership Rewards liability by determining the URR and the weighted average cost (WAC) per point, which are applied to the points of current enrollees. Refer to Note 9 to the “Consolidated Financial Statements” for additional information.
The URR assumption is used to estimate the number of points earned by current enrollees that will ultimately be redeemed in future periods. We use statistical and actuarial models to estimate the URR of points earned to date by current Card Members based on redemption trends, card product type, enrollment tenure, card spend levels and credit attributes. The WAC per point assumption is used to estimate future redemption costs and is primarily based on redemption choices made by Card Members, reward offerings by partners, and Membership Rewards program changes. The WAC per point assumption is derived from 12 months of redemptions and is adjusted as appropriate for certain changes in redemption costs that are not representative of future cost expectations and expected developments in redemption patterns.
We periodically evaluate our liability estimation process and assumptions based on changes in cost per point redeemed, partner contract changes and developments in redemption patterns, which may be impacted by product refreshes, changes in redemption options and mix of proprietary cards-in-force.
The process of estimating the Membership Rewards liability includes a high degree of judgment. Actual redemptions and associated redemption costs could differ significantly from our estimates, resulting in either higher or lower Membership Rewards expense.
Changes in the Membership Rewards URR and WAC per point have the effect of either increasing or decreasing the liability through the current period Membership Rewards expense by an amount estimated to cover the cost of all points previously earned but not yet redeemed by current enrollees as of the end of the reporting period. As of December 31, 2024, an increase in the estimated URR of current enrollees of 25 basis points would increase the Membership Rewards liability and corresponding rewards expense by approximately $197 million. Similarly, an increase in the WAC per point of 1 basis point would increase the Membership Rewards liability and corresponding rewards expense by approximately $220 million.
GOODWILL RECOVERABILITY
Goodwill represents the excess of acquisition cost of an acquired business over the fair value of assets acquired and liabilities assumed. Goodwill is not amortized but is tested for impairment at the reporting unit level annually or when events or circumstances arise, such as adverse changes in the business environment, that would more likely than not reduce the fair value of the reporting unit below its carrying value. Our methodology for conducting this goodwill impairment testing contains both a qualitative and quantitative assessment.
We have the option to initially perform an assessment of qualitative factors in order to determine whether it is more likely than not that the fair value of a reporting unit is less than its carrying amount. The qualitative factors may include, but are not limited to, economic conditions, industry and market considerations, cost factors, overall financial performance of the reporting unit and other company and reporting unit-specific events. If we determine that it is more likely than not that the fair value of a reporting unit is less than its carrying amount, we then perform the impairment evaluation using a more detailed quantitative assessment. We could also directly perform this quantitative assessment for any reporting unit, bypassing the qualitative assessment.
Our methodology for conducting the quantitative goodwill impairment testing is fundamentally based on the measurement of fair value for our reporting units, which inherently entails the use of significant management judgment. For valuation, we use a combination of the income approach (discounted cash flows) and market approach (market multiples) in estimating the fair value of our reporting units.
When preparing discounted cash flow models under the income approach, we estimate future cash flows using the reporting unit’s internal multi-year forecast, and a terminal value calculated using a growth rate that we believe is appropriate in light of current and expected future economic conditions. To discount these cash flows we use our expected cost of equity, determined using a capital asset pricing model. When using the market method under the market approach, we apply comparable publicly traded companies’ multiples (e.g., earnings, revenues) to our reporting units’ operating results. The judgment in estimating forecasted cash flows, discount rates and market comparables is significant, and imprecision could materially affect the fair value of our reporting units.
We could be exposed to an increased risk of goodwill impairment if future operating results or macroeconomic conditions differ significantly from management’s current assumptions.
INCOME TAXES
We are subject to the income tax laws of the United States, its states and municipalities and those of the foreign jurisdictions in which we operate. These tax laws are complex, and the manner in which they apply to the taxpayer’s facts is sometimes open to interpretation. In establishing a provision for income tax expense, we must make judgments about the application of inherently complex tax laws.
Unrecognized Tax Benefits
We establish a liability for unrecognized tax benefits, which are the differences between a tax position taken or expected to be taken in a tax return and the benefit recognized in the financial statements.
In establishing a liability for an unrecognized tax benefit, assumptions may be made in determining whether, and the extent to which, a tax position should be sustained. A tax position is recognized only when it is more likely than not to be sustained upon examination by the relevant taxing authority, based on its technical merits. The amount of tax benefit recognized is the largest benefit that we believe is more likely than not to be realized on ultimate settlement. As new information becomes available, we evaluate our tax positions and adjust our unrecognized tax benefits, as appropriate.
Tax benefits ultimately realized can differ from amounts previously recognized due to uncertainties, with any such differences generally impacting the provision for income tax.
Deferred Tax Asset Realization
Deferred tax assets and liabilities are determined based on the differences between the financial statement and tax bases of assets and liabilities using the enacted tax rates expected to be in effect for the years in which the differences are expected to reverse.
Since deferred taxes measure the future tax effects of items recognized in the Consolidated Financial Statements, certain estimates and assumptions are required to determine whether it is more likely than not that all or some portion of the benefit of a deferred tax asset will not be realized. In making this assessment, we analyze and estimate the impact of future taxable income, reversing temporary differences and available tax planning strategies. These assessments are performed quarterly, taking into account any new information.
Changes in facts or circumstances can lead to changes in the ultimate realization of deferred tax assets due to uncertainties.
OTHER MATTERS
RECENTLY ADOPTED AND ISSUED ACCOUNTING STANDARDS
Refer to the Recently Adopted and Issued Accounting Standards section of Note 1 to the “Consolidated Financial Statements.”
GLOSSARY OF SELECTED TERMINOLOGY
Adjusted net interest income — A non-GAAP measure that represents net interest income attributable to our Card Member loans (which includes, on a GAAP basis, interest that is deemed uncollectible), excluding the impact of interest expense and interest income not attributable to our Card Member loans.
Allocated service costs — Represents salaries and benefits associated with our technology and customer servicing groups, allocated based on activities directly attributable to our reportable operating segments, as well as overhead expenses, which are allocated to our reportable operating segments based on their relative levels of revenue and Card Member loans and receivables.
Asset securitizations — Asset securitization involves the transfer and sale of loans or receivables to a special-purpose entity created for the securitization activity, typically a trust. The trust, in turn, issues securities, commonly referred to as asset-backed securities that are secured by the transferred loans and receivables. The trust uses the proceeds from the sale of such securities to pay the purchase price for the transferred loans or receivables. The securitized loans and receivables of our Lending Trust and Charge Trust (collectively, the Trusts) are reported as assets and the securities issued by the Trusts are reported as liabilities on our Consolidated Balance Sheets.
Billed business (Card Member spending) — Represents transaction volumes (including cash advances) on payment products issued by American Express.
Capital ratios — Represents the minimum standards established by regulatory agencies as a measure to determine whether the regulated entity has sufficient capital to absorb on- and off-balance sheet losses beyond current loss accrual estimates. Refer to “Consolidated Capital Resources and Liquidity — Capital Strategy” above for further related definitions under Basel III.
Card Member — The individual holder of an issued American Express-branded card.
Card Member loans — Represents balances on our credit card products and revolve-eligible balances on our charge card products.
Card Member receivables — Represents balances on our charge card products that need to be paid in full on or before the Card Member’s payment due date.
Cards-in-force — Represents the number of cards that are issued and outstanding by American Express (proprietary cards-in-force) and cards issued and outstanding under network partnership agreements with banks and other institutions, except for retail cobrand cards issued by network partners that had no out-of-store spending activity during the prior twelve months. Basic cards-in-force excludes supplemental cards issued on consumer accounts. Cards-in-force is useful in understanding the size of our Card Member base.
Charge cards — Represents cards that generally carry no pre-set spending limits and are primarily designed as a method of payment and not as a means of financing purchases. Each transaction on a charge card with no pre-set spending limit is authorized based on its likely economics reflecting a Card Member’s most recent credit information and spend patterns. Charge Card Members must pay the full amount of balances billed each month, with the exception of balances that can be revolved under lending features offered on certain charge cards, such as Pay Over Time and Plan It®, that allow Card Members to pay for eligible purchases with interest over time.
Cobrand cards — Represents cards issued under cobrand agreements with selected commercial partners. Pursuant to the cobrand agreements, we make payments to our cobrand partners, which can be significant, based primarily on the amount of Card Member spending and corresponding rewards earned on such spending and, under certain arrangements, on the number of accounts acquired and retained. The partner is then liable for providing rewards to the Card Member under the cobrand partner’s own loyalty program.
Credit cards — Represents cards that have a range of revolving payment terms, structured payment features (e.g., Plan It, Expanded Buying Power), grace periods, and rate and fee structures.
Discount revenue — Primarily represents the amount we earn and retain from the merchant payable for facilitating transactions between Card Members and merchants on payment products issued by American Express.
Goods & Services (G&S) spend — Includes spend in merchant categories other than T&E-related merchant categories, which includes B2B spending by small and mid-sized enterprise customers in our CS and ICS segments.
Interest expense — Includes interest incurred primarily to fund Card Member loans and receivables, general corporate purposes and liquidity needs. Interest expense is divided principally into two categories: (i) deposits, which primarily relates to interest expense on deposits taken from customers and institutions, and (ii) debt, which primarily relates to interest expense on our long-term financing and short-term borrowings, (e.g., commercial paper, federal funds purchased, bank overdrafts and other short-term borrowings), as well as the realized impact of derivatives hedging interest rate risk on our long-term debt.
Interest income — Includes (i) interest on loans, (ii) interest and dividends on investment securities and (iii) interest income on deposits with banks and other.
Interest on loans — Assessed using the average daily balance method for Card Member loans. Unless the loan is classified as non-accrual, interest is recognized based upon the principal amount outstanding in accordance with the terms of the applicable account agreement until the outstanding balance is paid or written off.
Interest and dividends on investment securities — Primarily relates to our performing fixed-income securities. Interest income is recognized using the effective interest method, which adjusts the yield for security premiums and discounts, fees and other payments, so a constant rate of return is recognized on the outstanding balance of the related investment security throughout its term. Amounts are recognized until securities are in default or when it is likely that future interest payments will not be made as scheduled.
Interest income on deposits with banks and other — Primarily relates to the placement of cash in excess of near-term funding requirements in interest-bearing time deposits, overnight sweep accounts, and other interest-bearing demand and call accounts.
Loyalty coalitions — Programs that enable consumers to earn rewards points and use them to save on purchases from a variety of participating merchants through multi-category rewards platforms. Merchants in these programs generally fund the consumer offers and are responsible to us for the cost of rewards points; we earn revenue from operating the loyalty platform and by providing marketing support.
Net card fees — Represents the card membership fees earned during the period recognized as revenue over the covered card membership period (typically one year), net of the provision for projected refunds for Card Membership cancellation and deferred acquisition costs.
Net interest yield on average Card Member loans — A non-GAAP measure that is computed by dividing adjusted net interest income by average Card Member loans, computed on an annualized basis. Reserves and net write-offs related to uncollectible interest are recorded through provision for credit losses and are thus not included in the net interest yield calculation.
Net write-off rate — principal only — Represents the amount of proprietary consumer or small business Card Member loans or receivables written off, consisting of principal (resulting from authorized transactions), less recoveries, as a percentage of the average loan or receivable balance during the period.
Net write-off rate — principal, interest and fees — Includes, in the calculation of the net write-off rate, amounts for interest and fees in addition to principal for Card Member loans, and fees in addition to principal for Card Member receivables.
Network volumes — Represents the total of billed business and processed volumes.
Operating expenses — Represents salaries and employee benefits, professional services, data processing and equipment, and other expenses.
Other loans — Represents balances on non-card payment and financing products that are not associated with a Card Member agreement, and instead are governed by a separate borrowing relationship. Other loans consist primarily of consumer installment loans and lines of credit offered to small business customers.
Processed revenue — Represents revenues related to network partnership agreements, comprising royalties, fees and amounts earned for facilitating transactions on cards issued by network partners. Processed revenue also includes fees earned on alternative payment solutions facilitated by American Express.
Processed volumes — Represents transaction volumes (including cash advances) on cards issued under network partnership agreements with banks and other institutions, including joint ventures, as well as alternative payment solutions facilitated by American Express.
Proprietary new cards acquired — Represents the number of new cards issued by American Express during the referenced period, net of replacement cards. Proprietary new cards acquired is useful as a measure of the effectiveness of our customer acquisition strategy.
Reserve build (release) — Represents the portion of the provisions for credit losses for the period related to increasing or decreasing reserves for credit losses as a result of, among other things, changes in volumes, macroeconomic outlook, portfolio composition and credit quality of portfolios. Reserve build represents the amount by which the provision for credit losses exceeds net write-offs, while reserve release represents the amount by which net write-offs exceed the provision for credit losses.
T&E spend — Represents spend on travel and entertainment, which primarily includes airline, cruise, lodging and dining merchant categories.
CAUTIONARY NOTE REGARDING FORWARD-LOOKING STATEMENTS
This report includes forward-looking statements within the meaning of the Private Securities Litigation Reform Act of 1995, which are subject to risks and uncertainties. The forward-looking statements, which address our current expectations regarding business and financial performance, among other matters, contain words such as “believe,” “expect,” “anticipate,” “intend,” “plan,” “aim,” “will,” “may,” “should,” “could,” “would,” “likely,” “estimate,” “potential,” “continue” and similar expressions. Readers are cautioned not to place undue reliance on these forward-looking statements, which speak only as of the date on which they are made. We undertake no obligation to update or revise any forward-looking statements. Factors that could cause actual results to differ materially from these forward-looking statements, include, but are not limited to, the following:
•our ability to grow earnings per share in the future, which will depend in part on revenue growth, credit performance and the effective tax rate remaining consistent with current expectations and our ability to continue investing at high levels in areas that can drive sustainable growth (including our brand, value propositions, coverage, marketing, technology and talent), controlling operating expenses, effectively managing risk and executing our share repurchase program, any of which could be impacted by, among other things, the factors identified in the subsequent paragraphs as well as the following: macroeconomic conditions, higher rates of unemployment, changes in interest rates, effects of inflation, tariffs, supply chain issues, energy costs and fiscal and monetary policies; geopolitical instability, hostilities and tensions, such as involving China and the United States; the impact of any future contingencies, including, but not limited to, legal costs and settlements, the imposition of fines or monetary penalties, increases in Card Member remediation, investment gains or losses, restructurings, impairments and changes in reserves; issues impacting brand perceptions and our reputation; impacts related to acquisitions, cobrand and other partner agreements, portfolio sales and joint ventures; and the impact of regulation and litigation, which may be heightened due to the uncertain regulatory environment and could affect the profitability of our business activities, limit our ability to pursue business opportunities, require changes to business practices or alter our relationships with Card Members, partners and merchants;
•our ability to grow revenues net of interest expense and the sustainability of our future growth, which could be impacted by, among other things, the factors identified above and in the subsequent paragraphs, as well as the following: spending volumes and the spending environment not being consistent with expectations, including a decline in spending by U.S. small and mid-sized enterprise Card Members or slowdowns in U.S. consumer or international spending volumes; an inability to address competitive pressures, attract and retain customers, invest in and enhance our Membership Model of premium products, differentiated services and partnerships, successfully refresh our card products, grow spending and lending with customers across age cohorts, including Millennial and Gen Z customers, and implement strategies and business initiatives, including within the premium consumer space, commercial payments and the global network; the effects of regulatory initiatives, including pricing and network regulation; merchant coverage growing less than expected or the reduction of merchant acceptance or the perception of coverage; increased surcharging, steering, suppression or differential acceptance of our products; merchant discount rates changing from our expectations; and changes in foreign currency exchange rates;
•net card fees not performing consistently with expectations, which could be impacted by, among other things, a decrease in the ability and desire of Card Members to pay card fees, such as due to a deterioration in macroeconomic conditions; higher Card Member attrition rates; the pace of Card Member acquisition activity and demand for our fee-based products; and our inability to address competitive pressures, develop attractive premium value propositions and implement our strategy of refreshing card products and realize our anticipated growth from those refreshes, enhancing and delivering benefits and services and continuing to innovate with respect to our products;
•net interest income, the effects of changes in interest rates and the growth of loans and Card Member receivables outstanding and revolving balances, being higher or lower than expectations, which could be impacted by, among other things, the behavior and financial strength of Card Members and their actual spending, borrowing and paydown patterns; the effectiveness of our strategies to enhance Card Member value propositions, capture a greater share of Card Members’ spending and borrowings and attract new, and retain existing, customers; our ability to effectively manage underwriting risk; changes in benchmark interest rates, including where such changes affect our assets or liabilities differently than expected; changes in capital and credit market conditions and the availability and cost of capital; credit actions, including line size and other adjustments to credit availability; the yield on Card Member loans not remaining consistent with current expectations; and our deposit levels or the interest rates we offer on deposits changing from current expectations; loss or impacts to cobrand relationships; and governmental actions to cap interest rates;
•future credit performance, the level of future delinquency, reserve and write-off rates and the amount and timing of future reserve builds and releases, which will depend in part on macroeconomic factors such as unemployment rates, GDP and the volume of bankruptcies; the ability and willingness of Card Members to pay amounts owed to us; changes in loans and receivables outstanding, such as from the implementation of our strategy to capture spending and borrowings, or from changes in consumer behavior that affect loan and receivable balances (e.g., paydown and revolve rates); changes in the levels of customer acquisitions and the credit profiles of new customers acquired; the enrollment in, and effectiveness of, financial relief programs and the performance of accounts as they exit from such programs; the impact of the usage of debt settlement companies; and collections capabilities and recoveries of previously written-off loans and receivables;
•the actual amount to be spent on Card Member rewards and services and business development, and the relationship of these variable customer engagement costs to revenues, which could be impacted by continued changes in macroeconomic conditions and Card Member behavior as it relates to their spending patterns (including the level of spend in bonus categories), the redemption of rewards and offers (including travel redemptions) and usage of travel-related benefits; the costs related to reward point redemptions; further enhancements to our rewards programs and product benefits, including to make them attractive to Card Members and prospective customers, potentially in a manner that is not cost-effective; new and renegotiated contractual obligations with business partners, which may be affected by business partners with greater scale and leverage; our ability to identify and negotiate partner-funded value for Card Members; and the pace and cost of the expansion of our global lounge collection;
•the actual amount we spend on marketing in the future and the effectiveness and efficiency of our marketing spend, which will be based in part on continued changes in the macroeconomic and competitive environment and business performance, including the levels of demand for our products; management’s decisions regarding the timing of spending on marketing and the effectiveness of management’s investment optimization process, management’s identification and assessment of attractive investment opportunities; management’s ability to develop premium value propositions and drive customer demand, including continued customer spend growth and retention; the receptivity of Card Members and prospective customers to advertising and customer acquisition initiatives; and our ability to realize marketing efficiencies and balance expense control and investments in the business;
•our ability to control operating expenses, including relative to revenue growth, and the actual amount we spend on operating expenses in the future, which could be impacted by, among other things, salary and benefit expenses to attract and retain talent; our ability to realize operational efficiencies, including through increased scale and automation and continued adoption of artificial intelligence technologies; management’s decisions regarding spending in such areas as technology, business and product development, sales force, premium servicing and digital capabilities; our ability to innovate efficient channels of customer interactions and the willingness of Card Members to self-service and address issues through digital channels; restructuring activity; fraud costs; inflation; supply chain issues; expenses related to control management and compliance and consulting, legal and other professional services fees, including as a result of litigation or internal and regulatory reviews; regulatory assessments; the level of M&A activity and related expenses; information security or cybersecurity incidents; the payment of fines, penalties, disgorgement, restitution, non-income tax assessments and litigation-related settlements; the performance of Amex Ventures and other of our investments; impairments of goodwill or other assets; and the impact of changes in foreign currency exchange rates on costs;
•our tax rate not remaining consistent with expectations, which could be impacted by, among other things, further changes in tax laws and regulation (or the expiration of provisions of tax laws or regulations), the implementation of the OECD’s global minimum tax guidelines by jurisdictions, our geographic mix of income, unfavorable tax audits, assessments and tax litigation outcomes;
•changes affecting our plans regarding the return of capital to shareholders, including increasing the level of the dividend, which will depend on factors such as our capital levels and regulatory capital ratios; the results of our stress testing and capital planning process and new rulemakings and guidance from the Federal Reserve and other banking regulators, including changes to regulatory capital requirements, such as from the U.S. federal bank regulatory agencies’ Basel III rulemaking; our results of operations and financial condition; our credit ratings and rating agency considerations; required company approvals; and the economic environment and market conditions in any given period;
•changes in the substantial and increasing worldwide competition in the payments industry, including competitive pressure and competitor settlements and mergers that may materially impact the prices charged to merchants that accept American Express cards; surcharging, steering and suppression by merchants and merchant acceptance; the desirability of our premium card products; competition for new and existing cobrand relationships; competition from new and non-traditional competitors, and with respect to new products, services and technologies, such as the emergence or increase in popularity of alternative payment mechanisms; and the success of marketing, promotion and rewards programs;
•our ability to expand our leadership in the premium consumer space, including with Millennial and Gen-Z consumers, which will be impacted in part by competition, brand perceptions (including perceptions related to merchant coverage) and reputation, and our ability to develop and market new benefits and value propositions that appeal to Card Members and new customers, grow spending with new and younger age cohort Card Members, offer attractive services and rewards programs and build greater customer loyalty, which will depend in part on identifying and funding investment opportunities, addressing changing customer behaviors, new product innovation and development, Card Member acquisition efforts and enrollment processes, including through digital channels, continuing to realize the benefits from strategic partnerships, successfully implementing our dining strategy and evolving our infrastructure to support new products, services and benefits;
•our ability to build on our leadership in commercial payments, which will depend in part on competition; the willingness and ability of companies to use credit and charge cards for procurement and other business expenditures as well as use our other products and services for financing needs; perceived or actual difficulties and costs related to setting up B2B payment platforms; our ability to offer attractive value propositions and new products to current and potential customers; our ability to enhance and expand our payment, lending and cash flow management solutions, increase customer engagement, and build out a multi-product digital ecosystem to integrate our broad product set, which is dependent on our continued investment in capabilities, features, functionalities, platforms and technologies; and the success of our initiatives to support businesses, such as Small Business Saturday and other Shop Small campaigns;
•our ability to expand merchant coverage globally and our success, as well as the success of third-party merchant acquirers, aggregators and processors, in signing merchants to accept American Express, which will depend on, among other factors, the value propositions offered to merchants and merchant acquirers for card acceptance, the awareness and willingness of Card Members to use American Express cards at merchants, scaling marketing and expanding programs to increase card usage, identifying and growing acceptance in low- and new-to-plastic industries and businesses as they form, working with commercial buyers and suppliers to establish B2B acceptance, executing on our plans to increase coverage in priority international cities, destinations, countries and industry verticals, and continued network investments, including in capabilities that allow for greater digital integration and modernization of our authorization platform;
•our ability to successfully invest in, benefit from and expand the use of technological developments, digital payments, servicing and travel solutions and other technological capabilities, which will depend in part on our success in evolving our products and processes for the digital environment, developing new features in the Amex® app and enhancing our digital channels, effectively utilizing data and data platforms, building partnerships and executing programs with other companies, effectively utilizing artificial intelligence and machine learning and increasing automation, including to address servicing and other business and customer needs, and supporting the use of our products as a means of payment through online and mobile channels, all of which will be impacted by investment levels, customer and colleague receptiveness and ability to adopt new technologies, new product innovation and development and the platforms and infrastructure to support new products, services, benefits and partner integrations;
•our ability to grow internationally, which could be impacted by regulation and business practices, such as those capping interchange or other fees, mandating network access or data localization, favoring local competitors or prohibiting or limiting foreign ownership of certain businesses; our inability to successfully replicate aspects of our business model internationally and tailor products and services to make them attractive to local customers; competitors with more scale, local experience and established relationships with relevant customers, regulators and industry participants; the success of us and our network partners in acquiring Card Members and/or merchants; and political or economic instability or regional hostilities;
•our ability to successfully implement our dining strategy and grow our dining platform, which will depend in part on our ability to grow the number of diners, restaurants and other bookable venues using the platform and transactions on the platform; expand and innovate in the tools and capabilities offered through the platform, including integrating the Tock and Rooam acquisitions and benefiting from their added capabilities, users and/or bookable venues; successfully compete with other dining platforms and means of booking venues; and effectively utilize our dining platform to provide value to Card Members and merchants and sell our products and services;
•a failure in or breach of our operational or security systems, processes or infrastructure, or those of third parties, including as a result of cyberattacks or outages, which could compromise the confidentiality, integrity, privacy and/or security of data, disrupt our operations, reduce the use and acceptance of American Express cards and lead to regulatory scrutiny, litigation, remediation and response costs, and reputational harm;
•changes in capital and credit market conditions, which may significantly affect our ability to meet our liquidity needs and expectations regarding capital ratios; our access to capital and funding costs; the valuation of our assets; and our credit ratings or those of our subsidiaries;
•our funding plan being implemented in a manner inconsistent with current expectations, which will depend on various factors such as future business growth, the impact of global economic, political and other events on market capacity, demand for securities we offer, regulatory changes, our ability to securitize and sell loans and receivables and the performance of loans and receivables previously sold in securitization transactions;
•our ability to achieve our climate-related goals, which depend in part on the amount and efficacy of our investments in emissions reduction projects, the ability of our partners to set and achieve sustainability targets, the success of our supply chain and sustainability initiatives, and colleague programs; customer preferences and behaviors; the cost and availability of renewable energy, carbon removal and carbon offset projects and energy attribute certificates; changes in our real estate, technology and colleague strategies or an inability to execute those strategies; and brand perceptions and reputation;
•legal and regulatory developments, which could affect the profitability of our business activities; limit our ability to pursue business opportunities or conduct business in certain jurisdictions; require changes to business practices or governance, or alter our relationships with Card Members, partners, merchants and other third parties, including affecting our network operations and practices governing merchant acceptance, as well as our ability to continue certain cobrand relationships in the EU; impact card fees and rewards programs; exert further pressure on merchant discount rates and our network business, as well as result in an increase in surcharging, steering or other differential acceptance practices; alter the competitive landscape; subject us to heightened regulatory scrutiny and result in increased costs related to regulatory oversight and compliance, litigation-related settlements, judgments or expenses, restitution to Card Members or the imposition of fines or monetary penalties; materially affect capital or liquidity requirements, results of operations or ability to pay dividends; or result in harm to the American Express brand;
•changes in the financial condition and creditworthiness of our business partners, such as bankruptcies, restructurings or consolidations, including of cobrand partners, merchants that represent a significant portion of our business, network partners or financial institutions that we rely on for routine funding and liquidity, which could materially affect our financial condition or results of operations; and
•factors beyond our control such as global economic and business conditions, consumer and business spending generally, unemployment rates, geopolitical conditions, including resulting from recent political developments or further escalations or widening of ongoing military conflicts and regional hostilities, adverse developments affecting third parties, including other financial institutions, merchants or vendors, as well as severe weather conditions and natural disasters (e.g., hurricanes and wildfires), power loss, disruptions in telecommunications, pandemics, terrorism and other catastrophic events, any of which could significantly affect demand for and spending on American Express cards, delinquency rates, loan and receivable balances, deposit levels, foreign exchange rates and other aspects of our business and results of operations or disrupt our global network systems and ability to process transactions.
A further description of these uncertainties and other risks can be found in “Risk Factors” and our other reports filed with the SEC.
ITEM 7A. QUANTITATIVE AND QUALITATIVE DISCLOSURES ABOUT MARKET RISK
Refer to “Risk Management” under “MD&A” for quantitative and qualitative disclosures about market risk.
ITEM 8. FINANCIAL STATEMENTS AND SUPPLEMENTARY DATA
MANAGEMENT’S REPORT ON INTERNAL CONTROL OVER FINANCIAL REPORTING
Our management is responsible for establishing and maintaining adequate internal control over financial reporting.
Our internal control over financial reporting is a process designed to provide reasonable assurance regarding the reliability of financial reporting and the preparation of financial statements for external purposes in accordance with accounting principles generally accepted in the United States of America (GAAP), and includes those policies and procedures that:
•Pertain to the maintenance of records that, in reasonable detail, accurately and fairly reflect our transactions and dispositions of assets;
•Provide reasonable assurance that transactions are recorded as necessary to permit preparation of financial statements in accordance with GAAP and that our receipts and expenditures are being made only in accordance with authorizations of our management and directors; and
•Provide reasonable assurance regarding prevention or timely detection of unauthorized acquisition, use or disposition of our assets that could have a material effect on the financial statements.
Because of its inherent limitations, internal control over financial reporting may not prevent or detect misstatements. Also, projections of any evaluation of effectiveness to future periods are subject to the risk that controls may become inadequate because of changes in conditions, or that the degree of compliance with the policies or procedures may deteriorate.
Our management assessed the effectiveness of our internal control over financial reporting as of December 31, 2024. In making this assessment, our management used the criteria set forth by the Committee of Sponsoring Organizations of the Treadway Commission (COSO) in Internal Control —Integrated Framework (2013).
Based on management’s assessment and those criteria, we conclude that, as of December 31, 2024, our internal control over financial reporting is effective.
PricewaterhouseCoopers LLP, our independent registered public accounting firm, has issued an audit report appearing on the following page on the effectiveness of our internal control over financial reporting as of December 31, 2024.
REPORT OF INDEPENDENT REGISTERED PUBLIC ACCOUNTING FIRM
To the Board of Directors and Shareholders of American Express Company
Opinions on the Financial Statements and Internal Control over Financial Reporting
We have audited the accompanying consolidated balance sheets of American Express Company and its subsidiaries (the “Company”) as of December 31, 2024 and 2023, and the related consolidated statements of income, of comprehensive income, of shareholders’ equity and of cash flows for each of the three years in the period ended December 31, 2024, including the related notes (collectively referred to as the “consolidated financial statements”). We also have audited the Company’s internal control over financial reporting as of December 31, 2024, based on criteria established in Internal Control - Integrated Framework (2013) issued by the Committee of Sponsoring Organizations of the Treadway Commission (COSO).
In our opinion, the consolidated financial statements referred to above present fairly, in all material respects, the financial position of the Company as of December 31, 2024 and 2023, and the results of its operations and its cash flows for each of the three years in the period ended December 31, 2024 in conformity with accounting principles generally accepted in the United States of America. Also in our opinion, the Company maintained, in all material respects, effective internal control over financial reporting as of December 31, 2024, based on criteria established in Internal Control - Integrated Framework (2013) issued by the COSO.
Basis for Opinions
The Company’s management is responsible for these consolidated financial statements, for maintaining effective internal control over financial reporting, and for its assessment of the effectiveness of internal control over financial reporting, included in the accompanying Management’s Report on Internal Control over Financial Reporting. Our responsibility is to express opinions on the Company’s consolidated financial statements and on the Company’s internal control over financial reporting based on our audits. We are a public accounting firm registered with the Public Company Accounting Oversight Board (United States) (PCAOB) and are required to be independent with respect to the Company in accordance with the U.S. federal securities laws and the applicable rules and regulations of the Securities and Exchange Commission and the PCAOB.
We conducted our audits in accordance with the standards of the PCAOB. Those standards require that we plan and perform the audits to obtain reasonable assurance about whether the consolidated financial statements are free of material misstatement, whether due to error or fraud, and whether effective internal control over financial reporting was maintained in all material respects.
Our audits of the consolidated financial statements included performing procedures to assess the risks of material misstatement of the consolidated financial statements, whether due to error or fraud, and performing procedures that respond to those risks. Such procedures included examining, on a test basis, evidence regarding the amounts and disclosures in the consolidated financial statements. Our audits also included evaluating the accounting principles used and significant estimates made by management, as well as evaluating the overall presentation of the consolidated financial statements. Our audit of internal control over financial reporting included obtaining an understanding of internal control over financial reporting, assessing the risk that a material weakness exists, and testing and evaluating the design and operating effectiveness of internal control based on the assessed risk. Our audits also included performing such other procedures as we considered necessary in the circumstances. We believe that our audits provide a reasonable basis for our opinions.
Definition and Limitations of Internal Control over Financial Reporting
A company’s internal control over financial reporting is a process designed to provide reasonable assurance regarding the reliability of financial reporting and the preparation of financial statements for external purposes in accordance with generally accepted accounting principles. A company’s internal control over financial reporting includes those policies and procedures that (i) pertain to the maintenance of records that, in reasonable detail, accurately and fairly reflect the transactions and dispositions of the assets of the company; (ii) provide reasonable assurance that transactions are recorded as necessary to permit preparation of financial statements in accordance with generally accepted accounting principles, and that receipts and expenditures of the company are being made only in accordance with authorizations of management and directors of the company; and (iii) provide reasonable assurance regarding prevention or timely detection of unauthorized acquisition, use, or disposition of the company’s assets that could have a material effect on the financial statements.
Because of its inherent limitations, internal control over financial reporting may not prevent or detect misstatements. Also, projections of any evaluation of effectiveness to future periods are subject to the risk that controls may become inadequate because of changes in conditions, or that the degree of compliance with the policies or procedures may deteriorate.
Critical Audit Matters
The critical audit matters communicated below are matters arising from the current period audit of the consolidated financial statements that were communicated or required to be communicated to the audit committee and that (i) relate to accounts or disclosures that are material to the consolidated financial statements and (ii) involved our especially challenging, subjective, or complex judgments. The communication of critical audit matters does not alter in any way our opinion on the consolidated financial statements, taken as a whole, and we are not, by communicating the critical audit matters below, providing separate opinions on the critical audit matters or on the accounts or disclosures to which they relate.
Reserves for Credit Losses on Card Member Loans
As described in Note 3 to the consolidated financial statements, reserves for credit losses on Card Member loans represent management’s estimate of the expected credit losses in the Company’s outstanding portfolio of Card Member loans as of the balance sheet date. The reserves for credit losses on Card Member loans was $5.7 billion as of December 31, 2024. Management estimates lifetime expected credit losses by incorporating historical loss experience, as well as current and future economic conditions over a reasonable and supportable period (R&S Period) beyond the balance sheet date. As disclosed by management, in estimating expected credit losses, management uses a combination of statistically-based models that entail a significant amount of judgment. The primary areas of judgment used in measuring the quantitative components of the Company’s reserves relate to the determination of the appropriate R&S Period, the modeling of the probability of and exposure at default, and the methodology to incorporate current and future economic conditions. Management uses these models and assumptions, combined with historical loss experience, to determine the reserve rates that are applied to the outstanding loan balances to produce its reserves for expected credit losses. Within the R&S Period, the Company’s models use past loss experience and current and future economic conditions to estimate the probability of default, exposure at default and expected recoveries to estimate net losses at default. Beyond the R&S Period, expected credit losses are estimated by immediately reverting to long-term average loss rates. Management also estimates the likelihood and magnitude of recovery of previously written off loans considering how long ago the loan was written off and future economic conditions. Additionally, management evaluates whether to include qualitative reserves to cover losses that are expected but may not be adequately represented in the quantitative methods or the economic assumptions. The qualitative reserves address possible limitations within the models or factors not included within the models, such as external conditions, emerging portfolio trends, the nature and size of the portfolio, portfolio concentrations, the volume and severity of past due accounts, or management risk actions.
The principal considerations for our determination that performing procedures relating to the reserves for credit losses on Card Member loans is a critical audit matter are (i) the estimate of the reserves for credit losses on Card Member loans involved significant judgment by management, which in turn led to a high degree of auditor judgment, subjectivity and effort in performing procedures and evaluating audit evidence relating to the models, significant inputs, qualitative reserves, and significant assumptions, including the R&S Period and the loss rates used to estimate expected credit losses beyond the R&S Period and (ii) the audit effort involved the use of professionals with specialized skill and knowledge.
Addressing the matter involved performing procedures and evaluating audit evidence in connection with forming our overall opinion on the consolidated financial statements. These procedures included testing the effectiveness of controls relating to the reserves for credit losses on Card Member loans. These procedures also included, among others, testing management’s process for estimating the reserves for credit losses on Card Member loans through (i) evaluating the appropriateness of management’s methodology, (ii) testing the completeness and accuracy of significant inputs and (iii) evaluating the reasonableness of certain qualitative reserves and significant assumptions used to estimate the reserves. Professionals with specialized skill and knowledge were used to assist in evaluating the appropriateness of management’s methodology and the reasonableness of certain qualitative reserves and certain significant assumptions, including the R&S Period and the loss rates used to estimate expected credit losses beyond the R&S Period.
Membership Rewards Liability
As described in Note 9 to the consolidated financial statements, the Membership Rewards liability represents management’s estimate of the cost of Membership Rewards points earned that are expected to be redeemed in the future. The Membership Rewards liability was $14.8 billion as of December 31, 2024. The weighted average cost (WAC) per point and the Ultimate Redemption Rate (URR) are key assumptions used to estimate the liability. As disclosed by management, the URR assumption is used by management to estimate the number of points earned that will ultimately be redeemed in future periods. Management uses statistical and actuarial models to estimate the URR based on redemption trends, card product type, enrollment tenure, card spend levels and credit attributes. The WAC per point assumption is derived from 12 months of redemptions and is adjusted as appropriate for certain changes in redemption costs that are not representative of future cost expectations and expected developments in redemption patterns.
The principal considerations for our determination that performing procedures relating to the Membership Rewards liability is a critical audit matter are (i) the estimate of the URR involved significant judgment by management, which in turn led to a high degree of auditor judgment, subjectivity and effort in performing procedures and evaluating the audit evidence relating to the models, significant inputs and assumptions used by management and (ii) the audit effort involved the use of professionals with specialized skill and knowledge.
Addressing the matter involved performing procedures and evaluating audit evidence in connection with forming our overall opinion on the consolidated financial statements. These procedures included testing the effectiveness of controls relating to the estimate of the Membership Rewards liability, including the URR and WAC assumptions. These procedures also included, among others, (i) testing the completeness and accuracy of significant inputs to the statistical and actuarial models used to estimate the URR assumption, including redemption trends, card product type, enrollment tenure, and card spend levels, (ii) the involvement of professionals with specialized skill and knowledge to assist in developing an independent estimate of the URR assumption and comparing the independent estimate to management’s assumption to evaluate its reasonableness and (iii) comparing our independently calculated Membership Rewards liability to management’s estimate.
/s/ PricewaterhouseCoopers LLP
New York, New York
February 7, 2025
We have served as the Company’s auditor since 2005.
INDEX TO CONSOLIDATED FINANCIAL STATEMENTS
CONSOLIDATED STATEMENTS OF INCOME | | | | | | | | | | | | | | | | | | | | |
Year Ended December 31 (Millions, except per share amounts) | | 2024 | | 2023 | | 2022 |
| Revenues | | | | | | |
| Non-interest revenues | | | | | | |
| Discount revenue | | $ | 35,192 | | | $ | 33,416 | | | $ | 30,739 | |
| Net card fees | | 8,449 | | | 7,255 | | | 6,070 | |
| Service fees and other revenue | | 5,129 | | | 5,005 | | | 4,521 | |
| Processed revenue | | 1,636 | | | 1,705 | | | 1,637 | |
| Total non-interest revenues | | 50,406 | | | 47,381 | | | 42,967 | |
| Interest income | | | | | | |
| Interest on loans | | 21,095 | | | 17,697 | | | 11,967 | |
| Interest and dividends on investment securities | | 86 | | | 128 | | | 96 | |
| Deposits with banks and other | | 2,614 | | | 2,158 | | | 595 | |
| Total interest income | | 23,795 | | | 19,983 | | | 12,658 | |
| Interest expense | | | | | | |
| Deposits | | 5,695 | | | 4,865 | | | 1,527 | |
| Long-term debt and other | | 2,557 | | | 1,984 | | | 1,236 | |
| Total interest expense | | 8,252 | | | 6,849 | | | 2,763 | |
| Net interest income | | 15,543 | | | 13,134 | | | 9,895 | |
| Total revenues net of interest expense | | 65,949 | | | 60,515 | | | 52,862 | |
| Provisions for credit losses | | | | | | |
| Card Member receivables | | 774 | | | 880 | | | 627 | |
| Card Member loans | | 4,109 | | | 3,839 | | | 1,514 | |
| Other | | 302 | | | 204 | | | 41 | |
| Total provisions for credit losses | | 5,185 | | | 4,923 | | | 2,182 | |
| Total revenues net of interest expense after provisions for credit losses | | 60,764 | | | 55,592 | | | 50,680 | |
| Expenses | | | | | | |
| Card Member rewards | | 16,599 | | | 15,367 | | | 14,002 | |
| Business development | | 5,886 | | | 5,657 | | | 4,943 | |
| Card Member services | | 4,782 | | | 3,968 | | | 2,959 | |
| Marketing | | 6,040 | | | 5,213 | | | 5,458 | |
| Salaries and employee benefits | | 8,198 | | | 8,067 | | | 7,252 | |
| Other, net | | 6,364 | | | 6,807 | | | 6,481 | |
| Total expenses | | 47,869 | | | 45,079 | | | 41,095 | |
| Pretax income | | 12,895 | | | 10,513 | | | 9,585 | |
| Income tax provision | | 2,766 | | | 2,139 | | | 2,071 | |
| Net income | | $ | 10,129 | | | $ | 8,374 | | | $ | 7,514 | |
Earnings per Common Share — (Note 21)(a) | | | | | | |
| Basic | | $ | 14.04 | | | $ | 11.23 | | | $ | 9.86 | |
| Diluted | | $ | 14.01 | | | $ | 11.21 | | | $ | 9.85 | |
| Average common shares outstanding for earnings per common share: | | | | | | |
| Basic | | 712 | | | 735 | | | 751 | |
| Diluted | | 713 | | | 736 | | | 752 | |
(a)Represents net income less (i) earnings allocated to participating share awards of $76 million, $64 million and $57 million for the years ended December 31, 2024, 2023 and 2022, respectively, and (ii) dividends on preferred shares of $58 million, $58 million and $57 million for the years ended December 31, 2024, 2023 and 2022, respectively.
See Notes to Consolidated Financial Statements.
CONSOLIDATED STATEMENTS OF COMPREHENSIVE INCOME | | | | | | | | | | | | | | | | | | | | |
Year Ended December 31 (Millions) | | 2024 | | 2023 | | 2022 |
| Net income | | $ | 10,129 | | | $ | 8,374 | | | $ | 7,514 | |
| Other comprehensive income (loss): | | | | | | |
| Net unrealized debt securities gains (losses), net of tax | | 5 | | | 50 | | | (87) | |
| Foreign currency translation adjustments, net of hedges and tax | | (353) | | | 51 | | | (230) | |
| Net unrealized pension and other postretirement benefits, net of tax | | 25 | | | 37 | | | 52 | |
| Other comprehensive income (loss) | | (323) | | | 138 | | | (265) | |
| Comprehensive income | | $ | 9,806 | | | $ | 8,512 | | | $ | 7,249 | |
See Notes to Consolidated Financial Statements.
CONSOLIDATED BALANCE SHEETS | | | | | | | | | | | | | | |
December 31 (Millions, except share data) | | 2024 | | 2023 |
| Assets | | | | |
| Cash and cash equivalents | | | | |
| Cash and due from banks (includes restricted cash of consolidated variable interest entities: 2024, $6; 2023, nil) | | $ | 3,413 | | | $ | 7,118 | |
| Interest-bearing deposits in other banks | | 37,006 | | | 39,312 | |
| Short-term investment securities (includes restricted investments of consolidated variable interest entities: 2024, $82; 2023, $66) | | 221 | | | 166 | |
| Total cash and cash equivalents (includes restricted cash: 2024, $427; 2023, $514) | | 40,640 | | | 46,596 | |
| Card Member receivables (includes gross receivables available to settle obligations of a consolidated variable interest entity: 2024, $3,927; 2023, $4,587), less reserves for credit losses: 2024, $171; 2023, $174 | | 59,240 | | | 60,237 | |
| | | | |
| Card Member loans (includes gross loans available to settle obligations of a consolidated variable interest entity: 2024, $28,278; 2023, $28,590), less reserves for credit losses: 2024, $5,679; 2023, $5,118 | | 133,995 | | | 120,877 | |
| Card Member loans held for sale | | 758 | | | — | |
| Other loans, less reserves for credit losses: 2024, $194; 2023, $126 | | 9,038 | | | 6,960 | |
| Investment securities | | 1,240 | | | 2,186 | |
| Premises and equipment, less accumulated depreciation and amortization: 2024, $10,739; 2023, $9,911 | | 5,371 | | | 5,138 | |
| Other assets, less reserves for credit losses: 2024, $27; 2023, $27 | | 21,179 | | | 19,114 | |
| Total assets | | $ | 271,461 | | | $ | 261,108 | |
| Liabilities and Shareholders’ Equity | | | | |
| Liabilities | | | | |
| Customer deposits | | $ | 139,413 | | | $ | 129,144 | |
| Accounts payable | | 13,884 | | | 13,109 | |
| Short-term borrowings | | 1,374 | | | 1,293 | |
| Long-term debt (includes debt issued by consolidated variable interest entities: 2024, $13,880; 2023, $13,426) | | 49,715 | | | 47,866 | |
| Other liabilities | | 36,811 | | | 41,639 | |
| Total liabilities | | $ | 241,197 | | | $ | 233,051 | |
| Contingencies and Commitments (Note 12) | | | | |
| Shareholders’ Equity | | | | |
Preferred shares, $1.662/3 par value, authorized 20 million shares; issued and outstanding 1,600 shares as of December 31, 2024 and 2023 (Note 16) | | — | | | — | |
| Common shares, $0.20 par value, authorized 3.6 billion shares; issued and outstanding 702 million shares as of December 31, 2024 and 723 million shares as of December 31, 2023 | | 141 | | | 145 | |
| Additional paid-in capital | | 11,370 | | | 11,372 | |
| Retained earnings | | 22,148 | | | 19,612 | |
| Accumulated other comprehensive income (loss) | | (3,395) | | | (3,072) | |
| Total shareholders’ equity | | 30,264 | | | 28,057 | |
| Total liabilities and shareholders’ equity | | $ | 271,461 | | | $ | 261,108 | |
See Notes to Consolidated Financial Statements.
CONSOLIDATED STATEMENTS OF CASH FLOWS | | | | | | | | | | | | | | | | | | | | |
Years Ended December 31 (Millions) | | 2024 | | 2023 | | 2022 |
| Cash Flows from Operating Activities | | | | | | |
| Net income | | $ | 10,129 | | | $ | 8,374 | | | $ | 7,514 | |
| Adjustments to reconcile net income to net cash provided by operating activities: | | | | | | |
| Provisions for credit losses | | 5,185 | | | 4,923 | | | 2,182 | |
| Depreciation and amortization | | 1,676 | | | 1,651 | | | 1,626 | |
| Stock-based compensation | | 504 | | | 450 | | | 375 | |
| Deferred taxes | | (990) | | | (1,329) | | | (1,189) | |
Other items (a) | | (564) | | | 664 | | | 365 | |
| Originations of loans held-for-sale | | — | | | (54) | | | (277) | |
| Proceeds from sales of loans held-for-sale | | — | | | 59 | | | 277 | |
| Changes in operating assets and liabilities, net of effects of acquisitions and dispositions: | | | | | | |
| Other assets | | 1,007 | | | (1,244) | | | 1,391 | |
| Accounts payable & other liabilities | | (2,897) | | | 5,065 | | | 8,815 | |
| Net cash provided by operating activities | | 14,050 | | | 18,559 | | | 21,079 | |
| Cash Flows from Investing Activities | | | | | | |
| Sale of investments | | 42 | | | 2 | | | 26 | |
| Maturities and redemptions of investments | | 2,179 | | | 3,888 | | | 1,892 | |
| Purchase of investments | | (1,593) | | | (1,572) | | | (4,175) | |
Net increase in loans and Card Member receivables, including Card Member loans held for sale (b)(c) | | (23,259) | | | (25,124) | | | (29,562) | |
| Purchase of premises and equipment, net of sales: 2024, $6; 2023, $2; 2022, $1 | | (1,911) | | | (1,563) | | | (1,855) | |
| Acquisitions, net of cash acquired | | (454) | | | (64) | | | (15) | |
| Dispositions, net of cash disposed | | 594 | | | — | | | — | |
| | | | | | |
| Net cash used in investing activities | | (24,402) | | | (24,433) | | | (33,689) | |
| Cash Flows from Financing Activities | | | | | | |
| Net increase in customer deposits | | 10,305 | | | 18,915 | | | 25,902 | |
Net increase (decrease) in short-term borrowings (c) | | 207 | | | (105) | | | (706) | |
| Proceeds from long-term debt | | 12,602 | | | 15,674 | | | 23,230 | |
| Payments of long-term debt | | (10,759) | | | (10,703) | | | (18,906) | |
| | | | | | |
| | | | | | |
| Issuance of American Express common shares | | 100 | | | 28 | | | 56 | |
| Repurchase of American Express common shares and other | | (6,020) | | | (3,650) | | | (3,502) | |
| Dividends paid | | (1,999) | | | (1,780) | | | (1,565) | |
| Net cash provided by financing activities | | 4,436 | | | 18,379 | | | 24,509 | |
| Effect of foreign currency exchange rates on cash and cash equivalents | | (40) | | | 177 | | | (13) | |
| Net (decrease) increase in cash and cash equivalents | | (5,956) | | | 12,682 | | | 11,886 | |
| Cash and cash equivalents at beginning of year | | 46,596 | | | 33,914 | | | 22,028 | |
| Cash and cash equivalents at end of year | | $ | 40,640 | | | $ | 46,596 | | | $ | 33,914 | |
(a)Primarily includes the gain recognized on the sale of Accertify (See Note 1), losses on tax credit investments, changes in reserves, net gains and losses on Amex Ventures investments, gains/losses on fair value hedges and changes in equity method investments.
(b)Includes Card Member loans held for sale (HFS) which were previously held for investment within Card Member loans and were reclassified on the Consolidated Balance Sheets effective December 1, 2024. Refer to Note 1 for additional information.
(c)Excludes an increase of $117 million related to non-cash activity during 2023.
Net income taxes paid during 2024, 2023 and 2022 were $3.6 billion, $3.3 billion and $3.0 billion, respectively, and interest paid primarily related to Debt and Customer deposits for the same periods were $8.2 billion, $6.4 billion and $2.2 billion, respectively.
See Notes to Consolidated Financial Statements.
CONSOLIDATED STATEMENTS OF SHAREHOLDERS’ EQUITY | | | | | | | | | | | | | | | | | | | | | | | | | | | | | | | | | | | | | | |
| (Millions, except per share amounts) | | Total | | Preferred Shares | | Common Shares | | Additional Paid-in
Capital | | Accumulated Other
Comprehensive
Income (Loss) | | Retained Earnings |
| Balances as of December 31, 2021 | | $ | 22,177 | | | $ | — | | | $ | 153 | | | $ | 11,495 | | | $ | (2,945) | | | $ | 13,474 | |
| Net income | | 7,514 | | | — | | | — | | | — | | | — | | | 7,514 | |
| Other comprehensive income (loss) | | (265) | | | — | | | — | | | — | | | (265) | | | — | |
| | | | | | | | | | | | |
| | | | | | | | | | | | |
| Repurchase of common shares | | (3,332) | | | — | | | (4) | | | (302) | | | — | | | (3,026) | |
| Other changes, including employee plans | | 242 | | | — | | | — | | | 300 | | | — | | | (58) | |
| Cash dividends declared preferred Series D, $35,993.05 per share | | (57) | | | — | | | — | | | — | | | — | | | (57) | |
| Cash dividends declared common, $2.08 per share | | (1,568) | | | — | | | — | | | — | | | — | | | (1,568) | |
| Balances as of December 31, 2022 | | 24,711 | | | — | | | 149 | | | 11,493 | | | (3,210) | | | 16,279 | |
| Net income | | 8,374 | | | — | | | — | | | — | | | — | | | 8,374 | |
| Other comprehensive income (loss) | | 138 | | | — | | | — | | | — | | | 138 | | | — | |
| | | | | | | | | | | | |
| | | | | | | | | | | | |
| Repurchase of common shares | | (3,519) | | | — | | | (4) | | | (334) | | | — | | | (3,181) | |
| Other changes, including employee plans | | 181 | | | — | | | — | | | 213 | | | — | | | (32) | |
| Cash dividends declared preferred Series D, $35,993.05 per share | | (58) | | | — | | | — | | | — | | | — | | | (58) | |
| Cash dividends declared common, $2.40 per share | | (1,770) | | | — | | | — | | | — | | | — | | | (1,770) | |
| Balances as of December 31, 2023 | | 28,057 | | | — | | | 145 | | | 11,372 | | | (3,072) | | | 19,612 | |
| Net income | | 10,129 | | | — | | | — | | | — | | | — | | | 10,129 | |
| Other comprehensive income (loss) | | (323) | | | — | | | — | | | — | | | (323) | | | — | |
| | | | | | | | | | | | |
| | | | | | | | | | | | |
| Repurchase of common shares | | (5,857) | | | — | | | (4) | | | (377) | | | — | | | (5,476) | |
| Other changes, including employee plans | | 315 | | | — | | | — | | | 375 | | | — | | | (60) | |
| Cash dividends declared preferred Series D, $36,288.88 per share | | (58) | | | — | | | — | | | — | | | — | | | (58) | |
| Cash dividends declared common, $2.80 per share | | (1,999) | | | — | | | — | | | — | | | — | | | (1,999) | |
| Balances as of December 31, 2024 | | $ | 30,264 | | | $ | — | | | $ | 141 | | | $ | 11,370 | | | $ | (3,395) | | | $ | 22,148 | |
See Notes to Consolidated Financial Statements.
NOTES TO CONSOLIDATED FINANCIAL STATEMENTS
NOTE 1
SUMMARY OF SIGNIFICANT ACCOUNTING POLICIES
THE COMPANY
We are a globally integrated payments company, providing customers with access to products, insights and experiences that enrich lives and build business success. Our various products and services are offered globally to consumers, small businesses, mid-sized companies and large corporations through various channels, including mobile and online applications, affiliate marketing, customer referral programs, third-party service providers and business partners, in-house sales teams, direct mail, telephone and direct response advertising.
Refer to Note 24 for additional discussion of the products and services that comprise each segment. Corporate functions and certain other businesses and operations are included in Corporate & Other.
BUSINESS EVENTS
On May 1, 2024, we completed the previously announced transaction to sell fraud prevention solutions provider Accertify, Inc. (Accertify), a wholly owned subsidiary we acquired in 2010, the operations of which were reported within the Global Merchant and Network Services (GMNS) segment. The transaction resulted in a gain of $531 million ($479 million after tax), which was reported as a reduction to Other expense in the second quarter of 2024. Prior to the completion of the transaction, the carrying amount of Accertify’s net assets were not material to the Company’s financial position.
PRINCIPLES OF CONSOLIDATION
The Consolidated Financial Statements are prepared in conformity with accounting principles generally accepted in the United States of America (GAAP). Significant intercompany transactions are eliminated.
We consolidate entities in which we hold a “controlling financial interest.” For voting interest entities, we are considered to hold a controlling financial interest when we are able to exercise control over the investees’ operating and financial decisions. For variable interest entities (VIEs), the determination of which is based on the amount and characteristics of the entity’s equity, we are considered to hold a controlling financial interest when we are determined to be the primary beneficiary. A primary beneficiary is the party that has both: (1) the power to direct the activities that most significantly impact that VIE’s economic performance, and (2) the obligation to absorb the losses of, or the right to receive the benefits from, the VIE that could potentially be significant to that VIE.
Entities in which our voting interest in common equity does not provide it with control, but allows us to exert significant influence over operating and financial decisions, are accounted for under the equity method. We also have investments in equity securities where our voting interest is below the level of significant influence, including investments that we make in non-public companies in the ordinary course of business. Such investments are initially recorded at cost and adjusted to fair value through earnings for observable price changes in orderly transactions for identical or similar instruments of the same company or if they are determined to be impaired. See Note 4 for the accounting policy for our marketable equity securities.
FOREIGN CURRENCY
Transactions conducted in currencies other than the applicable functional currency of an entity are converted to the functional currency at the exchange rate on the transaction date. At the period end, monetary assets and liabilities are remeasured to the functional currency using period end rates. The resulting transaction gains and losses are recorded in Other, net expenses in the Consolidated Statements of Income.
For subsidiaries where the functional currency is not the U.S. dollar, the monetary assets and liabilities and results of operations are translated for consolidation purposes into U.S. dollars at period-end rates for monetary assets and liabilities and generally at average rates for results of operations. The resulting translation adjustments, along with any related qualifying hedge and tax effects, are included in accumulated other comprehensive income (loss) (AOCI), a component of shareholders’ equity. Translation adjustments, including qualifying hedge and tax effects, are reclassified to earnings upon the sale or substantial liquidation of investments in foreign operations.
AMOUNTS BASED ON ESTIMATES AND ASSUMPTIONS
Accounting estimates are an integral part of the Consolidated Financial Statements. These estimates are based, in part, on management’s assumptions concerning future events. Among the more significant assumptions are those that relate to reserves for Card Member credit losses on loans and receivables, Membership Rewards liability, goodwill and income taxes. These accounting estimates reflect the best judgment of management, but actual results could differ.
INCOME STATEMENT
Revenue is recognized when obligations under the terms of a contract with our customers are satisfied. We have elected to not disclose revenue that is expected to be recognized in future periods related to contracts with variable consideration (e.g., discount revenue). Non-interest revenue expected to be recognized in future periods related to all other contracts with customers is not material.
Payments made pursuant to contractual arrangements with our merchants, network partners and other customers are classified as contra-revenue, except where we receive goods, services or other benefits for which the fair value is determinable and measurable, in which case they are recorded as expense.
Discount Revenue
Discount revenue primarily represents the amount we earn and retain from the merchant payable for facilitating transactions between Card Members and merchants on payment products issued by American Express. The amount of fees charged for accepting our cards as payment, or merchant discount, varies with, among other factors, the industry in which the merchant conducts business, the merchant’s overall American Express-related transaction volume, the method of payment, the settlement terms with the merchant, the method of submission of transactions and, in certain instances, the geographic scope of the card acceptance agreement between the merchant and us (e.g., local or global) and the transaction amount. Discount revenue is generally recorded at the time the Card Member transaction occurs.
Card acceptance agreements, which include the agreed-upon terms for charging the merchant discount fee, vary in duration. Our contracts with small- and mid-sized merchants generally have no fixed contractual duration, while those with large merchants are generally for fixed periods, which typically range from three to seven years in duration. Our fixed-period agreements may include auto-renewal features, which may allow the existing terms to continue beyond the stated expiration date until a new agreement is reached. We satisfy our obligations under these agreements over the contract term, often on a daily basis, including through the processing of Card Member transactions and the availability of our payment network.
In cases where the merchant acquirer is a third party, we receive a network rate fee in our settlement with the merchant acquirer, which is negotiated between us and that merchant acquirer and is recorded as discount revenue at the time the Card Member transaction occurs.
Net Card Fees
Net card fees represent revenue earned from annual card membership fees, which vary based on the type of card and the number of cards for each account. These fees, net of qualifying acquisition costs and a reserve for projected refunds for Card Member cancellations, are deferred and recognized on a straight-line basis over the twelve-month card membership period as Net card fees in the Consolidated Statements of Income and are therefore more stable in relation to short term business or economic shifts. The unamortized net card fee balance is reported in Other liabilities on the Consolidated Balance Sheets.
Service Fees and Other Revenue
Service fees and other revenue includes service fees earned from merchants and other customers and travel commissions and fees, which are generally recognized in the period when the service is performed, and delinquency and foreign currency-related fees, which are primarily recognized in the period when they are charged to the Card Member. In addition, Service fees and other revenue includes income (losses) from our investments in which we have significant influence and therefore account for under the equity method. Refer to Note 18 for additional information.
Processed Revenue
Processed revenue primarily represents revenues related to network partnership agreements, comprising royalties, fees and amounts earned for facilitating transactions on cards issued by network partners. In our role as the operator of the American Express network, we settle with merchants and our third-party merchant acquirers on behalf of our network card issuing partners. The amount of fees charged for accepting American Express-branded cards is generally deducted from the payment to the merchant or third-party merchant acquirer and recorded as Processed revenue at the time the Card Member transaction occurs. Our network card issuing partners receive an issuer rate that is individually negotiated between that issuer and us and is recorded as contra-revenue within Processed revenue to the extent that there is revenue from the same customer, after which any additional issuer rate is recorded as expense in Business development.
Interest Income
Interest on Card Member loans is assessed using the average daily balance method. Unless the loan is classified as non-accrual, interest is recognized based upon the principal amount outstanding, in accordance with the terms of the applicable account agreement, until the outstanding balance is paid, or written off.
Interest and dividends on investment securities primarily relate to our performing fixed-income securities. Interest income is recognized as earned using the effective interest method, which adjusts the yield for security premiums and discounts, fees and other payments, so that a constant rate of return is recognized on the investment security’s outstanding balance. Amounts are recognized until securities are in default or when it becomes likely that future interest payments will not be made as scheduled.
Interest on deposits with banks and other is recognized as earned, and primarily relates to the placement of cash, in excess of near-term funding requirements, in interest-bearing time deposits, overnight sweep accounts, and other interest-bearing demand and call accounts.
Interest Expense
Interest expense includes interest incurred primarily to fund Card Member loans and receivables, general corporate purposes and liquidity needs, and is recognized as incurred. Interest expense is divided principally into two categories: (i) deposits, which primarily relates to interest expense on deposits taken from customers and institutions and (ii) debt, which primarily relates to interest expense on our long-term debt and short-term borrowings, as well as the realized impact of derivatives used to hedge interest rate risk on our long-term debt.
Card Member Rewards
We issue credit, charge and debit cards that allow Card Members to participate in various rewards programs (e.g., Membership Rewards, cash back and cobrand). Rewards expense is recognized in the period Card Members earn rewards, generally by spending on their enrolled card products. For Membership Rewards and cash back, we record a liability that represents the rewards that are expected to be redeemed, as well as, for Membership Rewards, the estimated cost of points earned. For cobrand, we record a liability based primarily on rewards earned on Card Member spending on cobrand cards, and make associated payments to our cobrand partners. The partner is liable for providing rewards to the Card Member under the cobrand partner’s own loyalty program. Card Member rewards liabilities are impacted over time by enrollment levels, attrition, the volume of points earned and redeemed, and the associated redemption costs. Changes in the Card Member rewards liabilities during the period are recorded as an increase or decrease to the Card Member rewards expense in the Consolidated Statements of Income.
Business Development
Business development expense includes payments to our cobrand partners, corporate client incentive payments earned on achievement of pre-set targets and certain payments to network partners. These costs are generally expensed as incurred.
Card Member Services
Card Member services expense represents costs incurred in providing our Card Members with various value-added benefits and services, which are generally expensed as incurred.
Marketing
Marketing expense includes the cost of promotional activities to attract, engage and retain customers. Customer acquisition activities include initiatives such as welcome offers, where bonus points or statement credits are issued for the purpose of incentivizing Card Members to apply for a new product and are awarded either on acquisition or upon the Card Member achieving specified spend volume within a stipulated time period, as well as affiliate marketing, direct mail campaigns and telemarketing. In addition, Marketing also includes agency services (such as marketing research, strategy consulting, creative production and placement), sponsorship programs, promotional events, distribution of branded materials and advertising via digital, television, radio and print media.
Marketing expenses incurred in the development and initial placement of advertising are expensed in the period in which the advertising first takes place. All other marketing expenses are generally expensed as incurred.
BALANCE SHEET
Cash and Cash Equivalents
Cash and cash equivalents include cash and amounts due from banks, interest-bearing bank balances, including securities purchased under resale agreements, restricted cash, and other highly liquid investments with original maturities of 90 days or less. Restricted cash primarily represents amounts related to Card Member credit balances as well as upcoming debt maturities of consolidated VIEs.
Card Member Loans HFS
When we decide to sell Card Member loans, they are reclassified on the Consolidated Balance Sheets as Card Member loans held for sale and measured at the lower of amortized cost or fair value (LOCOM). Refer to Note 14 for additional information regarding the valuation methodology for Card Member loans HFS. At the time of HFS reclassification, we first write-off amounts in accordance with our policy and then reverse any remaining reserves for credit losses associated with the HFS loans, the net impact of which is recognized within Provisions for credit losses in the Consolidated Statements of Income. HFS loans will continue to be remeasured at LOCOM until they are sold, with any changes in valuation recognized in Other, net in the Consolidated Statements of Income. We will continue to recognize discount revenue, interest income and other revenues and expenses related to the HFS loans until they are sold.
Effective December 1, 2024, we reclassified $758 million of Card Member loans related to the Lowe’s small business cobrand portfolio to Card Member loans held for sale on the Consolidated Balance Sheets and reversed $49 million of associated reserves for credit losses.
Goodwill
Goodwill represents the excess of the acquisition cost of an acquired business over the fair value of assets acquired and liabilities assumed. We allocate goodwill to our reporting units for the purpose of impairment testing. A reporting unit is defined as an operating segment, or a business that is one level below an operating segment, for which discrete financial information is regularly reviewed by the operating segment manager.
We evaluate goodwill for impairment annually as of November 1, or more frequently if events occur or circumstances change that would more likely than not reduce the fair value of one or more of our reporting units below its carrying value. Prior to completing the annual assessment of goodwill for impairment, we perform a recoverability test of certain long-lived assets.
We have the option to perform a qualitative assessment of goodwill impairment to determine whether it is more likely than not that the fair value of a reporting unit is less than its carrying value. Alternatively, we can perform a more detailed quantitative assessment of goodwill impairment.
This qualitative assessment entails the evaluation of factors such as economic conditions, industry and market considerations, cost factors, overall financial performance of the reporting unit and other company and reporting unit-specific events. If we determine that it is more likely than not that the fair value of a reporting unit is less than its carrying amount, we then perform the impairment evaluation using the quantitative assessment.
The quantitative assessment compares the fair value of a reporting unit with its carrying amount, including goodwill. If the carrying amount exceeds the reporting unit’s fair value, an impairment loss is recognized for the amount over and above the reporting unit’s fair value.
When measuring the fair value of our reporting units in the quantitative assessment, we use widely accepted valuation techniques, applying a combination of the income approach (discounted cash flows) and market approach (market multiples). When preparing discounted cash flow models under the income approach, we use internal forecasts to estimate future cash flows expected to be generated by the reporting units. To discount these cash flows, we use the expected cost of equity, determined by using a capital asset pricing model. We believe the discount rates appropriately reflect the risks and uncertainties in the financial markets generally and specifically in our internally-developed forecasts. When using market multiples under the market approach, we apply comparable publicly traded companies’ multiples (e.g., earnings or revenues) to our reporting units’ operating results.
For the years ended December 31, 2024 and 2023, we performed assessments for each reporting unit in connection with our annual goodwill impairment evaluation and determined that it was more likely than not that the fair values of each of our reporting units exceeded their carrying values and accordingly no impairment was recognized.
Premises and Equipment
Premises and equipment, including leasehold improvements, are carried at cost less accumulated depreciation. Costs incurred during construction are capitalized and are depreciated once an asset is placed in service. Depreciation is generally computed using the straight-line method over the estimated useful lives of the assets, which range from 3 to 10 years for equipment, furniture and building improvements, and from 40 to 50 years for premises, which are depreciated based upon their estimated useful life at the acquisition date.
Certain costs associated with the acquisition or development of internal-use software are also capitalized and recorded in Premises and equipment. Once the specific software feature is ready for its intended use, these costs are amortized on a straight-line basis over the software’s estimated useful life, generally 5 years. We review these assets for impairment using the same impairment methodology used for our intangible assets.
Leasehold improvements are depreciated using the straight-line method over the lesser of the remaining term of the leased facility, or the economic life of the improvement, and range from 5 to 10 years. We recognize lease restoration obligations at the fair value of the restoration liabilities when incurred and amortize the restoration assets over the lease term.
Leases
We have operating leases worldwide for facilities, primarily office locations and airport lounges, and equipment, which, for those leases with terms greater than 12 months, are recorded as lease-related assets and liabilities. We do not separate lease and non-lease components. Lease-related assets, or right-of-use assets, are recognized at the lease commencement date at amounts equal to the respective lease liabilities, adjusted for prepaid lease payments, initial direct costs and lease incentives. Lease liabilities are recognized at the present value of the contractual fixed lease payments, discounted using our incremental borrowing rate as of the lease commencement date or upon modification of the lease. Operating lease expense is recognized on a straight-line basis over the lease term, while variable lease payments are expensed as incurred.
OTHER SIGNIFICANT ACCOUNTING POLICIES
The following table identifies our other significant accounting policies, along with the related Note:
TABLE 1.1: OTHER SIGNIFICANT ACCOUNTING POLICIES | | | | | | | | | | | | | | |
| Significant Accounting Policy | | Note
Number | | Note Title |
| Loans and Card Member Receivables | | Note 2 | | Loans and Card Member Receivables |
| Reserves for Credit Losses | | Note 3 | | Reserves for Credit Losses |
| Investment Securities | | Note 4 | | Investment Securities |
| Asset Securitizations | | Note 5 | | Asset Securitizations |
| Stock-Based Compensation | | Note 10 | | Stock-Based Compensation |
| Legal Contingencies | | Note 12 | | Contingencies and Commitments |
| Derivative Financial Instruments and Hedging Activities | | Note 13 | | Derivatives and Hedging Activities |
| Fair Value Measurements | | Note 14 | | Fair Values |
| Guarantees | | Note 15 | | Guarantees |
| Income Taxes | | Note 20 | | Income Taxes |
| Earnings Per Common Share | | Note 21 | | Earnings Per Common Share |
CLASSIFICATION OF VARIOUS ITEMS
Certain reclassifications of prior period amounts have been made to conform to the current period presentation.
RECENTLY ADOPTED AND ISSUED ACCOUNTING STANDARDS
In November 2023, the Financial Accounting Standards Board issued updated accounting guidance for segment reporting, effective for annual reporting periods beginning after December 15, 2023 and for interim reporting periods beginning January 1, 2025. The updated guidance requires enhanced disclosures for significant expenses by reportable operating segment. Significant expense categories and amounts are those regularly provided to the chief operating decision maker (CODM) and included in the measure of a segment’s profit or loss. The updated guidance also requires us to disclose the title and position of our CODM, including an explanation of how our CODM uses the reported measure(s) of segment profit or loss in assessing segment performance and deciding how to allocate resources. We adopted the updated guidance for the annual reporting period beginning January 1, 2024, which did not result in a material impact to our Consolidated Financial Statements. Refer to Note 24 for related disclosures about our reportable operating segments.
In December 2023, the Financial Accounting Standards Board issued updated accounting guidance on Disclosures for Income Taxes, effective for annual reporting periods beginning after December 15, 2024, with early adoption permitted. The updated guidance requires additional disclosure and disaggregated information in the Income Tax Rate reconciliation using both percentages and reporting currency amounts, with additional qualitative explanations of individually significant reconciling items. The updated guidance also requires disclosure of the amount of income taxes paid (net of refunds received) disaggregated by jurisdictional categories (federal (national), state and foreign). We are currently assessing the updated guidance, however it is not expected to have a material impact to our Consolidated Financial Statements.
In November 2024, the Financial Accounting Standards Board issued updated accounting guidance on the Disaggregation of Income Statement Expenses for annual reporting periods beginning after December 15, 2026 and for interim reporting periods beginning December 15, 2027, with early adoption permitted. The updated guidance includes the requirement for a new tabular disclosure within a Note to the Consolidated Financial Statements, to disaggregate defined expense categories from the expense report lines presented on the Consolidated Statements of Income. We are currently assessing the updated guidance and its impact to our Consolidated Financial Statements.
NOTE 2
LOANS AND CARD MEMBER RECEIVABLES
Our lending and charge payment card products that we offer to consumer, small business and corporate customers result in the generation of Card Member loans and Card Member receivables. We also extend credit to customers through financing products that are not associated with a Card Member agreement, and instead are governed by a separate borrowing relationship, resulting in Other loans.
CARD MEMBER AND OTHER LOANS
Card Member loans are generally recorded at the time a Card Member enters into a point-of-sale transaction with a merchant and represent revolve-eligible balances on our card products, as well as any finance charges and associated card-related fees. Card Members with outstanding revolving loans are required to make a minimum monthly payment, and the balances that Card Members choose to revolve are subject to finance charges. These loans have varying terms such as credit limits, interest rates, fees and payment structures, which can be revised over time based on new information about Card Members and in accordance with applicable regulations and the respective product’s terms and conditions.
Card Member loans are presented on the Consolidated Balance Sheets net of reserves for credit losses (refer to Note 3), and include principal and any related accrued interest and fees. Our policy generally is to cease accruing interest on a Card Member loan at the time the account is written off, and establish reserves for interest that we believe will not be collected.
Other loans are recorded at the time any extension of credit is provided to consumer and commercial customers for financing products not associated with a Card Member agreement, such as consumer installment loans and lines of credit offered to small business customers. These loans have a range of fixed and variable terms such as interest rates, fees and repayment periods. Borrowers are typically required to make pre-established monthly payments over the term of the loan. Other loans are presented on the Consolidated Balance Sheets net of reserves for credit losses and include principal and any related accrued interest and fees.
Card Member and Other loans as of December 31, 2024 and 2023 consisted of:
TABLE 2.1: CARD MEMBER AND OTHER LOANS | | | | | | | | | | | | | | |
| (Millions) | | 2024 | | 2023 |
Consumer (a) | | $ | 107,646 | | | $ | 98,111 | |
| Small Business | | 31,991 | | | 27,833 | |
| Corporate | | 37 | | | 51 | |
| Card Member loans | | 139,674 | | | 125,995 | |
| Less: Reserves for credit losses | | 5,679 | | | 5,118 | |
| Card Member loans, net | | $ | 133,995 | | | $ | 120,877 | |
Other loans, net (b) | | $ | 9,038 | | | $ | 6,960 | |
(a)Includes approximately $28.3 billion and $28.6 billion of gross Card Member loans available to settle obligations of a consolidated VIE as of December 31, 2024 and 2023, respectively.
(b)Other loans are presented net of reserves for credit losses of $194 million and $126 million as of December 31, 2024 and 2023, respectively.
CARD MEMBER RECEIVABLES
Card Member receivables are recorded at the time a Card Member enters into a point-of-sale transaction with a merchant and represent balances due on our card products and card-related fees that need to be paid in full on or before the Card Member’s payment due date.
Charge Card Members generally must pay the full amount billed each month. Card Member receivable balances are presented on the Consolidated Balance Sheets net of reserves for credit losses (refer to Note 3), and include principal and any related accrued fees.
Card Member receivables as of December 31, 2024 and 2023 consisted of:
TABLE 2.2: CARD MEMBER RECEIVABLES | | | | | | | | | | | | | | |
| (Millions) | | 2024 | | 2023 |
| Consumer | | $ | 25,431 | | | $ | 25,578 | |
| Small Business | | 18,619 | | | 19,286 | |
Corporate(a) | | 15,361 | | | 15,547 | |
| Card Member receivables | | 59,411 | | | 60,411 | |
| Less: Reserves for credit losses | | 171 | | | 174 | |
| Card Member receivables, net | | $ | 59,240 | | | $ | 60,237 | |
(a)Includes $3.9 billion and $4.6 billion of gross Card Member receivables available to settle obligations of a consolidated VIE as of December 31, 2024 and 2023, respectively.
CARD MEMBER LOANS AND RECEIVABLES AGING
Generally, a Card Member account is considered past due if payment due is not received within 30 days after the billing statement date. The following tables present the aging of Card Member loans and receivables as of December 31, 2024 and 2023:
TABLE 2.3: CARD MEMBER LOANS AND RECEIVABLES AGING | | | | | | | | | | | | | | | | | | | | | | | | | | | | | | | | | | | | | | | | | | | | |
2024 (Millions) | | Current | | 30-59
Days
Past Due | | 60-89
Days
Past Due | | 90+
Days
Past Due | | Total | | 90+ Days Past Due and Still Accruing Interest (c) | | Non-Accruals(d) |
| Card Member Loans: | | | | | | | | | | | | | | |
| Consumer | | $ | 106,155 | | | $ | 437 | | | $ | 329 | | | $ | 725 | | | $ | 107,646 | | | $ | 435 | | | $ | 464 | |
| Small Business | | 31,510 | | | 151 | | | 107 | | | 223 | | | 31,991 | | | 132 | | | 135 | |
Corporate (a) | | (b) | | (b) | | (b) | | — | | | 37 | | | — | | | — | |
| Card Member Receivables: | | | | | | | | | | | | | | |
| Consumer | | $ | 25,255 | | | $ | 58 | | | $ | 39 | | | $ | 79 | | | $ | 25,431 | | | $ | — | | | $ | — | |
| Small Business | | 18,400 | | | 77 | | | 54 | | | 88 | | | 18,619 | | | — | | | — | |
Corporate (a) | | (b) | | (b) | | (b) | | 65 | | | 15,361 | | | — | | | — | |
| | | | | | | | | | | | | | | | | | | | | | | | | | | | | | | | | | | | | | | | | | | | |
2023 (Millions) | | Current | | 30-59
Days Past Due | | 60-89
Days Past Due | | 90+
Days Past
Due | | Total | | 90+ Days Past Due and Still Accruing Interest(c) | | Non-Accruals(d) |
| Card Member Loans: | | | | | | | | | | | | | | |
| Consumer | | $ | 96,779 | | | $ | 420 | | | $ | 298 | | | $ | 614 | | | $ | 98,111 | | | $ | 393 | | | $ | 344 | |
| Small Business | | 27,444 | | | 133 | | | 85 | | | 171 | | | 27,833 | | | 109 | | | 95 | |
Corporate (a) | | (b) | | (b) | | (b) | | — | | | 51 | | | — | | | — | |
| Card Member Receivables: | | | | | | | | | | | | | | |
| Consumer | | $ | 25,355 | | | $ | 70 | | | $ | 47 | | | $ | 106 | | | $ | 25,578 | | | $ | — | | | $ | — | |
| Small Business | | 19,020 | | | 104 | | | 62 | | | 100 | | | 19,286 | | | — | | | — | |
Corporate (a) | | (b) | | (b) | | (b) | | 67 | | | 15,547 | | | — | | | — | |
(a)For corporate accounts, delinquency data is tracked based on days past billing status rather than days past due. A Card Member account is considered 90 days past billing if payment has not been received within 90 days of the Card Member’s billing statement date. In addition, if we initiate collection procedures on an account prior to the account becoming 90 days past billing, the associated Card Member loan or receivable balance is classified as 90 days past billing. These amounts are shown above as 90+ Days Past Due for presentation purposes. See also (b).
(b)Delinquency data for periods other than 90+ days past billing has not historically been available due to system constraints. Therefore, such data has not been a material input for risk management purposes. The balances that are current to 89 days past billing can be derived as the difference between the Total and the 90+ Days Past Due balances.
(c)Our policy is generally to accrue interest through the date of write-off (typically 180 days past due). We establish reserves for interest that we believe will not be collected.
(d)Non-accrual loans primarily include certain loans placed with outside collection agencies for which we have ceased accruing interest.
CREDIT QUALITY INDICATORS FOR CARD MEMBER LOANS AND RECEIVABLES
The following table presents the key credit quality indicators as of or for the years ended December 31:
TABLE 2.4: CREDIT QUALITY INDICATORS FOR CARD MEMBER LOANS AND RECEIVABLES | | | | | | | | | | | | | | | | | | | | | | | | | | | | | | | | | | | | | | |
| | 2024 | | 2023 |
| | Net Write-Off Rate | | | | Net Write-Off Rate | | |
| | Principal Only (a) | | Principal, Interest & Fees (a) | | 30+
Days Past Due
as a % of
Total | | Principal Only (a) | | Principal, Interest & Fees (a) | | 30+
Days Past Due
as a % of
Total |
| Card Member Loans: | | | | | | | | | | | | |
| Consumer | | 2.2 | % | | 2.7 | % | | 1.4 | % | | 1.8 | % | | 2.2 | % | | 1.4 | % |
| Small Business | | 2.3 | % | | 2.6 | % | | 1.5 | % | | 1.7 | % | | 1.9 | % | | 1.4 | % |
| Card Member Receivables: | | | | | | | | | | | | |
| Consumer | | 1.2 | % | | 1.3 | % | | 0.7 | % | | 1.5 | % | | 1.6 | % | | 0.9 | % |
| Small Business | | 1.9 | % | | 2.0 | % | | 1.2 | % | | 2.2 | % | | 2.4 | % | | 1.4 | % |
| Corporate | | (b) | | 0.6 | % | | (c) | | (b) | | 0.6 | % | | (c) |
(a)We present a net write-off rate based on principal losses only (i.e., excluding interest and/or fees) to be consistent with industry convention. In addition, as our practice is to include uncollectible interest and/or fees as part of our total provision for credit losses, a net write-off rate including principal, interest and/or fees is also presented.
(b)Net write-off rate based on principal losses only is not available due to system constraints.
(c)For corporate receivables, delinquency data is tracked based on days past billing status rather than days past due. Delinquency data for periods other than 90+ days past billing is not available due to system constraints. 90+ days past billing as a % of total was 0.4% as of both December 31, 2024 and 2023.
Refer to Note 3 for additional indicators, including external qualitative factors, management considers in its evaluation process for reserves for credit losses.
LOANS AND RECEIVABLES RESTRUCTURINGS FOR BORROWERS EXPERIENCING FINANCIAL DIFFICULTY
Effective January 1, 2023, we prospectively adopted the new guidance that eliminated the recognition and measurement of troubled debt restructurings (TDRs). Following the adoption of this guidance, we evaluate all loans and receivables restructurings according to the accounting guidance for loan refinancing and restructuring to determine whether such loan modification should be accounted for as a new loan or a continuation of the existing loan. Our loans and receivables restructurings for borrowers experiencing financial difficulty are generally accounted for as a continuation of the existing loan, which reflects the ongoing effort to support our customer and recover our investment in the existing loan.
We offer several types of loans and receivables modification programs to customers experiencing financial difficulty. In such instances, we may modify loans and receivables with the intention to minimize losses and improve collectability, while providing customers with temporary or permanent financial relief.
Such modifications to the loans and receivables primarily include (i) temporary interest rate reductions (reducing interest rates to as low as zero percent, in which case the loan is characterized as non-accrual) and/or (ii) placing the customer on a fixed payment plan not to exceed 60 months. Upon entering the modification program, the customer’s ability to make future purchases is limited, canceled or, in certain cases, suspended until the customer successfully exits from the modification program. As of December 31, 2024, we had $82 million of unused credit available to customers with loans and receivables modified during the year ended December 31, 2024. In accordance with the modification agreement with the customer, loans and/or receivables may revert to the original contractual terms (including the contractual interest rate where applicable) when the customer exits the modification program, which is either (i) when all payments have been made in accordance with the modification agreement or (ii) when the customer defaults out of the modification program.
The following tables provide information relating to loans and receivables modifications for borrowers experiencing financial difficulty during the years ended December 31, 2024 and 2023:
TABLE 2.5: LOANS AND RECEIVABLES MODIFICATIONS FOR BORROWERS EXPERIENCING FINANCIAL DIFFICULTY | | | | | | | | | | | | | | | | | | | | | | | | | | |
| | Year Ended December 31, 2024 |
| | | | | | |
2024 (Millions) | | Account Balances (Millions) (a) | | % of Total Class of
Financing Receivables | | Weighted Average Interest Rate Reduction
(% points) | | Weighted Average Payment
Term Extensions
(# of months) |
| Interest Rate Reduction | | | | | | | | |
| Card Member Loans | | | | | | | | |
| Consumer | | $ | 1,770 | | | 1.6 | % | | 18.3 | % | | (b) |
| Small Business | | 646 | | | 2.0 | % | | 17.5 | % | | (b) |
| Corporate | | — | | | — | | | — | | | (b) |
| Term Extension | | | | | | | | |
| Card Member Receivables | | | | | | | | |
| Consumer | | 256 | | | 1.0 | % | | (c) | | 30 |
| Small Business | | 401 | | | 2.2 | % | | (c) | | 30 |
| Corporate | | 13 | | | 0.1 | % | | (c) | | 9 |
| Other Loans | | 30 | | | 0.3 | % | | — | | | 18 |
Interest Rate Reduction
and Term Extension | | | | | | | | |
| Other Loans | | 56 | | | 0.6 | % | | 2.6 | % | | 20 |
| Total | | $ | 3,172 | | | | | | | |
| | | | | | | | | | | | | | | | | | | | | | | | | | |
| | | | | | | | |
| | Year Ended December 31, 2023 |
2023 (Millions) | | Account Balances (Millions) (a) | | % of Total Class of
Financing Receivables | | Weighted Average Interest Rate Reduction
(% points) | | Weighted Average Payment
Term Extensions
(# of months) |
| Interest Rate Reduction | | | | | | | | |
| Card Member Loans | | | | | | | | |
| Consumer | | $ | 1,572 | | | 1.6 | % | | 16.4 | % | | (b) |
| Small Business | | 550 | | | 2.0 | % | | 15.9 | % | | (b) |
| Corporate | | — | | | — | | | — | | | (b) |
| Term Extension | | | | | | | | |
| Card Member Receivables | | | | | | | | |
| Consumer | | 346 | | | 1.4 | % | | (c) | | 27 |
| Small Business | | 543 | | | 2.8 | % | | (c) | | 28 |
| Corporate | | 13 | | | 0.1 | % | | (c) | | 9 |
| Other Loans | | 23 | | | 0.3 | % | | — | | | 18 |
Interest Rate Reduction
and Term Extension | | | | | | | | |
| Other Loans | | 42 | | | 0.6 | % | | 2.1 | % | | 20 |
| Total | | $ | 3,089 | | | | | | | |
(a)Represents the outstanding balances as of December 31, 2024 and 2023, respectively, of all modifications undertaken in the current and preceding year for loans and receivables that remain in modification programs as of, or that defaulted on or before, December 31, 2024 and 2023, respectively. The outstanding balances include principal, fees and accrued interest on loans and principal and fees on receivables. Modifications did not reduce the principal balance.
(b)For Card Member loans, we generally do not offer payment term extensions.
(c)We do not offer interest rate reduction programs for Card Member receivables as the receivables are non-interest bearing.
The following tables provide information with respect to loans and receivables modified on or after January 1, 2023 that defaulted in the periods presented and were modified in the twelve months prior to the payment default. A customer can miss up to three payments before being considered in default, depending on the terms of the modification program.
TABLE 2.6: MODIFIED LOANS AND RECEIVABLES THAT DEFAULTED WITHIN TWELVE MONTHS OF MODIFICATION
| | | | | | | | | | | | | | | | | | | | | | | | | | |
| | Year Ended December 31, 2024 |
Account Balance (Millions) (a) | | Interest Rate Reduction | | Term Extension | | Interest Rate Reduction and Term Extension | | Total |
| Card Member Loans | | | | | | | | |
| Consumer | | $ | 88 | | | (b) | | $ | — | | $ | 88 | |
| Small Business | | 40 | | | (b) | | — | | 40 | |
| Corporate | | — | | | (b) | | — | | — | |
| Card Member Receivables | | | | | | | | |
| Consumer | | (c) | | $ | 10 | | | — | | | 10 | |
| Small Business | | (c) | | 17 | | | — | | | 17 | |
| Corporate | | (c) | | — | | | — | | | — | |
| Other Loans | | — | | | — | | | 2 | | | 2 | |
| Total | | $ | 128 | | | $ | 27 | | | $ | 2 | | | $ | 157 | |
| | | | | | | | | | | | | | | | | | | | | | | | | | |
| | Year Ended December 31, 2023 |
Account Balance (Millions) (a) | | Interest Rate Reduction | | Term Extension | | Interest Rate Reduction and Term Extension | | Total |
| Card Member Loans | | | | | | | | |
| Consumer | | $ | 53 | | | (b) | | $ | — | | $ | 53 | |
| Small Business | | 20 | | | (b) | | — | | 20 | |
| Corporate | | — | | | (b) | | — | | — | |
| Card Member Receivables | | | | | | | | |
| Consumer | | (c) | | $ | 9 | | | — | | | 9 | |
| Small Business | | (c) | | 14 | | | — | | | 14 | |
| Corporate | | (c) | | — | | | — | | | — | |
| Other Loans | | — | | | — | | | 1 | | | 1 | |
| Total | | $ | 73 | | | $ | 23 | | | $ | 1 | | | $ | 97 | |
(a)Represents the outstanding balances as of December 31, 2024 and 2023, respectively, of all modifications undertaken on or after January 1, 2023 that defaulted in the periods presented and were modified in the twelve months prior to payment default. The outstanding balances include principal, fees and accrued interest on loans and principal and fees on receivables.
(b)For Card Member loans, we generally do not offer payment term extensions.
(c)We do not offer interest rate reduction programs for Card Member receivables as the receivables are non-interest bearing.
The following tables provide information relating to the performance of loans and receivables that were modified during the years ended December 31, 2024 and 2023 and that remain in modification programs as of, or that defaulted on or before, December 31, 2024 and 2023, respectively:
TABLE 2.7: PERFORMANCE OF MODIFIED LOANS AND RECEIVABLES
| | | | | | | | | | | | | | | | | | | | |
| | As of December 31, 2024 |
Account Balances (Millions) (a) | | Current | | 30-89 Days Past Due | | 90+ Days Past Due |
| Card Member Loans | | | | | | |
| Consumer | | $ | 1,615 | | | $ | 110 | | | $ | 45 | |
| Small Business | | 568 | | | 56 | | | 22 | |
| Corporate | | — | | | — | | | — | |
| Card Member Receivables: | | | | | | |
| Consumer | | 234 | | | 16 | | | 6 | |
| Small Business | | 357 | | | 31 | | | 13 | |
| Corporate | | 10 | | | 2 | | | 1 | |
| Other Loans | | 79 | | | 5 | | | 2 | |
| Total | | $ | 2,863 | | | $ | 220 | | | $ | 89 | |
| | | | | | | | | | | | | | | | | | | | |
| | As of December 31, 2023 |
Account Balances (Millions) (a) | | Current | | 30-89 Days Past Due | | 90+ Days Past Due |
| Card Member Loans | | | | | | |
| Consumer | | $ | 1,433 | | | $ | 103 | | | $ | 36 | |
| Small Business | | 489 | | | 45 | | | 16 | |
| Corporate | | — | | | — | | | — | |
| Card Member Receivables: | | | | | | |
| Consumer | | 314 | | | 25 | | | 7 | |
| Small Business | | 479 | | | 52 | | | 12 | |
| Corporate | | 11 | | | 2 | | | — | |
| Other Loans | | 59 | | | 4 | | | 2 | |
| Total | | $ | 2,785 | | | $ | 231 | | | $ | 73 | |
(a)The outstanding balances include principal, fees and accrued interest on loans and principal and fees on receivables.
TROUBLED DEBT RESTRUCTURING DISCLOSURES PRIOR TO ADOPTION OF THE NEW LOAN MODIFICATION GUIDANCE
Prior to adoption of the new loan modification guidance, we accounted for a modification to the contractual terms of a loan that resulted in granting a concession to a borrower experiencing financial difficulties as a TDR. Loans that were classified as a TDR prior to adoption will continue to be accounted for under the historical TDR accounting until the loan is entirely paid off or written off. As of December 31, 2024, there are no remaining loans which are accounted for under the historical TDR accounting.
The following table provides additional information with respect to our impaired loans and receivables as of December 31, 2022:
TABLE 2.8: IMPAIRED LOANS AND RECEIVABLES | | | | | | | | | | | | | | | | | | | | | | | | | | | | | | | | | | | | | | |
| | As of December 31, 2022 |
| | | | | | Accounts Classified as a TDR (c) | | | | |
2022 (Millions) | | Over 90 days Past Due & Accruing Interest (a) | | Non- Accruals (b) | | In Program (d) | | Out of Program (e) | | Total
Impaired
Balance | | Reserve for Credit
Losses-
TDRs |
| Card Member Loans | | | | | | | | | | | | |
| Consumer | | $ | 252 | | | $ | 155 | | | $ | 781 | | | $ | 1,098 | | | $ | 2,286 | | | $ | 335 | |
| Small Business | | 54 | | | 34 | | | 267 | | | 380 | | | 735 | | | 108 | |
| Corporate | | — | | | — | | | — | | | — | | | — | | | — | |
| Card Member Receivables | | | | | | | | | | | | |
| Consumer | | — | | | — | | | 257 | | | 179 | | | 436 | | | 20 | |
| Small Business | | — | | | — | | | 403 | | | 402 | | | 805 | | | 40 | |
| Corporate | | — | | | — | | | 6 | | | 7 | | | 13 | | | 1 | |
| Other Loans | | 3 | | | 2 | | | 19 | | | 2 | | | 26 | | | — | |
| Total | | $ | 309 | | | $ | 191 | | | $ | 1,733 | | | $ | 2,068 | | | $ | 4,301 | | | $ | 504 | |
(a)Our policy is generally to accrue interest through the date of write-off (typically 180 days past due). We establish reserves for interest that we believe will not be collected. Amounts presented exclude loans classified as a TDR.
(b)Non-accrual loans not in modification programs primarily include certain loans placed with outside collection agencies for which we have ceased accruing interest. Amounts presented exclude loans classified as TDRs.
(c)Accounts classified as a TDR include $48 million that were over 90 days past due and accruing interest and $17 million that were non-accruals as of December 31, 2022.
(d)In Program TDRs include accounts that are currently enrolled in a modification program.
(e)Out of Program TDRs include $1,922 million of accounts that have successfully completed a modification program and $146 million of accounts that were not in compliance with the terms of the modification programs as of December 31, 2022.
LOANS AND RECEIVABLES MODIFIED AS TDRs PRIOR TO ADOPTION OF THE NEW LOAN MODIFICATION GUIDANCE
The following table provides additional information with respect to loans and receivables that were modified as TDRs during the year ended December 31, 2022:
TABLE 2.9: LOANS AND RECEIVABLES MODIFIED AS TDRs
| | | | | | | | | | | | | | | | | | | | | | | | | | |
| 2022 | | Number of Accounts (Thousands) | | Account Balances (Millions) (a) | | Average Interest Rate Reduction (% points) | | Average Payment Term Extensions (# of months) |
| Troubled Debt Restructurings: | | | | | | | | |
| Card Member Loans | | 149 | | | $ | 1,002 | | | 14 | % | | (b) |
| Card Member Receivables | | 27 | | | 900 | | | (c) | | 20 |
Other Loans (d) | | 4 | | | 8 | | | 2 | % | | 17 |
| Total | | 180 | | | $ | 1,910 | | | | | |
(a)Represents the outstanding balance immediately prior to modification. The outstanding balance includes principal, fees and accrued interest on loans and principal and fees on receivables. Modifications did not reduce the principal balance.
(b)For Card Member loans, there have been no payment term extensions.
(c)We do not offer interest rate reduction programs for Card Member receivables as the receivables are non-interest bearing.
(d)Other loans primarily represent consumer installment loans and lines of credit offered to small business customers.
LOANS AND RECEIVABLES MODIFIED AS TDRs AND SUBSEQUENTLY DEFAULTED PRIOR TO ADOPTION OF THE NEW LOAN MODIFICATION GUIDANCE
The following table provides information with respect to loans and receivables modified as TDRs that subsequently defaulted within twelve months of modification. A customer can miss up to three payments before being considered in default, depending on the terms of the modification program.
TABLE 2.10: LOANS AND RECEIVABLES MODIFIED AS TDRs THAT DEFAULTED WITHIN TWELVE MONTHS OF MODIFICATION
| | | | | | | | | | | | | | |
| 2022 | | Number of Accounts (Thousands) | | Aggregated Outstanding Balances Upon Default (Millions) (a) |
| Troubled Debt Restructurings That Subsequently Defaulted: | | | | |
| Card Member Loans | | 14 | | | $ | 81 | |
| Card Member Receivables | | 3 | | | 38 | |
Other Loans (b) | | 1 | | | 1 | |
| Total | | 18 | | | $ | 120 | |
(a)The outstanding balances upon default include principal, fees and accrued interest on loans, and principal and fees on receivables.
(b)Other loans primarily represent consumer installment loans and lines of credit offered to small business customers.
NOTE 3
RESERVES FOR CREDIT LOSSES
Reserves for credit losses represent our best estimate of the expected credit losses in our outstanding portfolio of Card Member loans and receivables as of the balance sheet date. The CECL methodology requires us to estimate lifetime expected credit losses by incorporating historical loss experience, as well as current and future economic conditions over a reasonable and supportable period (R&S Period), which is approximately three years, beyond the balance sheet date. We make various judgments combined with historical loss experience to determine a reserve rate that is applied to the outstanding loan or receivable balance to produce a reserve for expected credit losses.
We use a combination of statistically-based models that incorporate current and future economic conditions throughout the R&S Period. The process of estimating expected credit losses is based on several key models: Probability of Default (PD), Exposure at Default (EAD) and future recoveries for each month of the R&S Period. Beyond the R&S Period, we estimate expected credit losses by immediately reverting to long-term average loss rates.
•PD models are used to estimate the likelihood an account will be written-off.
•EAD models are used to estimate the balance of an account at the time of write-off. This includes balances less expected repayments based on historical payment and revolve behavior, which vary by customer. Due to the nature of revolving loan portfolios, the EAD models are complex and involve assumptions regarding the relationship between future spend and payment behaviors.
•Recovery models are used to estimate amounts that are expected to be received from Card Members after default occurs, typically as a result of collection efforts. Future recoveries are estimated taking into consideration the time of default, time elapsed since default and macroeconomic conditions.
We also estimate the likelihood and magnitude of recovery of previously written off accounts considering how long ago the account was written off and future economic conditions, even if such expected recoveries exceed expected losses. Our models are developed using historical loss experience covering the economic cycle and consider the impact of account characteristics on expected losses. This history includes the performance of loans and receivables modifications for borrowers experiencing financial difficulty, including their subsequent defaults.
Future economic conditions that are incorporated over the R&S Period include multiple macroeconomic scenarios provided to us by an independent third party. Management reviews these economic scenarios each period and assigns probability weights to each scenario, generally with a consistent initial distribution. At times, due to macroeconomic uncertainty and volatility, management may apply judgment and assign different probability weights to scenarios. These macroeconomic scenarios contain certain variables, including unemployment rates and real gross domestic product (GDP), that are significant to our models.
We also evaluate whether to include qualitative reserves to cover losses that are expected but, in our assessment, may not be adequately represented in the quantitative methods or the economic assumptions. We consider whether to adjust the quantitative reserves (higher or lower) to address possible limitations within the models or factors not included within the models, such as external conditions, emerging portfolio trends, the nature and size of the portfolio, portfolio concentrations, the volume and severity of past due accounts, or management risk actions.
Lifetime losses for most of our loans and receivables are evaluated at an appropriate level of granularity, including assessment on a pooled basis where financial assets share similar risk characteristics, such as past spend and remittance behaviors, credit bureau scores where available, delinquency status, tenure of balance outstanding, amongst others. Credit losses on accrued interest are measured and presented as part of Reserves for credit losses on the Consolidated Balance Sheets and within the Provisions for credit losses in the Consolidated Statements of Income, rather than reversing interest income.
Loans and receivable balances are written off when we consider amounts to be uncollectible, which is generally determined by the number of days past due and is typically no later than 180 days past due for pay in full or revolving loans and 120 days past due for term loans. Loans and receivables in bankruptcy or owed by deceased individuals are generally written off upon notification.
The following table reflects the range of macroeconomic scenario key variables used, in conjunction with other inputs, to calculate reserves for credit losses:
TABLE 3.1: KEY MACROECONOMIC VARIABLES | | | | | | | | | | | | | | | | | | | | | | | | | | | | | | |
| | U.S. Unemployment Rate | | U.S. GDP Growth (Contraction) (a) |
| | December 31, 2024 | | | December 31, 2023 | | December 31, 2024 | | | | December 31, 2023 |
| Fourth quarter of 2024 | | 4% | | | | 3% - 8% | | 2% | | | | 3% - 1% |
| First quarter of 2025 | | 4% - 6% | | | | 3% - 8% | | 4% - (3)% | | | | 2% - 1% |
| Fourth quarter of 2025 | | 3% - 8% | | | | 3% - 7% | | 3% - 1% | | | | 2% |
| Fourth quarter of 2026 | | 3% - 7% | | | | 3% - 6% | | 2% | | | | 3% - 2% |
(a)Real GDP quarter over quarter percentage change seasonally adjusted to annualized rates.
CHANGES IN CARD MEMBER LOANS RESERVE FOR CREDIT LOSSES
Card Member loans reserve for credit losses increased for the year ended December 31, 2024, primarily driven by an increase in loans outstanding.
Card Member loans reserve for credit losses increased for the year ended December 31, 2023, primarily driven by an increase in loans outstanding and higher delinquencies.
The following table presents changes in the Card Member loans reserve for credit losses for the years ended December 31:
TABLE 3.2: CHANGES IN CARD MEMBER LOANS RESERVE FOR CREDIT LOSSES | | | | | | | | | | | | | | | | | | | | |
| (Millions) | | 2024 | | 2023 | | 2022 |
| Beginning Balance | | $ | 5,118 | | | $ | 3,747 | | | $ | 3,305 | |
Provisions(a) | | 4,109 | | | 3,839 | | | 1,514 | |
Net write-offs (b) | | | | | | |
| Principal | | (2,894) | | | (2,043) | | | (837) | |
| Interest and fees | | (621) | | | (443) | | | (229) | |
Other(c) | | (33) | | | 18 | | | (6) | |
| Ending Balance | | $ | 5,679 | | | $ | 5,118 | | | $ | 3,747 | |
(a)Provisions for principal, interest and fee reserve components. Provisions for credit losses includes reserve build (release) and replenishment for net write-offs. In addition, provisions for the year ended December 31, 2024 includes the reserve release of $49 million upon the reclassification of Card Member loans related to the Lowe’s small business cobrand portfolio as HFS in the fourth quarter of 2024. See Note 1 for additional information.
(b)Principal write-offs are presented less recoveries of $730 million, $537 million and $539 million for the years ended December 31, 2024, 2023 and 2022, respectively. Recoveries of interest and fees were not significant.
(c)Primarily includes foreign currency translation adjustments of $(33) million, $18 million and $(6) million for the years ended December 31, 2024, 2023 and 2022, respectively.
CHANGES IN CARD MEMBER RECEIVABLES RESERVE FOR CREDIT LOSSES
Card Member receivables reserve for credit losses remained relatively flat for the year ended December 31, 2024.
Card Member receivables reserve for credit losses decreased for the year ended December 31, 2023, primarily driven by lower delinquencies, partially offset by an increase in receivables outstanding.
The following table presents changes in the Card Member receivables reserve for credit losses for the years ended December 31:
TABLE 3.3: CHANGES IN CARD MEMBER RECEIVABLES RESERVE FOR CREDIT LOSSES | | | | | | | | | | | | | | | | | | | | |
| (Millions) | | 2024 | | 2023 | | 2022 |
| Beginning Balance | | $ | 174 | | | $ | 229 | | | $ | 64 | |
Provisions (a) | | 774 | | | 880 | | | 627 | |
Net write-offs (b) | | (773) | | | (937) | | | (462) | |
Other (c) | | (4) | | | 2 | | | — | |
| Ending Balance | | $ | 171 | | | $ | 174 | | | $ | 229 | |
(a)Provisions for principal and fee reserve components. Provisions for credit losses includes reserve build (release) and replenishment for net write-offs.
(b)Net write-offs are presented less recoveries of $304 million, $297 million and $257 million for the years ended December 31, 2024, 2023 and 2022, respectively.
(c)Primarily includes foreign currency translation adjustments of $(4) million, $1 million and $2 million for the years ended December 31, 2024, 2023 and 2022, respectively.
NOTE 4
INVESTMENT SECURITIES
Investment securities principally include available-for-sale (AFS) debt securities carried at fair value on the Consolidated Balance Sheets. The methodology for estimating credit losses for AFS debt securities requires us to estimate lifetime credit losses for all AFS debt securities in an unrealized loss position. When estimating a security’s probability of default and the recovery rate, we assess the security’s credit indicators, including credit ratings. If our assessment indicates that an estimated credit loss exists, we determine the portion of the unrealized loss attributable to credit deterioration and record a reserve for the estimated credit loss through the Consolidated Statements of Income in Other loans Provision for credit losses. Unrealized gains and any portion of a security’s unrealized loss attributable to non-credit losses are recorded in the Consolidated Statements of Comprehensive Income, net of tax. We had accrued interest on our AFS debt securities totaling $3 million and $5 million as of December 31, 2024 and 2023, respectively, presented as Other assets on the Consolidated Balance Sheets.
Investment securities also include equity securities carried at fair value on the Consolidated Balance Sheets with unrealized gains and losses recorded in the Consolidated Statements of Income as Other, net expense.
Realized gains and losses are recognized upon disposition of the securities using the specific identification method and recorded in the Consolidated Statements of Income as Other, net expense.
Refer to Note 14 for a description of our methodology for determining the fair value of investment securities.
The following is a summary of investment securities as of December 31:
TABLE 4.1: INVESTMENT SECURITIES | | | | | | | | | | | | | | | | | | | | | | | | | | | | | | | | | | | | | | | | | | | | | | | | | | |
| | 2024 | | 2023 |
Description of Securities (Millions) | | Cost | | Gross
Unrealized
Gains | | Gross
Unrealized
Losses | | Estimated
Fair
Value | | Cost | | Gross
Unrealized
Gains | | Gross
Unrealized
Losses | | Estimated
Fair
Value |
| Available-for-sale debt securities: | | | | | | | | | | | | | | | | |
| State and municipal obligations | | $ | 57 | | | $ | 1 | | | $ | (9) | | | $ | 49 | | | $ | 61 | | | $ | — | | | $ | (6) | | | $ | 55 | |
| U.S. Government agency obligations | | 4 | | | — | | | — | | | 4 | | | 4 | | | — | | | — | | | 4 | |
| U.S. Government treasury obligations | | 289 | | | — | | | (2) | | | 287 | | | 1,217 | | | 1 | | | (12) | | | 1,206 | |
Mortgage-backed securities (a) | | 11 | | | — | | | (1) | | | 10 | | | 12 | | | — | | | (1) | | | 11 | |
| Foreign government bonds and obligations | | 765 | | | — | | | — | | | 765 | | | 770 | | | — | | | — | | | 770 | |
Other (b) | | 77 | | | — | | | — | | | 77 | | | 74 | | | — | | | — | | | 74 | |
Equity securities (c)(d) | | 53 | | | 4 | | | (9) | | | 48 | | | 60 | | | 16 | | | (10) | | | 66 | |
| Total | | $ | 1,256 | | | $ | 5 | | | $ | (21) | | | $ | 1,240 | | | $ | 2,198 | | | $ | 17 | | | $ | (29) | | | $ | 2,186 | |
(a)Represents mortgage-backed securities guaranteed by Fannie Mae, Freddie Mac or Ginnie Mae.
(b)Represents investments in debt securities issued by Community Development Financial Institutions.
(c)Equity securities comprise investments in common stock and mutual funds.
(d)During 2024, an equity investment transferred from Other assets to Investment securities following the completion of an initial public offering by the issuer of the securities. The investment had a fair value of $7 million with an associated cost of $3 million as of December 31, 2024.
The following table provides information about our AFS debt securities with gross unrealized losses and the length of time that individual securities have been in a continuous unrealized loss position as of December 31, 2024 and 2023:
TABLE 4.2: AFS DEBT SECURITIES WITH GROSS UNREALIZED LOSSES BY DURATION | | | | | | | | | | | | | | | | | | | | | | | | | | | | | | | | | | | | | | | | | | | | | | | | | | |
| | 2024 | | 2023 |
| | Less than 12 months | | 12 months or more | | Less than 12 months | | 12 months or more |
Description of Securities (Millions) | | Estimated
Fair Value | | Gross Unrealized
Losses | | Estimated
Fair Value | | Gross Unrealized
Losses | | Estimated
Fair Value | | Gross Unrealized
Losses | | Estimated
Fair Value | | Gross Unrealized
Losses |
| State and municipal obligations | | $ | — | | | $ | — | | | $ | 22 | | | $ | (9) | | | $ | — | | | $ | — | | | $ | 33 | | | $ | (6) | |
| U.S. Government treasury obligations | | — | | | — | | | 123 | | | (2) | | | — | | | — | | | 1,114 | | | (12) | |
| Mortgage-backed securities | | — | | | — | | | 7 | | | (1) | | | — | | | — | | | 7 | | | (1) | |
| | | | | | | | | | | | | | | | |
| Total | | $ | — | | | $ | — | | | $ | 152 | | | $ | (12) | | | $ | — | | | $ | — | | | $ | 1,154 | | | $ | (19) | |
The gross unrealized losses on our AFS debt securities are primarily attributable to an increase in the current benchmark interest rate. Overall, for the AFS debt securities in gross unrealized loss positions, (i) we do not intend to sell the securities, (ii) it is more likely than not that we will not be required to sell the securities before recovery of the unrealized losses and (iii) we expect that the contractual principal and interest will be received on the securities. We concluded that there was no credit loss attributable to the securities in an unrealized loss position for the periods presented.
The following table summarizes the gross unrealized losses for AFS debt securities by ratio of fair value to amortized cost as of December 31, 2024 and 2023:
TABLE 4.3: AFS GROSS UNREALIZED LOSSES BY RATIO OF FAIR VALUE TO AMORTIZED COST | | | | | | | | | | | | | | | | | | | | | | | | | | | | | | | | | | | | | | | | | | | | | | | | | | | | | | | | |
| | Less than 12 months | | 12 months or more | | Total |
Ratio of Fair Value to Amortized Cost (Dollars in millions) | | Number of
Securities | | Estimated
Fair Value | | Gross
Unrealized
Losses | | Number of
Securities | | Estimated
Fair Value | | Gross
Unrealized
Losses | | Number of
Securities | | Estimated
Fair Value | | Gross
Unrealized
Losses |
| 2024: | | | | | | | | | | | | | | | | | | |
| 90%–100% | | — | | $ | — | | | $ | — | | | 30 | | $ | 129 | | | $ | (3) | | | 30 | | $ | 129 | | | $ | (3) | |
| Less than 90% | | — | | — | | | — | | | 15 | | 23 | | | (9) | | | 15 | | 23 | | | (9) | |
| Total as of December 31, 2024 | | — | | $ | — | | | $ | — | | | 45 | | $ | 152 | | | $ | (12) | | | 45 | | $ | 152 | | | $ | (12) | |
| 2023: | | | | | | | | | | | | | | | | | | |
| 90%–100% | | — | | $ | — | | | $ | — | | | 69 | | $ | 1,140 | | | $ | (14) | | | 69 | | $ | 1,140 | | | $ | (14) | |
| Less than 90% | | — | | — | | | — | | | 2 | | 14 | | | (5) | | | 2 | | 14 | | | (5) | |
| Total as of December 31, 2023 | | — | | $ | — | | | $ | — | | | 71 | | $ | 1,154 | | | $ | (19) | | | 71 | | $ | 1,154 | | | $ | (19) | |
Weighted average yields and contractual maturities for AFS debt securities with stated maturities as of December 31, 2024 were as follows:
TABLE 4.4: WEIGHTED AVERAGE YIELDS AND CONTRACTUAL MATURITIES OF AFS DEBT SECURITIES | | | | | | | | | | | | | | | | | | | | | | | | | | | | | | | | | |
| (Millions) | | Due within 1 year | | Due after 1 year but within 5 years | | Due after 5 years but within 10 years | | Due after 10 years | | Total | |
State and municipal obligations (a) | | $ | — | | | $ | — | | | $ | 23 | | | $ | 26 | | | $ | 49 | | |
U.S. Government agency obligations (a) | | — | | | — | | | — | | | 4 | | | 4 | | |
| U.S. Government treasury obligations | | 189 | | | 98 | | | — | | | — | | | 287 | | |
| | | | | | | | | | | |
Mortgage-backed securities (a)(b) | | — | | | — | | | — | | | 10 | | | 10 | | |
| Foreign government bonds and obligations | | 764 | | | 1 | | | — | | | — | | | 765 | | |
Other (c) | | — | | | 67 | | | 10 | | | — | | | 77 | | |
| Total Estimated Fair Value | | $ | 953 | | | $ | 166 | | | $ | 33 | | | $ | 40 | | | $ | 1,192 | | |
| | | | | | | | | | | |
| Total Cost | | $ | 955 | | | $ | 166 | | | $ | 32 | | | $ | 50 | | | $ | 1,203 | | |
Weighted average yield (d) | | 5.33 | % | | 3.71 | % | | 4.81 | % | | 2.73 | % | | 4.98 | % | |
(a)The expected payments on state and municipal obligations, U.S. Government agency obligations and mortgage-backed securities may not coincide with their contractual maturities because the issuers have the right to call or prepay certain obligations.
(b)Represents mortgage-backed securities guaranteed by Fannie Mae, Freddie Mac or Ginnie Mae.
(c)Represents investments in debt securities issued by Community Development Financial Institutions.
(d)Average yields for investment securities have been calculated using the effective yield on the date of purchase. Yields on tax-exempt investment securities have been computed on a tax-equivalent basis using the U.S. federal statutory tax rate of 21 percent.
NOTE 5
ASSET SECURITIZATIONS
We periodically securitize Card Member loans and receivables arising from our card businesses through the transfer of those assets to securitization trusts, American Express Credit Account Master Trust (the Lending Trust) and American Express Issuance Trust II (the Charge Trust and together with the Lending Trust, the Trusts). The Trusts then issue debt securities collateralized by the transferred assets to third-party investors.
The Trusts are considered VIEs as they have insufficient equity at risk to finance their activities, which are to issue debt securities that are collateralized by the underlying Card Member loans and receivables. Refer to Note 1 for further details on the principles of consolidation. We perform the servicing and key decision making for the Trusts, and therefore have the power to direct the activities that most significantly impact the Trusts’ economic performance, which are the collection of the underlying Card Member loans and receivables. In addition, we hold all of the variable interests in both Trusts, with the exception of the debt securities issued to third-party investors. Our ownership of variable interests in the Lending Trust was $14.6 billion and $15.3 billion as of December 31, 2024 and 2023, respectively, and in the Charge Trust was $3.9 billion and $4.6 billion as of December 31, 2024 and 2023, respectively. These variable interests held by us provide us with the right to receive benefits and the obligation to absorb losses, which could be significant to both the Lending Trust and the Charge Trust. Based on these considerations, we are the primary beneficiary of the Trusts and therefore consolidate the Trusts.
The debt securities issued by the Trusts are non-recourse to us. The securitized Card Member loans and receivables held by the Lending Trust and the Charge Trust, respectively, are available only for payment of the debt securities or other obligations issued or arising in the securitization transactions (refer to Note 2). The long-term debt of each Trust is payable only out of collections on their respective underlying securitized assets (refer to Note 8).
Restricted cash and cash equivalents held by the Lending Trust was $88 million and $66 million as of December 31, 2024 and 2023, respectively, and by the Charge Trust was nil as of both December 31, 2024 and 2023. These amounts relate to collections of Card Member loans and receivables to be used by the Trusts to fund future expenses and obligations, including interest on debt securities, credit losses and upcoming debt maturities.
Under the respective terms of the Lending Trust and the Charge Trust agreements, the occurrence of certain triggering events associated with the performance of the assets of each Trust could result in payment of trust expenses, establishment of reserve funds, or, in a worst-case scenario, early amortization of debt securities. During the years ended December 31, 2024 and 2023, no such triggering events occurred.
NOTE 6
OTHER ASSETS
The following is a summary of Other assets as of December 31:
TABLE 6.1: OTHER ASSETS | | | | | | | | | | | | | | |
| (Millions) | | 2024 | | 2023 |
| Goodwill | | $ | 4,187 | | | $ | 3,851 | |
Right-of-use lease assets | | 804 | | | 770 | |
| Other intangible assets, at amortized cost | | 123 | | | 98 | |
Other (a) | | 16,065 | | | 14,395 | |
| Total | | $ | 21,179 | | | $ | 19,114 | |
(a)Primarily includes net deferred tax assets, other receivables net of reserves, investments in non-consolidated entities, tax credit investments, prepaid assets and derivative assets.
GOODWILL
The changes in the carrying amount of goodwill reported in our reportable operating segments were as follows:
TABLE 6.2: GOODWILL ROLLFORWARD | | | | | | | | | | | | | | | | | | | | | | | | | | | | | | | | |
| (Millions) | | USCS | | CS | | ICS | | GMNS | | Total |
| Balance as of December 31, 2022 | | $ | 379 | | | $ | 2,122 | | | $ | 725 | | | $ | 560 | | | $ | 3,786 | |
| Acquisitions | | — | | | 30 | | | — | | | 18 | | | 48 | |
| Dispositions | | — | | | — | | | — | | | — | | | — | |
Other (a) | | — | | | (1) | | | 18 | | | — | | | 17 | |
| Balance as of December 31, 2023 | | $ | 379 | | | $ | 2,151 | | | $ | 743 | | | $ | 578 | | | $ | 3,851 | |
Acquisitions (b) | | 394 | | | — | | | — | | | — | | | 394 | |
| Dispositions | | — | | | — | | | — | | | (27) | | | (27) | |
Other (a) | | (1) | | | (3) | | | (27) | | | — | | | (31) | |
| Balance as of December 31, 2024 | | $ | 772 | | | $ | 2,148 | | | $ | 716 | | | $ | 551 | | | $ | 4,187 | |
(a)Primarily includes foreign currency translation.
(b)Includes the acquisition of a reservation, table and event management technology provider.
Accumulated impairment losses were $221 million as of both December 31, 2024 and 2023.
OTHER INTANGIBLE ASSETS
Intangible assets are amortized on a straight-line basis over their estimated useful lives of 1 to 22 years. We review long-lived assets and asset groups, including intangible assets, for impairment whenever events and circumstances indicate their carrying amounts may not be recoverable. An impairment is recognized if the carrying amount is not recoverable and exceeds the asset or asset group’s fair value.
The gross carrying amount for Other intangible assets as of December 31, 2024 and 2023 was $642 million and $717 million, respectively, with accumulated amortization of $519 million and $619 million, respectively.
Amortization expense was $46 million, $49 million and $51 million for the years ended December 31, 2024, 2023 and 2022, respectively. For Other intangible assets on the Consolidated Balance Sheets as of December 31, 2024, amortization expense is expected to be $35 million in 2025, $25 million in 2026, $23 million in 2027, $18 million in 2028, $15 million in 2029 and $7 million thereafter.
TAX CREDIT INVESTMENTS
We hold tax credit investments that promote affordable housing, community development, and small businesses that foster economic growth in underserved areas and support compliance with the Community Reinvestment Act by our U.S. bank subsidiary, American Express National Bank (AENB). These investments generate a return primarily through the realization of income tax credits and other income tax benefits.
As of December 31, 2024 and 2023, we had $1,568 million and $1,369 million in tax credit investments, respectively, included in Other assets on the Consolidated Balance Sheets, comprised of Low-Income Housing Tax Credit (LIHTC) investments and other qualifying investments. We account for such tax credit investments using the Proportional Amortization Method.
As of December 31, 2024 and 2023, $1,168 million and $1,126 million of our tax credit investments, respectively, related to investments in unconsolidated VIEs for which we do not have a controlling financial interest.
As of December 31, 2024, we committed to provide funding related to certain of our tax credit investments, which is expected to be paid between 2025 and 2040, resulting in $682 million in unfunded commitments reported in Other liabilities, of which $401 million specifically related to unconsolidated VIEs.
In addition, as of December 31, 2024, we had contractual off-balance sheet obligations to provide additional funding up to $4 million for these tax credit investments, fully related to unconsolidated VIEs. We may be required to fund these amounts between 2025 and 2034.
The following table presents tax credit investment expenses and associated income tax credits and other income tax benefits for the years ended December 31:
TABLE 6.3: TAX CREDIT INVESTMENT EXPENSES, INCOME TAX CREDITS AND OTHER BENEFITS
| | | | | | | | | | | | | | | | | | | | |
| (Millions) | | 2024 | | 2023 | | 2022 |
| Proportional amortization recognized in tax provision | | $ | 193 | | | $ | 185 | | | $ | 161 | |
| Equity method expenses recognized in Other, net expenses | | $ | — | | | $ | — | | | $ | 9 | |
Income tax credits and Other income tax benefits (a) recognized in tax provision | | $ | 221 | | | $ | 204 | | | $ | 196 | |
(a)Other income tax benefits are a result of tax deductible expenses generated by our tax credit investments.
Income tax credits and other income tax benefits associated with our tax credit investments are also recognized in the Consolidated Statements of Cash Flows in the Operating activities section primarily under Accounts payable and other liabilities.
NOTE 7
CUSTOMER DEPOSITS
As of December 31, customer deposits were categorized as interest-bearing or non-interest-bearing as follows:
TABLE 7.1: INTEREST-BEARING AND NON-INTEREST-BEARING CUSTOMER DEPOSITS | | | | | | | | | | | | | | |
| (Millions) | | 2024 | | 2023 |
| U.S.: | | | | |
| Interest-bearing | | $ | 138,433 | | | $ | 128,146 | |
| Non-interest-bearing (includes Card Member credit balances of: 2024, $513; 2023, $495) | | 566 | | | 557 | |
| Non-U.S.: | | | | |
| Interest-bearing | | 17 | | | 12 | |
| Non-interest-bearing (includes Card Member credit balances of: 2024, $395; 2023, $426) | | 397 | | | 429 | |
| Total customer deposits | | $ | 139,413 | | | $ | 129,144 | |
Customer deposits by deposit type as of December 31 were as follows:
TABLE 7.2: CUSTOMER DEPOSITS BY TYPE | | | | | | | | | | | | | | |
| (Millions) | | 2024 | | 2023 |
| U.S. interest-bearing deposits: | | | | |
| Savings accounts | | $ | 108,364 | | | $ | 92,324 | |
| Checking accounts | | 2,045 | | | 1,398 | |
| Certificates of deposit: | | | | |
| Direct | | 4,303 | | | 5,557 | |
| Third-party (brokered) | | 8,109 | | | 12,960 | |
| Sweep accounts ― Third-party (brokered) | | 15,612 | | | 15,907 | |
| Total U.S. interest-bearing deposits | | $ | 138,433 | | | $ | 128,146 | |
| Other deposits | | 72 | | | 77 | |
| | | | |
| | | | |
| Card Member credit balances | | 908 | | | 921 | |
| Total customer deposits | | $ | 139,413 | | | $ | 129,144 | |
The scheduled maturities of certificates of deposit as of December 31, 2024 were as follows:
TABLE 7.3: SCHEDULED MATURITIES OF CERTIFICATES OF DEPOSIT | | | | | | | | | | | | | | | | | | | | | | | | | | | | | | | | | | | | | | | | | | | | |
| (Millions) | | 2025 | | 2026 | | 2027 | | 2028 | | 2029 | | After 5 years | | Total |
Certificates of deposit (a) | | $ | 7,409 | | | $ | 2,244 | | | $ | 1,399 | | | $ | 701 | | | $ | 669 | | | $ | — | | | $ | 12,422 | |
(a)Includes $10 million of non-U.S. direct certificates of deposit as of December 31, 2024.
As of December 31, 2024 and 2023, certificates of deposit in denominations that met or exceeded the insured limit were $1.4 billion and $1.8 billion, respectively.
NOTE 8
DEBT
SHORT-TERM BORROWINGS
Our short-term borrowings outstanding, defined as borrowings with original contractual maturity dates of less than one year, as of December 31 were as follows:
TABLE 8.1: SHORT-TERM BORROWINGS | | | | | | | | | | | | | | | | | | | | | | | | | | |
| | 2024 | | 2023 |
| (Millions, except percentages) | | Outstanding Balance | | Year-End Stated Interest Rate on Debt (a) | | Outstanding Balance | | Year-End Stated Interest Rate on Debt (a) |
| | | | | | | | |
Short-term borrowings (b) | | $ | 1,374 | | | 2.47 | % | | $ | 1,293 | | | 1.03 | % |
| Total | | $ | 1,374 | | | 2.47 | % | | $ | 1,293 | | | 1.03 | % |
(a)For floating-rate issuances, the stated interest rates are weighted based on the outstanding principal balances and interest rates in effect as of December 31, 2024 and 2023.
(b)Includes borrowings from banks and book overdrafts with banks, which represents negative cash balances for accounts with an associated overdraft facility, due to timing differences arising in the ordinary course of business.
As of December 31, 2024, we maintained a three-year committed, revolving, secured borrowing facility, with a maturity date of September 15, 2026, which gives us the right to sell up to $3.0 billion face amount of eligible certificates issued from the Lending Trust. This facility enhances our contingent funding resources and is also used in the ordinary course of business to fund working capital needs. The facility was undrawn as of both December 31, 2024 and 2023. Additionally, certain of our subsidiaries maintained total committed lines of credit of $191 million and $185 million as of December 31, 2024 and 2023, respectively. As of December 31, 2024 and 2023, $16 million and nil were drawn on these committed lines of credit, respectively.
We paid $11.9 million and $12.0 million in fees to maintain the secured borrowing facility in 2024 and 2023, respectively. The committed facility does not contain a material adverse change clause, which might otherwise preclude borrowing under the facility, nor is it dependent on our credit rating.
LONG-TERM DEBT
Our long-term debt outstanding, defined as debt with original contractual maturity dates of one year or greater, as of December 31 was as follows:
TABLE 8.2: LONG-TERM DEBT | | | | | | | | | | | | | | | | | | | | | | | | | | | | | | | | | | | | | | | | | | | | |
| | 2024 | | 2023 |
| (Millions, except percentages) | | Original
Contractual
Maturity
Dates | | Outstanding Balance(a) | | Year-End Interest Rate on Debt(b) | | Year-End Interest Rate with Swaps(b)(c) | | Outstanding Balance(a) | | Year-End Interest Rate on Debt(b) | | Year-End Interest Rate with Swaps(b)(c) |
American Express Company
(Parent Company only) | | | | | | | | | | | | | | |
| Fixed Rate Senior Notes | | 2025 - 2042 | | $ | 14,582 | | | 3.66 | % | | 3.80 | % | | $ | 20,930 | | | 3.48 | % | | 4.14 | % |
| Floating Rate Senior Notes | | 2025 - 2028 | | 3,000 | | | 5.49 | | | | | 2,400 | | | 6.21 | | | — | |
| Fixed-to-Floating Rate Senior Notes | | 2026 - 2035 | | 15,973 | | | 5.35 | | | 5.57 | | | 8,769 | | | 5.38 | | | 5.91 | |
| Fixed Rate Subordinated Notes | | | | — | | | — | | | — | | | 586 | | | 3.63 | | | 6.74 | |
| Fixed-to-Floating Rate Subordinated Notes | | 2033 - 2035 | | 1,742 | | | 5.44 | | | 5.80 | | | 1,257 | | | 5.24 | | | 5.92 | |
| American Express Credit Corporation | | | | | | | | | | | | | | |
| Fixed Rate Senior Notes | | 2027 | | 333 | | | 3.30 | | | — | | | 330 | | | 3.30 | | | — | |
| | | | | | | | | | | | | | |
| Lending Trust | | | | | | | | | | | | | | |
| Fixed Rate Senior Notes | | 2025 - 2029 | | 13,934 | | | 4.23 | | | 4.32 | | | 13,449 | | | 3.36 | | | 3.49 | |
| | | | | | | | | | | | | | |
| | | | | | | | | | | | | | |
| | | | | | | | | | | | | | |
| | | | | | | | | | | | | | |
| | | | | | | | | | | | | | |
| | | | | | | | | | | | | | |
| Other | | | | | | | | | | | | | | |
| | | | | | | | | | | | | | |
| Floating Rate Borrowings | | 2025 - 2027 | | 247 | | | 0.76 | | | — | % | | 238 | | | 0.42 | | | — | % |
| Unamortized Underwriting Fees | | | | (96) | | | | | | | (93) | | | | | |
| Total Long-Term Debt | | | | $ | 49,715 | | | 4.51 | % | | | | $ | 47,866 | | | 3.96 | % | | |
(a)The outstanding balances include (i) unamortized discount, (ii) the impact of movements in exchange rates on foreign currency denominated debt and (iii) the impact of fair value hedge accounting on certain fixed-rate notes that have been swapped to floating rate through the use of interest rate swaps. Refer to Note 13 for more details on our treatment of fair value hedges.
(b)For floating-rate issuances, the stated interest rate on debt is weighted based on the outstanding principal balances and interest rates in effect as of December 31, 2024 and 2023.
(c)Interest rates with swaps are only presented when swaps are in place to hedge the underlying debt. The interest rates with swaps are weighted based on the outstanding principal balances and the interest rates on the floating leg of the swaps in effect as of December 31, 2024 and 2023.
Aggregate annual maturities on long-term debt obligations (based on contractual maturity or anticipated redemption dates) as of December 31, 2024 were as follows:
TABLE 8.3: ANNUAL MATURITIES ON LONG-TERM DEBT | | | | | | | | | | | | | | | | | | | | | | | | | | | | | | | | | | | | | | | | | | | | |
| (Millions) | | 2025 | | 2026 | | 2027 | | 2028 | | 2029 | | Thereafter | | Total |
| American Express Company (Parent Company only) | | $ | 5,250 | | | $ | 6,700 | | | $ | 8,012 | | | $ | 3,700 | | | $ | 2,500 | | | $ | 9,623 | | | $ | 35,785 | |
| American Express Credit Corporation | | — | | | — | | | 339 | | | — | | | — | | | — | | | 339 | |
| Lending Trust | | 7,250 | | | 2,100 | | | 2,200 | | | 1,350 | | | 1,000 | | | | | 13,900 | |
| | | | | | | | | | | | | | |
| Other | | 57 | | | 63 | | | 127 | | | | | | | | | 247 | |
| | $ | 12,557 | | | $ | 8,863 | | | $ | 10,678 | | | $ | 5,050 | | | $ | 3,500 | | | $ | 9,623 | | | $ | 50,271 | |
| Unamortized Underwriting Fees | | | | | | | | | | | | | | (96) | |
| Unamortized Discount and Premium | | | | | | | | | | | | | | (487) | |
| Impacts due to Fair Value Hedge Accounting | | | | | | | | | | | | | | 27 | |
| Total Long-Term Debt | | | | | | | | | | | | | | $ | 49,715 | |
We maintained a committed syndicated bank credit facility of $4.0 billion as of both December 31, 2024 and 2023, all of which was undrawn as of the respective dates. The facility has a maturity date of October 30, 2026, and the availability of the facility is subject to compliance with certain covenants, principally our maintenance of a minimum Common Equity Tier 1 (CET1) risk-based capital ratio of 4.5 percent, with certain restrictions in relation to either accessing the facility or distributing capital to common shareholders in the event our CET1 risk-based capital ratio falls between 4.5 percent and 6.5 percent. As of December 31, 2024 and 2023, we were in compliance with the covenants contained in the credit facility.
Additionally, we maintained a three-year committed, revolving, secured borrowing facility that gives us the right to sell up to $3.0 billion face amount of eligible notes issued from the Charge Trust at any time through July 15, 2026. As of both December 31, 2024 and 2023, no amounts were outstanding on this facility.
We paid $14.2 million and $20.2 million in fees to maintain these lines in 2024 and 2023, respectively. These committed facilities do not contain material adverse change clauses, which might otherwise preclude borrowing under the credit facilities, nor are they dependent on our credit rating.
We paid total interest, primarily related to short- and long-term debt, corresponding interest rate swaps and customer deposits, of $8.2 billion, $6.4 billion and $2.2 billion in 2024, 2023 and 2022, respectively.
NOTE 9
OTHER LIABILITIES
The following is a summary of Other liabilities as of December 31:
TABLE 9.1: OTHER LIABILITIES | | | | | | | | | | | | | | |
| (Millions) | | 2024 | | 2023 |
| Membership Rewards liability | | $ | 14,752 | | | $ | 13,742 | |
| Deferred card and other fees, net | | 4,042 | | | 3,442 | |
Book overdraft balances (a) | | 3,461 | | | 9,897 | |
Employee-related liabilities (b) | | 2,676 | | | 2,567 | |
Card Member rebate and reward accruals (c) | | 2,121 | | | 2,061 | |
Income tax liability (d) | | 1,386 | | | 1,275 | |
Other (e) | | 8,373 | | | 8,655 | |
| Total | | $ | 36,811 | | | $ | 41,639 | |
(a)Primarily includes negative cash balances for accounts without an associated overdraft facility, due to timing differences arising in the ordinary course of business.
(b)Includes employee benefit plan obligations and incentive compensation.
(c)Card Member rebate and reward accruals include payments to third-party reward partners and cash-back rewards.
(d)Includes repatriation tax liability of $749 million and $998 million as of December 31, 2024 and 2023, respectively, which represents our remaining obligation under the Tax Cuts and Jobs Act enacted on December 22, 2017 to pay a one-time transition tax on unrepatriated earnings and profits of certain foreign subsidiaries, the net position for current federal, state and non-U.S. income tax liabilities and deferred tax liabilities for foreign jurisdictions.
(e)Primarily includes prepaid products and Travelers Cheques, lease liabilities, accruals for general operating expenses, unfunded commitments for tax credit investments, payments to cobrand partners, dividends payable and client incentives.
MEMBERSHIP REWARDS
The Membership Rewards program allows enrolled Card Members to earn points that can be redeemed for a broad variety of rewards including, but not limited to, travel, shopping, gift cards and statement credits. We record a Membership Rewards liability that represents our best estimate of the cost of points earned that are expected to be redeemed by Card Members in the future. The weighted average cost (WAC) per point and the Ultimate Redemption Rate (URR) are the key assumptions used to estimate the liability. We use statistical and actuarial models to estimate the URR based on redemption trends, card product type, enrollment tenure, card spend levels and credit attributes. The WAC per point assumption is derived from 12 months of redemptions and is adjusted as appropriate for certain changes in redemption costs that are not representative of future cost expectations and expected developments in redemption patterns.
The expense for Membership Rewards points is included in Card Member rewards expense. We periodically evaluate our liability estimation process and assumptions based on changes in cost per point redeemed, partner contract changes and developments in redemption patterns, which may be impacted by product refreshes, changes in redemption options and mix of proprietary cards-in-force.
DEFERRED CARD AND OTHER FEES, NET
The carrying amount of deferred card and other fees, net of deferred direct acquisition costs and reserves for membership cancellations, as of December 31 was as follows:
TABLE 9.2: DEFERRED CARD AND OTHER FEES, NET | | | | | | | | | | | | | | |
| (Millions) | | 2024 | | 2023 |
Deferred card and other fees (a) | | $ | 4,475 | | | $ | 3,818 | |
| Deferred direct acquisition costs | | (180) | | | (158) | |
| Reserves for membership cancellations | | (253) | | | (218) | |
| Deferred card and other fees, net | | $ | 4,042 | | | $ | 3,442 | |
(a)Includes deferred fees for Membership Rewards program participants.
NOTE 10
STOCK-BASED COMPENSATION
STOCK OPTION AND AWARD PROGRAMS
Under our 2016 Incentive Compensation Plan (amended and restated effective May 6, 2024) and previously under our 2007 Incentive Compensation Plan, awards may be granted to colleagues and other individuals who perform services for us. These awards may be in the form of stock options, or in the form of restricted stock units and awards (collectively referred to as RSUs), or other incentives or similar awards designed to meet the requirements of non-U.S. jurisdictions.
There were a total of 20 million, 7 million and 9 million common shares unissued and available for grant as of December 31, 2024, 2023 and 2022, respectively, as authorized by our Board of Directors and shareholders. We generally issue new common shares upon exercise of options, vesting of restricted stock units and granting of restricted stock awards.
Stock-based compensation expense recognized in Salaries and employee benefits in the Consolidated Statements of Income was $508 million, $450 million and $373 million in 2024, 2023 and 2022, respectively, with corresponding income tax benefits of $124 million, $110 million and $90 million in those respective periods.
Our stock options and RSUs outstanding as of December 31, 2024, and changes during the year, are as follows:
TABLE 10.1: STOCK OPTIONS AND RSUs OUTSTANDING | | | | | | | | | | | | | | | | | | | | | | | | | | | | | | | | | | | | | | |
| | | Stock Options | | Service-Based RSUs | | Service and Performance-Based RSUs |
| (Numbers in thousands) | | Number | | Weighted-Average
Exercise Price | | Number | | Weighted- Average Grant- Date Fair Value | | Number | | Weighted- Average Grant- Date Fair Value |
| Outstanding as of December 31, 2023 | | 3,553 | | | $ | 119.80 | | | 1,827 | | | $ | 159.95 | | | 3,296 | | | $ | 144.64 | |
| Granted | | 273 | | | 201.07 | | | 922 | | | 204.68 | | | 1,223 | | | 176.09 | |
| Options exercised/RSUs vested | | (1,108) | | | 91.39 | | | (844) | | | 155.92 | | | (1,284) | | | 108.44 | |
| Forfeited | | — | | | — | | | (98) | | | 182.64 | | | (209) | | | 169.93 | |
| Expired | | — | | | — | | | — | | | — | | | — | | | — | |
| Outstanding as of December 31, 2024 | | 2,718 | | | 139.54 | | | 1,807 | | | $ | 183.41 | | | 3,026 | | | $ | 170.97 | |
| Options vested and expected to vest as of December 31, 2024 | | 2,718 | | | 139.54 | | | | | | | | | |
| Options exercisable as of December 31, 2024 | | 1,047 | | | $ | 99.23 | | | | | | | | | |
Stock-based compensation expense is generally recognized ratably based on the grant-date fair value of the awards, net of expected forfeitures, over the vesting period. Generally, the vesting period is the time from the grant date to the earlier of the vesting date defined in each award agreement or the date the colleague will become eligible to retire. Retirement eligibility is dependent upon age and/or years of service.
STOCK OPTIONS
Each stock option has an exercise price equal to the market price of our common stock on the grant date. Stock options generally vest on the third anniversary of, and have a contractual term of 10 years from, the grant date.
The fair value of options without market conditions is estimated on the grant date using a Black-Scholes-Merton option-pricing model. The following weighted-average assumptions were used for options granted in 2024, 2023 and 2022:
TABLE 10.2: WEIGHTED-AVERAGE ASSUMPTIONS FOR OPTIONS GRANTED | | | | | | | | | | | | | | | | | | | | |
| | 2024 | | 2023 | | 2022 |
| Dividend yield | | 1.5 | % | | 1.4 | % | | 1.0 | % |
Expected volatility(a) | | 31 | % | | 32 | % | | 31 | % |
| Risk-free interest rate | | 3.9 | % | | 3.5 | % | | 1.7 | % |
Expected life of stock option (in years)(b) | | 6.9 | | 7.1 | | 7.1 |
| Weighted-average fair value per option | | $ | 68.79 | | | $ | 60.03 | | | $ | 55.30 | |
(a)The expected volatility is based on historical and implied volatilities of our common stock price.
(b)The expected life of stock options was determined using historical option exercise behavior.
Certain executives were awarded a grant of stock options on October 31, 2022 that vest, subject to achieving performance and market conditions. These options vest in tranches on the third and fourth anniversaries from the grant date, subject to continued employment through the applicable anniversary, and have a contractual term of seven years. The fair value was estimated at the grant date using a Monte Carlo valuation model assuming a dividend yield of 1.4 percent, expected volatility (based on historical and implied volatilities of our common stock price) of 34 percent, risk-free rate of 3.9 percent and an expected life of seven years, resulting in a fair value of $50.10.
The weighted-average remaining contractual life and the aggregate intrinsic value (the amount by which the fair value of our stock price exceeds the exercise price of the option) of the stock options outstanding, exercisable, and vested and expected to vest as of December 31, 2024, were as follows:
TABLE 10.3: WEIGHTED-AVERAGE CONTRACTUAL LIFE AND AGGREGATE INTRINSIC VALUE OF OPTIONS | | | | | | | | | | | | | | | | | | | | |
| | Outstanding | | Exercisable | | Vested and
Expected to Vest |
Weighted-average remaining contractual life (in years) | | 5.3 | | 3.7 | | 5.3 |
Aggregate intrinsic value (millions) | | $ | 427 | | | $ | 207 | | | $ | 427 | |
As of December 31, 2024, there was $19 million of total unrecognized compensation cost related to unvested options, which will be recognized over the weighted-average remaining vesting period of 1.3 years.
For stock options that were exercised during 2024, 2023 and 2022, the intrinsic value, based upon the fair value of our stock price at the date the options were exercised, was $179 million, $26 million and $56 million, respectively; cash received by the Company from the exercise of stock options was $100 million, $28 million and $56 million during those respective periods. The income tax benefit recognized in the Consolidated Statements of Income related to stock option exercises was $25 million, $4 million and $9 million in 2024, 2023 and 2022, respectively.
RESTRICTED STOCK UNITS/AWARDS
We grant RSUs that contain either a) service conditions or b) both service and performance conditions. RSUs containing only service conditions generally vest ratably over three years, or four years for awards granted prior to 2022, beginning with the first anniversary of the grant date. RSUs containing both service and performance conditions generally vest on the third anniversary of the grant date, and the number of shares earned generally ranges from zero to 120 percent of target depending on the achievement of predetermined Company metrics. RSU holders receive dividend equivalents or dividends.
Performance-based RSUs include a relative total shareholder return (r-TSR) modifier so that our actual shareholder return relative to a comparable peer group is one of the performance conditions that determines the number of shares ultimately issued upon vesting.
The fair value of RSUs that do not include the r-TSR modifier, including those that contain only service conditions, is measured using our stock price on the grant date. The fair value of service and performance-based RSUs that include the r-TSR modifier is determined using a Monte Carlo valuation model using assumptions based on the historical volatility of our common stock price, the historical correlations of our common stock price with that of each of the companies in the performance peer group and the risk-free interest rate, each for a period equal to the estimated remaining performance period. The weighted averages of the following assumptions used in 2024, 2023 and 2022 were:
TABLE 10.4: RSU VALUATION MODEL WEIGHTED-AVERAGE ASSUMPTIONS | | | | | | | | | | | | | | | | | | | | |
| | 2024 | | 2023 | | 2022 |
| Expected volatility | | 30 | % | | 45 | % | | 42 | % |
| Risk-free interest rate | | 4.0 | % | | 3.7 | % | | 1.4 | % |
Remaining performance period (in years) | | 2.9 | | 2.9 | | 2.9 |
As of December 31, 2024, there was $266 million of total unrecognized compensation cost related to non-vested RSUs, which will be recognized over the weighted-average remaining vesting period of 1.8 years.
The weighted-average grant-date fair value of RSUs granted in 2024, 2023 and 2022 was $188.37, $163.88 and $168.26, respectively.
For RSUs vested during 2024, 2023 and 2022, the total fair value, based upon our stock price at the date the RSUs vested, was $437 million, $389 million and $323 million, respectively.
LIABILITY-BASED AWARDS
Other incentive awards can be settled with cash or equity shares at our discretion and final approval from the Compensation and Benefits Committee. These awards are generally settled with cash and thus are classified as liabilities; therefore, the fair value is determined at the grant date and remeasured quarterly as part of compensation expense over the vesting period. Cash paid upon vesting of these awards in 2024, 2023 and 2022 was $60 million, $55 million and $50 million, respectively.
NOTE 11
RETIREMENT PLANS
DEFINED CONTRIBUTION RETIREMENT PLANS
We sponsor defined contribution retirement plans, the principal plan being the Retirement Savings Plan (RSP), a 401(k) savings plan with a profit-sharing component. The RSP is a tax-qualified retirement plan subject to the Employee Retirement Income Security Act of 1974 and covers most colleagues in the United States. The total expense for all defined contribution retirement plans globally was $365 million, $380 million and $259 million in 2024, 2023 and 2022, respectively.
DEFINED BENEFIT PENSION AND OTHER POSTRETIREMENT BENEFIT PLANS
Our primary defined benefit pension plans that cover certain colleagues in the United States and United Kingdom are closed to new entrants and existing participants do not accrue any additional benefits. Some colleagues outside the United States and United Kingdom are covered by local retirement plans, some of which are funded, while other colleagues receive payments at the time of retirement or termination under applicable labor laws or agreements. We comply with minimum funding requirements in all countries. We also sponsor unfunded other postretirement benefit plans that provide health care and life insurance to certain retired colleagues in the United States. For these plans, the total net benefit was $18 million, $12 million and $24 million in 2024, 2023 and 2022, respectively.
We recognize the funded status of our defined benefit pension plans and other postretirement benefit plans, measured as the difference between the fair value of the plan assets and the projected benefit obligation, on the Consolidated Balance Sheets. As of December 31, 2024 and 2023, the unfunded status related to the defined benefit pension plans and other postretirement benefit plans was $88 million and $212 million, respectively, and is recorded in Other liabilities.
NOTE 12
CONTINGENCIES AND COMMITMENTS
CONTINGENCIES
In the ordinary course of business, we and our subsidiaries are subject to various pending and potential legal actions, arbitration proceedings, claims, investigations, examinations, regulatory proceedings, information gathering requests, subpoenas, inquiries and matters relating to compliance with laws and regulations (collectively, legal proceedings).
Based on our current knowledge, and taking into consideration our litigation-related liabilities, we do not believe we are a party to, nor are any of our properties the subject of, any legal proceeding that would have a material adverse effect on our consolidated financial condition or liquidity. However, in light of the uncertainties involved in such matters, including the fact that some pending legal proceedings are at preliminary stages or seek an indeterminate amount of damages, penalties or fines, it is possible that the outcome of legal proceedings could have a material impact on our results of operations. Certain legal proceedings involving us or our subsidiaries are described below.
On September 30, 2024, we were named as a defendant in a case filed in the United States District Court for the District of Massachusetts, captioned Pizza Hazel, Inc., et al. v. American Express Co., et al., in which plaintiffs allege that the anti-steering and non-discrimination provisions in our merchant agreements violate federal antitrust law and that the arbitration provision in our merchant agreements violates federal antitrust law to the extent it prevents antitrust challenges to our anti-steering and non-discrimination provisions. Plaintiffs seek, on behalf of themselves and a class of merchants that accept through the OptBlue Program, unspecified damages and an injunction prohibiting us from enforcing our anti-steering and non-discrimination provisions and prohibiting us from enforcing our arbitration provision to the extent it prevents antitrust challenges to our anti-steering and non-discrimination provisions.
On March 21, 2024, we were named as a defendant in a case filed in the United States District Court for the District of Rhode Island, captioned 5-Star General Store aka Bento LLC, et al. v. American Express Co., et al., in which plaintiffs allege that the anti-steering and non-discrimination provisions in our merchant agreements violate federal antitrust law and seek, on behalf of themselves and a class of merchants, an injunction prohibiting us from enforcing our anti-steering and non-discrimination provisions and a declaration that we have violated antitrust laws.
On January 29, 2019, we were named in a putative class action brought in the United States District Court for the Eastern District of New York, captioned Anthony Oliver, et al. v. American Express Company and American Express Travel Related Services Company Inc., in which the plaintiffs are holders of MasterCard, Visa and/or Discover credit and/or debit cards (but not American Express cards) and allege they paid higher prices as a result of the anti-steering and non-discrimination provisions in our merchant agreements in violation of federal antitrust law and the antitrust and consumer laws of various states. Plaintiffs seek unspecified damages and other forms of relief. The court dismissed plaintiffs’ federal antitrust claim, numerous state antitrust and consumer protection claims and their unjust enrichment claim. For the remaining state antitrust or consumer protection claims, the court certified classes for (i) holders of Visa and MasterCard debit cards in eight states and Washington, D.C.; and (ii) holders of Visa, MasterCard and Discover credit cards that do not offer rewards or charge an annual fee in two states and Washington, D.C.
On March 8, 2016, plaintiffs B&R Supermarket, Inc. d/b/a Milam’s Market and Grove Liquors LLC, on behalf of themselves and others, filed a suit, captioned B&R Supermarket, Inc. d/b/a Milam’s Market, et al. v. Visa Inc., et al., for violations of the Sherman Antitrust Act, the Clayton Antitrust Act, California’s Cartwright Act and unjust enrichment in the United States District Court for the Northern District of California, against American Express Company, other credit and charge card networks, other issuing banks and EMVCo, LLC. Plaintiffs allege that the defendants, through EMVCo, conspired to shift liability for fraudulent, faulty and otherwise rejected consumer credit card transactions from themselves to merchants after the implementation of EMV chip payment terminals. Plaintiffs seek damages and injunctive relief. On May 4, 2017, the California court transferred the case to the United States District Court for the Eastern District of New York. On August 28, 2020, the court granted plaintiffs’ motion for class certification. On August 14, 2024, the court granted our motion to compel arbitration as to class members who are subject to our merchant agreements, but did not stay the claims pending arbitration. On November 15, 2024, we appealed to the Second Circuit requesting a stay of all claims against us that are subject to arbitration.
In 2006, Mawarid Investments Limited filed a request for confidential arbitration under the 1998 London Court of International Arbitration Rules in connection with certain claims arising under a shareholders agreement between Mawarid and American Express Travel Related Services Company, Inc. relating to a joint venture between the parties, Amex (Middle East) BSC(c) (AEME). In 2008, the tribunal rendered a partial award, including a direction that an audit should take place to verify whether acquirer discount revenue related to transactions occurring with airlines located in the Middle East region had been properly allocated to AEME since its inception in 1992. In September 2021, the tribunal rendered a further partial award regarding the location of transactions through non-physical channels. In May 2022, the tribunal further clarified the 2021 partial award and the discount rate that should apply to transactions through non-physical channels. In December 2024, the tribunal rendered a further partial award providing further clarifications on the allocation of revenue. A final award is expected in 2025.
In May 2020, we began responding to a review by the Office of the Comptroller of the Currency (OCC) and the Department of Justice (DOJ) Civil Division regarding historical sales practices relating to sales to small business customers in the United States. In January 2021, we received a grand jury subpoena from the United States Attorney’s Office for the Eastern District of New York (EDNY) regarding these sales practices issues, as well as a Civil Investigative Demand from the Consumer Financial Protection Bureau (CFPB) pertaining to its investigation into sales practices related to consumers. We have also been made aware of a related investigation by the New York Department of Financial Services (NYDFS) and have provided information regarding these sales practices issues to The Board of Governors of the Federal Reserve System (Federal Reserve).
In January 2023, the CFPB notified us that its investigation was completed and that it did not intend to recommend an enforcement action be taken against us at that time. In July 2023, we reached a settlement with the OCC to resolve its review of historical sales practices to certain U.S. small business card customers that occurred between 2015 and 2017. In January 2025, we announced that we entered into agreements with the EDNY and DOJ Civil Division and reached an agreement in principle with the Staff of the Federal Reserve to resolve their investigations into historical sales practices for certain U.S. small business customers, which we ended in 2021 or earlier. Pursuant to the agreements and after crediting, we are required to pay approximately $230 million in total to resolve these matters.
We are being challenged in a number of countries regarding our application of value-added taxes (VAT) to certain of our international transactions, which are in various stages of audit, or are being contested in legal actions. While we believe we have complied with all applicable tax laws, rules and regulations in the relevant jurisdictions, the tax authorities may determine that we owe additional VAT. In certain jurisdictions where we are contesting the assessments, we were required to pay the VAT assessments prior to contesting.
Our legal proceedings range from cases brought by a single plaintiff to class actions with millions of putative class members to governmental proceedings. These legal proceedings involve various lines of business and a variety of claims (including, but not limited to, common law tort, contract, application of tax laws, antitrust and consumer protection claims), some of which present novel factual allegations and/or unique legal theories. While some matters pending against us specify the damages sought, many seek an unspecified amount of damages or are at very early stages of the legal process. Even when the amount of damages claimed against us are stated, the claimed amount may be exaggerated and/or unsupported. As a result, some matters have not yet progressed sufficiently through discovery and/or development of important factual information and legal issues to enable us to estimate an amount of loss or a range of possible loss, while other matters have progressed sufficiently such that we are able to estimate an amount of loss or a range of possible loss.
We have accrued for certain of our outstanding legal proceedings. An accrual is recorded when it is both (a) probable that a loss has occurred and (b) the amount of loss can be reasonably estimated. There may be instances in which an exposure to loss exceeds the accrual. We evaluate, on a quarterly basis, developments in legal proceedings that could cause an increase or decrease in the amount of the accrual that has been previously recorded, or a revision to the disclosed estimated range of possible losses, as applicable.
For those disclosed legal proceedings where a loss is reasonably possible in future periods, whether in excess of a recorded accrual for legal or tax contingencies, or where there is no such accrual, and for which we are able to estimate a range of possible loss, the current estimated range is zero to $160 million in excess of any accruals related to those matters. This range represents management’s estimate based on currently available information and does not represent our maximum loss exposure; actual results may vary significantly. As such legal proceedings evolve, we may need to increase our range of possible loss or recorded accruals. In addition, it is possible that significantly increased merchant steering or other actions impairing the Card Member experience as a result of an adverse resolution in one or any combination of the disclosed merchant cases could have a material adverse effect on our business and results of operations.
COMMITMENTS
Total lease expense is recorded in Other, net expenses in the Consolidated Statements of Income and includes rent expenses, adjustments for rent concessions, rent escalations and leasehold improvement allowances and is recognized on a straight-line basis over the lease term. Total lease expense was $189 million, $164 million and $188 million for the years ended December 31, 2024, 2023 and 2022, respectively.
Lease liabilities are recognized at the present value of the contractual fixed lease payments, discounted using our incremental borrowing rate as of the lease commencement date or upon modification of the lease. Lease liabilities outstanding were $933 million and $926 million as of December 31, 2024 and 2023, respectively. The weighted average remaining lease term was 17 years and 19 years as of December 31, 2024 and 2023, respectively. The weighted average rate used to discount lease commitments was 4 percent and 3 percent as of December 31, 2024 and 2023, respectively.
The following represents the maturities of our outstanding lease commitments as of December 31, 2024:
TABLE 12.1: MATURITIES OF OUTSTANDING LEASE COMMITMENTS | | | | | | | | |
| (Millions) | | |
| 2025 | | $ | 160 | |
| 2026 | | 146 | |
| 2027 | | 129 | |
| 2028 | | 121 | |
| 2029 | | 106 | |
| Thereafter | | 771 | |
Total Outstanding Fixed Lease Payments (a) | | $ | 1,433 | |
| Less: Amount representing interest | | $ | (500) | |
| Lease Liabilities | | $ | 933 | |
(a)Excludes $346 million related to leases that were not yet commenced but were commitments as of December 31, 2024.
As of December 31, 2024, we had approximately $12.9 billion in financial commitments outstanding related to agreements with certain cobrand partners under which we are required to make a certain level of minimum payments over the life of the agreement, generally ranging from five to ten years. Generally, such commitments are designed to be satisfied by the payment we make to such cobrand partners primarily based on Card Members’ spending and earning rewards on their cobrand cards and as we acquire new Card Members. In the event these payments do not fully satisfy the commitment, we generally pay the cobrand partner up to the amount of the commitment in exchange for an equivalent value of reward points.
Our U.S. bank subsidiary, AENB, is a member of the Federal Reserve System and is therefore required to subscribe to a certain amount of shares issued by its Federal Reserve District Bank, with half of the subscribed amount paid up front. As of both December 31, 2024 and 2023, AENB held shares with a carrying value of $132 million, with the remaining half subject to call by the Federal Reserve District Bank Board, the likelihood of which we believe is remote.
NOTE 13
DERIVATIVES AND HEDGING ACTIVITIES
We use derivative financial instruments to manage exposures to various market risks. These instruments derive their value from an underlying variable or multiple variables, including interest rates and foreign exchange rates, and are carried at fair value on the Consolidated Balance Sheets. These instruments enable end users to increase, reduce or alter exposure to various market risks and, for that reason, are an integral component of our market risk management. We do not transact in derivatives for trading purposes.
Market risk is the risk to earnings or asset and liability values resulting from movements in market prices. Our market risk exposures include:
•Interest rate risk due to changes in the relationship between the interest rates on our assets (such as loans, receivables and investment securities) and the interest rates on our liabilities (such as debt and deposits); and
•Foreign exchange risk related to transactions, funding, investments and earnings in currencies other than the U.S. dollar.
We centrally monitor market risks using market risk limits and escalation triggers as defined in our Asset/Liability Management Policy. Our market exposures are in large part by-products of the delivery of our products and services.
Interest rate risk primarily arises through the funding of Card Member receivables and fixed-rate loans with variable-rate borrowings, as well as through the risk to net interest margin from changes in the relationship between benchmark rates such as Prime, the secured overnight financing rate and the overnight indexed swap rate. Interest rate exposure within our charge card and fixed-rate lending products is managed by varying the proportion of total funding provided by short-term and variable-rate debt and deposits compared to fixed-rate debt and deposits. In addition, interest rate swaps are used from time to time to economically convert fixed-rate debt obligations to variable-rate obligations, or to convert variable-rate debt obligations to fixed-rate obligations. We may change the mix between variable-rate and fixed-rate funding based on changes in business volumes and mix, among other factors.
Foreign exchange exposures arise in four principal ways: (1) Card Member spending in currencies that are not the billing currency, (2) cross-currency transactions and balances from our funding activities, (3) cross-currency investing activities, such as in the equity of foreign subsidiaries and (4) revenues generated and expenses incurred in foreign currencies, which impact earnings. Our foreign exchange risk is managed primarily by entering into agreements to buy and sell currencies on a spot basis or by hedging this market exposure, to the extent it is economical, through various means, including the use of derivatives such as foreign exchange forwards.
Derivatives may give rise to counterparty credit risk, which is the risk that a derivative counterparty will default on, or otherwise be unable to perform pursuant to, an uncollateralized derivative exposure. We manage this risk by considering the current exposure, which is the replacement cost of contracts on the measurement date, as well as estimating the maximum potential future exposure of the contracts over the next 12 months, considering such factors as the volatility of the underlying or reference index. To mitigate derivative credit risk, counterparties are required to be pre-approved by us and rated as investment grade, and counterparty risk exposures are centrally monitored.
A majority of our derivative assets and liabilities as of December 31, 2024 and 2023 are subject to master netting agreements with our derivative counterparties. Accordingly, where appropriate, we have elected to present derivative assets and liabilities with the same counterparty on a net basis in the Consolidated Balance Sheets. To further mitigate counterparty credit risk, we exercise our rights under executed credit support agreements with the respective derivative counterparties for our bilateral interest rate swaps and select foreign exchange contracts. These agreements require that, in the event the fair value change in the net derivatives position between the two parties exceeds certain dollar thresholds, the party in the net liability position posts collateral to its counterparty. All derivative contracts cleared through a central clearinghouse are collateralized to the full amount of the fair value of the contracts.
In relation to our credit risk, certain of our bilateral derivative agreements include provisions that allow our counterparties to terminate the relevant agreement in the event of a downgrade of our debt credit rating below investment grade and settle the outstanding net liability position. As of December 31, 2024, these derivatives were not in a material net liability position and we had no material risk exposure to any individual derivative counterparty. Based on our assessment of the credit risk of our derivative counterparties and our own credit risk as of December 31, 2024 and 2023, no credit risk adjustment to the derivative portfolio was required.
Our derivatives are carried at fair value on the Consolidated Balance Sheets. The accounting for changes in fair value depends on the instruments’ intended use and the resulting hedge designation, if any, as discussed below. Refer to Note 14 for a description of our methodology for determining the fair value of derivatives.
The following table summarizes the total fair value, excluding interest accruals, of derivative assets and liabilities as of December 31:
TABLE 13.1: FAIR VALUE OF DERIVATIVE ASSETS AND LIABILITIES | | | | | | | | | | | | | | | | | | | | | | | | | | |
| | Other Assets Fair Value | | Other Liabilities Fair Value |
| (Millions) | | 2024 | | 2023 | | 2024 | | 2023 |
| Derivatives designated as hedging instruments: | | | | | | | | |
Fair value hedges - Interest rate contracts (a) | | $ | — | | | $ | — | | | $ | 23 | | | $ | 99 | |
| Net investment hedges - Foreign exchange contracts | | 340 | | | 9 | | | 18 | | | 455 | |
| Total derivatives designated as hedging instruments | | 340 | | | 9 | | | 41 | | | 554 | |
| Derivatives not designated as hedging instruments: | | | | | | | | |
| Foreign exchange contracts and other | | 666 | | | 71 | | | 90 | | | 423 | |
| Total derivatives, gross | | 1,006 | | | 80 | | | 131 | | | 977 | |
Derivative asset and derivative liability netting (b) | | (91) | | | (57) | | | (91) | | | (57) | |
Cash collateral netting (c) | | (18) | | | — | | | (23) | | | (106) | |
| Total derivatives, net | | $ | 897 | | | $ | 23 | | | $ | 17 | | | $ | 814 | |
(a)For our centrally cleared derivatives, variation margin payments are legally characterized as settlement payments as opposed to collateral.
(b)Represents the amount of netting of derivative assets and derivative liabilities executed with the same counterparty under an enforceable master netting arrangement.
(c)Represents the offsetting of the fair value of bilateral interest rate contracts and certain foreign exchange contracts with the right to cash collateral held from the counterparty or cash collateral posted with the counterparty.
We posted $368 million and $175 million as of December 31, 2024 and 2023, respectively, as initial margin on our centrally cleared interest rate swaps; such amounts are recorded within Other assets on the Consolidated Balance Sheets and are not netted against the derivative balances.
DERIVATIVE FINANCIAL INSTRUMENTS THAT QUALIFY FOR HEDGE ACCOUNTING
Derivatives executed for hedge accounting purposes are documented and designated as such when we enter into the contracts. In accordance with our risk management policies, we structure our hedges with terms similar to those of the item being hedged. We formally assess, at inception of the hedge accounting relationship and on a quarterly basis, whether derivatives designated as hedges are highly effective in offsetting the fair value or cash flows of the hedged items. These assessments usually are made through the application of a regression analysis method. If it is determined that a derivative is not highly effective as a hedge, we will discontinue the application of hedge accounting.
FAIR VALUE HEDGES
A fair value hedge involves a derivative designated to hedge our exposure to future changes in the fair value of an asset or a liability, or an identified portion thereof, that is attributable to a particular risk.
Interest Rate Contracts
We are exposed to interest rate risk associated with our fixed-rate debt obligations. At the time of issuance, certain fixed-rate long-term debt obligations are designated in fair value hedging relationships, using interest rate swaps, to economically convert the fixed interest rate to a floating interest rate. We had $18.9 billion and $11.7 billion of fixed-rate debt obligations designated in fair value hedging relationships as of December 31, 2024 and 2023, respectively.
Gains or losses on the fair value hedging instrument principally offset the losses or gains on the hedged item attributable to the hedged risk. The changes in the fair value of the derivative and the changes in the hedged item may not fully offset due to differences between a debt obligation’s interest rate and the benchmark rate, primarily due to credit spreads at inception of the hedging relationship that are not reflected in the fair value of the interest rate swap.
The following table presents the gains and losses recognized in Interest expense on the Consolidated Statements of Income associated with the fair value hedges of our fixed-rate long-term debt for the years ended December 31:
TABLE 13.2: GAINS AND LOSSES ASSOCIATED WITH FAIR VALUE HEDGES ON FIXED-RATE LONG TERM DEBT | | | | | | | | | | | | | | | | | | | | |
| | Gains (losses) |
| (Millions) | | 2024 | | 2023 | | 2022 |
| Fixed-rate long-term debt | | $ | 26 | | | $ | (289) | | | $ | 473 | |
| Derivatives designated as hedging instruments | | (27) | | | 290 | | | (476) | |
| Total | | $ | (1) | | | $ | 1 | | | $ | (3) | |
The carrying values of the hedged liabilities, recorded within Long-term debt on the Consolidated Balance Sheets, were $18.9 billion and $11.7 billion as of December 31, 2024 and 2023, respectively, including the cumulative amount of fair value hedging adjustments of $27 million and $53 million for the respective periods.
We recognized in Interest expense on Long-term debt net increases of $254 million and $189 million for the years ended December 31, 2024 and 2023, respectively and a net decrease of $57 million for the year ended December 31, 2022. These were primarily related to the net settlements including interest accruals on our interest rate derivatives designated as fair value hedges.
NET INVESTMENT HEDGES
A net investment hedge is used to hedge future changes in currency exposure of a net investment in a foreign operation. We primarily designate foreign currency derivatives as net investment hedges to reduce our exposure to changes in currency exchange rates on our investments in non-U.S. subsidiaries. We had notional amounts of approximately $14.3 billion and $14.1 billion of foreign currency derivatives designated as net investment hedges as of December 31, 2024 and 2023, respectively. The gain or loss on net investment hedges, net of taxes, recorded in AOCI as part of the cumulative translation adjustment, was a gain of $816 million, a loss of $640 million and a gain of $237 million for the years ended December 31, 2024, 2023 and 2022, respectively. Net investment hedge reclassifications out of AOCI into the Consolidated Statements of Income were not significant for the years ended December 31, 2024, 2023 and 2022, respectively.
DERIVATIVES NOT DESIGNATED AS HEDGES
We have derivatives that act as economic hedges, but are not designated as such for hedge accounting purposes. Foreign currency transactions from time to time may be partially or fully economically hedged through foreign currency contracts, primarily foreign exchange forwards. These hedges generally mature within one year. Foreign currency contracts involve the purchase and sale of designated currencies at an agreed upon rate for settlement on a specified date.
The changes in the fair value of derivatives that are not designated as hedges are primarily intended to offset the related foreign exchange gains or losses of the underlying foreign currency exposures. We had notional amounts of approximately $28.8 billion and $25.3 billion as of December 31, 2024 and 2023, respectively. The changes in the fair value of the derivatives and the related underlying foreign currency exposures resulted in net gains of $102 million, $82 million and $8 million for the years ended December 31, 2024, 2023 and 2022, respectively, that are recognized in Other, net expenses in the Consolidated Statements of Income.
Our embedded derivative related to seller earnout shares granted to us upon the completion of a business combination in the second quarter of 2022 between our equity method investee, American Express Global Business Travel, and Apollo Strategic Growth Capital (C Ordinary Shares of GBT JerseyCo Limited) had a notional amount of $78 million as of both December 31, 2024 and 2023. This embedded derivative had a fair value of $31 million and $18 million as of December 31, 2024 and 2023, respectively. The changes in the fair value of the embedded derivative resulted in a gain of $13 million, a loss of $9 million and a gain of $4 million for the years ended December 31, 2024, 2023 and 2022, respectively, which were recognized in Service fees and other revenue in the Consolidated Statements of Income.
NOTE 14
FAIR VALUES
Fair value is defined as the price that would be required to sell an asset or paid to transfer a liability in an orderly transaction between market participants at the measurement date, based on the principal or, in the absence of a principal, most advantageous market for the specific asset or liability.
GAAP provides for a three-level hierarchy of inputs to valuation techniques used to measure fair value, defined as follows:
•Level 1 ― Inputs that are quoted prices (unadjusted) for identical assets or liabilities in active markets that the entity can access.
•Level 2 ― Inputs other than quoted prices included within Level 1 that are observable for the asset or liability, either directly or indirectly, for substantially the full term of the asset or liability, including:
– Quoted prices for similar assets or liabilities in active markets;
– Quoted prices for identical or similar assets or liabilities in markets that are not active;
– Inputs other than quoted prices that are observable for the asset or liability; and
– Inputs that are derived principally from or corroborated by observable market data by correlation or other means.
•Level 3 ― Inputs that are unobservable and reflect our own estimates about the estimates market participants would use in pricing the asset or liability based on the best information available in the circumstances (e.g., internally derived assumptions surrounding the timing and amount of expected cash flows).
We monitor the market conditions and evaluate the fair value hierarchy levels at least quarterly. For the years ended December 31, 2024 and 2023, there were no Level 3 transfers.
FINANCIAL ASSETS AND FINANCIAL LIABILITIES CARRIED AT FAIR VALUE
The following table summarizes our financial assets and financial liabilities measured at fair value on a recurring basis, categorized by GAAP’s fair value hierarchy (as described in the preceding paragraphs), as of December 31:
TABLE 14.1: FINANCIAL ASSETS AND FINANCIAL LIABILITIES MEASURED AT FAIR VALUE | | | | | | | | | | | | | | | | | | | | | | | | | | | | | | | | | | | | | | | | | | | | | | | | | | |
| | 2024 | | 2023 |
| (Millions) | | Total | | Level 1 | | Level 2 | | Level 3 | | Total | | Level 1 | | Level 2 | | Level 3 |
| Assets: | | | | | | | | | | | | | | | | |
Investment securities: (a) | | | | | | | | | | | | | | | | |
| Equity securities | | $ | 48 | | | $ | 48 | | | $ | — | | | $ | — | | | $ | 66 | | | $ | 66 | | | $ | — | | | $ | — | |
| Debt securities | | 1,192 | | | — | | | 1,115 | | | 77 | | | 2,120 | | | — | | | 2,046 | | | 74 | |
Derivatives, gross (a)(b) | | 1,006 | | | — | | | 975 | | | 31 | | | 80 | | | — | | | 62 | | | 18 | |
| Total Assets | | 2,246 | | | 48 | | | 2,090 | | | 108 | | | 2,266 | | | 66 | | | 2,108 | | | 92 | |
| Liabilities: | | | | | | | | | | | | | | | | |
Derivatives, gross (a) | | 131 | | | — | | | 131 | | | — | | | 977 | | | — | | | 977 | | | — | |
| Total Liabilities | | $ | 131 | | | $ | — | | | $ | 131 | | | $ | — | | | $ | 977 | | | $ | — | | | $ | 977 | | | $ | — | |
(a)Refer to Note 4 for the fair values of investment securities and to Note 13 for the fair values of derivative assets and liabilities, on a further disaggregated basis.
(b)Level 3 fair value reflects an embedded derivative. Management reviews and applies judgment to the valuation of the embedded derivative that is performed by an independent third party using a Monte Carlo simulation that models a range of probable future stock prices based on implied volatility in a risk neutral framework. Refer to Note 13 for additional information about this embedded derivative.
VALUATION TECHNIQUES USED IN THE FAIR VALUE MEASUREMENT OF FINANCIAL ASSETS AND FINANCIAL LIABILITIES CARRIED AT FAIR VALUE
For the financial assets and liabilities measured at fair value on a recurring basis (categorized in the valuation hierarchy table above), we apply the following valuation techniques:
Investment Securities
When available, quoted prices of identical investment securities in active markets are used to estimate fair value. Such investment securities are classified within Level 1 of the fair value hierarchy.
When quoted prices of identical investment securities in active markets are not available, the fair values for our investment securities are obtained primarily from pricing services engaged by us, and we receive one price for each security. The fair values provided by the pricing services are estimated using pricing models, where the inputs to those models are based on observable market inputs or recent trades of similar securities. Such investment securities are classified within Level 2 of the fair value hierarchy. The inputs to the valuation techniques applied by the pricing services vary depending on the type of security being priced but are typically benchmark yields, benchmark security prices, credit spreads, prepayment speeds, reported trades and broker-dealer quotes, all with reasonable levels of transparency. The pricing services did not apply any adjustments to the pricing models used. In addition, we did not apply any adjustments to prices received from the pricing services.
We reaffirm our understanding of the valuation techniques used by our pricing services at least annually. In addition, we corroborate the prices provided by our pricing services by comparing them to alternative pricing sources. In instances where price discrepancies are identified between different pricing sources, we evaluate such discrepancies to ensure that the prices used for our valuation represent the fair value of the underlying investment securities. Refer to Note 4 for additional information on investment securities.
Within Level 3 of the fair value hierarchy are our holdings of debt securities issued by Community Development Financial Institutions. We take the carrying value for these investment securities to be a reasonable proxy for their fair value unless we determine, based on our internal credit model, that there are indicators that the contractual cash flows will not be received in full.
Derivative Financial Instruments
The fair value of our Level 2 derivative financial instruments is estimated by using third-party pricing models, where the inputs to those models are readily observable from active markets. The pricing models used are consistently applied and reflect the contractual terms of the derivatives as described below. We reaffirm our understanding of the valuation techniques at least annually and validate the valuation output on a quarterly basis.
The fair value of our interest rate swaps is determined based on a discounted cash flow method using the following significant inputs: the contractual terms of the swap such as the notional amount, fixed coupon rate, floating coupon rate and tenor, as well as discount rates consistent with the underlying economic factors of the currency in which the cash flows are denominated.
The fair value of foreign exchange forward contracts is determined based on a discounted cash flow method using the following significant inputs: the contractual terms of the forward contracts such as the notional amount, maturity dates and contract rate, as well as relevant foreign currency forward curves, and discount rates consistent with the underlying economic factors of the currency in which the cash flows are denominated.
Our Level 3 derivative financial instrument represents an embedded derivative in the form of C Ordinary Shares of GBT JerseyCo Limited. The fair valuation is performed by an independent third party using a Monte Carlo Simulation technique that models a range of probable future stock prices using the following significant inputs: term of the earnout, initial stock price, annual expected volatility of the common stock over the expected term, annual risk-neutral rate of return over the contractual term and dividend yield, which is further reviewed by management.
Credit valuation adjustments are necessary when the market parameters, such as a benchmark curve, used to value derivatives are not indicative of our credit quality or that of our counterparties. We consider the counterparty credit risk by applying an observable forecasted default rate to the current exposure. Refer to Note 13 for additional information on derivative financial instruments.
FINANCIAL ASSETS AND FINANCIAL LIABILITIES CARRIED AT OTHER THAN FAIR VALUE
The following tables summarize the estimated fair values of our financial assets and financial liabilities that are measured at amortized cost, and not required to be carried at fair value on a recurring basis, as of December 31, 2024 and 2023. The fair values of these financial instruments are estimates based upon the market conditions and perceived risks as of December 31, 2024 and 2023, and require management’s judgment. These figures may not be indicative of future fair values, nor can the fair value of American Express be estimated by aggregating the amounts presented.
TABLE 14.2: FAIR VALUE OF FINANCIAL ASSETS AND FINANCIAL LIABILITIES MEASURED AT AMORTIZED COST | | | | | | | | | | | | | | | | | | | | | | | | | | | | | | | | |
2024 (Billions) | | Carrying
Value | | Corresponding Fair Value Amount |
| | Total | | Level 1 | | Level 2 | | Level 3 |
| Financial Assets: | | | | | | | | | | |
Financial assets for which carrying values equal or
approximate fair value | | | | | | | | | | |
Cash and cash equivalents(a) | | $ | 41 | | | $ | 41 | | | $ | 39 | | | $ | 2 | | | $ | — | |
Other financial assets(b) | | 63 | | | 63 | | | — | | | 63 | | | — | |
| Financial assets carried at other than fair value | | | | | | | | | | |
Card Member and Other loans, less reserves(c) | | 143 | | | 149 | | | — | | | — | | | 149 | |
| Card Member loans HFS | | 1 | | | 1 | | | — | | | — | | | 1 | |
| | | | | | | | | | |
| Financial Liabilities: | | | | | | | | | | |
| Financial liabilities for which carrying values equal or approximate fair value | | 155 | | | 155 | | | — | | | 155 | | | — | |
| Financial liabilities carried at other than fair value | | | | | | | | | | |
Certificates of deposit(d) | | 12 | | | 12 | | | — | | | 12 | | | — | |
Long-term debt(c) | | $ | 50 | | | $ | 50 | | | $ | — | | | $ | 50 | | | $ | — | |
| | | | | | | | | | | | | | | | | | | | | | | | | | | | | | | | |
2023 (Billions) | | Carrying
Value | | Corresponding Fair Value Amount |
| | Total | | Level 1 | | Level 2 | | Level 3 |
| Financial Assets: | | | | | | | | | | |
Financial assets for which carrying values equal or
approximate fair value | | | | | | | | | | |
Cash and cash equivalents(a) | | $ | 47 | | | $ | 47 | | | $ | 45 | | | $ | 2 | | | $ | — | |
Other financial assets(b) | | 63 | | | 63 | | | — | | | 63 | | | — | |
| Financial assets carried at other than fair value | | | | | | | | | | |
Card Member and Other loans, less reserves(c) | | 128 | | | 133 | | | — | | | — | | | 133 | |
| | | | | | | | | | |
| Financial Liabilities: | | | | | | | | | | |
| Financial liabilities for which carrying values equal or approximate fair value | | 143 | | | 143 | | | — | | | 143 | | | — | |
| Financial liabilities carried at other than fair value | | | | | | | | | | |
Certificates of deposit(d) | | 19 | | | 18 | | | — | | | 18 | | | — | |
Long-term debt(c) | | $ | 48 | | | $ | 48 | | | $ | — | | | $ | 48 | | | $ | — | |
(a)Level 2 fair value amounts reflect time deposits and short-term investments.
(b)Balances include Card Member receivables (including fair values of Card Member receivables of $3.9 billion and $4.6 billion held by a consolidated VIE as of December 31, 2024 and 2023, respectively), other receivables and other miscellaneous assets.
(c)Balances include amounts held by a consolidated VIE for which the fair values of Card Member loans were $28.3 billion and $28.6 billion as of December 31, 2024 and 2023, respectively, and the fair values of Long-term debt were $14.0 billion and $13.3 billion as of December 31, 2024 and 2023, respectively.
(d)Presented as a component of Customer deposits on the Consolidated Balance Sheets.
VALUATION TECHNIQUES USED IN THE FAIR VALUE MEASUREMENT OF FINANCIAL ASSETS AND FINANCIAL LIABILITIES CARRIED AT OTHER THAN FAIR VALUE
For the financial assets and liabilities that are not required to be carried at fair value on a recurring basis (categorized in the valuation hierarchy table), we apply the following valuation techniques to measure fair value:
Financial Assets For Which Carrying Values Equal Or Approximate Fair Value
Financial assets for which carrying values equal or approximate fair value include cash and cash equivalents, Card Member receivables, accrued interest and certain other assets. For these assets, the carrying values approximate fair value because they are short term in duration, have no defined maturity or have a market-based interest rate.
Financial Assets Carried At Other Than Fair Value
Card Member and Other loans, less reserves
Card Member and Other loans are recorded at historical cost, less reserves, on the Consolidated Balance Sheets. In estimating the fair value for our loans, we use a discounted cash flow model. Due to the lack of a comparable whole loan sales market for similar loans and the lack of observable pricing inputs thereof, we use various inputs to estimate fair value. Such inputs include projected income, discount rates and forecasted write-offs. The valuation does not include economic value attributable to future receivables generated by the accounts associated with the loans.
Card Member loans HFS
The fair value of Card Member loans HFS is generally determined on an aggregate portfolio basis, using similar methodologies and inputs as those used for estimating the fair value of Card Member loans not HFS, as described above.
Financial Liabilities For Which Carrying Values Equal Or Approximate Fair Value
Financial liabilities for which carrying values equal or approximate fair value include accrued interest, customer deposits (excluding certificates of deposit, which are described further below), Travelers Cheques and other prepaid products outstanding, accounts payable, short-term borrowings and certain other liabilities for which the carrying values approximate fair value because they are short term in duration, have no defined maturity or have a market-based interest rate.
Financial Liabilities Carried At Other Than Fair Value
Certificates of Deposit
Certificates of deposit (CDs) are recorded at their historical issuance cost on the Consolidated Balance Sheets. Fair value is estimated using a discounted cash flow methodology based on the future cash flows and the discount rate that reflects the current market rates for similar types of CDs within similar markets.
Long-term Debt
Long-term debt is recorded at historical issuance cost on the Consolidated Balance Sheets adjusted for (i) unamortized discount and unamortized fees, (ii) the impact of movements in exchange rates on foreign currency denominated debt and (iii) the impact of fair value hedge accounting on certain fixed-rate notes that have been swapped to floating rate through the use of interest rate swaps. The fair value of our long-term debt is measured using quoted offer prices when quoted market prices are available. If quoted market prices are not available, the fair value is determined by discounting the future cash flows of each instrument at rates currently observed in publicly-traded debt markets for debt of similar terms and credit risk. For long-term debt, where there are no rates currently observable in publicly traded debt markets of similar terms and comparable credit risk, we use market interest rates and adjust those rates for necessary risks, including our own credit risk. In determining an appropriate spread to reflect our credit standing, we consider credit default swap spreads, bond yields of other long-term debt offered by us, and interest rates currently offered to us for similar debt instruments of comparable maturities.
NONRECURRING FAIR VALUE MEASUREMENTS
We have certain assets that are subject to measurement at fair value on a nonrecurring basis. For these assets, measurement at fair value in periods subsequent to their initial recognition is applicable if they are determined to be impaired or where there are observable price changes for equity investments without readily determinable fair values.
We estimate the Level 3 fair value of equity investments without readily determinable fair values, which include investments in our Amex Ventures portfolio, based on price changes as of the date of new similar equity financing transactions completed by the companies in the portfolio. In addition, impairments on such investments are recorded to account for the difference between the estimated fair value and carrying value of an investment based on a qualitative assessment of impairment indicators such as business performance, general market conditions and the economic and regulatory environment. When an impairment triggering event occurs, the fair value measurement is generally derived by taking into account all available information, such as share prices of publicly traded peer companies, internal valuations performed by our investees, and other third-party fair value data. The fair value of impaired investments represents a Level 3 fair value measurement.
The carrying value of equity investments without readily determinable fair values totaled $0.9 billion as of both December 31, 2024 and 2023, of which investments representing nonrecurring Level 3 fair value measurement were $1 million and nil as of December 31, 2024 and 2023, respectively. These amounts are included within Other assets on the Consolidated Balance Sheets.
We recorded unrealized gains of $85 million, $18 million and $94 million for the years ended December 31, 2024, 2023 and 2022, respectively. Unrealized losses were $37 million, $142 million and $388 million for the years ended December 31, 2024, 2023 and 2022, respectively. Unrealized gains and losses are recorded in Other, net on the Consolidated Statements of Income. Since the adoption of new accounting guidance on the recognition and measurement of financial assets and financial liabilities on January 1, 2018, cumulative unrealized gains for equity investments without readily determinable fair values totaled $1.1 billion as of both December 31, 2024 and 2023, and cumulative unrealized losses were $460 million and $431 million as of December 31, 2024 and 2023, respectively.
In addition, we also have certain equity investments measured at fair value using the net asset value practical expedient. Such investments were immaterial as of both December 31, 2024 and 2023.
NOTE 15
GUARANTEES
The maximum potential undiscounted future payments and related liability resulting from guarantees and indemnifications provided by us in the ordinary course of business were $1 billion and $10 million, respectively, as of December 31, 2024 and $1 billion and $24 million, respectively, as of December 31, 2023, all of which were primarily related to our real estate arrangements and business dispositions.
To date, we have not experienced any significant losses related to guarantees or indemnifications. Our recognition of these instruments is at fair value. In addition, we establish reserves when a loss is probable and the amount can be reasonably estimated.
NOTE 16
COMMON AND PREFERRED SHARES
The following table shows authorized shares and provides a reconciliation of common shares issued and outstanding for the years ended December 31:
TABLE 16.1: COMMON SHARES ISSUED AND OUTSTANDING | | | | | | | | | | | | | | | | | | | | |
| (Millions, except where indicated) | | 2024 | | 2023 | | 2022 |
Common shares authorized (billions) (a) | | 3.6 | | | 3.6 | | | 3.6 | |
| Shares issued and outstanding at beginning of year | | 723 | | | 743 | | | 761 | |
| Repurchases of common shares | | (24) | | | (22) | | | (20) | |
Net shares issued for RSUs and stock option exercises (b) | | 3 | | | 2 | | | 2 | |
| Shares issued and outstanding as of December 31 | | 702 | | | 723 | | | 743 | |
(a)Of the common shares authorized but unissued as of December 31, 2024, approximately 27 million shares are reserved for issuance under employee stock and employee benefit plans.
(b)Shares issued for RSUs are reported net of shares withheld for tax withholding obligations.
On March 8, 2023, the Board of Directors authorized the repurchase of up to 120 million common shares from time to time, subject to market conditions and in accordance with our capital plans. This authorization replaced the prior repurchase authorization made on September 23, 2019. During 2024, 2023 and 2022, we repurchased 24 million common shares with a cost of $5.9 billion, 22 million common shares with a cost of $3.5 billion, and 20 million common shares with a cost of $3.3 billion, respectively. The cost includes excise tax and commissions of $55 million and $32 million in 2024 and 2023, respectively, and commissions of $4 million in 2022. As of December 31, 2024, we had approximately 75 million common shares remaining under the Board share repurchase authorization.
Common shares are generally retired by us upon repurchase (except for 2.2 million, 2.3 million and 2.4 million shares held as treasury shares as of December 31, 2024, 2023 and 2022, respectively); retired common shares and treasury shares are excluded from the shares outstanding in the table above. The treasury shares, with a cost basis of $243 million, $252 million and $262 million as of December 31, 2024, 2023 and 2022, respectively, are included as a reduction to Additional paid-in capital in Shareholders’ equity on the Consolidated Balance Sheets.
PREFERRED SHARES
The Board of Directors may authorize the issuance of up to 20 million preferred shares at a par value of $1.662/3 per share without further shareholder approval. We have the following perpetual Fixed Rate Reset Noncumulative Preferred Share series issued and outstanding as of December 31, 2024:
TABLE 16.2: PREFERRED SHARES ISSUED AND OUTSTANDING | | | | | | | | | | |
| | | Series D | | |
| Issuance date | | August 3, 2021 | | |
| Securities issued | | 1,600 Preferred shares; represented by 1,600,000 depositary shares | | |
| Dividend rate per annum | | 3.55% through September 14, 2026; resets September 15, 2026 and every subsequent 5-year anniversary at 5-year Treasury rate plus 2.854% | | |
| Dividend payment date | | Quarterly beginning September 15, 2021 | | |
| Earliest redemption date | | September 15, 2026 | | |
| Aggregate liquidation preference | | $1,600 million | | |
Carrying value (a) | | $1,584 million | | |
(a)Carrying value, presented in the Statements of Shareholders’ Equity, represents the issuance proceeds, net of underwriting fees and offering costs.
In the event of the voluntary or involuntary liquidation, dissolution or winding up of the Company, the preferred shares then outstanding take precedence over our common shares for the payment of dividends and the distribution of assets out of funds legally available for distribution to shareholders. We may redeem the outstanding series of preferred shares at $1 million per preferred share (equivalent to $1,000 per depositary share) plus any declared but unpaid dividends in whole or in part, from time to time, on any dividend payment date on or after the earliest redemption date, or in whole, but not in part, within 90 days of certain bank regulatory changes.
NOTE 17
CHANGES IN ACCUMULATED OTHER COMPREHENSIVE INCOME (LOSS)
AOCI is a balance sheet item in Shareholders’ equity on the Consolidated Balance Sheets. It is comprised of items that have not been recognized in earnings but may be recognized in earnings in the future when certain events occur. Changes in each component for the three years ended December 31 were as follows: TABLE 17.1: CHANGES IN ACCUMULATED OTHER COMPREHENSIVE INCOME (LOSS)
| | | | | | | | | | | | | | | | | | | | | | | | | | | | | | | | | | | | | | | | | | | | |
| | | | | | | | | | | | | | |
| | As of or for the years ended December 31, |
(Millions), net of tax | | 2024 | | 2023 | | 2022 | | 2021 |
| | Ending Balance | | Net Change | | Ending Balance | | Net Change | | Ending Balance | | Net Change | | Ending Balance |
Net Unrealized Gains (Losses) on Debt Securities | | $ | (9) | | | $ | 5 | | | $ | (14) | | | $ | 50 | | | $ | (64) | | | $ | (87) | | | $ | 23 | |
| | | | | | | | | | | | | | |
| | | | | | | | | | | | | | |
| | | | | | | | | | | | | | |
| | | | | | | | | | | | | | |
| | | | | | | | | | | | | | |
| | | | | | | | | | | | | | |
| | | | | | | | | | | | | | |
| | | | | | | | | | | | | | |
Foreign Currency Translation Adjustment Gains (Losses), Net of Hedges (a) | | (2,924) | | | (353) | | | (2,571) | | | 51 | | | (2,622) | | | (230) | | | (2,392) | |
| Net unrealized pension and other postretirement benefit gains (losses) | | (462) | | | 25 | | | (487) | | | 37 | | | (524) | | | 52 | | (576) | |
| | | | | | | | | | | | | | |
| | | | | | | | | | | | | | |
| | | | | | | | | | | | | | |
| | | | | | | | | | | | | | |
| Accumulated other comprehensive income (loss) | | $ | (3,395) | | | $ | (323) | | | $ | (3,072) | | | $ | 138 | | | $ | (3,210) | | | $ | (265) | | | $ | (2,945) | |
(a)Refer to Note 13 for additional information on hedging activity.
The following table shows the tax impact for the years ended December 31 for the changes in each component of AOCI presented above:
TABLE 17.2: TAX IMPACT FOR CHANGES IN ACCUMULATED OTHER COMPREHENSIVE INCOME (LOSS) | | | | | | | | | | | | | | | | | | | | |
| | Tax expense (benefit) |
| (Millions) | | 2024 | | 2023 | | 2022 |
| Net unrealized gains (losses) on debt securities | | $ | 2 | | | $ | 16 | | | $ | (27) | |
| | | | | | |
| Foreign currency translation adjustment, net of hedges | | 205 | | | (158) | | | 75 | |
| Pension and other postretirement benefits | | 11 | | | (3) | | | 27 | |
| Total tax impact | | $ | 218 | | | $ | (145) | | | $ | 75 | |
Reclassifications out of AOCI into the Consolidated Statements of Income, net of taxes, for the years ended December 31, 2024, 2023 and 2022 were not significant.
NOTE 18
SERVICE FEES AND OTHER REVENUE AND OTHER EXPENSES
The following is a detail of Service fees and other revenue for the years ended December 31:
TABLE 18.1: COMPONENTS OF SERVICE FEES AND OTHER REVENUE | | | | | | | | | | | | | | | | | | | | |
| (Millions) | | 2024 | | 2023 | | 2022 |
| Service fees | | $ | 1,609 | | | $ | 1,518 | | | $ | 1,444 | |
| Foreign currency-related revenue | | 1,527 | | | 1,428 | | | 1,202 | |
| Delinquency fees | | 941 | | | 963 | | | 809 | |
| Travel commissions and fees | | 596 | | | 637 | | | 507 | |
| Other fees and revenues | | 456 | | | 459 | | | 559 | |
| Total Service fees and other revenue | | $ | 5,129 | | | $ | 5,005 | | | $ | 4,521 | |
The following is a detail of Other expenses for the years ended December 31:
TABLE 18.2: COMPONENTS OF OTHER EXPENSE | | | | | | | | | | | | | | | | | | | | |
| (Millions) | | 2024 | | 2023 | | 2022 |
| Data processing and equipment | | $ | 2,888 | | | $ | 2,805 | | | $ | 2,606 | |
| Professional services | | 2,274 | | | 2,029 | | | 2,074 | |
| | | | | | |
Gain on sale of Accertify (a) | | (531) | | | — | | | — | |
| Other | | 1,733 | | | 1,973 | | | 1,801 | |
| Total Other expenses | | $ | 6,364 | | | $ | 6,807 | | | $ | 6,481 | |
(a)Refer to Note 1 for additional information.
NOTE 19
RESTRUCTURING
We periodically initiate restructuring programs to enhance our overall effectiveness and efficiency and to support new business strategies. These programs are generally completed within a year of when they are initiated. In connection with these programs, we will typically incur severance and other exit costs.
We had $217 million, $216 million and $135 million accrued in total restructuring reserves as of December 31, 2024, 2023 and 2022, respectively. Restructuring expense, which primarily relates to new severance charges, net of revisions to existing reserves, was $123 million, $179 million and $142 million for the years ended December 31, 2024, 2023 and 2022, respectively, and is included within Salaries and employee benefits within our Consolidated Statements of Income. The cumulative cost relating to restructuring programs initiated in 2024 or in prior years that were in progress during 2024 was $400 million. There were no programs initiated prior to 2022 that were still in progress during 2024. Cumulative amounts were not material to any reportable operating segment.
NOTE 20
INCOME TAXES
The components of income tax expense for the years ended December 31 included in the Consolidated Statements of Income were as follows:
TABLE 20.1: COMPONENTS OF INCOME TAX EXPENSE | | | | | | | | | | | | | | | | | | | | |
| (Millions) | | 2024 | | 2023 | | 2022 |
| Current income tax expense: | | | | | | |
| U.S. federal | | $ | 2,368 | | | $ | 2,455 | | | $ | 2,445 | |
| U.S. state and local | | 494 | | | 351 | | | 339 | |
| Non-U.S. | | 894 | | | 662 | | | 476 | |
| Total current income tax expense | | 3,756 | | | 3,468 | | | 3,260 | |
| Deferred income tax (benefit) expense: | | | | | | |
| U.S. federal | | (797) | | | (952) | | | (763) | |
| U.S. state and local | | (146) | | | (139) | | | (117) | |
| Non-U.S. | | (47) | | | (238) | | | (309) | |
| Total deferred income tax (benefit) expense | | (990) | | | (1,329) | | | (1,189) | |
| Total income tax expense | | $ | 2,766 | | | $ | 2,139 | | | $ | 2,071 | |
A reconciliation of the U.S. federal statutory rate of 21 percent as of December 31, 2024, 2023 and 2022, to our actual income tax rate was as follows:
TABLE 20.2: RECONCILIATION OF ACTUAL INCOME TAX RATE | | | | | | | | | | | | | | | | | | | | |
| | | 2024 | | 2023 | | 2022 |
| U.S. statutory federal income tax rate | | 21.0 | % | | 21.0 | % | | 21.0 | % |
| (Decrease) increase in taxes resulting from: | | | | | | |
| Tax credits and tax-exempt income | | (0.7) | | | (0.7) | | | (0.9) | |
| State and local income taxes, net of federal benefit | | 2.5 | | | 2.4 | | | 3.1 | |
Non-U.S. subsidiaries’ earnings (a) | | (1.0) | | | (0.8) | | | (0.1) | |
| Tax settlements and lapse of statute of limitations | | (0.5) | | | (2.0) | | | (2.1) | |
| | | | | | |
| | | | | | |
| Valuation allowances | | — | | | 0.1 | | | (0.1) | |
| Other | | 0.2 | | | 0.3 | | | 0.7 | |
| Actual tax rates | | 21.5 | % | | 20.3 | % | | 21.6 | % |
(a)In certain jurisdictions outside the United States, we benefit from agreements that temporarily lower our income tax expense. The impact of these agreements was not material to our Consolidated Statements of Income.
We record a deferred income tax (benefit) provision when there are differences between assets and liabilities measured for financial reporting and for income tax return purposes. These temporary differences result in taxable or deductible amounts in future years and are measured using the tax rates and laws that will be in effect when such differences are expected to reverse.
The significant components of deferred tax assets and liabilities as of December 31 are reflected in the following table:
TABLE 20.3: COMPONENTS OF DEFERRED TAX ASSETS AND LIABILITIES | | | | | | | | | | | | | | |
| (Millions) | | 2024 | | 2023 |
| Deferred tax assets: | | | | |
| Reserves not yet deducted for tax purposes | | $ | 4,950 | | | $ | 4,552 | |
| Employee compensation and benefits | | 343 | | | 335 | |
| Net operating loss and tax credit carryforwards | | 464 | | | 466 | |
| Capitalized developed software | | 1,084 | | | 743 | |
| Other | | 853 | | | 723 | |
| Gross deferred tax assets | | 7,694 | | | 6,819 | |
| Valuation allowance | | (655) | | | (614) | |
| Deferred tax assets after valuation allowance | | 7,039 | | | 6,205 | |
| Deferred tax liabilities: | | | | |
| Intangibles and fixed assets | | 673 | | | 683 | |
| Deferred revenue | | — | | | 62 | |
| Deferred interest | | 113 | | | 114 | |
| | | | |
| Other | | 579 | | | 566 | |
| Gross deferred tax liabilities | | 1,365 | | | 1,425 | |
| Net deferred tax assets | | $ | 5,674 | | | $ | 4,780 | |
The net operating loss and tax credit carryforward balance as of December 31, 2024, shown in the table above, is related to pre-tax U.S. federal and non-U.S. net operating loss (NOL) carryforwards of $10 million and $1.2 billion, respectively, and foreign tax credit (FTC) carryforwards of $137 million. If not utilized, certain U.S. federal and non-U.S. NOL carryforwards will expire between 2025 and 2032, whereas others have an unlimited carryforward period. The FTC carryforwards will expire between 2029 and 2034.
A valuation allowance is established when management determines that it is more likely than not that all or some portion of the benefit of the deferred tax assets will not be realized. The valuation allowances for both periods presented above are associated with certain non-U.S. deferred tax assets, state NOLs, and FTC carryforwards.
Accumulated earnings of certain non-U.S. subsidiaries, which totaled approximately $1.2 billion as of December 31, 2024, are intended to be permanently reinvested outside the U.S. We do not provide for state income and foreign withholding taxes on foreign earnings intended to be permanently reinvested outside the U.S. Accordingly, state income and foreign withholding taxes, which would have aggregated to approximately $0.1 billion as of December 31, 2024, have not been provided on those earnings.
Net income taxes paid by us during 2024, 2023 and 2022, were approximately $3.6 billion, $3.3 billion and $3.0 billion, respectively. These amounts include estimated tax payments and cash settlements relating to prior tax years.
We are subject to the income tax laws of the United States, its states and municipalities and those of the foreign jurisdictions in which we operate. These tax laws are complex, and the manner in which they apply to the taxpayer’s facts is sometimes open to interpretation. Given these inherent complexities, we must make judgments in assessing the likelihood that a tax position will be sustained upon examination by the taxing authorities based on the technical merits of the tax position. A tax position is recognized only when, based on management’s judgment regarding the application of income tax laws, it is more likely than not that the tax position will be sustained upon examination. The amount of benefit recognized for financial reporting purposes is based on management’s best judgment of the largest amount of benefit that is more likely than not to be realized on ultimate settlement with the taxing authority given the facts, circumstances and information available at the reporting date. We adjust the level of unrecognized tax benefits when there is new information available to assess the likelihood of the outcome.
We are under continuous examination by the Internal Revenue Service (IRS) and tax authorities in other countries and states in which we have significant business operations. The tax years under examination and open for examination vary by jurisdiction. We are currently under examination by the IRS for the 2017 and 2018 tax years.
In December 2024, we received a Notice of Proposed Adjustment (Notice) from the IRS regarding transfer pricing between our U.S. and foreign subsidiaries for the 2017 and 2018 tax years currently under examination. The Notice proposes an increase to our U.S. taxable income that would result in an additional estimated U.S. federal income tax payment of approximately $185 million for 2017 and 2018, excluding interest and state income taxes, and asserts penalties of approximately $50 million for the same period. Although the Notice only applies to the 2017 and 2018 tax years currently under examination, the IRS may seek similar adjustments for subsequent tax years.
We strongly disagree with the IRS’s positions and plan to pursue all available remedies to vigorously contest the adjustments made by the IRS. We believe our income tax reserves are appropriate for all open tax years and that final resolution of this matter will not have a material impact on our results of operations. However, the ultimate outcome of this matter is uncertain, and if we are required to pay the IRS additional U.S. taxes, interest and/or potential penalties, our results of operations could be materially affected for the period in which the matter is resolved.
The following table presents changes in unrecognized tax benefits:
TABLE 20.4: ROLLFORWARD OF UNRECOGNIZED TAX BENEFITS | | | | | | | | | | | | | | | | | | | | |
| (Millions) | | 2024 | | 2023 | | 2022 |
| Balance, January 1 | | $ | 875 | | | $ | 962 | | | $ | 1,024 | |
| Increases: | | | | | | |
| Current year tax positions | | 161 | | | 132 | | | 119 | |
| Tax positions related to prior years | | 47 | | | 40 | | | 30 | |
| | | | | | |
| Decreases: | | | | | | |
| Tax positions related to prior years | | (4) | | | (50) | | | (30) | |
| Settlements with tax authorities | | (39) | | | (160) | | | (74) | |
| Lapse of statute of limitations | | (21) | | | (49) | | | (104) | |
| Effects of foreign currency translations | | (13) | | | — | | | (3) | |
| Balance, December 31 | | $ | 1,006 | | | $ | 875 | | | $ | 962 | |
Included in the unrecognized tax benefits of $1.0 billion, $0.9 billion and $1.0 billion for December 31, 2024, 2023 and 2022, respectively, are approximately $780 million, $670 million and $750 million, respectively, that, if recognized, would favorably affect the effective tax rate in a future period.
We believe it is reasonably possible that our unrecognized tax benefits could decrease within the next twelve months by as much as $107 million, principally as a result of potential resolutions of prior years’ tax items with various taxing authorities. The prior years’ tax items include unrecognized tax benefits relating to the deductibility of certain expenses or losses and the attribution of taxable income to a particular jurisdiction or jurisdictions. Of the $107 million of unrecognized tax benefits, approximately $84 million relates to amounts that, if recognized, would impact the effective tax rate in a future period.
Interest and penalties relating to unrecognized tax benefits are reported in the income tax provision. For the years ended December 31, 2024, 2023 and 2022, we recognized approximately $110 million, $30 million and $10 million, respectively, in expenses for interest and penalties.
We had approximately $500 million and $410 million accrued for the payment of interest and penalties as of December 31, 2024 and 2023, respectively.
NOTE 21
EARNINGS PER COMMON SHARE (EPS)
EPS is calculated using the two-class method. Under the two-class method, all earnings (distributed and undistributed) are allocated to common shares and participating securities. Undistributed earnings are calculated after deducting dividends on preferred shares, common shares and RSUs. RSUs granted under our 2016 Incentive Compensation Plan entitle recipients to receive nonforfeitable dividends during the vesting period on a basis equivalent to dividends on common shares. These unvested awards meet the definition of participating securities based on their respective rights to receive nonforfeitable dividends, and they are treated as a separate class of securities and are not included in computing basic EPS. Diluted EPS is also calculated under the treasury stock method and the more dilutive amount is reported. Participating securities are not included as incremental shares in computing diluted EPS.
The computations of basic and diluted EPS for the years ended December 31 were as follows:
TABLE 21.1: COMPUTATION OF BASIC AND DILUTED EARNINGS PER SHARE | | | | | | | | | | | | | | | | | | | | |
| (Millions, except per share amounts) | | 2024 | | 2023 | | 2022 |
| Numerator: | | | | | | |
| Basic and diluted: | | | | | | |
| Net income | | $ | 10,129 | | | $ | 8,374 | | | $ | 7,514 | |
| Preferred dividends | | (58) | | | (58) | | | (57) | |
| | | | | | |
| Net income available to common shareholders | | 10,071 | | | 8,316 | | | 7,457 | |
| Earnings allocated to participating share awards | | (76) | | | (64) | | | (57) | |
| Net income attributable to common shareholders | | $ | 9,995 | | | $ | 8,252 | | | $ | 7,400 | |
| Denominator: | | | | | | |
| Basic: Weighted-average common stock | | 712 | | | 735 | | | 751 | |
Add: Weighted-average stock options (a) | | 1 | | | 1 | | | 1 | |
| Diluted | | 713 | | | 736 | | | 752 | |
| Basic EPS | | $ | 14.04 | | | $ | 11.23 | | | $ | 9.86 | |
| Diluted EPS | | $ | 14.01 | | | $ | 11.21 | | | $ | 9.85 | |
(a)The dilutive effect of unexercised stock options excludes from the computation of EPS 0.05 million, 1.38 million and 0.39 million of options for the years ended December 31, 2024, 2023 and 2022, respectively, because inclusion of the options would have been anti-dilutive.
NOTE 22
REGULATORY MATTERS AND CAPITAL ADEQUACY
We are supervised and regulated by the Federal Reserve and are subject to the Federal Reserve’s requirements for risk-based capital and leverage ratios. Our U.S. bank subsidiary, AENB, is subject to supervision and regulation, including regulatory capital and leverage requirements, by the OCC.
Under the risk-based capital guidelines of the Federal Reserve, we are required to maintain minimum ratios of CET1, Tier 1 and Total (Tier 1 plus Tier 2) capital to risk-weighted assets, as well as a minimum Tier 1 leverage ratio (Tier 1 capital to average adjusted on-balance sheet assets) and a supplementary leverage ratio (SLR) (Tier 1 capital to both on-balance sheet and certain off-balance sheet exposures).
Failure to meet minimum capital requirements can initiate certain mandatory, and possibly additional, discretionary actions by regulators, that, if undertaken, could have a direct material effect on our operating activities.
As of December 31, 2024 and 2023, we met all capital requirements to which we were subject and maintained regulatory capital ratios in excess of those required to qualify as well capitalized.
The following table presents the regulatory capital ratios:
TABLE 22.1: REGULATORY CAPITAL RATIOS | | | | | | | | | | | | | | | | | | | | | | | | | | | | | | | | | | | | | | | | | | | | | | | | | | |
| (Millions, except percentages) | | CET 1
capital | | Tier 1 capital | | Total capital | | CET 1 capital
ratio | | Tier 1 capital
ratio | | Total capital
ratio | | Tier 1 leverage
ratio | | Supplementary
Leverage
Ratio |
December 31, 2024: (a) | | | | | | | | | | | | | | | | |
| American Express Company | | $ | 24,860 | | | $ | 26,405 | | | $ | 31,127 | | | 10.5 | % | | 11.2 | % | | 13.2 | % | | 9.8 | % | | 8.3 | % |
| American Express National Bank | | $ | 18,748 | | | $ | 18,748 | | | $ | 21,289 | | | 11.6 | % | | 11.6 | % | | 13.2 | % | | 9.6 | % | | 8.0 | % |
December 31, 2023: (a) | | | | | | | | | | | | | | | | |
| American Express Company | | $ | 23,174 | | | $ | 24,779 | | | $ | 28,784 | | | 10.5 | % | | 11.3 | % | | 13.1 | % | | 9.9 | % | | (b) |
| American Express National Bank | | $ | 17,038 | | | $ | 17,038 | | | $ | 19,548 | | | 11.6 | % | | 11.6 | % | | 13.3 | % | | 9.5 | % | | (b) |
Well-capitalized ratios (c) | | | | | | | | | | | | | | | | |
| American Express Company | | | | | | | | N/A | | 6.0 | % | | 10.0 | % | | N/A | | N/A |
| American Express National Bank | | | | | | | | 6.5 | % | | 8.0 | % | | 10.0 | % | | 5.0 | % | | N/A |
Minimum capital ratios (d) | | | | | | | | 4.5 | % | | 6.0 | % | | 8.0 | % | | 4.0 | % | | 3.0 | % |
Effective Minimum (e) | | | | | | | | | | | | | | | | |
| American Express Company | | | | | | | | 7.0 | % | | 8.5 | % | | 10.5 | % | | 4.0 | % | | 3.0 | % |
| American Express National Bank | | | | | | | | 7.0 | % | | 8.5 | % | | 10.5 | % | | 4.0 | % | | 3.0 | % |
(a)Capital ratios reported using Basel III capital definitions and risk-weighted assets using the Basel III standardized approach.
(b)We became a Category III firm in the third quarter of 2024 and thus are subject to a minimum SLR of 3 percent beginning with the fourth quarter of 2024.
(c)Represents requirements for bank holding companies and banking subsidiaries to be considered “well capitalized” pursuant to regulations issued under the Federal Reserve Regulation Y and the Federal Deposit Insurance Corporation Improvement Act, respectively. There is no CET1 capital ratio, Tier 1 leverage ratio or SLR requirement for a bank holding company to be considered “well capitalized.”
(d)As defined by the regulations issued by the Federal Reserve and OCC.
(e)Represents Basel III minimum capital requirement and applicable regulatory buffers as defined by the federal banking regulators, which includes the stress capital buffer for American Express Company and the capital conservation buffer for American Express National Bank.
RESTRICTED NET ASSETS OF SUBSIDIARIES
Certain of our subsidiaries are subject to restrictions on the transfer of net assets under debt agreements and regulatory requirements. These restrictions have not had any effect on our shareholder dividend policy and management does not anticipate any impact in the future. Procedures exist to transfer net assets between the Company and its subsidiaries, while ensuring compliance with the various contractual and regulatory constraints. As of December 31, 2024, the aggregate amount of net assets of subsidiaries that are restricted to be transferred was approximately $15.3 billion.
BANK HOLDING COMPANY DIVIDEND RESTRICTIONS
We are limited in our ability to pay dividends by the Federal Reserve, which could prohibit a dividend that would be considered an unsafe or unsound banking practice. It is the policy of the Federal Reserve that bank holding companies generally should pay dividends on preferred and common stock only out of net income available to common shareholders generated over the past year, and only if prospective earnings retention is consistent with the organization’s current and expected future capital needs, asset quality and overall financial condition. Moreover, bank holding companies are required by statute to be a source of strength to their insured depository institution subsidiaries and should not maintain dividend levels that undermine their ability to do so. On an annual basis, we are required to develop and maintain a capital plan, which includes planned dividends. We may be subject to limitations and restrictions on our dividends, if, among other things, (i) our regulatory capital ratios do not satisfy applicable minimum requirements and buffers or (ii) we are required to resubmit our capital plan.
BANK DIVIDEND RESTRICTIONS
In the year ended December 31, 2024, AENB paid dividends from retained earnings to its parent of $5.0 billion. AENB is limited in its ability to pay dividends by banking statutes, regulations and supervisory policy. In general, applicable federal and state banking laws prohibit, without first obtaining regulatory approval, insured depository institutions, such as AENB, from making dividend distributions if such distributions are not paid out of available retained earnings or would cause the institution to fail to meet capital adequacy standards. If AENB’s risk-based capital ratios do not satisfy minimum regulatory requirements and applicable buffers, it will face graduated constraints on dividends and other capital distributions. In determining the dividends to pay its parent, AENB must also consider the effects on applicable risk-based capital and leverage ratio requirements, as well as policy statements of the federal regulatory agencies. In addition, AENB’s banking regulators have authority to limit or prohibit the payment of a dividend by AENB under a number of circumstances, including if, in the banking regulator’s opinion, payment of a dividend would constitute an unsafe or unsound banking practice in light of the financial condition of the banking organization.
NOTE 23
SIGNIFICANT CREDIT CONCENTRATIONS
Concentrations of credit risk exist when changes in economic, industry or geographic factors similarly affect groups of counterparties whose aggregate credit exposure is material in relation to American Express’ total credit exposure. Our customers operate in diverse industries, economic sectors and geographic regions.
The following table details our maximum credit exposure of the on-balance sheet assets by category as of December 31:
TABLE 23.1: MAXIMUM CREDIT EXPOSURE OF ON-BALANCE SHEET ASSETS | | | | | | | | | | | | | | |
| (Billions) | | 2024 | | 2023 |
Individuals: (a) | | $ | 194 | | | $ | 178 | |
| United States | | 160 | | | 145 | |
Outside the United States (b) | | 34 | | | 33 | |
| Institutions: | | | | |
Financial services (c) | | 9 | | | 12 | |
Other (d) | | 17 | | | 17 | |
| Federal Reserve Bank | | 35 | | | 37 | |
U.S. Government and agencies (e) | | — | | | 1 | |
| Total on-balance sheet | | $ | 255 | | | $ | 245 | |
(a)Primarily reflects loans and receivables from global consumer and small business Card Members, which are governed by individual credit risk management.
(b)The geographic regions with the largest concentration outside the United States include the United Kingdom, Japan, the European Union, Australia, Canada and Mexico.
(c)Represents banks, broker-dealers, insurance companies and savings and loan associations, which are governed by institutional credit risk management.
(d)Primarily reflects loans and receivables from global corporate Card Members, which are governed by institutional credit risk management.
(e)Represent debt obligations of the U.S. Government and its agencies, states and municipalities and government-sponsored entities. Risk management for these balances is governed by our Asset and Liability Management Committee.
As of December 31, 2024 and 2023, our most significant concentration of credit risk was with individuals. These amounts are generally advanced on an unsecured basis. However, we review each potential customer’s credit application and evaluate the applicant’s financial history and ability and willingness to repay. We also consider credit performance by customer tenure, industry and geographic location in managing credit exposure.
As of December 31, 2024, we had approximately $468 billion of unused credit available to customers, approximately 80 percent of which was related to customers within the United States. Total unused credit does not represent potential future cash requirements, as a significant portion of this unused credit will likely not be drawn. Charge card products with no pre-set spending limits are not reflected in unused credit.
NOTE 24
REPORTABLE OPERATING SEGMENTS AND GEOGRAPHIC OPERATIONS
REPORTABLE OPERATING SEGMENTS
We consider a combination of factors when evaluating the composition of our reportable operating segments, including the results regularly provided to our Chief Executive Officer, who is our chief operating decision maker (CODM), economic characteristics, products and services offered, classes of customers, product distribution channels, geographic considerations (primarily United States versus outside the United States), and regulatory environment considerations.
The following is a brief description of the primary business activities of our four reportable operating segments:
•U.S. Consumer Services (USCS), which issues a wide range of proprietary consumer cards and provides services to U.S. consumers, including travel and lifestyle services as well as banking and non-card financing products. USCS also manages our dining platform that provides digital tools for restaurants and reservation bookings for diners.
•Commercial Services (CS), which issues a wide range of proprietary corporate and small business cards and provides services to U.S. businesses, including payment and expense management, banking and non-card financing products. CS also issues proprietary corporate cards and provides services to select global corporate clients.
•International Card Services (ICS), which issues a wide range of proprietary consumer, small business and corporate cards outside the United States. ICS also provides services to our international customers, including travel and lifestyle services, and manages certain international joint ventures and our loyalty coalition business.
•Global Merchant and Network Services (GMNS), which operates a global payments network that processes and settles card transactions, acquires merchants and provides multi-channel marketing programs and capabilities, services and data analytics, leveraging our global integrated network. GMNS manages our partnership relationships with third-party card issuers, merchant acquirers and a prepaid reloadable and gift card program manager, licensing the American Express brand and extending the reach of the global network.
Corporate functions and certain other businesses and operations are included in Corporate & Other.
Pretax income is used by our CODM to assess the relative performance of our operating segments and their contribution to enterprise profitability. Decisions on resource allocation by operating segment are made at the enterprise level as a function of strategic priority, operational requirements and expected return on investment of growth opportunities. The following tables present certain selected financial information for our reportable operating segments and Corporate & Other as of or for the years ended December 31, 2024, 2023 and 2022.
TABLE 24.1: SELECTED FINANCIAL INFORMATION BY SEGMENT
| | | | | | | | | | | | | | | | | | | | | | | | | | | | | | | | | | | | | | |
| (Millions) | | USCS | | CS | | ICS | | GMNS | | Corporate & Other (a) | | Consolidated |
| 2024 | | | | | | | | | | | | |
| Total non-interest revenues | | $ | 20,137 | | | $ | 13,219 | | | $ | 10,369 | | | $ | 6,729 | | | $ | (48) | | | $ | 50,406 | |
Revenue from contracts with customers (b) | | 14,481 | | | 11,559 | | | 6,766 | | | 6,051 | | | (32) | | | 38,825 | |
| Interest income | | 14,430 | | | 4,374 | | | 2,331 | | | 52 | | | 2,608 | | | 23,795 | |
| Interest expense | | 3,140 | | | 1,734 | | | 1,239 | | | (703) | | | 2,842 | | | 8,252 | |
| Net interest income | | 11,290 | | | 2,640 | | | 1,092 | | | 755 | | | (234) | | | 15,543 | |
| Total revenues net of interest expense | | 31,427 | | | 15,859 | | | 11,461 | | | 7,484 | | | (282) | | | 65,949 | |
| Provisions for credit losses | | 3,029 | | | 1,389 | | | 726 | | | 42 | | | (1) | | | 5,185 | |
| Total revenues net of interest expense after provisions for credit losses | | 28,398 | | | 14,470 | | | 10,735 | | | 7,442 | | | (281) | | | 60,764 | |
| Expenses | | | | | | | | | | | | |
Card Member rewards, business development and Card Member services (c) | | 14,329 | | | 6,504 | | | 5,243 | | | 1,148 | | | 43 | | | 27,267 | |
| Marketing | | 3,051 | | | 1,319 | | | 1,235 | | | 411 | | | 24 | | | 6,040 | |
| Salaries and employee benefits and other operating expenses | | 4,641 | | | 3,142 | | | 3,226 | | | 1,485 | | | 2,068 | | | 14,562 | |
| Total expenses | | 22,021 | | | 10,965 | | | 9,704 | | | 3,044 | | | 2,135 | | | 47,869 | |
| Pretax income (loss) | | $ | 6,377 | | | $ | 3,505 | | | $ | 1,031 | | | $ | 4,398 | | | $ | (2,416) | | | $ | 12,895 | |
| Total assets | | $ | 114,228 | | | $ | 58,969 | | | $ | 42,879 | | | $ | 17,712 | | | $ | 37,673 | | | $ | 271,461 | |
| | | | | | | | | | | | |
| | | | | | | | | | | | |
| | | | | | | | | | | | |
| | | | | | | | | | | | |
| | | | | | | | | | | | |
| | | | | | | | | | | | |
| | | | | | | | | | | | |
| | | | | | | | | | | | |
| | | | | | | | | | | | |
| | | | | | | | | | | | |
| | | | | | | | | | | | |
| | | | | | | | | | | | |
| | | | | | | | | | | | |
| | | | | | | | | | | | |
| | | | | | | | | | | | |
| | | | | | | | | | | | |
| | | | | | | | | | | | |
| | | | | | | | | | | | |
| | | | | | | | | | | | |
| | | | | | | | | | | | |
| | | | | | | | | | | | |
| | | | | | | | | | | | |
| | | | | | | | | | | | |
| | | | | | | | | | | | |
| | | | | | | | | | | | |
| | | | | | | | | | | | |
| | | | | | | | | | | | |
| | | | | | | | | | | | |
| | | | | | | | | | | | |
| | | | | | | | | | | | |
| | | | | | | | | | | | |
| | | | | | | | | | | | |
| | | | | | | | | | | | | | | | | | | | | | | | | | | | | | | | | | | | | | |
| (Millions) | | USCS | | CS | | ICS | | GMNS | | Corporate & Other (a) | | Consolidated |
| 2023 | | | | | | | | | | | | |
| Total non-interest revenues | | $ | 18,464 | | | $ | 12,931 | | | $ | 9,472 | | | $ | 6,620 | | | $ | (106) | | | $ | 47,381 | |
Revenue from contracts with customers (b) | | 13,715 | | | 11,379 | | | 6,155 | | | 6,006 | | | (37) | | | 37,218 | |
| Interest income | | 12,336 | | | 3,328 | | | 2,076 | | | 57 | | | 2,186 | | | 19,983 | |
| Interest expense | | 2,684 | | | 1,483 | | | 1,118 | | | (719) | | | 2,283 | | | 6,849 | |
| Net interest income | | 9,652 | | | 1,845 | | | 958 | | | 776 | | | (97) | | | 13,134 | |
| Total revenues net of interest expense | | 28,116 | | | 14,776 | | | 10,430 | | | 7,396 | | | (203) | | | 60,515 | |
| Provisions for credit losses | | 2,855 | | | 1,313 | | | 727 | | | 27 | | | 1 | | | 4,923 | |
| Total revenues net of interest expense after provisions for credit losses | | 25,261 | | | 13,463 | | | 9,703 | | | 7,369 | | | (204) | | | 55,592 | |
| Expenses | | | | | | | | | | | | |
Card Member rewards, business development and Card Member services (c) | | 12,808 | | | 6,332 | | | 4,588 | | | 1,218 | | | 46 | | | 24,992 | |
| Marketing | | 2,585 | | | 1,090 | | | 1,081 | | | 437 | | | 20 | | | 5,213 | |
| Salaries and employee benefits and other operating expenses | | 4,435 | | | 3,180 | | | 3,061 | | | 2,058 | | | 2,140 | | | 14,874 | |
| Total expenses | | 19,828 | | | 10,602 | | | 8,730 | | | 3,713 | | | 2,206 | | | 45,079 | |
| Pretax income (loss) | | $ | 5,433 | | | $ | 2,861 | | | $ | 973 | | | $ | 3,656 | | | $ | (2,410) | | | $ | 10,513 | |
| Total assets | | $ | 107,158 | | | $ | 55,361 | | | $ | 42,234 | | | $ | 23,714 | | | $ | 32,641 | | | $ | 261,108 | |
| | | | | | | | | | | | | | | | | | | | | | | | | | | | | | | | | | | | | | |
| (Millions) | | USCS | | CS | | ICS | | GMNS | | Corporate & Other (a) | | Consolidated |
| 2022 | | | | | | | | | | | | |
| Total non-interest revenues | | $ | 16,440 | | | $ | 12,196 | | | $ | 8,262 | | | $ | 6,123 | | | $ | (54) | | | $ | 42,967 | |
Revenue from contracts with customers (b) | | 12,478 | | | 10,844 | | | 5,301 | | | 5,603 | | | (7) | | | 34,219 | |
| Interest income | | 8,457 | | | 2,070 | | | 1,453 | | | 23 | | | 655 | | | 12,658 | |
| Interest expense | | 983 | | | 697 | | | 654 | | | (329) | | | 758 | | | 2,763 | |
| Net interest income | | 7,474 | | | 1,373 | | | 799 | | | 352 | | | (103) | | | 9,895 | |
| Total revenues net of interest expense | | 23,914 | | | 13,569 | | | 9,061 | | | 6,475 | | | (157) | | | 52,862 | |
| Provisions for credit losses | | 1,021 | | | 565 | | | 584 | | | 7 | | | 5 | | | 2,182 | |
| Total revenues net of interest expense after provisions for credit losses | | 22,893 | | | 13,004 | | | 8,477 | | | 6,468 | | | (162) | | | 50,680 | |
| Expenses | | | | | | | | | | | | |
Card Member rewards, business development and Card Member services (c) | | 10,791 | | | 6,116 | | | 3,816 | | | 1,192 | | | (11) | | | 21,904 | |
| Marketing | | 2,744 | | | 1,122 | | | 1,146 | | | 419 | | | 27 | | | 5,458 | |
| Salaries and employee benefits and other operating expenses | | 3,958 | | | 2,886 | | | 2,937 | | | 1,903 | | | 2,049 | | | 13,733 | |
| Total expenses | | 17,493 | | | 10,124 | | | 7,899 | | | 3,514 | | | 2,065 | | | 41,095 | |
| Pretax income (loss) | | $ | 5,400 | | | $ | 2,880 | | | $ | 578 | | | $ | 2,954 | | | $ | (2,227) | | | $ | 9,585 | |
| Total assets | | $ | 94,444 | | | $ | 51,411 | | | $ | 36,891 | | | $ | 20,005 | | | $ | 25,603 | | | $ | 228,354 | |
(a)Corporate & Other includes adjustments and eliminations for intersegment activity.
(b)Includes discount revenue, certain service fees and other revenue and processed revenues from customers.
(c)Card Member rewards, business development and Card Member services expenses are generally correlated to volumes or are variable based on usage.
Total Revenues Net of Interest Expense
We allocate discount revenue and certain other revenues among segments using a transfer pricing methodology. Within the USCS, CS and ICS segments, discount revenue generally reflects the issuer component of the overall discount revenue generated by each segment’s Card Members; within the GMNS segment, discount revenue generally reflects the network and acquirer component of the overall discount revenue being allocated.
Net card fees, processed revenue and certain other revenues are directly attributable to the segment in which they are reported.
Interest and fees on loans and certain investment income is directly attributable to the segment in which it is reported. Interest expense represents an allocated funding cost based on a combination of segment funding requirements and internal funding rates.
Provisions for Credit Losses
The provisions for credit losses are directly attributable to the segment in which they are reported.
Expenses
Card Member rewards, Business development and Card Member services expenses, as well as Marketing expenses, are generally included in each segment based on the actual expenses incurred. Global brand advertising, a component of Marketing expense, is primarily allocated to the segments based on the relative levels of revenue.
Salaries and employee benefits and other operating expenses reflect both costs incurred directly within each segment, as well as allocated expenses. The allocated expenses include service costs, which primarily reflect salaries and benefits associated with our technology and customer servicing groups, and overhead expenses. Service costs are allocated based on activities directly attributable to the segment, and overhead expenses are allocated based on the relative levels of revenue and Card Member loans and receivables.
GEOGRAPHIC OPERATIONS
The following table presents our total revenues net of interest expense and pretax income (loss) from continuing operations in different geographic regions based, in part, upon internal allocations, which necessarily involve management’s judgment.
TABLE 24.2: SUMMARY OF TOTAL REVENUE AND PRETAX INCOME BY REGION | | | | | | | | | | | | | | | | | | | | | | | | | | | | | | | | | | | | | | |
| (Millions) | | United States | | EMEA(a) | | APAC(a) | | LACC(a) | | Other Unallocated(b) | | Consolidated |
| 2024 | | | | | | | | | | | | |
| Total revenues net of interest expense | | $ | 51,471 | | | $ | 6,216 | | | $ | 4,698 | | | $ | 3,845 | | | $ | (281) | | | $ | 65,949 | |
| Pretax income (loss) from continuing operations | | 12,919 | | | 935 | | | 656 | | | 803 | | | (2,418) | | | 12,895 | |
| 2023 | | | | | | | | | | | | |
| Total revenues net of interest expense | | $ | 47,140 | | | $ | 5,633 | | | $ | 4,372 | | | $ | 3,571 | | | $ | (201) | | | $ | 60,515 | |
| Pretax income (loss) from continuing operations | | 10,717 | | | 854 | | | 592 | | | 760 | | | (2,410) | | | 10,513 | |
| 2022 | | | | | | | | | | | | |
| Total revenues net of interest expense | | $ | 41,396 | | | $ | 4,871 | | | $ | 3,835 | | | $ | 2,917 | | | $ | (157) | | | $ | 52,862 | |
| Pretax income (loss) from continuing operations | | 10,383 | | | 550 | | | 376 | | | 500 | | | (2,224) | | | 9,585 | |
(a)EMEA represents Europe, the Middle East and Africa; APAC represents Asia Pacific, Australia and New Zealand; and LACC represents Latin America, Canada and the Caribbean.
(b)Other Unallocated includes net costs which are not directly allocated to specific geographic regions, including costs related to the net negative interest spread on excess liquidity funding and executive office operations expenses.
NOTE 25
PARENT COMPANY
TABLE 25.1: PARENT COMPANY – CONDENSED STATEMENTS OF INCOME AND COMPREHENSIVE INCOME | | | | | | | | | | | | | | | | | | | | |
Years Ended December 31 (Millions) | | 2024 | | 2023 | | 2022 |
| Revenues | | | | | | |
| Non-interest revenues | | | | | | |
| Other | | $ | 390 | | | $ | 407 | | | $ | 388 | |
| Total non-interest revenues | | 390 | | | 407 | | | 388 | |
| Interest income | | 1,858 | | | 1,558 | | | 614 | |
| Interest expense | | 1,869 | | | 1,436 | | | 857 | |
| Total revenues net of interest expense | | 379 | | | 529 | | | 145 | |
| Expenses | | | | | | |
| Salaries and employee benefits | | 474 | | | 487 | | | 408 | |
| Other | | 385 | | | 408 | | | 372 | |
| Total expenses | | 859 | | | 895 | | | 780 | |
| Loss before income tax and equity in net income of subsidiaries | | (480) | | | (366) | | | (635) | |
| Income tax benefit | | (126) | | | (163) | | | (244) | |
| Equity in net income of subsidiaries and affiliates | | 10,483 | | | 8,577 | | | 7,905 | |
| Net income | | $ | 10,129 | | | $ | 8,374 | | | $ | 7,514 | |
| Net unrealized pension and other postretirement benefits, net of tax | | 41 | | | 5 | | | 10 | |
| Other comprehensive income (loss), net | | (364) | | | 133 | | | (275) | |
| Comprehensive income | | $ | 9,806 | | | $ | 8,512 | | | $ | 7,249 | |
TABLE 25.2: PARENT COMPANY – CONDENSED BALANCE SHEETS
| | | | | | | | | | | | | | |
As of December 31 (Millions) | | 2024 | | 2023 |
| Assets | | | | |
| Cash and cash equivalents | | $ | 7,293 | | | $ | 9,652 | |
| Equity in net assets of subsidiaries and affiliates | | 30,165 | | | 28,019 | |
| Loans to subsidiaries and affiliates | | 28,897 | | | 25,471 | |
| Due from subsidiaries and affiliates | | 1,291 | | | 1,261 | |
| Other assets | | 573 | | | 349 | |
| Total assets | | 68,219 | | | 64,752 | |
| Liabilities and Shareholders’ Equity | | | | |
| Liabilities | | | | |
| Accounts payable and other liabilities | | 2,239 | | | 2,188 | |
| Due to subsidiaries and affiliates | | 404 | | | 555 | |
| Long-term debt | | 35,312 | | | 33,952 | |
| Total liabilities | | 37,955 | | | 36,695 | |
| Shareholders’ Equity | | | | |
| Total shareholders’ equity | | 30,264 | | | 28,057 | |
| Total liabilities and shareholders’ equity | | $ | 68,219 | | | $ | 64,752 | |
TABLE 25.3: PARENT COMPANY – CONDENSED STATEMENTS OF CASH FLOWS | | | | | | | | | | | | | | | | | | | | |
Years Ended December 31 (Millions) | | 2024 | | 2023 | | 2022 |
| Cash Flows from Operating Activities | | | | | | |
| Net income | | $ | 10,129 | | | $ | 8,374 | | | $ | 7,514 | |
| Adjustments to reconcile net income to cash provided by operating activities: | | | | | | |
| Equity in net income of subsidiaries and affiliates | | (10,483) | | | (8,577) | | | (7,905) | |
| Dividends received from subsidiaries and affiliates | | 8,027 | | | 5,326 | | | 5,549 | |
| Other operating activities, primarily with subsidiaries and affiliates | | 14 | | | 360 | | | 160 | |
| Net cash provided by operating activities | | 7,687 | | | 5,483 | | | 5,318 | |
| Cash Flows from Investing Activities | | | | | | |
| | | | | | |
| Net increase in loans to subsidiaries and affiliates | | (3,449) | | | (2,836) | | | (4,850) | |
| Investments in subsidiaries and affiliates | | (55) | | | — | | | (1) | |
| Other investing activities | | 5 | | | — | | | — | |
| Net cash used in investing activities | | (3,499) | | | (2,836) | | | (4,851) | |
| Cash Flows from Financing Activities | | | | | | |
| Net decrease in short-term debt from subsidiaries and affiliates | | — | | | — | | | (136) | |
| Proceeds from long-term debt | | 8,872 | | | 9,969 | | | 13,202 | |
| Payments of long-term debt | | (7,500) | | | (5,750) | | | (5,675) | |
| | | | | | |
| | | | | | |
| Issuance of American Express common shares | | 100 | | | 28 | | | 56 | |
| Repurchase of American Express common shares and other | | (6,020) | | | (3,650) | | | (3,502) | |
| Dividends paid | | (1,999) | | | (1,780) | | | (1,565) | |
| Net cash (used in) provided by financing activities | | (6,547) | | | (1,183) | | | 2,380 | |
| Net (decrease) increase in cash and cash equivalents | | (2,359) | | | 1,464 | | | 2,847 | |
| Cash and cash equivalents at beginning of year | | 9,652 | | | 8,188 | | | 5,341 | |
| Cash and cash equivalents at end of year | | $ | 7,293 | | | $ | 9,652 | | | $ | 8,188 | |
ITEM 9. CHANGES IN AND DISAGREEMENTS WITH ACCOUNTANTS ON ACCOUNTING AND FINANCIAL DISCLOSURE
Not applicable.
ITEM 9A. CONTROLS AND PROCEDURES
Our management, with the participation of our Chief Executive Officer and Chief Financial Officer, has evaluated the effectiveness of our disclosure controls and procedures (as such term is defined in Rules 13a-15(e) and 15d-15(e) under the Securities Exchange Act of 1934, as amended (the Exchange Act)) as of the end of the period covered by this report. Based on such evaluation, our Chief Executive Officer and Chief Financial Officer have concluded that, as of the end of such period, our disclosure controls and procedures are effective and designed to ensure that the information required to be disclosed in our reports filed or submitted under the Exchange Act is recorded, processed, summarized and reported within the requisite time periods specified in the applicable rules and forms, and that it is accumulated and communicated to our management, including our Chief Executive Officer and Chief Financial Officer, as appropriate, to allow timely decisions regarding required disclosure.
There have not been any changes in our internal control over financial reporting (as such term is defined in Rules 13a-15(f) and 15d-15(f) under the Exchange Act) during the fourth quarter of 2024 that have materially affected, or are reasonably likely to materially affect, our internal control over financial reporting.
“Management’s Report on Internal Control over Financial Reporting,” which sets forth management’s evaluation of internal control over financial reporting, and the “Report of Independent Registered Public Accounting Firm” on the effectiveness of our internal control over financial reporting as of December 31, 2024 are set forth in “Financial Statements and Supplementary Data.”
ITEM 9B. OTHER INFORMATION
Rule 10b5-1 Trading Plans
On December 3, 2024, Anna Marrs, our Group President, Global Merchant and Network Services, entered into a Rule 10b5-1 trading arrangement (as defined in Item 408 of Regulation S-K under the Exchange Act), which is scheduled to expire no later than September 30, 2025. Up to 21,955 shares may be sold on the open market in accordance with the terms of Ms. Marrs’s trading arrangement. No non-Rule 10b5-1 trading arrangements (as defined in Item 408 of Regulation S-K under the Exchange Act) were adopted by any of our directors or officers (as defined in Rule 16a-1(f) under the Exchange Act) during the three months ended December 31, 2024, and no Rule 10b5-1 trading arrangements or non-Rule 10b5-1 trading arrangements were terminated by any such director or officer during such period.
ITEM 9C. DISCLOSURE REGARDING FOREIGN JURISDICTIONS THAT PREVENT INSPECTIONS
Not applicable.
PART III
ITEMS 10, 11, 12 and 13. DIRECTORS, EXECUTIVE OFFICERS AND CORPORATE GOVERNANCE; EXECUTIVE COMPENSATION; SECURITY OWNERSHIP OF CERTAIN BENEFICIAL OWNERS AND MANAGEMENT AND RELATED STOCKHOLDER MATTERS; CERTAIN RELATIONSHIPS AND RELATED TRANSACTIONS, AND DIRECTOR INDEPENDENCE
We expect to file with the SEC in March 2025 (and, in any event, not later than 120 days after the close of our last fiscal year), a definitive proxy statement, pursuant to SEC Regulation 14A in connection with our Annual Meeting of Shareholders to be held April 29, 2025, which involves the election of directors. The following information to be included in such proxy statement is incorporated herein by reference
•Information included under the caption “Corporate Governance at American Express — Our Corporate Governance Framework — Our Board’s Independence”
•Information included under the caption “Corporate Governance at American Express — Our Board Committees — Board Committee Responsibilities”
•Information included under the caption “Corporate Governance at American Express — Our Corporate Governance Framework — Director Attendance”
•Information included under the caption “Corporate Governance at American Express — Compensation of Directors”
•Information included under the caption “Stock Ownership Information”
•Information included under the caption “Corporate Governance at American Express — Our Director Nominees”
•Information included under the caption “Executive Compensation” (other than information included under the subcaption “Pay versus Performance”)
•Information under the caption “Corporate Governance at American Express — Certain Relationships and Transactions”
In addition, the information regarding executive officers called for by Item 401(b) of Regulation S-K may be found under the caption “Information About Our Executive Officers” under “Business.”
We have adopted a set of Corporate Governance Principles, which together with our Certification of Incorporation, By-Laws, the charters of the four standing committees of the Board of Directors (Audit and Compliance; Compensation and Benefits; Nominating, Governance and Public Responsibility; and Risk), our Code of Conduct (which constitutes our code of ethics) and the Code of Business Conduct for the Members of the Board of Directors, provide the framework for our governance. A complete copy of our Corporate Governance Principles, Certification of Incorporation, By-Laws, the charters of each of the Board committees, the Code of Conduct (which applies not only to our Chief Executive Officer, Chief Financial Officer and Controller, but also to all our other colleagues) and the Code of Business Conduct for the Members of the Board of Directors may be found under “Governance and Corporate Responsibility” on our Investor Relations website at https://ir.americanexpress.com. We intend to disclose any amendments to our Code of Conduct, or waivers of our Code of Conduct on behalf of our Chief Executive Officer, Chief Financial Officer or Controller, on our website. You may also access our Investor Relations website at the bottom of the Company’s homepage www.americanexpress.com. (Information from such sites is not incorporated by reference into this report.) You may also obtain free copies of these materials by writing to our Corporate Secretary at our headquarters.
We have adopted an insider trading policy governing the purchase, sale and/or other transactions in securities by employees, directors of the Company and AENB and other individuals working on behalf of us (including contractors, consultants and professionals retained by us) that we believe is reasonably designed to promote compliance with insider trading laws, rules and regulations, and the exchange listing standards applicable to us. It is our policy to comply with all federal, state and foreign securities laws and other applicable law (including by obtaining appropriate corporate approvals) when engaging in transactions in our securities.
ITEM 14. PRINCIPAL ACCOUNTANT FEES AND SERVICES
The information set forth under the heading “Audit Committee Matters — PricewaterhouseCoopers LLP Fees and Services,” which will appear in our definitive proxy statement in connection with our Annual Meeting of Shareholders to be held April 29, 2025, is incorporated herein by reference.
PART IV
ITEM 15. EXHIBIT AND FINANCIAL STATEMENT SCHEDULES
(a)
1. Financial Statements:
See the “Index to Consolidated Financial Statements” under “Financial Statements and Supplementary Data.”
2. Financial Statement Schedules:
All schedules are omitted since the required information is either not applicable, not deemed material, or shown in the Consolidated Financial Statements.
3. Exhibits:
The following exhibits are filed as part of this report. The exhibit numbers preceded by an asterisk (*) indicate exhibits electronically filed herewith. All other exhibit numbers indicate exhibits previously filed and are hereby incorporated herein by reference. Exhibits numbered 10.1 through 10.28 are management contracts or compensatory plans or arrangements.
| | | | | | | | |
| 3.1 | |
| | |
| 3.2 | |
| | |
| 4.1 | |
| | |
| 4.2 | |
| | |
| 4.3 | |
| | |
| 4.4 | Certain instruments defining the rights of holders of long-term debt securities of the Company and its subsidiaries are omitted pursuant to Section (b)(4)(iii)(A) of Item 601 of Regulation S-K. The Company hereby agrees to furnish copies of these instruments to the SEC upon request. |
| | |
| 4.5 | |
| | |
| 10.1 | |
| | |
| 10.2 | |
| | |
| 10.3 | |
| | |
| 10.4 | |
| | |
| 10.5 | |
| | |
| 10.6 | |
| | |
| 10.7 | |
| | |
| | | | | | | | |
| 10.8 | American Express Key Executive Life Insurance Plan, as amended (incorporated by reference to Exhibit 10.12 of the Company’s Annual Report on Form 10-K (Commission File No. 1-7657) for the fiscal year ended December 31, 1991). |
| | |
| 10.9 | |
| | |
| 10.10 | |
| | |
| 10.11 | |
| | |
| 10.12 | American Express Key Employee Charitable Award Program for Education (incorporated by reference to Exhibit 10.13 of the Company’s Annual Report on Form 10-K (Commission File No. 1-7657) for the year ended December 31, 1990). |
| | |
| 10.13 | American Express Company Salary/Bonus Deferral Plan (incorporated by reference to Exhibit 10.20 of the Company’s Annual Report on Form 10-K (Commission File No. 1-7657) for the year ended December 31, 1988). |
| | |
| 10.14 | |
| | |
| 10.15 | |
| | |
| 10.16 | |
| | |
| 10.17 | |
| | |
| | |
| | |
| | |
| | |
| | |
| | |
| | |
| | |
| | |
| | |
| | |
| | |
| | |
| | |
| | |
| | |
| | |
| | |
| 10.18 | |
| | |
| * | 10.19 | |
| | |
| 10.20 | |
| | |
| 10.21 | |
| | |
| | | | | | | | |
| 10.22 | |
| | |
| 10.23 | |
| | |
| 10.24 | |
| | |
| 10.25 | |
| | |
| 10.26 | |
| | |
| 10.27 | |
| | |
| 10.28 | |
| | |
| 10.29 | |
| | |
| * | 19 | |
| | |
| * | 21 | |
| | |
| * | 23 | |
| | |
| * | 31.1 | |
| | |
| * | 31.2 | |
| | |
| * | 32.1 | |
| | |
| * | 32.2 | |
| | |
| 97 | |
| | |
| | | | | | | | |
| * | 101.INS | XBRL Instance Document – The instance document does not appear in the interactive data file because its XBRL tags are embedded within the inline XBRL document |
| | |
| * | 101.SCH | XBRL Taxonomy Extension Schema Document |
| | |
| * | 101.CAL | XBRL Taxonomy Extension Calculation Linkbase Document |
| | |
| * | 101.LAB | XBRL Taxonomy Extension Label Linkbase Document |
| | |
| * | 101.PRE | XBRL Taxonomy Extension Presentation Linkbase Document |
| | |
| * | 101.DEF | XBRL Taxonomy Extension Definition Linkbase Document |
| | |
| * | 104 | Cover Page Interactive Data File (formatted as inline XBRL and contained in Exhibit 101) |
ITEM 16. FORM 10-K SUMMARY
Not applicable.
SIGNATURES
Pursuant to the requirements of Section 13 or 15(d) of the Securities Exchange Act of 1934, the Company has duly caused this report to be signed on its behalf by the undersigned, thereunto duly authorized. | | | | | | | | |
| | AMERICAN EXPRESS COMPANY |
| | /s/ CHRISTOPHE Y. LE CAILLEC |
| | Christophe Y. Le Caillec Chief Financial Officer |
February 7, 2025
Pursuant to the requirements of the Securities Exchange Act of 1934, this report has been signed below by the following persons on behalf of the Company and in the capacities and on the date indicated. | | | | | | | | |
| /s/ STEPHEN J. SQUERI | | /s/ DEBORAH P. MAJORAS |
Stephen J. Squeri
Chairman, Chief Executive Officer and Director | | Deborah P. Majoras Director |
| | |
| /s/ CHRISTOPHE Y. LE CAILLEC | | /s/ KAREN L. PARKHILL |
Christophe Y. Le Caillec Chief Financial Officer | | Karen L. Parkhill Director |
| | |
| /s/ JESSICA LIEBERMAN QUINN | | /s/ CHARLES E. PHILLIPS, JR. |
Jessica Lieberman Quinn
Executive Vice President and Corporate Controller
(Principal Accounting Officer) | | Charles E. Phillips, Jr. Director |
| | |
| /s/ THOMAS J. BALTIMORE, JR. | | /s/ LYNN A. PIKE |
Thomas J. Baltimore, Jr. Director | | Lynn A. Pike Director |
| | |
| /s/ JOHN J. BRENNAN | | /s/ DANIEL L. VASELLA |
John J. Brennan Director | | Daniel L. Vasella Director |
| | |
| /s/ WALTER J. CLAYTON III | | /s/ LISA W. WARDELL |
Walter J. Clayton III Director | | Lisa W. Wardell Director |
| | |
| /s/ THEODORE J. LEONSIS | | /s/ CHRISTOPHER D. YOUNG |
Theodore J. Leonsis Director | | Christopher D. Young Director |
| | |
| |
|
| |
|
| | |
February 7, 2025
Appendix
STATISTICAL DISCLOSURE BY BANK HOLDING COMPANIES
The accompanying supplemental information should be read in conjunction with the “MD&A,” “Consolidated Financial Statements” and notes thereto.
Distribution of Assets, Liabilities, and Shareholders’ Equity; Interest Rates and Interest Differential
The following tables provide a summary of our consolidated average balances including major categories of interest-earning assets and interest-bearing liabilities along with an analysis of net interest earnings. Consolidated average balances, interest, and average yields are segregated between U.S. and non-U.S. offices. Assets, liabilities, interest income and interest expense are attributed to the United States and outside the United States based on the location of the office recording such items. | | | | | | | | | | | | | | | | | | | | | | | | | | | | | | | | | | | | | | | | | | | | | | | | | | | | | | | | |
| | 2024 | | 2023 | | 2022 |
Years Ended December 31, (Millions, except percentages) | | Average Balance (a) | | Interest
Income | | Average
Yield | | Average Balance (a) | | Interest
Income | | Average
Yield | | Average Balance (a) | | Interest
Income | | Average
Yield |
| Interest-earning assets | | | | | | | | | | | | | | | | | | |
Interest-bearing deposits in banks and other (b) | | | | | | | | | | | | | | | | | | |
| U.S. | | $ | 43,425 | | | $ | 2,439 | | | 5.6 | % | | $ | 34,467 | | | $ | 1,895 | | | 5.5 | % | | $ | 22,164 | | | $ | 466 | | | 2.1 | % |
| Non-U.S. | | 2,098 | | | 163 | | | 7.8 | | | 2,173 | | | 229 | | | 10.5 | | | 2,005 | | | 95 | | | 4.7 | |
| Federal funds sold and securities purchased under agreements to resell | | | | | | | | | | | | | | | | | | |
| | | | | | | | | | | | | | | | | | |
| Non-U.S. | | — | | | — | | | — | | | 176 | | | 20 | | | 11.4 | | | 381 | | | 29 | | | 7.6 | |
| Short-term investment securities | | | | | | | | | | | | | | | | | | |
| U.S. | | 321 | | | 19 | | | 5.9 | | | 289 | | | 18 | | | 6.2 | | | 580 | | | 7 | | | 1.2 | |
| Non-U.S. | | 71 | | | 3 | | | 4.2 | | | 110 | | | 5 | | | 4.5 | | | 93 | | | 2 | | | 2.2 | |
Card Member and Other loans, including Card Member loans HFS (c) | | | | | | | | | | | | | | | | | | |
| U.S. | | 121,701 | | | 18,793 | | | 15.4 | | | 105,819 | | | 15,656 | | | 14.8 | | | 86,810 | | | 10,525 | | | 12.1 | |
| Non-U.S. | | 17,224 | | | 2,302 | | | 13.4 | | | 15,258 | | | 2,041 | | | 13.4 | | | 12,642 | | | 1,442 | | | 11.4 | |
| | | | | | | | | | | | | | | | | | |
| | | | | | | | | | | | | | | | | | |
| | | | | | | | | | | | | | | | | | |
Taxable investment securities (d) | | | | | | | | | | | | | | | | | | |
| U.S. | | 790 | | | 26 | | | 3.2 | | | 2,893 | | | 75 | | | 2.5 | | | 3,196 | | | 67 | | | 2.1 | |
| Non-U.S. | | 809 | | | 49 | | | 6.1 | | | 726 | | | 43 | | | 5.9 | | | 648 | | | 23 | | | 3.5 | |
Non-taxable investment securities (d) | | | | | | | | | | | | | | | | | | |
| U.S. | | 22 | | | 1 | | | 5.8 | | | 22 | | | 1 | | | 5.6 | | | 29 | | | 2 | | | 9.8 | |
Total interest-earning assets (e) | | $ | 186,461 | | | $ | 23,795 | | | 12.8 | % | | $ | 161,933 | | | $ | 19,983 | | | 12.3 | % | | $ | 128,548 | | | $ | 12,658 | | | 9.8 | % |
| U.S. | | $ | 166,259 | | | $ | 21,278 | | | | | $ | 143,490 | | | $ | 17,645 | | | | | $ | 112,779 | | | $ | 11,067 | | | |
| Non-U.S. | | $ | 20,202 | | | $ | 2,517 | | | | | $ | 18,443 | | | $ | 2,338 | | | | | $ | 15,769 | | | $ | 1,591 | | | |
(a)Averages based on month-end balances.
(b)Interest income primarily reflects interest on deposits from banks and dividends on investments in Federal Reserve stock.
(c)Amounts for 2024 include Card Member loans HFS and the associated interest income.
(d)Average yields for both taxable and non-taxable investment securities have been calculated using amortized cost balances and do not include changes in fair value recorded in other comprehensive loss. Average yield on non-taxable investment securities is calculated on a tax-equivalent basis using the U.S. federal statutory tax rate of 21 percent for 2024, 2023 and 2022.
(e)The average yield on total interest-earning assets is adjusted for the impacts of the items mentioned in footnote (d).
| | | | | | | | | | | | | | | | | | | | |
Years Ended December 31, (Millions, except percentages) | | 2024 Average Balance (a) | | 2023 Average Balance (a) | | 2022 Average Balance (a) |
| Non-interest-earning assets | | | | | | |
| Cash and due from banks | | | | | | |
| U.S. | | $ | 3,370 | | | $ | 3,281 | | | $ | 2,794 | |
| Non-U.S. | | 747 | | | 785 | | | 742 | |
| Card Member receivables, net | | | | | | |
| U.S. | | 33,046 | | | 34,269 | | | 34,527 | |
| Non-U.S. | | 25,003 | | | 23,182 | | | 19,973 | |
| Reserves for credit losses on Card Member and Other loans | | | | | | |
| U.S. | | (5,070) | | | (3,978) | | | (2,972) | |
| Non-U.S. | | (421) | | | (409) | | | (272) | |
Other assets (b) | | | | | | |
| U.S. | | 18,808 | | | 17,414 | | | 16,489 | |
| Non-U.S. | | 6,068 | | | 5,940 | | | 5,650 | |
| Total non-interest-earning assets | | 81,551 | | | 80,484 | | | 76,931 | |
| U.S. | | 50,154 | | | 50,986 | | | 50,838 | |
| Non-U.S. | | 31,397 | | | 29,498 | | | 26,093 | |
| Total assets | | 268,012 | | | 242,417 | | | 205,479 | |
| U.S. | | 216,413 | | | 194,476 | | | 163,617 | |
| Non-U.S. | | $ | 51,599 | | | $ | 47,941 | | | $ | 41,862 | |
| | | | | | |
| Percentage of total average assets attributable to non-U.S. activities | | 19.3 | % | | 19.8 | % | | 20.4 | % |
(a)Averages based on month-end balances.
(b)Includes premises and equipment, net of accumulated depreciation and amortization.
| | | | | | | | | | | | | | | | | | | | | | | | | | | | | | | | | | | | | | | | | | | | | | | | | | | | | | | | |
| | 2024 | | 2023 | | 2022 |
Years Ended December 31,
(Millions, except percentages) | | Average Balance (a) | | Interest
Expense | | Average
Rate | | Average Balance (a) | | Interest
Expense | | Average
Rate | | Average Balance (a) | | Interest
Expense | | Average
Rate |
| Interest-bearing liabilities | | | | | | | | | | | | | | | | | | |
| Customer deposits | | | | | | | | | | | | | | | | | | |
| U.S. | | | | | | | | | | | | | | | | | | |
| Savings accounts | | $ | 101,705 | | | $ | 4,210 | | | 4.1 | % | | $ | 84,913 | | | $ | 3,320 | | | 3.9 | % | | $ | 70,990 | | | $ | 961 | | | 1.4 | % |
| Checking accounts | | 1,677 | | | 29 | | | 1.7 | | | 1,189 | | | 37 | | | 3.1 | | | 468 | | | 6 | | | 1.3 | |
| Certificates of deposit | | 14,696 | | | 608 | | | 4.1 | | | 18,352 | | | 677 | | | 3.7 | | | 9,357 | | | 254 | | | 2.7 | |
| Sweep accounts | | 15,419 | | | 845 | | | 5.5 | | | 15,676 | | | 824 | | | 5.3 | | | 15,039 | | | 301 | | | 2.0 | |
| Non-U.S. | | | | | | | | | | | | | | | | | | |
| Certificates of deposit and other deposits | | 15 | | | 3 | | | 20.0 | | | 15 | | | 7 | | | 46.7 | | | 17 | | | 5 | | | 29.4 | |
| Short-term borrowings | | | | | | | | | | | | | | | | | | |
| U.S. | | 3 | | | — | | | — | | | 41 | | | — | | | — | | | 8 | | | — | | | — | |
| Non-U.S. | | 1,574 | | | 37 | | | 2.4 | | | 1,489 | | | 29 | | | 1.9 | | | 1,894 | | | 19 | | | 1.0 | |
Long-term debt and other (b) | | | | | | | | | | | | | | | | | | |
| U.S. | | 50,905 | | | 2,503 | | | 4.9 | | | 44,283 | | | 1,929 | | | 4.4 | | | 39,322 | | | 1,197 | | | 3.0 | |
| Non-U.S. | | 230 | | | 17 | | | 7.4 | | | 244 | | | 26 | | | 10.7 | | | 273 | | | 20 | | | 7.3 | |
| Total interest-bearing liabilities | | $ | 186,224 | | | $ | 8,252 | | | 4.4 | % | | $ | 166,202 | | | $ | 6,849 | | | 4.1 | % | | $ | 137,368 | | | $ | 2,763 | | | 2.0 | % |
| U.S. | | $ | 184,405 | | | $ | 8,195 | | | | | $ | 164,454 | | | $ | 6,787 | | | | | $ | 135,184 | | | $ | 2,719 | | | |
| Non-U.S. | | $ | 1,819 | | | $ | 57 | | | | | $ | 1,748 | | | $ | 62 | | | | | $ | 2,184 | | | $ | 44 | | | |
| | | | | | | | | | | | | | | | | | |
| Non-interest-bearing liabilities | | | | | | | | | | | | | | | | | | |
| Accounts payable | | | | | | | | | | | | | | | | | | |
| U.S. | | $ | 5,634 | | | | | | | $ | 5,609 | | | | | | | $ | 4,982 | | | | | |
| Non-U.S. | | 7,554 | | | | | | | 6,806 | | | | | | | 5,796 | | | | | |
Customer deposits(c) | | | | | | | | | | | | | | | | | | |
| U.S. | | 516 | | | | | | | 524 | | | | | | | 534 | | | | | |
| Non-U.S. | | 423 | | | | | | | 444 | | | | | | | 474 | | | | | |
| Other liabilities | | | | | | | | | | | | | | | | | | |
| U.S. | | 29,080 | | | | | | | 27,345 | | | | | | | 25,080 | | | | | |
| Non-U.S. | | 9,021 | | | | | | | 8,607 | | | | | | | 7,865 | | | | | |
| Total non-interest-bearing liabilities | | 52,228 | | | | | | | 49,335 | | | | | | | 44,731 | | | | | |
| U.S. | | 35,230 | | | | | | | 33,478 | | | | | | | 30,596 | | | | | |
| Non-U.S. | | 16,998 | | | | | | | 15,857 | | | | | | | 14,135 | | | | | |
| Total liabilities | | 238,452 | | | | | | | 215,537 | | | | | | | 182,099 | | | | | |
| U.S. | | 219,635 | | | | | | | 197,932 | | | | | | | 165,780 | | | | | |
| Non-U.S. | | 18,817 | | | | | | | 17,605 | | | | | | | 16,319 | | | | | |
| Total shareholders’ equity | | 29,560 | | | | | | | 26,880 | | | | | | | 23,380 | | | | | |
| Total liabilities and shareholders’ equity | | $ | 268,012 | | | | | | | $ | 242,417 | | | | | | | $ | 205,479 | | | | | |
| | | | | | | | | | | | | | | | | | |
| Percentage of total average liabilities attributable to non-U.S. activities | | 7.9 | % | | | | | | 8.2 | % | | | | | | 9.0 | % | | | | |
| Interest rate spread | | | | | | 8.4 | % | | | | | | 8.2 | % | | | | | | 7.8 | % |
Net interest income and net average yield on interest-earning assets(d)` | | | | $ | 15,543 | | | 8.3 | % | | | | $ | 13,134 | | | 8.1 | % | | | | $ | 9,895 | | | 7.7 | % |
(a)Averages based on month-end balances.
(b)Interest expense primarily reflects interest on long-term financing and interest incurred on derivative instruments in qualifying hedging relationships on the hedged debt instruments.
(c)U.S. non-interest-bearing Customer deposits include average Card Member credit balances of $463 million, $474 million and $502 million for 2024, 2023 and 2022, respectively. Non-U.S. non-interest-bearing Customer deposits include average Card Member credit balances of $420 million, $441 million and $471 million for 2024, 2023 and 2022, respectively.
(d)Net average yield on interest-earning assets is defined as net interest income divided by average total interest-earning assets as adjusted for the items mentioned in footnote (c) from the table on A-1.
Changes in Net Interest Income − Volume and Rate Analysis (a)
The following table presents the amount of changes in interest income and interest expense due to changes in both average volume and average rate. Major categories of interest-earning assets and interest-bearing liabilities have been segregated between U.S. and non-U.S. offices. Average volume/rate changes have been allocated between the average volume and average rate variances on a consistent basis based upon the respective percentage changes in average balances and average rates. | | | | | | | | | | | | | | | | | | | | | | | | | | | | | | | | | | | | | | |
| | 2024 Versus 2023 | | 2023 Versus 2022 |
| | Increase (Decrease)
due to change in: | | | | Increase (Decrease)
due to change in: | | |
Years Ended December 31, (Millions) | | Average Volume(b) | | Average Rate(c) | | Net Change | | Average Volume(b) | | Average Rate(c) | | Net Change |
| Interest-earning assets | | | | | | | | | | | | |
| Interest-bearing deposits in banks and other | | | | | | | | | | | | |
| U.S. | | $ | 493 | | | $ | 51 | | | $ | 544 | | | $ | 259 | | | $ | 1,170 | | | $ | 1,429 | |
| Non-U.S. | | (8) | | | (58) | | | (66) | | | 8 | | | 126 | | | 134 | |
| Federal funds sold and securities purchased under agreements to resell | | | | | | | | | | | | |
| Non-U.S. | | (20) | | | — | | | (20) | | | (16) | | | 7 | | | (9) | |
| Short-term investment securities | | | | | | | | | | | | |
| U.S. | | 2 | | | (1) | | | 1 | | | (4) | | | 15 | | | 11 | |
| Non-U.S. | | (2) | | | — | | | (2) | | | — | | | 3 | | | 3 | |
| Card Member and Other loans, including Card Member loans HFS | | | | | | | | | | | | |
| U.S. | | 2,350 | | | 787 | | | 3,137 | | | 2,305 | | | 2,826 | | | 5,131 | |
| Non-U.S. | | 263 | | | (2) | | | 261 | | | 298 | | | 301 | | | 599 | |
| | | | | | | | | | | | |
| | | | | | | | | | | | |
| | | | | | | | | | | | |
| Taxable investment securities | | | | | | | | | | | | |
| U.S. | | (54) | | | 5 | | | (49) | | | (6) | | | 14 | | | 8 | |
| Non-U.S. | | 5 | | | 1 | | | 6 | | | 3 | | | 17 | | | 20 | |
| Non-taxable investment securities | | | | | | | | | | | | |
| U.S. | | — | | | — | | | — | | | — | | | (1) | | | (1) | |
| Change in interest income | | $ | 3,029 | | | $ | 783 | | | $ | 3,812 | | | $ | 2,847 | | | $ | 4,478 | | | $ | 7,325 | |
| Interest-bearing liabilities | | | | | | | | | | | | |
| Customer deposits | | | | | | | | | | | | |
| U.S. | | | | | | | | | | | | |
| Savings accounts | | $ | 657 | | | $ | 233 | | | $ | 890 | | | $ | 188 | | | $ | 2,171 | | | $ | 2,359 | |
| Checking accounts | | 15 | | | (23) | | | (8) | | | 9 | | | 22 | | | 31 | |
| Certificates of deposit | | (135) | | | 66 | | | (69) | | | 244 | | | 179 | | | 423 | |
| Sweep accounts | | (14) | | | 35 | | | 21 | | | 13 | | | 510 | | | 523 | |
| Non-U.S. | | | | | | | | | | | | |
| Certificates of deposit & Other deposits | | — | | | (4) | | | (4) | | | (1) | | | 3 | | | 2 | |
| Short-term borrowings | | | | | | | | | | | | |
| | | | | | | | | | | | |
| Non-U.S. | | 2 | | | 6 | | | 8 | | | (4) | | | 14 | | | 10 | |
| Long-term debt and other | | | | | | | | | | | | |
| U.S. | | 288 | | | 286 | | | 574 | | | 151 | | | 581 | | | 732 | |
| Non-U.S. | | (1) | | | (8) | | | (9) | | | (2) | | | 8 | | | 6 | |
| Change in interest expense | | 812 | | | 591 | | | 1,403 | | | 598 | | | 3,488 | | | 4,086 | |
| Change in net interest income | | $ | 2,217 | | | $ | 192 | | | $ | 2,409 | | | $ | 2,249 | | | $ | 990 | | | $ | 3,239 | |
(a)Refer to footnotes from “Distribution of Assets, Liabilities and Shareholders’ Equity” for additional information.
(b)Represents the change in volume multiplied by the prior year rate.
(c)Represents the sum of the change in rate multiplied by the prior year volume and the change in rate multiplied by the change in volume.
Weighted average yields and contractual maturities for AFS debt securities with stated maturities
The following table presents weighted average yields by contractual maturities for AFS debt securities with stated maturities as of December 31, 2024: | | | | | | | | | | | | | | | | | | | | | | | | | | | | | | | | | |
Weighted average yield (a) | | Due within 1 year | | Due after 1 year but within 5 years | | Due after 5 years but within 10 years | | Due after 10 years | | Total | |
| State and municipal obligations | | — | % | | — | % | | 5.77 | % | | 2.27 | % | | 3.61 | % | |
| U.S. Government agency obligations | | — | | | — | | | — | | | 3.04 | | | 3.04 | | |
| U.S. Government treasury obligations | | 3.23 | | | 4.33 | | | — | | | — | | | 3.60 | | |
| Mortgage-backed securities | | — | | | — | | | — | | | 4.15 | | | 4.15 | | |
| Foreign government bonds and obligations | | 5.86 | | | 2.03 | | | — | | | — | | | 5.85 | | |
| Other | | — | % | | 2.82 | % | | 2.75 | % | | — | % | | 2.81 | % | |
(a)Weighted average yields for investment securities have been calculated using the effective yield on the date of purchase. Yields on tax-exempt investment securities have been computed on a tax-equivalent basis using the U.S. federal statutory tax rate of 21 percent.
Maturities and Sensitivities to Changes in Interest Rates
The following table presents contractual maturities of loans and Card Member receivables by customer type, and distribution between fixed and floating interest rates for loans due after one year based upon the stated terms of the loan agreements. The information is presented excluding amounts associated with Card Member loans HFS as of December 31, 2024. | | | | | | | | | | | | | | | | | | | | | | | | | | | | | | | | |
December 31, (Millions) | | 2024 |
| | Within 1 year (a) | | 1-5 years (b) (c) | | 5-15 years (c) | | After 15 years (c) | | Total |
| Loans | | | | | | | | | | |
| Consumer | | $ | 106,494 | | | $ | 1,152 | | | $ | — | | | $ | — | | | $ | 107,646 | |
| Small Business | | 31,632 | | | 359 | | | — | | | — | | | 31,991 | |
| Corporate | | 37 | | | — | | | — | | | — | | | 37 | |
| Other | | 1,763 | | | 7,355 | | | 86 | | | 28 | | | 9,232 | |
| Total loans | | $ | 139,926 | | | $ | 8,866 | | | $ | 86 | | | $ | 28 | | | $ | 148,906 | |
| | | | | | | | | | |
| Loans due after one year at fixed interest rates | | | | | | | | | | |
| Consumer | | | | $ | 1,152 | | | $ | — | | | $ | — | | | $ | 1,152 | |
| Small Business | | | | 359 | | | — | | | — | | | 359 | |
| | | | | | | | | | |
| Other | | | | 7,331 | | | 5 | | | 28 | | | 7,364 | |
| Loans due after one year at variable interest rates | | | | | | | | | | |
| | | | | | | | | | |
| | | | | | | | | | |
| | | | | | | | | | |
| Other | | | | 24 | | | 81 | | | — | | | 105 | |
| Total loans | | | | $ | 8,866 | | | $ | 86 | | | $ | 28 | | | $ | 8,980 | |
| | | | | | | | | | |
| Card Member receivables | | | | | | | | | | |
| Consumer | | $ | 25,249 | | | $ | 182 | | | $ | — | | | $ | — | | | $ | 25,431 | |
| Small Business | | 18,323 | | | 296 | | | — | | | — | | | 18,619 | |
| Corporate | | 15,361 | | | — | | | — | | | — | | | 15,361 | |
| Total Card Member receivables | | $ | 58,933 | | | $ | 478 | | | $ | — | | | $ | — | | | $ | 59,411 | |
(a)Card Member loans have no stated maturity and are therefore included in the due within one year category. However, many of our Card Members will revolve their balances, which may extend their repayment period beyond one year for balances outstanding as of December 31, 2024. Card Member receivables are due upon receipt of Card Member statements and have no stated interest rate and are therefore included in the due within one year category.
(b)Card Member loans and receivables due after one year represent modification programs offered to Card Members experiencing financial difficulties wherein a long-term concession (more than 12 months) has been granted to the borrower.
(c)Other loans due after one year represents installment loans.
Credit Quality Indicators for Loans and Card Member Receivables
The following table summarizes the ratio of all loans and Card Member receivables categories. The information is presented excluding amounts associated with Card Member loans HFS effective December 1, 2024. | | | | | | | | | | | | | | |
Years Ended December 31, (Millions, except percentages and where indicated) | | 2024 | | 2023 |
| Card Member loans | | | | |
| Consumer | | | | |
| Net write-offs — principal less recoveries | | $ | 2,200 | | | $ | 1,612 | |
| Net write-offs — interest and fees less recoveries | | $ | 511 | | | $ | 376 | |
Average consumer loans (billions) (a) | | $ | 100.0 | | | $ | 89.1 | |
Principal only net write-offs / average consumer loans outstanding (b) | | 2.2 | % | | 1.8 | % |
Principal, interest and fees net write-offs / average consumer loans outstanding (b) | | 2.7 | % | | 2.2 | % |
| Small Business | | | | |
| Net write-offs — principal less recoveries | | $ | 694 | | | $ | 431 | |
| Net write-offs — interest and fees less recoveries | | $ | 110 | | | $ | 67 | |
Average small business loans (billions) (a) | | $ | 30.7 | | | $ | 25.6 | |
Principal only net write-offs / average small business loans outstanding (b) | | 2.3 | % | | 1.7 | % |
Principal, interest and fees net write-offs / average small business loans outstanding (b) | | 2.6 | % | | 1.9 | % |
| | | | |
| Other loans | | | | |
| Net write-offs | | $ | 187 | | | $ | 107 | |
Average Other loans (billions) (a) | | $ | 8.1 | | | $ | 6.3 | |
Net write-offs/average Other loans outstanding (b) | | 2.3 | % | | 1.7 | % |
| | | | |
| Card Member receivables | | | | |
| Consumer | | | | |
| Net write-offs — principal less recoveries | | $ | 274 | | | $ | 350 | |
| Net write-offs — fees less recoveries | | $ | 25 | | | $ | 24 | |
Average consumer receivables (billions) (a) | | $ | 23.6 | | | $ | 22.7 | |
Principal only net write-offs / average consumer receivables outstanding (b) | | 1.2 | % | | 1.5 | % |
Principal and fees net write-offs / average consumer receivables outstanding (b) | | 1.3 | % | | 1.6 | % |
| Small Business | | | | |
| Net write-offs — principal less recoveries | | $ | 355 | | | $ | 428 | |
| Net write-offs — fees less recoveries | | $ | 32 | | | $ | 35 | |
Average small business receivables (billions) (a) | | $ | 18.9 | | | $ | 19.4 | |
Principal only net write-offs / average small business receivables outstanding (b) | | 1.9 | % | | 2.2 | % |
Principal and fees net write-offs / average small business receivables outstanding (b) | | 2.0 | % | | 2.4 | % |
| Corporate | | | | |
| Net write-offs — principal and fees less recoveries | | $ | 87 | | | $ | 100 | |
Average corporate receivables (billions) (a) | | $ | 15.7 | | | $ | 15.6 | |
Principal and fees net write-offs / average corporate receivables outstanding (b) | | 0.6 | % | | 0.6 | % |
| | | | |
| Reserve for credit losses | | $ | 6,044 | | | $ | 5,418 | |
Non-accrual loans (c) | | $ | 611 | | | $ | 446 | |
Reserve for credit losses as a percentage of total loans and Card Member receivables (d) | | 2.9 | % | | 2.8 | % |
Non-accrual loans as a percentage of total loans (d) | | 0.4 | % | | 0.3 | % |
Reserve for credit losses as a percentage of non-accrual loans (e) | | 962.0 | % | | 1175.8 | % |
(a)Averages are based on month-end balances for the periods presented.
(b)The net write-off rate presented is on a worldwide basis and is based on principal losses only (i.e., excluding interest and/or fees) to be consistent with industry convention. In addition, as our practice is to include uncollectible interest and/or fees as part of our total provision for credit losses, a net write-off rate including principal, interest and/or fees is also presented.
(c)Non-accrual loans primarily include certain loans placed with outside collection agencies for which we have ceased accruing interest. Amounts presented includes Other loans of $12 million and $7 million as of December 31, 2024 and 2023, respectively. Higher non-accrual loans are primarily driven by higher legal placements.
(d)Refer to “Maturities and Sensitivities to Changes in Interest Rates” for total outstanding balance of loans and Card Member receivables.
(e)Refer to “Allocation of reserve for credit losses” for reserve related to Card Member loans and Other loans.
Allocation of Reserve for Credit Losses
The following table shows the reserve for credit losses allocated to Card Member loans (excluding Card Member loans HFS as of December 31, 2024), Card Member receivables and Other loans. | | | | | | | | | | | | | | | | | | | | | | | | | | |
| December 31, | | 2024 | | 2023 |
(Millions, except percentages) Reserve for credit losses at end of year applicable to | | Amount | | Percentage (a) | | Amount | | Percentage (a) |
| Card Member loans | | $ | 5,679 | | | 94 | % | | $ | 5,118 | | | 95 | % |
| Card Member receivables | | 171 | | | 3 | | | 174 | | | 3 | |
| Other loans | | 194 | | | 3 | | | 126 | | | 2 | |
| Total Reserve for credit losses | | $ | 6,044 | | | 100 | % | | $ | 5,418 | | | 100 | % |
(a)Percentage of reserve for credit losses on Card Member loans, Card Member receivables and Other loans to the total reserve.
Uninsured Customer Deposits
Our U.S. deposits are insured up to $250,000 per depositor, per ownership category through the FDIC. Our non-U.S. deposits are insured as per regulatory rules in the respective jurisdictions. As of December 31, 2024 and 2023, we had total deposits of $139.4 billion and $129.1 billion, respectively, of which approximately $12.4 billion and $11.3 billion, respectively, were uninsured.
The following table presents the amount of uninsured time certificates of deposit issued by us in our U.S. and non-U.S. offices, further segregated by time remaining until maturity. For any account holder with aggregate deposits in excess of insured limits, the uninsured deposits are calculated proportionately as a percentage of total deposits for each category of deposits held as of the reporting date. | | | | | | | | | | | | | | | | | | | | | | | | | | | | | |
| By remaining maturity as of December 31, 2024 |
| (Millions) | 3 months
or less | | Over 3 months
but within 6 months | | Over 6 months
but within 12 months | | Over
12 months | | Total |
U.S. (a) | $ | 180 | | | $ | 84 | | | $ | 277 | | | $ | 93 | | | $ | 634 | |
Non U.S. (b) | $ | 1 | | | $ | 1 | | | $ | 3 | | | $ | 5 | | | $ | 10 | |
(a)We offer deposits within our U.S. bank subsidiary, AENB. These funds are currently insured up to $250,000 per depositor, per ownership category through the FDIC.
(b)Includes time deposits in certain of our Non-U.S. offices that exceed the insurance limit as defined by the regulatory rules in individual markets.