Exhibit 99.1

2012 Noble Investor conference January 22, 2013 NobleFinancial Conference January 22, 2013

22 Thispresentationcontainscertainforward-lookingstatementsrelatedtotheCompany’s expectationsandprospectsthatinvolverisksanduncertainties,includinguncertainties associated with economic conditions in the electronics industry, particularly in the principalindustrysectorsservedbytheCompany,changesincustomerrequirements and in the volume of sales to principal customers, competition and technological change,theabilityoftheCompanytocontrolmanufacturingandoperatingcosts,the abilityoftheCompanytodevelopandmaintainsatisfactoryrelationshipswithvendors, and the ability of the Company to efficiently integrate acquired companies into its business. The Company's actual results of operations may differ significantly from thosecontemplatedbyanyforward-lookingstatementsasaresultoftheseandother factors,includingfactorssetforthintheCompany's2012AnnualReportonForm10-K andinotherfilingswiththeSecuritiesandExchangeCommission,allofwhichmaybe found in the Investor Relations section of the Company’s website at www.iec- electronics.com. TheCompanyundertakesnoobligationtopubliclyupdateorrevise forward-lookinginformation,whetherasaresultofnew,updatedinformation,future eventsorotherwise. In addition, references to non-GAAP financial measures in this presentation are reconciled to GAAP in the Investor Relations section of the Company’s website, www.iec-electronics.com. Safe HarborStatement

3 Agenda Company Overview Our Industry and What Makes Us Different Financial Highlights Capital Priorities + Future growth

44 Overarching Guidelines Is IEC in a competitive position? □ Do we have a solid business model? Have we been successful growing our business? Are our markets growing?
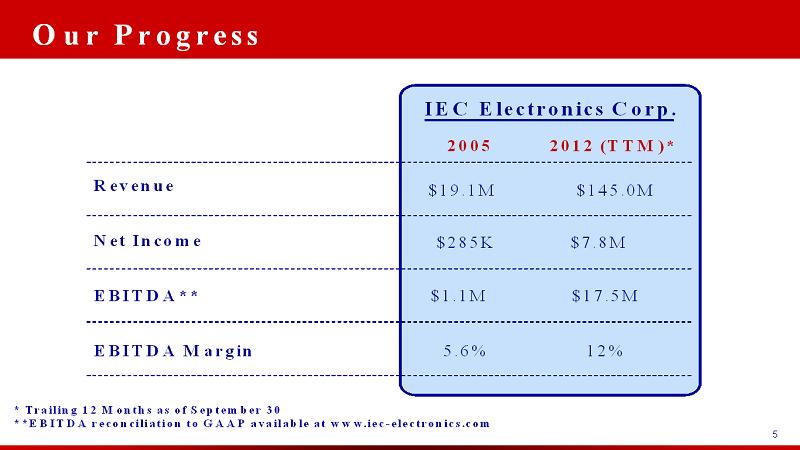
5 Our Progress IEC Electronics Corp. Revenue $19.1M Net Income EBITDA** * Trailing 12 Months as of September 30 **EBITDA reconciliation to GAAP available at www.iec-electronics.com 2005 2012 (TTM)* $145.0M $7.8M EBITDA Margin $1.1M 5.6% $17.5M 12% $285K

66 Since I Was Here Last Year IEC Electronics Corp. Revenue $11.7M Net Profit EBITDA** * Trailing 12 Months as of September 30 **EBITDA reconciliation to GAAP available at www.iec-electronics.com 2012 +8.8% +14.8% $2.9M +19.5% $7.8M Change 2011 $145.0M $133.3M $6.8M $1.0M $14.7M $17.5M
.406 batting average in 1896 “Wee” Willie Keeler
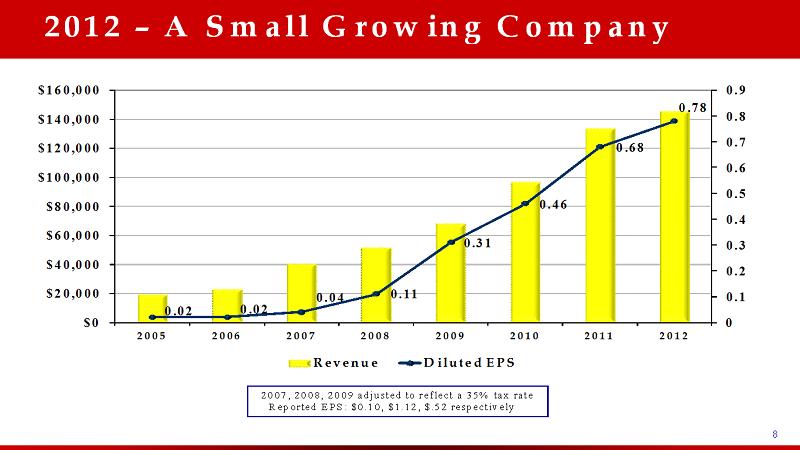
88 2012 –A Small Growing Company 0.02 0.02 0.04 0.11 0.31 0.46 0.68 0.78 0 0.1 0.2 0.3 0.4 0.5 0.6 0.7 0.8 0.9 $0 $20,000 $40,000 $60,000 $80,000 $100,000 $120,000 $140,000 $160,000 2005 2006 2007 2008 2009 2010 2011 2012 Revenue Diluted EPS 2007, 2008, 2009 adjusted to reflect a 35% tax rate Reported EPS: $0.10, $1.12, $.52 respectively
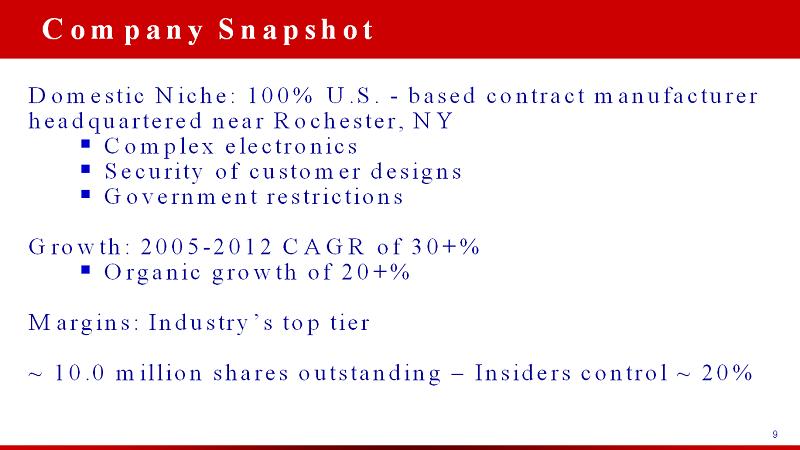
9 Domestic Niche: 100% U.S. -based contract manufacturer headquartered near Rochester, NY ▪Complex electronics ▪Security of customer designs ▪Government restrictions Growth: 2005-2012 CAGR of 30+% ▪Organic growth of 20+% Margins: Industry’s top tier ~ 10.0 million shares outstanding –Insiders control ~ 20% Company Snapshot
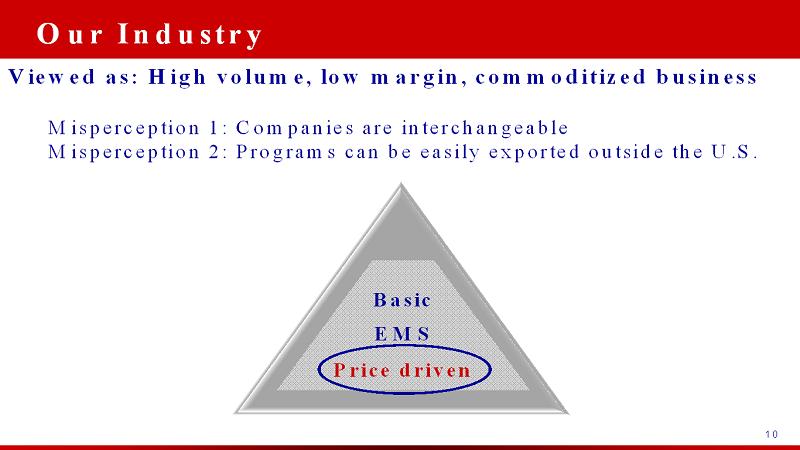
10 Viewed as: High volume, low margin, commoditized business Misperception 1: Companies are interchangeable Misperception 2: Programs can be easily exported outside the U.S. Our Industry Basic EMS Price driven
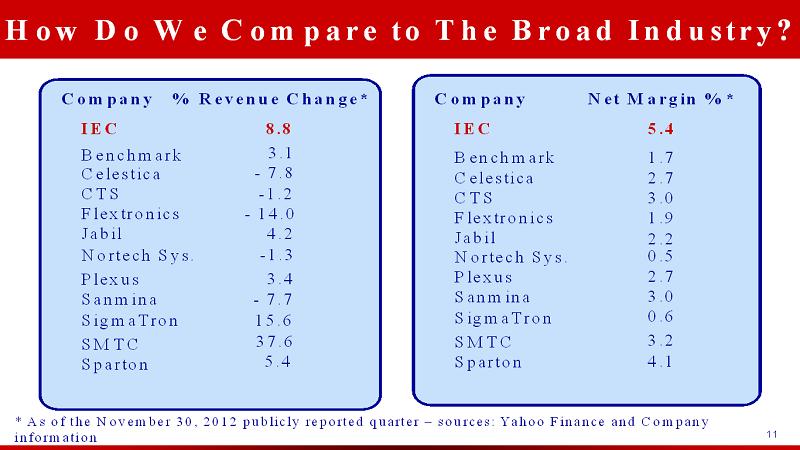
11111111 How Do We Compare to The Broad Industry? IEC Benchmark Plexus SigmaTron Sparton SMTC Company Flextronics Jabil Celestica CTS Net Margin %* Sanmina Nortech Sys. 5.4 1.7 2.7 3.0 2.7 1.9 2.2 0.5 3.0 0.6 3.2 4.1 IEC Benchmark Plexus SigmaTron Sparton SMTC Company % Revenue Change* Flextronics Jabil Celestica CTS Sanmina Nortech Sys. 8.8 -7.8 -14.0 4.2 -1.3 -7.7 15.6 37.6 5.4 3.4 -1.2 3.1 * As of the November 30, 2012 publicly reported quarter –sources: Yahoo Finance and Company information
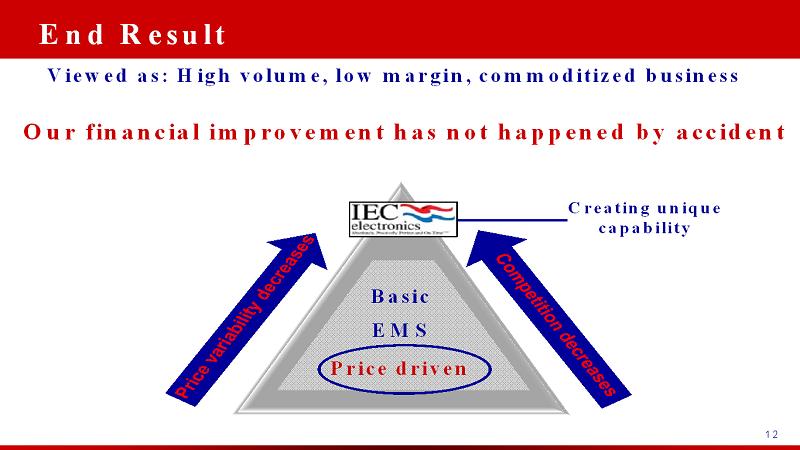
12 Viewed as: High volume, low margin, commoditized business Our financial improvement has not happened by accident End Result Creating unique capability Basic EMS Price driven
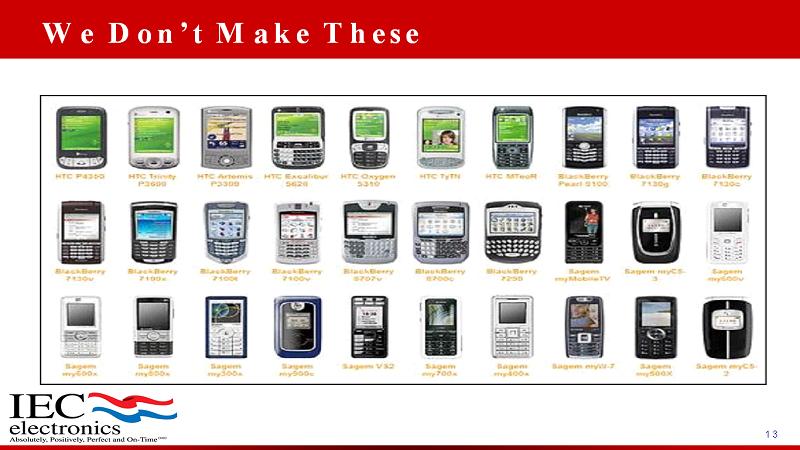
13 We Don’t Make These

14 Nor These
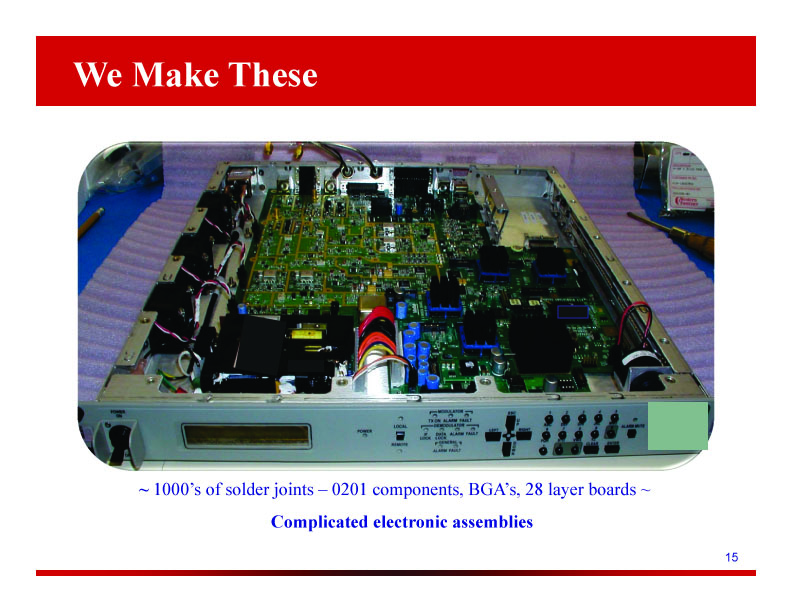
15 ~ 1000’s of solder joints –0201 components, BGA’s, 28 layer boards ~ Complicated electronic assemblies We Make These
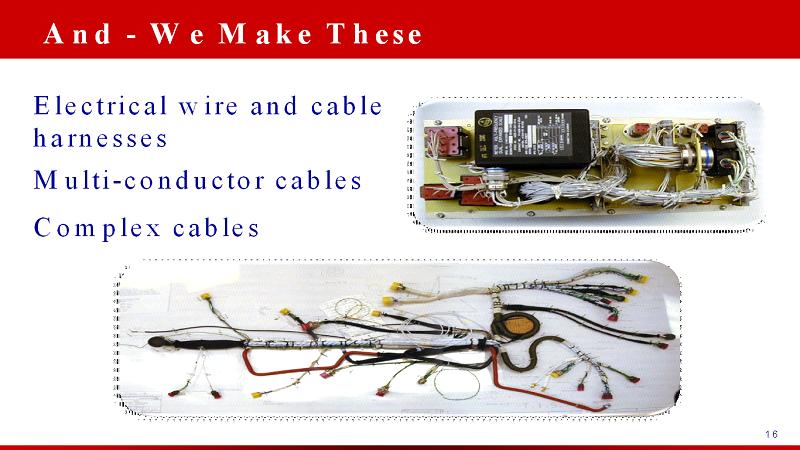
16 And -We Make These Electrical wire and cable harnesses Multi-conductor cables Complex cables

17 Medical Devices & Diagnostic Equipment Locomotive & Signaling Products Satellite Communication Commercial & Government Secure Defense Communications Advanced Defense & Aerospace Systems Combat Defense Systems For Applications Like These

18 And Applications Like These
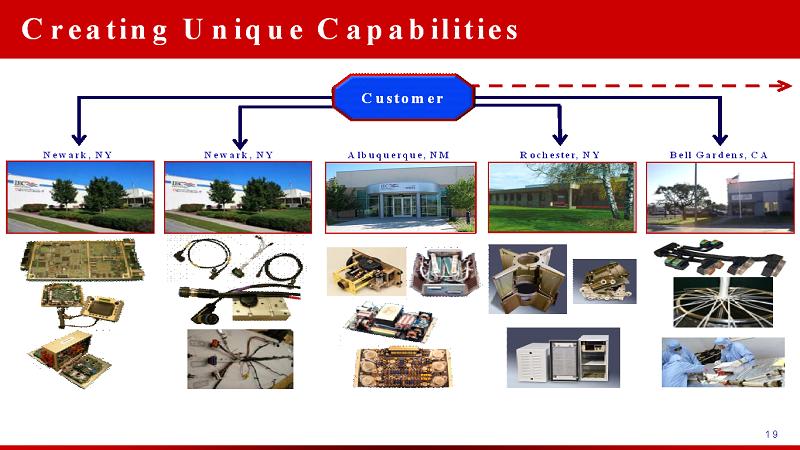
19 Creating Unique Capabilities Customer Newark, NY Newark, NY Albuquerque, NM Rochester, NY Bell Gardens, CA
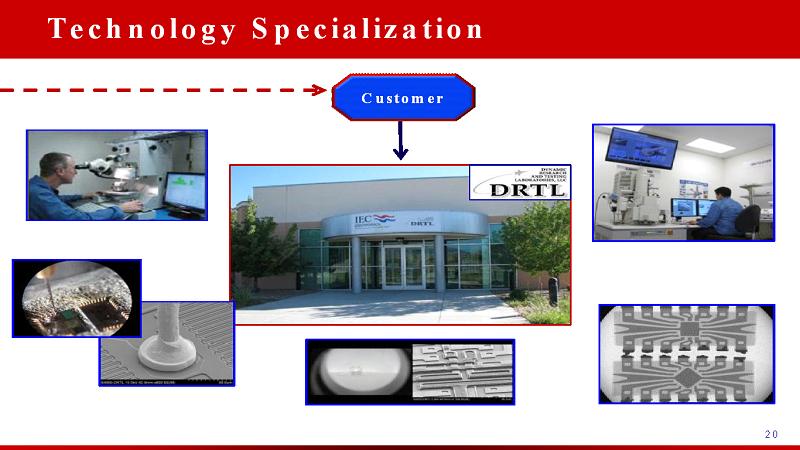
20 Technology Specialization Customer
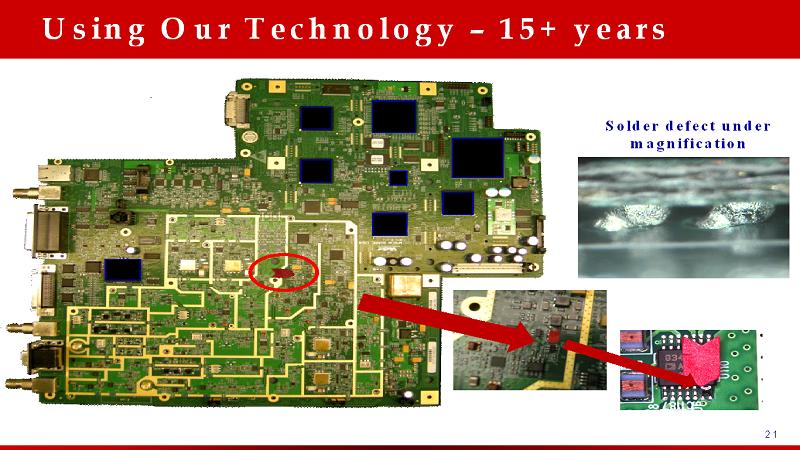
21 Using Our Technology –15+ years Solder defect under magnification
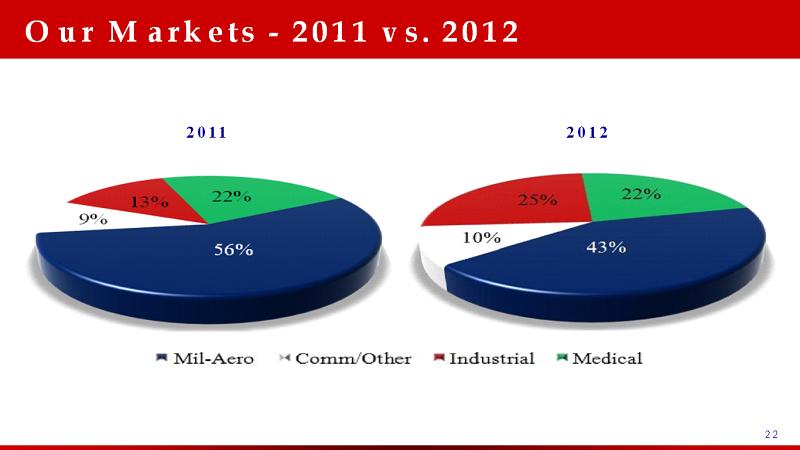
22 Our Markets -2011 vs. 2012 20122011

C-130 P3 ORION B-2 SPIRIT V-22 OSPREY B-1 LANCER F-15 EAGLE MRAP DOD-SATELITE F/A-18 HORNET PATRIOT MISSILE LAUNCHER SATCOM SENTINEL UH-60 BLACK HAWK Some of Our Platforms

OH-58 KIOWA B-52 STRATOFORTRESS FIRESCOUT TOMAHAWK MISSILE SKYEYE HUNTER AH-64 APACHE GLOBAL-HAWK JASSM MISSILE PREDATOR More Platforms

25252525 0.03 0.03 0.04 0.11 0.31 0.48 0.68 0.78 $- $20,000.00 $40,000.00 $60,000.00 $80,000.00 $100,000.00 $120,000.00 $140,000.00 $160,000.00 0 0.1 0.2 0.3 0.4 0.5 0.6 0.7 0.8 2005 2006 2007 2008 2009 2010 2011 2012 Revenues Reported EPS 2007, 2008, 2009 adjusted to reflect a 35% tax rate Reported EPS: $0.10, $1.12, $.52 respectively ▪8 consecutive years of solid revenue growth ▪8 consecutive years of steady earnings growth ▪8 consecutive years of consistent cash flow growth ▪Debt less than 2x EBITDA A Growing Company

262626 Improving Profitability 1.5% 1.0% 0.8% 2.1% 4.5% 4.8% 5.1% 5.4% 0.0% 0.5% 1.0% 1.5% 2.0% 2.5% 3.0% 3.5% 4.0% 4.5% 5.0% 5.5% 6.0% $0 $1,000 $2,000 $3,000 $4,000 $5,000 $6,000 $7,000 $8,000 $9,000 2005 2006 2007 2008 2009 2010 2011 2012 I n M i l l i o n s Net Income Net Income Margin 2007, 2008, 2009 adjusted to reflect a 35% tax rate Reported EPS: $0.10, $1.12, $.52 respectively
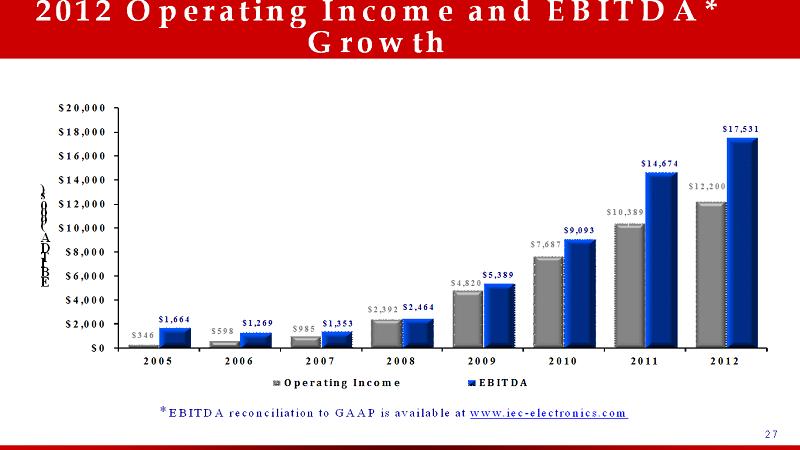
2727 2012 Operating Income and EBITDA* Growth E B I T D A ( 0 0 0 ’ s ) *EBITDA reconciliation to GAAP is available at www.iec-electronics.com $346 $598 $985 $2,392 $4,820 $7,687 $10,389 $12,200 $1,664 $1,269 $1,353 $2,464 $5,389 $9,093 $14,674 $17,531 $0 $2,000 $4,000 $6,000 $8,000 $10,000 $12,000 $14,000 $16,000 $18,000 $20,000 2005 2006 2007 2008 2009 2010 2011 2012 Operating Income EBITDA
2828 Our Future Pay down our debt ▪Substantial reduction since our last acquisition –$47 million after the acquisition reduced net debt to $24.9 million ▪ 21 month timeframe ▪Any acquisitions –need to create economic value

29 The World Around Us Europe is faltering –collective economy greater than the U.S. ▪ Greece appears poised to leave the EU ▪ Brazil and China’s growth hit a soft patch –possibly more “The tailwind from the economic recovery is likely over” - NeitherBluenor Redwill solve the problem of anemic economic growth anytime soon

3030 Future Growth What do we see going forward? ▪Expect 6% -9% revenue growth in 2013
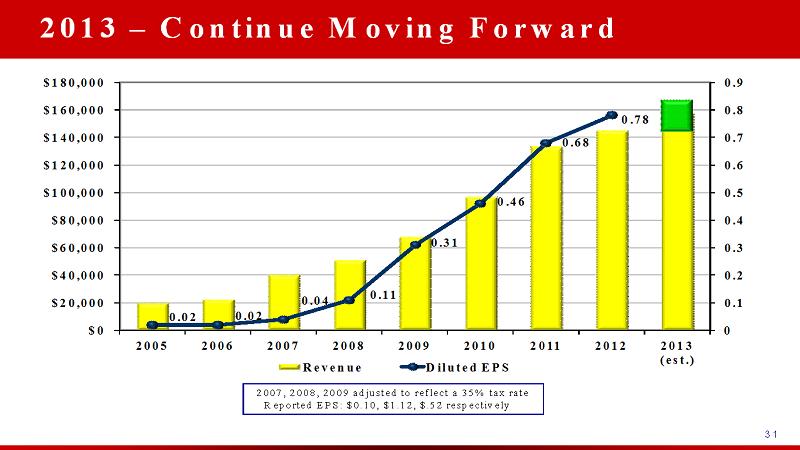
313131 2013 –Continue Moving Forward 0.02 0.02 0.04 0.11 0.31 0.46 0.68 0.78 0 0.1 0.2 0.3 0.4 0.5 0.6 0.7 0.8 0.9 $0 $20,000 $40,000 $60,000 $80,000 $100,000 $120,000 $140,000 $160,000 $180,000 2005 2006 2007 2008 2009 2010 2011 2012 2013 (est.) Revenue Diluted EPS 2007, 2008, 2009 adjusted to reflect a 35% tax rate Reported EPS: $0.10, $1.12, $.52 respectively
3232 Overarching Guidelines Is IEC in a competitive position? □ Do we have a solid business model? YES Have we been successful growing our business? YES Are our markets growing? YES

33 Questions Thank you for listening