Exhibit 99.3
Link to searchable text of slide shown above

Link to searchable text of slide shown above
Link to searchable text of slide shown above
Link to searchable text of slide shown above
Link to searchable text of slide shown above
Link to searchable text of slide shown above
Link to searchable text of slide shown above
Link to searchable text of slide shown above
Link to searchable text of slide shown above
Link to searchable text of slide shown above
Link to searchable text of slide shown above
Link to searchable text of slide shown above
Link to searchable text of slide shown above

Link to searchable text of slide shown above

Link to searchable text of slide shown above
Searchable text section of graphics shown above
[LOGO]
First Quarter 2003
Investor Conference Call
May 8, 2003
[LOGO]
1
Forward-looking Statements
There are forward-looking statements contained in this presentation. They use such words as “may,” “will,” “expect,” “believe,” “plan,” or other similar terminology. These statements involve known and unknown risks, uncertainties and other factors, which may cause the actual results to be materially different than those expressed or implied in such statements. These factors include, but are not limited to: risks associated with the implementation of the Company’s new strategic growth plan, the availability of suitable locations and terms of the sites designated for development; legislation and government regulation including the ability to obtain satisfactory regulatory approvals; conditions beyond IHOP’s control such as weather, natural disasters or acts of war or terrorism; availability and cost of materials and labor; cost and availability of capital; competition; continuing acceptance of the International House of Pancakes brand and concepts by guests and franchisees; IHOP’s overall marketing, operational and financial performance; economic and political conditions; adoption of new, or changes in, accounting policies and practices; and other factors discussed from time to time in IHOP’s filings with the Securities and Exchange Commission. Forward-looking information is provided by IHOP pursuant to the safe harbor established under the Private Securities Litigation Reform Act of 1995 and should be evaluated in the context of these factors. In addition, IHOP disclaims any intent or obligation to update these forward-looking statements.
2
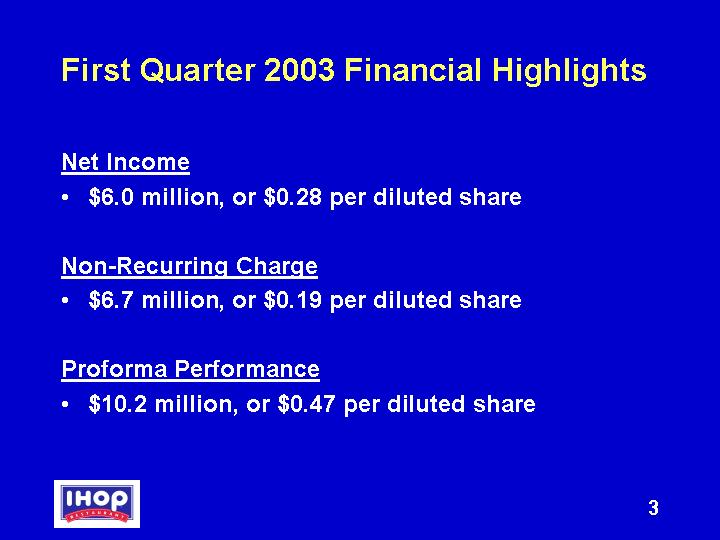
First Quarter 2003 Financial Highlights
Net Income
• $6.0 million, or $0.28 per diluted share
Non-Recurring Charge
• $6.7 million, or $0.19 per diluted share
Proforma Performance
• $10.2 million, or $0.47 per diluted share
3
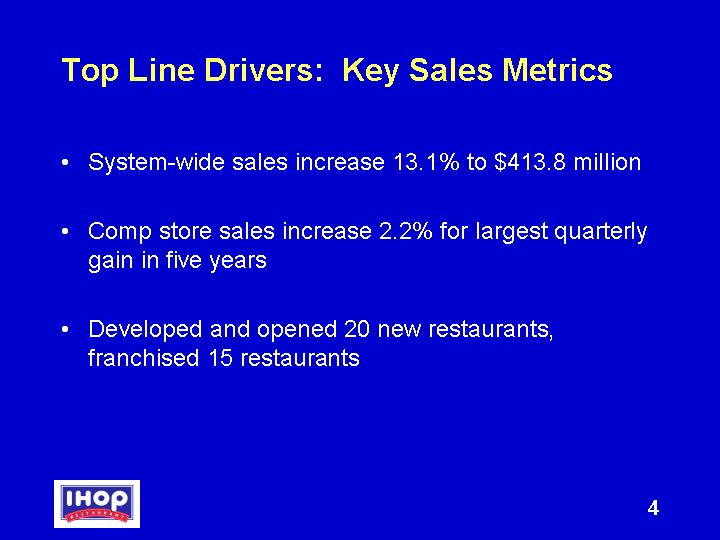
Top Line Drivers: Key Sales Metrics
• System-wide sales increase 13.1% to $413.8 million
• Comp store sales increase 2.2% for largest quarterly gain in five years
• Developed and opened 20 new restaurants, franchised 15 restaurants
4
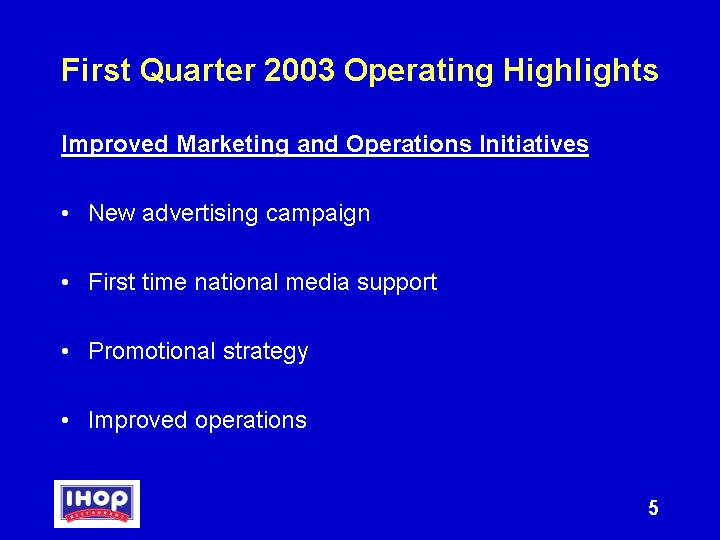
First Quarter 2003 Operating Highlights
Improved Marketing and Operations Initiatives
• New advertising campaign
• First time national media support
• Promotional strategy
• Improved operations
5
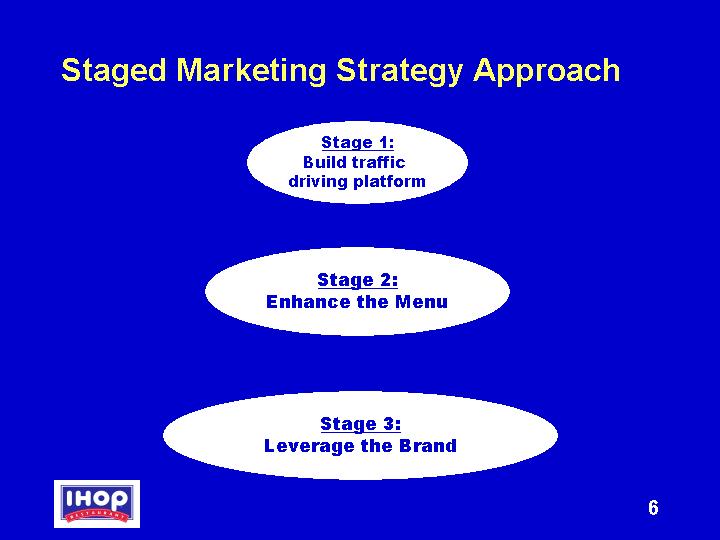
Staged Marketing Strategy Approach
Stage 1:
Build traffic
driving platform
Stage 2:
Enhance the Menu
Stage 3:
Leverage the Brand
6
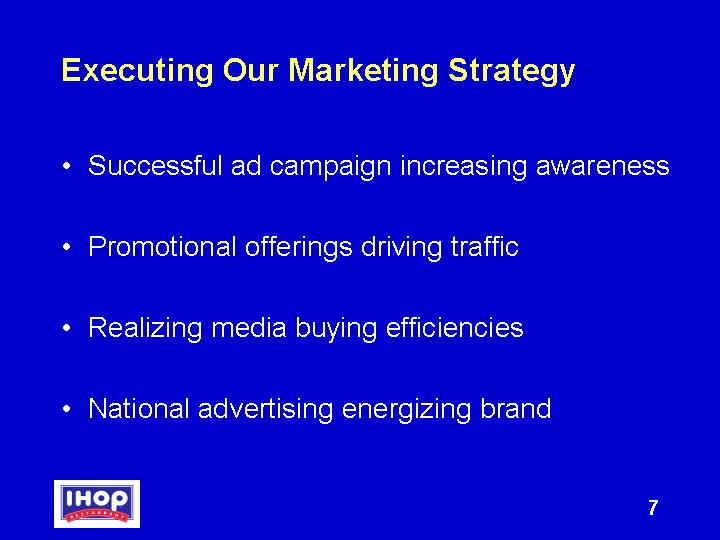
Executing Our Marketing Strategy
• Successful ad campaign increasing awareness
• Promotional offerings driving traffic
• Realizing media buying efficiencies
• National advertising energizing brand
7
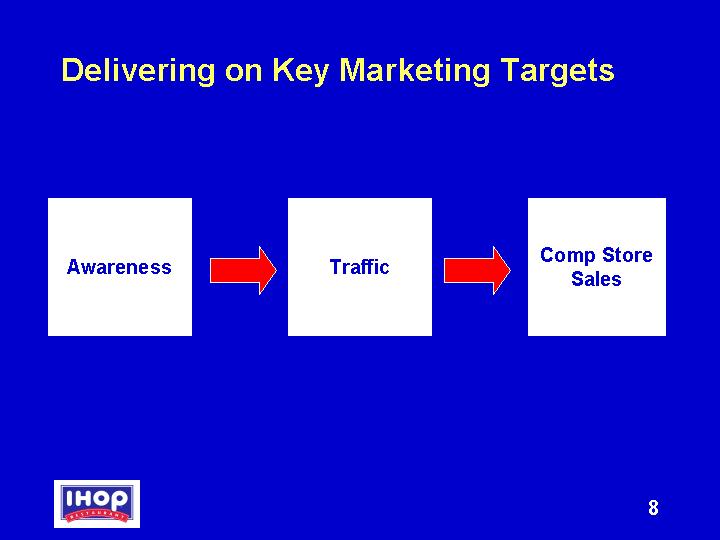
Delivering on Key Marketing Targets
Awareness | Traffic | Comp Store Sales |
8
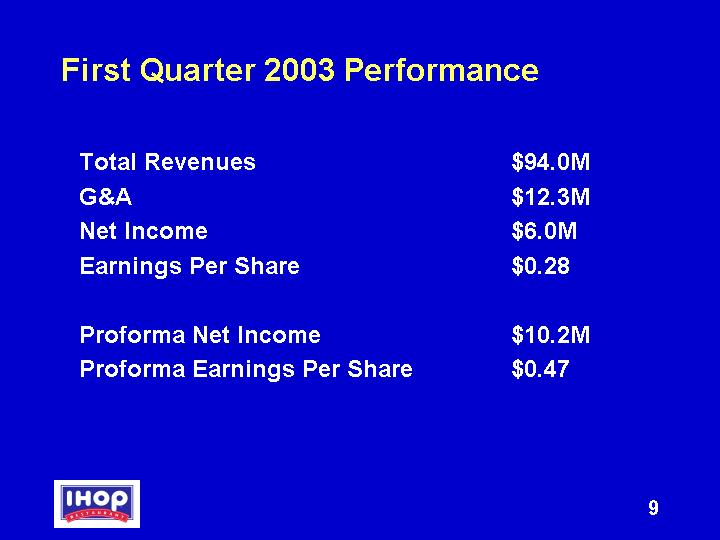
First Quarter 2003 Performance
Total Revenues | | $ | 94.0M | |
G&A | | $ | 12.3M | |
Net Income | | $ | 6.0M | |
Earnings Per Share | | $ | 0.28 | |
| | | |
Proforma Net Income | | $ | 10.2M | |
Proforma Earnings Per Share | | $ | 0.47 | |
9
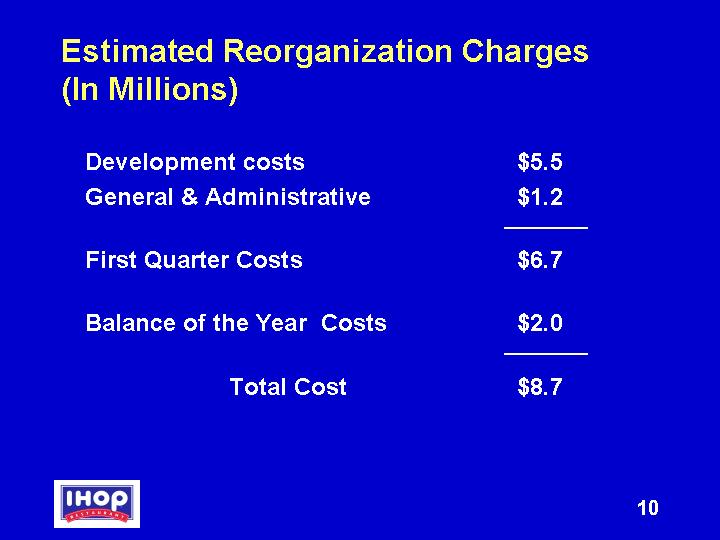
Estimated Reorganization Charges
(In Millions)
Development costs | | $ | 5.5 | |
General & Administrative | | $ | 1.2 | |
| | | |
First Quarter Costs | | $ | 6.7 | |
| | | |
Balance of the Year Costs | | $ | 2.0 | |
| | | |
Total Cost | | $ | 8.7 | |
10
Segment Reporting Results
| | Franchise
Operations | | Rental
Operations | | Company
Operations | | Financing
Operations | |
| | | | | | | | | |
Components | | • Royalty • Merchandise • Advertising • “Franchise” fee | | • Revenue from operating leases • Interest from capital leases | | • Retail revenue from Company operated restaurants | | • “Development” component of franchise fee • Interest on franchise and equipment notes | |
| | | | | | | | | |
1Q03 | | Rev: $33.8M | | Rev: $28.3M | | Rev: $19.7M | | Rev: $12.2M | |
Performance | | Profit: $18.4M | | Profit: $8.3M | | Profit: $(1.2)M | | Profit: $5.4M | |
11
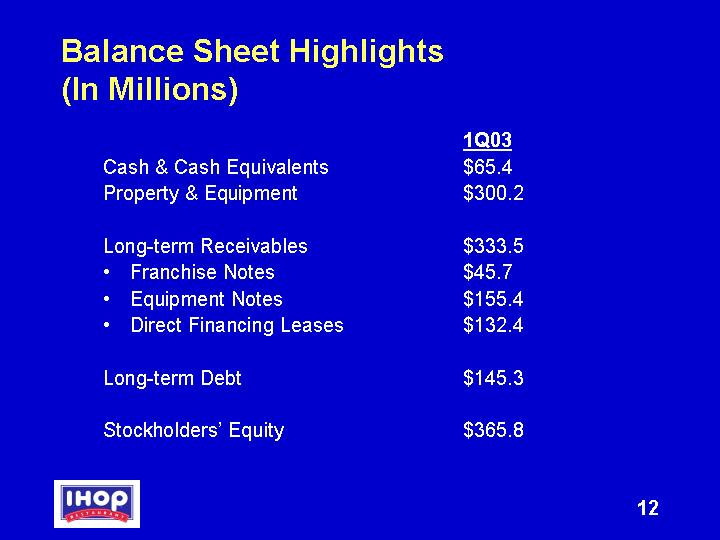
Balance Sheet Highlights
(In Millions)
| | 1Q03 | |
Cash & Cash Equivalents | | $ | 65.4 | |
Property & Equipment | | $ | 300.2 | |
| | | |
Long-term Receivables | | $ | 333.5 | |
• Franchise Notes | | $ | 45.7 | |
• Equipment Notes | | $ | 155.4 | |
• Direct Financing Leases | | $ | 132.4 | |
| | | |
Long-term Debt | | $ | 145.3 | |
| | | |
Stockholders’ Equity | | $ | 365.8 | |
12
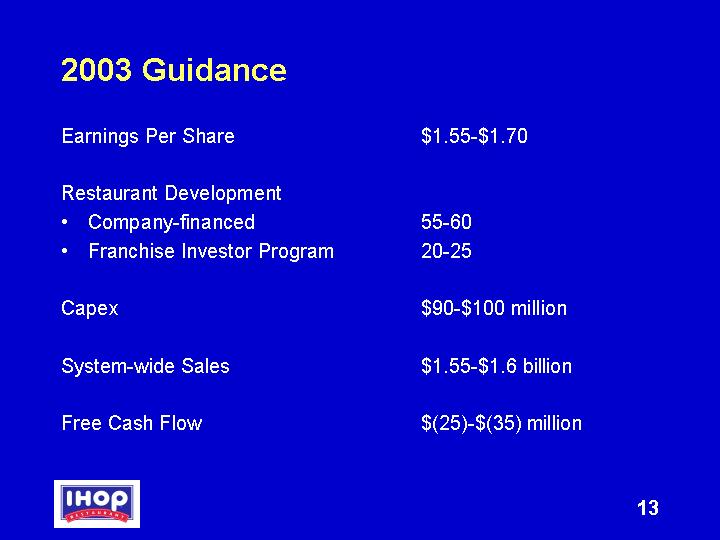
2003 Guidance
Earnings Per Share | | $ | 1.55 | - | $ | 1.70 | |
| | | | | |
Restaurant Development | | | | | |
• Company-financed | | 55-60 | | | |
• Franchise Investor Program | | 20-25 | | | |
| | | | | |
Capex | | $ | 90 | - | $ | 100 | million |
| | | | | |
System-wide Sales | | $ | 1.55 | - | $ | 1.6 | million |
| | | | | |
Free Cash Flow | | $ | (25) | - | $ | (35) | million |
13
Question and Answer Session
14
[LOGO]
First Quarter 2003
Investor Conference
Call May 8, 2003
15