UNITED STATES
SECURITIES AND EXCHANGE COMMISSION
Washington, D.C. 20549
____________________
FORM 10-K
| | x | | ANNUAL REPORT PURSUANT TO SECTION 13 OR 15(d) OF THE SECURITIES EXCHANGE ACT OF 1934 | |
| | | | | |
| | | | For the fiscal year ended December 31, 2003 | |
| | | | | |
| | o | | TRANSITION REPORT PURSUANT TO SECTION 13 OR 15(d) OF THE SECURITIES EXCHANGE ACT OF 1934 | |
| | | | | |
| | | | For the transition period from ____________ to _____________ | |
Commission file number: 1-3004
ILLINOIS POWER COMPANY
(Exact name of registrant as specified in its charter)
Illinois | | 37-0344645 |
| (State or other jurisdiction of | | (I.R.S. Employer |
| incorporation or organization) | | Identification Number) |
| | |
500 S. 27th Street | | |
Decatur, Illinois | | 62521-2200 |
| (Address of principal executive offices) | | (Zip Code) |
Registrant’s telephone number, including area code:(217) 424-6600
Securities registered pursuant to Section 12(b) of the Act:
| Title of each class: | | Name of each exchange on which registered: |
| Each of the following securities are listed on the New York Stock Exchange. |
| Mortgage bonds | | |
| 6 3/4% Series due 2005 | | |
| 7 1/2% Series due 2025 | | |
Securities registered pursuant to Section 12(g) of the Act:None
Indicate by check mark whether the registrant (1) has filed all reports required to be filed by Section 13 or 15(d) of the Securities Exchange Act of 1934 during the preceding 12 months (or for such shorter period that the registrant was required to file such reports), and (2) has been subject to the filing requirements for the past 90 days. Yes x Noo
Indicate by check mark if disclosure of delinquent filers pursuant to Item 405 of Regulation S-K is not contained herein, and will not be contained, to the best of registrant’s knowledge, in definitive proxy or information statements incorporated by reference in Part III of this Form 10-K or any amendment to this Form 10-K. x
Indicate by check mark whether the registrant is an accelerated filer (as defined in Rule 12b-2 of the Act). Yeso Nox
Illinova Corporation is the sole holder of the common stock of Illinois Power Company. There is no voting or non-voting common equity held by non-affiliates of Illinois Power Company. Illinova also owns 662,924 shares, or approximately 73%, of IP’s preferred stock. Illinois Power Company is an indirect wholly-owned subsidiary of Dynegy Inc.
DOCUMENTS INCORPORATED BY REFERENCE: None.
ILLINOIS POWER COMPANY
FORM 10-K
TABLE OF CONTENTS
| | | | Page |
| | | | |
PART I |
| Definitions | | | | 3 |
| Item 1. | | Business | | 3 |
| Item 2. | | Properties | | 14 |
| Item 3. | | Legal Proceedings | | 14 |
| Item 4. | | Submission of Matters to a Vote of Security Holders | | 14 |
| | | | |
PART II |
| | | | |
| Item 5. | | Market for Registrant’s Common Equity and Related Stockholder Matters | | 14 |
| Item 6. | | Selected Financial Data | | 15 |
| Item 7. | | Management’s Discussion and Analysis of Financial Condition and Results of | | |
| | Operations | | 16 |
| Item 7A. | | Quantitative and Qualitative Disclosures About Market Risk | | 32 |
| Item 8. | | Financial Statements and Supplementary Data | | 33 |
| Item 9. | | Changes in and Disagreements with Accountants on Accounting and Financial | | |
| | Disclosure | | 33 |
| Item 9A. | | Controls and Procedures | | 33 |
| | | | |
PART III |
| | | | |
| Item 10. | | Directors and Executive Officers of the Registrant | | 33 |
| Item 11. | | Executive Compensation | | 36 |
| Item 12. | | Security Ownership of Certain Beneficial Owners and Management and Related Stockholders Matters | | 39 |
| Item 13. | | Certain Relationships and Related Transactions | | 39 |
| Item 14. | | Principal Accountant Fees and Services | | 40 |
| | | | |
PART IV |
| | | | |
| Item 15. | | Exhibits, Financial Statement Schedules, and Reports on Form 8-K | | 41 |
| | | | |
| Signatures | | | | 42 |
PART I
Definitions
As used in this Form 10-K, the abbreviations contained herein have the meanings set forth in the glossary beginning on page F-42. Additionally, the terms “IP,” “we,” “us” and “our” refer to Illinois Power Company and its subsidiaries, unless the context clearly indicates otherwise.
Item 1. Business
General
We are engaged in the transmission, distribution and sale of electric energy and the distribution, transportation and sale of natural gas in the State of Illinois. We provide electric and natural gas service to residential, commercial and industrial customers in substantial portions of northern, central and southern Illinois. Our service territory includes 11 cities with populations greater than 30,000 and 37 cities with populations greater than 10,000 (2000 U.S. Census Bureau’s Redistricting Data). We also currently supply electric transmission service to numerous utilities, electric cooperatives, municipalities and power marketing entities in the State of Illinois.
We are an indirect, wholly-owned subsidiary of Dynegy Inc. Dynegy acquired our direct parent company, Illinova, and its subsidiaries, including us, in February 2000. Our operations comprise one of Dynegy’s four reportable segments. Dynegy is continuing its self-restructuring efforts and made substantial progress in 2003 in terms of exiting non-core businesses and extending a substantial portion of its debt maturities; however, Dynegy still has substantial debt and other obligations. Our results of operations and financial condition are affected by the consolidated financial and liquidity position of Dynegy, particularly because we rely on interest payments under a $2.3 billion intercompany note receivable from Illinova for a significant portion of our net cash provided by operating activities. Please read “Management’s Discussion and Analysis of Financial Condition an d Results of Operations - Liquidity and Capital Resources - Our Relationship with Dynegy” for further discussion.
Dynegy and Illinova recently entered into an agreement with Ameren to sell the shares of our common and preferred stock owned by Illinova for $2.3 billion. The closing of the sale is expected to occur before the end of 2004. However, closing is contingent upon the receipt of required regulatory approvals and other conditions. Please read Note 2 - “Agreed Sale to Ameren” in the accompanying audited financial statements for additional information about this transaction.
We were incorporated under the laws of the State of Illinois on May 25, 1923. Our principal executive office is located at 500 S. 27th Street, Decatur, Illinois 62521-2200, and our telephone number at that office is (217) 424-6600.
Our SEC filings on Forms 10-K, 10-Q and 8-K (and amendments to such filings) are available free of charge through the SEC’s website, www.sec.gov. The SEC also has a toll free number that you may call for information, which is 800-732-0330.
Electric Business
Overview
We supply electric service at retail to an estimated aggregate population of 1,372,000 in 313 incorporated municipalities, adjacent suburban and rural areas and numerous unincorporated communities. We hold franchises in all of the 313 incorporated municipalities in which we provide retail electric service. At year end 2003, based on billable meters, we served 601,082 active electric customers. We own an electric distribution system of 37,765 circuit miles of overhead and underground lines. We also own a 1,672 circuit
mile electric transmission system. For the year ended December 31, 2003, we delivered a total of 18,601 million kWh of electricity.
Our highest system peak hourly demand (native retail load) in 2003 was 3,585,000 kW on August 21, 2003. This compares with our record high system peak hourly demand (native retail load) of 3,888,000 kW on July 29, 1999.
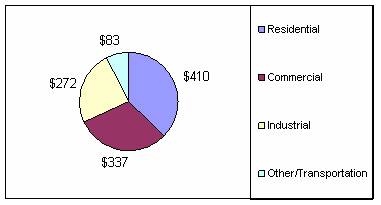
The chart below shows electric revenues by customer class for the year ended December 31, 2003:
Electric Revenues (in millions)
Electric Rates
Regulators historically have determined our rates for electric service—the ICC at the retail level and the FERC at the wholesale level. These rates are designed to recover the cost of service and to allow our shareholders the opportunity to earn a reasonable rate of return. Please read “Competition” and “Regulation” below for further discussion of the regulatory environment in which we operate, including the retail electric rate freeze that will remain in effect through 2006.
Power Supply
We own no significant generation assets and obtain the majority of the electricity that we supply to our retail customers through long-term power purchase agreements with AmerGen and DMG. The AmerGen agreement was entered into in connection with the sale of our former Clinton nuclear generation facility to AmerGen in December 1999. We are obligated to purchase a predetermined percentage of Clinton’s electricity output through 2004 at fixed prices that exceed current and projected wholesale prices. At the time of the Clinton sale, we recorded a liability related to the above-market portion of this purchase agreement, which is being amortized through 2004, based on the expected energy to be purchased from AmerGen. The AmerGen agreement does not obligate AmerGen to acquire replacement power for us in the event of a curtailment or shutdown at Clinton.
We have a power purchase agreement with DMG that provides approximately 70% of our capacity requirements. This agreement has a primary term that runs through 2004, with provisions to extend the agreement annually thereafter as the parties shall agree. The DMG agreement requires that we pay DMG for reserved capacity and that we pay for any electricity actually purchased based on a formula that includes various cost factors, primarily related to the cost of fuel, plus a market price for amounts in excess of our reserved capacity. This agreement obligates DMG to provide power up to the amount we reserve even if DMG has individual units unavailable. At our option, DMG is required to provide power in excess of our reserved capacity, but we must pay market prices for any power that DMG purchases in order to satisfy this requirement.
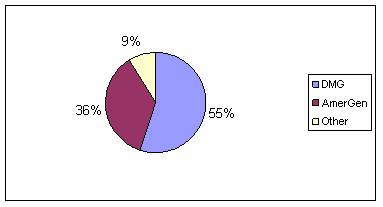
The following chart illustrates the percentage of power purchases by supplier, based on actual total volume of power purchased, for the year ended December 31, 2003:
Power Purchased by Supplier (based on MWH)
Our ability to meet our power and energy needs beyond 2004 is addressed in our pending sale to Ameren. Pursuant to a related agreement, which is conditioned upon the closing of the transaction, we will purchase 2,800 MWs of capacity and up to 11.5 million MWh of energy from a Dynegy affiliate at fixed prices for two years beginning in January 2005. Additionally, we will purchase from that Dynegy affiliate 300 MWs of capacity in 2005 and 150 MWs of capacity in 2006 at a fixed price with an option to purchase energy at market-based prices. Any capacity and energy needs not met by this agreement would be secured from either existing agreements, through a specified purchasing process, or, in limited circumstances, through open market purchases. Please read Note 2 - “Agreed Sale to Ameren” in the accompanying audited financial statements for additional information.
The current power purchase agreement between us and DMG requires that notice of termination be presented by December 31, 2003, one year prior to the scheduled expiration period. The parties have agreed to amend the agreement to extend this notice date requirement to March 31, 2004.
In the event that the pending transaction for our sale to Ameren is not completed, the existing agreement with DMG is terminated and no replacement agreement is executed with a Dynegy affiliate, we will be required to purchase a substantial portion of our power on the open market at then current market prices. In the event that the Ameren transaction is not completed and the existing agreement with DMG is either not terminated or is replaced with another agreement with a Dynegy affiliate, we will be required to purchase any amount of capacity and energy not provided under the contract on the open market at then current market prices. Volatility in market prices for power could affect us to the extent that we would be required to purchase power in the open market.
Interconnections
We are a participant, together with AmerenUE and AmerenCIPS, in the Illinois-Missouri Power Pool (“Pool”), which was formed in 1952. The Pool operates under an interconnection agreement that provides for the interconnection of transmission lines. This agreement has no expiration date, but any party may withdraw from the agreement on 36 months written notice.
We, AmerenCIPS and AmerenUE have contracted with the TVA for the interconnection of the TVA system with those of the three companies. The contract addresses power purchase provisions among the parties and other working arrangements. This contract has no expiration date, but any party may withdraw from the agreement on five years written notice.
We also have interconnections with Indiana-Michigan Power Company, Commonwealth Edison Company, AmerenCILCO, MidAmerican Energy Corporation, Louisville Gas & Electric, Southern Illinois Power Cooperative, Electric Energy Inc. and the City of Springfield, Illinois.
We are currently a member of the Mid-America Interconnected Network (“MAIN”), one of ten regional reliability councils established to coordinate plans and operations of member companies regionally and nationally. We had previously given notice to MAIN of our intent to withdraw effective December 31, 2004; however, our membership status will depend upon the outcome of the sale transaction with Ameren. Prior to December 31, 2004, we expect to either extend our membership in MAIN or join one of the other adjacent regional reliability councils.
Illinois Electric Deregulation
Our electric operations are regulated by the State of Illinois through the Illinois Public Utilities Act and the ICC. The ICC regulates the rates at which we can sell and distribute electricity to retail customers. In June 2002, a bill was enacted that extends Illinois’ current retail electric rate freeze through 2006. Beginning in 2007, absent further extension of the retail electric rate freeze or other action, we expect that the distribution and transmission component of retail electric rates will continue to be based on cost while the power and energy component may be based on cost or prices in the wholesale market. We cannot predict the structure under which retail rates will be set after 2006 or the impact of any such rate structure on our business.
Please read “Regulation” below for significant legislative actions affecting our electric business.
Gas Business
Overview
We supply retail natural gas service to residential, commercial and industrial consumers in substantial portions of northern, central and southern Illinois. We do not sell gas for resale.
We supply retail natural gas service to an estimated population of 1,019,000 in 258 incorporated municipalities and adjacent areas. We hold franchises in all of the incorporated municipalities in which we provide retail gas service. At year end 2003, based on billable meters, we served 415,558 active gas customers. For the year ended December 31, 2003, we delivered a total of 778 million therms of natural gas.
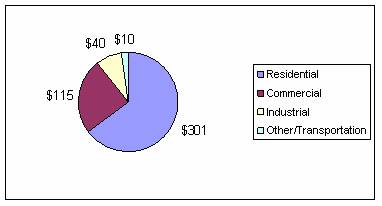
The chart below shows gas revenues by customer class for the year ended December 31, 2003:
Gas Revenues (in millions)
We own 763 miles of natural gas transmission pipeline and 7,669 miles of natural gas distribution pipeline. We have contracts on six interstate pipelines for firm transportation and storage services. These contracts have varying expiration dates ranging from 2004 to 2012. We also have contracts for the acquisition of natural gas ranging in duration from one to twelve months. Our customers’ gas price volatility during the typical heating season is mitigated to a certain extent through the use of forward pricing instruments and the natural price hedge characteristic of natural gas storage. In addition, natural gas storage enhances the operational reliability of our gas system.
We own seven underground natural gas storage fields with a total capacity of approximately 11.6 billion cubic feet and a total deliverability on a peak day of approximately 339 million cubic feet. To supplement the capacity of our seven underground storage fields, we have contracted with natural gas pipelines for an additional 5.4 billion cubic feet of underground storage capacity, representing additional total deliverability on a peak day of approximately 93 million cubic feet. The operation of these underground storage facilities permits us to increase deliverability to our retail gas customers during peak load periods by withdrawal of natural gas that was previously placed in storage during off-peak months. We experienced our 2003 peak-day send out of 669,379 MMBtu of natural gas on January 23, 2003. This compares with our record peak-day send out of 857,324 MMBtu of natural gas on January 10, 1 982.
We continuously monitor the operating efficiencies of our underground gas storage fields. In 1999, we reduced the capacity of our working gas in the Hillsboro gas storage field from 7.6 Bcf to 4.0 Bcf, based on results from an engineering study and the annual operating results of the field, thereby increasing the base gas inventory. During 2003, we initiated further engineering studies; should further adjustments be made based on such studies, any adjustments to inventory would be expected to be recovered from our customers through the purchase gas adjustment clause, subject to ICC prudency review.
Gas Rates
The ICC determines rates that we may charge for retail gas service. As with the rates that we are allowed to charge for retail electric service, these rates are designed to recover our cost of service and to allow our shareholders the opportunity to earn a reasonable rate of return. Our rate schedules contain provisions for passing through to our customers any increases or decreases in the cost of natural gas, subject to an annual prudency review by the ICC. Rates for gas distribution services are set by the ICC in rate proceedings and are based on the underlying costs. Pursuant to the sale agreement with Ameren, we are required to file with the ICC, no later than June 30, 2004, revised gas service tariffs proposing a general increase in base rates for gas service. The approval of the rate case, which will be the first such case we have filed since 1993 in Docket No. 93-0183, will b e at the ICC’s discretion.
Relationship with Dynegy
As described above, we are an indirect, wholly-owned subsidiary of Dynegy Inc. We rely on Dynegy and other of its affiliates for, among other things, providing funds to Illinova for interest payments under our $2.3 billion intercompany note receivable from Illinova, a significant portion of our purchased power and certain general and administrative services related to our operations. Because of our relationship with Dynegy, negative events that impact Dynegy can indirectly impact us. To learn more about Dynegy and its current financial condition, we encourage you to read Dynegy’s annual report on Form 10-K for the fiscal year ended December 31, 2003, which is available free of charge through the SEC’s website at www.sec.gov. Please read “Management’s Discussion and Analysis of Financial Condition and Results of Operation - Liquidity and Capital Resources - Our Re lationship with Dynegy” for further discussion of the effects that events affecting Dynegy can have and have had on us.
Competition
We are authorized, by statute and/or certificates of public convenience and necessity, to conduct operations in the territories we serve. In addition, we operate under franchises and license agreements granted by the communities we serve.
Our electric utility business faces competition brought about by the implementation of a customer choice structure in the State of Illinois. Under the Customer Choice Law, residential electric customers were given a 15% decrease in their base electric rates beginning August 1, 1998 and an additional 5% decrease in base electric rates beginning May 1, 2002. The Customer Choice Law also implemented a return on equity collar that is further described below under “Regulation.” Additionally, the Customer Choice Law phased in the right of customers to choose their electricity suppliers, with specified non-residential customers being granted this right in October 1999, all remaining non-residential customers being granted this right beginning on December 31, 2000 and all residential customers being granted this right effective May 1, 2002. Customers who buy their electricity from a supplier othe r than the local electric utility are required to pay applicable transition charges to the utility through the year 2006. These charges are not intended to compensate the electric utilities for all revenues lost because of customers buying electricity from other suppliers.
Although no parties have requested certification from the ICC to provide residential electric service pursuant to the Customer Choice Law, this could change. Currently, there are eight energy providers for non-residential service. We face competition from these and other energy providers. By the end of 2003, commercial and industrial customers representing approximately 18% of our commercial and industrial load, more than three-fourths of which relates to one industrial customer, had switched to other energy providers, and we estimate that, by the end of 2004, commercial and industrial customers representing an additional 7% of our commercial and industrial load will have switched to other such providers. Competition typically is based on price and service reliability.
With respect to our gas distribution business, absent extraordinary circumstances, potential competitors are barred from constructing competing systems in our service territories by a judicial doctrine known as the "first in the field" doctrine. In addition, the high cost of installing duplicate distribution facilities would render the construction of a competing system impractical. Additionally, competition in varying degrees exists between natural gas and other fuels or forms of energy available to consumers in our service territories.
Regulation
Federal We are subject to regulation under the Federal Power Act by the FERC as to rates and charges in connection with the transmission of electric energy in interstate commerce, the issuance of debt securities maturing in not more than 12 months, accounting and depreciation policies, interaction with affiliates and certain other matters. The FERC has declared us exempt from the Natural Gas Act and related FERC orders, rules and regulations.
In November 2003, the FERC issued a final rule (“FERC Order 2004”) revising the standards of conduct applicable to jurisdictional electric transmission providers (and natural gas pipelines) and their “energy affiliates.” The new rule consolidates the previously disparate standards of conduct applicable to electric and natural gas transmission providers, and by broadening the definition of “energy affiliate” expands the range of affiliated entities covered by the standards of conduct. The standards of conduct are designed to ensure that transmission providers do not provide preferential access to service or information to affiliated entities. The new regulations require each transmission provider to file with the FERC and post on its OASIS or internet website a plan and schedule for implementing the standards of conduct and to be in full compliance with the standards of conduct by June 1, 2004. Among other things, the regulations require transmission providers’ employees who are engaged in transmission system operations to function independently from the transmission providers’ sales or marketing employees and from any employees of their energy affiliates. The regulations also require all transmission providers to designate a regulatory
compliance officer for this purpose who will be responsible for standards of conduct compliance. Transmission providers that are members of RTOs or ISOs may seek an exemption from the rule. Several parties have asked the FERC for clarification and rehearing on many issues outlined in FERC Order 2004. We are currently in compliance with FERC Order 2004 as contemplated.
In April 2003, the FERC issued a white paper on its wholesale power market platform, shifting its focus from market standardization to allow regional state committees to oversee timelines and market designs of RTOs and ISOs in their areas. The ultimate impact of this rulemaking on us is not known at this time
We are an electric utility as defined in the PUHCA. Our direct parent company, Illinova, and Dynegy are holding companies as defined in the PUHCA. However, both Illinova and Dynegy generally are exempt from regulation under section 3(a)(1) of the PUHCA. They remain subject to regulation under the PUHCA with respect to the acquisition of certain voting securities of other domestic public utility companies and utility holding companies.
The U.S. Congress is presently considering passage of comprehensive energy legislation that could impact us. The legislation includes repeal of the PUHCA, enhanced reliability measures, various transmission improvement and financing provisions, and new market reporting requirements. We cannot predict with certainty whether or not the U.S. Congress will finish its work on the energy legislation and send it to the President for signature or what effect any final legislation will have on our business.
State The Illinois Public Utilities Act was significantly modified in 1997 by the Customer Choice Law, but the ICC continues to have broad powers of supervision and regulation with respect to our rates and charges, our services and facilities, extensions or abandonment of service, classification of accounts, valuation and depreciation of property, issuance of securities and various other matters. We must continue to provide bundled retail electric service to all who choose to continue to take service at tariff rates, and we must provide unbundled electric distribution services to all eligible customers as defined by the Customer Choice Law at rates that must be approved by the ICC. During 2003, the ICC ruled on (i) proposed revisions to the current Market Value Index; and (ii) continued suspension of the “neutral fact-finder” procedure. During 2004, we expect the ICC to (i) issue proposed rules on the interconnection of the distributed generation to electric utility systems; (ii) consider the establishment of more uniform line extension and service installation policies for customers of electric and gas utilities; and (iii) begin consideration of how to address the post-2006 period when the current bundled electric rate freeze ends. The impact of these regulations on our financial condition and results of operations cannot be predicted with certainty.
Following is a discussion of the actions taken by the Illinois legislature with respect to the deregulation of the State of Illinois’ electric system:
P.A. 92-0537 - Extension of Retail Electric Rate Freeze In June 2002, the Governor of Illinois signed a bill that added two years to the retail electric rate freeze in Illinois. The bill extends through 2006 the mandatory retail electric rate freeze, which was originally required by P.A. 90-561. P.A. 92-0537 freezes our rates for full service, or ‘‘bundled,’’ electric service at current levels unless the two-year average of our earned ROE is below the two-year average of the “Treasury Yield,” defined as the monthly average yields of the 30-year U.S. Treasury Bonds through January 2002, an average of the 30-year U.S. Treasury Bonds and the monthly Treasury Long-Term Average Rates in February 2002, and the monthly Treasury Long-Term Average Rates (25 years and above) after February 2002, for the concurrent period, in which event we may reques t a rate increase from the ICC. The ICC would rule on this request for a rate increase using traditional ratemaking standards. As a result of the retail rate freeze, our bundled service retail electric consumers are expected to continue to pay their current electric rates for the next several years. The rate freeze does not apply to our rates for distribution service to customers choosing direct access. These rates are currently required to be based on cost of service and can be raised or lowered subject to approval by the ICC. Beginning in 2007, absent further extension of the retail electric rate freeze or other action, we expect that the distribution and transmission component of retail electric rates will continue to be required to be based on cost while the energy component may be required to be based on cost or prices in the wholesale market.
P.A. 90-561 - Rate Adjustment Provisions P.A. 90-561 gave our residential customers a 15% decrease in base electric rates beginning August 1, 1998. An additional 5% decrease went into effect on May 1, 2002. The approximate rate reduction savings realized by our customers during 2003 and 2002 was $106.5 million and $101.6 million, respectively. The combined impact of these rate decreases is expected to result in a total annual revenue reduction of approximately $104 million in 2004, $106 million in 2005 and $108 million in 2006, relative to rate levels in effect prior to August 1, 1998.
The extent to which revenues are affected by P.A. 90-561 will depend on a number of factors, including future market prices for wholesale and retail energy and load growth and demand levels in our current service territory.
P.A. 90-561/92-0537 - Utility Earnings Cap The regulatory reform legislation contains floor and ceiling provisions applicable to our ROE during the mandatory transition period ending in 2006. Pursuant to the provisions in the legislation, we may request an increase in our base rates if the two-year average of our earned ROE is below the Treasury Yield. Conversely, we are required to refund amounts to our customers equal to 50% of the value earned above a defined “ceiling limit.” The ceiling limit is exceeded if our two-year average ROE exceeds the Treasury Yield, plus 8.5% in 2002 through 2006. In 2002, we filed to increase the add-on to the Treasury Yield from 6.5% to 8.5%; as a result, we waived our right to collect transition charges in 2007 and 2008. Regulatory asset amortization is included in the calculation of the ROE for the ceiling test but is not inc luded in the calculation of the ROE for the floor test. During 2003, our two-year average ROE was within the allowable ROE collar.
P.A. 90-561 - Direct Access Provisions Since October 1999, non-residential customers with demand greater than 4 MW at a single site, customers with at least 10 sites having aggregate total demand of at least 9.5 MW and customers representing one-third of the remaining load in the non-residential class have been given the right to choose their electric generation suppliers. This right, which we refer to as direct access, was made available for remaining non-residential customers beginning on December 31, 2000. Direct access became available to all residential customers effective May 1, 2002. However, at the present time, there are no Alternative Residential Electric Suppliers registered to provide service to our residential customers. We remain obligated to provide electric service to our customers at tariff rates and to provide delivery service to our customers at regul ated rates. Departing customers must pay applicable transition charges to us, but those charges are not designed to compensate us for all of our lost revenues.
Although residential rate reductions and the introduction of direct access have led to lower electric service revenues, P.A. 90-561 is designed to protect the financial integrity of electric utilities in three principal ways:
| | Departing customers are obligated to pay applicable transition charges based on the utility’s lost revenue from that customer. The transition charges are applicable through 2006. |
| | Until December 31, 2004, utilities are provided the opportunity to lower their financing and capital costs through the issuance of “securitized” bonds, also called transitional funding trust notes. |
| | The ROE of utilities is managed through application of floor and ceiling test rules contained in P.A. 90-561/92-0537 as described in the “Utility Earnings Cap” section above. |
P.A. 90-561 - ISO Participation Participation in an ISO or RTO by utilities serving retail customers in Illinois was one of the requirements included in P.A. 90-561 and P.A. 92-12.
In January 1998, we, in conjunction with eight other transmission-owning entities, filed with the FERC for all approvals necessary to create and to implement the MISO. On May 8, 2001, the FERC issued an order approving a settlement that allowed us to withdraw from the MISO.
In November 2001, we and seven of the transmission owners proposing to form the Alliance RTO filed definitive agreements with the FERC for approval whereby National Grid would serve as the Alliance RTO’s managing member. In an order issued on December 20, 2001, the FERC stated that it could not approve the Alliance RTO, and the FERC directed the Alliance companies to file a statement of their plans to join an RTO, including the timeframe, within 60 days of December 20, 2001.
In May 2002, we submitted a letter to the FERC indicating that we would join PJM either as an individual transmission owner or as part of an independent transmission company. In July 2002, the FERC issued an order approving our proposal to join PJM, subject to certain conditions. These conditions include a requirement that (i) the parties negotiate and implement a rate design that will eliminate rate pancaking between PJM and the MISO; (ii) the North American Electric Reliability Council oversees the reliability plans for the MISO and PJM; and (iii) PJM and MISO develop a joint operation agreement to deal with seams issues. In addition, the FERC initiated an investigation under Federal Power Act Section 206 of the MISO, PJM West and PJM’s transmission rates for through and out service and revenue distribution. Subsequent to the July 2002 order, the parties were unable to negotiate a rate design that would e liminate rate pancaking between PJM and the MISO, and the FERC ordered a hearing on this matter.
In orders issued in November 2003, December 2003 and February 2004, the FERC directed the transmission providers, including us, to eliminate the charge for through and out transmission service as applied to requests made on or after November 17, 2003, for service that commences on or after May 1, 2004, when the power being delivered over our transmission system ultimately serves load in the region comprised of PJM, the MISO, AEP, Ameren, Dayton P&L, ComEd or IP. The revenues lost due to the elimination of this charge can be recovered from the loads that benefit by the elimination of such charge via a “lost revenue recovery mechanism.” This proceeding is ongoing and includes a period of settlement discussions mandated by the FERC. We submitted the first of two required compliance filings in January 2004 and have a second required compliance filing due in April 2004. The FERC’s decision in this proceeding is subject to requests for rehearing and appeal.
The Customer Choice Law requires us to participate in an RTO. Ultimately, any decision we make regarding which RTO to join will be subject to review and approval by the FERC. For several months prior to the execution of the purchase agreement with Ameren, we had suspended our efforts to join an RTO in light of the possible sale. Pursuant to the purchase agreement, we agreed to submit, within 90 days following the purchase date, an application to join the MISO. The timely submission of this application is a condition to the closing of the sale and the application will be conditioned on FERC approval of the sale.
Gas Matters Our retail natural gas sales also are regulated by the ICC. Our sales of gas are currently priced under a purchased gas adjustment mechanism under which our gas purchase costs are passed through to our customers if such costs are determined prudent. Our rates for delivering gas are set by the ICC based on our cost of service. Pursuant to the sale agreement with Ameren, we will file with the ICC no later than June 30, 2004, revised gas service tariffs proposing a general increase in base rates for gas service. The approval of the rate case, which will be the first such case we have filed since 1993 in Docket No. 93-0183, will be at the ICC’s discretion.
Please see Note 5 - “Commitments and Contingencies,” in the accompanying audited financial statements for a description of the other material regulatory matters affecting us.
Environmental Matters
General We are subject to regulation by various federal and Illinois authorities with respect to environmental matters and may in the future become subject to additional regulation by such authorities or by other federal, state and local governmental bodies. Environmental laws and regulations, including environmental regulators’ interpretations of these laws and regulations, are complex, change frequently and have tended to become more stringent over time. Many environmental laws require permits from governmental authorities before construction on a project may be commenced or before wastes or other materials may be discharged into the environment. The process for obtaining necessary permits can be lengthy and complex, and can sometimes result in the establishment of permit conditions that make the project or activity for which the permit was sought either unp rofitable or otherwise unattractive. Even where permits are not required, compliance with environmental laws and regulations can require significant capital and operating expenditures, and we may be required to incur costs to remediate contamination from past releases of wastes into the environment. Failure to comply with these statutes, rules and regulations may result in the assessment of administrative, civil and even criminal penalties. Furthermore, the failure to obtain or renew an environmental permit could prevent operation of one or more of our facilities. We do
not expect that our compliance with any such environmental regulations will have a material adverse effect upon our capital expenditures, earnings or competitive position. For more information, please see Note 5 – “Commitments and Contingencies” in the accompanying audited financial statements.
Baldwin Station Litigation Illinois Power and DMG are the subject of an NOV from the EPA and a complaint filed by the EPA and the Department of Justice in federal district court alleging that we failed to obtain required construction permits in connection with certain repair and maintenance activities at the Baldwin Station in violation of the Clean Air Act and certain related federal and Illinois regulations. The trial to address the claims of liability in this matter concluded in September 2003 and we are awaiting the issuance of a decision from the presiding judge. Please read, Note 5 – “Commitments and Contingencies -U.S. Environmental Protection Agency Complaint” in the accompanying audited financial statements for further discussion of this lawsuit.
Remedial Laws We are also subject to environmental remediation requirements, including provisions of the Comprehensive Environmental Response, Compensation and Liability Act, or CERCLA, and the corrective action provisions of the federal Resource Conservation and Recovery Act, or RCRA, and similar state laws. CERCLA imposes liability, regardless of fault or the legality of the original conduct, on persons that contributed to the release of a “hazardous substance” into the environment. These persons include the current or previous owner and operator of a facility and companies that disposed, or arranged for the disposal, of the hazardous substance found at a facility. CERCLA also authorizes the EPA and, in some cases, private parties to take actions in response to threats to public health or the environment and to seek recovery for the costs of cleaning up the hazardous substances that have been released and for damages to natural resources from such responsible party. Further, it is not uncommon for neighboring landowners and other affected parties to file claims for personal injury and property damage allegedly caused by the hazardous substances released into the environment. CERCLA or RCRA could impose remedial obligations at a variety of our facilities.
In the early 1900s, we operated two dozen sites at which synthetic gas was manufactured from coal. Operation of these MGP sites was generally discontinued in the 1950s when natural gas became available from interstate gas transmission pipelines. Many of these MGP sites were contaminated with residues from the gas manufacturing process and remediation of this historic contamination could be required under CERCLA or RCRA or analogous state laws. We are in the process of cleaning up sites that we have identified as requiring remediation. Recovery of clean-up costs in excess of insurance proceeds is considered probable from our electric and gas customers. For more information on our MGP sites, please see Note 5 - “Commitments and Contingencies” in the accompanying audited financial statements.
Pipeline Safety In addition to environmental regulatory issues, the design, construction, operation and maintenance of some of our pipeline facilities are subject to the safety regulations established by the Secretary of the U.S. Department of Transportation pursuant to the Natural Gas Pipeline Safety Act and the Hazardous Liquid Pipeline Safety Act, or by state regulations meeting the requirements of the NGPSA and the HLPSA, or to similar statutes, rules and regulations in other jurisdictions. In December 2000, the DOT adopted new regulations requiring operators of interstate pipelines to develop and follow an integrity management program that provides for continual assessment of the integrity of all pipeline segments that could affect so-called “high consequence” environmental impact areas, through periodic internal inspection, pressure testing or other equa lly effective assessment means. An operator’s program to comply with the new rule must also provide for periodically evaluating the pipeline segments through comprehensive information analysis, remediating potential problems found through the required assessment and evaluation, and assuring additional protection for the high consequence segments through preventative and mitigative measures. The requirements of this new DOT rule will likely increase the costs of pipeline operations. We believe that such costs will not be material to our financial position or results of operations.
Health and Safety Our operations are subject to the requirements of OSHA and other comparable federal and state statutes. The OSHA hazard communication standard, the EPA community right-to-know regulations under Title III of the Superfund Amendments and Reauthorization Act and similar state statutes require that information be organized and maintained about hazardous materials used in or produced by our operations. Some of this information must be provided to employees, state and local government authorities and citizens.
We believe we are currently in compliance, and expect to continue to comply in all material respects, with these rules and regulations.
Other Issues Hazardous and non-hazardous wastes that we generate must be managed in accordance with federal regulations under the TSCA, the CERCLA and the RCRA and additional state regulations promulgated under both the RCRA and state law. Regulations promulgated in 1988 under the RCRA govern our use of underground storage tanks. The use, storage and disposal of certain toxic substances, such as polychlorinated biphenyls in electrical equipment, are regulated under the TSCA. Hazardous substances used by us are subject to reporting requirements under the Emergency Planning and Community-Right-To-Know Act. The State of Illinois has been delegated authority for enforcement of these regulations under the Illinois Environmental Protection Act and state statutes. These requirements impose certain monitoring, record keeping, reporting and operational requirements that we have implemented or are implementing to assure compliance. We do not anticipate that compliance with any such environmental regulations will have a material adverse impact on our financial position or results of operations.
Operational Risks and Insurance
We are subject to all risks inherent in the various businesses in which we operate. These risks include, but are not limited to, explosions, fires, terrorist attacks, product spillage, weather, nature and the public, which could result in damage to or destruction of operating assets and other property, or could result in personal injury, loss of life or pollution of the environment, as well as curtailment or suspension of operations at the affected facility. We maintain general public liability and property/boiler and machinery insurance in amounts that we consider to be adequate for such risks. Such insurance is subject to deductibles that we consider reasonable and not excessive given the current insurance market environment. The costs associated with these insurance coverages have increased significantly during recent periods and will more than likely continue to increase in the future. The occurrence of a significant event not fully insured or indemnified against, or the failure of a party to meet its indemnification obligations, could materially and adversely affect our results of operations and financial condition. While we currently maintain levels and types of insurance that we believe to be prudent under current insurance industry market conditions, our potential inability to secure these levels and types of insurance in the future could negatively impact our business operations and financial stability, particularly if a significant uninsured loss were to occur. No assurance can be given that we will be able to maintain these levels of insurance in the future at rates we consider commercially reasonable.
Seasonality
Our electric and natural gas sales are affected by seasonal weather patterns. Electricity sales are generally higher during the summer months when warm weather typically requires air conditioner usage. Alternatively, gas sales are generally higher in the winter months when cold weather typically requires gas-fired heater usage. Consequently, our operating revenues and associated operating expenses are not distributed evenly throughout the year.
Significant Customer
No single customer accounted for greater than 10% of our consolidated revenues during 2003, 2002 or 2001.
Employees
At December 31, 2003, we had 564 salaried employees and 1,243 bargaining unit employees. We are subject to collective bargaining agreements with various unions. We consider relations with both bargaining unit and salaried employees to be satisfactory.
Item 2. Properties
We have included descriptions of the location and general character of our principal physical operating properties above in “Item 1, Business.” Those descriptions are incorporated herein by this reference. A majority of our assets are pledged as collateral with respect to our mortgage bonds. Please read Note 9 - “Long-Term Debt” in the accompanying audited financial statements for further discussion of our mortgage bonds.
Item 3. Legal Proceedings
For a description of our material legal proceedings, please read “Environmental Matters” and “Other – Legal Proceedings” in Note 5 – “Commitments and Contingencies” in the accompanying audited financial statements.
Item 4. Submission of Matters to a Vote of Security Holders
No matter was submitted to a vote of security holders during the fourth quarter of 2003.
PART II
Item 5. Market for Registrant’s Common Equity and Related Stockholder Matters
All of our common stock is owned by our parent corporation, Illinova. In accordance with the terms of our October 2002 netting agreement with Dynegy, no common stock dividends were paid in 2003. In March 2002 and March 2001, payments of dividends on common stock of $0.5 million and $100.0 million, respectively, were made to Illinova, as authorized by the Board of Directors. For more information on our netting agreement, please read “Management’s Discussion and Analysis of Financial Condition and Results of Operations - Affiliate Transactions” below.
In March 2002, we completed a solicitation of consents from our preferred stockholders to amend our Restated Articles of Incorporation to eliminate a provision that limited the amount of unsecured indebtedness that we could issue or assume. Concurrently, Illinova completed a tender offer pursuant to which it acquired 662,924 shares, or approximately 73%, of our preferred stock. The New York Stock Exchange delisted each series of preferred stock that was subject to the tender offer and previously listed thereon. We amended our Restated Articles of Incorporation to eliminate the restriction on incurring unsecured indebtedness. We paid approximately $1.3 million for charges incurred in connection with the consent solicitation. These charges are reflected as an adjustment to retained earnings in the accompanying Consolidated Balance Sheets.
During 2003 and 2002, we paid the required quarterly dividends on our preferred stock as follows:
Cumulative Preferred
Stock Series | | | Shares Outstanding | | | Quarterly Dividend Per Share | | | Quarterly Dividend Paid | |
| |
| |
| |
| |
| | | | | | | | | | | |
| 4.08% | | | 225,510 | | $ | 0.5100 | | $ | 115,010 | |
| 4.20% | | | 143,760 | | $ | 0.5250 | | | 75,474 | |
| 4.26% | | | 104,280 | | $ | 0.5325 | | | 55,529 | |
| 4.42% | | | 102,190 | | $ | 0.5525 | | | 56,460 | |
| 4.70% | | | 145,170 | | $ | 0.5875 | | | 85,287 | |
| 7.75% | | | 191,765 | | $ | 0.96875 | | | 185,772 | |
| | | | | | |
| |
| | | | | | | | | | | |
| | | | | | | | $ | 573,532 | |
| | | | | | |
| |
Securities Authorized For Issuance Under Equity Compensation Plans
We are an indirect, wholly-owned subsidiary of Dynegy. None of our employees receive compensation in the form of IP equity. However, there are compensation plans with our employees, including stock option plans, pursuant to which our employees can and do receive stock-based compensation from Dynegy. Please read Dynegy’s Annual Report on Form 10-K for the fiscal year ended December 31, 2003 for a discussion of the shares of Dynegy common stock that are reserved for issuance pursuant to these plans. Please read Note 11 – “Common Stock and Retained Earnings” in the accompanying audited financial statements for more information on these stock option plans.
Item 6. Selected Financial Data
The selected financial information presented below was derived from, and is qualified by reference to, our Consolidated Financial Statements, including the Notes thereto, contained elsewhere herein. The selected financial information should be read in conjunction with the Consolidated Financial Statements and related Notes and “Management’s Discussion and Analysis of Financial Condition and Results of Operations.”
|
| S E L E C T E D F I N A N C I A L D A T A | | | |
| | | (Millions of dollars) | |
| | | 2003 | | | 2002 | | | 2001(3) | | | 2000(3) | | | 1999 | |
|
| Operating revenues | | | | | | | | | | | | | | | | |
| Electric | | $ | 1,101.9 | | $ | 1,138.8 | | $ | 1,137.1 | | $ | 1,189.4 | | $ | 1,178.6 | |
| Electric interchange(1) | | | - | | | 7.1 | | | 0.7 | | | 2.7 | | | 420.2 | |
| Gas | | | 465.9 | | | 372.4 | | | 476.6 | | | 393.5 | | | 304.4 | |
|
| Total operating revenues | | $ | 1,567.8 | | $ | 1,518.3 | | $ | 1,614.4 | | $ | 1,585.6 | | $ | 1,903.2 | |
|
| Earnings before cumulative effect of change in accounting principle | | $ | 119.4 | | $ | 160.7 | | $ | 166.2 | | $ | 134.9 | | $ | 113.1 | |
| Cumulative effect of change in accounting principle, net of tax(2) | | $ | (2.4 | ) | | - | | | - | | | - | | | - | |
| Net income | | $ | 117.0 | | $ | 160.7 | | $ | 166.2 | | $ | 134.9 | | $ | 113.1 | |
| Effective income tax rate | | | 38.9 | % | | 39.3 | % | | 41.4 | % | | 38.2 | % | | 38.7 | % |
|
| Net income applicable to common shareholders | | $ | 114.7 | | $ | 158.4 | | $ | 157.9 | | $ | 121.0 | | $ | 95.6 | |
| Cash dividends declared on common stock | | | - | | | 0.5 | | | 100.0 | | | - | | | 40.9 | |
|
| Total assets(4) | | $ | 5,059.2 | | $ | 5,050.3 | | $ | 4,929.3 | | $ | 5,038.9 | | $ | 5,363.1 | |
|
| Capitalization | | | | | | | | | | | | | | | | |
| Common stock equity | | $ | 1,484.9 | | $ | 1,366.2 | | $ | 1,221.9 | | $ | 1,156.3 | | $ | 1,035.2 | |
| Preferred stock | | | 45.8 | | | 45.8 | | | 45.8 | | | 45.8 | | | 45.8 | |
| Mandatorily redeemable preferred stock | | | - | | | - | | | - | | | 100.0 | | | 193.4 | |
| Long-term debt | | | 1,434.6 | | | 1,718.8 | | | 1,605.6 | | | 1,787.6 | | | 1,906.4 | |
| Long-term debt to IPSPT(5) | | | 345.6 | | | - | | | - | | | - | | | - | |
|
| Total capitalization | | $ | 3,310.9 | | $ | 3,130.8 | | $ | 2,873.3 | | $ | 3,089.7 | | $ | 3,180.8 | |
|
| Retained earnings | | $ | 504.9 | | $ | 390.2 | | $ | 233.6 | | $ | 175.7 | | $ | 54.7 | |
|
| Capital expenditures | | $ | 125.5 | | $ | 144.5 | | $ | 148.8 | | $ | 157.8 | | $ | 197.2 | |
| Cash flows from operations | | $ | 136.3 | | $ | 209.4 | | $ | 345.0 | | $ | 381.3 | | $ | 85.8 | |
| Ratio of earnings to fixed charges | | | 2.18 | | | 3.30 | | | 3.25 | | | 2.53 | | | 2.16 | |
|
| (1) | | Interchange sales volumes are not comparable year to year due to the October 1999 transfer of our generation assets. Please read Note 4 - “Related Parties” in the accompanying audited financial statements for more information. |
| | |
| (2) | | Effective January 1, 2003, we adopted SFAS 143, “Accounting for Asset Retirement Obligations.” In accordance with the provisions of SFAS 143, we recorded our ARO obligations as a cumulative effect adjustment, net of tax. Please read Note 1 - “Summary of Significant Accounting Policies – Accounting Principles Adopted” in the accompanying audited financial statements for more information. |
| (3) | | The consolidated financial statements for the years ended December 31, 2001 and 2000 were audited by other independent accountants who have ceased operations. Please read “Report of Independent Public Accountants” in the accompanying audited financial statements. |
| | |
| (4) | | SFAS 143, which we adopted in January 2003, requires that cost of removal, which was previously a component of our reserve for depreciation, be reclassified as a regulatory liability. At December 31, 2003, $72.2 million cost of removal, net of salvage, was reclassified. Total assets for the years 2002, 2001, 2000 and 1999, approximately $68.7 million, $68.2 million, $67.2 million and $65.3 million, respectively, were adjusted to reflect the effect of SFAS 143. For additional information, please read Note 1 – “Summary of Significant Accounting Policies – Cost of Removal, Net.” |
| | |
| (5) | | Effective December 31, 2003, IPSPT was deconsolidated from our financial statements in conjunction with the adoption of FIN No. 46R. Please read Note 1 - “Summary of Significant Accounting Policies – Accounting Principles Adopted” in the accompanying audited financial statements for more information. |
Item 7. Management’s Discussion and Analysis of Financial Condition and Results of Operations
General – Company Profile
We are engaged in the transmission, distribution and sale of electric energy and the distribution, transportation and sale of natural gas in the State of Illinois. We provide electric and natural gas service to residential, commercial and industrial customers in substantial portions of northern, central and southern Illinois. We are a regulated utility that serves more than 590,000 electricity customers and nearly 415,000 natural gas customers in northern, central and southern Illinois. We generate earnings and cash flows in this business through sales of electric and gas service to residential, commercial and industrial customers. We also currently supply electric transmission service to numerous utilities, electric cooperatives, municipalities and power marketing entities in the State of Illinois.
We are an indirect, wholly-owned subsidiary of Dynegy Inc. Dynegy acquired our direct parent company, Illinova, and its subsidiaries, including us, in February 2000. Our operations comprise one of Dynegy’s four reportable segments. Dynegy is continuing its self-restructuring efforts and made substantial progress in 2003 in terms of exiting non-core businesses and extending a substantial portion of its debt maturities; however, Dynegy still has substantial debt and other obligations. Our results of operations and financial condition are affected by the consolidated financial and liquidity position of Dynegy, particularly because we rely on interest payments under a $2.3 billion intercompany note receivable from Illinova, our direct parent company and a wholly-owned Dynegy subsidiary (“Note Receivable from Affiliate”), for a significant portion of our net cash provided by operating act ivities. Please read “Liquidity and Capital Resources - Our Relationship with Dynegy” below for further discussion.
We were a leader in the development of the comprehensive electric utility regulatory reform legislation for the State of Illinois, which provided the foundation for our subsequent strategic actions and transformation. Following the successful execution of our strategy to transfer our wholly-owned generating assets to an unregulated affiliate and to exit our nuclear operations, we are now focused on delivering reliable transmission and distribution service in a cost-effective manner.
The earnings and cash flows generated by us are primarily driven by the volumes of electricity and natural gas that we sell. In terms of costs, retail electric rates are frozen through 2006, and gas costs are passed through to customers. The primary factors impacting earnings and cash flows include:
| Ø | weather and its effect on demand for our services, particularly with respect to residential electric customers; |
| | the number of customers that choose another retail electric provider under the Illinois Customer Choice Law; |
| | our ability to control our capital expenditures, which primarily are limited to maintenance, safety and reliability projects, and new business services and other costs through disciplined management and safe, efficient operations; and |
| | general economic conditions and the resulting effect on demand for our services, particularly with respect to commercial and industrial customers. |
Dynegy and Illinova recently entered into an agreement with Ameren to sell the shares of our common and preferred stock owned by Illinova for $2.3 billion. The transaction is expected to close before the end of 2004, subject to the receipt of required regulatory approvals and other closing conditions. Please read Note 2 – “Agreed Sale to Ameren” in the accompanying audited financial statements for further discussion.
Liquidity and Capital Resources
Overview
We have a significant amount of leverage, including quarterly payments of approximately $21.6 million due on the IPSPT transitional funding trust notes through 2008. Because we have no revolving credit facility and no access to the commercial paper markets, we have relied on cash on hand, cash from liquidity initiatives and cash flows from operations, including interest payments under our Note Receivable from Affiliate, to satisfy our debt obligations and to otherwise operate our business. Absent interest payments under our Note Receivable from Affiliate, including the prepayments described below, our cash flows from operations are insufficient to cover our capital expenditures, debt service and other obligations. For the next twelve months, we believe that our cash on hand, cash flows from operations, including interest payments under our Note Receivable from Affiliate, and any nec essary additional liquidity support, which Dynegy has committed to provide, will be sufficient to satisfy these obligations. Over the longer term, our liquidity and capital resources are expected to be significantly impacted by the outcome of the pending Ameren transaction. Please read “- Liquidity and Debt Maturities - Conclusion -” below and Note 2 - “Agreed Sale to Ameren” in the accompanying audited financial statements for further discussion.
Our Relationship with Dynegy
As stated above, we are an indirect, wholly-owned subsidiary of Dynegy Inc. We are susceptible to developments at Dynegy because we rely on an unsecured Note Receivable from Affiliate for a substantial portion of our net cash provided by operating activities. The note, which had $2.3 billion in principal outstanding at December 31, 2003, matures on September 30, 2009 and bears interest at an annual rate of 7.5%, due semiannually in April and October. Because our operating cash flows, cash on hand and other capital resources were insufficient to satisfy our 2003 debt maturities, Dynegy prepaid approximately $127.8 million of interest on our Note Receivable from Affiliate. In January 2004, we received an additional $42.6 million of prepaid interest on our Note Receivable from Affiliate. These prepayments were recorded in Deferred Credits – Other on our Consolidated Balance Sheet.
We have reviewed the collectibility of this note to assess whether it has become impaired as required by GAAP. Based upon our assessment, we do not believe that the Note Receivable from Affiliate is impaired. Please read “-Critical Accounting Policies” below for further discussion as to applicable GAAP regarding impairment of the Note Receivable from Affiliate. Principal payments on the Note Receivable from Affiliate are not required until 2009 when it is due in full; as a result, future events may effect our view as to the collectiblity of the remaining principal owed us thereunder.It is possible that if negative events affect Dynegy or if we do not receive timely interest payments on the Note Receivable from Affiliate, such matters could cause us to believe it necessary to impair the Note Receivable from Affiliate on our Consolidated Balance Sheet and such action could have a mat erial adverse effect on our financial condition and results of operations.
In connection with Dynegy’s agreement to sell our common and preferred stock to Ameren, the Note Receivable from Affiliate is required to be addressed. For more information on the proposed sale and the Note Receivable from Affiliate, please read Note 2 - “Agreed Sale to Ameren” and Note 4 - “Related Parties” in the accompanying audited financial statements.
Liquidity and Debt Maturities
Sources of Liquidity We are currently satisfying our capital requirements primarily with cash flows from operations, cash on hand and interest payments under our $2.3 billion Note Receivable from Affiliate, including approximately $170.4 million of prepaid interest received through January 2004.
In December 2002, we sold $550 million of 11 1/2% Mortgage bonds due 2010 in a private offering. Of the $550 million, we issued $400 million in December 2002, with $150 million issued on a delayed delivery basis subject to ICC approval, which we received in January 2003. The mortgage bonds were sold at a discounted price of $97.48 to yield an effective rate of 12%. We received net cash proceeds of approximately $380 million in December 2002 and approximately $142.5 million in January 2003 from this offering.
Due to our non-investment grade credit ratings and other factors, we do not have access to the commercial paper markets, and our access to the capital markets is limited. These factors, along with the level of our indebtedness and the fact that we do not currently have a revolving credit facility, will have several important effects on our future operations. First, a significant portion of our operating cash flows will be dedicated to the payment of principal and interest on our outstanding indebtedness, including the IPSPT transitional funding trust notes and the increased interest expense associated with our December 2002 $550 million Mortgage bond financing, and will not be available for other purposes. Second, our ability to obtain additional financing for working capital, capital expenditures, general corporate and other purposes is limited. We therefore expect to continue to rely on Dynegy� 46;s commitment to provide additional liquidity as and when needed. Please read Note 2 – “Agreed Sale to Ameren” in the accompanying audited financial statements for a discussion of the pending sale of our company to Ameren, the outcome of which will significantly impact our future liquidity position.
Uses of Liquidity In May 2003, we paid the remaining $100 million on our one-year term loan using proceeds from our December 2002 $550 million Mortgage bond offering. In December 2002 we had paid $200 million on the loan. In August 2003, we repaid $100 million of mortgage bonds at maturity and in September 2003, we repaid $90 million of mortgage bonds at maturity. We repaid these bonds using the remaining proceeds from our December 2002 $550 million Mortgage bond offering and prepaid interest on our Note Receivable from Affiliate.
Debt Maturities As of December 31, 2003, our debt maturities through December 31, 2006 were as follows (millions of dollars):
| | | | 2004 | | | 2005 | | | 2006 | |
| |
IPSPT Transitional Funding Trust Notes | | | | | | | | | | |
1st quarter(1) | | $ | 9.5 | | $ | 21.6 | | $ | 21.6 | |
2nd quarter | | | 21.6 | | | 21.6 | | | 21.6 | |
3rd quarter | | | 21.6 | | | 21.6 | | | 21.6 | |
4th quarter | | | 21.6 | | | 21.6 | | | 21.6 | |
Tilton Lease (2) | | | | | | | | | | |
3rd quarter | | | 81.0 | | | | | | | |
6 ¾% Mortgage Bonds | | | | | | | | | | |
1st quarter | | | | | | 70.0 | | | | |
| | |
| |
| |
| |
| | $ | 155.3 | | $ | 156.4 | | $ | 86.4 | |
| | |
| |
| |
| |
|
| (1) | | Due to the adoption of FIN No. 46R and resulting deconsolidation of IPSPT, certain amounts, included in restricted cash, are netted against the first quarter 2004 maturity, which is included in the current portion of our long-term debt payable to IPSPT on our December 31, 2003 consolidated balance sheet. |
| (2) | | Please read “Off-Balance Sheet Financing” below for additional information. |
Affiliate Transactions In October 2002, the ICC issued an order approving a netting agreement among us, Dynegy, Illinova and several other Dynegy subsidiaries. Under the netting agreement, we can discharge and satisfy payments due to the other parties to the netting agreement under a Services and Facilities Agreement, or for natural gas and transportation services, by offsetting and netting such payments due against interest due us, but unpaid, under our intercompany note with Illinova, or amounts billed by us to, or owed to us by, the other parties under certain other agreements. Similarly, Illinova would be entitled to discharge and satisfy semiannual interest payments due to us under the intercompany note, and for other services, by offsetting and netting such payments due us against amounts billed to us but unpaid under the Se rvices and Facilities Agreement, which includes tax sharing provisions between us and Dynegy, or for natural gas and transportation services. The netting agreement does not, however, give us a right to offset our payments owed under the power purchase agreement with DMG against the payments due us from Dynegy or its affiliates. Additionally, under the same ICC order, we may not pay any common dividend to Dynegy or its affiliates until our mortgage bonds are rated investment grade by Moody’s and Standard & Poor’s and specific approval for such payment is obtained from the ICC.
Our financial statements include related-party transactions with IPSPT, our wholly-owned unconsolidated subsidiary, as reflected in the table below (millions of dollars):
| | | | 12/31/03(1) | | | 12/31/02 | |
|
| Investment in IPSPT | | $ | 4.3 | | $ | - | |
| Receivable from IPSPT (noncurrent) | | $ | 2.2 | | $ | - | |
| Long-term debt to IPSPT (including due within one year)(2) | | $ | 419.9 | | $ | - | |
| (1) | | Effective December 31, 2003, IPSPT was deconsolidated from our financial statements in conjunction with the adoption of FIN No. 46R. |
| (2) | | Due to the adoption of FIN No. 46R and resulting deconsolidation of IPSPT, certain amounts included in restricted cash are netted against the current portion of our long-term debt payable to IPSPT on our December 31, 2003 consolidated balance sheet. |
Off-Balance Sheet Financing As previously disclosed, in September 1999, we entered into an $81 million operating lease on four gas turbines located in Tilton, Illinois. These facilities consist of peaking units with generating capacity of 176 MW. The lease runs until September 2004, with an option to renew for two additional years. In October 1999, we subleased the turbines to DMG. In September 2003, we delivered notice of our intent to purchase the turbines upon expiration of the operating lease in September 2004 but expect the ultimate purchaser to be DMG. As a result of this action, the operating lease was reclassified as a capital lease and we are now the capital sublessor. As a result, we no longer have any off-balance sheet financing arrangements.
Based upon an independent appraisal, we recorded a receivable from DMG at the fair market value of $66.4 million, which is offset by a corresponding liability to the original lessor. The receivable from DMG and payable to the original lessor will be accreted monthly, using the straight line method to the $81 million purchase obligation in September 2004. The accretion recorded for 2003 was approximately $4.3 million and was recorded as interest income offset by the same amount of interest expense. The accretion to be recorded in 2004 will be approximately $10.3 million. The net effect on our income statement will be zero. This obligation was previously disclosed as a lease obligation in the footnotes to our financial statements and the Commercial Financial Obligations and Contingent Financial Commitments tables in our 2002 Form 10-K.
The following table sets forth our lease expense and lease payments (millions of dollars) relating to Tilton for the periods presented.
| | | 2003 | | | 2002 | |
| | |
| |
| |
Lease expense | | $ | 2.7 | | $ | 2.7 | |
Lease payments (cash flows) | | $ | 2.7 | | $ | 2.7 | |
Pursuant to the sublease of these facilities, DMG is concurrently reimbursing us for the lease payments above.
We have determined that we have an Asset Retirement Obligation related to the lease for the Tilton facilities. For further information regarding our ARO, please read Note 1 – “Summary of Significant Accounting Policies” in the accompanying audited financial statements.
Disclosure of Financial Obligations and Contingent Financial Commitments We have entered into various financial obligations and commitments in the course of our ongoing operations and financing strategies. Financial obligations are considered to represent known future cash payments that we are required to make under existing contractual arrangements, such as debt and lease agreements. These obligations may result from general financing activities, as well as from commercial arrangements that are directly supported by related revenue-producing activities. Contingent financial commitments represent contingent obligations that become payable only if certain pre-defined events were to occur, such as funding financial guarantees.
The following table provides a summary of our contractual obligations and commercial commitments as of December 31, 2003 (millions of dollars).
Financial Obligations and Commercial Commitments |
|
Payments Due by Period |
|
Cash Obligations* | | | Total | | | 2004 | | | 2005 | | | 2006 | | | 2007 | | | 2008 | | | Thereafter | |
|
| Long-Term Debt (1) | | $ | 1,444.6 | | $ | - | | $ | 70.0 | | $ | - | | $ | - | | $ | - | | $ | 1,374.6 | |
| IPSPT Transitional Funding Trust Notes (2) | | | 419.9 | | | 74.3 | | | 86.4 | | | 86.4 | | | 86.4 | | | 86.4 | | | - | |
| Capital Lease (3) | | | 83.1 | | | 83.1 | | | - | | | - | | | - | | | - | | | - | |
| DecommissioningCharges-Clinton (4) | | | 4.9 | | | 4.9 | | | - | | | - | | | - | | | - | | | - | |
| Decommissioning-DOE (5) | | | 2.2 | | | 0.7 | | | 0.7 | | | 0.8 | | | - | | | - | | | - | |
| Unconditional Purchase Obligations (6) | | | 429.2 | | | 382.5 | | | 12.9 | | | 9.8 | | | 6.1 | | | 4.6 | | | 13.3 | |
| Conditional Purchase Obligations (7) | | | 205.0 | | | 205.0 | | | - | | | - | | | - | | | - | | | - | |
| Pension Funding Obligation(8) | | | 69.5 | | | 2.0 | | | 32.5 | | | 35.0 | | | - | | | - | | | - | |
| Operating Leases (9)(10) | | | 9.7 | | | 1.7 | | | 1.5 | | | 1.4 | | | 1.2 | | | 1.2 | | | 2.7 | |
|
| Total Contractual Cash Obligations | | $ | 2,668.1 | | $ | 754.2 | | $ | 204.0 | | $ | 133.4 | | $ | 93.7 | | $ | 92.2 | | $ | 1,390.6 | |
|
| * | | Cash obligations herein are not discounted and do not include related interest or accretion. |
| | |
| (1) | | Aggregate principal outstanding under our mortgage bonds approximated $1.4 billion at December 31, 2003, bearing interest ranging from 1.55% to 11 1/2% per annum. We have a mortgage bond issue of $70 million maturing in March 2005. |
| | |
| (2) | | Reflects the balance of $864 million of IPSPT Transitional Funding Trust Notes issued by IPSPT in December 1998 as allowed under the Illinois Electric Utility Transition Funding Law in P.A. 90-561. Per annum interest on these notes averages approximately 5.50%. IPSPT is retiring the principal outstanding under these notes utilizing our quarterly payments of $21.6 million through 2008. Effective December 31, 2003, IPSPT was deconsolidated from our financial statements in conjunction with the adoption of FIN No. 46R. Please read Note 1 – “Summary of Significant Accounting Policies – Accounting Policies Adopted” in the accompanying audited financial statements for additional information. |
| | |
| (3) | | Reflects our $2.1 million annual lease payment and $81 million purchase obligation related to the capital lease on the Tilton turbines, which will be terminated in 2004. We are subleasing the turbines to our affiliate, DMG, who is responsible for making all such payments on the turbines. |
| | |
| (4) | | Reflects decommissioning charges associated with our former Clinton facility. See Note 1 – “Summary of Significant Accounting Policies” in the accompanying audited financial statements included herein for additional information. |
| | |
| (5) | | Reflects decontamination and decommissioning charges associated with our use of a DOE facility that enriched uranium for the Clinton Power Station. We were assessed an amount to be paid over fifteen years that would be used to pay for DOE’s decontamination and decommissioning of its facility. Our final payment is due in 2006. |
| | |
| (6) | | Reflects an unconditional power purchase obligation between us and DMG, another Dynegy affiliate. The agreement requires us to compensate the affiliate for capacity charges through 2004 at a total contract cost of $310.8 million. We also have contracts on six interstate pipeline companies for firm transportation and storage services for natural gas. These contracts have varying expiration dates ranging from 2004 to 2012, for a total cost of $66.0 million. We also enter into obligations for the reservation of natural gas supply. These obligations generally range in duration from one to twelve months and require us to compensate the provider for capacity charges. The cost of the agreements is $38.7 million. |
| (7) | | Relates to our expected purchases under the PPA with AmerGen. For additional information, please read Item 1 – “Power Supply” above. |
| | |
| (8) | | This represents the projected defined benefit funding obligation for our pension plans for salaried and union employees, including $0.5 million, $1.9 million, and $1.9 million in 2004, 2005 and 2006, respectively, relating to our affiliate, DMG. Although we expect to incur significant funding obligations subsequent to 2006, such amounts have not been included in this table because our estimates are imprecise. See Note 12 - “Employee Compensation, Savings and Pension Plans” in the audited financial statements included herein for additional information. |
| | |
| (9) | | Our primary operating leases reflected above relate to our material distribution facility, Tilton land lease and a lease on 15 line trucks. The material distribution facility is a commercial property lease for our storage warehouse that expires in 2009 and has remaining lease payments of $3.3 million. The lease on 15 line trucks expires in 2009 and has remaining lease payments of $1.3 million. The remaining leases included in this line relate to copiers, fax machines, small equipment and building leases. |
| | |
| (10) | | The Tilton land lease is subleased to DMG, and we satisfy our contractual obligations under this arrangement with payments made by DMG. Lease payments total $2.4 million for the land lease ending October 2028. |
Contingent Financial Obligations Our contingent financial commitments as of December 31, 2003 are listed below. These commitments represent contingent obligations that may require a payment of cash upon certain pre-defined events.
| | $1.8 million in surety bonds expiring during 2004. These bonds are renewed on a rolling twelve-month basis. |
| | According to the PPA with DMG, we are to provide a security guarantee of $50 million upon a credit downgrade event. This guarantee is being fulfilled by a $50 million guarantee from Dynegy on our behalf. |
| | Dynegy is required to provide collateral to guarantee payment of deductibles for insurance claims and has assigned $12 million to us as our share of its total corporate requirement. |
Credit Ratings As of February 27, 2004, our credit ratings, as assessed by the three major credit rating agencies, were as follows:
|
| | Standard & Poor’s | | Moody’s | | Fitch |
|
| Senior secured debt | | B | | B1(1) | | B |
| Senior unsecured debt | | * | | B2 | | CCC+ |
| Preferred stock | | CCC | | Caa2 | | CC |
*Not rated
| (1) | | Reflects a February 2004 two-notch ratings upgrade by Moody’s Investors Service, who cited the pending sale to Ameren and indicated that our credit ratings remained under review for further upgrade. B1 is four notches below investment grade. |
Our non-investment grade status has limited our ability to refinance our debt obligations as they mature and limits our access to the capital markets. Our non-investment grade status also will likely increase the borrowing costs incurred in connection with any such actions. Our financial flexibility has likewise been reduced as a result of, among other things, restrictive covenants and other terms typically imposed on non-investment grade borrowers. For a description of the restrictions included in our 11 1/2% Mortgage bonds issued in December 2002 and January 2003, please read Note 9 – “Long-Term Debt” in the accompanying audited financial statements.
We have been requested to provide letters of credit or other credit security to support certain business transactions, including our purchase of natural gas and natural gas transportation. As of December 31, 2003, Dynegy posted $26 million in letters of credit in support of these transactions. Additionally, in July
2002, some of our suppliers began to require us to accelerate payment for some of our natural gas purchases.
Dividends There are restrictions on our ability to pay cash dividends, including any dividends that we might pay indirectly to Dynegy. Under our Restated Articles of Incorporation, we may pay dividends on our common stock, all of which is owned by Illinova, subject to the preferential rights of the holders of our preferred stock, of which Illinova owns approximately 73%. We also are limited in our ability to pay dividends by the Illinois Public Utilities Act and the Federal Power Act, which require retained earnings equal to or greater than the amount of any proposed dividend. In 2003, we did not pay any dividends on our common stock; however, we paid $0.5 million of dividends on our common stock to Illinova in March of 2002. Additionally, the ICC’s October 23, 2002 order relating to a netting agreement between us and Dynegy prohibits us from declaring and paying any dividends on our common stock until such time as our mortgage bonds are rated investment grade by both Moody’s and Standard & Poor’s and further requires that we first obtain approval for any such payment from the ICC.
Capital Expenditures Capital expenditures for 2003 were approximately $125.5 million. Capital expenditures consist of numerous projects to upgrade and maintain the reliability of our electric and gas transmission and distribution systems, add new customers to the system and prepare for a competitive environment. Our capital expenditures for 2004 are expected to total approximately $140 million. Additional expenditures may be required during this period to accommodate the transition to a competitive environment, environmental compliance, system upgrades and other costs that cannot be determined at this time.
Commitments and Contingencies Please read Note 5 - “Commitments and Contingencies,” which is incorporated herein by reference, for a discussion of our commitments and contingencies.
Conclusion We have a significant amount of indebtedness, including quarterly payments of approximately $21.6 million due on the IPSPT transitional funding trust notes through 2008.
Due to our non-investment grade credit ratings and other factors, we do not have access to the commercial paper markets, and our access to the capital markets is limited. These factors, along with the level of our indebtedness and the fact that we do not currently have a revolving credit facility, will have several important effects on our future operations. First, a significant portion of our cash flows will be dedicated to the payment of principal and interest on our outstanding indebtedness, including the increased interest expense associated with our December 2002 $550 million Mortgage bond financing, and will not be available for other purposes. Second, our ability to obtain additional financing for working capital, capital expenditures, general corporate and other purposes is limited.
For the near term, our debt maturities primarily comprise (i) quarterly payments on the IPSPT transitional funding trust notes, for which we receive a separate revenue stream from our customers; and (ii) an $81 million payment on our Tilton lease in September 2004, which we expect to receive from DMG under the sublease agreement. We believe that we have sufficient internal liquidity sources, including Dynegy’s commitment of support, to satisfy these debt maturities and our commercial obligations for the next twelve months. Importantly, while Dynegy’s restructured credit facility, which expires in February 2005, prohibits it from prepaying more than $200 million in principal under our Note Receivable from Affiliate during the term of the credit agreement, it does not limit Dynegy’s ability to prepay interest under our Note Receivable from Affiliate. In addition, the indenture governing Dynegy Holdings Inc.’s second priority senior secured notes permits payments of principal on the intercompany note receivable up to $450 million or to the extent that a fixed charge coverage ratio of 2:1 is satisfied. The indenture also permits the prepayment of interest on the intercompany note receivable up to twelve months at any one time.
Over the longer term, our liquidity and capital resources will be materially affected by the outcome of the pending sale of our company to Ameren. If the sale is consummated, Ameren has committed to contribute cash to us in order to support our ongoing operating commitments and to reduce our leverage. If the sale is not consummated, we would explore other liquidity initiatives. These initiatives would include an integration of many processes into those of Dynegy’s, which we expect would yield significant cost savings. Another liquidity initiative could include an issuance of mortgage bonds or transitional funding trust notes. Based on our December 31, 2003 financial statements, we could issue approximately $709 million in
mortgage bonds under our 1992 Mortgage. Until December 31, 2004, we also have the ability to cause the issuance by IPSPT, subject to ICC approval, of up to $864 million in additional transitional funding trust notes pursuant to the Illinois Electric Utility Transitional Funding Law. However, under the supplemental indenture we executed in connection with the issuance of our 11 1/2% Mortgage bonds due 2010, we could be required to redeem these bonds if we were to cause the issuance of more than $300 million of transitional funding trust notes.
Our ability to consummate other liquidity initiatives, as described above, is subject to a number of risks, some of which are beyond our control. The outcome of the agreed sale to Ameren is also subject to a number of risks, some of which are beyond our control. These risks include, among others, the receipt of required regulatory approvals, particularly from the ICC, and satisfaction of other closing conditions. We encourage you to read Dynegy’s Annual Report on Form 10-K for the year ended December 31, 2003 for additional information regarding Dynegy and its current liquidity position.
Reference is also made to the section “Uncertainty of Forward-Looking Statements and Information” below for additional factors that could impact our future operating results.
Critical Accounting Policies
Our Accounting Department is responsible for the development and application of accounting policy and control procedures for the organization's financial and operational accounting functions. This department conducts its activities independent of our business units and reports to Dynegy’s Corporate Controller.
We have identified the following critical accounting policies, which require a significant amount of judgment and are considered to be the most important to the portrayal of our financial position and results of operations:
Ø | | revenue recognition; |
Ø | | long-lived assets; |
Ø | | note receivable from affiliate; |
Ø | | regulatory asset amortization; |
Ø | | valuation of pension assets and liabilities; and |
Ø | | accounting for income taxes. |
Revenue Recognition Revenues for utility services are recognized when services are provided to customers. As such, we record revenues for services provided but not yet billed. Unbilled revenues represent the estimated amount customers will be billed for service delivered from the time meters were last read to the end of the accounting period. The estimate is based upon a percentage ratio of daily deliveries into our system throughout the month. A percentage is assigned to each daily delivery representing the portion that will not be billed by the end of the month. The unbilled deliveries are allocated to a revenue class based on current month billed ratios and priced at an average price by class.
Long-lived Assets The estimated useful lives of our long-lived assets are used to compute depreciation expense and are also used for impairment testing. Estimated useful lives are based on the assumption that we provide an appropriate level of capital expenditures while the assets are still in operation. Without these continued capital expenditures, the useful lives of these assets could decrease significantly. These estimates could be impacted by regulatory actions and competition. If the useful lives of these assets are determined to differ from the original estimate, depreciation rates would be adjusted prospectively.
Note Receivable from Affiliate As described above, we hold a $2.3 billion Note Receivable from Affiliate. We are required to review the collectibility of this note to assess whether it has become impaired under the criteria of SFAS No. 114, “Accounting by Creditors for Impairment of a Loan.” Under this standard, a loan is impaired when, based on current information and events, it is “probable” that a creditor will be unable to collect all amounts due according to the contractual terms of the loan agreement. However, if the possibility that we would not be able to collect all amounts due under the contractual terms were only “more likely than not” or “reasonably possible” but not probable, then the Note Receivable from Affiliate would not be
considered impaired under SFAS 114. The use of the terms “probable,” “reasonably possible” and “more likely than not” are used in FAS No. 5, “Accounting for Contingencies,” as follows:
Ø | | Reasonably possible – The chance of the future event or events occurring is more than remote but less than likely. |
Ø | | More likely than not - A level of likelihood that is more than 50%. |
Ø | | Probable – Future events are likely to occur. |
A collectibility assessment in accordance with SFAS 114 is highly subjective given the inherent uncertainty of predicting future events, and principal payments on our Note Receivable from Affiliate are not required until 2009 when it is due in full. We evaluate the range of likelihood of collectibility of our Note Receivable from Affiliate on a quarterly basis utilizing, among other things, our review of the status of Dynegy’s financial condition, the market's view of Dynegy’s debt and stock price, and Dynegy's earnings and cash flow quidence. Any change in assumption or estimate could result in a different outcome. In the future should we conclude that an impairment has occurred, we would measure the note’s realizable value, which may exceed its fair value, based on a probability weighted analysis of multiple expected future cash flows discounted at the note’s e ffective interest rate of 7.5%, as opposed to a market rate of interest, in accordance with SFAS 114.
Regulatory Asset Amortization P.A. 90-561 allows utilities to recover potentially non-competitive investment costs (“stranded costs”) from retail customers during the transition period, which extends until December 31, 2006. During this period, we are allowed to recover stranded costs through frozen bundled rates and transition charges from customers who select other electric suppliers. The amount of amortization recorded in each period is based on the recovery of such costs from the rate payers as measured by our ROE, based on actual and projected recovery of such costs. If different judgments were applied to the projected recovery of these costs, the outcome could differ materially from our estimates. Please read Note 1 - “Summary of Significant Accounting Policies” for additional information on our regulator y asset amortization.
Valuation of Pension Assets and Liabilities Our employees participate in defined benefit pension plans sponsored by Dynegy. The values and discussion below represent the components of the Dynegy defined benefit plans that were sponsored by us prior to the merger with Dynegy. Plan participants include Illinova employees as of February 1, 2000, as well as our employees and employees of DMG hired subsequent to the merger. We are reimbursed by the other Illinova subsidiaries (prior to the merger) and by other Dynegy subsidiaries (subsequent to the merger) for their share of the expenses of the benefit plans. Please see Note 12 – “Employee Compensation, Savings and Pension Plans” in the audited financial statements included herein for more information.
Our pension and postretirement benefit costs are developed from actuarial valuations. Inherent in these valuations are key assumptions provided by us to our actuaries, including the discount rate and expected long-term rate of return on plan assets. Material changes in our pension and postretirement benefit costs may occur in the future due to changes in these assumptions, changes in the number of plan participants, and changes in the level of benefits provided.
The discount rate is subject to change each year, consistent with changes in applicable high-quality, long-term corporate bond indices. Long-term interest rates declined during 2003. Accordingly, at December 31, 2003, we used a discount rate of 6.0%, a decline of 50 basis points from the 6.5% rate used as of December 31, 2002. This decline in the discount rate had the impact of increasing the underfunded status of our pension plans by approximately $41 million.
The expected long-term rate of return on pension plan assets is selected by taking into account the expected duration of the projected benefit obligation for the plans, the asset mix of the plans, and the fact that the plan assets are actively managed to mitigate downside risk. Based on these factors, our expected long-term rate of return as of January 1, 2004 is 8.75%, compared with 9.00% during 2003. This change did not impact 2003 pension expense, but it will adversely impact pension expense beginning in 2004. We expect the decrease in this assumption, coupled with the decreased discount rate discussed above and the passage of time, will increase 2004 pension expense by approximately $10.5 million.
On December 31, 2003, our annual measurement date, the excess of accumulated benefit obligation related to our pension plans continue to exceed the fair value of the pension plan assets (such excess is referred to as an unfunded accumulated benefit obligation). This difference is attributed to (1) an increase in the accumulated benefit obligation that resulted from the decrease in the discount rate and the expected long-term rate of return and (2) a decline in the fair value of the plan assets due to a sharp decrease in the equity markets through December 31, 2002, which was partially recovered during 2003. As a result of the 2003 partial recovery in accordance with SFAS No. 87, “Employers’ Accounting for Pensions”, we recognized a credit to other comprehensive income of $6.3 million (net of taxes of $3.8 million), which increased common stock equity. The cummulative charge to common stock equity for the excess of additional pension liability over the unrecognized prior service cost represents a net loss not yet recognized as pension expense.
The following table illustrates the effect that changes in the assumptions made for discount rate and rate of return would have had on our pension plan assets and liabilities (millions of dollars):
| | | | PBO** | | | 2004 | |
| | | | 12/31/2004 | | | Expense | |
| | |
| |
| |
| 2004 estimate* | | $ | 853.2 | | $ | 25.9 | |
| | | | | | | |
| Impact of changes in rate assumptions: | | | | | | | |
Increase Discount Rate 50 basis points | | $ | (54.2 | ) | $ | (5.0 | ) |
Decrease Discount Rate 50 basis points | | $ | 59.8 | | $ | 5.4 | |
Increase Expected Rate of Return 50 basis points | | $ | – | | $ | (3.0 | ) |
Decrease Expected Rate of Return 50 basis points | | $ | – | | $ | 3.0 | |
* Liabilities projected from December 31, 2003 to December 31, 2004 assuming no gains or losses. Assets projected from December 31, 2003 to December 31, 2004 assuming an 8.75% return.
** Pension Benefit Obligation
We expect to make $2 million in cash contributions related to our defined benefit pension plans during 2004. In addition, it is likely that we will be required to continue to make contributions to the pension plans beyond 2004. Although it is difficult to estimate these potential future cash requirements due to uncertain market conditions, we currently expect that the cash requirements would be approximately $33 million in 2005 and $35 million in 2006.
Accounting for Income Taxes We follow the guidelines in SFAS No. 109, “Accounting for Income Taxes,” which require that we use the asset and liability method of accounting for deferred income taxes and provide deferred income taxes for all significant income tax temporary differences. Please read Note 8 – “Income Taxes” in the accompanying audited financial statements for additional information.
As part of the process of preparing our financial statements, we are required to estimate our income taxes. This process involves estimating our actual current tax exposure together with assessing temporary differences resulting from differing treatment of items, such as depreciation, for tax and accounting purposes. These differences result in deferred tax assets and liabilities, which are included within our Consolidated Balance Sheets.
Results of Operations
Overview In this section we discuss our results of operations on a consolidated basis for 2003, 2002 and 2001. Our operations consist of a single reportable segment. This segment includes the transmission, distribution and sale of electric energy; and the transportation, distribution and sale of natural gas in Illinois. Also included in this segment are specialized support functions, including accounting, legal, regulatory, information technology, human resources, environmental resources, purchasing and materials management and communications. At the end of this section, we have included our 2004 outlook.
Net Income We had net income of $117.0 million in 2003. This compares with net income of $160.7 million and $166.2 million in 2002 and 2001, respectively. The decrease in 2003 earnings compared to 2002 was due to lower electric sales due to cooler than normal summer weather and the full year impact of the 5% residential rate reduction effective May 1, 2002. In addition, results were negatively impacted by higher operating expenses and interest expense, partially offset by lower amortization of regulatory assets. The decrease in 2002 earnings compared to 2001 was due to the 5% residential rate reduction effective May 1, 2002, offset by favorable weather-driven sales from residential and commercial customers. In addition, results were favorably impacted by increased operating efficiencies and litigation and billing settlements, offs et by increased regulatory asset amortization.
The following table provides summary financial data regarding our results of operations for 2003, 2002 and 2001, respectively.
| | | Year Ended December 31, |
| | |
| |
| | | | 2003 | | | 2002 | | | 2001 | |
| | |
| |
| |
| |
| | | (Millions of dollars) | |
| Electric Operations: | | | | | | | | | | |
| Revenues | | $ | 1,101.9 | | $ | 1,145.9 | | $ | 1,137.8 | |
| Electricity Purchased | | | (681.0 | ) | | (677.5 | ) | | (661.8 | ) |
| Gas Operations: | | | | | | | | | | |
| Revenues | | | 465.9 | | | 372.4 | | | 476.6 | |
| Gas Purchased | | | (315.5 | ) | | (231.7 | ) | | (332.8 | ) |
| Other Expenses | | | (325.2 | ) | | (348.2 | ) | | (344.3 | ) |
| General Taxes | | | (67.5 | ) | | (57.6 | ) | | (68.4 | ) |
| Income Taxes | | | (12.4 | ) | | (39.3 | ) | | (40.6 | ) |
| Other Income and Deductions – Net | | | 116.1 | | | 109.1 | | | 121.5 | |
| Interest Charges | | | (162.9 | ) | | (112.4 | ) | | (121.8 | ) |
| Cumulative effect of change in accounting principle | | | (2.4 | ) | | - | | | - | |
| | |
| |
| |
| |
| Net Income | | $ | 117.0 | | $ | 160.7 | | $ | 166.2 | |
| | | | | | | | | | | |
| Net Non-Cash Items Included in Net Income | | | 109.5 | | | 117.5 | | | 112.4 | |
| | |
| |
| |
| |
| Operating Cash Flows Before Changes in Working Capital | | | 226.5 | | | 278.2 | | | 278.6 | |
| Increase (Decrease) in Working Capital | | | (90.2 | ) | | (68.8 | ) | | 66.4 | |
| | |
| |
| |
| |
| Net Cash Provided by Operating Activities | | $ | 136.3 | | $ | 209.4 | | $ | 345.0 | |
| | |
| |
| |
| |
| Net Cash Used in Investing Activities | | $ | (125.5 | ) | $ | (141.1 | ) | $ | (146.7 | ) |
| | |
| |
| |
| |
| Net Cash Provided by (Used in) Financing Activities | | $ | (111.5 | ) | $ | 7.8 | | $ | (168.6 | ) |
| | |
| |
| |
| |
The following table provides operating statistics regarding our results of operations for 2003, 2002 and 2001, respectively.
| | | Year Ended December 31, |
| | |
| |
| | | | 2003 | | | 2002 | | | 2001 | |
| | |
| |
| |
| |
Electric Operations: | | | | | | | | | | |
| Electric Sales Revenues (in millions): | | | | | | | | | | |
| Residential | | $ | 410.3 | | $ | 435.8 | | $ | 431.4 | |
| Commercial | | | 337.2 | | | 338.0 | | | 332.0 | |
| Commercial-distribution | | | 0.1 | | | 0.1 | | | 1.5 | |
| Industrial | | | 272.0 | | | 281.8 | | | 288.0 | |
| Industrial-distribution | | | 5.6 | | | 5.6 | | | 3.6 | |
| Other | | | 38.8 | | | 38.3 | | | 39.3 | |
| Interchange | | | - | | | 7.1 | | | .7 | |
| Transmission/Wheeling | | | 37.9 | | | 39.2 | | | 41.3 | |
| | |
| |
| |
| |
| Total Electric Sales Revenues | | $ | 1,101.9 | | $ | 1,145.9 | | $ | 1,137.8 | |
| | |
| |
| |
| |
| Electricity Purchased | | $ | 681.0 | | $ | 677.5 | | $ | 661.8 | |
| | |
| |
| |
| |
| Electric Sales in kWh (in millions): | | | | | | | | | | |
| Residential | | | 5,309 | | | 5,548 | | | 5,202 | |
| Commercial | | | 4,413 | | | 4,415 | | | 4,337 | |
| Commercial-distribution | | | 4 | | | 2 | | | 40 | |
| Industrial | | | 6,123 | | | 6,306 | | | 6,353 | |
| Industrial-distribution | | | 2,378 | | | 2,503 | | | 2,605 | |
| Other | | | 372 | | | 368 | | | 371 | |
| | |
| |
| |
| |
| Sales to ultimate consumers | | | 18,599 | | | 19,142 | | | 18,908 | |
| Interchange | | | 2 | | | 2 | | | 2 | |
| | |
| |
| |
| |
| | | | | | | | | | | |
| Total Electricity Delivered | | | 18,601 | | | 19,144 | | | 18,910 | |
| | |
| |
| |
| |
| | | | | | | | | | |
| Cooling Degree Days | | | 980 | | | 1,467 | | | 1,302 | |
| Cooling Degree Days – 10 Year Rolling Average | | | 1,214 | | | 1,246 | | | 1,297 | |
Gas Operations: | | | | | | | | | | |
| Gas Sales Revenues (in millions): | | | | | | | | | | |
| Residential | | $ | 301.2 | | $ | 243.4 | | $ | 298.0 | |
| Commercial | | | 114.7 | | | 89.0 | | | 112.4 | |
| Industrial | | | 39.6 | | | 27.3 | | | 45.3 | |
| Other | | | 10.4 | | | 12.7 | | | 20.9 | |
| | |
| |
| |
| |
| Total Gas Sales Revenues | | $ | 465.9 | | $ | 372.4 | | $ | 476.6 | |
| | |
| |
| |
| |
| Gas Purchased | | $ | 315.5 | | $ | 231.7 | | $ | 332.8 | |
| | |
| |
| |
| |
| | | | | | | | | | |
| Gas Sales in Therms (in millions): | | | | | | | | | | |
| Residential | | | 337 | | | 323 | | | 315 | |
| Commercial | | | 145 | | | 137 | | | 136 | |
| Industrial | | | 57 | | | 58 | | | 70 | |
| | |
| |
| |
| |
| Sales to ultimate consumers | | | 539 | | | 518 | | | 521 | |
| Transportation of Customer-Owned Gas | | | 226 | | | 233 | | | 246 | |
| | |
| |
| |
| |
| Total gas sold and transported | | | 765 | | | 751 | | | 767 | |
| Sales to affiliates | | | 13 | | | 22 | | | 18 | |
| | |
| |
| |
| |
| Total Gas Delivered | | | 778 | | | 773 | | | 785 | |
| | |
| |
| |
| |
| | | | | | | | | | |
| Heating Degree Days | | | 5,256 | | | 5,118 | | | 4,749 | |
| Heating Degree Days – 10 Year Rolling Average | | | 4,930 | | | 5,002 | | | 5,032 | |
Electric Operations
Electric Revenues For the years 2001 through 2003, electric revenues, including interchange, decreased 3%. Electric revenues, excluding interchange, were $1,101.9 million in 2003 compared to $1,138.8 million and $1,137.1 million in 2002 and 2001, respectively. The decrease in electric revenues in 2003 compared to 2002 reflect lower sales volume due to cooler than normal summer weather for residential sales, the full year impact of the 5% residential rate decrease that was effective May 1, 2002 and lower industrial sales due to the combined effect of customers choosing alternative suppliers and general economic conditions. The increase in electric revenues in 2002 compared to 2001 reflected an increase in sales volume due to favorable weather partially offset by a 5% residential rate reduction effective May 1, 2002. Interchange revenues were $0 million, $ 7.1 million and $.7 million for 2003, 2002 and 2001, respectively. Interchange revenues in 2002 reflect the reversal of a contingent liability for a bulk power billing dispute that was settled for less than the reserve.
The components of annual changes in electric revenues excluding interchange were:
| |
(Millions of dollars) | | | 2003 | | | 2002 | |
| |
| Price | | $ | (7.2 | ) | $ | (22.2 | ) |
| Volume and other | | | (29.7 | ) | | 23.9 | |
| | |
| |
Electric revenue increase (decrease) | | $ | (36.9 | ) | $ | 1.7 | |
| | |
| |
Electricity Purchased Electricity purchased increased $3.5 million in 2003 due to a higher average cost per unit offset by lower purchased volumes due to reduced demand resulting from cooler than normal summer weather and general economic conditions. The increase in electricity purchased in 2002 of $15.7 million was primarily due to higher sales associated with warmer than normal summer weather, partially offset by a lower average per unit cost.
Changes in the cost of electricity purchased to serve our native load were:
| |
(Millions of dollars) | | | 2003 | | | 2002 | |
| |
| Electricity purchased: | | | | | | | |
| Price | | $ | 30.4 | | $ | (6.2 | ) |
| Volume | | | (26.9 | ) | | 21.9 | |
| | |
| |
Electricity cost increase | | $ | 3.5 | | $ | 15.7 | |
| | |
| |
Gas Operations
Gas Revenues For the years 2001 through 2003, gas revenues, including transportation, decreased 2%. Gas revenues excluding transportation revenues were $468.0 million in 2003 compared to $372.1 million and $469.8 million in 2002 and 2001, respectively. Transportation revenues were ($2.1) million, $.4 million and $6.8 million in 2003, 2002 and 2001, respectively. The 2003 increase in gas revenues was a direct result of higher natural gas prices which are passed through to our end use customers and colder than normal weather in the first quarter, which resulted in higher demand from residential and commercial customers. The 2002 decrease in gas revenues was a direct result of lower natural gas prices offset by weather-driven residential sales.
The components of annual changes in gas revenues excluding transportation revenues were:
| |
(Millions of dollars) | | | 2003 | | | 2002 | |
| |
| Price | | $ | 77.0 | | $ | (97.0 | ) |
| Volume and other | | | 18.9 | | | (0.7 | ) |
| | |
| |
| |
Gas revenue increase (decrease) | | $ | 95.9 | | $ | (97.7 | ) |
| | |
| |
| |
Gas Purchased The 2003 increase in gas purchases related to higher prices for natural gas and weather driven residential and commercial sales. The 2002 decrease in gas purchases are related to lower prices for natural gas offset by weather-driven residential sales.
Changes in the cost of gas purchased to serve our native load were:
| |
(Millions of dollars) | | | 2003 | | | 2002 | |
| |
| Gas purchased: | | | | | | | |
| Price | | $ | 87.8 | | $ | (68.1 | ) |
| Volume | | | (3.7 | ) | | 7.6 | |
| Gas cost recoveries | | | (0.3 | ) | | (40.6 | ) |
| | |
| |
Gas cost increase (decrease) | | $ | 83.8 | | $ | (101.1 | ) |
| | |
| |
Other Expenses Other expenses were $325.2 million in 2003 compared to $348.2 million and $344.3 million in 2002 and 2001, respectively. A comparison of significant increases (decreases) in other operating expenses, maintenance, retirement and severance, and depreciation and amortization for the last two years is presented in the following table:
| |
(Millions of dollars) | | | 2003 | | | 2002 | |
| |
| Other operating expenses | | $ | 6.2 | | $ | (2.1 | ) |
| Maintenance | | | 4.2 | | | (0.7 | ) |
| Retirement and severance expense | | | 0.7 | | | (16.0 | ) |
| Depreciation and amortization | | | (2.2 | ) | | (0.2 | ) |
| Amortization of regulatory assets | | | (31.9 | ) | | 22.9 | |
| | |
| |
| Other expenses increase (decrease) | | $ | (23.0 | ) | $ | 3.9 | |
| | |
| |
The increase in other operating and maintenance expense for 2003 over 2002 was primarily due to higher employee benefit costs, insurance claims and an increase in legal reserves as a result of additional legal activity, partially offset by operating efficiencies. The decrease in retirement and severance expense in 2002 was due to an early retirement/severance program we offered in 2001 related to a corporate reorganization.
In 2003, there was a slight decrease in depreciation and amortization as a result of lower capital expenditures. In 2002, our increased financial performance allowed us to recognize additional regulatory asset amortization and stay within the allowable ROE collar. Therefore, the annual amortization of our regulatory assets was reduced in 2003.
General Taxes General taxes increased $9.9 million in 2003 primarily because 2002 general tax expense benefited from a favorable audit conclusion for utility taxes and an adjustment in our municipal utility taxes (“MUT”). The decrease in general taxes of $10.8 million in 2002 was attributable to the 2002 audit conclusion and adjustment to MUT discussed above as well as lower gas revenue taxes resulting from lower gas prices in 2002, partially offset by a favorable 2001 Invested Capital Tax dispute settlement with the Illinois Department of Revenue.
Income Taxes See Note 8 – “Income Taxes” in the accompanying audited financial statements for additional information on current and deferred income taxes and analysis of federal and state income tax.
Other Income and Deductions - Net The increase of $7.0 million in 2003 of other income and deductions - net was attributable to the remeasurement of our ARO, along with reduced losses on disposal of property and general reduction in non-operating expenses. See Note 1 - “Summary of Significant Accounting Policies” in the accompanying audited financial statements for additional information. For 2002, the decrease in other income and deductions – net was attributable to favorable insurance and litigation settlements in 2001 partially offset by a favorable litigation settlement in 2002.
Interest Charges Total interest charges, including AFUDC, increased $50.5 million in 2003 substantially due to our $550 million 11 1/2% Mortgage bonds outstanding, partially offset by the reduction in the IPSPT
transitional funding trust notes and the redemption of our $100 million and $90 million Mortgage bonds in August and September, respectively. In addition, the 2003 increase in interest charges is partially offset by the repayment of our $300 million term loan, $200 million of which was repaid in December 2002 with the remaining $100 million paid in May 2003. Total interest charges, including AFUDC, decreased $9.4 million in 2002, primarily due to the ongoing redemption of the IPSPT transitional funding trust notes, and lower average long-term debt balances coupled with lower interest charges on short-term debt. See “Note 7 - Revolving Credit Facilities and Short-Term Loans” and Note 9 – “Long-Term Debt” in the accompanying audited financial statements for additional information.
Operating Cash Flow Operating cash flows were $136.3 million for the year ended December 31, 2003 compared to $209.4 million and $345.0 million for the year ended December 31, 2002 and 2001, respectively. The changes in net income period to period, including the components related to depreciation and amortization, have been previously discussed. The changes in working capital relate primarily to timing differences in cash flows. Cash flow was positively affected in 2003 by the payment of one additional month of interest income on our Note Receivable from Affiliate. Factors decreasing cash flows were higher priced gas inventories and higher prepayments due to increased collateral requirements on natural gas purchases.
During 2002, we paid more in tax payments and had one month less in interest payments on the Note Receivable from Affiliate.
During 2001, our recoveries from customers, related to UGAC, were higher due to an increase in underrecoveries at the end of 2000. Finally, in 2001, accounts payable related to our gas purchases were higher due to the requirements from some of our gas suppliers to accelerate payment for natural gas purchases.
Capital Expenditures and Investing Activities Cash used for capital expenditures and investing activities was $125.5 million in 2003 as compared to $141.1 million and $146.7 million in 2002 and 2001, respectively. Our capital expenditures represent amounts spent on routine capital maintenance of our existing asset base and additions of new business services during the year.
Financing Activities During 2003, cash used for financing activities totaled $111.5 million. The following summarizes significant items:
| | Issuance of $150 million of 11 1/2% Mortgage bonds; |
| | Receipt of $127.8 million of prepaid interest under our Note Receivable from Affiliate; |
| | Redemption of $190 million of our Mortgage bonds; |
| | Redemption of $100 million of our 1-year term loan; |
| | Redemption of $86.4 million of the IPSPT transitional funding trust notes; and |
| | Payment of $2.3 million in preferred stock dividends. |
During 2002, cash provided by financing activities totaled $7.8 million. The significant items are as follows:
| | Issuance of $400 million of our 11 1/2 % Mortgage bonds; |
| | Borrowing of $60 million under our 1-year term loan; |
| | Redemption of $238.2 million in short-term debt; |
| | Redemption of $95.7 million of our Mortgage bonds; |
| | Redemption of $86.4 million of the IPSPT transitional funding trust notes ; and |
| | Payment of $2.3 million in preferred stock dividends. |
During 2001, cash used for financing activities totaled $168.6 million. The following summarizes significant items:
| | Issuance of $186.8 million of variable rate Mortgage bonds; |
| | Borrowing of $477.2 million in commercial paper; |
| | Redemption of $186.8 of our variable rate Mortgage bonds; |
| | Redemption of $346.8 million in commercial paper; |
| | Redemption of $86.4 million of the IPSPT transitional funding trust notes; |
| | Redemption of $100 million of our Trust Originated Preferred Securities; |
| | Payment of $100 million in common stock dividends; and |
| | Payment of $8.3 million in preferred stock dividends. |
2004 Outlook Future results of operations for us may be affected, either positively or negatively, by regulatory actions (with respect to rates or otherwise), general economic conditions, weather and customers choosing to utilize competitive alternate service providers. We expect 2004 operating income to be similar to actual results for 2003. Cash flow from operations is expected to be higher in 2004 than in 2003 as a result of the delayed recovery from our customers of costs we incurred in 2003 relating to gas inventories and higher prepaid deposits associated with gas purchases. Future results of operations will be significantly impacted by the outcome of the pending sale transaction with Ameren. Please read Note 2 - "Agreed Sale to Ameren" for the further discussion of this pending transaction. Our ability to meet our capacity a nd energy needs beyond 2004 is addressed in connection with the pending sale to Ameren. Please read Item 1, Business – Power Supply for further discussion.
Uncertainty of Forward-Looking Statements and Information This Annual Report includes statements reflecting assumptions, expectations, projections, intentions or beliefs about future events. These statements are intended as “forward-looking statements” under the Private Securities Litigation Reform Act of 1995. All statements included or incorporated by reference in this annual report, other than statements of historical fact, that address activities, events or developments that we or our management expect, believe or anticipate will or may occur in the future are forward-looking statements. These statements represent our reasonable judgment on the future based on various factors and using numerous assumptions and are subject to known and unknown risks, uncertainties and other factors that could cause our actual results and financial position to differ materia lly from those contemplated by the statements. Important factors that could cause a material difference in the actual results from the forward-looking statements are set forth elsewhere in this annual report. You can identify these statements by the fact that they do not relate strictly to historical or current facts. They use words such as “anticipate,” “estimate,” “project,” “forecast,” “may,” “should,” “expect,” “will” and other words of similar meaning. In particular, these include, but are not limited to, statements relating to the following:
| | projected operating or financial results; |
| | the consummation of the agreed sale transaction with Ameren; |
| | expectations regarding capital expenditures, preferred dividends and other matters; |
| | beliefs about the financial impact of deregulation; |
| | assumptions regarding the outcomes of legal and administrative proceedings; |
| | projections as to the carrying value of our Note Receivable from Affiliate; |
| | estimations relating to the potential impact of new accounting standards; |
| | our ability to obtain required funding from Dynegy in the short-term and to consummate one or more liquidity initiatives in the long-term; |
| | intentions with respect to future energy supplies; and |
| | anticipated costs associated with legal and regulatory compliance. |
Any or all of our forward-looking statements may turn out to be wrong. They can be affected by inaccurate assumptions or by known or unknown risks and uncertainties, including the following:
| | the outcome of the agreed sale transaction with Ameren; |
| | our substantial indebtedness and our ability to generate sufficient cash flows either from our operations or other liquidity initiatives to service principal and interest on such indebtedness; |
| | the timing and extent of changes in commodity prices for natural gas and electricity; |
| | the effects of deregulation in Illinois and nationally and the rules and regulations adopted in connection therewith; |
| | competition from alternate retail electric providers; |
| | general economic and capital market conditions, including overall economic growth, demand for power and natural gas, and interest rates; |
| | the effects of our relationship with Dynegy Inc., our indirect parent company, including the ultimate impact of the legal and administrative proceedings to which it is currently subject; |
| | Dynegy’s financial condition, including its ability to maintain its credit ratings and to continue to support payment to us of principal and interest on our $2.3 billion intercompany note receivable from Illinova; |
| | the cost of borrowing, access to capital markets and other factors affecting our financing activities; |
| | operational factors affecting the ongoing commercial operations of our transmission, transportation and distribution facilities, including catastrophic weather-related damage, unscheduled repairs or workforce issues; |
| | the cost and other effects of legal and administrative proceedings, settlements, investigations or claims, including environmental liabilities that may not be covered by indemnity or insurance; and |
| | other regulatory or legislative developments that affect the energy industry in general and our operations in particular. |
In addition, there may be other factors that could cause our actual results to be materially different from the results referenced in the forward-looking statements. Many of these factors will be important in determining our actual future results. Consequently, no forward-looking statement can be guaranteed. Our actual future results may vary materially from those expressed or implied in any forward-looking statements.
All of our forward-looking statements, whether written or oral, are expressly qualified by these cautionary statements and any other cautionary statements that may accompany such forward-looking statements. In addition, we disclaim any obligation to update any forward-looking statements to reflect events or circumstances after the date of this annual report except as required by applicable law.
Item 7A. Quantitative and Qualitative Disclosures About Market Risk
Our operating results may be impacted by commodity price fluctuations for electricity used in supplying service to our customers. We have contracted with AmerGen and DMG to supply power via PPAs that expire at the end of 2004. Should power acquired under these agreements be insufficient to meet our load requirements, we will have to buy power at current market prices. The PPA with DMG obligates DMG to provide power up to the reservation amount, and at the same prices, even if DMG has individual units unavailable at various times. The PPA with AmerGen does not obligate AmerGen to acquire replacement power for us in the event of a curtailment or shutdown at the Clinton Power Station. Under a Clinton shutdown scenario, to the extent we exceed our capacity reservation with DMG, we will have to buy power at current market prices. Such purchases would expose us to commodity price risk. As discussed above, P.A. 90-561 was amended to extend the retail electric rate freeze for two additional years, through 2006.
As described above, our ability to meet our power and energy needs beyond 2004 is provided for in the proposed sale transaction with Ameren. If we are unable to sufficiently contract for these power and energy needs, we would be required to satisfy our needs through open market purchases. Please read Item 1, Business – Power Supply for further discussion.
The ICC determines our delivery rates for gas service. These rates have been designed to recover the cost of service and allow shareholders the opportunity to earn a reasonable rate of return. The gas commodity is a pass through cost to the end-use customer and is subject to an annual ICC prudence review. Future natural gas sales will continue to be affected by an increasingly competitive marketplace, changes in the regulatory environment, transmission access, weather conditions, gas cost recoveries, customer conservation efforts and the overall economy. Price risk associated with our gas operations is mitigated through contractual terms applicable to the business, as allowed by the ICC. We apply prudent risk-management practices in order to minimize these market risks. Such risk management practices may not fully mitigate these exposures.
Item 8. Financial Statements and Supplementary Data
Our 2001-2003 audited financial statements are set forth, beginning on page F-1, found at the end of this report, and are incorporated herein by reference.
Item 9. Changes in and Disagreements with Accountants on Accounting and Financial Disclosure
Not applicable.
Item 9A. Controls and Procedures
Evaluation of Disclosure Controls and Procedures Effective as of the end of the period covered by this report, an evaluation was carried out under the supervision and with the participation of our management, including our Chief Executive Officer and our Chief Financial Officer, of the effectiveness of the design and operation of our disclosure controls and procedures (as defined in Rule 13a-15(e) and 15d-15(e) under the Exchange Act). Based upon that evaluation, our CEO and CFO concluded that our disclosure controls and procedures are effective and designed to ensure that the information required to be disclosed in our SEC reports is recorded, processed, summarized and reported within the requisite time periods. While our disclosure controls and procedures provide reasonable assurance that the appropriate information will be available on a timely basis, this assurance is subject to limitations inherent in any control system, no matter how well it may be designed or administered.
Changes in Internal Controls There was no change in our internal controls over financial reporting (as defined in Rules 13a-15(e) and 15d-15(e) under the Exchange Act) identified in connection with the evaluation of our internal controls performed during the last fiscal quarter that has materially affected, or is reasonably likely to materially affect, our internal controls over financial reporting.
PART III
Item 10. Directors and Executive Officers of the Registrant
The following table sets forth certain information with respect to our directors and executive officers as of February 27, 2004:
Name | | Age | | Position(s) | | Served with the
Company Since |
| |
| |
| |
|
| Daniel L. Dienstbier | | 63 | | Chairman of the Board | | 2002 |
| Larry F. Altenbaumer | | 55 | | President and Director | | 1970 |
| R. Blake Young | | 45 | | Executive Vice President and Chief Operating Officer | | 2004 |
| Nick J. Caruso | | 57 | | Executive Vice President and Chief Financial Officer | | 2003 |
| Shawn E. Schukar | | 42 | | Senior Vice President | | 1984 |
| Peggy E. Carter | | 41 | | Managing Director, Controller | | 1985 |
| Ronald D. Pate | | 49 | | Vice President | | 1978 |
| Frank A. Starbody | | 45 | | Vice President | | 1992 |
| Carol F. Graebner | | 50 | | Director | | 2003 |
| Bruce A. Williamson | | 44 | | Director | | 2002 |
The directors named above will serve in such capacity until our next annual shareholder meeting or until their respective successors have been duly elected and qualified, or until their earlier death, resignation or
removal. The executive officers named above will serve in such capacities until our next annual Board of Directors meeting or until their respective successors have been duly elected and qualified or until their earlier death, resignation or removal.
Daniel L. Dienstbier has served as Chairman of our Board of Directors since June 2002. Mr. Dienstbier has also served as Chairman of the Board of Dynegy since September 2002 and as a director of Dynegy since 1995. He served as interim Chief Executive Officer of Dynegy from May 2002 until October 2002 and as President of Northern Natural Gas Company, which was a subsidiary of Dynegy, from February 2002 until July 2002. Mr. Dienstbier has over thirty-five years of experience in the oil and gas industry. He served as President and Chief Operating Officer of American Oil & Gas Corp. from October 1993 through July 1994, President and Chief Operating Officer of Arkla, Inc. from July 1992 through October 1993, and President of Jule, Inc., a private company involved in energy consulting and joint venture investments in the pipeline, gathering and exploration and production industries, from February 1991 through June 1992. Previously, Mr. Dienstbier served as President and Chief Executive Officer of Dyco Petroleum Corp. and Executive Vice President of Diversified Energy from February 1989 through February 1991. In addition, he served as President of the Gas Pipeline Group of Enron Corp. from July 1985 through July 1988. Mr. Dienstbier is a former director of American Oil & Gas Corp., Arkla, Inc., Enron Corp. and Midwest Resources. He is also a former member of the Audit and Compliance Committee of Northern Border Partners, L.P.
Larry F. Altenbaumer has served as our President since September 1999 and as our Chief Executive Officer from November 2002 until August 2003. Mr. Altenbaumer has also served as one of our Directors and as an Executive Vice President of Dynegy since February 2002. Mr. Altenbaumer previously served as a Senior Vice President of Dynegy from February 2000 until November 2002, following the consummation of the Dynegy-Illinova merger. In February 2004, Mr. Altenbaumer announced his retirement, effective April 1, 2004, from his service as our President and Executive Vice President of Dynegy. Mr. Altenbaumer previously served us and Illinova in various capacities since June 1970, including as our Senior Vice President and Chief Financial Officer from June 1992 until September 1999 and as Senior Vice President, Chief Financial Officer, Treasurer and Controller of Illinova from June 1994 until September 1999.
R. Blake Young has served as our Executive Vice President and Chief Operating Officer since February 2004, and will become our President on April 1, 2004, and has overall responsibility for our transition to Ameren during the regulatory approval process. Mr. Young has also served as Executive Vice President of Administration and Technology of Dynegy since October 2002, and is responsible for strategic planning, corporate technology, corporate communications, investor relations, human resources, divestitures and corporate shared services. Prior to joining Dynegy in October 1998, he worked for Campbell Soup Company where he was responsible for technology deployment across its U.S. grocery division and head of global business systems strategy. Mr. Young was previously employed by Tenneco Energy for approximately 13 years, where he served as Vice President and Chief Informa tion Officer.
Nick J. Caruso is our Executive Vice President and Chief Financial Officer. He has served in this position since March 2003. Mr. Caruso has also served as the Executive Vice President and Chief Financial Officer of Dynegy since December 2002, and is responsible for Dynegy’s internal audit, risk management, tax, treasury, accounting and finance functions. He was previously employed by Shell Oil Company from June 1969 to December 2001. He most recently served as that company’s Vice President of Finance and Chief Financial Officer before retiring in December 2001. He was responsible for the controller’s organization, treasury, insurance, auditing and retirement funds, interfacing with the board of directors on internal controls and preparation of financial statements.
Shawn E. Schukar has served us as a Senior Vice President since August 2003. Since he joined us in January 1984, Mr. Schukar has served us in various capacities including Vice President of Energy Supply Management from July 2001 until July 2003, Director of Transmission Services from November 1999 until July 2001, and Director of Retail Risk and Commodity Pricing from January 1999 until November 1999. Mr. Schukar previously served us in various positions in generation control and power production from January 1984 through January 1999.
Peggy E. Carter has served us as Managing Director, Controller since August 2003 in connection with an internal reorganization. Prior to the title change, Ms. Carter served us as Vice President since February 2000, following the consummation of the Dynegy-Illinova merger, and as Controller since November 1999. Ms. Carter was elected to serve as Vice President following the consummation of the Dynegy-Illinova merger in February 2000. Ms. Carter previously served in various capacities with us from January 1985, including Business Leader in our accounting department from August 1994 until November 1999.
Ronald D. Pate has served us as Vice President, Asset Performance and Compliance Management since August 2003. Since joining us in September 1978, Mr. Pate has served us in various capacities including Vice President of Delivery Systems Operations and Development from June 2001 to July 2003, Senior Director of Gas Delivery from May 2000 to June 2001, Director of Gas Delivery from November 1999 to May 2000, and Manager of Gas Delivery from January 1999 to November 1999.
Frank A. Starbody has served as Vice President, Energy Supply and Customer Management since August 2003. Mr. Starbody previously served as our Senior Director of Public and Legislative Affairs from July 2002 until July 2003, following his promotion to Senior Director of Customer Value Management in June 2001. Mr. Starbody previously served in various capacities from 1992 through 2001, including administrator of gas supply from 1992 until 1995, electric system power coordinator from 1995 until 1996, team leader of gas supply from 1996 until 1997 and director of gas supply from 1997 until 2001. Prior to coming to Illinois Power, Mr. Starbody worked for A.E. Staley Manufacturing Company as manager of energy procurement.
Carol F. Graebner has served as one of our Directors since July 2003. Ms. Graebner has also served as Executive Vice President and General Counsel of Dynegy since March 2003. Prior to joining Dynegy, Ms. Graebner was employed by Duke Energy International, where she served as senior vice president and general counsel and was responsible for providing all legal, regulatory and governmental affairs services for that company’s international merchant energy business. Prior to joining Duke Energy International in November 1998, she served in various positions of increasing responsibility at Conoco Inc., advancing over a 16-year period to general counsel of Conoco Global Power, Inc.
Bruce A. Williamson has served as one of our Directors since November 2002. Mr. Williamson also serves as Dynegy’s President and Chief Executive Officer and as a Director. He has served in these positions with Dynegy since joining that company in October 2002. Prior to joining Dynegy, Mr. Williamson served in various capacities for Duke Energy and its affiliates, most recently serving as President and Chief Executive Officer of Duke Energy Global Markets. In this capacity, he was responsible for all Duke Energy business units with global commodities and international business positions. Mr. Williamson joined PanEnergy Corporation in June 1995, which then merged with Duke Power in June 1997. Prior to the Duke-PanEnergy merger, he served as PanEnergy’s Vice President of Finance. Before joining PanEnergy, he held positions of increasing responsibility at Shell Oi l Company, advancing over a 14-year period to Assistant Treasurer.
Section 16(a) Beneficial Ownership Reporting Compliance
Section 16(a) of the Securities Exchange Act of 1934 requires that reports of ownership and changes in ownership be filed with respect to directors, executive officers and persons who beneficially own more than 10% of a class of equity securities registered under Section 12 thereof. We believe that all such requirements were satisfied with respect to our cumulative preferred stock during the fiscal year ended December 31, 2003.
Code of Ethics
We are an indirect, wholly-owned subsidiary of Dynegy and have not adopted a separate Code of Ethics within the meaning of Item 406(b) of Regulation S-K. A copy of Dynegy's Code of Ethics, which applies to Dynegy's chief executive officer, chief financial officer, controller and other persons performing similar functions designated by Dynegy's chief financial officer, is filed as Exhibit 14.1 to Dynegy's Form 10-K for the year ended December 31, 2003.
Item 11. Executive Compensation
The following table sets forth certain information regarding the compensation earned by or awarded to each individual who served as our Chief Executive Officer during 2003 and our four other most highly compensated executive officers at the end of 2003 (the “Named Executive Officers”), as well as amounts earned by or awarded to certain of such individuals for services rendered in their capacities as executive officers, if any, for the fiscal years of 2002 and 2001.
Summary Compensation Table
| | | | | | | Long Term | |
| | | | Annual Compensation | Compensation Awards | |
| | | |
|
| |
| | | | | | | Restricted | Securities | |
Name and | | | | | Other Annual | Stock | Underlying | All Other |
Principal Position | | Year | Salary | Bonus(2) | Compensation(3) | Awards(4) | Options(5) | Compensation(6) |
|
| Larry F. Altenbaumer | | | 2003 | | $ | 350,000 | | $ | 175,000 | | $ | --- | | $ | --- | | | --- | | $ | 6,000 | |
| President | | | 2002 | | $ | 288,770 | | $ | --- | | $ | --- | | $ | --- | | | 90,000 | | $ | 5,250 | |
| | | | 2001 | | $ | 299,500 | | $ | 350,000 | | $ | --- | | $ | --- | | | 79,050 | | $ | 5,250 | |
| | | | | | | | | | | | | | | | | | | | | | | |
| Shawn E. Schukar | | | 2003 | (1) | $ | 187,054 | | $ | $ 60,000 | | $ | --- | | $ | 17,499 | | | 8,376 | | $ | 2,784 | |
| Senior Vice President | | | 2002 | | $ | --- | | $ | --- | | $ | --- | | $ | --- | | | --- | | $ | --- | |
| | | | 2001 | | $ | --- | | $ | --- | | $ | --- | | $ | --- | | | --- | | $ | --- | |
| | | | | | | | | | | | | | | | | | | | | | | |
| Peggy E. Carter | | | 2003 | | $ | 139,292 | | $ | 38,500 | | $ | --- | | $ | --- | | | --- | | $ | 4,178 | |
| Managing Director, | | | 2002 | | $ | 123,780 | | $ | --- | | $ | --- | | $ | --- | | | 12,000 | | $ | 3,310 | |
| Controller | | | 2001 | | $ | 117,706 | | $ | 47,500 | | $ | --- | | $ | --- | | | 7,918 | | $ | 5,250 | |
| | | | | | | | | | | | | | | | | | | | | | | |
| Ronald D. Pate | | | 2003 | (1) | $ | 135,616 | | $ | 60,000 | | $ | --- | | $ | 17,499 | | | 8,376 | | $ | 3,849 | |
| Vice President | | | 2002 | | $ | --- | | $ | --- | | $ | --- | | $ | --- | | | --- | | $ | --- | |
| | | | 2001 | | $ | --- | | $ | --- | | $ | --- | | $ | --- | | | --- | | $ | --- | |
| | | | | | | | | | | | | | | | | | | | | | | |
| Frank A. Starbody | | | 2003 | (1) | $ | 120,570 | | $ | 60,000 | | $ | --- | | $ | 17,499 | | | 8,376 | | $ | 3,038 | |
| Vice President | | | 2002 | | $ | --- | | $ | --- | | $ | --- | | $ | --- | | | --- | | $ | --- | |
| | | | 2001 | | $ | --- | | $ | --- | | $ | --- | | $ | --- | | | --- | | $ | --- | |
| (1) | | Messrs. Pate, Schukar and Starbody became executive officers in August 2003 in connection with an internal reorganization which resulted in each of these officers assuming responsibility for a particular policy-making function. |
| (2) | | As applicable, bonus amounts include bonuses earned in 2001 and 2003, which were paid in 2002 and 2004, respectively. No bonuses were earned in 2002. Mr. Altenbaumer’s bonus was paid pursuant to his settlement agreement and release described below under “Employment Contracts and Change-In-Control Arrangements.” |
| (3) | | Includes “Perquisites and Other Personal Benefits” if value is greater than the lesser of $50,000 or 10% of the reported salary and bonus. |
| (4) | | For 2003, Messrs. Pate, Schukar and Starbody each received 8,376 shares of restricted Dynegy Class A common stock valued at $4.48 per share. Such shares vest three years from the date of grant. During such period, any dividends paid on Dynegy Class A common stock will also be paid with respect to these restricted shares. |
(5) | | Securities underlying options for 2002 and 2003 includes options granted in 2003 and 2004, respectively, for work done in the preceding year. |
| (6) | | The amounts included as “All Other Compensation” represent contributions to the Named Executive Officers’ respective savings plan accounts. |
|
Option Grants in 2003
The following table sets forth certain information with respect to Dynegy stock option grants made to the Named Executive Officers for 2003 under the Dynegy Inc. 2000 Long Term Incentive Plan and the Dynegy Inc. 2001 Non-Executive Stock Incentive Plan. Dynegy indirectly owns all of our common stock.
Individual Grants
Name | | | Number of Securities Underlying Options Granted(1) | | | % of Total Options Granted to Employees for 2002(1) | | | Exercise Price $/Share | | | Expiration Date | | Potential Realizable Value at Assumed Annual Rates of Stock Price Appreciation for Option Term(2) |
| | |
| | |
| | |
| | |
| |
|
| | | | | | | | | | | | | | | 5% | | | 10% | |
| | | | | | | | | | | | | | | |
| | |
| |
| Larry F. Altenbaumer | | | --- | | | --- | | | --- | | | --- | | | --- | | | --- | |
| Shawn E. Schukar | | | 8,376 | | | * | | $ | 4.48 | | | 02/10/2014 | | $ | 23,599 | | $ | 59,804 | |
| Peggy E. Carter | | | --- | | | --- | | | --- | | | --- | | | --- | | | --- | |
| Ronald D. Pate | | | 8,376 | | | * | | $ | 4.48 | | | 02/10/2014 | | $ | 23,599 | | $ | 59,804 | |
| Frank A. Starbody | | | 8,376 | | | * | | $ | 4.48 | | | 02/10/2014 | | $ | 23,599 | | $ | 59,804 | |
| * | | Less than 1%. |
| (1) | | Securities underlying options granted and percent of total options granted to employees in 2003 reflects Dynegy stock options granted to employees of Dynegy and its affiliates, including IP, for 2003 performance in 2004. |
| (2) | | The dollar amounts under these columns represent the potential realizable value of each grant of options assuming that the market price of Dynegy common stock appreciates in value from the date of grant at the 5% and 10% annual rates prescribed by the SEC and are not intended to forecast possible future appreciation, if any, of the price of Dynegy common stock. |
Aggregated Option Exercises and Fiscal Year-End Option Values
The following table sets forth certain information regarding Dynegy stock options held by the Named Executive Officers at December 31, 2003. No Dynegy stock options were exercised by any of the Named Executive Officers in 2003.
| | | Number of Securities Underlying
Unexercised Options at Fiscal Year-End | | Value of Unexercised In-the-Money Options at Fiscal Year-End (1) | |
| | |
| |
| |
Name | | | Exercisable | | | Unexercisable | | | Exercisable | | | Unexercisable | |
| |
| |
| |
| |
| |
| Larry F. Altenbaumer | | | 229,718 | | | 147,046 | | $ | --- | | $ | 225,900 | |
| Shawn E. Schukar | | | 14,294 | | | 16,646 | | $ | --- | | $ | 30,120 | |
| Peggy E. Carter | | | 13,365 | | | 15,682 | | $ | --- | | $ | 30,120 | |
| Ronald D. Pate | | | 9,083 | | | 14,223 | | $ | --- | | $ | 25,100 | |
| Frank A. Starbody | | | 5,992 | | | 8,754 | | $ | --- | | $ | 15,060 | |
| (1) | | Value based on the closing price of $4.28 on the New York Stock Exchange – Composite Tape for Dynegy Class A common stock on December 31, 2003. |
Pension Benefits
The following table shows the estimated annual pension benefits on a straight-life annuity basis payable on retirement to each of our Named Executive Officers based on specified annual average earnings and years of credited service classifications, assuming continuation of the Dynegy Inc. Retirement Plan, formerly the IP Retirement Income Plan for Salaried Employees (the “IP Retirement Plan”), and employment until age 65. Estimated annual benefits under the IP Retirement Plan are payable only with respect to annual earnings up to $200,000. This table does not reflect the Social Security offset, but any actual pension benefit payments would be subject to this offset.
Estimated Annual Benefits (rounded)
AnnualAverageEarnings | | | 15 Yrs. Credited Service | | | 20 Yrs. Credited Service | | | 25 Yrs. Credited Service | | | 30 Yrs. Credited Service | | | 35 Yrs. Credited Service | |
|
$ | 125,000 | | $ | 37,500 | | $ | 50,000 | | $ | 62,500 | | $ | 75,000 | | $ | 75,000 | |
| 150,000 | | | 45,000 | | | 60,000 | | | 75,000 | | | 90,000 | | | 90,000 | |
| 170,000 | | | 51,000 | | | 68,000 | | | 85,000 | | | 102,000 | | | 102,000 | |
| 200,000 | | | 60,000 | | | 80,000 | | | 100,000 | | | 120,000 | | | 120,000 | |
The earnings used in determining pension benefits under the IP Retirement Plan are the participants’ regular base compensation, as set forth under the “Salary” column in the Summary Compensation Table above.
At December 31, 2003, for purposes of the IP Retirement Plan, each of our Named Executive Officers had completed the number of years of credited service listed below:
Name: | | Years of Credited Service: |
| | |
| Larry F. Altenbaumer | | 30 |
| Shawn E. Schukar | | 18 |
| Peggy E. Carter | | 17 |
| Ronald D. Pate | | 24 |
| Frank A. Starbody | | 10 |
Compensation of Directors
None of our Directors receive special or additional compensation as a result of their service on the Board of Directors or any committee of the Board of Directors.
Employment Contracts and Change-in-Control Arrangements
In January 2004, we entered into a severance agreement and release and a consulting agreement with Mr. Altenbaumer, which are described below. We also have a letter agreement with Mr. Schukar, which is described below. Dynegy has employment agreements with Nick J. Caruso and R. Blake Young, which will be described in Dynegy’s upcoming proxy statement.
Larry Altenbaumer Severance Agreement and Release. Effective upon the closing of the Dynegy-Illinova merger in February 2000, Dynegy Inc. entered into a three-year employment agreement with Mr. Altenbaumer, pursuant to which Mr. Altenbaumer served as our President and as Executive Vice President of Dynegy. In May 2002, the parties executed an addendum to the agreement that extended the original term for an additional year.
In January 2004, we entered into a severance agreement and release providing for the termination of Mr. Altenbaumer’s employment agreement effective February 2, 2004. Under the terms of this severance agreement, we agreed to pay Mr. Altenbaumer, in full satisfaction of all amounts due to him under his employment agreement or otherwise:
| · | | $350,000, less certain deductions and withholdings, representing one year of his base salary; |
| · | | $57,885, less certain deductions and withholdings, representing accrued vacation and personal time; and |
| · | | $175,000, less applicable withholdings, representing his annual bonus with respect to his 2003 performance. |
Additionally, Mr. Altenbaumer is entitled, subject to certain conditions, to continuation of his medical benefits for a period of 12 months and the immediate vesting of the 90,000 options granted to him on February 4, 2003.
Larry Altenbaumer Consulting Agreement In January 2004, we also entered into a consulting agreement with Mr. Altenbaumer which provides that we will pay him a consulting fee of $357,500 upon the March 2005 termination of this agreement in exchange for his services, which shall include providing assistance to Dynegy in its efforts to dispose of, retain or restructure its regulated energy delivery business. During the term of this agreement, Mr. Altenbaumer is subject to a non-compete clause which provides that, absent our prior consent, the agreement will terminate and he will forfeit his consulting fee in the event he provides his services to any governmental entity, utility, natural gas provider, or electric generation company doing business in the State of Illinois. Provisions within the consulting agreement allow either party to terminate the agreement prior to its s cheduled March 2005 termination date upon the occurence of specified conditions.
Shawn Schukar Letter Agreement In February 2003, Dynegy entered into a letter agreement with Mr. Schukar which provides that he is entitled to severance pay in the event that, following a change in control of IP, Mr. Schukar’s employment is terminated or he is required to relocate outside the Decatur, Illinois metropolitan area, or Mr. Schukar resigns due to a reduction in his base salary. The severance pay to which he is entitled is the greater of:
| · | | the amount he would be eligible to receive under the Dynegy Inc. Executive Severance Plan then in effect; and |
| · | | 150% of his base salary and target bonus under the Dynegy Inc. Incentive Compensation Plan. |
Compensation Committee Interlocks and Insider Participation
Dynegy and IP have a joint Compensation Committee that, as of December 31, 2003, was comprised of the following Dynegy directors: Barry J. Galt (Chairperson), Linda Bynoe, Joe Stewart, William Trubeck and John Watson. There are no matters relating to interlocks or insider participation that we are required to report.
Item 12. Security Ownership of Certain Beneficial Owners and Management and Related Stockholders Matters
All of our common stock is owned by Illinova, which is a wholly-owned subsidiary of Dynegy. A subsidiary of ChevronTexaco now holds approximately 26% of Dynegy’s outstanding common stock and $400 million of its Series C Mandatorily Redeemable Convertible Preferred Stock due 2033. We also have six series of preferred stock outstanding, none of which is owned by any director or executive officer. Illinova owns approximately 73% of our outstanding preferred stock.
Item 13. Certain Relationships and Related Transactions
We routinely conduct business with other subsidiaries of Dynegy. These transactions include the purchase or sale of electricity, natural gas and transmission services as well as certain other services. We derived approximately $28.2 million in operating revenue from these transactions during 2003. Aggregate operating expenses charged by affiliates in 2003 approximated $537.5 million, including $471.7 million for power purchased. Please read Note 4 – “Related Parties” in the accompanying audited financial statements for more information pertaining to related party transactions.
With respect to electricity purchases, we have a PPA with DMG that provides approximately 70% of our capacity requirements through December 2004. Please read Item 1, Business – Power Supply for further discussion.
Effective January 1, 2000, the Dynegy consolidated group, which includes us, began operating under a Services and Facilities Agreement, whereby other Dynegy affiliates exchange services with us such as financial, legal, information technology and human resources as well as shared facility space. Our services are exchanged at fully distributed costs and revenue is not recorded under this agreement.
Effective October 1, 1999, we sold our wholly-owned fossil generating assets and other generation-related assets and liabilities at net book value to Illinova in exchange for an unsecured note receivable of approximately $2.8 billion. The note matures on September 30, 2009 and bears interest at a rate of 7.5%, due semiannually in April and October. At December 31, 2003, principal outstanding under the note approximated $2.3 billion with no accrued interest due to prepayments previously discussed herein. We recognized $170.4 million in interest income on the note from Illinova in 2003. Pursuant to Dynegy’s agreement to sell us to Ameren, this $2.3 billion intercompany note receivable will be eliminated in conjunction with the closing of the transaction.
In October 2002, the ICC approved a netting agreement among us, Dynegy and other of its affiliates. Please read Item 7 - "Management's Discussion and Analysis - Liquidity and Debt Maturities - Affiliate Transactions” above for further discussion.
Item 14. Principal Accountant Fees and Services
We are an indirect, wholly-owned subsidiary of Dynegy and do not have a separate audit committee. Information regarding principal accountant fees and services for Dynegy and its consolidated subsidiaries, including us, will be contained in its upcoming proxy statement under the heading “Principal Accounting Fees and Services.”
PART IV
Item 15. Exhibits, Financial Statement Schedules, and Reports on Form 8-K
(a) The following documents, which we have filed with the SEC pursuant to the Securities Exchange Act of 1934, as amended, are by this reference incorporated in and made a part of this report:
| 1. | | Financial Statements - Our consolidated financial statements are incorporated under Item 8 of this Form 10-K. |
| | | |
| 2. | | Financial Statement Schedules |
| | | |
| | | All Financial Statement Schedules are omitted because they are not applicable or the required information is shown in the financial statements or notes thereto. |
| | | |
| 3. | | Exhibits |
| | | |
| | | The exhibits filed with this Form 10-K are listed in the Exhibit Index located elsewhere herein. All management contracts and compensatory plans or arrangements set forth in such list are marked with a ~. |
(b) Reports on Form 8-K during the quarter ended December 31, 2003:
| | | Current Report on Form 8-K dated October 31, 2003. Items 5 and 7 were reported and no financial statements were filed. |
| | | |
| | | Current Report on Form 8-K dated November 22, 2003. Items 5 and 7 were reported and no financial statements were filed. |
| | | |
| | | Current Report on Form 8-K dated December 5, 2003. Items 5 and 7 were reported and no financial statements were filed. |
SIGNATURES
Pursuant to the requirements of Section 13 or 15(d) of the Securities Exchange Act of 1934, the registrant has duly caused this report to be signed on its behalf by the undersigned thereunto duly authorized.
| | | |
| | Illinois Power Company |
|
|
|
| Date: March 12, 2004 | By: | /s/ Larry F. Altenbaumer |
| |
|
| | Larry F. Altenbaumer |
| | President |
| | |
Pursuant to the requirements of the Securities and Exchange Act of 1934, this report has been signed below by the following persons on behalf of the registrant in the capacities and on the dates indicated.
| /s/ Larry F. Altenbaumer | | President and Director | | March 12, 2004 |
| | | | |
| Larry F. Altenbaumer | | | | |
| (Principal Executive Officer) | | | | |
| | | | | |
| | | | | |
| /s/ Nick J. Caruso | | Executive Vice President and | | March 12, 2004 |
| | Chief Financial Officer | | |
| Nick J. Caruso | | | | |
| (Principal Financial Officer) | | | | |
| | | | | |
| | | | | |
| /s/ Peggy E. Carter | | Managing Director, Controller | | March 12, 2004 |
| | | | |
| Peggy E. Carter | | | | |
| (Principal Accounting Officer) | | | | |
| | | | | |
| | | | | |
| /s/ Daniel L. Dienstbier | | Director | | March 12, 2004 |
| | | | |
| Daniel L. Dienstbier | | | | |
| | | | | |
| | | | | |
| /s/ Carol F. Graebner | | Director | | March 12, 2004 |
| | | | |
| Carol F. Graebner | | | | |
| | | | | |
| | | | | |
| /s/ Bruce A. Williamson | | Director | | March 12, 2004 |
| | | | |
| Bruce A. Williamson | | | | |
Exhibit Index
Description
Exhibit
(3)(i) Articles of Incorporation
*Amended and Restated Articles of Incorporation of Illinois Power Company, dated September 7, 1994. Filed as Exhibit 3(a) to the Current Report on Form 8-K dated September 7, 1994 (File No. 1-3004).
(3)(ii) By-Laws
*By-laws of Illinois Power Company, as amended December 14, 1994. Filed as Exhibit 3(b)(1) to the Annual Report on Form 10-K for the year ended December 31, 1994 (File No. 1-3004).
(4) Instruments defining the rights of security holders, including indentures
*4.1 - General Mortgage Indenture and Deed of Trust dated as of November 1, 1992. Filed as Exhibit 4(cc) to the Annual Report on Form 10-K for the year ended December 31, 1992 (File No. 1-3004).
*4.2 - Supplemental Indenture No. 2 dated March 15, 1993, to General Mortgage Indenture and Deed of Trust dated as of November 1, 1992 for the 6 3/4% bonds due 2005. Filed as Exhibit 4(ii) to the Annual Report on Form 10-K for the year ended December 31, 1992 (File No. 1-3004).
*4.3 - Supplemental Indenture dated July 15, 1993, to General Mortgage Indenture and Deed of Trust dated as of November 1, 1992 for the 7 1/2% bonds due 2025. Filed as Exhibit 4(kk) to the Quarterly Report on Form 10-Q for the quarter ended June 30, 1993 (File No. 1-3004).
*4.4 - Supplemental Indenture dated August 1, 1993, to General Mortgage Indenture and Deed of Trust dated as of November 1, 1992 for the 6 1/2% bonds due 2003. Filed as Exhibit 4(mm) to the Quarterly Report on Form 10-Q for the quarter ended June 30, 1993 (File No. 1-3004).
*4.5 - Supplemental Indenture dated April 1, 1997, to General Mortgage Indenture and Deed of Trust dated as of November 1, 1992 for the series P, Q, and R bonds. Filed as Exhibit 4(b) to the Quarterly Report on Form 10-Q for the quarter ended March 31, 1997 (File No. 1-3004).
*4.6 - Supplemental Indenture dated as of March 1, 1998, to General Mortgage Indenture and Deed of Trust dated as of November 1, 1992 for the series S bonds. Filed as Exhibit 4.41 to the Registration Statement on Form S-3, filed January 22, 1999 (Registration No. 333-71061).
*4.7 - Supplemental Indenture dated as of March 1, 1998, to General Mortgage Indenture and Deed of Trust dated as of November 1, 1992 for the series T bonds. Filed as Exhibit 4.42 to the Registration Statement on Form S-3, filed January 22, 1999 (Registration No. 333-71061).
*4.8 - Supplemental Indenture dated as of September 15, 1998, to General Mortgage Indenture and Deed of Trust dated as of November 1, 1992 for the 6% bonds due 2003. Filed as Exhibit 4.46 to the Registration Statement on Form S-3, filed January 22, 1999 (Registration No. 333-71061).
*4.9 - Supplemental Indenture dated as of June 15, 1999, to General Mortgage Indenture and Deed of Trust dated as of November 1, 1992 for the 7.5% bonds due 2009. Filed as Exhibit 4.2 to the Quarterly Report on Form 10-Q for the quarter ended June 30, 1999 (File No. 1-3004).
*4.10 - Supplemental Indenture dated as of July 15, 1999, to General Mortgage Indenture and Deed of Trust dated as of November 1, 1992 for the series U bonds. Filed as Exhibit 4.4 to the Quarterly Report on Form 10-Q for the quarter ended June 30, 1999 (File No. 1-3004).
Exhibit Index (Continued)
Description
Exhibit
*4.11 - Supplemental Indenture dated as of July 15, 1999, to General Mortgage Indenture and Deed of Trust dated as of November 1, 1992 for the series V bonds. Filed as Exhibit 4.6 to the Quarterly Report on Form 10-Q for the quarter ended June 30, 1999 (File No. 1-3004).
*4.12 - Supplemental Indenture No. 1 dated as of May 1, 2001, to General Mortgage Indenture and Deed of Trust dated as of November 1, 1992 for the series W bonds. Filed as Exhibit 4.19 to the Annual Report on Form 10-K for the year ended December 31, 2001 (File No. 1-3004).
*4.13 - Supplemental Indenture No. 2 dated as of May 1, 2001, to General Mortgage Indenture and Deed of Trust dated as of November 1, 1992 for the series X bonds. Filed as Exhibit 4.20 to the Annual Report on Form 10-K for the year ended December 31, 2001 (File No. 1-3004).
*4.14 - Supplemental Indenture dated as of December 15, 2002, to General Mortgage Indenture and Deed of Trust dated as of November 1, 1992 for the 11 1/2% bonds due 2010. Filed as Exhibit 4.1 to the Current Report on Form 8-K dated December 23, 2002.
(10) Material contracts
*10.1 - Group Insurance Benefits for Managerial Employees of Illinois Power Company as amended January 1, 1983. Filed as Exhibit 10(a) to the Annual Report on Form 10-K for the year ended December 31, 1983 (File No. 1-3004).
*10.2 - Illinois Power Company Retirement Income Plan for Salaried Employees, as amended and restated effective January 1, 1989, as further amended through January 1, 1994. Filed as Exhibit 10(m) to the Annual Report on Form 10-K for the year ended December 31, 1994. (File No. 1-3004).
*10.3 - Illinois Power Company Retirement Income Plan for Employees Covered Under a Collective Bargaining Agreement, as amended and restated effective as of January 1, 1994. Filed as Exhibit 10(n) to the Annual Report on Form 10-K for the year ended December 31, 1994. (File No. 1-3004).
*10.4 - Illinois Power Company Incentive Savings Plan, as amended and restated effective January 1, 2002. Filed as Exhibit 10.3 to the Registration Statement on Form S-8 of Dynegy Inc., Registration No. 333-76570.
†10.5 - First amendment to Illinois Power Company Incentive Savings Plan for Employees Covered Under a Collective Bargaining Agreement Trust Agreement, effective October 1, 2003.
*10.6 - Illinois Power Company Incentive Savings Plan Trust Agreement. Filed as Exhibit 10.4 to the Registration Statement on Form S-8 of Dynegy Inc., Registration No. 333-76570.
*10.7 - Illinois Power Company Incentive Savings Plan for Employees Covered Under a Collective Bargaining Agreement, as amended and restated effective January 1, 2002. Filed as Exhibit 10.5 to the Registration Statement on Form S-8 of Dynegy Inc., Registration No. 333-76570.
*10.8 - Illinois Power Company Incentive Savings Plan for Employees Covered Under a Collective Bargaining Agreement Trust Agreement. Filed as Exhibit 10.6 to the Registration Statement on Form S-8 of Dynegy Inc. Registration No. 333-76570.
*10.9 - Illinois Power Company Supplemental Retirement Income Plan for Salaried Employees, as amended by resolutions adopted by the Board of Directors on June 10-11, 1997. Filed as Exhibit 10(b)(13) to the Annual Report on Form 10-K for the year ended December 31, 1997. (File No. 1-3004).
*10.10 – Registration Rights Agreement dated as of December 20, 2002 among Illinois Power Company and the initial purchasers of the 11 1/2 % Mortgage bonds due 2010. Filed as Exhibit 4.2 to the Current Report on Form 8-K dated December 23, 2002.
Exhibit Index (Continued)
Description
Exhibit
*10.11 – Purchase Agreement dated February 2, 2004 among Dynegy Inc., Illinova Corporation, Illinova Generating Company, and Ameren Corporation (incorporated by reference to Exhibit 2.1 to the Current Report on Form 8-K of Dynegy Inc. filed on February 4, 2004, File No. 1-15659).
†10.12 – Severance Agreement and Release dated as of January 27, 2004 among Larry F. Altenbaumer, Dynegy Inc. and Illinois Power Company.~
†10.13 – Contract for Services dated as of January 27, 2004 between Larry F. Altenbaumer and Illinois Power Company.~
†10.14 – Letter Agreement dated as of March 6, 2003 between Dynegy, Inc. and Shawn E. Schukar.~
†12.1 Statement of Computation of Ratio of Earnings to Fixed Charges
†21.1 Subsidiaries of Illinois Power Company
†31.1 - Chief Executive Officer Certification Pursuant to Rule 13a-14(a) and 15d-14(a), As Adopted Pursuant to Section 302 of the Sarbanes-Oxley Act of 2002.
†31.2 - Chief Financial Officer Certification Pursuant to Rule 13a-14(a) and 15d-14(a), As Adopted Pursuant to Section 302 of the Sarbanes-Oxley Act of 2002.
**32.1 - Chief Executive Officer Certification Pursuant to 18 United States Code section 1350, As Adopted Pursuant to Section 906 of the Sarbanes-Oxley Act of 2002.
**32.2 - Chief Financial Officer Certification Pursuant to 18 United States Code section 1350, As Adopted Pursuant to Section 906 of the Sarbanes-Oxley Act of 2002.
______________________________________
| * | | Incorporated herein by reference. |
| ** | | Pursuant to Securities and Exchange Commission Release No. 33-8238, this certification will be treated as “accompanying” this report and not “filed” as part of such report for purposes of Section 18 of the Securities Exchange Act of 1934, as amended, or the Exchange Act, or otherwise subject to the liability of Section 18 of the Exchange Act, and this certification will not be deemed to be incorporated by reference into any filing under the Securities Act of 1933, as amended, or the Exchange Act. |
| ~ | | Management contract and compensatory plans or arrangements. |
| † | | Filed herewith. |
Illinois Power Company
INDEX TO CONSOLIDATED FINANCIAL STATEMENTS
Consolidated Financial Statements | PAGE |
|
|
| | | |
| | Report of Independent Auditors | F-2 |
| | | |
| | Report of Independent Public Accountants | F-3 |
| | | |
| | Consolidated Balance Sheets as of December 31, 2003 and 2002 | F-4 |
| | | |
| | Consolidated Statements of Income and Comprehensive Income for the years ended | |
| | December 31, 2003, 2002 and 2001 | F-5 |
| | | |
| | Consolidated Statements of Cash Flows for the years ended | |
| | December 31, 2003, 2002 and 2001 | F-6 |
| | | |
| | Consolidated Statements of Retained Earnings for the years ended | |
| | December 31, 2003, 2002 and 2001 | F-7 |
| | | |
| | Notes to Consolidated Financial Statements | F-8 |
| | | |
Report of Independent Auditors
To the Board of Directors and
Shareholders of Illinois Power Company:
In our opinion, the accompanying consolidated balance sheets as of December 31, 2003 and 2002 and the related consolidated statements of income and comprehensive income, of cash flows and of retained earnings for the years then ended present fairly, in all material respects, the financial position of Illinois Power Company at December 31, 2003 and 2002, and the results of its operations and its cash flows for the years then endedin conformity with accounting principles generally accepted in the United States of America. These financial statements are the responsibility of the Company’s management; our responsibility is to express an opinion on these financial statements based on our audits. We conducted our audits of these statements in accordance with auditing standards generally accepted in the United States of Ame rica, which require that we plan and perform the audit to obtain reasonable assurance about whether the financial statements are free of material misstatement. An audit includes examining, on a test basis, evidence supporting the amounts and disclosures in the financial statements, assessing the accounting principles used and significant estimates made by management, and evaluating the overall financial statement presentation. We believe that our audits provide a reasonable basis for our opinion. The consolidated financial statements of the Company as of December 31, 2001 and for the year ended December 31, 2001, were audited by other independent accountants who have ceased operations. Those independent accountants expressed an unqualified opinion in their report dated February 25, 2002.
The Company has a $2.3 billion unsecured Note Receivable from Affiliate at December 31, 2003 and, as discussed in Note6, the interest income from this Note Receivable provides the Company with substantial income and cash flows. Company management evaluated the Note Receivable from Affiliate for possible impairment under the requirements of Statement of Financial Accounting Standards No. 114 (SFAS 114),Accounting by Creditors for Impairment of a Loan.As discussed in Note 1, SFAS 114 does not require the Note Receivable from Affiliate to be carried at fair value and considers a loan as impaired only when it is probable that the Company will be unable to collect all amounts due according to the contractual terms of the loan agreement. Therefore, under this standard, it could be reasonably possible , or even more likely than not, that all such payments would not be collected and a loan not be considered impaired. Company management believes the Note Receivable from Affiliate is fully collectible and no impairment is required by SFAS 114. As discussed in Notes 2 and 4, the Company's parent has entered into an agreement to sell Illinois Power Company to Ameren Corporation and the Company anticipates that the Note Receivable from Affiliate will be significantly reduced or eliminated in connection with the proposed sale transaction.
As discussed in Note 1 to the financial statements, the Company changed the manner in which it accounts for asset retirement obligations as of January 1, 2003. As discussed in Note 1, the Company adopted certain provisions of Financial Accounting Standards Board Interpretation No. 46, “Consolidation of Variable Interest Entities – an interpretation of ARB 51 (revised December2003),” as of December 31, 2003. As discussed in Note 1, the Company adopted the provisions of Statement of Financial Accounting Standards No. 132 (revised 2003), “Employers’ Disclosures About Pensions and Other Postretirement Benefits – an Amendment of FASB Statements No. 87, 88, and 106 and a revision of FASB Statement No. 132,” as of December 31, 2003.
PricewaterhouseCoopers LLP
Houston, Texas
March 8, 2004
The following report is a copy of a report previously issued by Arthur Andersen LLP and has not been reissued by Arthur Andersen LLP.
REPORT OF INDEPENDENT PUBLIC ACCOUNTANTS
To the Board of Directors and Shareholder of Illinois Power Company:
We have audited the accompanying consolidated balance sheets of Illinois Power Company (an indirect, wholly owned subsidiary of Dynegy, Inc.) and subsidiaries as of December 31, 2001* and 2000*, and the related statements of income, retained earnings and cash flows for the years then ended. These financial statements are the responsibility of the Company’s management. Our responsibility is to express an opinion on these financial statements based on our audits.
We conducted our audits in accordance with auditing standards generally accepted in the United States. Those standards require that we plan and perform the audit to obtain reasonable assurance about whether the financial statements are free of material misstatement. An audit includes examining, on a test basis, evidence supporting the amounts and disclosures in the financial statements. An audit also includes assessing the accounting principles used and significant estimates made by management, as well as evaluating the overall financial statement presentation. We believe that our audits provide a reasonable basis for our opinion.
In our opinion, the financial statements referred to above present fairly, in all material respects, the financial position of Illinois Power Company and subsidiaries as of December 31, 2001* and 2000*, and the results of their operations and their cash flows for the years then ended in conformity with accounting principles generally accepted in the United States.
Houston, Texas
February 25, 2002
* The consolidated balance sheets as of December 31, 2001 and 2000 and the related consolidated statements of income and comprehensive income, of cash flows and of retained earnings for the year ended December 31, 2000 are not required to be presented in the 2003 annual report.
Illinois Power Company | | | |
CONSOLIDATED BALANCE SHEETS | | | |
|
| |
(Millions of dollars) | |
| |
| December 31, | | | 2003 | | | 2002 | |
ASSETS | | | | | | | |
Utility Plant | | | | | | | |
| Electric (includes construction work in progress of $86.2 million and $98.3 million, respectively) | | $ | 2,499.0 | | $ | 2,409.6 | |
| Gas (includes construction work in progress of $13.5 million and $18.4 million, respectively) | | | 783.4 | | | 770.6 | |
| |
| | | | 3,282.4 | | | 3,180.2 | |
| Less -- accumulated depreciation | | | 1,199.4 | | | 1,150.2 | |
| |
| | | | 2,083.0 | | | 2,030.0 | |
| |
Investments and Other Assets | | | 7.3 | | | 8.9 | |
| |
Current Assets | | | | | | | |
| Cash and cash equivalents | | | 16.7 | | | 117.4 | |
| Restricted cash | | | - | | | 16.6 | |
| Accounts receivable (less allowance of $5.5 million and $5.5 million, respectively) | | | | | | | |
| Service | | | 83.8 | | | 80.4 | |
| Other | | | 32.2 | | | 23.4 | |
| Accounts receivable, affiliates | | | 74.7 | | | 22.1 | |
| Accrued unbilled revenue | | | 81.6 | | | 77.8 | |
| Inventories at average cost | | | | | | | |
| Gas in underground storage | | | 55.0 | | | 33.1 | |
| Operating materials | | | 11.5 | | | 10.6 | |
| Prepayments and other | | | 50.7 | | | 19.7 | |
| |
| | | | 406.2 | | | 401.1 | |
| |
Note Receivable from Affiliate | | | 2,271.4 | | | 2,271.4 | |
| |
Deferred Debits | | | | | | | |
| Transition period cost recovery | | | 116.2 | | | 154.9 | |
| Investment in IPSPT | | | 4.3 | | | - | |
| Receivable from IPSPT | | | 2.2 | | | - | |
| Other | | | 168.6 | | | 184.0 | |
| |
| | | | 291.3 | | | 338.9 | |
| |
| | | $ | 5,059.2 | | $ | 5,050.3 | |
| |
CAPITAL and LIABILITIES | | | | | | | |
Capitalization | | | | | | | |
| Common stock -- No par value, 100,000,000 shares authorized; 75,643,937 shares issued, stated at | | $ | 1,274.1 | | $ | 1,274.1 | |
| Additional paid-in capital | | | 9.1 | | | 8.9 | |
| Retained earnings - accumulated since 1/1/99 | | | 504.9 | | | 390.2 | |
| Accumulated other comprehensive income (loss), net of tax | | | (9.6 | ) | | (13.4 | ) |
| Less -- Capital stock expense | | | 7.2 | | | 7.2 | |
| Less -- 12,751,724 shares of common stock in treasury, at cost | | | 286.4 | | | 286.4 | |
| |
| Total common stock equity | | | 1,484.9 | | | 1,366.2 | |
| Preferred stock | | | 45.8 | | | 45.8 | |
| Long-term debt | | | 1,434.6 | | | 1,718.8 | |
| Long-term debt to IPSPT | | | 345.6 | | | - | |
| |
| Total capitalization | | | 3,310.9 | | | 3,130.8 | |
| |
Current Liabilities | | | | | | | |
| Accounts payable | | | 37.3 | | | 66.1 | |
| Accounts payable, affiliates | | | 14.2 | | | 18.3 | |
| Notes payable | | | - | | | 100.0 | |
| Long-term debt maturing within one year | | | 70.7 | | | 276.4 | |
| Long-term debt maturing within one year to IPSPT | | | 74.3 | | | - | |
| Taxes accrued | | | 50.1 | | | 48.5 | |
| Interest accrued | | | 10.1 | | | 15.4 | |
| Other | | | 95.0 | | | 80.1 | |
| |
| | | | 351.7 | | | 604.8 | |
| |
Deferred Credits | | | | | | | |
| Accumulated deferred income taxes | | | 1,011.0 | | | 1,038.2 | |
| Accumulated deferred investment tax credits | | | 19.8 | | | 21.2 | |
| Other | | | 365.8 | | | 255.3 | |
| Commitments and Contingencies (Note 5) | | | | | | | |
| |
| | | | 1,396.6 | | | 1,314.7 | |
| |
| | | $ | 5,059.2 | | $ | 5,050.3 | |
| |
| | | | | | | | |
See notes to consolidated financial statements, which are an integral part of these statements. | | | |
Illinois Power Company | | | | |
CONSOLIDATED STATEMENTS OF INCOME
AND COMPREHENSIVE INCOME | | | | |
|
| |
| | | | (Millions of dollars) | |
| |
| For the Years Ended December 31, | | | 2003 | | | 2002 | | | 2001 | |
Operating Revenues | | | | | | | | | | |
| Electric | | $ | 1,101.9 | | $ | 1,138.8 | | $ | 1,137.1 | |
| Electric interchange | | | - | | | 7.1 | | | 0.7 | |
| Gas | | | 465.9 | | | 372.4 | | | 476.6 | |
| |
| Total | | | 1,567.8 | | | 1,518.3 | | | 1,614.4 | |
| |
| | | | | | | | | | | |
Operating Expenses and Taxes | | | | | | | | | | |
| Power purchased | | | 681.0 | | | 677.5 | | | 661.8 | |
| Gas purchased | | | 315.5 | | | 231.7 | | | 332.8 | |
| Other operating expenses | | | 146.4 | | | 140.2 | | | 142.3 | |
| Retirement and severance expense | | | - | | | (0.7 | ) | | 15.3 | |
| Maintenance | | | 58.1 | | | 53.9 | | | 54.6 | |
| Depreciation and amortization | | | 78.5 | | | 80.7 | | | 80.9 | |
| Amortization of regulatory assets | | | 42.2 | | | 74.1 | | | 51.2 | |
| General taxes | | | 67.5 | | | 57.6 | | | 68.4 | |
| Income taxes | | | 12.4 | | | 39.3 | | | 40.6 | |
| |
| Total | | | 1,401.6 | | | 1,354.3 | | | 1,447.9 | |
| |
| Operating income | | | 166.2 | | | 164.0 | | | 166.5 | |
| |
| | | | | | | | | | | |
Other Income and Deductions - Net | | | | | | | | | | |
| Interest income from affiliates | | | 170.4 | | | 170.4 | | | 171.0 | |
| Miscellaneous - net | | | (54.3 | ) | | (61.3 | ) | | (49.5 | ) |
| |
| Total | | | 116.1 | | | 109.1 | | | 121.5 | |
| |
| Income before interest charges | | | 282.3 | | | 273.1 | | | 288.0 | |
| |
| | | | | | | | | | | |
Interest Charges | | | | | | | | | | |
| Interest expense | | | 163.8 | | | 112.9 | | | 123.5 | |
| Allowance for borrowed funds used during construction | | | (0.9 | ) | | (0.5 | ) | | (1.7 | ) |
| |
| Total | | | 162.9 | | | 112.4 | | | 121.8 | |
| |
| | | | | | | | | | | |
| Earnings before cumulative effect of change in accounting principle | | | 119.4 | | | 160.7 | | | 166.2 | |
| Cumulative effect of change in accounting principle, net of tax | | | (2.4 | ) | | - | | | - | |
| |
| | | | | | | | | | | |
| Net income | | | 117.0 | | | 160.7 | | | 166.2 | |
| Less -- Preferred dividend requirements | | | 2.3 | | | 2.3 | | | 8.3 | |
| |
| Net income applicable to common shareholder | | $ | 114.7 | | $ | 158.4 | | $ | 157.9 | |
| |
| | | | | | | | | | | |
| Net income | | $ | 117.0 | | $ | 160.7 | | $ | 166.2 | |
| Other comprehensive income (loss), net of tax | | | 3.8 | | | (13.4 | ) | | - | |
| |
| Comprehensive income | | $ | 120.8 | | $ | 147.3 | | $ | 166.2 | |
| |
See notes to consolidated financial statements, which are an integral part of these statements.
Illinois Power Company | | | | |
CONSOLIDATED STATEMENTS OF CASH FLOWS | | | | |
| | |
| |
| | | (Millions of dollars) | |
| |
| For the Years Ended December 31, | | | 2003 | | | 2002 | | | 2001 | |
Cash Flows from Operating Activities | | | | | | | | | | |
| Net income | | $ | 117.0 | | $ | 160.7 | | $ | 166.2 | |
| Items not affecting cash flows from operating activities -- | | | | | | | | | | |
| Depreciation and amortization | | | 130.9 | | | 161.8 | | | 138.0 | |
| Deferred income taxes | | | (23.8 | ) | | (44.3 | ) | | (25.6 | ) |
| Cumulative effect of change in accounting principle | | | 2.4 | | | - | | | - | |
| Changes in assets and liabilities resulting from operating activities -- | | | | | | | | | | |
| Accounts receivable | | | 5.9 | | | (22.0 | ) | | 116.8 | |
| Accrued unbilled revenue | | | (3.8 | ) | | 0.5 | | | 38.4 | |
| Inventories | | | (22.8 | ) | | 1.5 | | | 5.2 | |
| Prepayments | | | (28.2 | ) | | 0.1 | | | 4.1 | |
| Accounts payable | | | (32.9 | ) | | (1.2 | ) | | (65.5 | ) |
| Other deferred credits | | | (29.0 | ) | | (38.7 | ) | | (42.3 | ) |
| Interest accrued and other, net | | | 20.6 | | | (9.0 | ) | | 9.7 | |
| |
| Net cash provided by operating activities | | | 136.3 | | | 209.4 | | | 345.0 | |
|
Cash Flows from Investing Activities | | | | | | | | | | |
| Capital expenditures | | | (125.5 | ) | | (144.5 | ) | | (148.8 | ) |
| Other investing activities | | | - | | | 3.4 | | | 2.1 | |
| |
| Net cash used in investing activities | | | (125.5 | ) | | (141.1 | ) | | (146.7 | ) |
| |
Cash Flows from Financing Activities | | | | | | | | | | |
| Dividends on common stock and preferred stock | | | (2.3 | ) | | (2.8 | ) | | (108.3 | ) |
| Prepaid Interest on Affiliate Note Receivable | | | 127.8 | | | - | | | - | |
| Redemptions -- | | | | | | | | | | |
| Short-term debt | | | (100.0 | ) | | (238.2 | ) | | (346.8 | ) |
| Long-term debt | | | (276.4 | ) | | (182.1 | ) | | (273.2 | ) |
| Preferred stock | | | - | | | - | | | (100.0 | ) |
| Issuances -- | | | | | | | | | | |
| Short-term debt | | | - | | | 60.0 | | | 477.2 | |
| Long-term debt | | | 150.0 | | | 400.0 | | | 186.8 | |
| Decrease (increase) in restricted cash | | | (2.4 | ) | | (5.3 | ) | | 1.2 | |
| Other financing activities | | | (8.2 | ) | | (23.8 | ) | | (5.5 | ) |
| |
| Net cash provided by (used in) financing activities | | | (111.5 | ) | | 7.8 | | | (168.6 | ) |
| |
| Net change in cash and cash equivalents | | | (100.7 | ) | | 76.1 | | | 29.7 | |
| Cash and cash equivalents at beginning of year | | | 117.4 | | | 41.3 | | | 11.6 | |
| |
| Cash and cash equivalents at end of year | | $ | 16.7 | | $ | 117.4 | | $ | 41.3 | |
|
See notes to consolidated financial statements, which are an integral part of these statements. | | | | | | | | | | |
Illinois Power Company | | | |
CONSOLIDATED STATEMENTS OF RETAINED EARNINGS | |
| | |
| |
(Millionsof dollars) | |
| |
| For the Years Ended December 31, | | | 2003 | | | 2002 | | | 2001 | |
| | | | | | | | | | | |
| Balance at beginning of year | | $ | 390.2 | | $ | 233.6 | | $ | 175.7 | |
| Net income | | | 117.0 | | | 160.7 | | | 166.2 | |
| |
| | | | 507.2 | | | 394.3 | | | 341.9 | |
| |
| Less-- | | | | | | | | | | |
| Dividends- | | | | | | | | | | |
| Preferred stock | | | 2.3 | | | 2.3 | | | 8.3 | |
| Common stock | | | - | | | 0.5 | | | 100.0 | |
| Preferred stock tender charges | | | - | | | 1.3 | | | - | |
| |
| | | | 2.3 | | | 4.1 | | | 108.3 | |
| |
| Balance at end of year | | $ | 504.9 | | $ | 390.2 | | $ | 233.6 | |
| |
See notes to consolidated financial statements, which are an integral part of these statements.
Notes to Consolidated Financial Statements
Note 1 - Summary of Significant Accounting Policies
Principles of Consolidation We are an indirect, wholly-owned subsidiary of Dynegy Inc. All of our outstanding common stock and 73% of our outstanding preferred stock is held by our direct parent company, Illinova, which is a wholly-owned subsidiary of Dynegy. We are engaged in the transmission, distribution and sale of electric energy and distribution, transportation and sale of natural gas in the State of Illinois. Our consolidated financial statements include the accounts of IP; Illinois Power Financing I, a statutory business trust in which we serve as sponsor that is currently inactive; Illinois Power Financing II, a statutory business trust in which we serve as sponsor that is currently inactive; and Illinois Power Transmission Company LLC, a limited liability Delaware company that is currently inactive. Effective December 31, 2003, Illinois Power Securitization Li mited Liability Company, a Delaware special purpose limited liability company in which we are the sole member and Illinois Power Special Purpose Trust, a Delaware special purpose business trust whose sole owner is LLC, are no longer consolidated due to the adoption of FIN No. 46R. The accounts of LLC and IPSPT , which are VIEs under FIN No. 46R, are separate legal entities from IP. The assets of the VIEs are not available to creditors of IP and the transitional properties held by the VIEs are not assets of IP. See Note 9 – “Long-Term Debt” and Note 10 – “Preferred Stock” for additional information.
All significant intercompany balances and transactions have been eliminated from the consolidated financial statements. The preparation of the consolidated financial statements in conformity with generally accepted accounting principles requires management to make estimates and assumptions that affect the reported amounts of assets and liabilities, the disclosure of contingent assets and liabilities and the reported amounts of revenues and expenses during the reporting period. On an ongoing basis, management reviews its estimates, and any changes in facts and circumstances may result in revised estimates. Actual results could differ materially from those estimates. Certain prior year amounts have been reclassified to conform to the current year presentation.
Clinton Impairment, Quasi-Reorganization and Sale of Clinton In December 1998, IP’s Board of Directors decided to exit Clinton operations, resulting in an impairment of Clinton-related assets and the accrual of exit-related costs. Concurrent with the decision to exit Clinton, IP’s Board of Directors also decided to effect a quasi-reorganization, whereby IP’s consolidated accumulated deficit in retained earnings at December 31, 1998 was eliminated. On December 15, 1999, IP sold Clinton to AmerGen. The sale resulted in revisions to the impairment of Clinton-related assets and the previously accrued exit-related costs. All such revisions were made directly to common stock equity on the balance sheet. Please read “Clinton Decommissioning Cost Recovery” and “Power Purchase Agreement Costs” below for more information related to the sale of C linton.
Utility Plant The cost of additions to plant and replacements for retired property units is capitalized. Cost includes labor, materials, and an allocation of general and administrative costs, plus AFUDC or capitalized interest as described below. Maintenance and repairs, including replacement of minor items of property, are charged to maintenance expense as incurred. Prior to January 1, 2003, when depreciable property units were retired, the original cost and dismantling charges, less salvage value, were charged to accumulated depreciation. Rate regulated companies subject to SFAS 71, “Accounting for the Effects of Certain Types of Regulation,” were allowed to record the estimated or actual cost of removal and salvage associated with utility plant in the reserve for depreciation. These amounts were recorded through a composite depreciation rate. The amounts ac crued in the reserve for depreciation are not associated with Asset Retirement Obligations as defined in SFAS 143, “Accounting for Asset Retirement Obligations”, which we adopted January 1, 2003. With the adoption of SFAS No. 143, we reclassified $72.2 million and $68.7 million of cost of removal, net of salvage, from accumulated depreciation to regulatory liabilities, at December 31, 2003 and 2002, respectively. Please read “Accounting Principles Adopted” below for more information on Asset Retirement Obligations.
Allowance for Funds Used During Construction The FERC Uniform System of Accounts defines AFUDC as the net costs for the period of construction of borrowed funds used for construction purposes and a reasonable rate on other funds when so used. AFUDC is capitalized as a component of construction work in progress in applying the provisions of SFAS 71. In 2003, 2002 and 2001, the pre-tax rate used for all construction projects was 2.6%, 2.9% and 4.8%, respectively. Although cash is not currently realized from AFUDC, it is realized through the ratemaking process over the service life of the related property through increased revenues resulting from a higher rate base and higher depreciation expense.
Depreciation For financial statement purposes, various classes of depreciable property are depreciated over their estimated useful lives by applying composite rates on a straight-line basis. Provisions for depreciation for electric plant facilities, as a percentage of the average depreciable cost, were 2.2%, 2.2% and 2.3% in 2003, 2002 and 2001, respectively. Provisions for depreciation of gas utility plant, as a percentage of the average depreciable cost, were 3.4% in 2003, 3.5% in 2002 and 3.5% in 2001.
Note Receivable from Affiliate We hold an unsecured note receivable from Illinova relating to the sale of our former fossil-fueled generating assets. The note matures on September 30, 2009 and bears interest at an annual rate of 7.5%, due semi-annually in April and October. At December 31, 2003 and 2002, principal outstanding under the note receivable approximated $2.3 billion with $0 and $14.2 million in accrued interest at December 31, 2003 and 2002, respectively. In addition to receiving the accrued interest, at December 31, 2003, we had received $127.8 million of prepaid interest, representing 9 months of interest, on our Note Receivable from Affiliate. In January 2004, we received an additional $42.6 million of prepaid interest, representing 3 months of interest, on our Note Receivable from Affiliate. These interest prepayments were recorded in Deferred Cred its – Other on our Consolidated Balance Sheet.
We review the collectibility of this note on a quarterly basis to assess whether it has become impaired under the criteria of SFAS No. 114, “Accounting by Creditors for Impairment of a Loan.” Under this standard, a loan is impaired when, based on current information and events, it is “probable” that a creditor will be unable to collect all amounts due according to the contractual terms of the loan agreement. However, if the possibility that we would not be able to collect all amounts due under the contractual terms were only “more likely than not” or “reasonably possible,” but not “probable,” then the Note Receivable from Affiliate would not be considered impaired under SFAS 114. The terms “probable,” “reasonably possible” and “more likely than not” are used in SFAS No. 5, “Accounting for Contingenc ies,” as follows:
| | Reasonably possible – The chance of the future event or events occurring is more than remote but less than likely. |
| | More likely than not – A level of likelihood that is more than 50%. |
| | Probable – Future events are likely to occur. |
While we believe that the Note Receivable from Affiliate is not impaired and is fully collectible in accordance with its contractual terms based upon, among other things, our review of Dynegy’s financial condition, the market's view of Dynegy's dept and stock price and Dynegy's earnings and cash flow guidance, we expect to continue to review the collectibility of the Note Receivable from Affiliate on a quarterly basis. Principal payments on the Note Receivable from Affiliate are not required until 2009 when it is due in full; as a result, future events may affect our view as to the collectibility of the remaining principal owed us thereunder. Accordingly, we have reflected the Note Receivable from Affiliate on our December 31, 2003 Consolidated Balance Sheet at $2.3 billion. It is possible that if negative events affect Dynegy or if we do not receive timely interest payments on the Note Receivable from Affiliate, such matters could cause us to believe it necessary to impair the Note Receivable from Affiliate on our Consolidated Balance Sheet and such action could have a material adverse effect on our financial condition and results of operations. See further discussion in Note 4 – “Related Parties” and Note 14 – “Fair Value of Financial Instruments.”
This assessment is highly subjective given the inherent uncertainty of predicting future events. In the future, should we conclude impairment has occurred; we would measure the note’s realizable value based on a
probability weighted analysis of multiple expected future cash flows discounted at the note’s effective interest rate of 7.5%, as opposed to a market rate of interest, in accordance with SFAS No. 114.
Regulation and Regulatory Assets and Liabilities We are regulated primarily by the ICC and the FERC. We prepare our consolidated financial statements in accordance with SFAS No. 71. Reporting under SFAS 71 requires companies like ours whose service obligations and prices are regulated to maintain balance sheet assets representing costs probable of recovery through inclusion in future rates. Regulatory assets represent probable future revenues associated with costs that are expected to be recovered from customers through the ratemaking process. Regulatory liabilities represent costs that are expected to be returned to customers through the ratemaking process. As discussed in “Utility Plant” above, with the adoption of SFAS No. 143, the cost of removal, net of salvage, which had previously been recorded as a component of our depreciation reserve, was required to be reclassified as a long-term regulatory liability. Significant regulatory assets and liabilities, which are included in Deferred Debits and Deferred Credits on our Consolidated Balance Sheets, are:
| |
Regulatory assets and liabilities (Millions of dollars) | | | 2003 | | | 2002 | |
| |
| Regulatory assets | | | | | | | |
| Transition period cost recovery | | $ | 116.2 | | $ | 154.9 | |
| Unamortized losses on reacquired debt | | | 47.2 | | | 53.6 | |
| Manufactured-gas plant site cleanup costs | | | 38.9 | | | 39.7 | |
| Clinton decommissioning cost recovery | | | 4.5 | | | 8.0 | |
| | |
| |
| Total regulatory assets | | $ | 206.8 | | $ | 256.2 | |
| | |
| |
| Regulatory liabilities | | | | | | | |
| Cost of removal, net | | $ | 72.2 | | $ | 68.7 | |
| Deferred taxes - SFAS 109 | | | 56.6 | | | 49.3 | |
| | |
| |
| Total regulatory liabilities | | $ | 128.8 | | $ | 118.0 | |
| | |
| |
Transition Period Cost Recovery P.A. 90-561 allows utilities to recover potentially non-competitive investment costs (“stranded costs”) from retail customers during the transition period, which extends until December 31, 2006. During this period, we are allowed to recover stranded costs through frozen bundled rates and transition charges from customers who select other electric suppliers. In May 1998, the SEC Staff issued interpretive guidance on the appropriate accounting treatment during regulatory transition periods for asset impairments and the related regulated cash flows designed to recover such impairments. The Staff’s guidance established that an impaired portion of plant assets identified in a state’s legislation or rate order for recovery through regulated cash flows should be treated as a regulatory asset in the portion of the enterprise f rom which the regulated cash flows are derived. Based on this guidance and on provisions of P.A. 90-561, we recorded a regulatory asset of $457.3 million in December 1998 for the portion of our stranded costs deemed probable of recovery during the transition period. Subsequent adjustments related to the sale of the Clinton Power Station reduced the regulatory asset by $115.9 million to $341.4 million. The amount of amortization recorded in each period is based on the recovery of such costs from rate payers as measured by our ROE. The transition period cost recovery asset amortization was $38.7 million in 2003, $70.5 million in 2002, and $47.4 million in 2001. The increase in amortization of the transition period cost recovery regulatory asset for 2002 was due to increased financial performance, which allowed us to recognize additional regulatory asset amortization and stay within the allowable ROE collar. See Note 5 – “Commitments and Contingencies – Utility Earnings Cap” for additional i nformation on the transition period cost recovery regulatory asset.
Unamortized Losses on Reacquired Debt In accordance with SFAS No. 71, costs related to refunded debt are amortized over the lives of the related new debt issues or the remaining life of the old debt if no new debt is issued.
Manufactured-Gas Plant Site Cleanup Costs The regulatory asset for the probable future collections from rate payers of allowable MGP site cleanup costs is amortized as the allowable costs are collected from rate payers. See Note 5 – “Commitments and Contingencies” for additional information.
Clinton Decommissioning Cost Recovery As a result of the sale of Clinton to AmerGen, AmerGen has assumed responsibility for operating and ultimately decommissioning the nuclear power plant. When the sale closed in December 1999, we were required to transfer decommissioning trust funds in the amount of $98.5 million to AmerGen and to make an additional payment of $113.4 million to the decommissioning trust funds. In addition, we agreed to make five annual payments of approximately $5.0 million through 2004, of which four payments have been made through December 2003. The accrual balances for decommissioning costs at December 31, 2003 and 2002 were $4.9 million and $9.9 million, respectively.
| |
Decommissioning costs (Millions of dollars) | | | 2003 | | | 2002 | |
| |
| | | | | | | | |
| Accrual balance, beginning of period | | $ | 9.9 | | $ | 14.9 | |
| Cash payments | | | (5.0 | ) | | (5.0 | ) |
| | |
| |
| Accrual balance, end of period | | $ | 4.9 | | $ | 9.9 | |
| | |
| |
The ICC has allowed for continued recovery of decommissioning costs associated with Clinton after the sale to AmerGen. We adjusted the regulatory asset for probable future collections from our customers of decommissioning costs to reflect the ICC’s limitation on recovery of such costs to approximately $3.7 million annually through 2004. At December 31, 2003 and 2002 the regulatory asset balances were $4.5 million and $8.0 million, respectively. The regulatory asset for the probable future collections from rate payers of decommissioning costs is amortized as the decommissioning costs are collected from rate payers.
Cost of Removal, Net Rate regulated companies subject to SFAS No. 71, “Accounting for the Effects of Certain Types of Regulation,” were allowed to record the estimated or actual cost of removal and salvage associated with utility plant in the reserve for depreciation. These amounts were recorded through a composite depreciation rate. The amounts accrued in the reserve for depreciation are not associated with Asset Retirement Obligations in accordance with SFAS 143, “Accounting for Asset Retirement Obligations”, which we adopted January 1, 2003. With the adoption of SFAS No. 143, we reclassified $72.2 million and $68.7 million of cost of removal, net of salvage, from accumulated depreciation to regulatory liabilities, at December 31, 2003 and 2002, respectively.
Deferred Taxes – SFAS No. 109 We provide deferred income taxes for the temporary differences in the tax and financial reporting bases of our assets and liabilities in accordance with SFAS 109, “Accounting for Income Taxes.” The temporary differences relate principally to net utility plant in service and depreciation. With regulated accounting under SFAS No. 71, the difference in the deferred taxes calculated at the current income tax rate under SFAS No. 109 and the statutory rate in effect at the time the deferred taxes were originally recorded is recorded as a regulatory asset/liability.
Unamortized Debt Discount and Expense Discount and expense associated with long-term debt are amortized over the lives of the related issues.
Power Purchase Agreement Costs The Clinton sale was contingent on our signing a PPA with AmerGen. The PPA requires that we purchase a predetermined percentage of Clinton’s output over the 5-year life of the agreement at fixed prices that exceeded current and projected wholesale prices at the time the agreement was signed. Therefore, we accrued $145.0 million for the premium that we estimate would be paid over the life of the agreement, which is being amortized based on the energy purchased from AmerGen. At December 31, 2003 and 2002, $29.4 million and $30.4 million, respectively, are included in other current liabilities and $0.0 and $29.5 million, respectively, are included in Other Deferred Credits in the accompanying Consolidated Balance Sheets. The PPA expires December 31, 2004.
| |
Power purchase agreement costs (Millions of dollars) | | | 2003 | | | 2002 | |
|
|
| |
| | | | | | | | |
| Accrual balance, beginning of period | | $ | 59.9 | | $ | 87.5 | |
| Amortization | | | (30.5 | ) | | (27.6 | ) |
| | |
| |
| Accrual balance, end of period | | $ | 29.4 | | $ | 59.9 | |
| | |
| |
Revenue Recognition and Energy Cost Revenues for utility services are recognized when services are provided to customers. As such, we record revenues for services provided but not yet billed. Unbilled revenues represent the estimated amount customers will be billed for service delivered from the time meters were last read to the end of the accounting period.
In 2003, 2002 and 2001, public utility and municipal utility taxes included in operating revenues were $20.2 million, $17.3 million and $19.4 million, respectively.
The cost of gas purchased to serve our native load is recovered from customers pursuant to the UGAC. Accordingly, allowable gas costs that are to be passed on to customers in a subsequent accounting period are deferred. The recovery of costs deferred under this clause is subject to review and approval by the ICC.
Income Taxes Our indirect parent, Dynegy, files a consolidated U.S. federal income tax return and, for financial reporting purposes, accounts for income taxes using the liability method in accordance with SFAS No. 109, “Accounting for Income Taxes.” Under this method, income taxes are provided for amounts currently payable and for amounts deferred as tax assets and liabilities caused by differences between financial statement carrying amounts and the tax bases of certain assets and liabilities. Deferred income taxes are measured using the enacted tax rates that are assumed will be in effect when the differences reverse. The estimates used to recognize deferred tax assets are subject to revision, either higher or lower, in future periods based on new facts or circumstances. ITCs used to reduce federal income taxes have been deferred and are being amortized to i ncome over the service life of the property that gave rise to the credits. Please read Note 8 – “Income Taxes” for additional information about our income taxes.
We are included in the consolidated federal and state income tax returns filed by Dynegy. Under our Services and Facilities Agreement with Dynegy, we calculate our own tax liability under the separate return approach and reimburse Dynegy for such amount.
Preferred Dividend Requirements Our preferred dividend requirements are recorded on the accrual basis and reflected in the Consolidated Statements of Income and Comprehensive Income.
Other Comprehensive Income On December 31, 2003, our annual measurement date, the accumulated benefit obligation related to our pension plans continue to exceed the fair value of the pension plan assets. This difference is attributed to (1) an increase in the accumulated benefit obligation that resulted from the decrease in the discount rate and the expected long-term rate of return and (2) a decline in the fair value of the plan assets due to a sharp decrease in the equity markets through December 31, 2002, partially offset by the recovery in 2003. Therefore, during 2003, the difference between the accumulated benefit obligation and the fair value of the assets decreased. As a result, in accordance with SFAS No. 87, “Employers’ Accounting for Pensions”, we recorded a credit to other comprehensive income of $6.3 million ($3.8 million after-tax), which increased common stock equity. In 2002, we recognized a charge to other comprehensive income of $22.2 million ($13.4 million after-tax), which decreased common stock equity.
Derivative Instruments During 2003, 2002 and 2001, all of our purchase contracts qualified for the normal purchase and sale exemption within SFAS No. 133, “Accounting for Derivative Instruments and Hedging Activities” and, therefore, we accounted for such contracts under the accrual method. We had no other derivative instruments qualifying under SFAS No. 133 during these years. During 2003, 2002 and 2001 we did not participate in any trading activity.
Consolidated Statements of Cash Flows Cash and cash equivalents include cash on hand and temporary investments purchased with an initial maturity of three months or less. We had cash and cash equivalents of $16.7 million, $117.4 million and $41.3 million at December 31, 2003, 2002 and 2001, respectively.
Income taxes and interest paid are as follows:
(Millions of dollars) |
| |
| Years Ended December 31, | | | 2003 | | | 2002 | | | 2001 | |
| |
| | | | | | | | | | | |
| Income taxes | | $ | 94.3 | | $ | 151.1 | | $ | 116.4 | |
| Interest | | $ | 152.9 | | $ | 106.3 | | $ | 121.1 | |
There were no material non-cash investing activities in 2002 or 2001; however, in the third quarter of 2003, we entered into a capital lease relating to our Tilton generating facility valued at approximately $66.4 million. For additional discussion of this capital lease, please read Note 5 - "Commitments and Contingencies - Capital Leases." There were no material non-cash financing activities in 2003, 2002 or 2001.
Restricted Cash Prior to the adoption of FIN No. 46R, the restricted cash of IPSPT was included in our Consolidated Balance Sheets. As of December 31, 2002, our restricted cash of $16.6 million reflected cash reserved for use in paying off the IPSPT transitional funding trust notes issued under the provisions of P.A. 90-561. See Note 9 – “Long-Term Debt” for additional discussion of the IPSPT transitional funding trust notes. Effective December 31, 2003, IPSPT was deconsolidated from our financial statements in conjunction with the adoption of FIN No. 46R. Please read “Accounting Policies Adopted – FIN No. 46” below for additional information.
Employee Stock Options In December 2002, the FASB issued SFAS No. 148, “Accounting for Stock-Based Compensation-Transition and Disclosure.” SFAS No. 148 amends SFAS No. 123, “Accounting for Stock-Based Compensation,” and provides alternative methods of transition (prospective, modified prospective or retroactive) for entities that voluntarily change to the fair value-based method of accounting for stock-based employee compensation in a fiscal year beginning before December 16, 2003. SFAS 148 requires prominent disclosure about the effects on reported net income of an entity’s accounting policy decisions with respect to stock-based employee compensation. We transitioned to a fair value-based method of accounting for stock-based compensation in the first quarter 2003 and are using the prospective method of transition as described under SFAS No. 14 8. As a result, a charge of approximately $0.2 million is reflected in other operating expenses for the year ended December 31, 2003. In 2001, a charge of $0.6 million was incurred and recorded as compensation expense due to the extension of the exercise period and the acceleration of vesting for certain stock options due to the early retirement and severance components of our corporate reorganization as more fully discussed in Note 3 – “2001 Reorganization.” Pursuant to the Dynegy-Illinova merger, all stock options granted to our employees prior to the merger were converted to options to purchase Dynegy Class A common stock on a one-for-one basis.
Under the prospective method of transition, all stock options granted after January 1, 2003 are accounted for on a fair value basis. Options granted prior to January 1, 2003 continue to be accounted for using the intrinsic value method. Accordingly, for options granted prior to January 1, 2003, compensation expense is not reflected for employee stock options unless they were granted at an exercise price lower than market value on the grant date. No in-the-money stock options have been granted to our employees since the merger.
Had compensation cost for all stock options granted prior to 2003 been determined on a fair value basis consistent with SFAS No. 123, our net income would have approximated the following pro forma amounts for the years ended December 31, 2003, 2002 and 2001, respectively (millions of dollars).
| | | | 2003 | | | 2002 | | | 2001 | |
| | |
| |
| Reported net income | | $ | 117.0 | | $ | 160.7 | | $ | 166.2 | |
| Less: pro forma expense, net-of-tax | | | 4.1 | | | 4.6 | | | 3.9 | |
| | |
| |
| Pro forma net income | | $ | 112.9 | | $ | 156.1 | | $ | 162.3 | |
| | |
| |
The fair value of each option grant was estimated on the date of the grant using the Black-Scholes option-pricing model, with the following weighted-average assumptions used for grants in 2003, 2002 and 2001: dividends per year of zero for 2003, $0.15 per share for 2002 and $0.30 per share for 2001; expected volatility of 89.6%, 74.3% and 46.4%, respectively; a risk-free interest rate of 3.9%, 4.2% and 4.3%, respectively; and an expected option life of 10 years for all periods.
See Note 11 - “Common Stock and Retained Earnings” for additional information.
Accounting Principles Adopted
SFAS No. 132 In December 2003, the FASB released revised SFAS No. 132, “Employers’ Disclosures about Pensions and Other Postretirement Benefits.” The revised standard requires disclosures for pensions and other postretirement benefit plans and replaces existing pension disclosure requirements. We adopted the new disclosure requirements as of December 31, 2003. Please read Note 12 - “Pension and Other Benefits Costs” for additional information regarding our pension plans.
SFAS No. 143 In June 2001, the FASB issued SFAS No. 143, “Accounting for Asset Retirement Obligations.” SFAS No. 143, which was adopted January 1, 2003, requires that the fair value of a liability for an asset retirement obligation be recognized in the period in which it is incurred with the associated asset retirement costs being capitalized as a part of the carrying amount of the long-lived asset. SFAS No. 143 also includes disclosure requirements that provide a description of asset retirement obligations and reconciliation of changes in the components of those obligations.
In order to ascertain whether a legal obligation exists associated with the retirement of our long-lived assets, we identified all facilities and their assets by functional classification. We reviewed those assets for obligations that may have resulted from enacted laws, state and federal regulation, ordinances, written and oral contracts and other applications of law. Two AROs were identified in connection with our operating lease agreement for four gas turbines and a separate land lease at the Tilton site. The turbine assets are subleased to DMG; however we remain the primary obligor. In that capacity we are liable for retiring the assets in place or dismantling them for sale and delivery to a third party if we do not exercise our option to purchase the assets or renegotiate the lease. At the expiration of the land lease, we may have the obligation to restore the property to its o riginal condition. The AROs were calculated based on cash flows, through a process that included assessment of the timing of future retirements, the retirement method and estimated cost, the credit-adjusted risk-free rate and development of other significant assumptions. The credit-adjusted risk-free rate utilized was 12%, which represents the effective interest rate on our Mortgage bonds that were issued December 2002. Upon adoption, the cumulative effect, net of the associated income taxes, was approximately $2.4 million. The ARO liability for the asset operating lease and the land lease, recorded during the first quarter 2003, was $5.8 million. Amortization and accretion expense for 2003 was approximately $1 million.
In September 2003, an asset purchase option was exercised which effectively reclassified the Tilton operating lease relating to the turbines as a capital lease and relieved the most imminent dismantlement obligation. At that time, 100% weight was transferred to the likelihood that the outcome of the timing of the cash flows would be at the expiration of the extended land lease in September 2033. Prior to the exercise of the option, the ARO liability balance was $6.2 million and the net book value of the Asset Retirement Cost was $1.3 million.
The removal cost assumption remained the same but was extended to 2033 using the original inflation factor of 3%. The undiscounted cash flows of the dismantlement of the turbine assets in 2033 was calculated to be $18.4 million (compared to $8.2 million on an undiscounted basis at adoption for SFAS 143 which assumed a 2006 obligation under the operating lease). Using the current discount rate of 10.125% as prescribed by SFAS 143, paragraph 15, “Upward revisions in the amount of undiscounted estimated cash flows shall be discounted using the current credit-adjusted risk-free rate,” the carrying amount of the ARO liability at September 30, 2003 was calculated to be $1 million.
The ARO liability related to the turbines was reduced to reflect the change, the remaining asset retirement cost net of accumulated amortization was removed, and the remaining net credit was recognized as a gain in the operating section of the income statement for December 31, 2003. This resulted in a zero value asset retirement cost, a $1 million ARO liability carrying amount in Deferred Credits on our Consolidated Balance Sheet, and a net credit to Other Income and Deductions – Net section of our Consolidated Statement of Income and Comprehensive Income of $3.9 million at December 31, 2003.
The following pro forma financial information has been prepared to give effect to the adoption of SFAS No. 143 as if it had been applied during all periods presented (millions of dollars):
For the Years Ended December 31, | | | 2002 | | | 2001 | |
| | |
| |
| Reported net income | | $ | 160.7 | | $ | 166.2 | |
| Pro forma adjustments to reflect retroactive adoption of SFAS No. 143 | | | (0.7 | ) | | (0.7 | ) |
| | |
| |
| Pro forma net income | | $ | 160.0 | | $ | 165.5 | |
| | |
| |
The following table presents the AROs that would have been included in other deferred credits on our consolidated balance sheets if SFAS No. 143 had been applied during all periods presented (millions of dollars):
For the Years Ended December 31, | | | 2002 | | | 2001 | |
| | |
| |
| Balance, beginning of year | | $ | 5.2 | | $ | 4.6 | |
| Accretion expense | | | 0.6 | | | 0.6 | |
| | |
| |
| Balance, end of year | | $ | 5.8 | | $ | 5.2 | |
| | |
| |
In addition to this liability, we also have potential retirement obligations for the dismantlement of our electric and gas transmission and distribution facilities and natural gas storage facilities. It is our intent to maintain these facilities in a manner such that the facilities will be operational indefinitely. As such, we cannot estimate any potential retirement obligations associated with these assets. At the time we are able to estimate any new asset retirement obligations, liabilities will be recorded in accordance with SFAS No. 143.
SFAS No. 146 In July 2002, the FASB issued SFAS No. 146, “Accounting for Exit or Disposal Activities,” which addresses the recognition, measurement and reporting of costs associated with exit and disposal activities, including restructuring activities that were previously accounted for pursuant to the guidance in EITF Issue 94-3, “Liability Recognition for Certain Employee Termination Benefits and Other Costs to Exit an Activity (including Certain Costs Incurred in a Restructuring).” SFAS No. 146 is effective for exit or disposal activities that are initiated after December 31, 2002. The application of SFAS No. 146 during 2003 did not have a material impact on our financial statements.
SFAS No. 148 In December 2002, the FASB issued SFAS No. 148, “Accounting for Stock-Based Compensation – Transition and Disclosure.” We transitioned to a fair value-based method of accounting for stock-based compensation in the first quarter of 2003 and are using the prospective method of transition as described under SFAS No. 148. For further discussion, please see “Employee Stock Options” above.
SFAS No. 149 In April 2003, the FASB issued SFAS No. 149, “Amendment of SFAS No. 133 on Derivative Instruments and Hedging Activities,” which clarifies and amends various issues related to derivatives and financial instruments addressed in SFAS No. 133 and interpretations issued by the Derivatives Implementation Group. In particular, SFAS No. 149 (1) clarifies when a contract with an initial net investment meets the characteristics of a derivative; (2) clarifies when a derivative contains a financing component that should be recorded as a financing transaction on the balance sheet and the statement of cash flows; (3) amends the definition of an “underlying” in SFAS No. 133 to conform to the language used in FIN No. 45; and (4) clarifies other derivative concepts. SFAS No. 149 is applicable to all contracts entered into or modified after June 30, 2003 and to all hedging relationships designated after June 30, 2003. The adoption of SFAS No. 149 did not have any effect on our financial statements.
SFAS No. 150 In May 2003, the FASB issued SFAS No. 150, “Accounting for Certain Financial Instruments with Characteristics of Both Liabilities and Equity,” which establishes how an issuer classifies and measures certain financial instruments with characteristics of both liabilities and equity. Instruments that have an unconditional obligation requiring the issuer to redeem the instrument by transferring an asset at a specified date are required to be classified as liabilities on the balance sheet. Instruments that require the issuance of a variable number of equity shares by the issuer generally do not have the risks associated with equity instruments and as such should also be classified as liabilities on the balance sheet. SFAS No. 150 was effective for contracts in existence or created or modified for the first interim period beginning after June 15, 2003. The adoption of SFAS No. 150 did not have any impact on our financ ial statements.
FIN No. 45 In November 2002, the FASB issued FIN No. 45, “Guarantor’s Accounting and Disclosure Requirements for Guarantees, Including Indirect Guarantees of Indebtedness of Others.” As required by FIN No. 45, we adopted the disclosure requirements on December 31, 2002. On January 1, 2003, we adopted the initial recognition and measurement provisions for guarantees issued or modified after December 31, 2002. The adoption of the recognition and measurement provisions did not have any impact on our financial statements.
FIN No. 46 In January 2003, the FASB issued FIN No. 46, “Consolidation of Variable Interest Entities - an Interpretation of ARB No. 51.” In December 2003, the FASB issued the updated and final interpretation FIN No. 46R. FIN No. 46R requires that an equity investor in a variable interest entity have significant equity at risk (generally a minimum of 10%, which is an increase from 3% required under previous guidance) and hold a controlling interest, evidenced by voting rights, and absorb a majority of the entity’s expected losses, receive a majority of the entity’s expected returns, or both. If the equity investor is unable to evidence these characteristics, the entity that retains these ownership characteristics will be required to consolidate the variable interest entity as the primary beneficiary. FIN No. 46 was applicable immediately to variable i nterest entities created or obtained after January 31, 2003. While we have not entered into any arrangements in 2003 that would be subject to FIN 46R, entities previously formed are impacted. FIN No. 46R was effective on December 31, 2003 for interests in entities that were previously considered special purpose entities under then existing authoritative guidance.
In 1998, LLC, of which we are the sole owner, established IPSPT, of which it is the sole owner, to issue Transition Funding Notes (“TFN’s”) as allowed under Illinois’ deregulation legislation (“P.A. 90-561”). The proceeds of the TFN’s were used to repurchase debt and equity in order to lower our overall cost of capital. In accordance with P.A. 90-561, we must designate a percentage of the cash received from customer billings to fund payment of the TFN’s. The amounts received are remitted to IPSPT and are restricted for the sole purpose of reducing the outstanding balance of the TFN’s. Prior to FIN No. 46R, we consolidated IPSPT and reflected the obligation to the noteholders on our balance sheet.
IPSPT is a VIE pursuant to FIN No. 46R, as the equity investment is not sufficient to permit the entity to finance its activities without additional subordinated support. P.A. 90-561 states that the utility is liable for the IPSPT Transition Funding Notes in the event the utility does not receive the funds from the ratepayer or remit the funds to the trust, however, under FIN No. 46R the noteholders are considered the primary beneficiaries of the special purpose trust, and our obligation under the notes is to the IPSPT rather than the noteholders. As of December 31, 2003, LLC and IPSPT were no longer consolidated within our financial statements pursuant to the provisions of FIN No. 46R. This change in presentation had no significant impact on our results of operations or financial position as the previous obligation to the noteholders is now reflected as a separate obligation to IPS PT. In accordance with FIN No. 46R, prior periods have not been restated. Therefore, its effects are reflected only in the Consolidated Balance Sheet as of December 31, 2003, with no effect upon the Consolidated Statement of Income and Comprehensive Income or the Consolidated Statement of Cash Flows. See Note 9 – “Long-Term Debt” for additional discussion of the Transitional Funding Trust Notes.
FSP No. 106-1 FSP No. 106-1, Accounting and Disclosure Requirements Related to the Medicare Prescription Drug, Improvement and Modernization Act of 2003 was issued January 12, 2004 and became effective for fiscal years ending after December 7, 2003. FSP No. 106-1 requires additional disclosures
relating to the Medicare Prescription Drug, Improvement and Modernization Act of 2003, which was signed into law on December 8, 2003. We have elected to defer accounting for the Act and the amounts included within the accumulated postretirement benefit obligation (APBO) and net periodic postretirement benefit cost in the financial statements and accompanying notes do no reflect the effects of the Act on our plan. Specific authoritative guidance on the accounting for the federal subsidy is pending and that guidance, when issued, could require us to change previously reported information.
Note 2 - Agreed Sale to Ameren
In February 2004, Dynegy announced that it entered into a $2.3 billion sale agreement with Ameren pursuant to which Ameren will acquire all of our outstanding common and preferred stock owned by Illinova and Dynegy’s 20 percent ownership in the Joppa power generation facility in Joppa, IL. Upon acquiring our company, Ameren will effectively assume our debt of approximately $1.8 billion at closing and Dynegy will receive approximately $400 million in cash, subject to working capital adjustments, with another $100 million being placed in escrow.
In a related agreement that is conditioned upon the closing of the transaction, a Dynegy affiliate has contracted to sell 2,800 megawatts of capacity and up to 11.5 million MWh of energy to us at fixed prices for two years beginning in January 2005. That Dynegy affiliate has also agreed to sell 300 MWs of capacity in 2005 and 150 MWs of capacity in 2006 to us at a fixed price with an option to purchase energy at market-based prices.
In connection with Dynegy's agreement to sell our common and preferred stock to Ameren, the Note Receivable from Affiliate is required to be addressed. Please read Note 4 - "Related Parties" for additional information concerning our Note Receivable from Affilate. Additionally the sale is conditioned upon, among other things, the receipt of approvals from the ICC, the FERC, the SEC and other governmental and regulatory agencies. Pending these approvals, the transaction is expected to close before the end of 2004.
Note 3 - 2001 Reorganization
We implemented a corporate restructuring in November 2001 that affected departments throughout our organization. As part of the restructuring, severance and early retirement costs of $15.3 million ($9.2 million after-tax) were recorded in 2001. Severance charges represented approximately $5.3 million ($3.2 million after-tax) of the total costs incurred, of which $4.5 million had been paid by the end of 2002 as compared to $.2 million by the end of 2001. Adjustments made in 2002 relate to expenses accrued for the 2001 and 2000 severance plans that will not be paid out. These expenses were accrued using the best data available at the time, but upon review, such expenses were not incurred. As of December 31, 2002, 98 employees were either severed or elected early retirement as a result of the restructuring. The severance/retirement plan and related actions were substantially completed by December 31, 2002 and in 2003, the remaining balance of $0.6 million related to the 2001 severance was paid out.
The following table provides the summary of the activity for the liabilities associated with our severance programs (millions of dollars):
| | | | 2003 | | | 2002 | |
| | |
| |
| Balance, beginning of period | | $ | .6 | | $ | 5.4 | |
| Severance: | | | | | | | |
| Adjustments | | | - | | | (1.2 | ) |
| Cash payments | | | (.6 | ) | | (3.6 | ) |
| | |
| |
| Balance, end of period | | $ | - | | $ | .6 | |
| | |
| |
Note 4 - Related Parties
At December 31, 2003, principal outstanding under the Note Receivable from Affiliate approximated $2.3 billion. Due to the prepayments described below, we had no accrued interest at December 31, 2003. At December 31, 2002, principal outstanding under the note receivable approximated $2.3 billion with approximately $14.2 million in accrued interest. We have recognized $170.4 million interest income from Illinova on the note in 2003 and 2002 and $169.9 million in 2001. In July 2003, Dynegy made an interest payment of approximately $100.0 million on its $2.3 billion intercompany note payable to Illinova, which in turn made an interest payment of approximately $100.0 million to us under our Note Receivable from Affiliate. In September, October and December 2003, Dynegy paid to Illinova, which in turn paid us, additional interest payments of approximately $70.9 million, $28.4 million and $56.8 million, respectively. These notes contain substantially similar interest payment provisions pursuant to which semi-annual interest payments of approximately $86 million are due to us under our Note Receivable from Affiliate on April 1 and October 1 of each year. The amounts paid to us in July, September, October and December 2003 represent accrued interest on the notes for the months of April – December 2003 and prepaid interest for the months of January 2004 – September 2004. We have classified nine months of prepaid interest, received as of December 31, 2003, as cash flows from financing activities on our condensed consolidated statement of cash flows. As the interest is earned, it will be reclassified as cash flows from operating activities in the condensed consolidated cash flow statement. In January 2004, we received an additional interest prepayment of $42.6 million.
We have reviewed the collectibility of our Note Receivable from Affiliate to assess whether it has become impaired under the criteria of SFAS No. 114, “Accounting by Creditors for Impairment of a Loan.” Under this standard, a loan is impaired when, based on current information and events, it is “probable” that a creditor will be unable to collect all amounts due according to the contractual terms of the loan agreement. Please see Note 1 - “Summary of Significant Accounting Policies,” above for further discussion as to applicable GAAP requirements regarding impairment of this note. While we believe that our Note Receivable from Affiliate is not impaired and is fully collectible, we continue to review the collectibility of the note on a quarterly basis. Principal payments on our Note Receivable from Affiliate are not required until 2009 when it is due in full; as a result, future events may affect our view as to the collectibility of the remaining principal owed us under the note. It is possible that if negative events affect Dynegy or if we do not receive timely interest payments on our Note Receivable from Affiliate, such matters could cause us to believe it necessary to impair our Note Receivable from Affiliate on our consolidated balance sheet and such action could have a material adverse effect on our financial condition and results of operations. For example, a significant impairment could impact our ability to comply with the financial covenants contained in our Tilton lease agreement and to stay within the utility earnings cap contained in the Illinois Customer Choice Law.
In connection with Dynegy’s agreement to sell our common and preferred stock to Ameren, the Note Receivable from Affiliate is required to be addressed. Pursuant to this requirement, we anticipate that the Note Receivable from Affiliate will be significantly reduced or eliminated from our Consolidated Balance Sheet in exchange for value, in the form of cash and/or other consideration, to be received by us.
We routinely conduct business with other subsidiaries of Dynegy. These transactions include the purchase or sale of electricity, natural gas and transmission services as well as certain other services. Operating revenue derived from transactions with affiliates approximated $28.2 million for 2003, $33.0 million for 2002 and $34.8 million for 2001. Aggregate operating expenses charged by affiliates in 2003 approximated $537.5 million, including $471.7 million for power purchased. Aggregate operating expenses charged by affiliates in 2002 approximated $536.5 million, including $486.4 million for power purchased. Aggregate operating expenses charged by affiliates in 2001 approximated $526.3 million, including $459.7 million for power purchased. Management believes that the methods of allocating costs, where used, are reasonable and related party transactions have been conducted at pric es and terms similar to those available to and transacted with unrelated parties.
We have a PPA with DMG that provides us the right to purchase power from DMG for a primary term extending through December 31, 2004. This right to purchase power qualifies under the normal purchase and sale exemption of SFAS 133 and, therefore, we have accounted for the PPA under the accrual method. The primary term may be extended on an annual basis, subject to concurrence by both parties. The PPA defines the terms and conditions under which DMG provides power and energy to us using a tiered pricing structure. The agreement requires us to compensate the affiliate for capacity charges through 2004 at a total contract cost of $310.8 million. According to the PPA agreement with DMG, we are to provide a security guarantee of $50 million upon a credit downgrade event. This guarantee is being fulfilled by a $50 million guarantee from Dynegy on our behalf. With this arrangement, we believ e we have provided adequate power supply for our expected load plus a reserve supply above that expected level. Should power acquired under this agreement, when combined with our other power purchase agreements, be insufficient to meet our load requirements, we will have to buy power at current market prices. The PPA obligates DMG to provide power up to the reservation amount even if DMG has individual units unavailable at various times.
Please read Note 2 – “Agreed Sale to Ameren” for a discussion of a contingent power purchase agreement with a Dynegy affiliate to provide us power following the closing of the sale to Ameren.
At December 31, 2003, the outstanding balance on our receivable from DMG related to the Tilton lease was approximately $70.7 million, which will be accreted to approximately $81.0 million by September 2004. In 2003, we recognized approximately $4.3 million of interest income from accretion of the receivable. The interest income was offset by corresponding interest expense. Please see Note 5 - “Commitments and Contingencies,” below for further discussion of the Tilton lease.
Effective January 1, 2000, the Dynegy consolidated group, including us, began operating under a Services and Facilities Agreement which was approved by the ICC, whereby other Dynegy affiliates exchange services with us such as financial, legal, information technology and human resources as well as shared facility space. Our services are exchanged at fully distributed costs and revenue is not recorded under this agreement. Management believes that the allocation method utilized under this agreement is reasonable and amounts charged under this agreement would result in costs to us similar to costs we would have incurred for these services on a stand-alone basis.
On October 23, 2002, the ICC issued an order approving a petition submitted by us to enter into an agreement with Dynegy and its affiliates that would allow for certain payments due to Dynegy under the Services and Facilities Agreement to be netted against certain payments due to us from Dynegy, should Dynegy or its affiliates fail to make payments due to us on or before their due dates. However, the PPA with DMG is specifically exempted from this agreement. The agreement also allows Dynegy to net payments in the event we fail to make our required payments to Dynegy. Additionally, under the terms of this petition and the ICC’s approval, we will not pay any common dividend to Dynegy or its affiliates until our first mortgage bonds are rated investment grade by Moody’s Investors Service and Standard & Poor’s Rating Service and specific approval is obtained from the ICC.
Our financial statements include related-party transactions with IPSPT, our wholly-owned unconsolidated subsidiary, as reflected in the table below.
| |
| | | 12/31/03(1) | | | 12/31/02 | |
| |
| | | | | | | | |
| Investment in IPSPT | | $ | 4.3 | | $ | - | |
| Receivable from IPSPT (noncurrent) | | $ | 2.2 | | $ | - | |
| Long-term debt to IPSPT (including due within one year)(2) | | $ | 419.9 | | $ | - | |
| (1) | Effective December 31, 2003, IPSPT was deconsolidated from our financial statements in conjunction with the adoption of FIN No. 46R. |
| (2) | Due to the adoption of FIN No. 46R and resulting deconsolidation of IPSPT, certain amounts, including restricted cash, are netted against the current portion of our long-term debt payable to IPSPT on our December 31, 2003 consolidated balance sheet. |
Note 5 - Commitments and Contingencies
Commitments We have contracts on six interstate pipelines for firm transportation and storage services for natural gas. These contracts have varying expiration dates ranging from 2004 to 2012, for a total cost of $66.0 million. We also enter into obligations for the reservation of natural gas supply. These obligations generally range in duration from one to twelve months and require us to reimburse capacity charges. The cost of the agreements is $38.7 million. Total natural gas purchased was approximately $320 million in 2003, $236 million in 2002 and $296 million in 2001. We anticipate that all gas-related costs will be recoverable under our UGAC.
Utility Earnings Cap P.A. 90-561 contains floor and ceiling provisions applicable to our ROE during the mandatory transition period ending in 2006. Pursuant to the provisions in the legislation, we may request an increase in our base rates if the two-year average of our earned ROE is below the two-year average of the Treasury Yield for the concurrent period. Conversely, we are required to refund amounts to our customers equal to 50% of the value earned above a defined “ceiling limit.” The ceiling limit is exceeded if our two-year average ROE exceeds the Treasury Yield, plus 8.5% in 2002 through 2006. In December 2002, we filed to increase the add-on to the Treasury Yield from 6.5% to 8.5%. Consequently, we may not request the collection of transition charges in 2007 and 2008. Regulatory asset amortization is included in the calculation of the ROE for the ceili ng test but is not included in the calculation of the ROE for the floor test. Prior to February 2002, the ROE test was based on the two-year average of the monthly average yields of 30-year U.S. Treasury Bonds. During 2003 and 2002, our two-year average ROE was within the allowable ROE collar.
Legal and Environmental Matters
We are involved in legal or administrative proceedings before various courts and agencies with respect to matters occurring in the ordinary course of business. Management believes that appropriate reserves have been recorded and that the final disposition of these proceedings will not have a material adverse effect on our consolidated financial position or results of operations.
As of December 31, 2003, forty-five lawsuits were pending against us for illnesses based on alleged exposure to asbestos at generation facilities previously owned by us. Thirty-five asbestos lawsuits were served on us during 2003, with seven of these served subsequent to September 30, 2003. We were dismissed, without prejudice, from two lawsuits during 2003. We intend to vigorously defend against the remaining pending lawsuits. Although, we have recorded a reserve with respect to the pending lawsuits however, we do not expect the outcome of any such lawsuits to have a material effect upon our results of operations.
Trans-Elect Litigation In October 2003, Trans-Elect, Inc. and Illinois Electric Transmission Company, LLC, filed suit against us in the Northern District of Illinois requesting specific performance and estoppel, and claiming damages as a result of breach of contract and lost profits. These causes of action allegedly arise from our termination of an asset purchase and sale agreement entered into by the parties in October 2002. Under the terms of the agreement, we agreed to sell our transmission assets to Trans-Elect if, on or before July 7, 2003, the agreement received the required FERC, ICC, SEC and Hart-Scott Rodino approvals. As of July 7, 2003, the agreement had not been approved by, among other entities, the FERC and, as a result, we terminated the agreement in accordance with its terms on July 8, 2003. Trans-Elect claims that we breached the agreement by failing to use our “best efforts” to obtain the required approvals and/or to negotiate an alternate agreement that could be approved. Trial has been scheduled in this matter for January 2005.
We deny these claims, in that we believe we complied with the terms of the agreement, and intend to defend against them vigorously. We cannot predict with certainty whether we will incur any liability or estimate the damages, if any, that might be incurred in connection with this lawsuit. However, we do not believe that any liability we might incur as a result of this litigation would have a material adverse effect on our financial condition or results of operations. Additionally, Dynegy has retained this liability in connection with its
proposed sale of our company to Ameren and does not expect that the outcome will negatively impact its ability to close the sale.
Kemerer v. Illinois Power Company This case was brought by the wife of a man who died in 2002 when he backed his aluminum ladder into overhead power lines and was electrocuted. In the lawsuit, the plaintiff sought to recover on three counts-wrongful death (including lost wages and pain and suffering), negligent infliction of emotional distress and punitive damages. The case was tried to a jury in February 2004, which found for the plaintiff and awarded approximately $1.6 million in actual damages and $3 million in punitive damages. We believe that we have reasonable grounds to appeal the jury’s decision and we intend to pursue an appeal vigorously.
U.S. Environmental Protection Agency Complaint IP and DMG, collectively referred to in this section as the Defendants, are currently the subject of an NOV from the EPA and a complaint filed by the EPA and the Department of Justice alleging violations of the Clean Air Act and certain federal and Illinois regulations adopted under the Clean Air Act. Similar notices and complaints were filed against other owners of coal-fired power plants in what we refer to as the Utility Enforcement Initiative. Both the NOV and the complaint allege that certain equipment repairs, replacements and maintenance activities at the Defendants’ three Baldwin Station generating units constituted “major modifications” under the Prevention of Significant Deterioration (“PSD”), the New Source Performance Standard (“NSPS”) regulations and the applicable Illinois re gulations, and that the Defendants failed to obtain required operating permits under the applicable Illinois regulations. When activities that meet the definition of “major modifications” occur and are not otherwise exempt, the Clean Air Act and related regulations generally require that the generating facilities at which such activities occur meet more stringent emissions standards, which may entail the installation of potentially costly pollution control equipment.
DMG has significantly reduced emissions at the Baldwin Station since the 1999 complaint by converting the Baldwin Station from high to low sulfur coal, resulting in sulfur dioxide emission reductions of over 90% from 1999 levels, and installing selective catalytic reduction equipment at two of the three units at Baldwin Station, resulting in significant emission reductions of nitrogen oxides. However, the EPA may seek to require the installation of the “best available control technology,” or the equivalent, at the Baldwin Station, which we estimate could require capital expenditures of up to $410 million. The EPA also has the authority to seek penalties for the alleged violations at the rate of up to $27,500 per day for each violation.
In February 2003, the Court granted our motion for partial summary judgment based on the five-year statute of limitations. As a result, the EPA is not permitted to seek any monetary civil penalties for claims related to construction without a permit under the PSD regulations. The Court’s ruling also precludes monetary civil penalties for a portion of the claims under the NSPS regulations and the applicable Illinois regulations. We believe that we have meritorious defenses against the remaining claims and vigorously defended against them at trial. The trial to resolve claims of liability began in June 2003 and closing arguments occurred in September 2003. Shortly after closing arguments, several interveners were granted the right to file briefs in support of arguments they believe the United States has ceased to pursue. The judge indicated at the end of the trial that he intende d to issue a liability decision before the end of 2003. However, delays in post-trial briefing and associated with the intervention have postponed the issuance of the liability order. Dynegy has recorded a reserve in an amount considered reasonable for potential penalties that could be imposed if the Court finds us liable and the EPA prosecutes successfully the remaining claims for penalties.
In August 2003 two significant decisions were handed down in other cases that are part of the Utility Enforcement Initiative. InUnited States v. Ohio Edison , the Court found the defendant liable for violations of the Clean Air Act and applied the EPA’s narrow interpretation of the “routine maintenance, repair and replacement” exclusion, which defines it with respect to what is routine for the specific unit where the projects occurred. InUnited States v. Duke Energy Company , however, the Court rejected the EPA’s narrow interpretation, holding that the exclusion should be defined relative to what is routine for the particular industry, not what is routine for the particular unit at issue. TheDuke case also held that the government bears the burden of proof on the issue of whether a particular project is routine.
Also in August 2003, the EPA issued a new rule, the “Equipment Replacement Provision of the Routine Maintenance, Repair and Replacement Exclusion,” which was scheduled to go into effect in December 2003. Several northeastern states and environmental groups challenged the new rule by filing an appeal. Prior to its effective date, the Court stayed the effect of the new rule pending a ruling on the appeal. The new rule, if sustained, would provide that the replacement of components of a process unit with identical components (or their functional equivalents) will fall within the scope of the routine maintenance, repair and replacement exclusion if (i) the replacement cost is less than 20% of the total cost of replacing the unit, (ii) the replacement does not alter the unit’s basic design and (iii) the unit will continue to comply with applicable emission and operational standards.
None of the Defendants’ other facilities are covered in the complaint and NOV, but the EPA previously requested information, which has been provided, concerning activities at the Defendants’ Vermilion, Wood River and Hennepin plants. The EPA could eventually commence enforcement actions based on activities at these plants, although the uncertainty surrounding the new rule makes it difficult to assess the likelihood of additional EPA enforcement actions.
Manufactured-Gas Plants In the early 1900s, we operated two dozen sites at which synthetic natural gas was manufactured from coal. Operation of these MGP sites was generally discontinued in the 1950s when natural gas became available from interstate gas transmission pipelines. Many of these MGP sites were contaminated with residues from the gas manufacturing process. The Illinois EPA has issued No Further Remediation Letters for two of our MGP sites. Although we estimate our liability for MGP site remediation to be approximately $48 million for our remaining 22 MGP sites, because of the unknown and unique characteristics at each site, we cannot be certain of our ultimate liability for remediation of the sites. In October 1995, we initiated litigation against a number of our insurance carriers. Settlement proceeds recovered from these carriers offset a portion of the est imated MGP remediation costs and are credited to customers through the tariff rider mechanism that the ICC previously approved. Cleanup costs in excess of insurance proceeds are considered probable of recovery from our electric and gas customers, based upon ICC Docket 91-0085.
P.A. 90-561 – ISO Participation Participation in an ISO or RTO by utilities serving retail customers in Illinois was one of the requirements included in P.A. 90-561 and P.A. 92-12.
In January 1998, we, in conjunction with eight other transmission-owning entities, filed with the FERC for all approvals necessary to create and to implement the MISO. On May 8, 2001, the FERC issued an order approving a settlement that allowed Illinois Power to withdraw from the MISO.
In November 2001, we and seven of the transmission owners proposing to form the Alliance RTO filed definitive agreements with the FERC for approval whereby National Grid would serve as the Alliance RTO’s managing member. In an order issued in December 2001, the FERC stated that it could not approve the Alliance RTO, and the FERC directed the Alliance companies to file a statement of their plans to join an RTO, including the timeframe, within 60 days of December 20, 2001.
In May 2002, we submitted a letter to the FERC indicating that we would join PJM either as an individual transmission owner or as part of an independent transmission company. In July 2002, the FERC issued an order approving our proposal to join PJM, subject to certain conditions. These conditions include requirements, among others, that (i) the parties negotiate and implement a rate design that will eliminate rate pancaking between PJM and the MISO, (ii) the North American Electric Reliability Council oversee the reliability plans for the MISO and PJM, and (iii) PJM and MISO develop a joint operation agreement to deal with seams issues. In addition, the FERC initiated an investigation under Federal Power Act section 206 of the MISO, PJM West and PJM’s transmission rates for through and out service and revenue distribution. Subsequent to the July 31 order, the parties were unabl e to negotiate a rate design that would eliminate rate pancaking between PJM and the MISO and the FERC ordered a hearing on this matter.
In orders issued in November 2003, December 2003 and February 2004, the FERC directed the transmission providers, including us, to eliminate the charge for through and out transmission service as applied to requests made on or after November 17, 2003, for service that commences on or after May 1, 2004, when the power being delivered over our transmission system ultimately serves load in the region comprised of PJM, the MISO, AEP, Ameren, Dayton P&L, ComEd or IP. The revenues lost due to the elimination of this charge can be recovered from the loads that benefit by the elimination of such charge via a “lost revenue recovery mechanism.” This proceeding is ongoing and includes a period of settlement discussions mandated by the FERC. We submitted the first of two required compliance filings in January 2004 and have a second required compliance filing due in April 2004. The FERC’s decision in this proceeding is subject to requests for rehearing and appeal.
The Customer Choice Law requires us to participate in an RTO. Ultimately, any decision we make regarding which RTO to join will be subject to review and approval by the FERC. For several months prior to the execution of the purchase agreement with Ameren, we had suspended our efforts to join an RTO in light of the possible sale. Pursuant to the purchase agreement, we agreed to submit, within 90 days following the purchase date, an application to join the MISO. The timely submission of this application is a condition to the closing of the sale and the application will be conditioned on FERC approval of the sale.
Other
Electric and Magnetic Fields The possibility that exposure to EMFs emanating from power lines, household appliances and other electric sources may result in adverse health effects continues to be the subject of governmental, medical and media attention. Two major scientific studies concluded in 1999 failed to demonstrate significant EMF health risk; however, a definitive conclusion may never be reached on this topic, and future impacts are unpredictable. Therefore, we continue to compile the latest research information on this topic. At the same time, we conduct EMF monitoring in the field when customers express a concern.
Accounts Receivable We sell electric energy and natural gas to residential, commercial and industrial customers throughout Illinois. At December 31, 2003, 58%, 33% and 9% of “Accounts Receivable - Service” were from residential, commercial and industrial customers, respectively. At December 31, 2002, 56%, 31% and 13% of “Accounts Receivable - Service” were from residential, commercial and industrial customers, respectively. We maintain reserves for potential credit losses and such losses have been within management's expectations. The allowance for doubtful accounts remained at $5.5 million in 2003 and 2002.
Operating Leases Minimum commitments in connection with operating leases at December 31, 2003 were as follows: 2004 - $1.7 million, 2005 - $1.5 million, 2006 - $1.4 million, 2007 - $1.2 million, 2008 - $1.2; and thereafter $2.7 million. These operating lease payments primarily relate to our material distribution facility, which is a commercial property lease for our storage warehouse, the Tilton land lease and the lease on 15 line trucks. Rent expense was approximately $5.7 million, $7.3 million and $6.8 million for the years ended December 31, 2003, 2002 and 2001, respectively.
Capital Leases An off-balance sheet operating lease for four gas turbines located in Tilton, Illinois was reclassified as a capital lease pursuant to our exercise of a purchase option in September 2003. The turbine assets are sublet to DMG and we are the capital sublessor. Based upon an independent appraisal, we recorded a receivable from DMG at the fair market value of $66.4 million, which is offset by a corresponding liability to the original lessor. The receivable from DMG and payable to the original lessor will be accreted to the $81 million purchase obligation over the next 9 months using the straight line method. The accretion recorded for 2003 was approximately $4.3 million and was recorded as interest income offset by the same amount of interest expense. The accretion to be recorded in 2004 will be approximately $10.3 million. The net effect on our income statem ent will be zero. As a result, we no longer have any off-balance sheet financing arrangements.
Underground Storage We continuously monitor the operating efficiencies of our underground gas storage fields. In 1999, we reduced the capacity of our working gas in the Hillsboro gas storage field from 7.6 Bcf to 4.0 Bcf, based on results from an engineering study and the annual operating results of the field, thereby increasing the base gas inventory. During 2003, we initiated further engineering studies; should further
adjustments be made based on such studies, any adjustments to inventory would be expected to be recovered from our customers through the purchase gas adjustment clause, subject to ICC prudency review.
Note 6 - Liquidity
We have a significant amount of indebtedness, including quarterly payments of approximately $21.6 million due on the IPSPT transitional funding trust notes through 2008.
Due to our non-investment grade credit ratings and other factors, we do not have access to the commercial paper markets, and our access to the capital markets is limited. These factors, along with the level of our indebtedness and the fact that we do not currently have a revolving credit facility, will have several important effects on our future operations. First, a significant portion of our cash flows will be dedicated to the payment of principal and interest on our outstanding indebtedness, including the increased interest expense associated with our December 2002 $550 million Mortgage bond financing, and will not be available for other purposes. Second, our ability to obtain additional financing for working capital, capital expenditures, general corporate and other purposes is limited.
For the near term, our debt maturities primarily comprise (i) quarterly payments on the IPSPT transitional funding trust notes, for which we receive a separate revenue stream from our customers; and (ii) an $81 million payment on our Tilton lease in September 2004, which we expect to receive from DMG under the sublease agreement. We believe that we have sufficient internal liquidity sources, including Dynegy’s commitment of support, to satisfy these debt maturities and our commercial obligations for the next twelve months. Because we have no revolving credit facility and no access to the commercial paper markets, we rely on cash on hand, cash flows from operations and interest payments under our $2.3 billion Note Receivable from Affiliate to satisfy our debt obligations and to otherwise operate our business. Importantly, while Dynegy’s restructured credit facility, which expires in February 2005, prohibits it from prepaying more than $200 million in princi pal under our Note Receivable from Affiliate during the term of the credit agreement, it does not limit Dynegy’s ability to prepay interest under our Note Receivable from Affiliate. In addition, the indenture governing Dynegy Holdings Inc.’s second priority senior secured notes permits payments of principal on the intercompany note receivable up to $450 million or to the extent that a fixed charge coverage ratio of 2:1 is satisfied. The indenture also permits the prepayment of interest on the intercompany note receivable up to twelve months at any one time.
Over the longer term, our liquidity and capital resources will be materially affected by the outcome of the pending sale of our company to Ameren. If the sale is consummated, Ameren has committed to contribute cash to us in order to support our ongoing operating commitments and to reduce our leverage. If the sale is not consummated, we would explore other liquidity initiatives. These initiatives would include an integration of many processes into those of Dynegy’s, which we expect would yield significant cost savings. Another liquidity initiative could include an issuance of mortgage bonds or transitional funding trust notes. Based on our December 31, 2003 financial statements, we could issue approximately $709 million in mortgage bonds under our 1992 Mortgage. Until December 31, 2004, we also have the ability to cause the issuance by IPSPT, subject to ICC approval, of up to $864 million in additional transitional funding trust notes pursuant to the Illinois El ectric Utility Transitional Funding Law. However, under the supplemental indenture we executed in connection with the issuance of our 11 1/2% Mortgage bonds due 2010, we could be required to redeem these bonds if we were to cause the issuance of more than $300 million of transitional funding trust notes.
Our ability to consummate other liquidity initiatives, as described above, is subject to a number of risks. The outcome of the agreed sale to Ameren is also subject to a number of risks. These risks include, among others, the receipt of required regulatory approvals, particularly from the ICC, and satisfaction of other closing conditions. We encourage you to read Dynegy’s Annual Report on Form 10-K for the year ended December 31, 2003 for additional information regarding Dynegy and its current liquidity position.
Note 7 - Revolving Credit Facilities and Short-Term Loans
On May 2, 2003, we paid the remaining balance of $100 million outstanding on our $300 million one-year term loan. In December 2002, we paid $200 million to reduce this term loan to $100 million. On May 17, 2002, we exercised the “term-out” provision contained in our $300 million 364-day revolving credit facility, which was scheduled to mature on May 20, 2002. In connection with this conversion, we borrowed the remaining $60 million available under this facility. The exercise of the “term-out” provision converted the facility to a one-year term loan that matured in May 2003. The interest rate on borrowings under the short term loan agreement was generally at a Eurodollar rate plus a margin that was determined based on our senior unsecured long-term debt rating. If greater than 25% of the aggregate commitment was utilized, this margin was increased by .125%. We pai d facility fees of .25%on the outstanding balance of our short term loan agreement.
At December 31, 2003 and December 31, 2002, we had no commercial paper outstanding.
We have been requested to provide letters of credit or other credit security to support certain business transactions, including our purchase of natural gas and natural gas transportation. As of December 31, 2003 and December 31, 2002, Dynegy posted $26 million and $29 million, respectively, in collateral and letters of credit in support of these transactions. In addition, at December 31, 2003, Dynegy had assigned $12 million to us as our share of the total collateral it has been required to post as security for insurance deductibles.
The following table summarizes our short-term borrowing activity and relevant interest rates for the years ended December 31:
| |
(Millions of dollars, except rates) | | | 2003 | | | 2002 | |
| |
| Short-term borrowings at December 31, | | $ | - | | $ | 100.0 | |
| Weighted average interest rate at December 31, | | | 0.0 | % | | 2.7 | % |
| Maximum amount outstanding at any month end | | $ | 100.0 | | $ | 300.0 | |
| Average daily borrowings outstanding during the year | | $ | 33.2 | | $ | 276.8 | |
| Weighted average interest rate during the year | | | 2.6 | % | | 2.8 | % |
Note 8 - Income Taxes | | | |
| | | | |
| Deferred tax assets and liabilities were comprised of the following: | |
| | | | |
(Millions of dollars) | |
| |
| Balances as of December 31, | | | 2003 | | | 2002 | |
| |
| | | | | | | | |
| Deferred tax assets | | | | | | | |
| |
Current - | | |
| Miscellaneous book/tax recognition differences | | $ | 22.1 | | $ | 20.4 | |
| |
| | | | | | | | |
| Noncurrent - | | | | | | | |
| Depreciation and other property related | | | 47.9 | | | 45.7 | |
| Unamortized investment tax credit | | | 11.1 | | | 11.8 | |
| Miscellaneous book/tax recognition differences | | | 40.0 | | | 45.6 | |
| Minimum pension funding liability | | | 6.3 | | | 8.8 | |
| |
| | | | 105.3 | | | 111.9 | |
| |
| | | | | | | | |
| Total deferred tax assets | | $ | 127.4 | | $ | 132.3 | |
| |
| | | | | | | | |
| Deferred tax liabilities | | | | | | | |
| |
| | | | | | | | |
| Current - | | | | | | | |
| Miscellaneous book/tax recognition differences | | $ | 4.5 | | $ | 3.2 | |
| |
| | | | | | | | |
| Noncurrent - | | | | | | | |
| Depreciation and other property related | | | 1,044.1 | | | 1,059.2 | |
| Miscellaneous book/tax recognition differences | | | 72.2 | | | 90.9 | |
| |
| | | | 1,116.3 | | | 1,150.1 | |
| |
| | | | | | | | |
| Total deferred tax liabilities | | $ | 1,120.8 | | $ | 1,153.3 | |
| |
| Income taxes included in net income in the Consolidated Statements of Income and Comprehensive Income consist of the following components: |
| | | | |
(Millionsof dollars) | |
| |
| Years Ended December 31, | | | 2003 | | | 2002 | | | 2001 | |
| |
| | | | | | | | | | | |
| Current taxes - | | | | | | | | | | |
| | | | | | | | | | | |
| Included in operating | | | | | | | | | | |
| expenses and taxes | | $ | (0.6 | ) | $ | 15.5 | | $ | 15.9 | |
| Included in other income | | | | | | | | | | |
| and deductions | | | 101.4 | | | 124.0 | | | 129.8 | |
| |
| | | | | | | | | | | |
| Total current taxes | | | 100.8 | | | 139.5 | | | 145.7 | |
| |
| | | | | | | | | | | |
| Deferred taxes - | | | | | | | | | | |
| | | | | | | | | | | |
| Included in operating | | | | | | | | | | |
| expenses and taxes | | | | | | | | | | |
| Property related differences | | | 25.7 | | | 20.3 | | | 7.8 | |
| Alternative minimum tax | | | - | | | 15.8 | | | 35.1 | |
| Gain/loss on reacquired debt | | | (1.9 | ) | | (0.7 | ) | | 3.5 | |
| Clinton power purchase agreement costs | | | 12.1 | | | 11.0 | | | 12.1 | |
| Transition period cost recovery | | | (15.3 | ) | | (28.0 | ) | | (18.8 | ) |
| Uniform gas adjustment clause | | | 1.6 | | | 1.5 | | | (14.6 | ) |
| Miscellaneous book/tax recognition differences | | | (9.1 | ) | | (1.1 | ) | | 0.5 | |
| Pension expense/funding | | | 1.3 | | | 6.4 | | | - | |
| | | | | | | | | | | |
| Included in other income | | | | | | | | | | |
| and deductions - net | | | | | | | | | | |
| Property related differences | | | (40.5 | ) | | (58.2 | ) | | (57.3 | ) |
| Miscellaneous book/tax recognition differences | | | 2.7 | | | (0.9 | ) | | 4.1 | |
| | | | | | | | | | | |
| Included in cumulative effect of change in | | | | | | | | | | |
| accounting principle | | | | | | | | | | |
| Asset retirement obligation | | | (1.6 | ) | | - | | | - | |
| |
| | | | | | | | | | | |
| Total deferred taxes | | | (25.0 | ) | | (33.9 | ) | | (27.6 | ) |
| |
| | | | | | | | | | | |
| Deferred investment tax credit - net | | | | | | | | | | |
| Included in operating expenses and taxes | | | (1.4 | ) | | (1.4 | ) | | (0.9 | ) |
| |
| | | | | | | | | | | |
| Total income taxes | | $ | 74.4 | | $ | 104.2 | | $ | 117.2 | |
| |
| Note: For the years ended December 31, 2003, 2002 and 2001, income tax expenses in the amount of $63.6 million, $64.9 million and $76.6 million, respectively, are reported in Miscellaneous-Net, and for the year ended December 31, 2003, $(1.6) million is reported in Cumulative Effect of Change in Accounting Principle in the accompanying Consolidated Statements of Income and Comprehensive Income. Other tax expenses for the years ended December 31, 2003, 2002 and 2001 are reported as separate components on the accompanying Consolidated Statements of Income and Comprehensive Income. |
| The reconciliations of income tax expense to amounts computed by applying the statutory tax rate to reported pretax income from continuing operations for the period are as follows: |
| | | | | |
| | | | | | | | | | (Millions of dollars) | |
| |
| Years Ended December 31, | | | 2003 | | | 2002 | | | 2001 | |
| |
| | | | | | | | | | | |
| Income tax expense at the | | | | | | | | | | |
| federal statutory tax rate | | $ | 67.0 | | $ | 92.7 | | $ | 99.2 | |
| Increases / (decreases) in taxes | | | | | | | | | | |
| resulting from - | | | | | | | | | | |
| State taxes, net of federal effect | | | 9.1 | | | 12.3 | | | 13.2 | |
| Investment tax credit amortization | | | (1.4 | ) | | (1.4 | ) | | (0.9 | ) |
| Depreciation not normalized | | | 3.9 | | | 3.4 | | | 4.4 | |
| Interest expense on preferred securities | | | - | | | - | | | (2.4 | ) |
| Other - net | | | (4.2 | ) | | (2.8 | ) | | 3.7 | |
| | | | | | | | | | | |
| |
| Total income taxes from continuing operations | | $ | 74.4 | | $ | 104.2 | | $ | 117.2 | |
| |
Combined federal and state effective income tax rates were 38.9%, 39.3% and 41.4% for the years 2003, 2002 and 2001, respectively.
We are included in the consolidated federal income tax and unitary state tax returns of Dynegy. Under our Services and Facilities Agreement with Dynegy, we calculate our own tax liability under the separate return approach and reimburse Dynegy for such amount.
We are subject to the Alternative Minimum Tax and have utilized the remaining Alternative Minimum Tax credit carryforward at December 31, 2002.
Note 9 - Long-Term Debt | | | | | |
| | | |
| | | | | | (Millions of dollars) |
| |
| December 31, | | | | | 2003 | | 2002 | |
| |
| | | | | | | Carrying | | | Fair | | | Carrying | | | Fair | |
| | | | | | | Value | | | Value | | | Value | | | Value | |
| | | | | |
| |
| |
| Mortgage bonds-- | | | | | | |
| 6.0% series due 2003 | | | | | $ | - | | $ | - | | $ | 90.0 | | $ | 86.7 | |
| 6 1/2% series due 2003 | | | | | | - | | | - | | | 100.0 | | | 96.7 | |
| 6 3/4% series due 2005 | | | | | | 70.0 | | | 71.6 | | | 70.0 | | | 66.4 | |
| 7.5% series due 2009 | | | | | | 250.0 | | | 275.8 | | | 250.0 | | | 215.0 | |
| 5.70% series due 2024 (Pollution Control Series U) | | | | | | 35.6 | | | 36.0 | | | 35.6 | | | 36.2 | |
| 7.40% series due 2024 (Pollution Control Series V) | | | | | | 84.1 | | | 93.5 | | | 84.1 | | | 88.4 | |
| 7 1/2% series due 2025 | | | | | | 65.6 | | | 67.4 | | | 65.6 | | | 51.7 | |
| 5.40% series due 2028 (Pollution Control Series S) | | | | | | 18.7 | | | 18.4 | | | 18.7 | | | 18.7 | |
| 5.40% series due 2028 (Pollution Control Series T) | | | | | | 33.8 | | | 33.3 | | | 33.8 | | | 33.8 | |
| 11 1/2% series due 2010 | | | | | | 550.0 | | | 660.0 | | | 400.0 | | | 388.0 | |
| Adjustable rate series due 2032 | | | | | | | | | | | | | | | | |
| (Pollution Control Series P, Q, and R) | | | | | | 150.0 | | | 150.0 | | | 150.0 | | | 150.0 | |
| Adjustable rate series due 2028 (Series W) | | | | | | 111.8 | | | 111.8 | | | 111.8 | | | 111.8 | |
| Adjustable rate series due 2017 (Series X) | | | | | | 75.0 | | | 75.0 | | | 75.0 | | | 75.0 | |
| | | | | |
| |
| |
| Total mortgage bonds | | | | | | 1,444.6 | | | 1,592.8 | | | 1,484.6 | | | 1,418.4 | |
| | | | | |
| |
| |
| IPSPT Transitional Funding Trust Notes-- | | | | | | | | | | | | | | | | |
| 5.34% due 2003 | | | | | | - | | | - | | | 29.4 | | | 29.6 | |
| 5.38% due 2005 | | | | | | - | | | - | | | 175.0 | | | 178.4 | |
| 5.54% due 2007 | | | | | | - | | | - | | | 175.0 | | | 181.6 | |
| 5.65% due 2008 | | | | | | - | | | - | | | 139.0 | | | 152.8 | |
| | | | | |
| |
| |
| Total transitional funding trust notes | | | | | | - | | | - | | | 518.4 | | | 542.4 | |
| | | | | |
| |
| |
| Obligations for Tilton Capital Lease | | | | | | 70.7 | | | 70.7 | | | - | | | - | |
| | | | | |
| |
| |
| | | | | | | 1,515.3 | | $ | 1,663.5 | | | 2,003.0 | | $ | 1,960.8 | |
| | | | | |
| |
| |
| |
| |
| Adjustment to fair value | | | | | | 8.1 | | | | | | 8.7 | | | | |
| Unamortized discount on debt | | | | | | (18.1 | ) | | | | | (16.5 | ) | | | |
| | | | | |
| | | | |
| | | | |
| | | | | | | 1,505.3 | | | | | | 1,995.2 | | | | |
| Long-term debt and capital leases maturing within one year | | | | | | (70.7 | ) | | | | | (276.4 | ) | | | |
| | | | | |
| | | | |
| | | | |
| Total long-term debt | | | | | $ | 1,434.6 | | | | | $ | 1,718.8 | | | | |
| | | | | |
| | | | |
| | | | |
| | | | | | | | | | | | | | | | | |
| Long-term debt payable to IPSPT | | | | | | | | | | | | | | | | |
| 5.38% due 2005 | | | | | $ | 105.9 | | $ | 109.4 | | $ | - | | $ | - | |
| 5.54% due 2007 | | | | | | 175.0 | | | 182.6 | | | - | | | - | |
| 5.65% due 2008 | | | | | | 139.0 | | | 148.5 | | | - | | | - | |
| | | | | |
| |
| |
| Total long-term debt payable to IPSPT | | | | | | 419.9 | | $ | 440.5 | | | - | | $ | - | |
| | | | | | | | |
| | | | |
| |
| Long-term debt payable to IPSPT maturing within one year | | | | | | (74.3 | ) | | | | | - | | | | |
| | | | | |
| | | | |
| | | | |
| Total long-term debt payable to IPSPT | | | | | $ | 345.6 | | | | | $ | - | | | | |
| | | | | |
| | | | |
| | | | |
In the above table, the “adjustment to fair value” is the total adjustment of debt to fair value as a result of our 1998 quasi-reorganization. The quasi-reorganization was a process whereby our consolidated accumulated deficit in retained earnings at December 31, 1998 was eliminated by the adjustment to fair market value of certain assets and liabilities and a transfer from common stock equity. The adjustment to the fair value of each debt series is being amortized over its respective remaining life to interest expense.
In the above table, the fair value of our long-term debt is estimated based on the quoted market prices for similar issues or by discounting expected cash flows at the rates currently offered to us for debt of the same remaining maturities, as advised by our bankers.
We had one standby bond purchase facility in the aggregate amount of $151.7 million that provided credit enhancement for $150 million of Illinois Development Finance Authority (“IDFA”) 1997 Series A, B and C bonds (the “Pollution Control Bonds”), along with one month’s interest of approximately $1.7 million, for which our Pollution Control Series P, Q and R mortgage bonds were issued without coupon and pledged to secure payment on the Pollution Control Bonds. On April 9, 2002, the related indenture was amended to incorporate an additional interest rate setting mechanism, the auction rate mode. After the indenture was amended, the Pollution Control Bonds were reissued without further change. The auction rate mode did not require the use of a standby purchase facility, allowing the standby bond purchase facility to expire without consequence.
Our $100 million and $90 million Mortgage bonds, which matured August 1, 2003 and September 15, 2003, respectively, were redeemed using prepaid interest under our Note Receivable from Affiliate, as further discussed above, and the remaining proceeds from our December 2002 Mortgage bond offering.
Our $95.7 million Mortgage bonds, which matured on July 15, 2002, were redeemed using prepaid interest on our Note Receivable from Affiliate and working capital proceeds.
On December 20, 2002, we sold $550 million of 11 1/2% Mortgage bonds due 2010 in a private offering. Of the $550 million, we issued $400 million in December 2002, with $150 million issued on a delayed delivery basis subject to ICC approval, which we received in January 2003. The mortgage bonds were sold at a discounted price of $97.48 to yield an effective rate of 12%. We realized net cash proceeds of approximately $380 million in December 2002 and approximately $142.5 million in January 2003 from this offering. We used a portion of the proceeds from the issuance to replenish the liquidity used to repay the $95.7 million 6.25% Mortgage bonds on July 15, 2002. Also, we used a portion of the proceeds to satisfy our $300 million due under our short term loan, which was due May 2003, of which we paid $200 million in December 2002 and $100 million in May 2003.
The 11 1/2% Mortgage bonds due 2010 contain triggering events that could require us to redeem the bonds if we take certain actions, including the payment of certain dividends and investments in areas outside of our normal utility operations, the redemption of equity or subordinated debt, the incurrence of further debt beyond that needed for refunding purposes, the issuance of preferred stock, and the incurrence of certain liens. We also agreed, pursuant to a registration rights agreement, to affect an exchange offer or to otherwise provide the purchasers of these mortgage bonds with an equivalent amount of registered mortgage bonds.
On July 11, 2003, we commenced an exchange offer, pursuant to which we offered to exchange up to $550 million of outstanding 11 1/2% Mortgage Bonds due 2010, or Outstanding Bonds, for a new series of our 11 1/2% Mortgage Bonds due 2010, or New Bonds, with substantially the same terms as the Outstanding Bonds, including the same principal amount, interest rate, redemption terms and payment and maturity dates, which were registered under the Securities Act. The exchange offer, which was initially scheduled to expire on August 11, 2003, was extended until August 25, 2003 and was completed on August 28, 2003.
In addition to the quarterly payments on the IPSPT transitional funding trust notes (the “Notes”), we have long-term debt maturities for the years 2004 through 2008, of $70 million in the first quarter of 2005.
In December 1998, the IPSPT issued $864 million of the Notes as allowed under the Illinois Electric Utility Transition Funding Law in P.A. 90-561. As of December 31, 2003, we have used $790.3 million of the funds to repurchase outstanding debt obligations, $13.6 million to repurchase preferred stock, $49.3 million to repurchase 2.3 million shares of our common stock owned by Illinova and $10.8 million for issuance expenses. In accordance with the Transitional Funding Securitization Financing Agreement, we must designate a percentage of the cash received from customer billings to fund payment of the Notes. The amounts received are remitted to the IPSPT and are restricted for the sole purpose of paying down such Notes.
During 2003 and 2002, we paid IPSPT $86.4 million, which was used by IPSPT to pay down the Notes. We estimate that IPSPT will continue to pay down such Notes ratably, $86.4 million annually, through 2008. At December 31, 2003, $74.3 million of these $419.9 million Notes outstanding are classified as long-term debt maturing within one year. Due to the adoption of FIN No. 46R and resulting deconsolidation of IPSPT, certain amounts included in restricted cash are netted against the current portion of our long term debt payable to IPSPT on our December 31, 2003 consolidated balance sheet.
At December 31, 2003 and 2002, the aggregate total of unamortized debt expense and unamortized loss on reacquired debt was approximately $78.9 million and $84.6 million, respectively. This amount is included in the Consolidated Balance Sheets under Other Deferred Charges.
As previously disclosed, in September 1999, we entered into an $81 million operating lease on four gas turbines located in Tilton, Illinois. These facilities consist of peaking units with generating capacity of 176 MW. The lease runs until September 2004, with an option to renew for two additional years. In October 1999, we subleased the turbines to DMG. In September 2003, we delivered notice of our intent to purchase the turbines upon expiration of the operating lease in September 2004. As a result of this action, the operating lease was reclassified as a capital lease and we are now the capital sublessor. Based upon an independent appraisal, we recorded a receivable from DMG at the fair market value of $66.4 million, which is offset by a corresponding liability to the original lessor. The receivable from DMG and payable to the original lessor will be accreted monthly, using the st raight line method, to the $81 million purchase obligation in September 2004. The accretion recorded for 2003 was approximately $4.3 million and was recorded as interest income offset by the same amount of interest expense. The accretion to be recorded in 2004 will be approximately $10.3 million. The net effect on our income statement will be zero. This obligation was previously disclosed as a lease obligation in the footnotes to our financial statements and the Commercial Financial Obligations and Contingent Financial Commitments tables in our 2002 Form 10-K.
Note 10 - Preferred Stock | | | | |
| | | | | | | | |
| | | | | | | |
| | | | | | | | | (Millions of dollars) | |
| |
| December 31, | | | | | | | | | | | 2003 | | | 2002 | |
| |
Serial Preferred Stock, cumulative, $50 par value --Authorized 5,000,000 shares; 912,675 shares outstanding atDecember 31, 2003 and 2002, respectively. | |
| | | | | | | | | | | | | | | | | | | | |
| | | | | | | 2003 | | | 2002 | | | Redemption | | | | | | | |
| | | | Series | | | Shares | | | Shares | | | Prices | | | | | | | |
| | | | 4.08 | % | | 225,510 | | | 225,510 | | $ | 51.50 | | $ | 11.3 | | $ | 11.3 | |
| | | | 4.26 | % | | 104,280 | | | 104,280 | | | 51.50 | | | 5.2 | | | 5.2 | |
| | | | 4.70 | % | | 145,170 | | | 145,170 | | | 51.50 | | | 7.2 | | | 7.2 | |
| | | | 4.42 | % | | 102,190 | | | 102,190 | | | 51.50 | | | 5.1 | | | 5.1 | |
| | | | 4.20 | % | | 143,760 | | | 143,760 | | | 52.00 | | | 7.2 | | | 7.2 | |
| | | | 7.75 | % | | 191,765 | | | 191,765 | | | 50.00 | | | 9.6 | | | 9.6 | |
| | | Net premium on preferred stock | | | | | 0.2 | | | 0.2 | |
| Total Preferred Stock, $50 par value | | | | | 45.8 | | | 45.8 | |
| |
Serial Preferred Stock, cumulative, without par value-- | | | | | | |
| Authorized 5,000,000 shares; none outstanding | | | | | - | | | - | |
| |
Preference Stock, cumulative, without par value -- | | | | | | |
| Authorized 5,000,000 shares; none outstanding | | | | | - | | | - | |
| |
| Total Serial Preferred Stock and Preference Stock | $ | 45.8 | | $ | 45.8 | |
| |
All of the above series of Serial Preferred Stock ($50 par value) are currently redeemable at our option, in whole or in part, at any time with not less than 30 days and not more than 60 days notice by publication.
Redemption of Preferred Stock and Consent Solicitation At December 31, 2001, a provision of our Restated Articles of Incorporation prohibited us from incurring additional unsecured debt of more than approximately $210 million. On March 28, 2002, we completed a solicitation of consents from our preferred stockholders to amend our Restated Articles of Incorporation to eliminate this provision. Concurrently, Illinova completed a tender offer pursuant to which it acquired 662,924 shares, or approximately 73%, of our preferred stock. The New York Stock Exchange subsequently delisted each of the series of preferred stock that were subject to the tender offer. On March 29, 2002, we amended our Restated Articles of Incorporation to eliminate this provision. We incurred approximately $1.3 million in charges in connection with the consent solicitation. These charges are reflected as an adjustment to Retained Earnings in the accompanying Consolidated Balance Sheets.
Note 11 - Common Stock and Retained Earnings
Illinova is the sole holder of all of our common stock. At December 31, 2003, there were 100,000,000 shares authorized with 75,643,937 shares issued. There is no voting or non-voting common equity held by non-affiliates of IP. We are an indirect wholly owned subsidiary of Dynegy.
As of December 31, 2003, we had repurchased 12,751,724 shares of our common stock from Illinova. Under Illinois law, such shares may be held as treasury stock and treated as authorized but unissued, or may be canceled by resolution of the Board of Directors. We hold the common stock as treasury stock and deduct it from common equity at the cost of the repurchased shares.
Under our Restated Articles of Incorporation, common stock dividends are subject to the preferential rights of the holders of preferred and preference stock. We are also limited in our payment of dividends by the Illinois Public Utilities Act, which requires retained earnings equal to or greater than the amount of any proposed dividend declaration or payment and by the netting agreement, effective October 2002. Please read Note 4 – “Related Parties” for more information on our netting agreement. The Federal Power Act precludes declaration or payment of dividends by electric utilities “out of money properly stated in a capital account.” No common stock dividends were declared or paid in 2003. During March 2002, we declared and paid common stock dividends of $0.5 million to Illinova.
Employee Stock Ownership Plan Our employees historically participated in an Employees’ Stock Ownership Plan (“ESOP”) that included a stock matching and an incentive compensation feature tied to employee achievement of specified corporate performance goals. This arrangement began in 1991 when we loaned $35 million to the Trustee of the Plan, which used the loan proceeds to purchase 2,031,445 shares of our common stock on the open market. We financed the loan with funds borrowed under our bank credit agreements. The loan and common shares became Illinova instruments on formation of Illinova in May 1994. These shares were held in a Loan Suspense Account under the ESOP and were released and allocated to the accounts of participating employees as the loan was repaid by the Trustee with cash contributed by us for company stock matching and incentive compensation awar ds. Common dividends received on allocated and unallocated shares held by the Plan were used to repay the loan, which then released additional shares to cover dividends on shares held in participating employees’ accounts. The number of shares released when funds were received by the Trustee was based on the closing price of the common stock on the last day of the award period or the common stock dividend date. Effective with the merger of Dynegy and Illinova, the shares of Illinova stock in the ESOP were converted to the same number of shares of Dynegy Class A common stock. The ESOP plan ended in April 2001 upon distribution of the remaining shares held by the Plan.
During 2001, final distribution was made when 11,540 common shares were allocated to salaried employees and 12,948 shares to employees covered under the Collective Bargaining Agreement through the stock matching contribution feature of the ESOP arrangement. No expense was recognized in 2003 or in 2002 due to the termination of the ESOP plan in April 2001. Using the shares allocated method, we recognized $0.2 million of expense in 2001. During 2001 we contributed $0.9 million to the ESOP. Interest paid on the ESOP debt was negligible in 2001. Dividends used for debt service were approximately $0.2 million in 2001.
Stock Options In 1992, the Board of Directors adopted and the shareholders approved a Long-Term Incentive Compensation Plan (“LTIP”) for officers or employee members of the Board, but excluding directors who were not officers or employees. Restricted stock, incentive stock options, non-qualified stock options, stock appreciation rights, dividend equivalents, and other stock-based awards could be granted under LTIP for up to 1,500,000 shares of Illinova’s common stock. These stock-based awards generally vest over three years, have a maximum term of 10 years and have exercise prices equal to the market price on the date the awards were granted. Pursuant to terms of the merger, certain vesting requirements on outstanding options granted prior to the merger were accelerated.
In December 2002, the FASB issued SFAS No. 148, “Accounting for Stock-Based Compensation—Transition and Disclosure” which amended SFAS No. 123, “Accounting for Stock-Based Compensation,” and provided alternative methods of transition (prospective, modified prospective or retroactive) for entities that voluntarily change to the fair value-based method of accounting for stock-based employee compensation in a fiscal year beginning before December 16, 2003. SFAS No. 148 requires prominent disclosure about the effects on reported net income of an entity’s accounting policy decisions with respect to stock-based employee compensation. We transitioned to a fair value-based method of accounting for stock-based compensation in the first quarter 2003 and are using the prospective method of transition as described under SFAS No. 148. As a result, a charge of approx imately $0.2 million is reflected in other operating expenses for the year ended December 31, 2003.
Each option granted is valued at an option price. Options granted at market value vest and become exercisable ratably over a three-year period. The difference between the option price and the stock price, if any, of each option on the date of grant is recorded as compensation expense over a vesting period. No compensation expense was recorded related to such options during 2003, 2002 and 2001. However, compensation expense of $0.6 million was recorded in 2001 related to revisions to vesting and exercise provisions extended to employees participating in the severance and retirement components of our 2001 reorganization plan. Refer to Note 3 - “2001 Reorganization” above for additional information. Pursuant to the merger, all stock options granted to our employees prior to the merger were converted to options to purchase Dynegy Class A common stock on a one-for-one basis.
We recognized tax benefits associated with the exercise of Dynegy stock options by our employees in 2002 and 2001 in accordance with our tax sharing agreement. In 2002 and 2001, $0.8 million and $7.8 million, respectively was reflected as a reduction in current taxes payable and an increase to additional paid-in capital.
The following summarizes options granted and option transactions for 2003, 2002 and 2001:
| | | For the Year Ended December 31, | |
| | | 2003 | 2002 | 2001 |
| |
| | | Number of | Weighted Avg. | | Number of | | Weighted Avg. | | Number of | | Weighted Avg. | |
| | | | Shares | | Option Price | | Shares | | Option Price | | Shares | | Option Price | |
| | |
| |
| |
| |
| Outstanding at beginning of period | | | 1,606,086 | | $ | 29.94 | | | 1,716,790 | | $ | 29.92 | | | 1,429,951 | | $ | 28.00 | |
| | | | | | | | | | | | | | | | | | | | |
| Granted | | | 335,500 | | | 1.77 | | | - | | | N/A | | | 559,421 | | $ | 33.52 | |
| | | | | | | | | | | | | | | | | | | | |
| Exercised | | | - | | | N/A | | | (16,497 | ) | $ | 23.38 | | | (195,733 | ) | $ | 25.54 | |
| | | | | | | | | | | | | | | | | | | | |
| Canceled, forfeited or expired | | | (201,994 | ) | $ | 29.22 | | | (94,207 | ) | $ | 30.66 | | | (76,849 | ) | $ | 31.58 | |
| | | | | | | | | | | | | | | | | | | | |
| | |
| | | | |
| | | | |
| | | | |
| Outstanding at end of period | | | 1,739,592 | | $ | 24.59 | | | 1,606,086 | | $ | 29.94 | | | 1,716,790 | | $ | 29.92 | |
| | |
| | | | |
| | | | |
| | | | |
| | | | | | | | | | | | | | | | | | | | |
| | | | | | | | | | | | | | | | | | | | |
| Exercisable at end of period | | | 1,291,010 | | $ | 29.76 | | | 1,504,157 | | $ | 27.66 | | | 860,715 | | $ | 29.06 | |
| | | | | | | | | | | | | | | | | | | | |
| Weighted average fair value of options | | | | | | | | | | | | | | | |
| granted at market | | | | | $ | 1.54 | | | | | $ | N/A | | | | | $ | 19.10 | |
| | | | | |
| | | | |
| | | | |
| |
| | | | | | | | | | | | | | | | | | | | |
| Weighted average fair value of options | | | | | | | | | | | | | | | |
| granted below market | | | | | | N/A | | | | | | N/A | | | | | | N/A | |
| | | | | |
| | | | |
| | | | |
| |
| | | | | | | | | | | | | | | | | | | | |
Options outstanding as of December 31, 2003 are summarized below:
| | | Options Outstanding | | Options Exercisable |
| |
| |
|
| | | Number of Shares Outstanding at | Weighted Average | Weighted | | Number of Shares | Weighted |
Range of Exercise Prices | | December 31, 2003 | Remaining Contractual Life (Years) | Average Exercise Price | | Exercisable at December 31, 2003 | Average Exercise Price |
| |
|
|
| |
|
|
| | | | | | | | |
| $1.77 - $23.38 | | 540,949 | 8.4 | $10.62 | | 422,877 | $23.63 |
| | | | | | | | |
| $23.85 - $26.13 | | 381,409 | 6.9 | $24.13 | | 100,400 | $24.91 |
| | | | | | | | |
| $29.09 - $31.13 | | 629,500 | 4.9 | $30.41 | | 609,500 | $30.45 |
| | | | | | | | |
| $35.28 - $56.98 | | 187,734 | 7.0 | $46.30 | | 158,233 | $46.53 |
| | |
| | | |
| |
| | | 1,739,592 | | | | 1,291,010 | |
| |
| | | |
| |
| | | | | | | | |
The fair value of options granted, which is amortized to expense over the option vesting period in determining the pro forma impact, is estimated on the date of grant issuance using the Black-Scholes option-pricing model with the following weighted average assumptions:
| | | | 2003 | | | 2002 | | | 2001 | |
| | |
| |
| |
| |
| Expected life of options | | | 10 years | | | N/A | | | 10 years | |
| Risk-free interest rates | | | 3.92 | % | | N/A | | | 4.82 | % |
| Expected volatility of stock | | | 90 | % | | N/A | | | 46 | % |
| Expected dividend yield | | | N/A | | | N/A | | | 1.0 | % |
See Note 1 for a tabular presentation of the pro forma report.
Note 12 - Employee Compensation, Savings and Pension Plans
Corporate Incentive Plan Dynegy maintains a discretionary incentive plan to provide employees, including ours, competitive and meaningful rewards for reaching corporate and individual objectives. Specific rewards are at the discretion of Dynegy’s Compensation Committee of the Board of Directors.
In addition, in 2003 Dynegy adopted the Mid-Term Incentive Performance Award Program. This program is limited to select employees who are eligible to receive cash compensation of up to 200% of their annual base salary, paid in installments over a two-year period, based on the performance of Dynegy's Class A common stock during the last 30 trading days in 2004 and stock performance over the entire year 2005. Dynegy's accounts for this cash plan using variable plan accounting and recognized less than $1 million in compensation expense during 2003 associated with the plan.
401(k) Savings Plan Our employees are eligible to participate in one of two incentive savings plans, which meet the requirements of Section 401(k) of the Internal Revenue Code and are defined contribution plans subject to the provisions of ERISA. We match 50% of employee contributions to the incentive savings plans, subject to a maximum of six percent of compensation. Employees are immediately 100% vested in Company contributions. Matching contributions are made in Dynegy common stock.
Pension and Other Benefits Costs Our employees are participants in defined benefit plans sponsored by Dynegy Inc., which prior to the February 1, 2000 Dynegy-Illinova merger, were sponsored and administered by us. See Note 1 – “Summary of Significant Accounting Policies” above for more information.
The values and discussion below represent the components of the Dynegy benefit plans that were sponsored and administered by us prior to the merger. Plan participants include Illinova employees as of February 1, 2000 as well as our employees and employees DMG hired subsequent to the merger. We are reimbursed by the other Illinova subsidiaries (prior to the merger) and by other Dynegy subsidiaries (subsequent to the merger) for their share of the expenses of these benefit plans.
The following tables contain information about the obligations and funded status of these plans:
| | | (Millions of dollars) |
| |
| | | | Pension Benefits | | Other Benefits | |
| | | | 2003 | | | 2002 | | | 2003 | | | 2002 | |
| |
Change in benefit obligation | | | | | | | | | | | | | |
| | | | | | | | | | | | | | |
| Projected benefit obligation at beginning of year | | $ | 573.5 | | $ | 489.6 | | $ | 150.6 | | $ | 133.7 | |
| Service cost | | | 13.4 | | | 10.6 | | | 3.8 | | | 3.0 | |
| Interest cost | | | 36.1 | | | 35.6 | | | 10.4 | | | 9.6 | |
| Participant contributions | | | - | | | - | | | 1.3 | | | 1.1 | |
| Plan amendments | | | 1.3 | | | - | | | - | | | - | |
| Actuarial (gain)/loss | | | 38.0 | | | 69.5 | | | 32.8 | | | 11.3 | |
| Special termination benefits | | | - | | | - | | | - | | | - | |
| Benefits paid | | | (33.3 | ) | | (31.8 | ) | | (9.1 | ) | | (8.1 | ) |
| |
| Projected benefit obligation at end of year | | $ | 629.0 | | $ | 573.5 | | $ | 189.8 | | $ | 150.6 | |
| |
| | | | | | | | | | | | | | |
Change in plan assets | | | | | | | | | | | | | |
| | | | | | | | | | | | | | |
| Fair value of plan assets, beginning of year | | $ | 476.7 | | $ | 557.4 | | $ | 67.0 | | $ | 79.4 | |
| Actual return/(loss) on plan assets | | | 98.7 | | | (48.9 | ) | | 14.2 | | | (11.0 | ) |
| Employer contributions | | | - | | | - | | | 5.8 | | | 5.6 | |
| Participant contributions | | | - | | | - | | | 1.3 | | | 1.1 | |
| Benefits paid | | | (33.3 | ) | | (31.8 | ) | | (9.1 | ) | | (8.1 | ) |
| |
| Fair value of plan assets, end of year | | $ | 542.1 | | $ | 476.7 | | $ | 79.2 | | $ | 67.0 | |
| |
Reconciliation of funded status | | | | | | | | | | | | | |
| | | | | | | | | | | | | | |
| Funded status | | | | | | | | | | | | | |
| Unrecognized actuarial (gain)/loss | | $ | (86.9 | ) | $ | (96.8 | ) | $ | (110.6 | ) | $ | (83.6 | ) |
| Unrecognized prior service cost | | | 104.0 | | | 114.3 | | | 91.9 | | | 72.0 | |
| Unrecognized transition obligation/(asset) | | | 6.4 | | | 6.6 | | | - | | | - | |
| Net amount recognized | | | (4.4 | ) | | (5.9 | ) | | 17.1 | | | 19.3 | |
| |
| | | $ | 19.1 | | $ | 18.2 | | $ | (1.6 | ) | $ | 7.7 | |
| |
Amounts recognized in the Consolidated Balance Sheets consist of: |
| Prepaid benefit cost | | $ | 38.5 | | $ | 37.6 | | $ | - | | $ | 7.7 | |
| Accrued benefit liability | | | (37.7 | ) | | (44.5 | ) | | (1.6 | ) | | - | |
| Intangible asset | | | 2.4 | | | 3.0 | | | - | | | - | |
| Accumulated other comprehensive income (pretax) | | | 15.9 | | | 22.1 | | | - | | | - | |
| |
| Net amount recognized | | $ | 19.1 | | $ | 18.2 | | $ | (1.6 | ) | $ | 7.7 | |
| |
The accumulated benefit obligation for our defined benefit plans was $280.5 million and $263.3 million at December 31, 2003 and 2002, respectively.
Plan amendments of $1.3 million in 2003 relate to an amendment to increase the career average accrual formula to 2.4% from 2.2% for bargaining union employees.
On December 31, 2003 and December 31, 2002, our annual measurement date, the accumulated benefit obligation related to our pension plans exceeded the fair value of the pension plan assets. This difference is attributed to (1) an increase in the accumulated benefit obligation that resulted from the decrease in the discount rate and the expected long-term rate of return and (2) a decline in the fair value of the plan assets due to a sharp decrease in the equity markets through December 31, 2002. As a result, in accordance with SFAS 87, “Employers’ Accounting for Pensions”, we have recorded minimum pension liability, with an offset to accumulated other comprehensive income. The following summarizes information about our defined pension plans with an accumulated benefit obligation in excess of plan assets:
(Millions of dollars) | |
| |
| | | | 2003 | | | 2002 | |
| |
| Accumulated benefit obligation | | $ | 280.5 | | $ | 263.3 | |
| Projected benefit obligation | | | 321.7 | | | 299.9 | |
| Fair value of plan assets | | | 244.3 | | | 218.8 | |
| | | | | | | | |
The following summarizes the change to accumulated other comprehensive loss associated with the minimum pension liability:
(Millions of dollars) | |
| |
| | | | 2003 | | | 2002 | | | 2001 | |
| |
| Change in minimum liability include in other comprehensive income (net | | | | | | | | | | |
| of taxes of $(2.5) million in 2003 and $8.8 million in 2002) | | $ | (3.7 | ) | $ | 13.3 | | $ | - | |
| (Millions of dollars) | |
| |
| | | Pension Benefits | | Other Benefits | |
| | | | 2003 | | | 2002 | | | 2001 | | | 2003 | | | 2002 | | | 2001 | |
| |
Components of net periodic benefit cost | | | | | | | | | | | | | | |
| | | | | | | | | | | | | | | | | | | | |
| Service cost | | $ | 13.4 | | $ | 10.6 | | $ | 9.8 | | $ | 3.8 | | $ | 3.0 | | $ | 2.4 | |
| Interest cost | | | 36.1 | | | 35.6 | | | 33.7 | | | 10.4 | | | 9.6 | | | 8.4 | |
| Expected return on plan assets | | | (50.4 | ) | | (56.6 | ) | | (53.8 | ) | | (5.9 | ) | | (7.1 | ) | | (7.8 | ) |
| Amortization of prior service cost | | | 1.5 | | | 1.4 | | | 1.4 | | | - | | | - | | | - | |
| Amortization of transition liability/(asset) | | | (1.5 | ) | | (3.4 | ) | | (4.2 | ) | | 2.1 | | | 2.1 | | | 2.1 | |
| Recognize net actuarial (gain)/loss | | | - | | | (4.4 | ) | | (6.7 | ) | | 4.6 | | | 2.0 | | | - | |
| |
| Net periodic benefit cost/(income) | | $ | (0.9 | ) | $ | (16.8 | ) | $ | (19.8 | ) | $ | 15.0 | | $ | 9.6 | | $ | 5.1 | |
| Additional cost due to SFAS 88 | | | - | | | - | | | 8.7 | | | - | | | - | | | - | |
| |
| Total net periodic benefit cost/(income) | | $ | (0.9 | ) | $ | (16.8 | ) | $ | (11.1 | ) | $ | 15.0 | | $ | 9.6 | | $ | 5.1 | |
| |
The following weighted average assumptions were used to determine benefit obligations:
| |
| | | Pension Benefits
December 31, | | Other Benefits
December 31, | |
| |
| | | | 2003 | | | 2002 | | | 2003 | | | 2002 | |
| Discount rate | | | 6.00 | % | | 6.50 | % | | 6.00 | % | | 6.50 | % |
| Rate of compensation increase | | | 4.50 | % | | 4.50 | % | | 4.50 | % | | 4.50 | % |
The following weighted average assumptions were used to determine net periodic benefit cost:
|
| | | Pension Benefits | Other Benefits |
| | | December 31, | December 31, |
|
| | | | 2003 | | | 2002 | | | 2001 | | | 2003 | | | 2002 | | | 2001 | |
| Discount Rate | | | 6.50 | % | | 7.50 | % | | 8.00 | % | | 6.00 | % | | 7.50 | % | | 8.00 | % |
| Expected return on plan assets | | | 9.00 | % | | 9.50 | % | | 9.50 | % | | 9.00 | % | | 9.50 | % | | 9.50 | % |
| Rate of compensation increase | | | 4.50 | % | | 4.50 | % | | 4.50 | % | | 4.50 | % | | 4.50 | % | | 4.50 | % |
Our expected long-term rate of return on plan assets for the year ended December 31, 2004 is 8.75%. This figure begins with a blend of asset class-level returns developed under a theoretical global capital asset pricing model methodology conducted by an outside consultant. In development of this figure, the historical relationships between equities and fixed income are preserved consistent with the widely accepted capital market principle that assets with higher volatility generate a greater return over the long run. Current market factors such as inflation and interest rates are also incorporated in the assumptions. The figure also incorporates an upward adjustment reflecting the plan’s use of active management and favorable past experience.
The following summarizes our assumed health care cost trend rates:
| | | December 31. |
|
| | | | 2003 | | | 2002 | |
| |
| Health care case trend rated assumed for next year | | | 10.00 | % | | 9.30 | % |
| Ultimate trend rate | | | 5.50 | % | | 5.50 | % |
| Year that the rate reaches the ultimate trend rate | | | 2009 | | | 2009 | |
Assumed health care cost trend rates have a significant effect on the amounts reported for the health care plans. The impact of one percent increase/decrease in assumed health care cost trend rates is as follows:
(Millions of dollars) |
|
| | | | Increase | | | Decrease | |
|
| Aggregate impact on service cost and interest cost | | $ | 2.5 | | $ | (2.1 | ) |
| Impact on accumulated post-retirement benefit obligation | | $ | 24.2 | | $ | (20.5 | ) |
Plan Assets We employ a total return investment approach whereby a mix of equities and fixed income investments are used to maximize the long-term return on plan assets for a prudent level of risk. The intent of this strategy is to minimize plan expenses by outperforming plan liabilities over the long run. Risk tolerance is established through careful consideration of plan liabilities, plan funded status, and corporate financial condition. The investment portfolio contains a diversified blend of equity and fixed income investments. Furthermore, equity investments are diversified across U.S. and non-U.S. stocks as well as growth, value, and small and large capitalizations. Other assets such as real estate, private equity, and hedge funds are used judiciously to enhance long-term returns while improving portfolio diversification.
Derivatives may be used to gain market exposure in an efficient and timely manner; however, derivatives may not be used to leverage the portfolio beyond the market value of the underlying investments. Investment risk is measured and monitored on an ongoing basis through annual liability measurements, periodic asset/liability studies, and quarterly investment portfolio reviews.
Our pension plan weighted-average asset allocations by asset category were as follows:
| | December 31. |
|
| | 2003 | 2002 |
|
|
| Equity securities | 64% | 59% |
| Debt securities | 28% | 30% |
| Real estate | 5% | 6% |
| Other | 3% | 4% |
| Cash | -% | 1% |
|
|
| Total | 100% | 100% |
|
|
Equity securities did not include any common stock of Dynegy at December 31, 2003 or 2002.
Our other postretirement benefit plans weighted-average asset allocations by asset category were as follows:
| | December 31. |
|
| | 2003 | 2002 |
|
|
| Equity securities | 75% | 74% |
| Debt securities | 25% | 26% |
| |
|
| Total | 100% | 100% |
|
|
Equity securities did not include any common stock of Dynegy at December 31, 2003 or 2002.
ContributionsWe expect to contribute approximately $2 million related to our pension plan liability and approximately $5 million to our other post retirement benefit plans in 2004.
As permitted under Paragraph 26 of SFAS 87, “Employers’ Accounting for Pensions”, the amortization of any prior service cost is determined using a straight-line amortization of the cost over the average remaining service period of employees expected to receive benefits under the Plan.
During 2001, we recognized special termination benefit pension expense of $8.7 million due to our staffing reduction in connection with a reorganization. See Note 3 – “2001 Reorganization” above for additional information.
Note 13 - Segments of Business
Our operations consist of a single reportable segment. This segment includes the transmission, distribution and sale of electric energy and the transportation, distribution and sale of natural gas in Illinois. Also included in this segment are specialized support functions, including accounting, legal, regulatory, performance management, information technology, human resources, environmental resources, purchasing and materials management and communications.
Note 14 - Fair Value of Financial Instruments
The following disclosure of the estimated fair value of financial instruments is made in accordance with the requirements of SFAS 107, “Disclosures About Fair Value of Financial Instruments.” Using available market information and selected valuation methodologies, we have determined the estimated fair value amounts. Considerable judgment is required in interpreting market data to develop the estimates of fair value. The use of different market assumptions or valuation methodologies could have a material effect on the estimated fair value amounts.
| | | 2003 | | 2002 | |
| | |
|
| |
(Millions of dollars) | | | Carrying
Value | | | Fair Value | | | Carrying
Value | | | Fair Value | |
| |
| | | | | | | | | | | | | | |
| Cash and cash equivalents | | $ | 16.7 | | $ | 16.7 | | $ | 117.4 | | $ | 117.4 | |
| Note receivable from affiliate | | | 2,271.4 | | | 2,271.4 | | | 2,271.4 | | | 989.1 | |
| Preferred stock | | | 45.8 | | | 43.7 | | | 45.8 | | | 17.6 | |
| Long-term debt (including current maturities) | | | 1,505.3 | | | 1,663.5 | | | 1,995.2 | | | 1,960.8 | |
| Long-term debt to IPSPT (including current | | | | | | | | | | | | | |
| maturities) | | | 419.9 | | | 440.5 | | | --- | | | --- | |
| Notes payable | | | --- | | | --- | | | 100.0 | | | 100.0 | |
| | | | | | | | | | | | | | |
Our operations are subject to regulation; therefore, gains or losses on the redemption of long-term debt may be included in rates over a prescribed amortization period, if they are in fact, settled at amounts approximating those in the above table.
The following methods and assumptions were used to estimate the fair value of each class of financial instruments listed in the table above:
Cash and Cash Equivalents The carrying amount of cash and cash equivalents approximates fair value due to the short maturity of these instruments.
Note Receivable from Affiliate The fair value of our Note Receivable from Affiliate is estimated based on the quoted market prices for Dynegy’s publicly traded senior unsecured debt securities having similar terms. As of December 31, 2003, the fair value of our Note Receivable from Affiliate was substantially the same as its carrying value. This calculation was prepared using the same methodology to determine the fair value of our Note Receivable from Affiliate at December 31, 2002.
Preferred Stock Our preferred stock is no longer listed on the New York Stock Exchange as a result of the March 2002 tender offer pursuant to which Illinova acquired 73% of our outstanding shares. As a result, reliable “market prices” of the various preferred series could not be obtained. For each series, quotes were obtained from our bankers and averaged to determine an estimated market price.
Long-Term Debt The fair value of our long-term debt is estimated based on the quoted market prices for similar issues or by discounting expected cash flows at the rates currently offered to us for debt of the same remaining maturities, as advised by our bankers. The detail related to the carrying amounts and fair values of each debt instrument are included in Note 9 – “Long-Term Debt.”
Notes Payable The carrying amount of notes payable approximates fair value due to the short maturity of these instruments. We paid the remaining balance of $100 million on our one-year term loan on May 2, 2003.
Other The carrying values of all other current financial assets and liabilities approximate fair value due to the short-term maturities of these instruments.
Note 15 - Quarterly Consolidated Financial Information And Common Stock Data (Unaudited) |
| | | (Millions of dollars) | |
| | |
| |
| | | | First Quarter | | | Second Quarter | | | Third Quarter | | | Fourth Quarter | |
| | | | 2003 | | | 2003 | | | 2003 | | | 2003 | |
| | |
| |
| Operating revenues | | $ | 461.7 | | $ | 327.0 | | $ | 401.7 | | $ | 377.4 | |
| Operating income | | | 50.8 | | | 32.5 | | | 47.1 | | | 35.8 | |
| Net income before cumulative effect of change in accounting principle | | | 34.4 | | | 18.1 | | | 39.6 | | | 27.3 | |
| Net income | | | 32.0 | | | 18.1 | | | 39.6 | | | 27.3 | |
| Net income applicable to common shareholder | | | 31.5 | | | 17.5 | | | 39.0 | | | 26.7 | |
| | | | | | | | | | | | | | |
| | |
| |
| | | | First Quarter | | | Second Quarter | | | Third Quarter | | | Fourth Quarter | |
| | | | 2002 | | | 2002 | | | 2002 | | | 2002 | |
| | |
| |
| Operating revenues | | $ | 393.2 | | $ | 343.9 | | $ | 406.0 | | $ | 375.2 | |
| Operating income | | | 35.5 | | | 45.1 | | | 57.7 | | | 25.7 | |
| Net income | | | 34.5 | | | 46.2 | | | 56.9 | | | 23.1 | |
| Net income applicable to common shareholder | | | 33.9 | | | 45.6 | | | 56.3 | | | 22.6 | |
| | | | | | | | | | | | | | |
Definitions
As used in this Form 10-K, the abbreviations listed below have the following meanings:
| AFUDC | Allowance for Funds Used During Construction |
| AEP | American Electric Power |
| Alliance RTO | Alliance Regional Transmission Organization |
| Ameren | Ameren Corporation |
| AmerenCILCO | Ameren – Central Illinois Light Company |
| AmerenCIPS | Ameren – Central Illinois Public Service Company |
| AmerenUE | Ameren – Union Electric Company |
| AmerGen | AmerGen Energy Company |
| APB | Accounting Principles Board |
| ARO | Asset Retirement Obligation |
| Bcf | Billion cubic feet |
| Clinton | Clinton Power Station |
| ComED | Commonwealth Edison Company |
| Dayton P&L | Dayton Power & Light |
| DMG | Dynegy Midwest Generation, Inc. |
| DOE | United States Department of Energy |
| DOT | U.S. Department of Transportation |
| Dynegy | Dynegy Inc. |
| EITF | Emerging Issues Task Force of the Financial Accounting Standards Board |
| EMF | Electric and Magnetic Fields |
| ERISA | The Employee Retirement Income Security Act of 1974, as amended |
| EPA | Environmental Protection Agency |
| Exchange Act | Securities Exchange Act of 1934, as amended |
| Exelon | Exelon Corporation |
| FASB | Financial Accounting Standards Board |
| FERC | Federal Energy Regulatory Commission |
| FIN | FASB Interpretation Number |
| GAAP | Generally Accepted Accounting Principles |
| HLPSA | Hazardous Liquid Pipeline Safety Act |
| ICC | Illinois Commerce Commission |
| Illinova | Illinova Corporation |
| IPSPT | Illinois Power Special Purpose Trust |
| ISO | Independent System Operator |
| ITC | Investment Tax Credit |
| kW | Kilowatts |
| kWh | Kilowatt-Hour |
| LLC | Illinois Power Securitization Limited Liability Company |
| MGP | Manufactured-Gas Plant |
| MISO | Midwest Independent Transmission System Operator, Inc. |
| MMBtu | Millions of British thermal units |
| MW | Megawatts |
| National Grid | National Grid, USA |
| NGPSA | Natural Gas Pipeline Safety Act |
| NOV | Notice of Violation issued by the EPA |
| OASIS | Open Access Same-time Information System |
| OSHA | Occupational Safety and Health Act |
| P.A. 90-561 | Electric Service Customer Choice and Rate Relief Law of 1997 |
| P.A. 92-0537 | Extension of Retail Electric Rate Freeze |
| PJM | PJM Interconnection LLC |
| PPA | Power Purchase Agreement |
| PUHCA | Public Utility Holding Company Act of 1935 |
| RCRA | Resource Conservation and Recovery Act |
| ROE | Return on Equity |
| RTO | Regional Transmission Organization |
| SEC | United States Securities and Exchange Commission |
| SFAS | Statement of Financial Accounting Standards |
| Trans-Elect | Trans-Elect, Inc. |
| TSCA | Toxic Substances Control Act |
| TVA | Tennessee Valley Authority |
| UGAC | Uniform Gas Adjustment Clause |
| VIE | Variable Interest Entity |
Additionally, the terms “IP,” “we,” “us” and “our” refer to Illinois Power Company and its subsidiaries, unless the context clearly indicates otherwise.