PROFITABLE GROWTH, STRONG RETURNS 100 YEARS STRONG ITW Conference Call Third Quarter 2012 October 23, 2012
PROFITABLE GROWTH, STRONG RETURNS Forward-Looking Statements 2 Safe Harbor Statement This conference call contains forward-looking statements within the meaning of the Private Securities Litigation Reform Act of 1995 including, without limitation, statements regarding strategic initiatives and related benefits, operating performance, growth in free operating cash flow, revenue growth, diluted income per share from continuing operations, restructuring expenses and related benefits, tax rates, exchange rates, share repurchases, end market conditions, and the Company’s related 2012 forecasts. These statements are subject to certain risks, uncertainties, and other factors which could cause actual results to differ materially from those anticipated. Important risks that could cause actual results to differ materially from the Company’s expectations include those that are detailed in ITW’s Form 10-K for 2011 and Form 10-Q for the third quarter of 2012. Non-GAAP Measures The Company uses certain non-GAAP measures in discussing the Company’s performance (denoted with *). The reconciliation of those measures to the most comparable GAAP measures is contained within the appendix of this presentation and is also available at our website www.ITW.com under “Investor Relations”.
PROFITABLE GROWTH, STRONG RETURNS Conference Call Playback • Replay number: 888-566-0396; No pass code necessary • Telephone replay available through midnight of November 6, 2012 • Webcast / PowerPoint replay available at www.itw.com • Supplemental financial and investor information will be available on the ITW website under the “Investor Relations” tab 3
PROFITABLE GROWTH, STRONG RETURNS Key Long-Term Initiatives 4 Business Structure Simplification •Future organization structure determined and simplification opportunities identified •Strategic leaders put in place to take on General Manager roles across organization •80/20 process will further simplify and focus larger businesses •Operational benefits on pace to be realized starting in ‘13 Strategic Sourcing •As part of long-range plan, made decisions on appropriate approach and organization •Began staffing sourcing resources company-wide •First direct material RFP in progress •Expanding scope and penetration of existing indirect categories Portfolio Management •Announced pending divestiture of a majority interest in Decorative Surfaces segment •Divested a consumer packaging and other non-core businesses (+$0.03 to Q3 EPS) •Over $400M of annualized revenue acquired YTD, focused on growth platforms and emerging markets • ITW is committed to shareholder value-adding initiatives: business structure simplification, strategic sourcing and portfolio management • These initiatives enable our decentralized management to better leverage ITW’s core competitive advantages globally and enhance our long-term operational performance • Prospective long-term strategic and operational benefits expected to start accruing in ’13 • More details to be discussed at December 14th Investor meeting
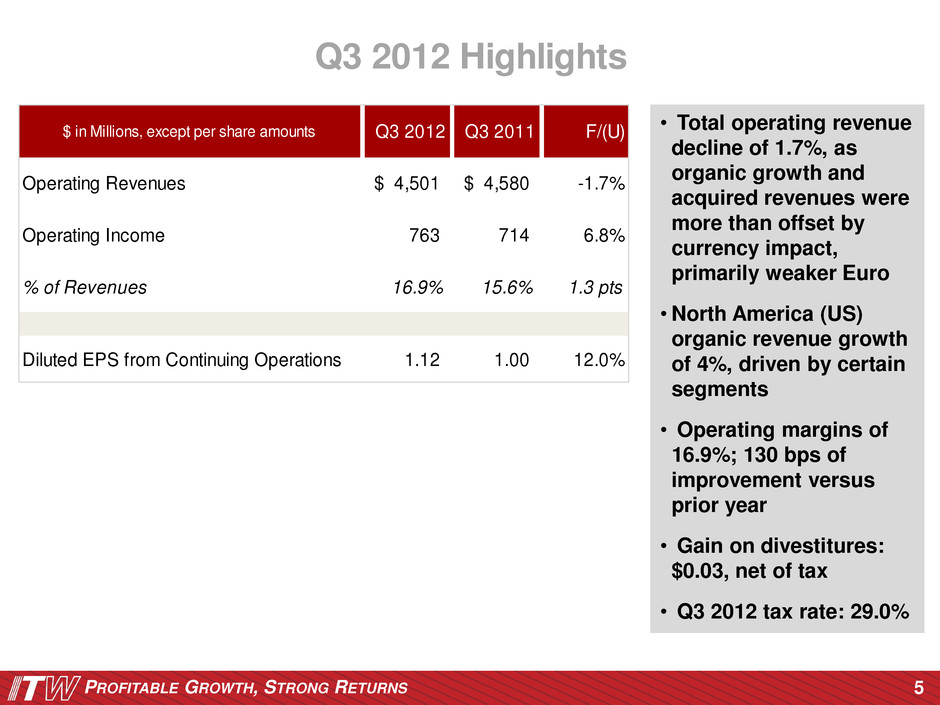
PROFITABLE GROWTH, STRONG RETURNS 5 • Total operating revenue decline of 1.7%, as organic growth and acquired revenues were more than offset by currency impact, primarily weaker Euro • North America (US) organic revenue growth of 4%, driven by certain segments • Operating margins of 16.9%; 130 bps of improvement versus prior year • Gain on divestitures: $0.03, net of tax • Q3 2012 tax rate: 29.0% Q3 2012 Highlights $ in Millions, except per share amounts Q3 2012 Q3 2011 F/(U) Operating Revenues 4,501$ 4,580$ -1.7% Operating Income 763 714 6.8% % of Revenues 16.9% 15.6% 1.3 pts Diluted EPS f om Continuing Operations 1.12 1.00 12.0%

PROFITABLE GROWTH, STRONG RETURNS • Organic revenue growth: 0.9%, led by US • Price / cost margin impact: +80 bps • Acquisition operating margins excluding amortization: 11.7% • Currency negatively impacted EPS by $0.04 primarily due to weaker Euro • Restructuring expense of $29M, $15M higher than last year 6 Q3 2012 vs. Q3 2011 Operating Results Total Revenue Operating Income Operating Margin Organic (Base) Business Operating Leverage 0.9% 2.2% 0.2% Changes in Variable Margin & Overhead Costs - 11.3% 1.8% Total Organic (Base) 0.9% 13.5% 2.0% Acquisitions & Divestitures 1.4% -0.2% -0.3% Translation -4.1% -4.1% -0.1% Impairment - -0.2% - Restructuring - -2.2% -0.3% Other 0.1% - - Total -1.7% 6.8% 1.3% F(U) to Prior Year
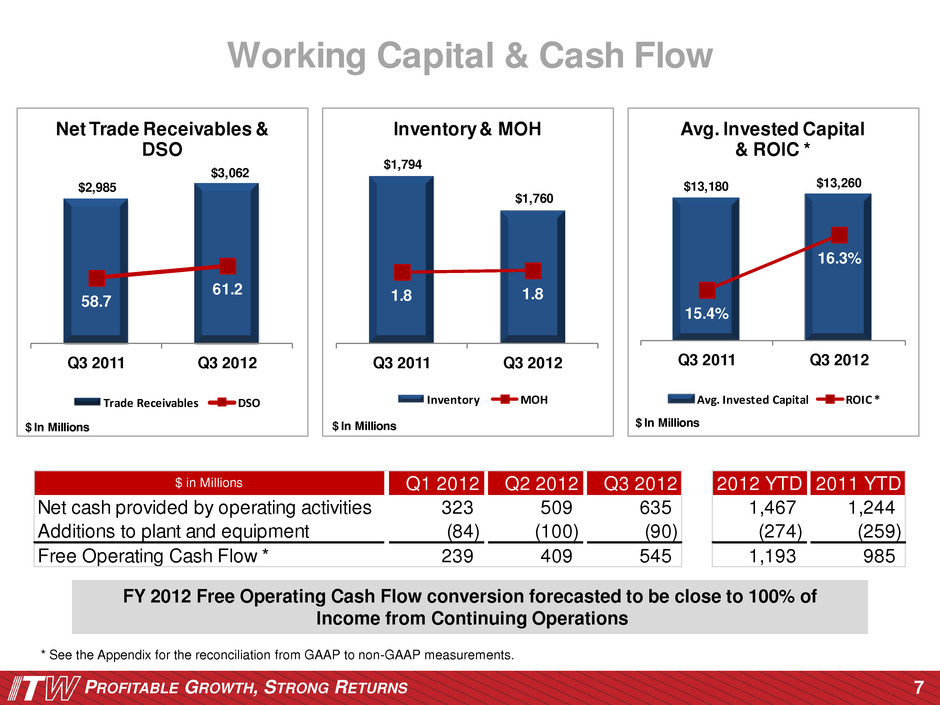
PROFITABLE GROWTH, STRONG RETURNS 7 * See the Appendix for the reconciliation from GAAP to non-GAAP measurements. Working Capital & Cash Flow $2,985 $3,062 58.7 61.2 Q3 2011 Q3 2012 $ In Millions Net Trade Receivables & DSO Trade Receivables DSO $1,794 $1,760 1.8 1.8 Q3 2011 Q3 2012 $ In Millions Inventory& MOH Inventory MOH $13,180 $13,260 15.4% 16.3% Q3 2011 Q3 2012 $ In Millions Avg. Invested Capital & ROIC * Avg. Invested Capital ROIC * $ in Millions Q1 2012 Q2 2012 Q3 2012 2012 YTD 2011 YTD Net cash provided by operating activities 323 509 635 1,467 ,244 Additions to plant and equipment (84) (1 0) (90) (274) ( 59) Free Operating C sh Flow * 239 409 545 1,193 985 FY 2012 Free Operating Cash Flow conversion forecasted to be close to 100% of Income from Continuing Operations
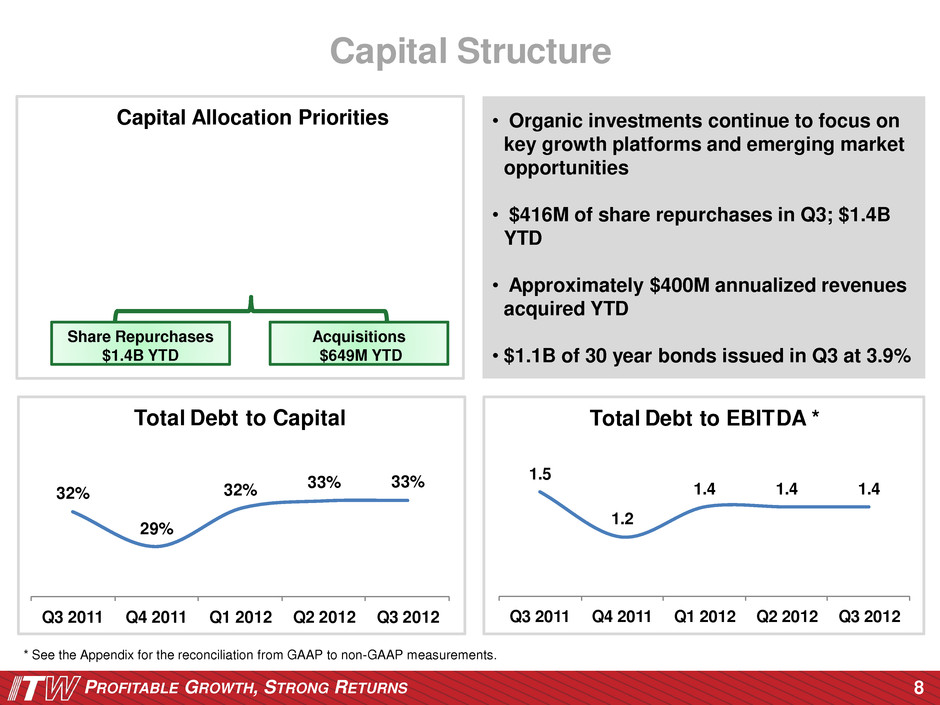
PROFITABLE GROWTH, STRONG RETURNS 8 * See the Appendix for the reconciliation from GAAP to non-GAAP measurements. 32% 29% 32% 33% 33% Q3 2011 Q4 2011 Q1 2012 Q2 2012 Q3 2012 Total Debt to Capital 1.5 1.2 1.4 1.4 1.4 Q3 2011 Q4 2011 Q1 2012 Q 2012 Q3 2012 Total Deb to EBITDA * Capital Structure • Organic investments continue to focus on key growth platforms and emerging market opportunities • $416M of share repurchases in Q3; $1.4B YTD • Approximately $400M annualized revenues acquired YTD • $1.1B of 30 year bonds issued in Q3 at 3.9% Share Repurchases $1.4B YTD Acquisitions $649M YTD Capital Allocation Priorities
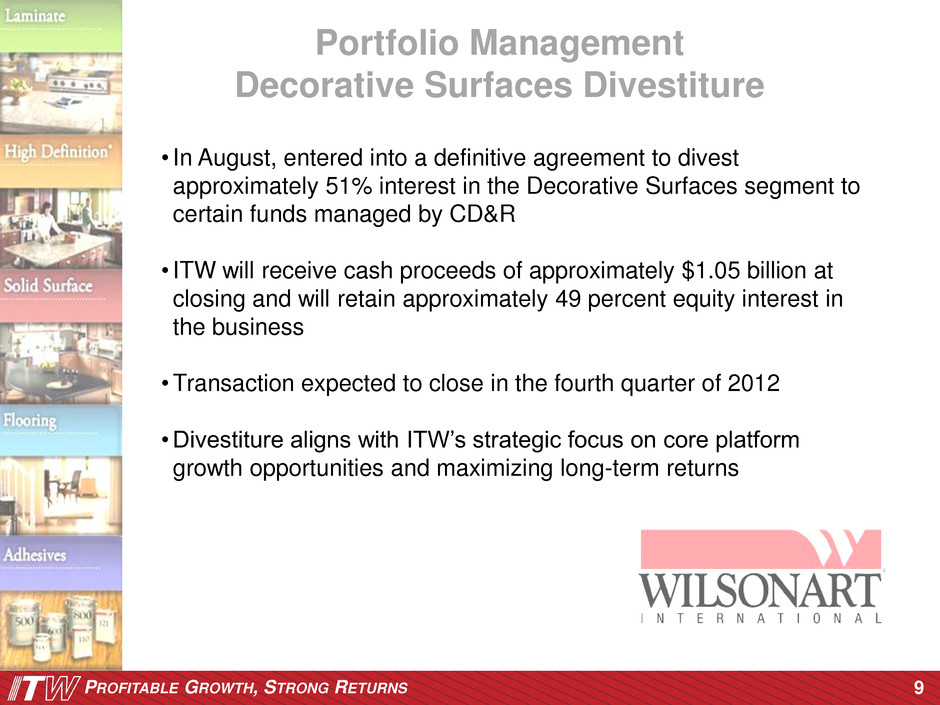
PROFITABLE GROWTH, STRONG RETURNS 9 Portfolio Management Decorative Surfaces Divestiture • In August, entered into a definitive agreement to divest approximately 51% interest in the Decorative Surfaces segment to certain funds managed by CD&R • ITW will receive cash proceeds of approximately $1.05 billion at closing and will retain approximately 49 percent equity interest in the business •Transaction expected to close in the fourth quarter of 2012 • Divestiture aligns with ITW’s strategic focus on core platform growth opportunities and maximizing long-term returns
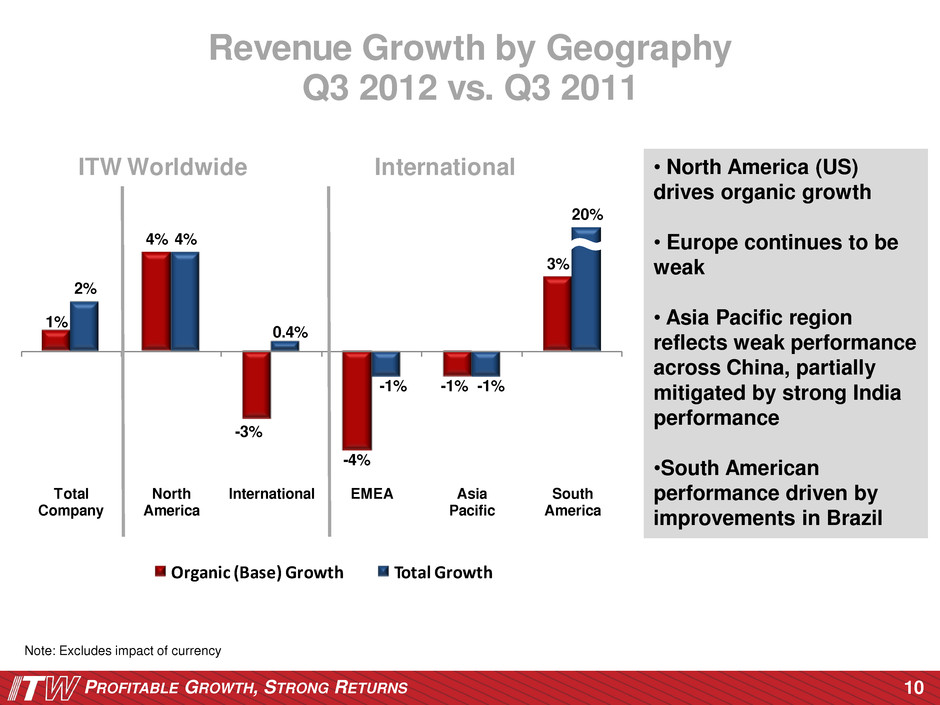
PROFITABLE GROWTH, STRONG RETURNS Revenue Growth by Geography 10 • North America (US) drives organic growth • Europe continues to be weak • Asia Pacific region reflects weak performance across China, partially mitigated by strong India performance •South American performance driven by improvements in Brazil 1% 4% -3% -4% -1% 3% 2% 4% 0.4% -1% -1% 20% Total Company North America International EMEA Asia Pacific South America Organic (Base) Growth Total Growth ITW Worldwide International Note: Excludes impact of currency Q3 2012 vs. Q3 2011

PROFITABLE GROWTH, STRONG RETURNS 11 Q3 2012 Segment Results * See the Appendix for the reconciliation from GAAP to non-GAAP measurements. $ in Millions Total Revenue Operating Income Operating Margin Total Revenue Organic (Base) Revenue * Operating Income Operating Margin Organic (Base) Op Margin * Transportation 858$ 135$ 15.7% -2.2% 1.4% -1.8% 0.1% 1.1% Power Systems & Electronics 813 179 22.0% 4.6% 4.5% 16.6% 2.2% 2.9% Industrial Packaging 599 77 12.8% -4.6% 0.2% 19.2% 2.6% 2.5% Food Equipment 491 93 18.8% -4.0% 0.3% 11.3% 2.6% 2.3% Construction 477 60 12.6% -7.2% -2.8% -5.4% 0.1% 0.7% Polymers & Fluids 308 53 17.4% -7.3% -6.7% -5.3% 0.5% 1.2% Decorative Surfaces 267 35 13.0% -5.7% -1.7% 1.8% 1.0% 0.8% All Other 704 131 18.6% 4.1% 4.5% 7.8% 0.6% 2.5% Intersegment (16) Total Company 4,501 763 16.9% -1.7% 0.9% 6.8% 1.3% 2.0% Q3 2012 % F(U) vs. prior year

PROFITABLE GROWTH, STRONG RETURNS 12 Q3 2012 Segment Commentary Organic Revenue Y/O/Y % Changes / Key Business Trends ~ Auto OEM WW: 9% ∙ NA: 9%; International: 9% (Europe: 4%, Asia Pacific: 23%) ∙ Auto builds grew in NA and China but declined in Europe ~ Auto Aftermarket WW: -8%, consumer spending further softened for car maintenance ~ Truck Remanufacturing: 2% ~ Electronics WW: 11% ∙ Electronic Assembly: 29%, high volume activity occurred with key customer new product rollouts ∙ Other Electronics: -4%, driven by key customers in more commoditized consumer electronics spaces ~ Welding WW: 2% ∙ NA: 5%, oil + gas and heavy equipment OEM's demand was moderate but still good ∙ International: -6%, China welding demand further weakened for shipbuilding ~ Industrial Packaging NA: 2% ~ Industrial Packaging International: -1% ~ Strapping and Equipment: -3% (NA: -3%, International: -3%) ~ Stretch Packaging WW: 10%, NA film volume increased and new business was gained in beverage and food segments ~ Food Equipment NA: 5% ∙ Equipment: 6%, baking, slicing and cooking categories improved ∙ Service: 2% ~ Food Equipment International: -4% ∙ Equipment: -8%, weak sales activity in Italy and France ∙ Service: 6% ~ NA Construction: 3%, residential, commercial and renovation construction all were positive, but still waiting for residential "uptick" ~ International Construction: -6%, commercial construction markets further deteriorated (Europe: -8%, Asia Pacific: -3%) ~ Polymers & Hygi ne: -9%, due to weakness in Europ (Spain) and exit from low margin business ~ Fluids: -2% ~ Decorative Surfaces NA: 1% ~ Decorative Surfaces International: -6%, weaker end market demand in the United Kingdom and Germany ~ Test and Measurement WW: 12%, strong cap ex spending for structural testing equipment in NA, Europe, and China ~ Consumer Packaging WW: flat, growth in global packaging solutions offset by weakness in decorating and graphics business Polymers & Fluids Decorative Surfaces All Other Construction Transportation Power Systems & Electronics Food Equipment Industrial Packaging Note: WW = Worldwide, NA = North America
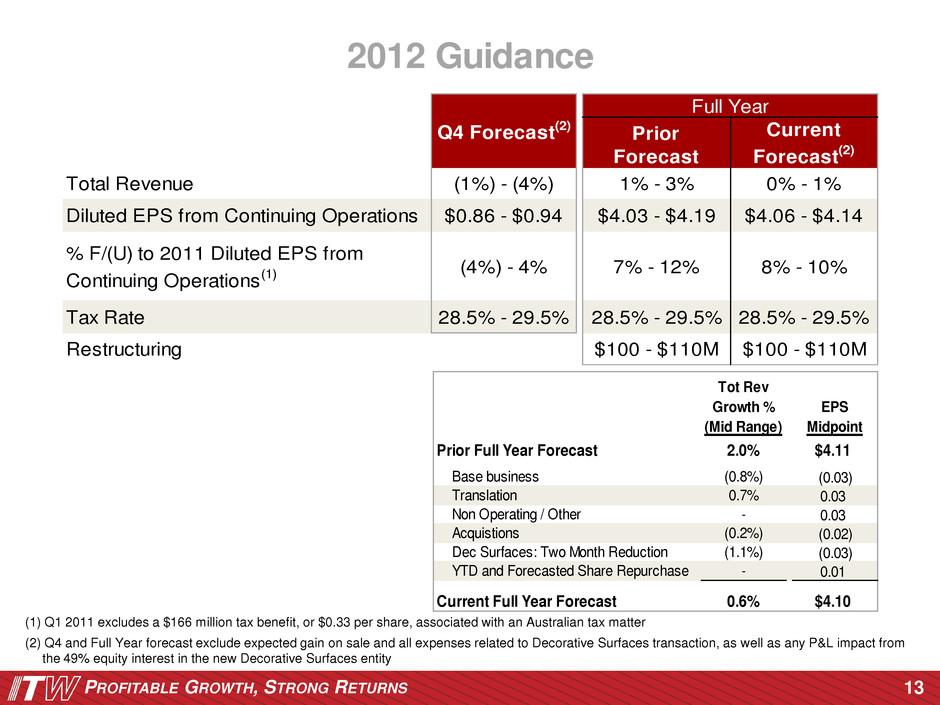
PROFITABLE GROWTH, STRONG RETURNS 13 2012 Guidance (1) Q1 2011 excludes a $166 million tax benefit, or $0.33 per share, associated with an Australian tax matter (2) Q4 and Full Year forecast exclude expected gain on sale and all expenses related to Decorative Surfaces transaction, as well as any P&L impact from the 49% equity interest in the new Decorative Surfaces entity Prior Forecast Current Forecast(2) Total Revenue (1%) - (4%) 1% - 3% 0% - 1% Diluted EPS from Continuing Operations $0.86 - $0.94 $4.03 - $4.19 $4.06 - $4.14 % F/(U) to 2011 Diluted EPS from Continuing Operations(1) (4%) - 4% 7% - 12% 8% - 10% Tax Rate 28.5% - 29.5% 28.5% - 29.5% 28.5% - 29.5% Restructuring $100 - $110M $100 - $110M Full Year Q4 Forecast(2) Tot Rev Growth % (Mid Range) EPS Midpoint Prior Full Year Forecast 2.0% $4.11 Base business (0.8%) (0.03) Translation 0.7% 0.03 Non Operating / Other - 0.03 Acquistions (0.2%) (0.02) Dec Surfaces: Two Month Reduction (1.1%) (0.03) YTD and Forecasted Share Repurchase - 0.01 Current Full Year Forecast 0.6% $4.10
PROFITABLE GROWTH, STRONG RETURNS R FITABLE R TH, TR N ETURNS 100 YEARS STRONG Q&A 14

PROFITABLE GROWTH, STRONG RETURNS R FITABLE R TH, TR N ETURNS 100 YEARS STRONG Appendix: GAAP to Non-GAAP Reconciliations & Segment Tables 15
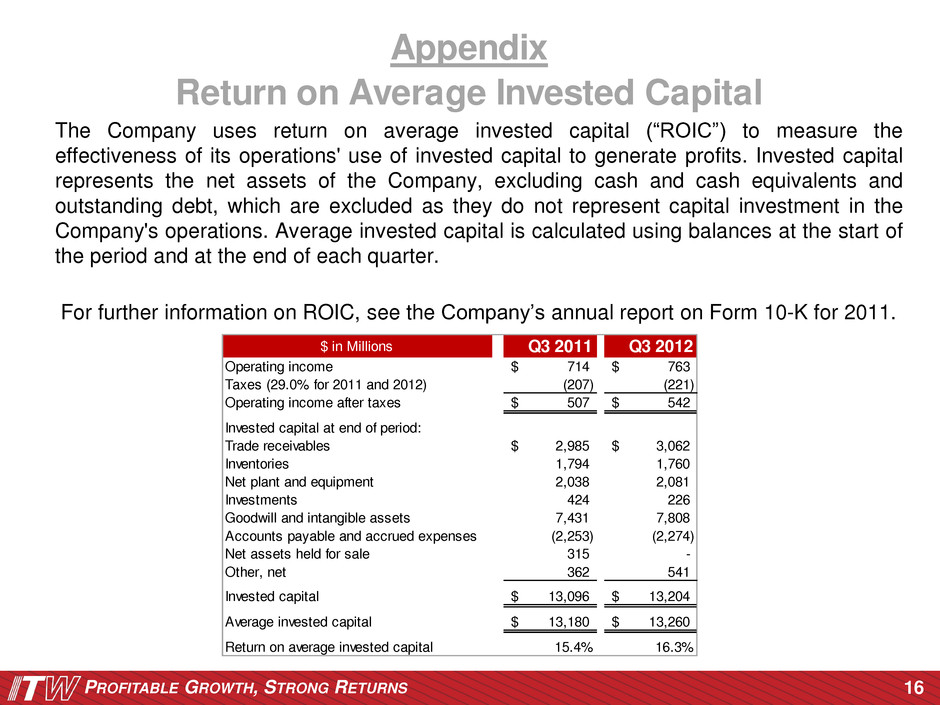
PROFITABLE GROWTH, STRONG RETURNS The Company uses return on average invested capital (“ROIC”) to measure the effectiveness of its operations' use of invested capital to generate profits. Invested capital represents the net assets of the Company, excluding cash and cash equivalents and outstanding debt, which are excluded as they do not represent capital investment in the Company's operations. Average invested capital is calculated using balances at the start of the period and at the end of each quarter. For further information on ROIC, see the Company’s annual report on Form 10-K for 2011. 16 $ in Millions Q3 2011 Q3 2012 Operating income 714$ 763$ Taxes (29.0% for 2011 and 2012) (207) (221) Operating income after taxes 507$ 542$ Invested capital at end of period: Trade receivables 2,985$ 3,062$ Inventories 1,794 1,760 Net plant and equipment 2,038 2,081 Investments 424 226 Goodwill and intangible assets 7,431 7,808 Accounts payable and accrued expenses (2,253) (2,274) Net assets held for sale 315 - Other, net 362 541 Invested capital 13,096$ 13,204$ Average invested capital 13,180$ 13,260$ Return on average invested capital 15.4% 16.3% Appendix Return on Average Invested Capital

PROFITABLE GROWTH, STRONG RETURNS The Company uses free operating cash flow to measure cash flow generated by operations that is available for dividends, acquisitions, share repurchases and debt repayment. Free operating cash flow represents net cash provided by operating activities less additions to plant and equipment. For further information on free operating cash flow, see the Company’s annual report on Form 10-K for 2011. 17 Appendix Free Operating Cash Flow $ in Millions Q1 2012 Q2 2012 Q3 2012 2012 YTD 2011 YTD Net cash provided by operating activities 323 509 635 1,467 ,244 Additions to plant and equipment (84) (1 0) (90) (274) ( 59) Free Operating C sh Flow 239 409 545 1,193 985
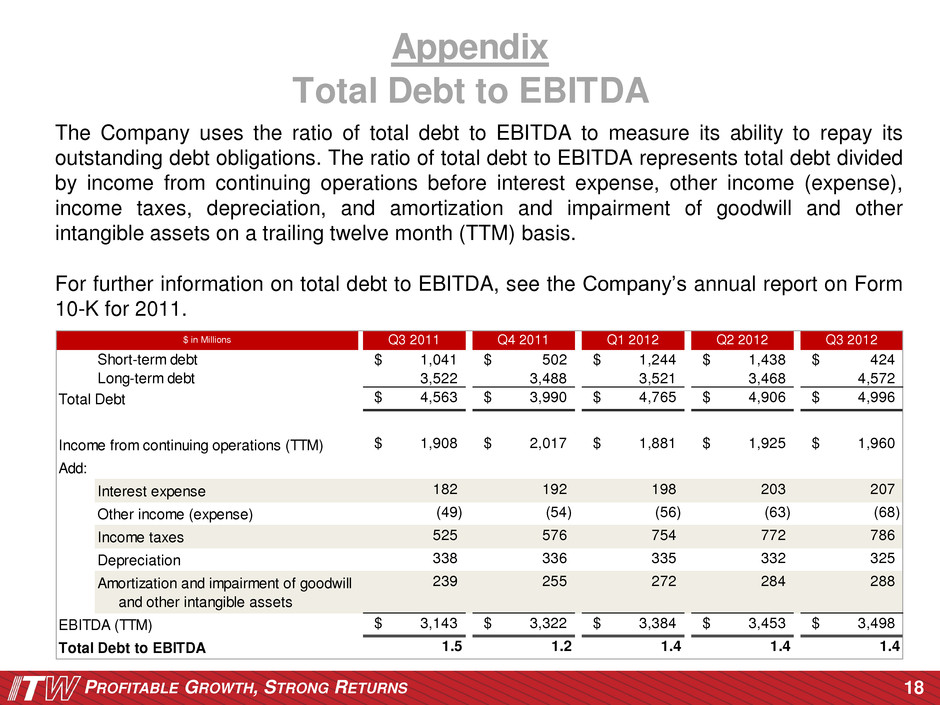
PROFITABLE GROWTH, STRONG RETURNS The Company uses the ratio of total debt to EBITDA to measure its ability to repay its outstanding debt obligations. The ratio of total debt to EBITDA represents total debt divided by income from continuing operations before interest expense, other income (expense), income taxes, depreciation, and amortization and impairment of goodwill and other intangible assets on a trailing twelve month (TTM) basis. For further information on total debt to EBITDA, see the Company’s annual report on Form 10-K for 2011. 18 Q3 2011 Q4 2011 Q1 2012 Q2 2012 Q3 2012 Short-term debt 1,041$ 502$ 1,244$ 1,438$ 424$ Long-term debt 3,522 3,488 3,521 3,468 4,572 Total Debt 4,563$ 3,990$ 4,765$ 4,906$ 4,996$ Income from continuing operations (TTM) 1,908$ 2,017$ 1,881$ 1,925$ 1,960$ Add: Interest expense 182 192 198 203 207 Other income (expense) (49) (54) (56) (63) (68) Income taxes 525 576 754 772 786 D preciation 338 336 335 332 325 Am rtization and impairment of goodwill and other intangible assets 239 255 272 284 288 EBITDA (TTM) 3,143$ 3,322$ 3,384$ 3,453$ 3,498$ Total Debt to EBITDA 1.5 1.2 1.4 1.4 1.4 $ in Millions Appendix Total Debt to EBITDA
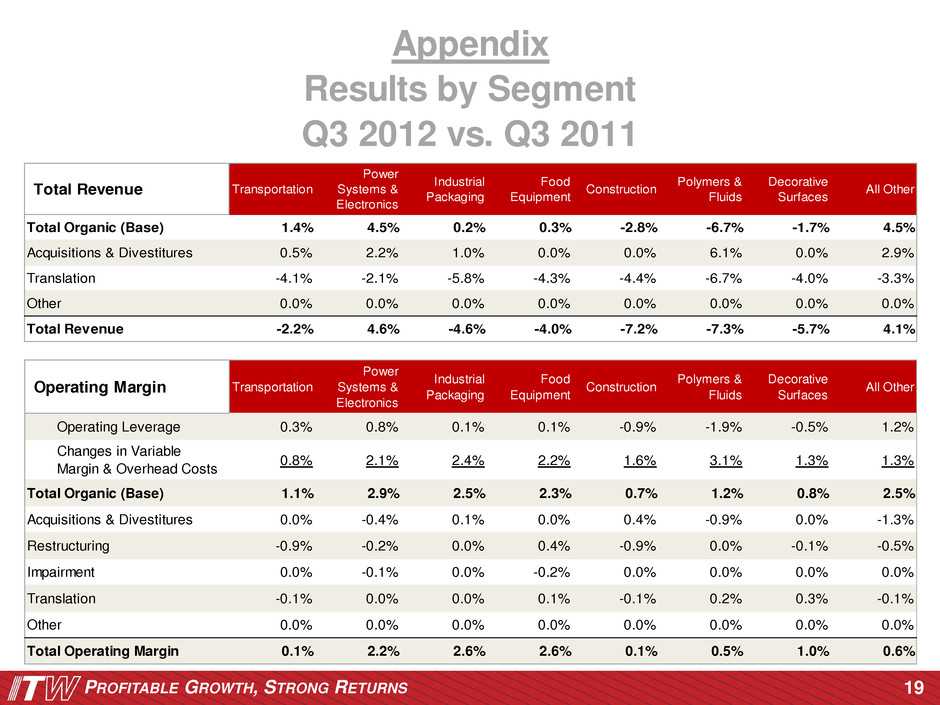
PROFITABLE GROWTH, STRONG RETURNS 19 Appendix Results by Segment Q3 2012 vs. Q3 2011 Total Revenue Transportation Power Systems & Electronics Industrial Packaging Food Equipment Construction Polymers & Fluids Decorative Surfaces All Other Total Organic (Bas ) 1.4% 4.5% 0.2% 0.3% -2.8% -6.7% -1.7% 4.5% Acquisitions & Divestitures 0.5% 2.2% 1.0% 0.0% 0.0% 6.1% 0.0% 2.9% Translation -4.1% -2.1% -5.8% -4.3% -4.4% -6.7% -4.0% -3.3% Other 0.0% 0.0% 0.0% 0.0% 0.0% 0.0% 0.0% 0.0% Total Revenue -2.2% 4.6% -4.6% -4.0% -7.2% -7.3% -5.7% 4.1% Operating Margin Transportation Power Systems & Electronics Industrial Packaging Food Equipment Construction Polymers & Fluids Decorative Surfaces All Other Operating Leverage 0.3% 0.8% 0.1% 0.1% -0.9% -1.9% -0.5% 1.2% Changes in Variable Margin & Overhead Costs 0.8% 2.1% 2.4% 2.2% 1.6% 3.1% 1.3% 1.3% Total Organic (Base) 1.1% 2.9% 2.5% 2.3% 0.7% 1.2% 0.8% 2.5% Acquisitions & Divestitures 0.0 -0.4 .1 .0 0.4 -0.9 0.0 -1.3 Restructuring 0.9 0.2 0.0 0.4 0.9 0.0 0.1 0.5 Impairment . - .1 . - .2 . . . . Translation -0.1% 0.0% 0.0% 0.1% -0.1% 0.2% 0.3% -0.1% Other 0.0% 0.0% 0.0% 0.0% 0.0% 0.0% 0.0% 0.0% Total Operating Margin 0.1% 2.2% 2.6% 2.6% 0.1% 0.5% 1.0% 0.6%


