Exhibit 99.1
Q3 news release
FOR THE NINE MONTHS ENDED SEPTEMBER 30, 2009
|
Calgary, October 29, 2009 | ||
Imperial Oil announces estimated third-quarter financial and operating results |
Third Quarter
| Nine Months
| |||||||||||||||||||||||||||
(millions of dollars, unless noted) | 2009 | 2008 | % | 2009 | 2008 | % | ||||||||||||||||||||||
Net income (U.S. GAAP) | 547 | 1,389 | (61) | 1,045 | 3,218 | (68) | ||||||||||||||||||||||
Net income per common share | ||||||||||||||||||||||||||||
- assuming dilution (dollars) | 0.64 | 1.57 | (59) | 1.22 | 3.60 | (66) | ||||||||||||||||||||||
Capital and exploration expenditures | 575 | 360 | 60 | 1,604 | 930 | 72 |
Bruce March, chairman, president and chief executive officer of Imperial Oil, commented:
“Net income for the third quarter was $547 million, down 61 percent from the third quarter of 2008, but up 162 percent from the second quarter of 2009. Earnings in the third quarter were down from the same quarter in 2008 primarily due to lower Upstream crude oil and natural gas commodity prices as a result of the global economic downturn. Downstream earnings in the third quarter of 2009 were impacted by reduced demand for products, resulting in lower overall downstream margins.
Net income for the first nine months of 2009 was $1,045 million or $1.22 a share, versus $3,218 million or $3.60 a share for the first nine months of 2008.
Continued lower commodity prices and tight downstream margins resulted in challenging business conditions for the quarter compared to the same period last year. Imperial continues to weather this economic downturn well, with earnings supporting our investments in company growth projects through the down cycle. Our proven approach of focusing on those elements of the business within our control, combined with prudent financial management and disciplined capital investment, will continue to reward our shareholders in these uncertain times.
Imperial Oil continued its long-term focus and disciplined approach to capital investment. In the third quarter, capital and exploration expenditures increased to $575 million, up 60 percent from the same period last year. For the first nine months of 2009, capital and exploration expenditures were $1,604 million, an increase of 72 percent over the first nine months of 2008. The company continues to develop its outstanding portfolio of company growth projects, delivering new energy supplies which are vital to economic growth.
During the first nine months of 2009, the company distributed $747 million cash to shareholders through dividends of $257 million and share repurchases of $490 million.”
|
1
Imperial Oil is one of Canada’s largest corporations and a leading member of the country’s petroleum industry. The company is a major producer of crude oil and natural gas, and one of the largest petroleum refiners and marketers with a coast-to-coast supply network that includes about 1,900 retail service stations. |
2
Third quarter items of interest
| ||||
¡ | Net income was $547 million, versus $1,389 million for the third quarter of 2008, and $209 million for the second quarter of 2009. | |||
¡ | Net income per common share was $0.64, versus $1.57 for the third quarter of 2008. | |||
¡ | Cash flow from operating activities was $698 million, compared with $1,635 million in the same period last year. | |||
¡ | Capital and exploration expenditures were $575 million, versus $360 million for the third quarter of 2008. | |||
¡ | Gross oil-equivalent barrels of production averaged 304,000 barrels a day, compared with 310,000 barrels a day in the same period last year. | |||
¡ | Kearl oil sands project update | |||
Following board approval of the first phase of Kearl in May, the project has been proceeding with detailed design, procurement and construction activities with a current workforce of about 3,000 employees and contractors. Kearl will be developed in three phases and could ultimately produce more than 300,000 barrels of bitumen a day before royalties. The first phase of the project is expected to start up in late 2012. Imperial holds a 71-percent interest in the project and is the operator in this joint venture with ExxonMobil Canada. | ||||
¡ | Cold Lake surpasses one billion barrels of production | |||
The company’s Cold Lake heavy oil operation in northeastern Alberta has surpassed one billion barrels of cumulative production. Only three other fields in Canada have achieved this milestone, and it is the only in-situ operation to have done so. During four decades of operation at Cold Lake, technological advancements have tripled recovery rates while reducing fresh water use and surface land disturbance. | ||||
¡ | Cold Lake expansion | |||
In September, Imperial filed amendment applications for the previously approved Cold Lake Nabiye project (2004). The proposed changes to the project will result in improved energy efficiency, reduced greenhouse gas and sulphur dioxide emissions, and reduced surface footprint. The Nabiye expansion is continuing to be advanced, and if sanctioned, will add about 30,000 barrels a day of production from a new plant. The expansion will access 250 million barrels of previously undeveloped resource at the Cold Lake heavy oil operation.
|
3
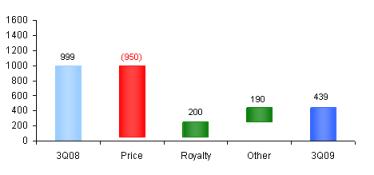
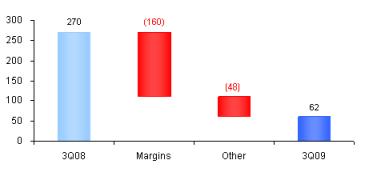
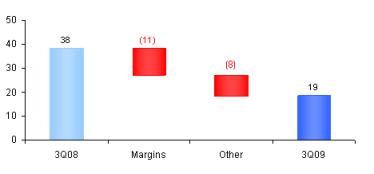
Third quarter 2009 vs. third quarter 2008
Upstream net income in the third quarter was $439 million versus $999 million in the same period of 2008. Earnings decreased primarily due to lower crude oil and natural gas commodity prices of about $950 million as a result of the global economic downturn. Lower realizations were partially offset by lower royalty costs due to lower commodity prices of about $200 million, the impact of a lower Canadian dollar of about $115 million and lower energy costs of about $95 million.
The average price of Brent crude oil in U.S. dollars, a common benchmark for world oil markets, was $68.29 a barrel in the third quarter, down about 41 percent from the corresponding period last year. The company’s realizations on sales of Canadian conventional crude oil mirrored the same trend as world prices, decreasing about 43 percent in the third quarter, compared to the same period last year.
The company’s average realizations for Cold Lake heavy oil also declined about 40 percent in the third quarter of 2009, compared to the corresponding period last year. The decline was less than that of lighter crude oil, due to the narrowing price spread between light crude oil and Cold Lake heavy oil.
The company’s average realizations for natural gas averaged $2.90 a thousand cubic feet in the third quarter, down from $9.20 in the same quarter last year.
Gross production of Cold Lake heavy oil averaged 145 thousand barrels a day during the third quarter, versus 143 thousand barrels in the same quarter last year. The cyclic nature of production at Cold Lake and lower maintenance activities contributed primarily to the increase in production in the third quarter of 2009.
The company’s share of Syncrude’s gross production in the third quarter was 78 thousand barrels a day, versus 79 thousand barrels in the third quarter of 2008.
Gross production of conventional crude oil averaged 25 thousand barrels a day in the third quarter, essentially the same as the corresponding period of 2008.
Gross production of natural gas during the third quarter of 2009 decreased to 291 million cubic feet a day from 309 million cubic feet in the same period last year. The lower production volume was primarily a result of natural reservoir decline.
Net income from Downstream was $62 million in the third quarter of 2009, compared with $270 million in the same period a year ago. When compared to the same period in 2008, earnings in the third quarter of 2009 were negatively impacted by reduced demand for products, resulting in lower overall downstream margins of about $160 million. North American refining margins in the third quarter of 2008 were significantly higher as a result of Hurricane Gustav in the Gulf of Mexico. Also impacting third quarter 2009 earnings were lower sales volumes due to the slowdown in the economy.
Chemical net income was $19 million in the third quarter, compared with $38 million in the same quarter last year. Earnings were lower in the quarter primarily due to lower margins for polyethylene products.
Net income effects from Corporate and other were $27 million in the third quarter, compared with $82 million in the same period of 2008. The decrease in earnings effects in the third quarter reflected changes in share-based compensation charges.
Cash flow from operations was used to fund growth projects such as Kearl. The company will continue to evaluate its share-purchase program in the context of its overall capital activities.
In the third quarter of 2009, the company built $68 million of cash while funding its higher capital program requirements from operating cash flow.
|
4
First nine months 2009 vs. first nine months 2008
Net income for the first nine months of 2009 was $1,045 million or $1.22 a share on a diluted basis, versus $3,218 million or $3.60 a share for the first nine months of 2008.
First nine months highlights | ||||
¡ | Net income was $1,045 million, down from $3,218 million in the first nine months of 2008. | |||
¡ | Net income per common share decreased to $1.22 compared to $3.60 in the same period of 2008. | |||
¡ | Cash flow from operations was $664 million, versus $3,351 million in the same period of 2008. | |||
¡ | Capital and exploration expenditures were $1,604 million, up 72 percent. | |||
¡ | Gross oil-equivalent barrels of production averaged 292 thousands of barrels per day, compared to 309 thousands of barrels per day in the first nine months of 2008. | |||
¡ | Imperial distributed a total of $747 million cash to shareholders in 2009 through dividends and share repurchases, compared with $2,048 million in 2008. | |||
¡ | Per-share dividends declared in the first three quarters of 2009 totaled $0.30, up from $0.28 in the same period of 2008. | |||
Upstream net income for the first nine months was $833 million versus $2,587 million during the same period last year. Crude oil and natural gas commodity prices were lower by about $3,000 million compared to the first nine months of 2008. Earnings were also negatively impacted by lower cyclical Cold Lake heavy oil production of about $50 million, lower Syncrude volumes of about $30 million and lower conventional volumes from expected reservoir decline of about $30 million. These factors were partially offset by lower royalty costs due to lower commodity prices of about $750 million and the impact of a lower Canadian dollar of about $590 million.
The average price of Brent crude oil in U.S. dollars, a common benchmark for world oil markets, was $57.26 a barrel in the first nine months of 2009, down about 48 percent from the corresponding period last year. The company’s realizations on sales of Canadian conventional crude oil mirrored the same trend as world prices, decreasing about 47 percent in the first nine months of the year, compared to the same period last year.
The company’s average realizations for Cold Lake heavy oil also declined about 40 percent in the first three quarters of 2009, compared to the corresponding period last year. The decline was less than that of lighter crude oil, due to the narrowing price spread between light crude oil and Cold Lake heavy oil.
For the nine months of 2009, realizations for natural gas averaged $4.07 a thousand cubic feet, down from $9.16 in 2008.
|
5
First nine months 2009 vs. first nine months 2008 (continued)
For the first nine months, gross production of Cold Lake heavy oil was 144 thousand barrels a day this year, compared with 147 thousand barrels in the same period of 2008. Lower production in the first nine months of 2009 was primarily due to the cyclic nature of production at Cold Lake.
During the first nine months of 2009, the company’s share of gross production from Syncrude averaged 66 thousand barrels a day, down from 71 thousand barrels in 2008. Planned maintenance activities in the first half of 2009, which included design modifications to improve long-term operational performance, contributed to the reduced production in the first nine months of 2009.
Gross production of conventional crude oil averaged 25 thousand barrels a day in the first nine months of 2009, essentially the same as the corresponding period of 2008.
In the first nine months of the year, gross production of natural gas was 294 million cubic feet a day, down from 315 million cubic feet in the first nine months of 2008. The lower production volume was primarily a result of natural reservoir decline.
Nine-month net income from Downstream was $226 million, compared with $539 million in 2008. Earnings in the first nine months of 2008 included a gain of $187 million from the sale of Rainbow pipeline. Also impacting earnings in 2009 were lower overall downstream margins of about $90 million and lower sales volumes of about $60 million due to the slowdown in the economy. Higher planned maintenance activities at the refineries also negatively impacted earnings by $30 million. These factors were partially offset by the favourable impact of a weaker Canadian dollar of about $65 million.
Chemical nine-month net income was $30 million, compared with $72 million in 2008. Earnings in 2009 were negatively impacted by the slow economy, with lower overall margins and sales volumes.
For the nine months of 2009, net income effects from Corporate and other were negative $44 million, versus $20 million last year. Unfavourable earnings effects in the first nine months of 2009 were primarily due to higher share-based compensation charges and lower interest income from lower yields on cash balances.
During the first nine months of 2009, the company repurchased about 12 million shares for $490 million, including shares purchased from ExxonMobil.
Cash flow from operations was used to fund growth projects such as Kearl.
Key financial and operating data follow.
Forward-Looking Statements
Statements in this report relating to future plans, projections, events or conditions are forward-looking statements. Actual future results, including project plans, costs, timing and capacities; financing sources; the resolution of contingencies and uncertain tax positions; the effect of changes in prices and other market conditions; and environmental and capital expenditures could differ materially depending on a number of factors, such as the outcome of commercial negotiations; changes in the supply of and demand for crude oil, natural gas, and petroleum and petrochemical products; political or regulatory events; and other factors discussed in Item 1A of the company’s 2008 Form 10K.
|
6
Attachment I
IMPERIAL OIL LIMITED
THIRD QUARTER 2009
Third Quarter | Nine Months | |||||||
(millions of Canadian dollars, unless noted) | 2009 | 2008 | 2009 | 2008 | ||||
Net income (U.S. GAAP) | ||||||||
Total revenues and other income | 5,561 | 9,515 | 15,534 | 25,637 | ||||
Total expenses | 4,802 | 7,558 | 14,079 | 21,132 | ||||
Income before income taxes | 759 | 1,957 | 1,455 | 4,505 | ||||
Income taxes | 212 | 568 | 410 | 1,287 | ||||
Net income (U.S. GAAP) | 547 | 1,389 | 1,045 | 3,218 | ||||
Net income per common share (dollars) | 0.64 | 1.57 | 1.23 | 3.62 | ||||
Net income per common share - assuming dilution (dollars) | 0.64 | 1.57 | 1.22 | 3.60 | ||||
Gain/(loss) on asset sales, after tax | – | 2 | 26 | 203 | ||||
Total assets at September 30 | 16,822 | 18,627 | ||||||
Total debt at September 30 | 140 | 143 | ||||||
Interest coverage ratio - earnings basis | ||||||||
(rolling 4 quarters, times covered) | 248.3 | 265.7 | ||||||
Other long-term obligations at September 30 | 2,219 | 1,879 | ||||||
Shareholders’ equity at September 30 | 9,410 | 9,050 | ||||||
Capital employed at September 30 | 9,587 | 9,234 | ||||||
Return on average capital employed(a) | ||||||||
(rolling 4 quarters, percent) | 18.5 | 48.2 | ||||||
Dividends on common stock | ||||||||
Total | 85 | 88 | 255 | 249 | ||||
Per common share (dollars) | 0.10 | 0.10 | 0.30 | 0.28 | ||||
Millions of common shares outstanding | ||||||||
At September 30 | 847.6 | 869.7 | ||||||
Average - assuming dilution | 854.9 | 883.8 | 857.5 | 894.8 |
(a) Return on capital employed is net income excluding after-tax cost of financing divided by the average rolling four quarters’ capital employed.
7
Attachment II
IMPERIAL OIL LIMITED
THIRD QUARTER 2009
Third Quarter | Nine Months | |||||||||||
(millions of Canadian dollars) | 2009 | 2008 | 2009 | 2008 | ||||||||
Total cash and cash equivalents | 458 | 1,933 | 458 | 1,933 | ||||||||
Net income | 547 | 1,389 | 1,045 | 3,218 | ||||||||
Adjustment for non-cash items: | ||||||||||||
Depreciation and depletion | 194 | 188 | 584 | 550 | ||||||||
(Gain)/loss on asset sales | – | (4 | ) | (32 | ) | (236 | ) | |||||
Deferred income taxes and other | (6 | ) | 137 | (49 | ) | (105 | ) | |||||
Changes in operating assets and liabilities | (37 | ) | (75 | ) | (884 | ) (a) | (76 | ) | ||||
Cash from (used in) operating activities | 698 | 1,635 | 664 | 3,351 | ||||||||
Cash from (used in) investing activities | (545 | ) | (307 | ) | (1,431 | ) | (581 | ) | ||||
Sales of subsidiaries, investments and property, plant and equipment | 8 | 19 | 45 | 260 | ||||||||
Cash from (used in) financing activities
| (85 | ) | (690 | ) | (749 | ) | (2,045 | ) |
(a) Year-to-date 2009 cash flow from operating activities was negatively impacted by the timing of scheduled income tax payments.
8
Attachment III
IMPERIAL OIL LIMITED
THIRD QUARTER 2009
Third Quarter | Nine Months | ||||||||
(millions of Canadian dollars) | 2009 | 2008 | 2009 | 2008 | |||||
Net income (U.S. GAAP) | |||||||||
Upstream | 439 | 999 | 833 | 2,587 | |||||
Downstream | 62 | 270 | 226 | 539 | |||||
Chemical | 19 | 38 | 30 | 72 | |||||
Corporate and other | 27 | 82 | (44 | ) | 20 | ||||
Net income (U.S. GAAP) | 547 | 1,389 | 1,045 | 3,218 | |||||
Operating revenues by segment | |||||||||
Upstream | 921 | 1,692 | 2,560 | 4,977 | |||||
Downstream | 4,380 | 7,393 | 12,217 | 19,223 | |||||
Chemical | 246 | 393 | 684 | 1,127 | |||||
Operating revenues | 5,547 | 9,478 | 15,461 | 25,327 | |||||
Production and manufacturing expenses | |||||||||
Upstream | 549 | 671 | 1,825 | 1,927 | |||||
Downstream | 313 | 369 | 1,049 | 1,097 | |||||
Chemical | 47 | 52 | 142 | 159 | |||||
Production and manufacturing expenses | 909 | 1,092 | 3,016 | 3,183 | |||||
Capital and exploration expenditures | |||||||||
Upstream | 504 | 288 | 1,422 | 755 | |||||
Downstream | 64 | 67 | 167 | 162 | |||||
Chemical | 6 | 3 | 12 | 7 | |||||
Corporate and other | 1 | 2 | 3 | 6 | |||||
Capital and exploration expenditures | 575 | 360 | 1,604 | 930 | |||||
Exploration expenses charged to income included above
| 21 | 34 | 126 | 91 |
9
Attachment IV
IMPERIAL OIL LIMITED
THIRD QUARTER 2009
Third Quarter | Nine Months | |||||||
Operating statistics | 2009 | 2008 | 2009 | 2008 | ||||
Gross crude oil and NGL production (thousands of barrels a day) | ||||||||
Cold Lake | 145 | 143 | 144 | 147 | ||||
Syncrude | 78 | 79 | 66 | 71 | ||||
Conventional | 25 | 27 | 25 | 27 | ||||
Total crude oil production | 248 | 249 | 235 | 245 | ||||
Natural gas liquids (NGLs) available for sale | 7 | 9 | 8 | 11 | ||||
Total crude oil and NGL production | 255 | 258 | 243 | 256 | ||||
Gross natural gas production (millions of cubic feet a day) | 291 | 309 | 294 | 315 | ||||
Gross oil-equivalent productiona | ||||||||
(thousands of oil-equivalent barrels a day) | 304 | 310 | 292 | 309 | ||||
Net crude oil and NGL production (thousands of barrels a day) | ||||||||
Cold Lake | 116 | 117 | 124 | 122 | ||||
Syncrude | 67 | 66 | 62 | 60 | ||||
Conventional | 19 | 20 | 21 | 19 | ||||
Total crude oil production | 202 | 203 | 207 | 201 | ||||
Natural gas liquids (NGLs) available for sale | 6 | 7 | 6 | 9 | ||||
Total crude oil and NGL production | 208 | 210 | 213 | 210 | ||||
Net natural gas production (millions of cubic feet a day) | 295 | 248 | 278 | 254 | ||||
Net oil-equivalent productiona | ||||||||
(thousands of oil-equivalent barrels a day) | 257 | 251 | 259 | 252 | ||||
Cold Lake blend sales (thousands of barrels a day) | 185 | 180 | 187 | 191 | ||||
NGL Sales (thousands of barrels a day) | 9 | 8 | 9 | 11 | ||||
Natural gas sales (millions of cubic feet a day) | 269 | 286 | 270 | 287 | ||||
Average realizations and prices (Canadian dollars) | ||||||||
Conventional crude oil realizations (a barrel) | 65.29 | 114.58 | 57.30 | 108.89 | ||||
NGL realizations (a barrel) | 36.24 | 78.21 | 38.14 | 65.70 | ||||
Natural gas realizations (a thousand cubic feet) | 2.90 | 9.20 | 4.07 | 9.16 | ||||
Syncrude realizations (a barrel) | 73.27 | 127.34 | 65.95 | 120.30 | ||||
Western Canada Select heavy oil (a barrel) | 63.74 | 103.94 | 55.67 | 94.70 | ||||
Refinery throughput (thousands of barrels a day) | 417 | 468 | 414 | 448 | ||||
Refinery capacity utilization (percent) | 83 | 93 | 82 | 89 | ||||
Petroleum product sales (thousands of barrels a day) | ||||||||
Gasolines | 204 | 210 | 200 | 203 | ||||
Heating, diesel and jet fuels | 138 | 160 | 143 | 157 | ||||
Heavy fuel oils | 22 | 32 | 26 | 29 | ||||
Lube oils and other products | 43 | 51 | 39 | 46 | ||||
Net petroleum products sales | 407 | 453 | 408 | 435 | ||||
Petrochemical Sales (thousands of tonnes a day) | 2.8 | 2.8 | 2.8 | 3.0 | ||||
(a) Gas converted to oil-equivalent at 6 million cubic feet = 1 thousand barrels
|
10
Attachment V
IMPERIAL OIL LIMITED
THIRD QUARTER 2009
Net income (U.S. GAAP) | Net income per common share | |||||
(millions of Canadian dollars) | (dollars) | |||||
2005 | ||||||
First Quarter | 393 | 0.38 | ||||
Second Quarter | 539 | 0.52 | ||||
Third Quarter | 652 | 0.64 | ||||
Fourth Quarter | 1,016 | 1.00 | ||||
Year | 2,600 | 2.54 | ||||
2006 | ||||||
First Quarter | 591 | 0.60 | ||||
Second Quarter | 837 | 0.85 | ||||
Third Quarter | 822 | 0.84 | ||||
Fourth Quarter | 794 | 0.83 | ||||
Year | 3,044 | 3.12 | ||||
2007 | ||||||
First Quarter | 774 | 0.82 | ||||
Second Quarter | 712 | 0.76 | ||||
Third Quarter | 816 | 0.88 | ||||
Fourth Quarter | 886 | 0.97 | ||||
Year | 3,188 | 3.43 | ||||
2008 | ||||||
First Quarter | 681 | 0.76 | ||||
Second Quarter | 1,148 | 1.29 | ||||
Third Quarter | 1,389 | 1.57 | ||||
Fourth Quarter | 660 | 0.77 | ||||
Year | 3,878 | 4.39 | ||||
2009 | ||||||
First Quarter | 289 | 0.34 | ||||
Second Quarter | 209 | 0.25 | ||||
Third Quarter
| 547 | 0.64 |
11
IMPERIAL OIL LIMITED
THIRD QUARTER 2009
Factors affecting net income(millions of Canadian dollars)
Upstream Earnings 3Q09 vs 3Q08
| ||||||
![]() | ||||||
3Q09 | 3Q08 | 3Q09 vs 3Q08 | ||||
439 | 999 | (560) | ||||
Downstream Earnings 3Q09 vs 3Q08 | ||||||
3Q09 | 3Q08 | 3Q09 vs 3Q08 | ||||
62 | 270 | (208) | ||||
Chemical Earnings 3Q09 vs 3Q08 | ||||||
| ||||||
3Q09 | 3Q08 | 3Q09 vs 3Q08 | ||||
19 | 38 | (19) | ||||
12