Exhibit 99.1
| | |
| | |
| | Q3 news release FOR THE NINE MONTHS ENDED SEPTEMBER 30, 2010 |
| | |
| | Calgary, November 1, 2010 Imperial Oil announces estimated third-quarter financial and operating results |
| | | | | | | | | | | | | | | | | | | | | | | | | | | | |
| | | Third quarter | | | | | | Nine months | |
| (millions of dollars, unless noted) | | 2010 | | | 2009 | | | % | | | | | | 2010 | | | 2009 | | | % | |
| | | | | | | |
Net income (U.S. GAAP) | | | 418 | | | | 547 | | | | (24 | ) | | | | | | | 1,411 | | | | 1,045 | | | | 35 | |
Net income per common share | | | | | | | | | | | | | | | | | | | | | | | | | | | | |
- assuming dilution (dollars) | | | 0.49 | | | | 0.64 | | | | (23 | ) | | | | | | | 1.65 | | | | 1.22 | | | | 35 | |
| | | | | | | |
Capital and exploration expenditures | | | 1,199 | | | | 575 | | | | 109 | | | | | | | | 2,980 | | | | 1,604 | | | | 86 | |
| | |
| | Bruce March, chairman, president and chief executive officer of Imperial Oil, commented: |
| | “Imperial Oil achieved solid results with third quarter earnings of $418 million or $0.49 per share. Our earnings were down from $547 million in the third quarter of 2009 due to lower upstream volumes primarily from a planned downtime at Syncrude, unfavourable foreign exchange effects of a stronger Canadian dollar, and third-party pipeline reliability issues that negatively impacted heavy crude oil industry sales and realizations. Strong operating performance in downstream business segments offset continued weak industry margins. |
| | Earnings for the first nine months of 2010 were $1,411 million or $1.65 per share, up from $1,045 million in the first nine months of 2009, an increase of 35 percent. |
| | Imperial Oil’s proven approach of taking a long-term view and focusing on disciplined capital investment and financial management will continue to reward our shareholders. Strong cash flow from operating activities continued to substantially fund our record capital investment program. Capital and exploration expenditures were $1,199 million in the third quarter, about double the third quarter of 2009. These expenditures were directed primarily to the development of our Kearl oil sands company growth project.” |
| | |
| | Imperial Oil is one of Canada’s largest corporations and a leading member of the country’s petroleum industry. The company is a major producer of crude oil and natural gas, Canada’s largest petroleum refiner and a leading marketer with a coast-to-coast supply network that includes about 1,850 retail service stations. |
1
| | |

|
| | |
| | | | | | |
| |
| | Third quarter items of interest |
| | |
| | — | | Net income was $418 million, compared with $547 million for the third quarter of 2009, a decrease of 24% or $129 million. |
| | |
| | — | | Net income per common share was $0.49, a decrease of 23% from the third quarter of 2009. |
| | |
| | — | | Cash generated from operating activities was $965 million, compared with $698 million in the same period last year. |
| | |
| | — | | Capital and exploration expenditures were $1,199 million, up 109% from the third quarter of 2009, supporting the Kearl oil sands and other growth projects. |
| | |
| | — | | Gross oil-equivalent barrels of production averaged 281,000 barrels a day, compared with 304,000 barrels a day in the same period last year. Lower production volumes in the third quarter were primarily due to planned maintenance activities at Syncrude and the cyclic nature of production at Cold Lake. |
| | |
| | — | | Kearl oil sands project update: |
| | | |
| | | | - | | The company is currently reconfiguring its Kearl project development plan to include a combination of debottlenecking and expansion to minimize facility requirements and to reduce the plant footprint. The approach will leverage our execution learnings, take advantage of the investments in infrastructure that would not need to be duplicated in the future and will utilize our successful “design one, build many” approach to replicate facilities. The overall production profile and total resource developed at Kearl remain relatively unchanged for the reconfigured project. It is expected that the capital investments’ spending profile of the first phase of the project will be higher based on the adjustments mentioned above. |
| | | |
| | | | - | | The Kearl project’s tailings management plan was approved by Alberta’s Energy Resources Conservation Board (ERCB) on August 11, 2010. |
| | |
| | — | | Nabiye project update – The regulatory approval process for Imperial’s Nabiye expansion project advanced with the recent ERCB Cold Lake scheme amendment and Alberta Utilities Commission approvals. The expansion will add new producing well pads, a processing plant, cogeneration facilities and about 30,000 barrels a day to Cold Lake’s production. Current activities include plant site clearing, grading and road construction. |
| | |
| | — | | Horn River update – Imperial is planning to drill a horizontal multi-well pad pilot development to evaluate longer-term well productivity this winter season. The company also added an additional 11,000 acres, bringing its joint venture holdings to 321,000 net acres – one of industry’s largest acreage positions in the area. |
| | |
| | — | | Beaufort Sea – Imperial and ExxonMobil Canada signed a joint operator agreement with BP to share exploration and potential development work on their exploration licenses in the Beaufort Sea. Imperial or ExxonMobil Canada will be the operator and further exploration activities will only proceed with proper regulatory approval. |
| | |
| | — | | Tim Hortons alliance – Imperial Oil and Tim Hortons signed a 10-year agreement to extend their existing alliance. The agreement includes a commitment to add 175 Tim Hortons locations at Esso sites across Canada over the next 10 years. Tim Hortons began opening kiosks inside Esso gas stations in 1994 and there are now more than 350 of these sites across Canada. |
2
| | |
|
| | |
| | |
| | Third quarter 2010 vs. third quarter 2009 |
| | The company’s net income for the third quarter of 2010 was $418 million or $0.49 a share on a diluted basis, compared with $547 million or $0.64 a share for the same period last year. |
| | Although third quarter earnings were lower, underlying business operations remained strong across all segments of the company. The lower third quarter earnings were primarily attributable to planned maintenance activities at Syncrude, impacting earnings by about $90 million, and the unfavourable foreign exchange effects of a stronger Canadian dollar of about $70 million. These factors were partially offset by the combined impacts of upstream commodity prices and downstream margins totaling about $75 million. The company estimates that third-party pipeline reliability issues negatively impacted third quarter earnings by about $60 million; this effect, which will carry-over in fourth quarter results, has been reflected in the overall commodity price and margins factor above. |
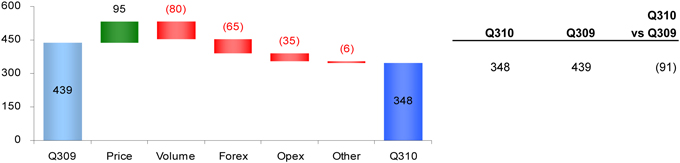
| | Upstream net income in the third quarter was $348 million versus $439 million in the same period of 2009. Earnings decreased primarily due to higher costs and lower volumes at Syncrude, mainly a result of planned maintenance activities, totaling about $90 million. Earnings were also negatively impacted by the unfavourable foreign exchange effects of a stronger Canadian dollar of about $65 million and lower Cold Lake bitumen production and lower conventional volumes totaling about $25 million. These factors were partially offset by higher crude oil and natural gas commodity prices in the third quarter of 2010 which contributed to higher earnings of about $95 million. Third-party pipeline reliability issues in the third quarter negatively impacted the transportation of western crude oil. The company estimates the negative impact on earnings of about $45 million from lower realizations, the effect of which has been reflected in the commodity price factor above. |
| | The average price of Brent crude oil in U.S. dollars, a common benchmark for world oil markets, was $76.85 a barrel in the third quarter, up about 13 percent from the corresponding period last year. The company’s average realizations on sales of Canadian conventional crude oil and synthetic crude oil from Syncrude production also increased. The company’s average bitumen realizations were also higher in the third quarter, but by less than the relative increase in light crude oil prices, reflecting a widened price spread between the lighter crude oils and Cold Lake bitumen, attributable to third-party pipeline outages. |
| | Gross production of Cold Lake bitumen averaged 139 thousand barrels a day during the third quarter, versus 145 thousand barrels in the same quarter last year. Lower volumes were due to the cyclic nature of production at Cold Lake. |
| | The company’s share of Syncrude’s gross production in the third quarter was 66 thousand barrels a day, versus 78 thousand barrels in the third quarter of 2009. Lower volumes were the result of planned maintenance activities, which began in September 2010 and will complete in late October 2010. |
| | Gross production of conventional crude oil averaged 22 thousand barrels a day in the third quarter, down from 25 thousand barrels in the third quarter of 2009. Planned maintenance activities at the Norman Wells field and natural reservoir decline were the main contributors to the lower production. |
| | Gross production of natural gas during the third quarter of 2010 was 284 million cubic feet a day, down slightly from 291 million cubic feet in the same period last year. The lower production volume was primarily a result of maintenance activities and natural reservoir decline. |
| | Downstream net income was $69 million in the third quarter of 2010, compared with $62 million in the same period a year ago. Improved refinery operations as well as improved sales volumes when compared to the low levels in the third quarter of 2009 contributed about $25 million to the earnings increase. These factors were partially offset by lower overall margins of about $20 million, which included the negative impact of the third-party pipeline outages. |
3
| | |
| | Third quarter 2010 vs. third quarter 2009 (continued) |
| | |
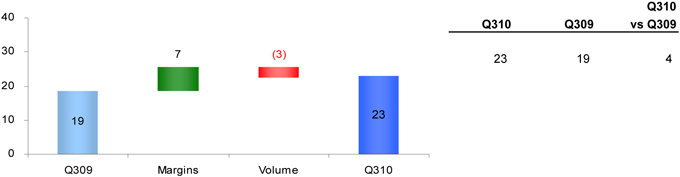
| | Chemical net income was $23 million in the third quarter, $4 million higher than the same quarter last year. Improved industry margins for polyethylene and intermediate products were partially offset by lower sales volumes for polyethylene products. |
| | Net income effects from Corporate and other were negative $22 million in the third quarter, compared with $27 million in the same period of 2009. The change in earnings effects was primarily due to changes in share-based compensation charges in the third quarter of 2010. |
| �� | Cash flow generated from operating activities was $965 million during the third quarter of 2010, compared with $698 million in the same period last year. Higher cash flow was primarily driven by working capital effects partially offset by lower earnings. |
| | Investing activities used net cash of $1,113 million in the third quarter, an increase of $568 million from the corresponding period in 2009. Capital and exploration expenditures were $1,199 million in the third quarter, compared with $575 million during the same quarter 2009. Expenditures during the quarter were primarily directed towards the advancement of the Kearl oil sands project. Other investments included development drilling at Cold Lake, exploration drilling at Horn River as well as environmental and other projects at Syncrude. |
| | In the third quarter, the company increased its debt level by $228 million by drawing on existing facilities. |
| | The company’s balance of cash was $51 million at September 30, 2010, compared with $513 million at the end of 2009. |
4
| | | | |
| | Nine months highlights |
| | — | | Net income was $1,411 million, up from $1,045 million in the nine months of 2009. |
| | — | | Net income per common share increased to $1.65 compared to $1.22 in the same period of 2009. |
| | — | | Cash generated from operations was $2,203 million, versus $664 million in the nine months of 2009. |
| | — | | Capital and exploration expenditures were $2,980 million, up 86 percent, supporting the Kearl oil sands and other growth projects. |
| | — | | Gross oil-equivalent barrels of production averaged 291 thousands of barrels per day, compared to 292 thousands of barrels per day in the nine months of 2009. |
| | — | | Per-share dividends declared in the first three quarters of 2010 totaled $0.32, up from $0.30 in the same period of 2009. |
| | |
| | Nine months 2010 vs. nine months 2009 |
| | Net income for the first nine months of 2010 was $1,411 million or $1.65 a share on a diluted basis, versus $1,045 million or $1.22 a share for the nine months of 2009. |
| | For the nine months, earnings increased primarily due to the impacts of higher upstream commodity prices of about $800 million, higher Syncrude volumes of about $90 million and improved refinery operations and lower refinery maintenance activities totaling about $75 million. These factors were partially offset by the unfavourable effects of a stronger Canadian dollar of about $330 million, higher royalty costs due to higher commodity prices of about $240 million, and lower overall downstream margins of about $110 million. Earnings in the nine months of 2010 also included higher gain of about $25 million from sale of non-operating assets. |
| | Upstream net income for the nine months was $1,238 million versus $833 million during the same period last year. Higher crude oil and natural gas commodity prices in 2010 increased revenues, contributing to higher earnings of about $800 million. Earnings were also positively impacted by higher Syncrude volumes, reflecting improved reliability, of about $90 million. These factors were partially offset by the impact of a stronger Canadian dollar of about $265 million and higher royalty costs due to higher commodity prices of about $240 million. |
| | The average price of Brent crude oil in U.S. dollars, a common benchmark for world oil markets, was $77.15 a barrel in the nine months of 2010, up about 35 percent from the corresponding period last year. The company’s average realizations on sales of Canadian conventional crude oil and synthetic crude oil from Syncrude production also increased. The company’s average bitumen realizations were also higher in the first nine months of 2010, but by less than the relative increase in light crude oil prices, reflecting widened price spread between the lighter crude oils and Cold Lake bitumen, attributable to third-party pipeline outages. |
| | For the nine months, gross production of Cold Lake bitumen was 143 thousand barrels a day this year, compared with 144 thousand barrels in the same period of 2009. |
| | During the nine months of the year, the company’s share of gross production from Syncrude averaged 71 thousand barrels a day, up from 66 thousand barrels in 2009. Increased production in the nine months of 2010 was due to improved operational reliability. |
5
| | |
| | Nine months 2010 vs. nine months 2009 (continued) |
| | |
| | Gross production of conventional crude oil in the first nine months of the year was 23 thousand barrels a day, compared with 25 thousand barrels in 2009. Planned maintenance activities at the Norman Wells field and natural reservoir decline were the main contributors to the lower production. |
| |
| | In the nine months of the year, gross production of natural gas was 282 million cubic feet a day, down from 294 million cubic feet in the nine months of 2009. The lower production volume was primarily a result of maintenance activities and natural reservoir decline. |
| |
| | Nine-month net income from Downstream was $176 million, compared with $226 million in 2009. Lower earnings were primarily due to lower overall margins of about $110 million and the unfavourable effects of a stronger Canadian dollar of about $60 million. These factors were partially offset by the favourable impacts of about $75 million associated with improved refinery operations and lower refinery maintenance activities and $35 million gain from sale of non-operating assets. |
| |
| | Chemical net income for the first nine months was $44 million, up $14 million from the same period in 2009. Improved industry margins were partially offset by lower sales volumes for polyethylene products and higher costs due to planned maintenance activities. |
| |
| | For the nine months of 2010, net income from Corporate and other was negative $47 million, in line with negative $44 million reported last year. |
| |
| | Key financial and operating data follow. |
| |
| | Forward-Looking Statements |
| |
| | Statements in this report relating to future plans, projections, events or conditions are forward-looking statements. Actual future results, including project plans, costs, timing and capacities; financing sources; the resolution of contingencies and uncertain tax positions; the effect of changes in prices and other market conditions; and environmental and capital expenditures could differ materially depending on a number of factors, such as the outcome of commercial negotiations; changes in the supply of and demand for crude oil, natural gas, and petroleum and petrochemical products; political or regulatory events; and other factors discussed in Item 1A of the company’s 2010 Form 10K. |
6
Attachment I
IMPERIAL OIL LIMITED
THIRD QUARTER 2010
| | | | | | | | | | | | | | | | | | | | | | |
| | | Third Quarter | | | | | Nine Months | |
millions of Canadian dollars, unless noted | | 2010 | | | | | 2009 | | | | | 2010 | | | | | 2009 | |
| | | | | | | |
Net income (U.S. GAAP) | | | | | | | | | | | | | | | | | | | | | | |
Total revenues and other income | | | 5,851 | | | | | | 5,561 | | | | | | 18,156 | | | | | | 15,534 | |
Total expenses | | | 5,283 | | | | | | 4,802 | | | | | | 16,255 | | | | | | 14,079 | |
Income before income taxes | | | 568 | | | | | | 759 | | | | | | 1,901 | | | | | | 1,455 | |
Income taxes | | | 150 | | | | | | 212 | | | | | | 490 | | | | | | 410 | |
Net income | | | 418 | | | | | | 547 | | | | | | 1,411 | | | | | | 1,045 | |
| | | | | | | |
Net income per common share (dollars) | | | 0.49 | | | | | | 0.64 | | | | | | 1.66 | | | | | | 1.23 | |
Net income per common share - assuming dilution (dollars) | | | 0.49 | | | | | | 0.64 | | | | | | 1.65 | | | | | | 1.22 | |
| | | | | | | |
Gain/(loss) on asset sales, after tax | | | 10 | | | | | | - | | | | | | 50 | | | | | | 26 | |
| | | | | | | |
Total assets at September 30 | | | | | | | | | | | | | | | 19,398 | | | | | | 16,822 | |
| | | | | | | |
Total debt at September 30 | | | | | | | | | | | | | | | 457 | | | | | | 140 | |
Interest coverage ratio - earnings basis | | | | | | | | | | | | | | | | | | | | | | |
(rolling 4 quarters, times covered) | | | | | | | | | | | | | | | 331.8 | | | | | | 248.3 | |
| | | | | | | |
Other long-term obligations at September 30 | | | | | | | | | | | | | | | 2,443 | | | | | | 2,219 | |
| | | | | | | |
Shareholders’ equity at September 30 | | | | | | | | | | | | | | | 10,746 | | | | | | 9,410 | |
Capital employed at September 30 | | | | | | | | | | | | | | | 11,238 | | | | | | 9,587 | |
Return on average capital employed (a) | | | | | | | | | | | | | | | | | | | | | | |
(rolling 4 quarters, percent) | | | | | | | | | | | | | | | 18.7 | | | | | | 18.5 | |
| | | | | | | |
Dividends on common stock | | | | | | | | | | | | | | | | | | | | | | |
Total | | | 93 | | | | | | 85 | | | | | | 178 | | | | | | 255 | |
Per common share (dollars) | | | 0.11 | | | | | | 0.10 | | | | | | 0.32 | | | | | | 0.30 | |
| | | | | | | |
Millions of common shares outstanding | | | | | | | | | | | | | | | | | | | | | | |
At September 30 | | | | | | | | | | | | | | | 847.6 | | | | | | 847.6 | |
Average - assuming dilution | | | 854.7 | | | | | | 854.9 | | | | | | 854.5 | | | | | | 857.5 | |
| (a) | Return on capital employed is net income excluding after-tax cost of financing divided by the average rolling four quarters’ capital employed. |
7
Attachment II
IMPERIAL OIL LIMITED
THIRD QUARTER 2010
| | | | | | | | | | | | | | | | | | | | | | |
| | | Third Quarter | | | | | Nine Months | |
| millions of Canadian dollars | | 2010 | | | | | 2009 | | | | | 2010 | | | | | 2009 | |
| | | | | | | |
Total cash and cash equivalents at period end | | | 51 | | | | | | 458 | | | | | | 51 | | | | | | 458 | |
| | | | | | | |
| Net income | | | 418 | | | | | | 547 | | | | | | 1,411 | | | | | | 1,045 | |
| Adjustment for non-cash items: | | | | | | | | | | | | | | | | | | | | | | |
Depreciation and depletion | | | 187 | | | | | | 194 | | | | | | 561 | | | | | | 584 | |
(Gain)/loss on asset sales | | | (12 | ) | | | | | - | | | | | | (58 | ) | | | | | (32 | ) |
Deferred income taxes and other | | | (17 | ) | | | | | (6 | ) | | | | | 55 | | | | | | (49 | ) |
Changes in operating assets and liabilities | | | 389 | | | (a) | | | (37 | ) | | | | | 234 | | | (a) | | | (884 | ) |
| Cash from (used in) operating activities | | | 965 | | | | | | 698 | | | | | | 2,203 | | | | | | 664 | |
| | | | | | | |
| Cash from (used in) investing activities | | | (1,113 | ) | | | | | (545 | ) | | | | | (2,717 | ) | | | | | (1,431 | ) |
Proceeds from asset sales | | | 35 | | | | | | 8 | | | | | | 95 | | | | | | 45 | |
| | | | | | | |
| Cash from (used in) financing activities | | | 135 | | | | | | (85 | ) | | | | | 52 | | | | | | (749 | ) |
| | | | | | | | | | | | | | | | | | | | | | | |
| (a) | Third quarter and the first nine months of 2010 cash flow from operating activities were positively impacted by the timing of scheduled income tax payments and other working capital effects. |
8
Attachment III
IMPERIAL OIL LIMITED
THIRD QUARTER 2010
| | | | | | | | | | | | | | | | |
| | | Third Quarter | | | Nine Months | |
| millions of Canadian dollars | | 2010 | | | 2009 | | | 2010 | | | 2009 | |
| | | | |
Net income (U.S. GAAP) | | | | | | | | | | | | | | | | |
Upstream | | | 348 | | | | 439 | | | | 1,238 | | | | 833 | |
Downstream | | | 69 | | | | 62 | | | | 176 | | | | 226 | |
Chemical | | | 23 | | | | 19 | | | | 44 | | | | 30 | |
Corporate and other | | | (22 | ) | | | 27 | | | | (47 | ) | | | (44 | ) |
Net income | | | 418 | | | | 547 | | | | 1,411 | | | | 1,045 | |
| | | | |
Total revenues | | | | | | | | | | | | | | | | |
Upstream | | | 1,792 | | | | 1,878 | | | | 5,985 | | | | 4,894 | |
Downstream | | | 5,088 | | | | 4,749 | | | | 15,592 | | | | 13,362 | |
Chemical | | | 344 | | | | 315 | | | | 1,028 | | | | 900 | |
Eliminations/Other | | | (1,373 | ) | | | (1,381 | ) | | | (4,449 | ) | | | (3,622 | ) |
Revenues | | | 5,851 | | | | 5,561 | | | | 18,156 | | | | 15,534 | |
| | | | |
Purchases of crude oil and products | | | | | | | | | | | | | | | | |
Upstream | | | 545 | | | | 568 | | | | 1,985 | | | | 1,400 | |
Downstream | | | 4,047 | | | | 3,729 | | | | 12,471 | | | | 10,162 | |
Chemical | | | 244 | | | | 218 | | | | 754 | | | | 650 | |
Eliminations | | | (1,374 | ) | | | (1,389 | ) | | | (4,451 | ) | | | (3,635 | ) |
Purchases of crude oil and products | | | 3,462 | | | | 3,126 | | | | 10,759 | | | | 8,577 | |
| | | | |
Production and manufacturing expenses | | | | | | | | | | | | | | | | |
Upstream | | | 592 | | | | 549 | | | | 1,767 | | | | 1,825 | |
Downstream | | | 320 | | | | 313 | | | | 1,079 | | | | 1,049 | |
Chemical | | | 49 | | | | 47 | | | | 157 | | | | 142 | |
Production and manufacturing expenses | | | 961 | | | | 909 | | | | 3,003 | | | | 3,016 | |
| | | | |
Capital and exploration expenditures | | | | | | | | | | | | | | | | |
Upstream | | | 1,151 | | | | 504 | | | | 2,838 | | | | 1,422 | |
Downstream | | | 45 | | | | 64 | | | | 129 | | | | 167 | |
Chemical | | | 1 | | | | 6 | | | | 9 | | | | 12 | |
Corporate and other | | | 2 | | | | 1 | | | | 4 | | | | 3 | |
Capital and exploration expenditures | | | 1,199 | | | | 575 | | | | 2,980 | | | | 1,604 | |
| | | | |
Exploration expenses charged to income included above | | | 54 | | | | 21 | | | | 171 | | | | 126 | |
9
Attachment IV
IMPERIAL OIL LIMITED
THIRD QUARTER 2010
| | | | | | | | | | | | | | | | |
| Operating statistics | | Third Quarter | | | Nine Months | |
| | | 2010 | | | 2009 | | | 2010 | | | 2009 | |
| | | | |
Gross crude oil and Natural Gas Liquids (NGL) production (thousands of barrels a day) | | | | | | | | | | | | | | | | |
Cold Lake | | | 139 | | | | 145 | | | | 143 | | | | 144 | |
Syncrude | | | 66 | | | | 78 | | | | 71 | | | | 66 | |
Conventional | | | 22 | | | | 25 | | | | 23 | | | | 25 | |
Total crude oil production | | | 227 | | | | 248 | | | | 237 | | | | 235 | |
NGLs available for sale | | | 7 | | | | 7 | | | | 7 | | | | 8 | |
Total crude oil and NGL production | | | 234 | | | | 255 | | | | 244 | | | | 243 | |
| | | | |
Gross natural gas production (millions of cubic feet a day) | | | 284 | | | | 291 | | | | 282 | | | | 294 | |
| | | | |
Gross oil-equivalent production (a) (thousands of oil-equivalent barrels a day) | | | 281 | | | | 304 | | | | 291 | | | | 292 | |
| | | | |
Net crude oil and NGL production (thousands of barrels a day) | | | | | | | | | | | | | | | | |
Cold Lake | | | 112 | | | | 116 | | | | 114 | | | | 124 | |
Syncrude | | | 61 | | | | 67 | | | | 65 | | | | 62 | |
Conventional | | | 17 | | | | 19 | | | | 17 | | | | 21 | |
Total crude oil production | | | 190 | | | | 202 | | | | 196 | | | | 207 | |
NGLs available for sale | | | 5 | | | | 6 | | | | 5 | | | | 6 | |
Total crude oil and NGL production | | | 195 | | | | 208 | | | | 201 | | | | 213 | |
| | | | |
Net natural gas production (millions of cubic feet a day) | | | 263 | | | | 295 | | | | 255 | | | | 278 | |
| | | | |
Net oil-equivalent production (a) (thousands of oil-equivalent barrels a day) | | | 239 | | | | 257 | | | | 244 | | | | 259 | |
| | | | |
Cold Lake blend sales (thousands of barrels a day) | | | 176 | | | | 185 | | | | 187 | | | | 187 | |
NGL Sales (thousands of barrels a day) | | | 13 | | | | 9 | | | | 11 | | | | 9 | |
Natural gas sales (millions of cubic feet a day) | | | 259 | | | | 269 | | | | 262 | | | | 270 | |
| | | | |
Average realizations (Canadian dollars) | | | | | | | | | | | | | | | | |
Conventional crude oil realizations (a barrel) | | | 67.93 | | | | 65.29 | | | | 70.76 | | | | 57.30 | |
NGL realizations (a barrel) | | | 44.22 | | | | 36.24 | | | | 48.15 | | | | 38.14 | |
Natural gas realizations (a thousand cubic feet) | | | 3.58 | | | | 2.90 | | | | 4.19 | | | | 4.07 | |
Synthetic oil realizations (a barrel) | | | 77.83 | | | | 73.27 | | | | 79.26 | | | | 65.95 | |
Bitumen realizations (a barrel) | | | 57.04 | | | | 55.97 | | | | 58.17 | | | | 49.31 | |
| | | | |
Refinery throughput (thousands of barrels a day) | | | 453 | | | | 417 | | | | 437 | | | | 414 | |
Refinery capacity utilization (percent) | | | 90 | | | | 83 | | | | 87 | | | | 82 | |
| | | | |
Petroleum product sales (thousands of barrels a day) | | | | | | | | | | | | | | | | |
Gasolines | | | 227 | | | | 204 | | | | 215 | | | | 200 | |
Heating, diesel and jet fuels | | | 151 | | | | 138 | | | | 145 | | | | 143 | |
Heavy fuel oils | | | 20 | | | | 22 | | | | 28 | | | | 26 | |
Lube oils and other products | | | 46 | | | | 43 | | | | 44 | | | | 39 | |
Net petroleum products sales | | | 444 | | | | 407 | | | | 432 | | | | 408 | |
| | | | |
Petrochemical Sales (thousands of tonnes a day) | | | 2.7 | | | | 2.8 | | | | 2.7 | | | | 2.8 | |
(a) Gas converted to oil-equivalent at 6 million cubic feet = 1 thousand barrels
10
Attachment V
IMPERIAL OIL LIMITED
THIRD QUARTER 2010
| | | | | | | | |
| | | Net income (U.S. GAAP) | | | Net income per common share | |
| | | (millions of Canadian dollars) | | | (dollars) | |
| | |
| 2006 | | | | | | | | |
First Quarter | | | 591 | | | | 0.60 | |
Second Quarter | | | 837 | | | | 0.85 | |
Third Quarter | | | 822 | | | | 0.84 | |
Fourth Quarter | | | 794 | | | | 0.83 | |
Year | | | 3,044 | | | | 3.12 | |
| | |
| 2007 | | | | | | | | |
First Quarter | | | 774 | | | | 0.82 | |
Second Quarter | | | 712 | | | | 0.76 | |
Third Quarter | | | 816 | | | | 0.88 | |
Fourth Quarter | | | 886 | | | | 0.97 | |
Year | | | 3,188 | | | | 3.43 | |
| | |
| 2008 | | | | | | | | |
First Quarter | | | 681 | | | | 0.76 | |
Second Quarter | | | 1,148 | | | | 1.29 | |
Third Quarter | | | 1,389 | | | | 1.57 | |
Fourth Quarter | | | 660 | | | | 0.77 | |
Year | | | 3,878 | | | | 4.39 | |
| | |
| 2009 | | | | | | | | |
First Quarter | | | 289 | | | | 0.34 | |
Second Quarter | | | 209 | | | | 0.25 | |
Third Quarter | | | 547 | | | | 0.64 | |
Fourth Quarter | | | 534 | | | | 0.63 | |
Year | | | 1,579 | | | | 1.86 | |
| | |
| 2010 | | | | | | | | |
First Quarter | | | 476 | | | | 0.56 | |
Second Quarter | | | 517 | | | | 0.61 | |
Third Quarter | | | 418 | | | | 0.49 | |
| | | | | | | | |
11
Attachment VI
IMPERIAL OIL LIMITED
THIRD QUARTER 2010
Factors affecting net income (millions of Canadian dollars)
Upstream Earnings Q310 vs Q309
Downstream Earnings Q310 vs Q309

Chemical Earnings Q310 vs Q309
12