Imperial Oil – Sustained Energy Leadership
Welcome Toronto
May 26, 2011
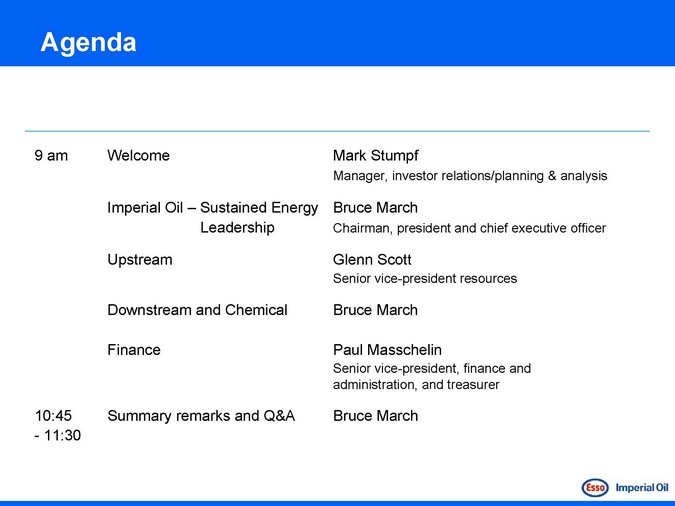
Agenda
9 am
10:45
- 11:30
Welcome
Imperial Oil – Sustained Energy Leadership
Upstream
Downstream and Chemical
Finance
Summary remarks and Q&A
Mark Stumpf
Manager, investor relations/planning & analysis
Bruce March
Chairman, president and chief executive officer
Glenn Scott
Senior vice-president resources
Bruce March
Paul Masschelin
Senior vice-president, finance and administration, and treasurer
Bruce March
Cautionary Statement
This presentation contains forward -looking information on future production, project start-ups and future capital spending. Actual results could differ materially due to changes in project schedules, operating performance, demand for oil and gas, commercial negotiations or other technical and economic factors.
Oil-equivalent barrels (OEB) may be misleading, particularly if used in isolation. An OEB conversion ratio of 6,000 cubic feet to one barrel is based on an energy -equivalency conversion method primarily applicable at the burner tip and does not represent a value equivalency at the well head.
Proved reserves are calculated under United States Securities and Exchange Commission (SEC) requirements, as shown in Form 10-K dated December 31, 2010.
Pursuant to National Instrument 51-101 disclosure guidelines, and using Canadian Oil and Gas Evaluation Handbook definitions, Imperial’s non-proved resources are classified as a “contingent resource. “ Such resources are a best estimate of the company’s net interest after royalties at year-end 2010, as determined by Imperial’s internal qualified reserves evaluator. Contingent resources are considered to be potentially recoverable from known accumulations, using established technology or technology under development, but are currently not considered to be commercially recoverable due to one or more contingencies. There is no certainty that it will be economically viable or technically feasible to produce any portion of the resource.
Financials in Canadian dollars.
Imperial Oil – 2011 Investor Meeting
Our Business
2010 results
Industry leading safety
Double digit returns in each business segment
Long history of excellent safety performance Sound environmental results Strong bottom -line
Earnings: $2.2 billion
Return on capital employed: 21% Cash flow from operations: $3.4 billion Investing through the cycle on high quality growth projects : $4.0 billion
Large resource base:
Reserves 2.5 billion oil-equivalent barrels*
Non-proved resource 13 billion oil-equivalent barrels*
* | | Imperial Oil interest after royalties |
Safety leadership
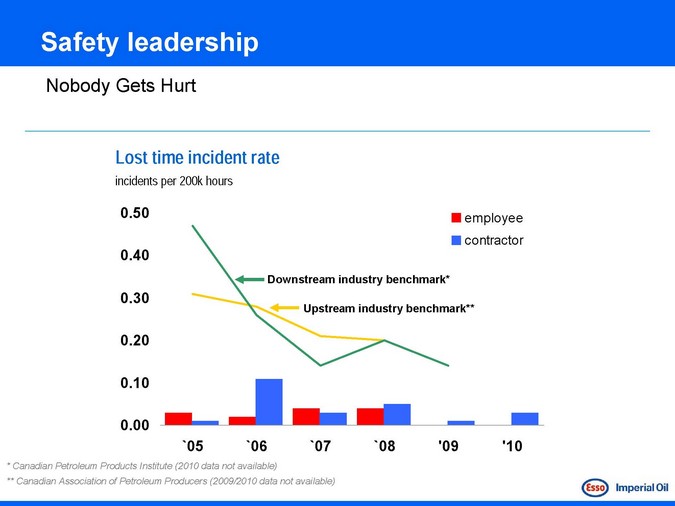
Nobody Gets Hurt
Lost time incident rate
incidents per 200k hours
employee contractor
0.50 0.40 0.30 0.20 0.10 0.00
Downstream industry benchmark*
Upstream industry benchmark**
`05 `06 `07 `08 ‘09 ‘10
* | | Canadian Petroleum Products Institute (2010 data not available) |
** Canadian Association of Petroleum Producers (2009/2010 data not available)
Environmental business planning
Protect Tomorrow. Today.
Rigorous environmental planning and stewardship
Actions
Conserve:
Energy efficiency
Reduce:
Fresh water use Spills and releases Flaring & emissions Land-use footprint
Reclaim & reuse:
Return to productive use
Environmental performance
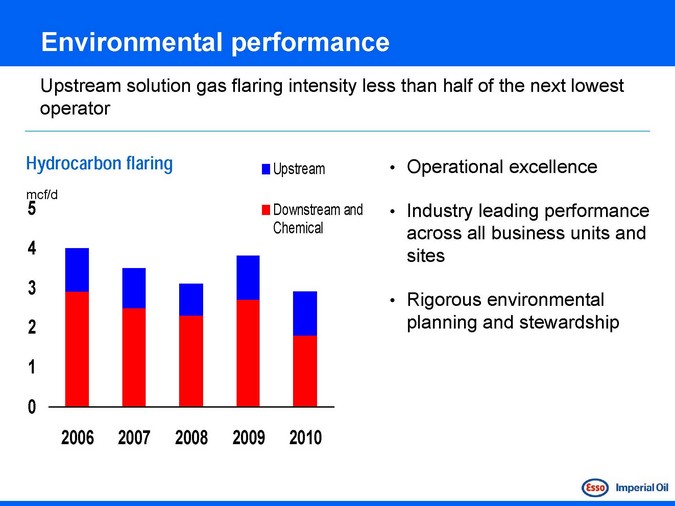
Upstream solution gas flaring intensity less than half of the next lowest operator
Hydrocarbon flaring
mcf/d
2006 2007 2008 2009 2010
Upstream
Downstream and Chemical
Operational excellence
Industry leading performance across all business units and sites
Rigorous environmental planning and stewardship
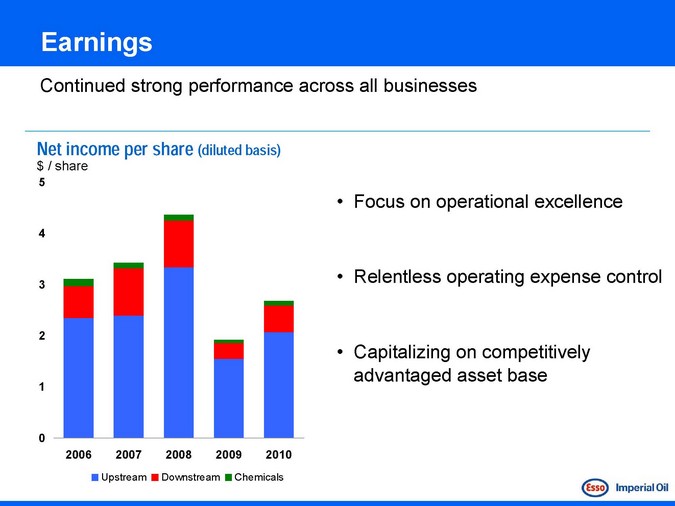
Earnings
Continued strong performance across all businesses
Net income per share (diluted basis)
$ / share
2006 2007 2008 2009 2010
Focus on operational excellence
Relentless operating expense control
Capitalizing on competitively advantaged asset base
Upstream
Downstream
Chemicals
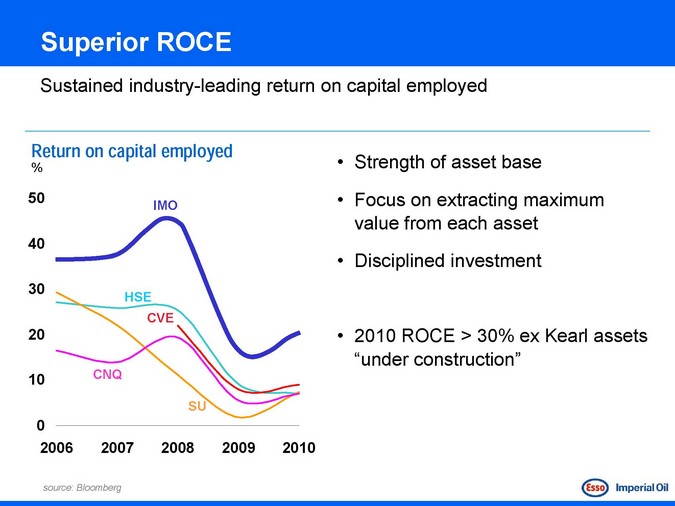
Superior ROCE
Sustained industry -leading return on capital employed
Return on capital employed
%
50 40 30 20 10 0
2006 2007 2008 2009 2010
source: Bloomberg
IMO
HSE CVE
CNQ
SU
Strength of asset base Focus on extracting maximum value from each asset Disciplined investment
2010 ROCE > 30% ex Kearl assets “under construction”
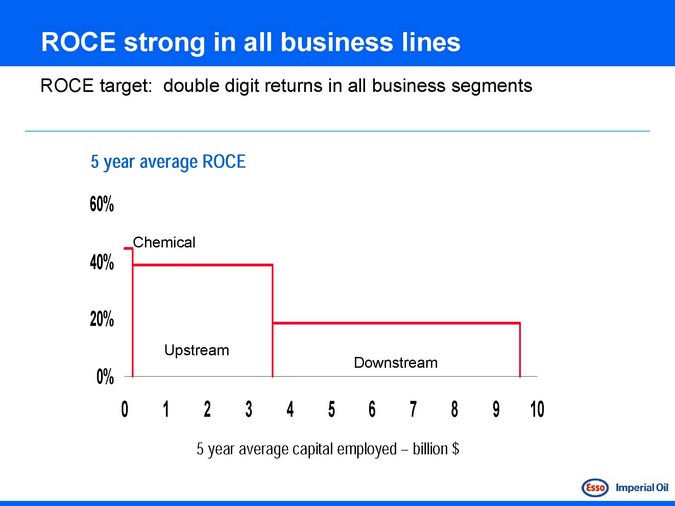
ROCE strong in all business lines
ROCE target: double digit returns in all business segments
60%
40%
20%
0%
Chemical
Upstream
Downstream
0 1 2 3 4 5 6 7 8 9 10
5 | | year average capital employed – billion $ |
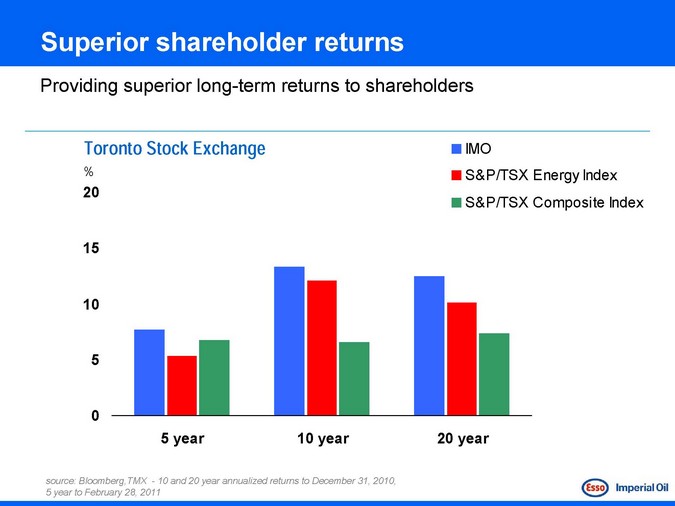
Superior shareholder returns
Providing superior long-term returns to shareholders
Toronto Stock Exchange
%
20 15 10 5 0
source: Bloomberg,TMX—10 and 20 year annualized returns to December 31, 2010, 5 year to February 28, 2011
IMO
S&P/TSX Energy Index S&P/TSX Composite Index
Imperial Oil – energy for 130 years
Leading the development of energy in Canada
69.6% owned by ExxonMobil
Competitive advantages
Discipline and consistency Portfolio quality Organizational capability Superior technology Balance sheet strength
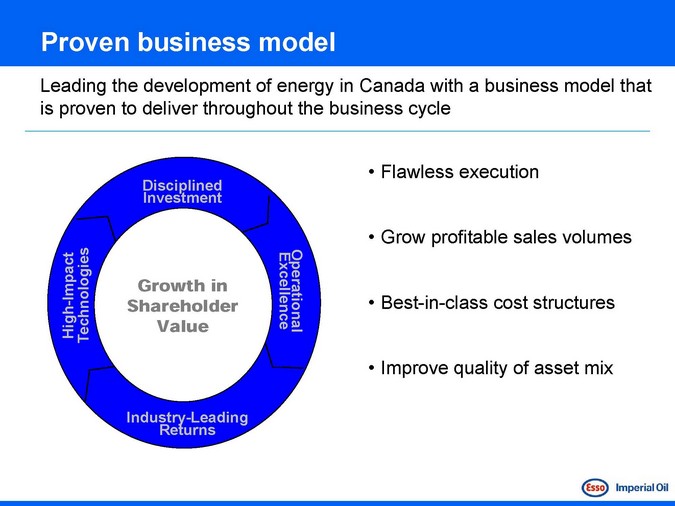
Proven business model
Leading the development of energy in Canada with a business model that is proven to deliver throughout the business cycle
Disciplined Investment
ExcellenceOperational
Industry -Leading Returns
- Impact HighTechnologies
Growth in Shareholder Value
Flawless execution
Grow profitable sales volumes Best-in-class cost structures Improve quality of asset mix
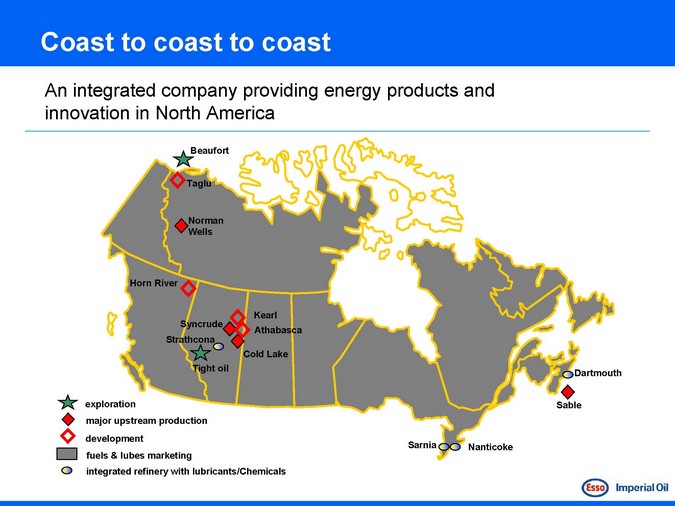
Coast to coast to coast
An integrated company providing energy products and innovation in North America
Beaufort
Taglu
Norman Wells
Horn River
Kearl Athabasca
Syncrude Strathcona
Tight oil
Cold Lake
Dartmouth
Sable
Sarnia
Nanticoke
exploration major upstream production development fuels & lubes marketing integrated refinery with lubricants/Chemicals
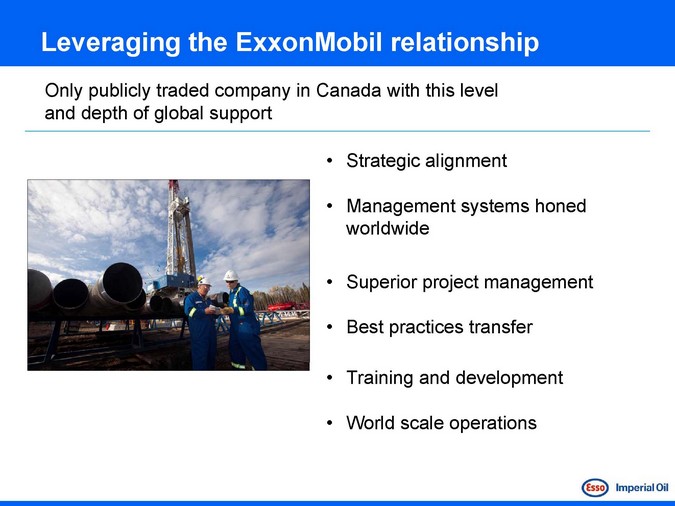
Leveraging the ExxonMobil relationship
Only publicly traded company in Canada with this level and depth of global support
Strategic alignment
Management systems honed worldwide
Superior project management Best practices transfer Training and development World scale operations
Leveraging the ExxonMobil relationship
Access to $1 billion per year in research and development
Shared leading edge technology Fundamental research Scale-up to commercial Across all business segments
Business fundamentals
Imperial Oil is positioned to prosper
Growing world population; strong GDP growth in developed and developing nations Long-term demand forecasts for oil, gas and petrochemicals remain robust Energy demand up with economic activity, strongly mitigated by efficiency
Continued strong growth for oil and gas from developing countries Demand for petroleum products in OECD countries flat
Increasing regulation and oversight; climate change policies uncertain
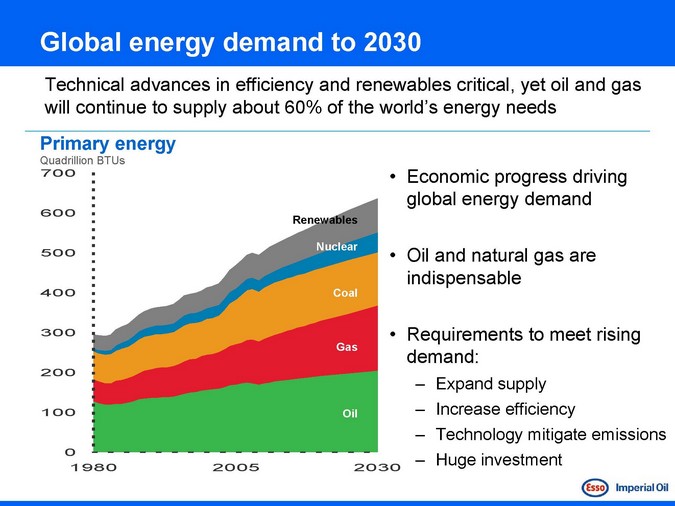
Global energy demand to 2030
Technical advances in efficiency and renewables critical, yet oil and gas will continue to supply about 60% of the world’s energy needs
Primary energy
Quadrillion BTUs
700 600 500 400 300 200 100 0
1980 2005 2030
Renewables
Nuclear
Coal Gas Oil
Economic90 progress driving global energy demand
Oil and natural gas are
60
indispensable
Requirements to meet rising demand:30
Expand supply Increase efficiency Technology mitigate emissions Huge0 investment
1980 2005
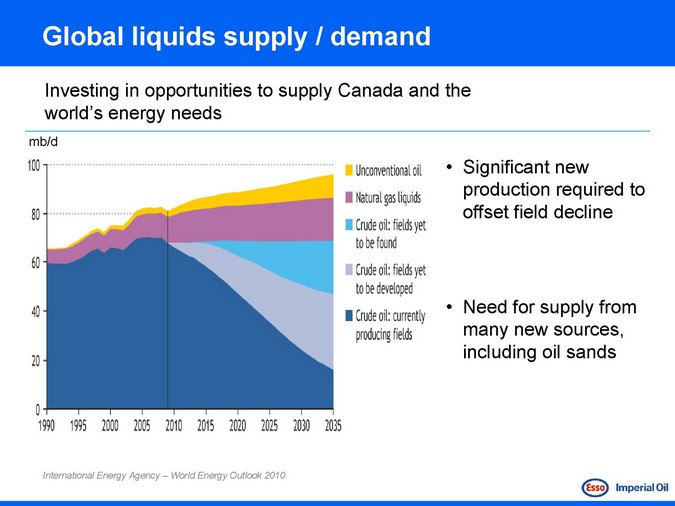
Global liquids supply / demand
Investing in opportunities to supply Canada and the world’s energy needs
mb/d
Significant new production required to offset field decline
Need for supply from many new sources, including oil sands
International Energy Agency – World Energy Outlook 2010
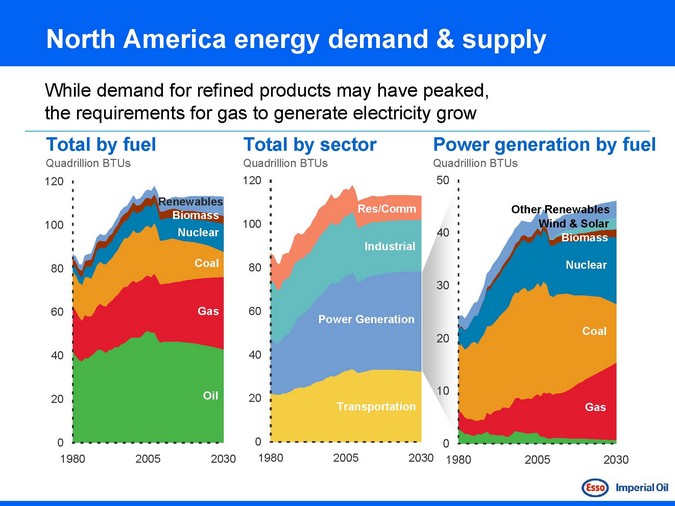
North America energy demand & supply
While demand for refined products may have peaked, the requirements for gas to generate electricity grow
Total by fuel
Quadrillion BTUs
120 100 80 60 40 20 0
1980 2005 2030
Renewables Biomass Nuclear
Coal Gas Oil
Total by sector
Quadrillion BTUs
120 100 80 60 40 20 0
1980 2005 2030
Res/Comm
Industrial
Power Generation
Transportation
Power generation by fuel
Quadrillion BTUs
50 40 30 20 10 0
Other Renewables
Wind & Solar Biomass
Nuclear Coal Gas
1980 2005 2030
Gas as a transition fuel
With a low carbon intensity, natural gas is an ideal fuel to replace coal in electricity generation
Gas is abundant, clean and affordable
Gas is excellent opportunity as we transition from mor e GHG intensive power generation to renewable forms later in the century
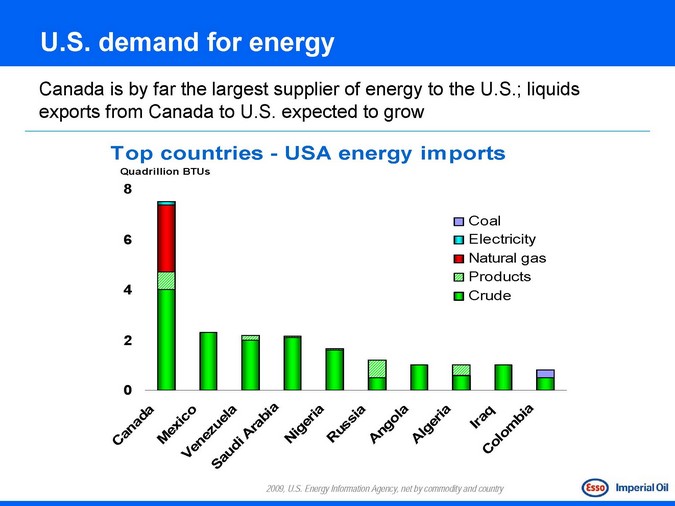
U.S. demand for energy
Canada is by far the largest supplier of energy to the U.S.; liquids exports from Canada to U.S. expected to grow
Top countries—USA energy imports
Quadrillion BTUs
Coal Electricity Natural gas Products Crude
2009, U.S. Energy Information Agency, net by commodity and country
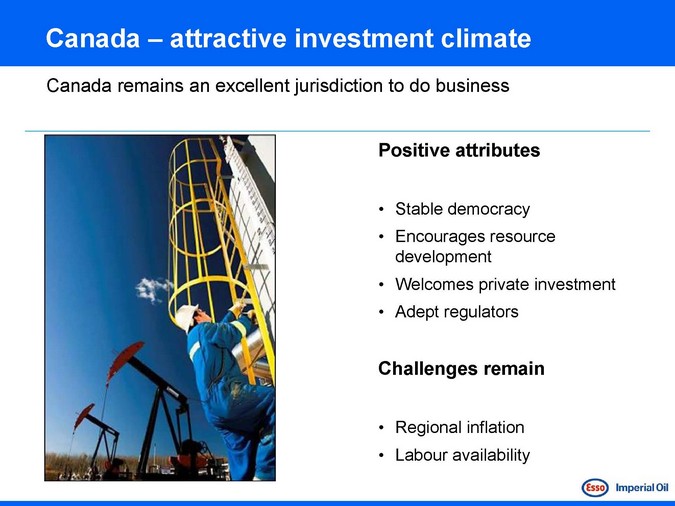
Canada – attractive investment climate
Canada remains an excellent jurisdiction to do business
Positive attributes
Stable democracy
Encourages resource development Welcomes private investment Adept regulators
Challenges remain
Regional inflation Labour availability
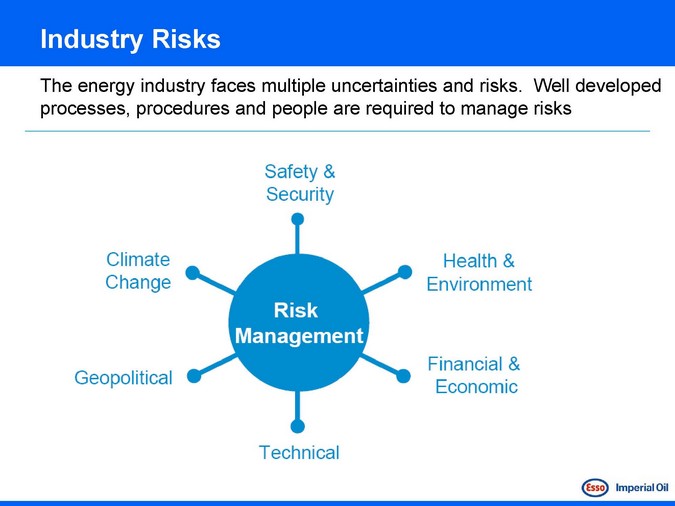
Industry Risks
The energy industry faces multiple uncertainties and risks. Well developed processes, procedures and people are required to manage risks
Risk management approach
Common expectations for addressing risk inherent in our business
Capable, committed workforce with clear accountabilities
Well developed and clearly defined policies and procedures
High standards of design to reduce or eliminate risk
Employee and contractor training
Systematic approach to performance metrics and continuous improvement
Rigorously applied management systems
Risk management approach
Imperial Oil employs multiple management systems to lower risk across the businesses, forming a foundation for strong financial and operating results
Operations Integrity Management System
Facilities Integrity Management System
Controls Integrity Management System
ExxonMobil Capital Project Management System
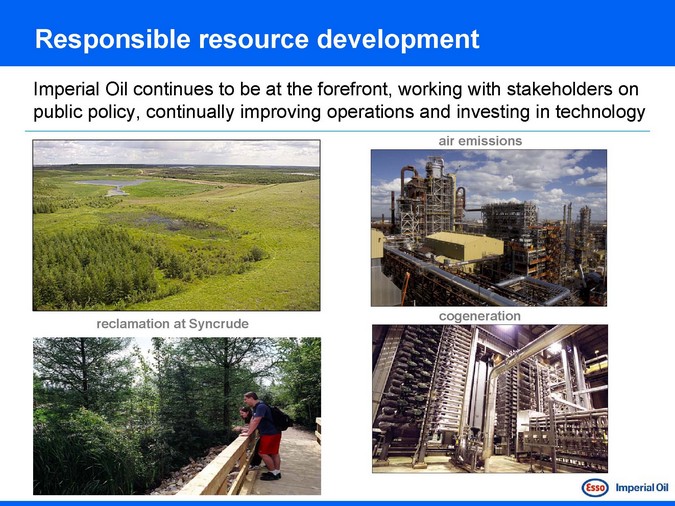
Responsible resource development
Imperial Oil continues to be at the forefront, working with stakeholders on public policy, continually improving operations and investing in technology
reclamation at Syncrude
air emissions
cogeneration
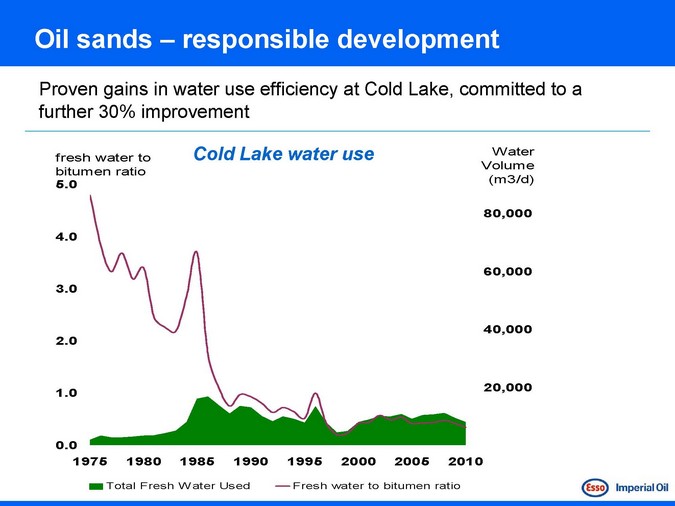
Oil sands – responsible development
Proven gains in water use efficiency at Cold Lake, committed to a further 30% improvement
fresh water to bitumen ratio
5.0 4.0 3.0 2.0 1.0 0.0
1975 1980 1985 1990 1995 2000 2005 2010
Cold Lake water use
Water Volume (m3/d)
80,000 60,000 40,000 20,000
Total Fresh Water Used
Fresh water to bitumen ratio
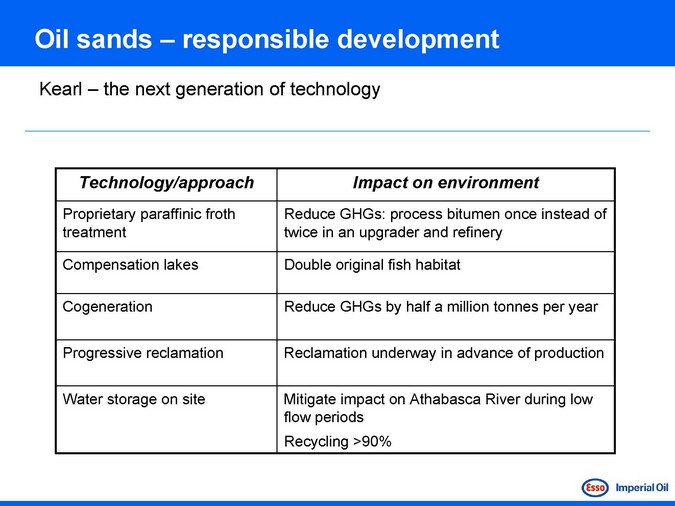
Oil sands – responsible development
Kearl – the next generation of technology
Technology/approach
Proprietary paraffinic froth treatment
Compensation lakes Cogeneration Progressive reclamation Water storage on site
Impact on environment
Reduce GHGs: process bitumen once instead of twice in an upgrader and refinery
Double original fish habitat
Reduce GHGs by half a million tonnes per year
Reclamation underway in advance of production
Mitigate impact on Athabasca River during low flow periods Recycling >90%
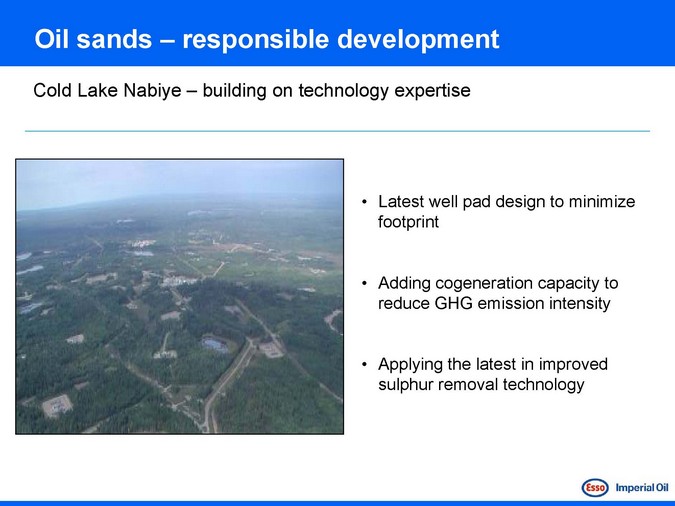
Oil sands – responsible development
Cold Lake Nabiye – building on technology expertise
Latest well pad design to minimize footprint
Adding cogeneration capacity to reduce GHG emission intensity
Applying the latest in improved sulphur removal technology
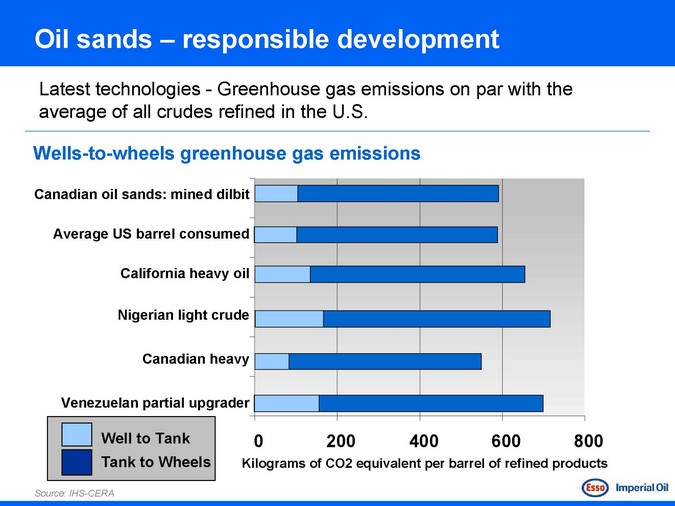
Oil sands – responsible development
Latest technologies—Greenhouse gas emissions on par with the average of all crudes refined in the U.S.
Wells-to-wheels greenhouse gas emissions
Canadian oil sands: mined dilbit
Average US barrel consumed
California heavy oil
Nigerian light crude
Canadian heavy
Venezuelan partial upgrader
Well to Tank Tank to Wheels
Source: IHS-CERA
0 200 400 600 800
Kilograms of CO2 equivalent per barrel of refined products
Oil sands – research and development
At our Calgary Research Centre, scientists’ work is focused on extraction efficiency while minimizing environmental impacts
In-situ processes
Non-aqueous extraction
Centre for Oil Sands Innovation at University of Alberta
Game changing technology focus
Industry collaboration on tailings treatment
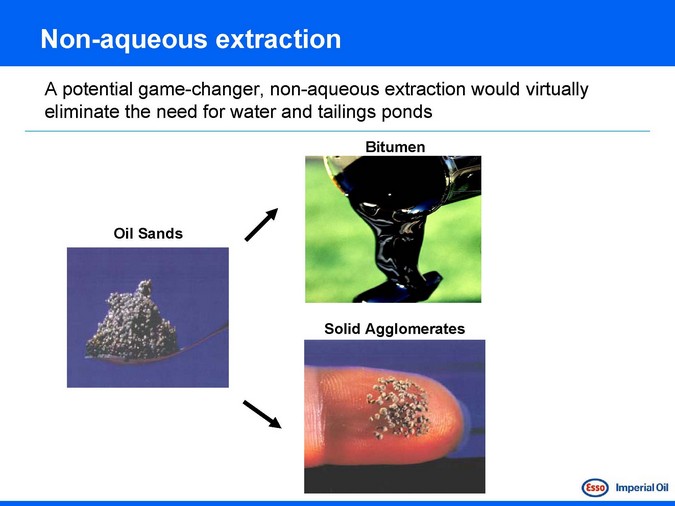
Non-aqueous extraction
A potential game-changer, non-aqueous extraction would virtually eliminate the need for water and tailings ponds
Oil Sands
Bitumen
Solid Agglomerates
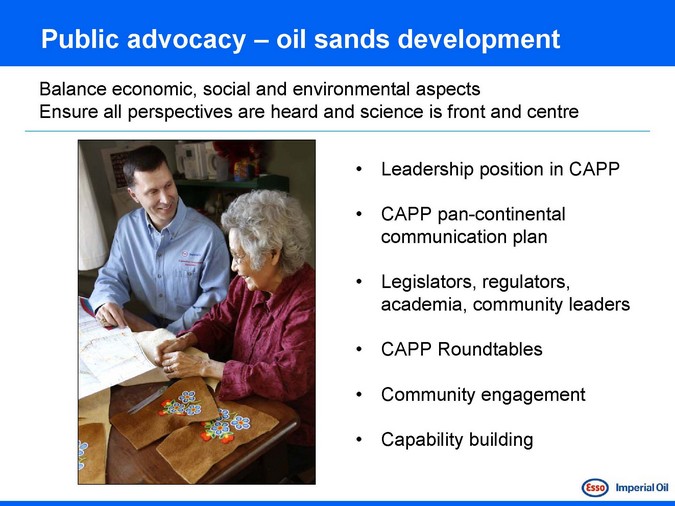
Public advocacy – oil sands development
Balance economic, social and environmental aspects
Ensure all perspectives are heard and science is front and centre
Leadership position in CAPP
CAPP pan-continental communication plan
Legislators, regulators, academia, community leaders
CAPP Roundtables
Community engagement
Capability building
Imperial strengths
Underpinned by superior technology, financial strength and a long-term focus
industry leadership through the business cycle
Discipline and consistency
Portfolio quality
Integration and capability
Embarking on a growth strategy

Imperial Oil – 2011 Investor Meeting
Upstream – Doubling Production
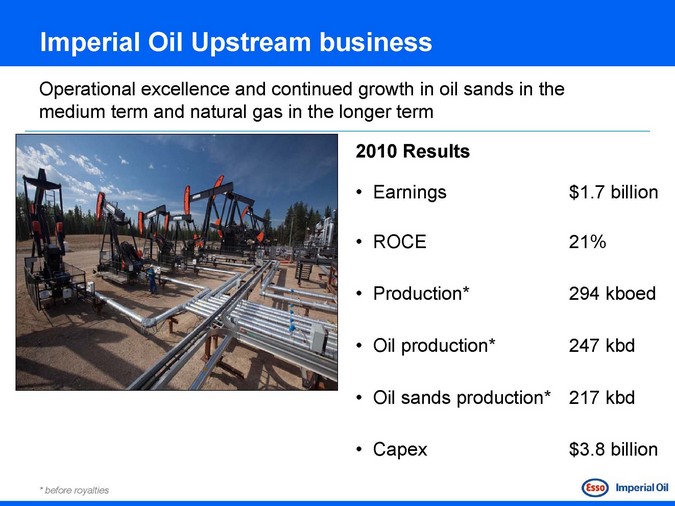
Imperial Oil Upstream business
Operational excellence and continued growth in oil sands in the medium term and natural gas in the longer term
2010 Results
Earnings
ROCE
Production*
Oil production*
Oil sands production*
Capex
$1.7 billion
21%
294 kboed
247 kbd
217 kbd
$3.8 billion
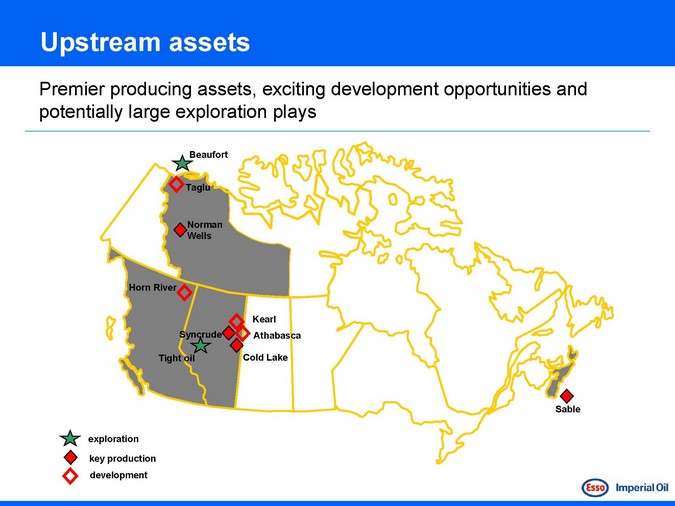
Upstream assets
Premier producing assets, exciting development opportunities and potentially large exploration plays
Beaufort
Taglu
Norman Wells
Horn River
Syncrude
Tight oil
Kearl Athabasca
Cold Lake
exploration
key production development
Sable
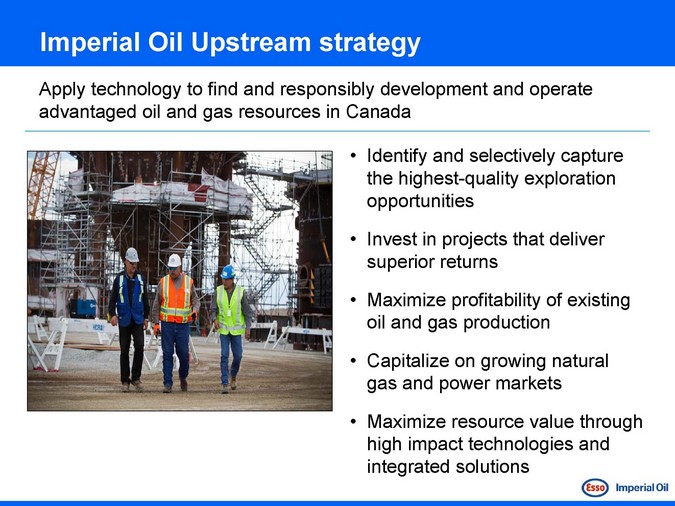
Imperial Oil Upstream strategy
Apply technology to find and responsibly development and operate advantaged oil and gas resources in Canada
Identify and selectively capture the highest -quality exploration opportunities
Invest in projects that deliver superior returns
Maximize profitability of existing oil and gas production
Capitalize on growing natural gas and power markets
Maximize resource value through high impact technologies and integrated solutions
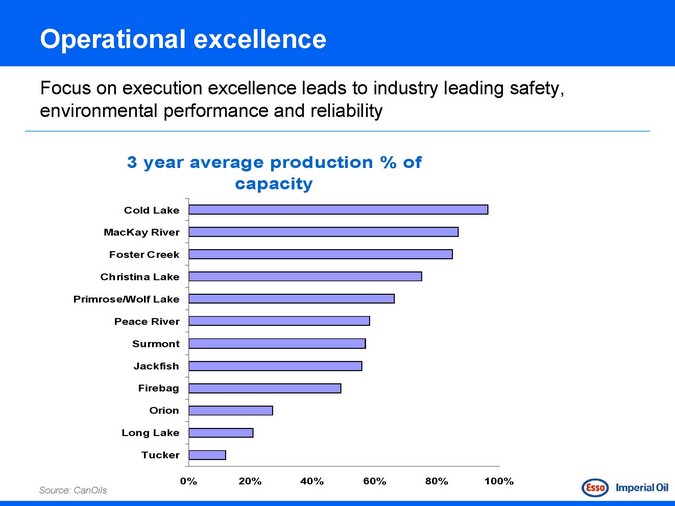
Operational excellence
Focus on execution excellence leads to industry leading safety, environmental performance and reliability
3 | | year average production % of capacity |
Cold Lake MacKay River Foster Creek Christina Lake Primrose/Wolf Lake Peace River Surmont Jackfish Firebag Orion Long Lake Tucker
0% 20% 40% 60% 80% 100%
Source: CanOils
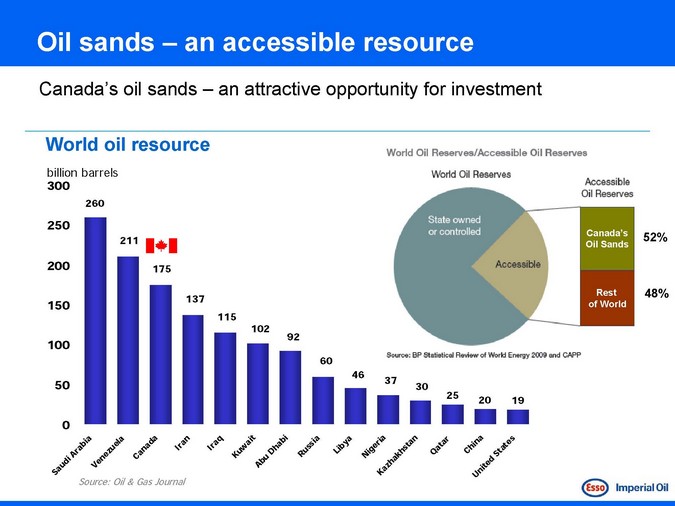
an accessible resource Oil sands –
an attractive opportunity for investment Canada’s oil sands –
World oil resource
billion barrels
300 250 200 150 100 50 0
260
211
175
137
115
102
92
60
46
37
30
25
20
19
Canada’s Oil Sands
Rest of World
52% 48%
Source: Oil & Gas Journal
Ar i uda S
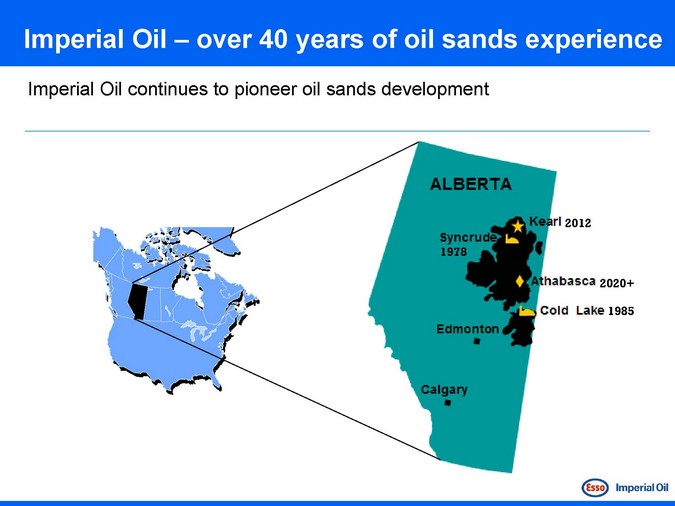
Imperial Oil – over 40 years of oil sands experience
Imperial Oil continues to pioneer oil sands development
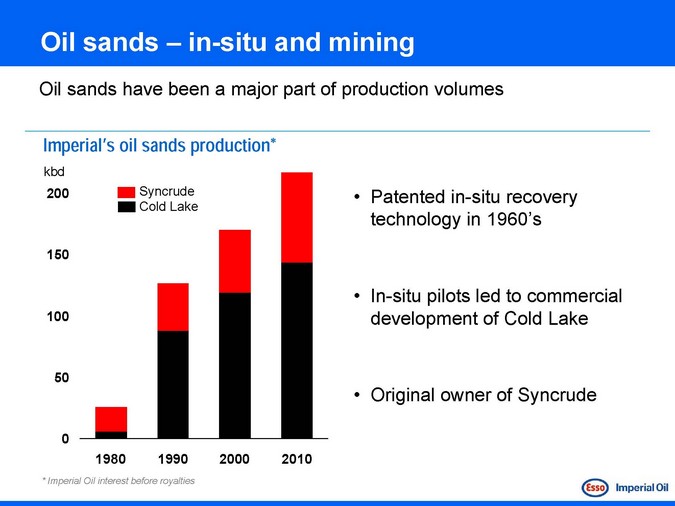
Oil sands – in-situ and mining
Oil sands have been a major part of production volumes
Imperial’s oil sands production*
kbd
200 150 100 50 0
Syncrude Cold Lake
1980 1990 2000 2010
Patented in-situ recovery technology in 1960’s
In-situ pilots led to commercial development of Cold Lake
Original owner of Syncrude
* | | Imperial Oil interest before royalties |
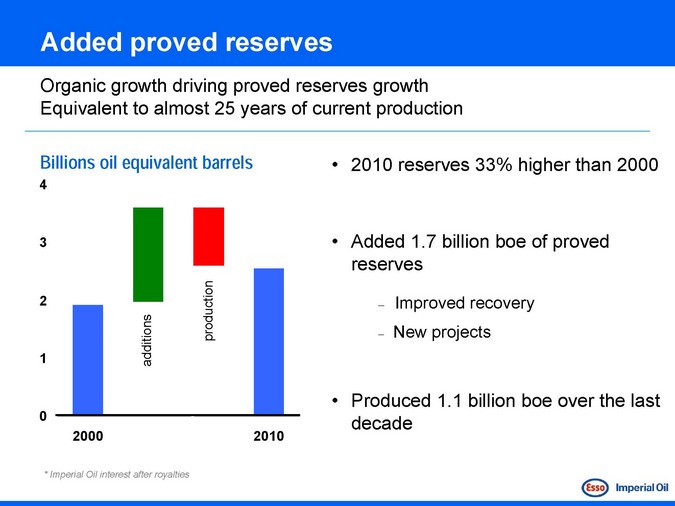
Added proved reserves
Organic growth driving proved reserves growth Equivalent to almost 25 years of current production
Billions oil equivalent barrels
0
2000
2010
additions
production
* | | Imperial Oil interest after royalties |
2010 reserves 33% higher than 2000
Added 1.7 billion boe of proved reserves
Improved recovery New projects
Produced 1.1 billion boe over the last decade
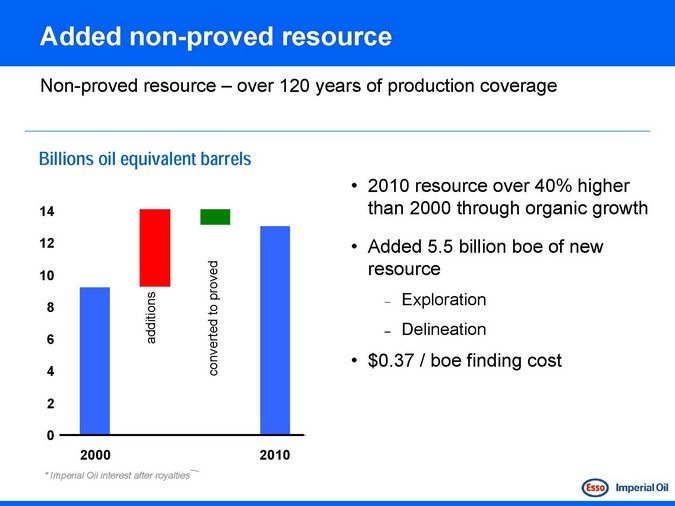
Added non-proved resource
Non-proved resource – over 120 years of production coverage
Billions oil equivalent barrels
14 12 10 8 6 4 2 0
additions
proved to converted
2000 2010
2010 resource over 40% higher than 2000 through organic growth
Added 5.5 billion boe of new resource
Exploration Delineation
$0.37 / boe finding cost
* | | Imperial Oil interest after royalties |
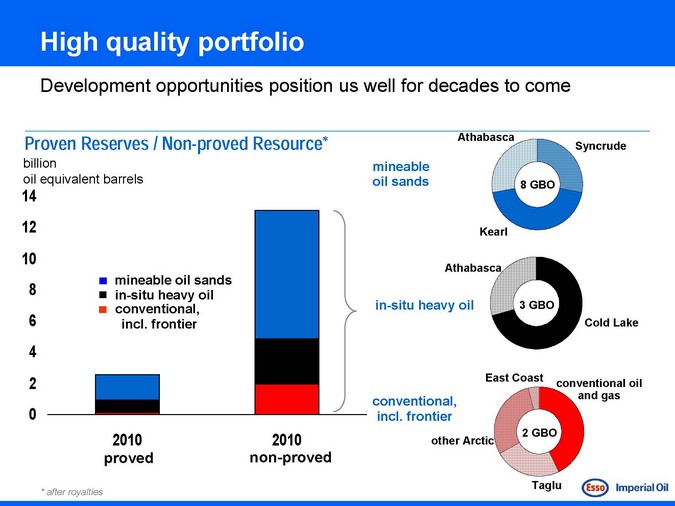
High quality portfolio
Development opportunities position us well for decades to come
Proven Reserves / Non-proved Resource*
billion oil equivalent barrels
14 12 10 8 6 4 2 0
mineable oil sands in-situ heavy oil conventional, incl. frontier
2010 proved
2010 non-proved
mineable oil sands
Athabasca
Syncrude
Kearl
Athabasca
in-situ heavy oil
Cold Lake
conventional, incl. frontier
East Coast
conventional oil and gas
other Arctic
Taglu
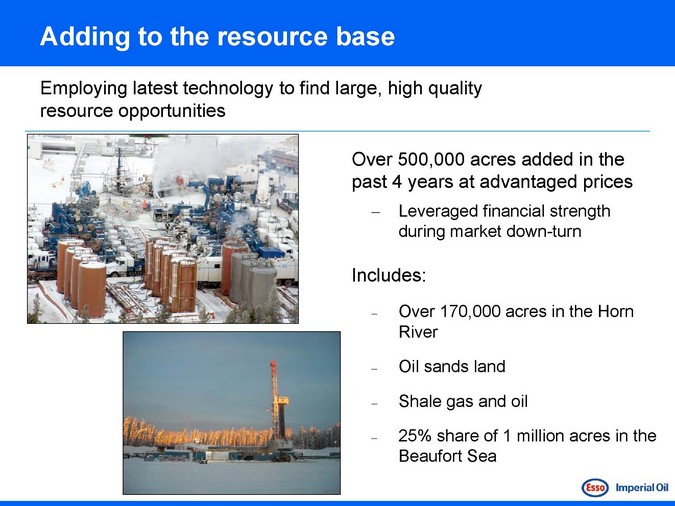
Adding to the resource base
Employing latest technology to find large, high quality resource opportunities
Over 500,000 acres added in the past 4 years at advantaged prices
Leveraged financial strength during market down-turn
Includes:
Over 170,000 acres in the Horn River
Oil sands land
Shale gas and oil
25% share of 1 million acres in the Beaufort Sea
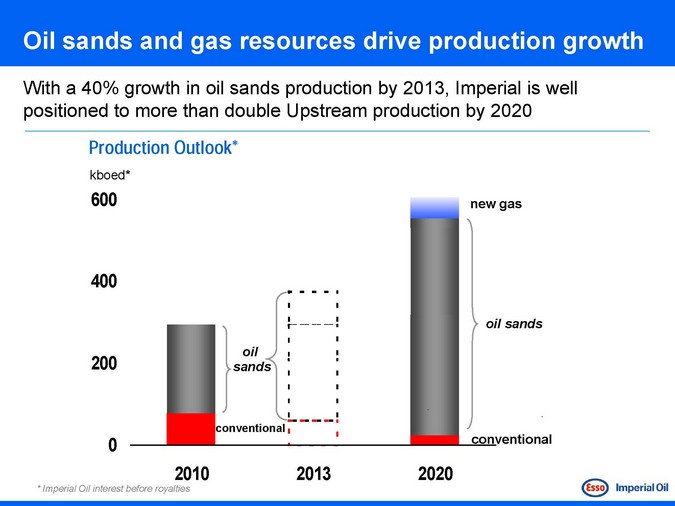
Oil sands and gas resources drive production growth
With a 40% growth in oil sands production by 2013, Imperial is well positioned to more than double Upstream production by 2020
Production Outlook*
kboed*
600 400 200 0
oil sands
conventional
new gas
oil sands
conventional
2010 2013 2020
* | | Imperial Oil interest before royalties |
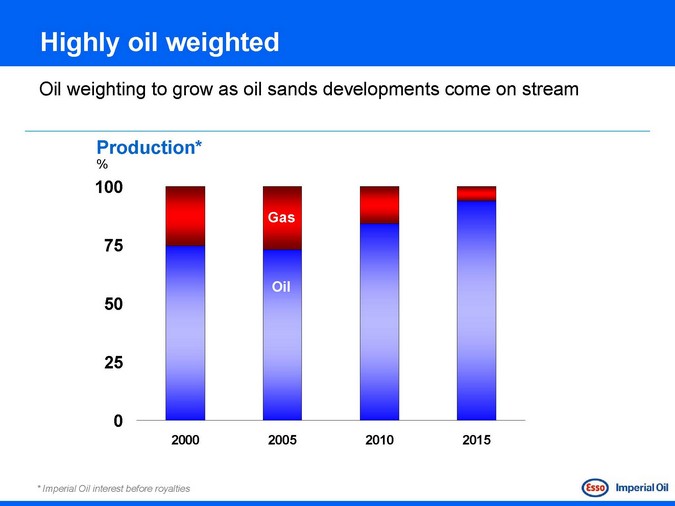
Highly oil weighted
Oil weighting to grow as oil sands developments come on stream
Production*
%
100 75 50 25 0
Gas
Oil
2000 2005 2010 2015
* | | Imperial Oil interest before royalties |
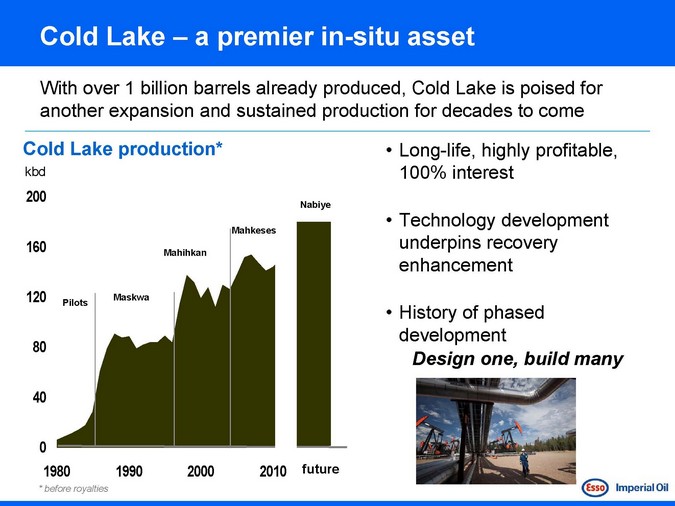
Cold Lake – a premier in-situ asset
With over 1 billion barrels already produced, Cold Lake is poised for another expansion and sustained production for decades to come
Cold Lake production*
kbd
200 160 120 80 40 0
Pilots
Maskwa
Mahihkan
Mahkeses
Nabiye
Long-life, highly profitable, 100% interest
Technology development underpins recovery enhancement
History of phased development
Design one, build many
1980 1990 2000 2010 future
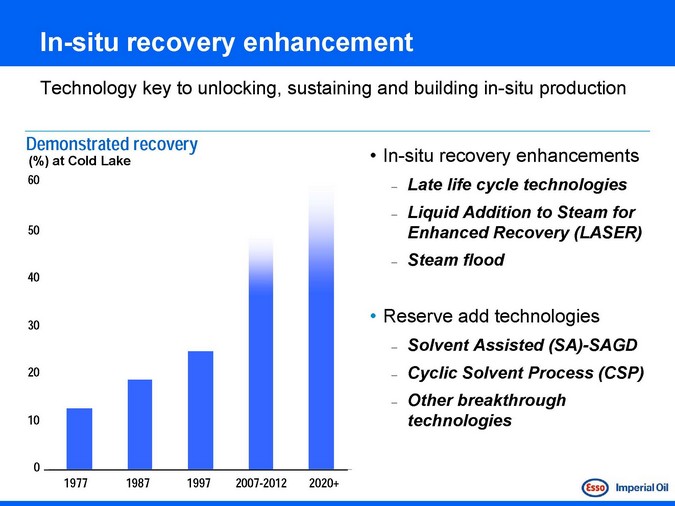
In-situ recovery enhancement
Technology key to unlocking, sustaining and building in-situ production
Demonstrated recovery
(%) at Cold Lake
60 50 40 30 20 10 0
1977 1987 1997 2007-2012 2020+
In-situ recovery enhancements
Late life cycle technologies
Liquid Addition to Steam for Enhanced Recovery (LASER) Steam flood
Reserve add technologies
Solvent Assisted (SA)-SAGD Cyclic Solvent Process (CSP) Other breakthrough technologies
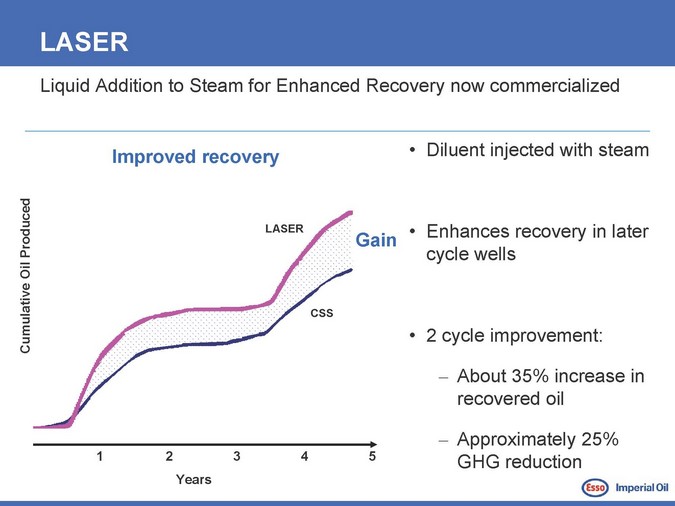
LASER
Liquid Addition to Steam for Enhanced Recovery now commercialized
Improved recovery
Produced Oil Cumulative
LASER
CSS
Years
Gain
Diluent injected with steam
Enhances recovery in later cycle wells
About 35% increase in recovered oil
Approximately 25% GHG reduction
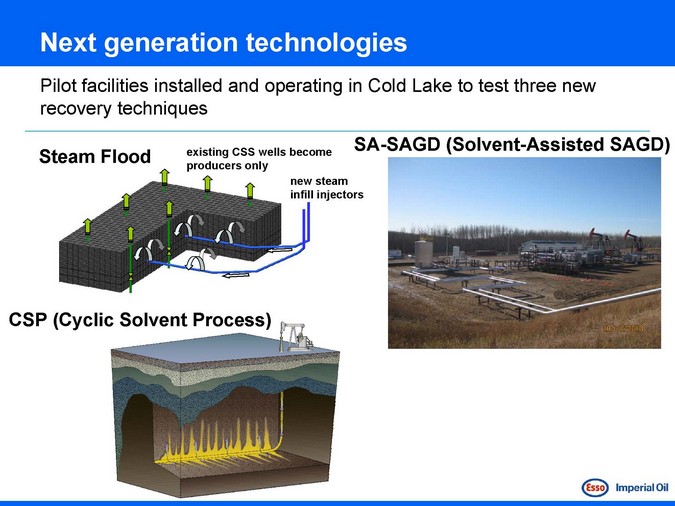
Next generation technologies
Pilot facilities installed and operating in Cold Lake to test three new recovery techniques
Steam Flood
CSP (Cyclic Solvent Process)
existing CSS wells become producers only
new steam infill injectors
SA-SAGD (Solvent -Assisted SAGD)
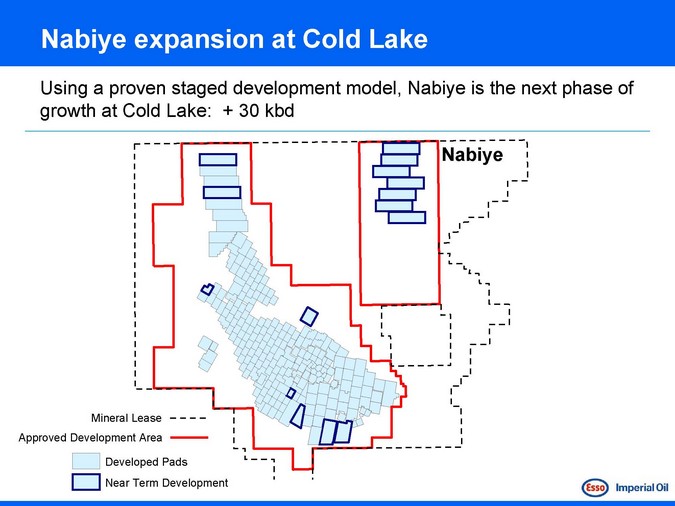
Nabiye expansion at Cold Lake
Using a proven staged development model, Nabiye is the next phase of growth at Cold Lake: + 30 kbd
Nabiye
Mineral Lease
Approved Development Area
Developed Pads
Near Term Development
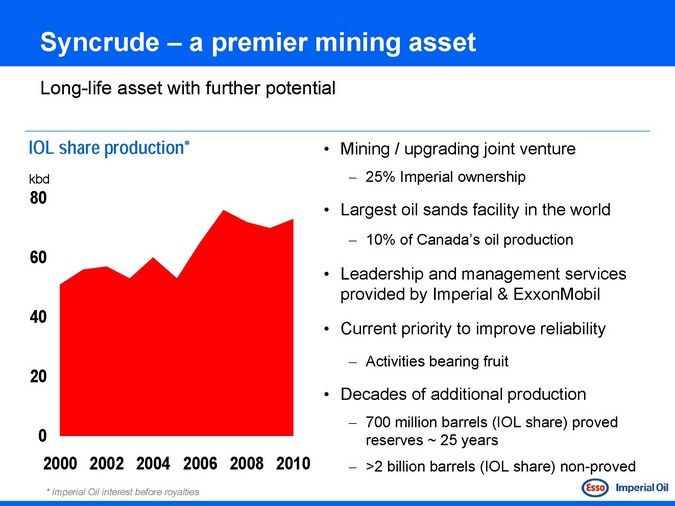
Syncrude – a premier mining asset
Long-life asset with further potential
IOL share production*
kbd
80 60 40 20 0
2000 2002 2004 2006 2008 2010
Mining / upgrading joint venture
25% Imperial ownership
Largest oil sands facility in the world
10% of Canada’s oil production
Leadership and management services provided by Imperial & ExxonMobil
Current priority to improve reliability
Activities bearing fruit
Decades of additional production
700 million barrels (IOL share) proved reserves ~ 25 years
>2 billion barrels (IOL share) non-proved
* | | Imperial Oil interest before royalties |
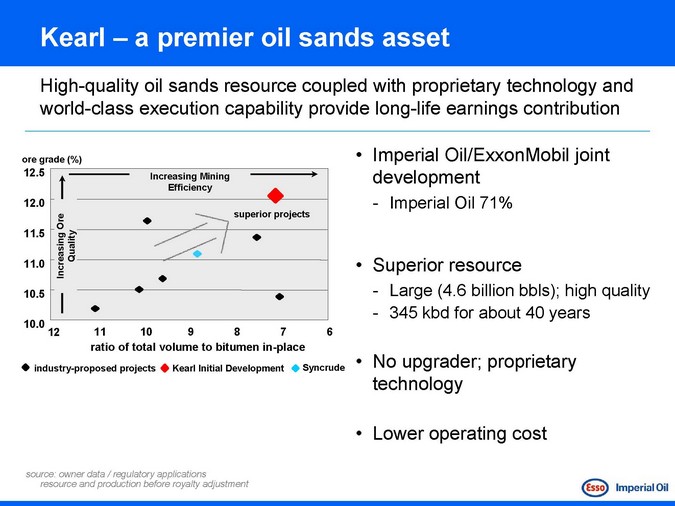
Kearl – a premier oil sands asset
High-quality oil sands resource coupled with proprietary technology and world-class execution capability provide long-life earnings contribution
ore grade (%)
12.5 Increasing Mining Efficiency 12.0
Ore superior projects 11.5 Quality 11.0 Increasing 10.5
10.0
12 11 10 9 8 7 6
ratio of total volume to bitumen in-place
industry -proposed projects
Kearl Initial Development
Syncrude
Imperial Oil/ExxonMobil joint development
Imperial Oil 71%
Superior resource
Large (4.6 billion bbls); high quality 345 kbd for about 40 years
No upgrader; proprietary technology
Lower operating cost
source: owner data / regulatory applications resource and production before royalty adjustment
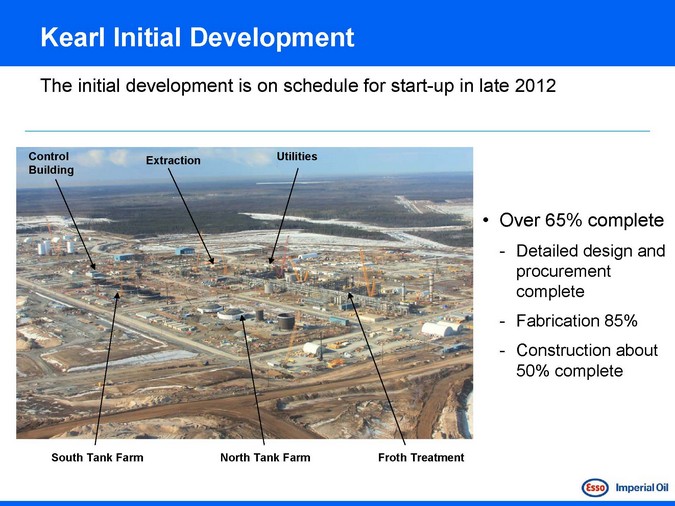
Kearl Initial Development
The initial development is on schedule for start-up in late 2012
Control Extraction Utilities Building
South Tank Farm North Tank Farm Froth Treatment
Over 65% complete
Detailed design and procurement complete Fabrication 85% Construction about 50% complete
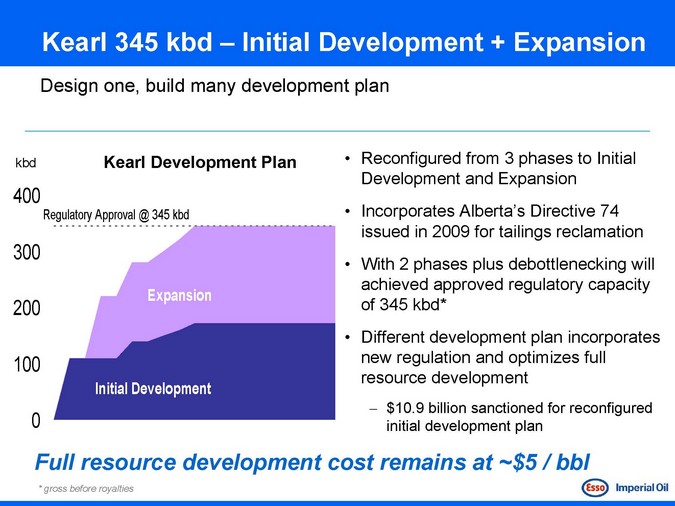
Kearl 345 kbd – Initial Development + Expansion
Design one, build many development plan
Kearl Development Plan
kbd
400 300 200 100 0
Regulatory Approval @ 345 kbd
Expansion
Initial Development
Reconfigured from 3 phases to Initial Development and Expansion Incorporates Alberta’s Directive 74 issued in 2009 for tailings reclamation With 2 phases plus debottlenecking will achieved approved regulatory capacity of 345 kbd* Different development plan incorporates new regulation and optimizes full resource development
$10.9 billion sanctioned for reconfigured initial development plan
Full resource development cost remains at ~$5 / bbl
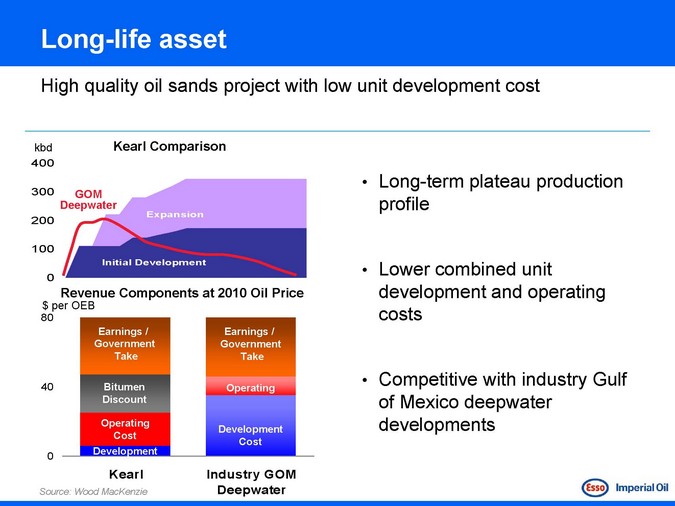
Long -life asset
High quality oil sands project with low unit development cost
Kearl Comparison
kbd
400
300 GOM Deepwater
200 100 0
Expansion
Initial Development
Revenue Components at 2010 Oil Price $ per OEB
80
40
0
Earnings / Government Take
Bitumen Discount
Operating Cost Development
Kearl
Earnings / Government Take
Operating
Development Cost
Industry GOM Deepwater
Source: Wood MacKenzie
Long-term plateau production profile
Lower combined unit development and operating costs
Competitive with industry Gulf of Mexico deepwater developments
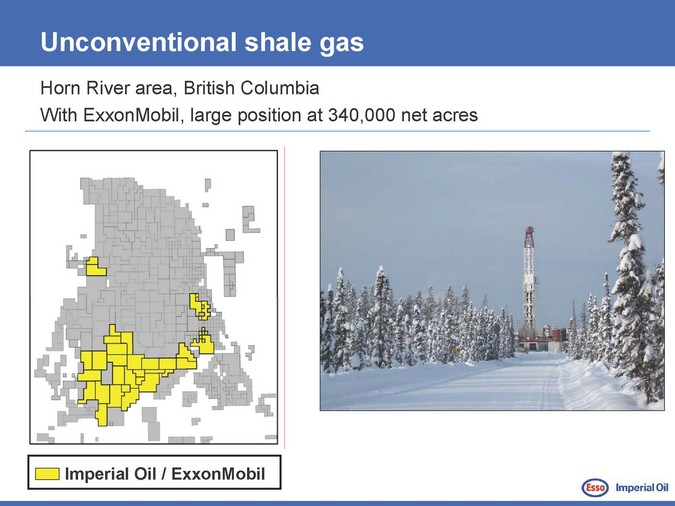
Unconventional shale gas
Horn River area, British Columbia
With ExxonMobil, large position at 340,000 net acres
Imperial Oil / ExxonMobil
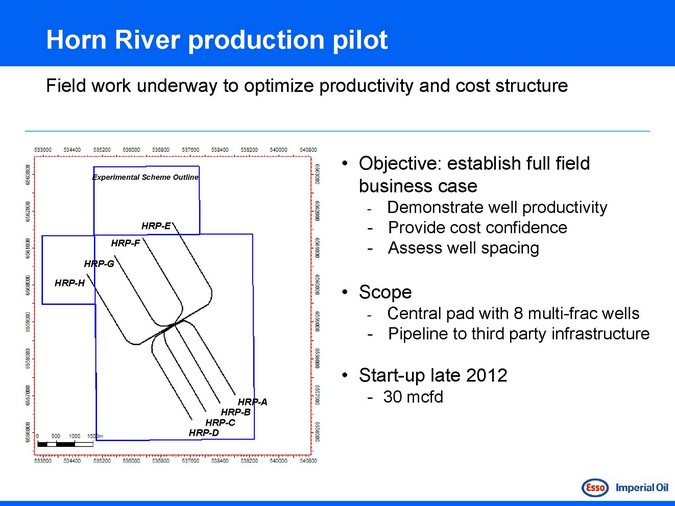
Horn River production pilot
Field work underway to optimize productivity and cost structure
Objective: establish full field business case
Demonstrate well productivity Provide cost confidence Assess well spacing
Scope
Central pad with 8 multi-frac wells Pipeline to third party infrastructure
Start-up late 2012
30 mcfd
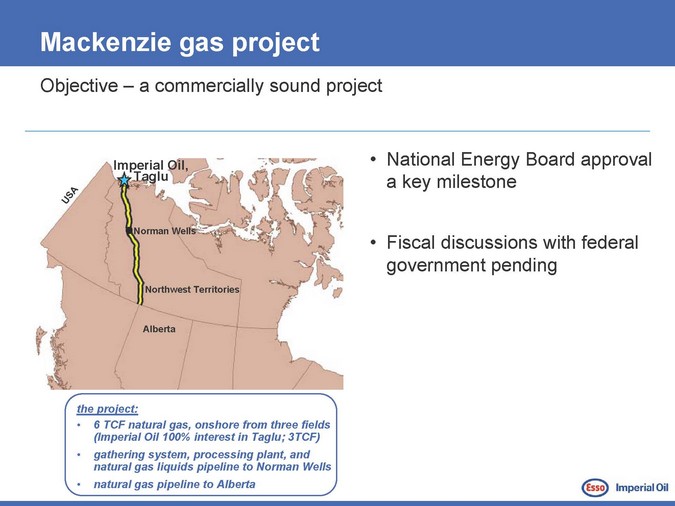
Mackenzie gas project
Objective – a commercially sound project
National Energy Board approval a key milestone
Fiscal discussions with federal government pending
Imperial Oil, Taglu
S A U
Norman Wells
Northwest Territories
Alberta
the project:
6 TCF natural gas, onshore from three fields (Imperial Oil 100% interest in Taglu; 3TCF) gathering system, processing plant, and natural gas liquids pipeline to Norman Wells natural gas pipeline to Alberta
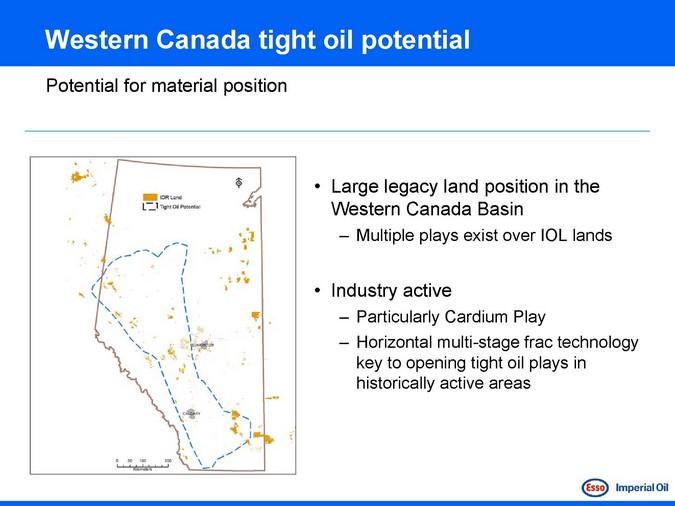
Western Canada tight oil potential
Potential for material position
Large legacy land position in the Western Canada Basin
Multiple plays exist over IOL lands
Industry active
Particularly Cardium Play
Horizontal multi-stage frac technology key to opening tight oil plays in historically active areas
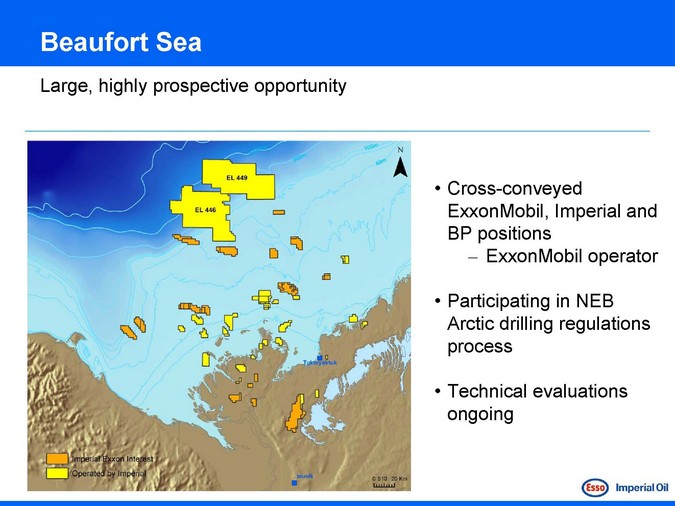
Beaufort Sea
Large, highly prospective opportunity
Cross-conveyed
ExxonMobil, Imperial and BP positions
– ExxonMobil operator
Participating in NEB Arctic drilling regulations process
Technical evaluations ongoing
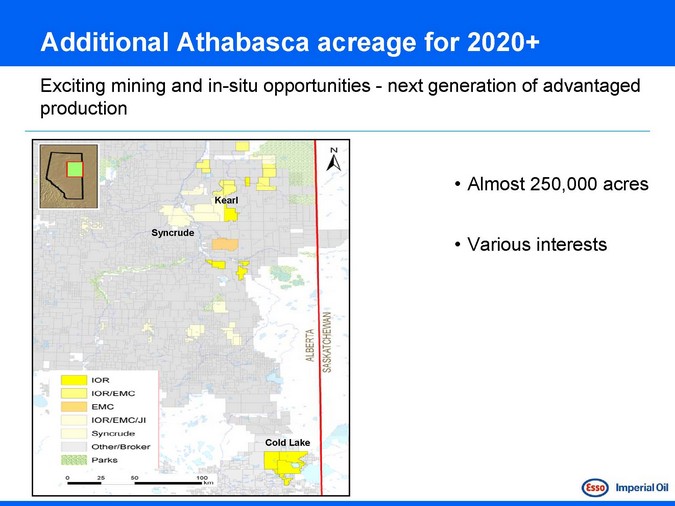
Additional Athabasca acreage for 2020+
Exciting mining and in-situ opportunities—next generation of advantaged production
Almost 250,000 acres
Various interests
Imperial Oil – 2011 Investor Meeting
Downstream and Chemical
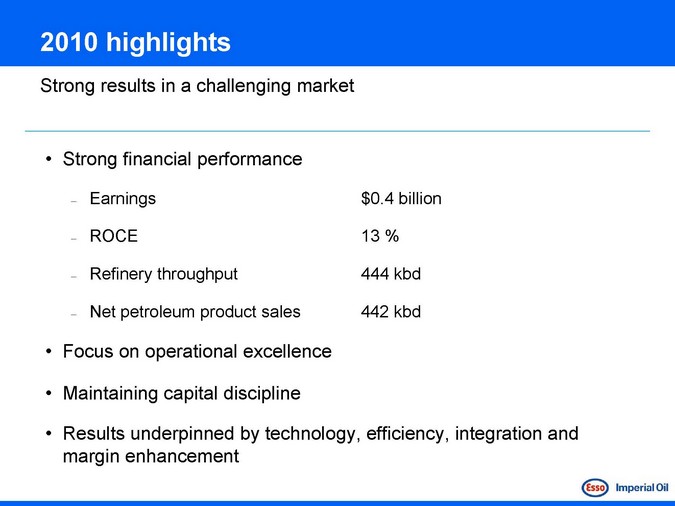
2010 highlights
Strong results in a challenging market
Strong financial performance
Earnings ROCE Refinery throughput
Net petroleum product sales
$0.4 billion 13 % 444 kbd 442 kbd
Focus on operational excellence
Maintaining capital discipline
Results underpinned by technology, efficiency, integration and margin enhancement
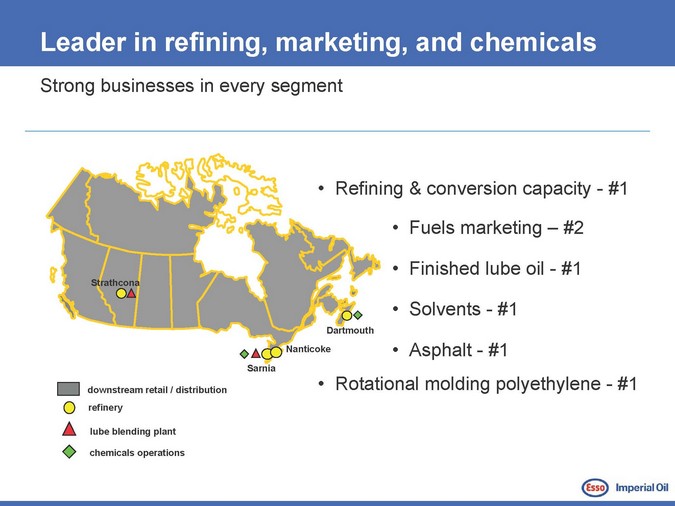
Leader in refining, marketing, and chemicals
Strong businesses in every segment
Refining & conversion capacity—#1
Fuels marketing – #2 Finished lube oil—#1 Solvents—#1 Asphalt—#1
Rotational molding polyethylene—#1
Dartmouth
Strathcona
Nanticoke
Sarnia
downstream retail / distribution refinery
lube blending plant
chemicals operations
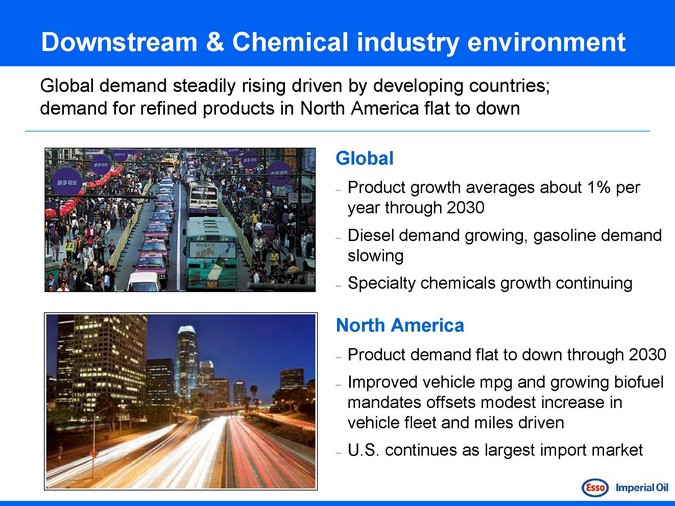
Downstream & Chemical industry environment
Global demand steadily rising driven by developing countries; demand for refined products in North America flat to down
Global
Product growth averages about 1% per year through 2030 Diesel demand growing, gasoline demand slowing Specialty chemicals growth continuing
North America
Product demand flat to down through 2030 Improved vehicle mpg and growing biofuel mandates offsets modest increase in vehicle fleet and miles driven U.S. continues as largest import market
Downstream and Chemical strategies
A culture of continuous improvement through Self-Help drives superior results
Relentless focus on best-in-class operations
Provide valued and high quality products and services to our customers
Lead industry in efficiency and effectiveness
Capitalize on integration across Imperial and ExxonMobil operations
Disciplined and selective investments for advantaged returns
Maximize value from technology leadership
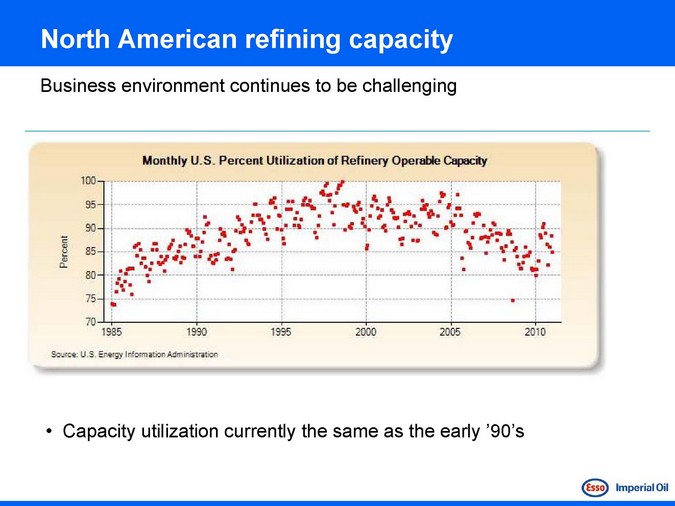
North American refining capacity
Business environment continues to be challenging
Capacity utilization currently the same as the early ‘90’s
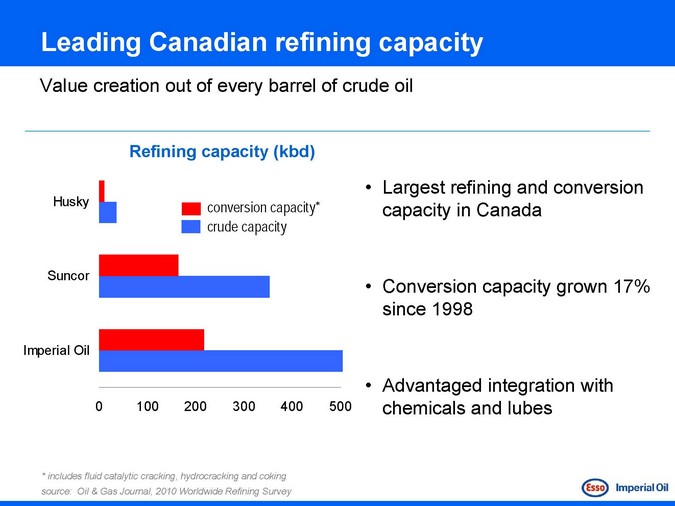
Leading Canadian refining capacity
Value creation out of every barrel of crude oil
Refining capacity (kbd)
Husky
Suncor
Imperial Oil
conversion capacity* crude capacity
0 100 200 300 400 500
Largest refining and conversion capacity in Canada
Conversion capacity grown 17% since 1998
Advantaged integration with chemicals and lubes
* includes fluid catalytic cracking, hydrocracking and coking source: Oil & Gas Journal, 2010 Worldwide Refining Survey
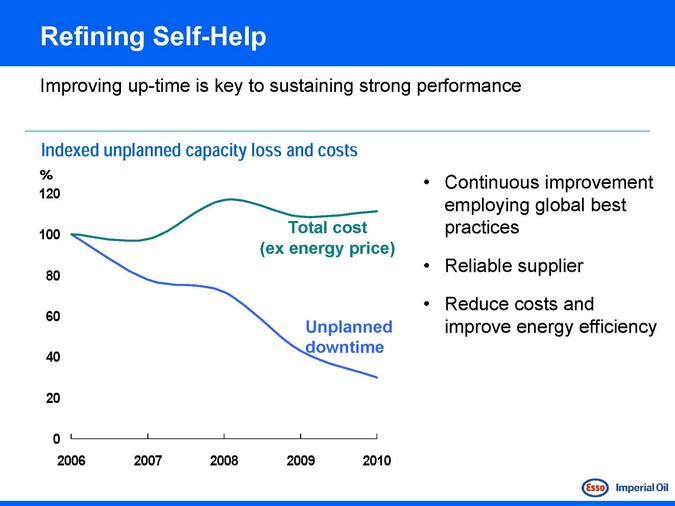
Refining Self-Help
Improving up-time is key to sustaining strong performance
Indexed unplanned capacity loss and costs
%
120 100 80 60 40 20 0
2006 2007 2008 2009 2010
Total cost (ex energy price)
Unplanned downtime
Continuous improvement employing global best practices
Reliable supplier
Reduce costs and improve energy efficiency
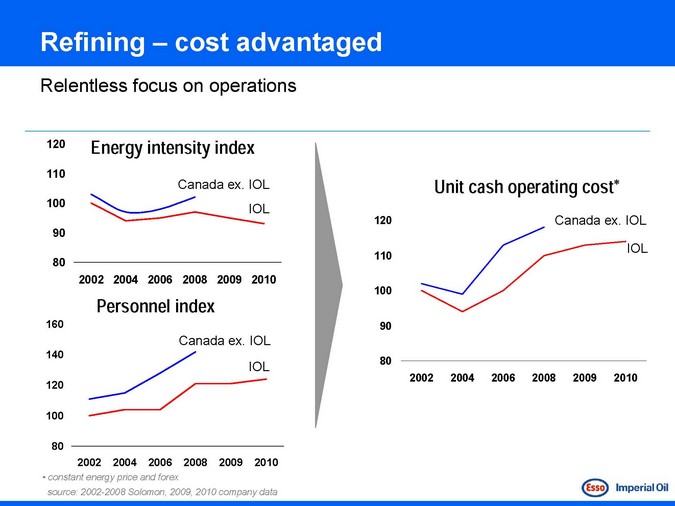
Refining – cost advantaged
Relentless focus on operations
120 110 100 90 80
Energy intensity index
Canada ex. IOL
IOL
2002 2004 2006 2008 2009 2010
Personnel index
160 140 120 100 80
Canada ex. IOL
IOL
2002 2004 2006 2008 2009 2010
• constant energy price and forex source: 2002-2008 Solomon, 2009, 2010 company data
Unit cash operating cost*
120 110 100 90 80
2002 2004 2006 2008 2009 2010
Canada ex. IOL
IOL
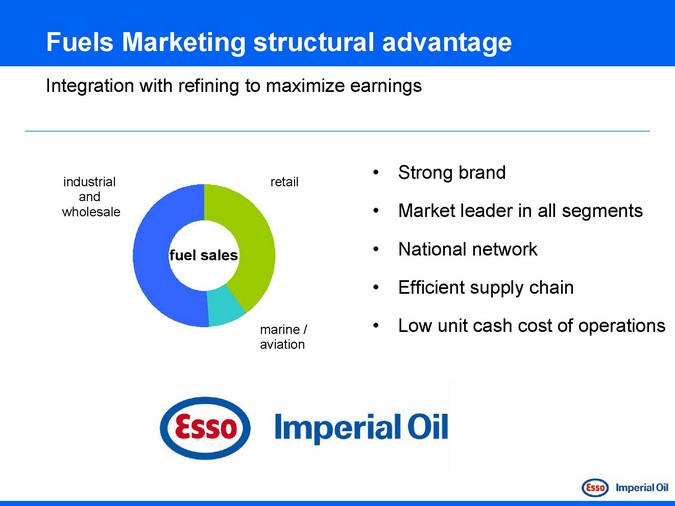
Fuels Marketing structural advantage
Integration with refining to maximize earnings
industrial and wholesale
retail
Strong brand
Market leader in all segments National network Efficient supply chain Low unit cash cost of operations
fuel sales
marine / aviation
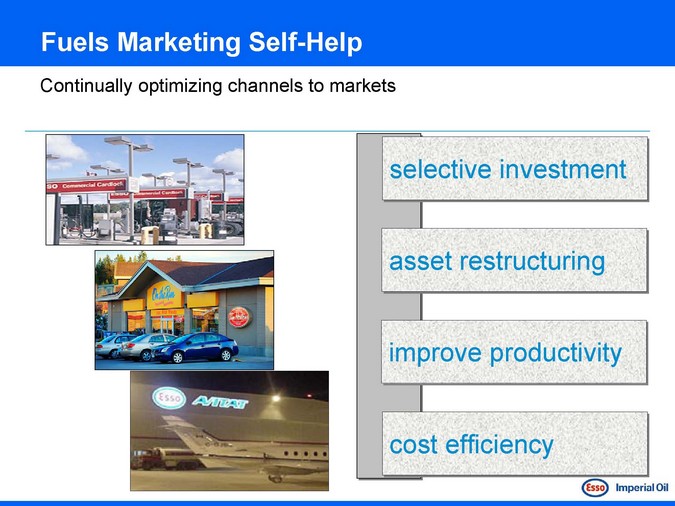
Fuels Marketing Self-Help
Continually optimizing channels to markets
selective investment
asset restructuring
improve productivity
cost efficiency
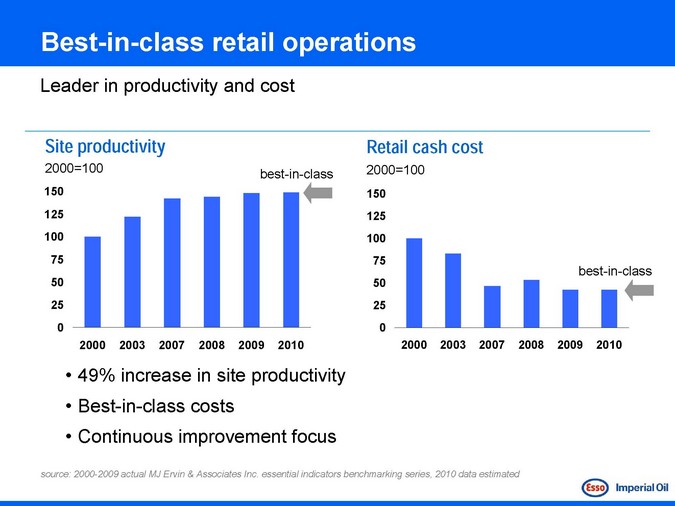
Best-in-class retail operations
Leader in productivity and cost
Site productivity
2000=100
150 125 100 75 50 25 0
2000 2003 2007 2008 2009 2010
best-in-class
Retail cash cost
2000=100
150 125 100 75 50 25 0
2000 2003 2007 2008 2009 2010
best-in-class
49% increase in site productivity Best-in-class costs Continuous improvement focus
source: 2000-2009 actual MJ Ervin & Associates Inc. essential indicators benchmarking series, 2010 data estimated
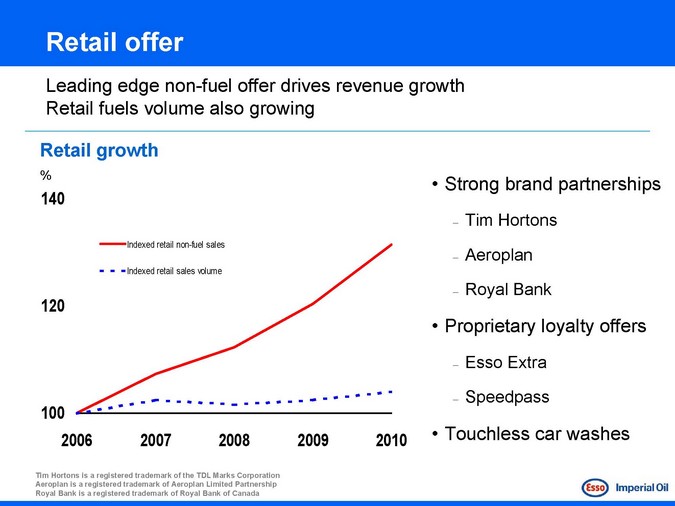
Retail offer
Leading edge non-fuel offer drives revenue growth Retail fuels volume also growing
Retail growth
%
140
Indexed retail non-fuel sales
Indexed retail sales volume
120
100
2006 2007 2008 2009 2010
Strong brand partnerships
Tim Hortons Aeroplan Royal Bank
Proprietary loyalty offers
Esso Extra
Speedpass
Touchless car washes
Tim Hortons is a registered trademark of the TDL Marks Corporation Aeroplan is a registered trademark of Aeroplan Limited Partnership Royal Bank is a registered trademark of Royal Bank of Canada
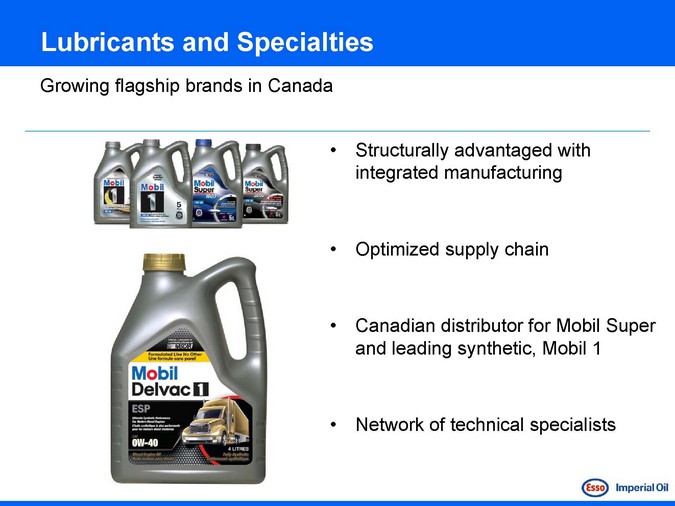
Lubricants and Specialties
Growing flagship brands in Canada
Structurally advantaged with integrated manufacturing
Optimized supply chain
Canadian distributor for Mobil Super and leading synthetic, Mobil 1
Network of technical specialists
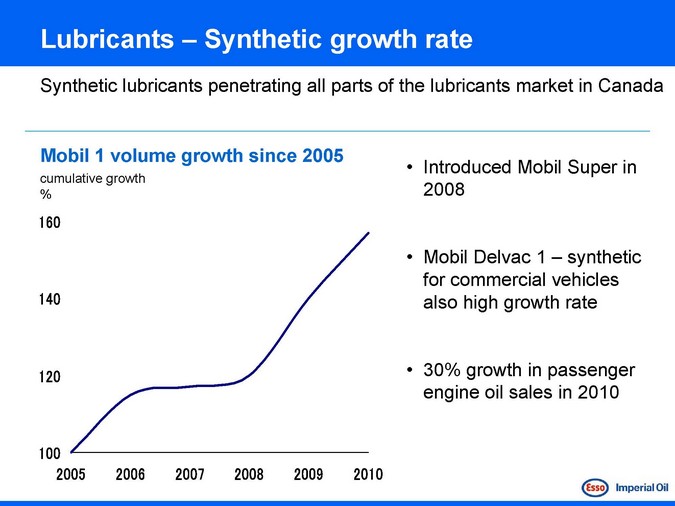
Lubricants – Synthetic growth rate
Synthetic lubricants penetrating all parts of the lubricants market in Canada
Mobil 1 volume growth since 2005
cumulative growth %
160
140
120
100 200520062007200820092010
Introduced Mobil Super in 2008
Mobil Delvac 1 – synthetic for commercial vehicles also high growth rate
30% growth in passenger engine oil sales in 2010
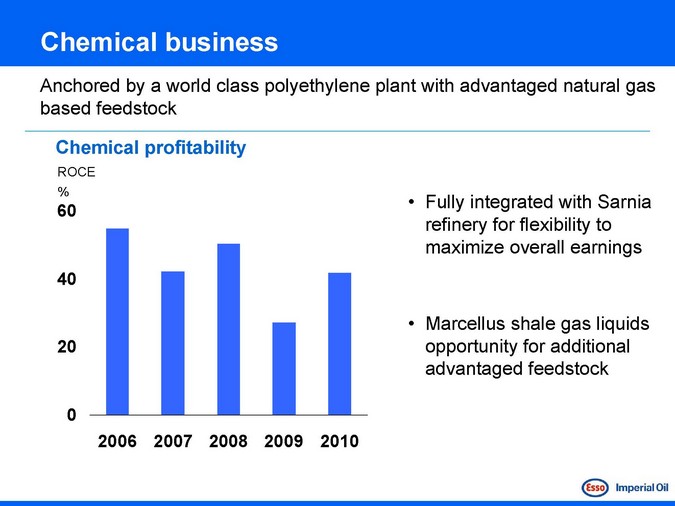
Chemical business
Anchored by a world class polyethylene plant with advantaged natural gas based feedstock
Chemical profitability
ROCE %
60
40 20 0
2006 2007 2008 2009 2010
Fully integrated with Sarnia refinery for flexibility to maximize overall earnings
Marcellus shale gas liquids opportunity for additional advantaged feedstock
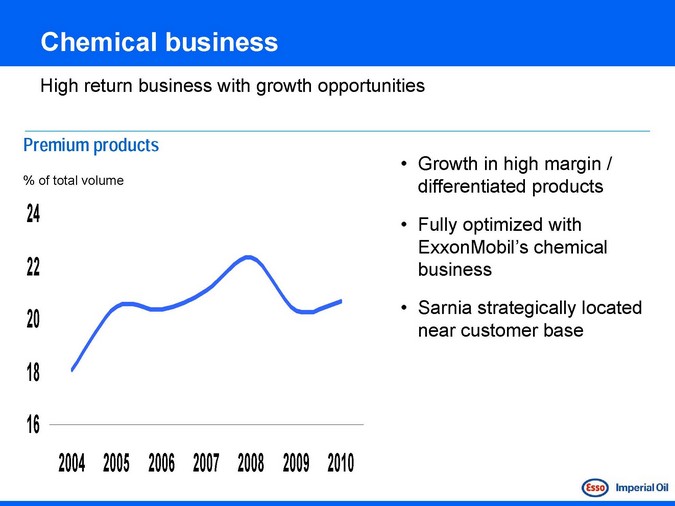
Chemical business
High return business with growth opportunities
Premium products
% of total volume
24
22 20
18 16
2004 2005 2006 2007 2008 2009 2010
Growth in high margin / differentiated products
Fully optimized with ExxonMobil’s chemical business
Sarnia strategically located near customer base
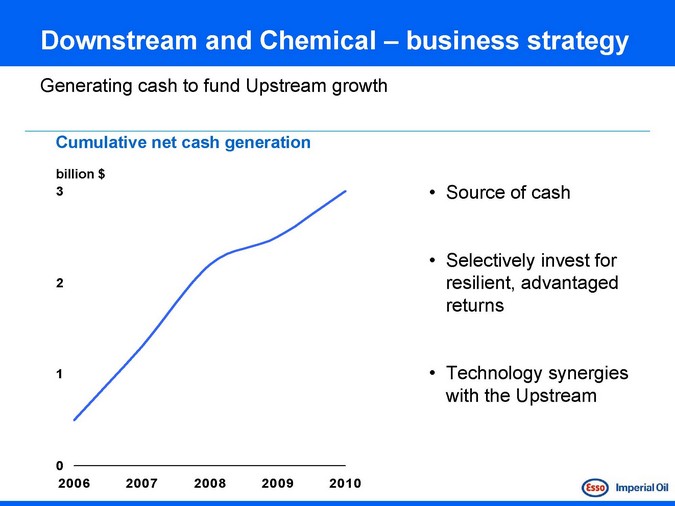
Downstream and Chemical – business strategy
Generating cash to fund Upstream growth
Cumulative net cash generation
billion $ 3
0
2006 2007 2008 2009 2010
Source of cash
Selectively invest for resilient, advantaged returns
Technology synergies with the Upstream
Imperial Oil – 2011 Investor Meeting
Finance—Flexibility
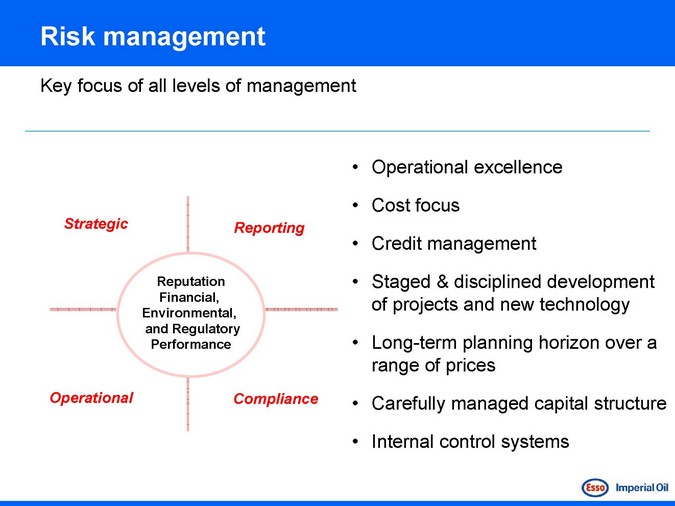
Risk management
Key focus of all levels of management
Strategic
Reporting
Operational
Reputation
Financial, Environmental, and Regulatory Performance
Compliance
Operational excellence Cost focus Credit management
Staged & disciplined development of projects and new technology
Long-term planning horizon over a range of prices
Carefully managed capital structure
Internal control systems
Consistent financial approach
Consistent management approach focused on managing risks in a volatile commodity price environment
Disciplined identification and design of investment opportunities
Cash directed to fund attractive projects Excellent project management and control No special purpose entities No derivatives No hedging Strong internal control systems—a competitive advantage
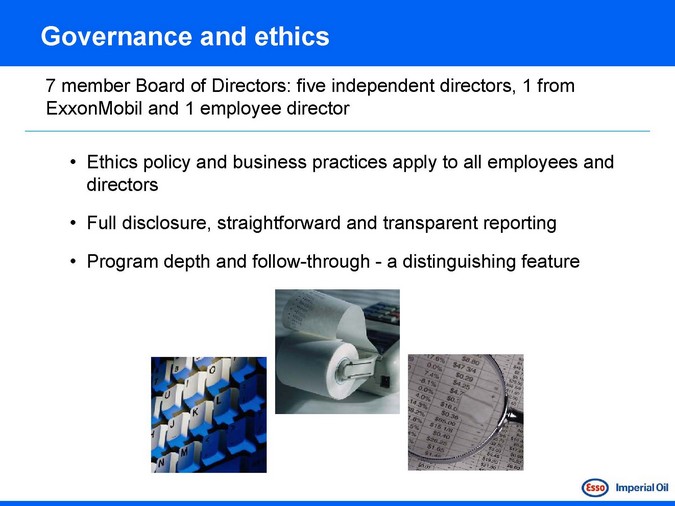
Governance and ethics
7 | | member Board of Directors: five independent directors, 1 from ExxonMobil and 1 employee director |
Ethics policy and business practices apply to all employees and directors
Full disclosure, straightforward and transparent reporting
Program depth and follow-through—a distinguishing feature
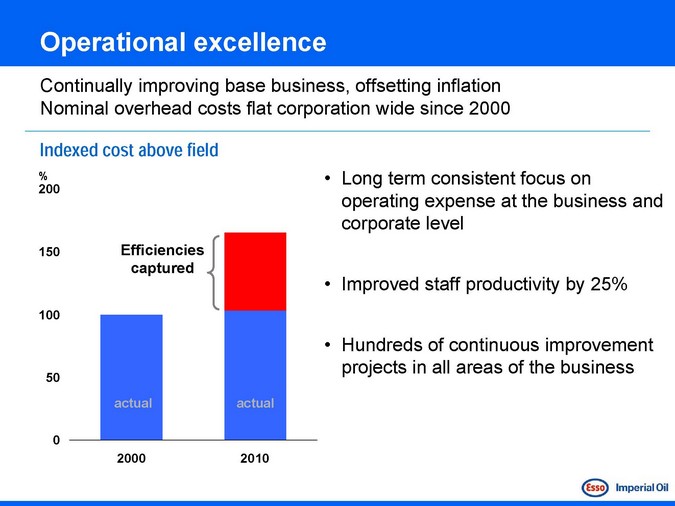
Continually improving base business, offsetting inflation Nominal overhead costs flat corporation wide since 2000
Indexed cost above field
% 200
150 100 50 0
Efficiencies captured
actual actual
2000 2010
Long term consistent focus on operating expense at the business and corporate level
Improved staff productivity by 25%
Hundreds of continuous improvement projects in all areas of the business
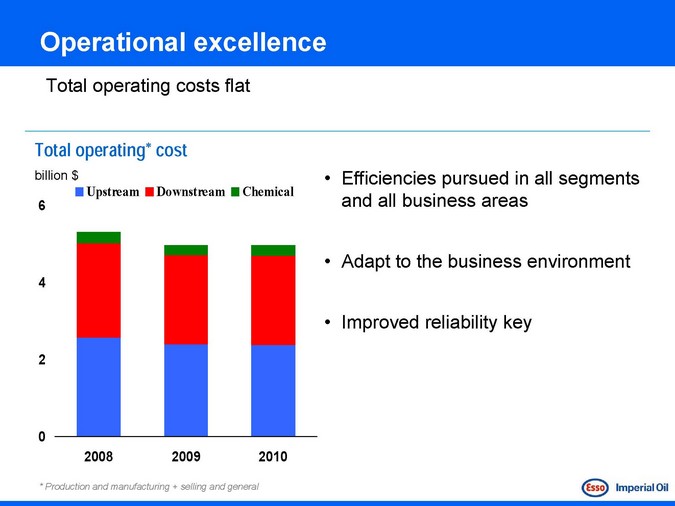
Operational excellence
Total operating costs flat
Total operating* cost
billion $
Upstream
Downst ream
Chemical
0
2008 2009 2010
* | | Production and manufacturing + selling and general |
Efficiencies pursued in all segments and all business areas
Adapt to the business environment
Improved reliability key

Cash utilization
The first and best use of cash is to fund high quality investment opportunities
billion $ 5
Dividends
Capital and Exploration
Share Buy-backs
2006 2 007 2 008 2009 2 010
Priorities
Dividends
Fund all quality opportunities
Develop advantaged projects
Share re-purchases
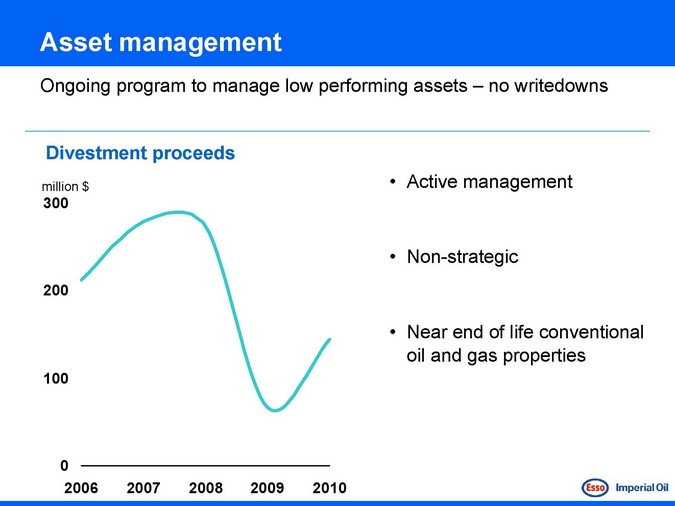
Asset management
Ongoing program to manage low performing assets – no writedowns
Divestment proceeds
million $
300
200
100
0
2006 2007 2008 2009 2010
Active management
Non-strategic
Near end of life conventional oil and gas properties
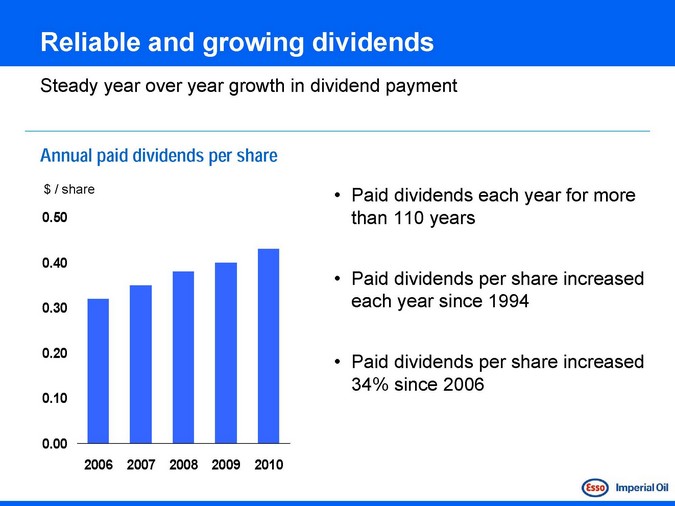
Reliable and growing dividends
Steady year over year growth in dividend payment
Annual paid dividends per share
$ / share
0.50 0.40 0.30 0.20 0.10 0.00
2006 2007 2008 2009 2010
Paid dividends each year for more than 110 years
Paid dividends per share increased each year since 1994
Paid dividends per share increased 34% since 2006
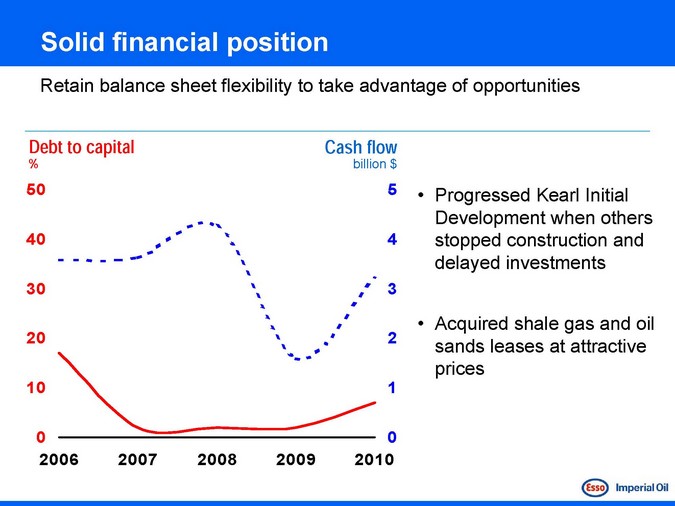
Solid financial position
Retain balance sheet flexibility to take advantage of opportunities
Debt to capital
%
50 40 30 20 10 0
2006 2007 2008 2009 2010
Cash flow
billion $
Progressed Kearl Initial Development when others stopped construction and delayed investments
Acquired shale gas and oil sands leases at attractive prices
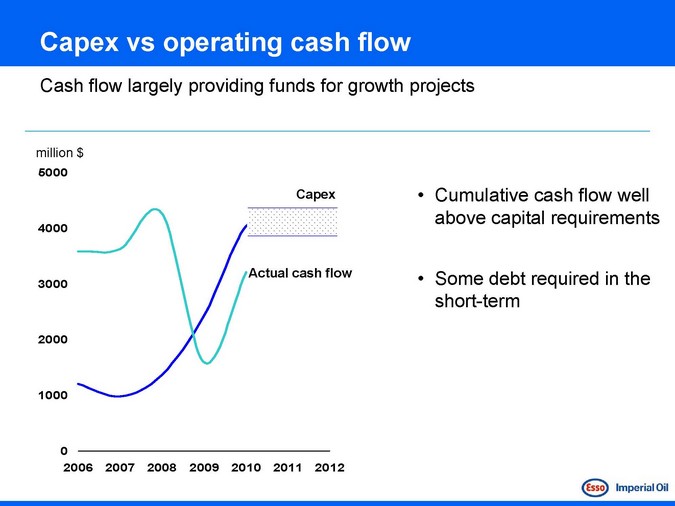
Capex vs operating cash flow
Cash flow largely providing funds for growth projects
million $
5000
4000 3000 2000 1000
0
2006 2007 2008 2009 2010 2011 2012
Capex
Actual cash flow
Cumulative cash flow well above capital requirements
Some debt required in the short-term
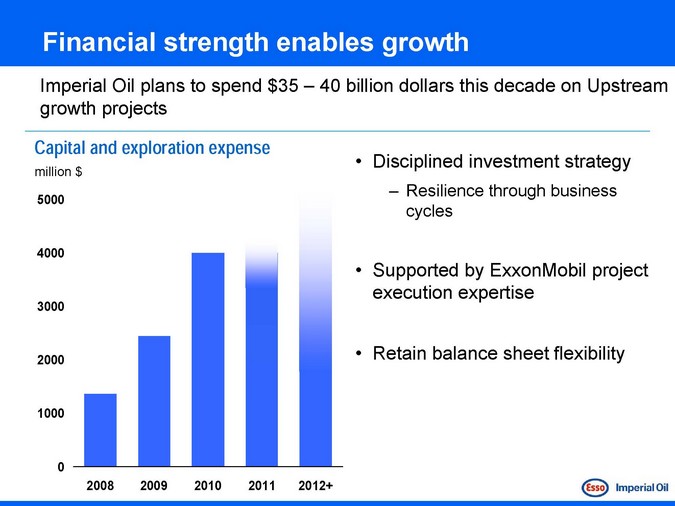
Financial strength enables growth
Imperial Oil plans to spend $35 – 40 billion dollars this decade on Upstream growth projects
Capital and exploration expense
million $
5000 4000 3000 2000 1000 0
2008 2009 2010 2011 2012+
Disciplined investment strategy
Resilience through business cycles
Supported by ExxonMobil project execution expertise
Retain balance sheet flexibility
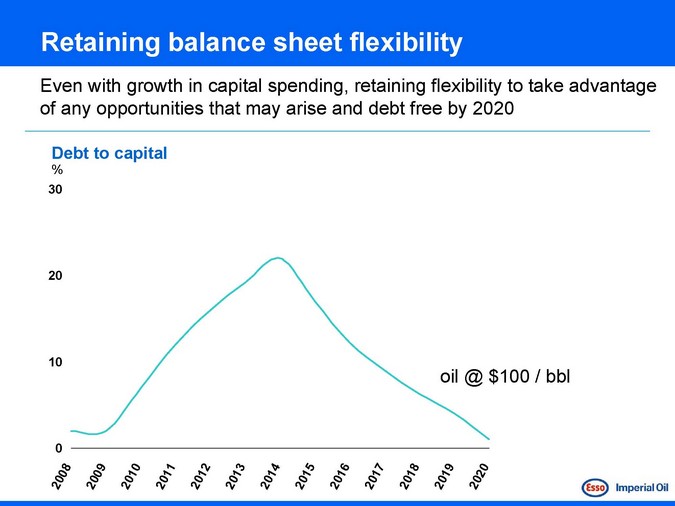
Retaining balance sheet flexibility
Even with growth in capital spending, retaining flexibility to take advantage of any opportunities that may arise and debt free by 2020
Debt to capital
%
30
20
10
0
0 8 0 9 1 0 1 1 1 2 13 1 4 1 5 1 6 1 7 18 1 9 2 0 2 0 20 2 0 2 0 20 2 0 2 0 20 2 0 2 0 2 0 2 0 20
oil @ $100 / bbl
2011 Investor Meeting
Summary Remarks
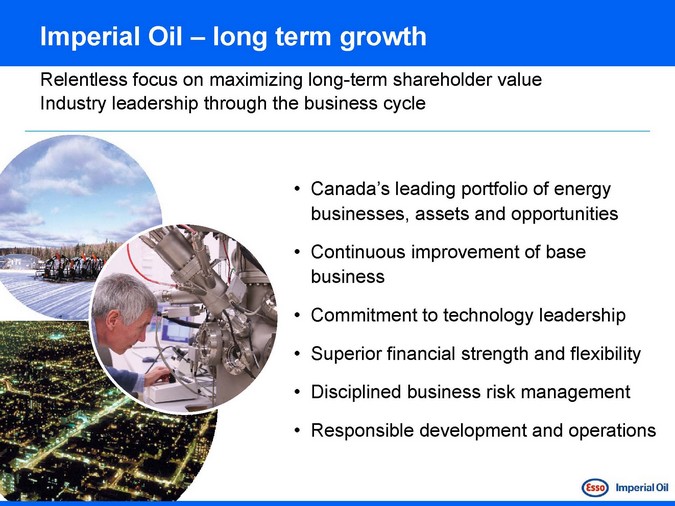
Imperial Oil – long term growth
Relentless focus on maximizing long-term shareholder value Industry leadership through the business cycle
Canada’s leading portfolio of energy businesses, assets and opportunities
Continuous improvement of base business
Commitment to technology leadership Superior financial strength and flexibility Disciplined business risk management Responsible development and operations
For more information www.imperialoil. ca.
For more detailed investor information, or to receive annual and interim reports, please contact:
Mark L. Stumpf
Manager, Investor Relations/Planning & Analysis Imperial Oil Limited 237 Fourth Avenue SW
Calgary, Alberta T2P 3M9 Email: mark.l.stumpf@esso. ca Phone: (403) 237-4537