Exhibit 99.1
[Graphic Appears Here]
INNOVATION, GROWTH, INTEGRITY
InvestorDay
March, 2012
[Graphic Appears Here]
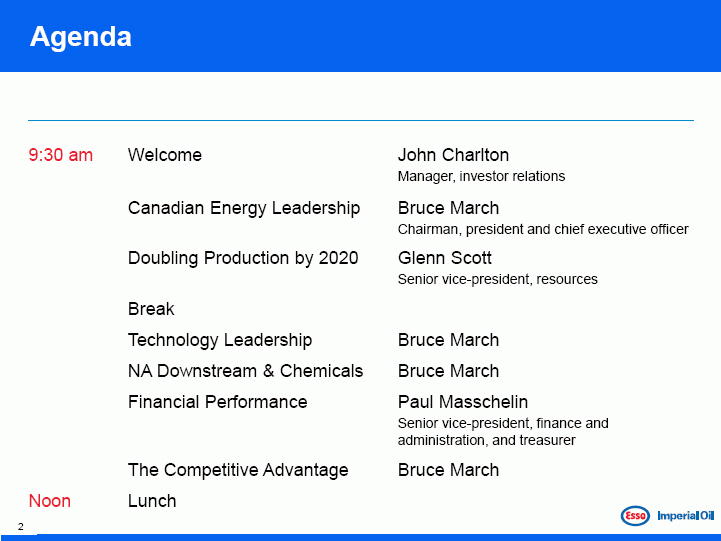
9:30 am Welcome John Charlton
Manager, investor relations
Canadian Energy Leadership
Bruce March
Chairman, president and chief executive officer
Doubling Production by 2020
Glenn Scott
Senior vice-president, resources
Break
Technology Leadership
Bruce March
NA Downstream & Chemicals
Bruce March
Financial Performance
Paul Masschelin
Senior vice-president, finance and administration, and treasurer
The Competitive Advantage
Bruce March
Noon
Lunch
Cautionary statement
This presentation contains forward-looking information on future production, project start-ups and future capital spending. Actual results could differ materially due to changes in project schedules, operating performance, demand for oil and gas, commercial negotiations or other technical and economic factors.
Oil-equivalent barrels (OEB) may be misleading, particularly if used in isolation. An OEB conversion ratio of 6,000 cubic feet to one barrel is based on an energy-equivalency conversion method primarily applicable at the burner tip and does not represent a value equivalency at the well head.
Proved reserves are calculated under United States Securities and Exchange Commission (SEC) requirements, as shown in Form 10-K dated December 31, 2011.
Pursuant to National Instrument 51-101 disclosure guidelines, and using Canadian Oil and Gas Evaluation Handbook definitions, Imperial’s non-proved resources are classified as a “contingent resource.” Such resources are a best estimate of the company’s net interest after royalties at year-end 2011, as determined by Imperial’s internal qualified reserves evaluator. Contingent resources are considered to be potentially recoverable from known accumulations, using established technology or technology under development, but are currently not considered to be commercially recoverable due to one or more contingencies. There is no certainty that it will be economically viable or technically feasible to produce any portion of the resource.
Financials in Canadian dollars.
3
Esso imperial oil
Canadian energy leadersjhip
bruce March
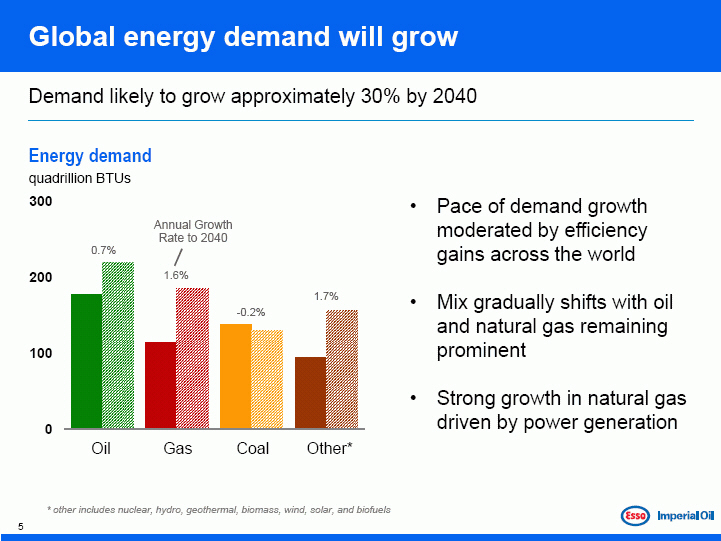
Global energy demand will grow
Demand likely to grow approximately 30% by 2040
Energy demand
[Graphic Appears Here]
* other includes nuclear, hydro, geothermal, biomass, wind, solar, and biofuels
• Pace of demand growth moderated by efficiency gains across the world
• Mix gradually shifts with oil and natural gas remaining prominent
• Strong growth in natural gas driven by power generation
[Graphic Appears Here]
5
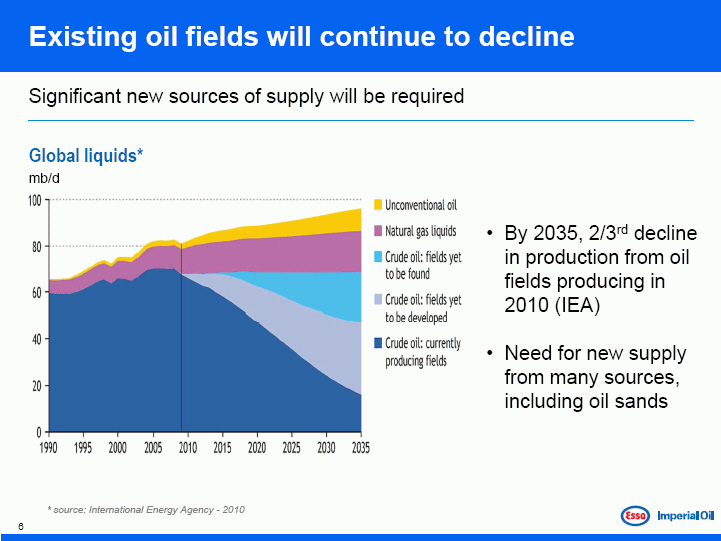
Existing oil fields will continue to decline
Significant new sources of supply will be required
[Graphic Appears Here]
* source: International Energy Agency—2010
[Graphic Appears Here]
• By 2035, 2/3rd decline in production from oil fields producing in 2010 (IEA)
• Need for new supply from many sources, including oil sands
6
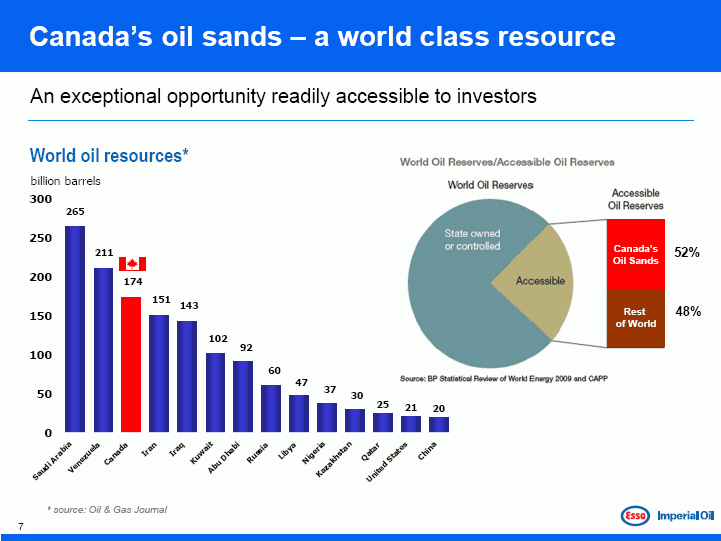
Canada’s oil sands – a world class resource
An exceptional opportunity readily accessible to investors
[Graphic Appears Here]
* source: Oil & Gas Journal
7
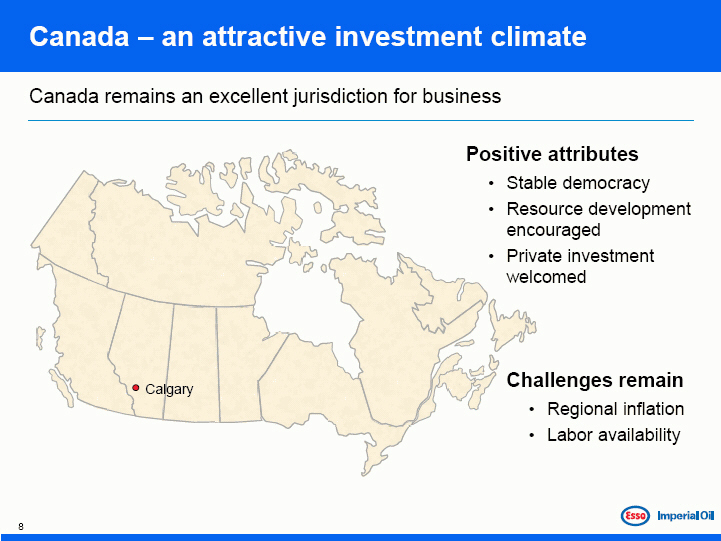
Canada – an attractive investment climate
Canada remains an excellent jurisdiction for business
Positive attributes
• Stable democracy
• Resource development encouraged
• Private investment welcomed
Challenges remain
• Regional inflation
• Labor availability
8
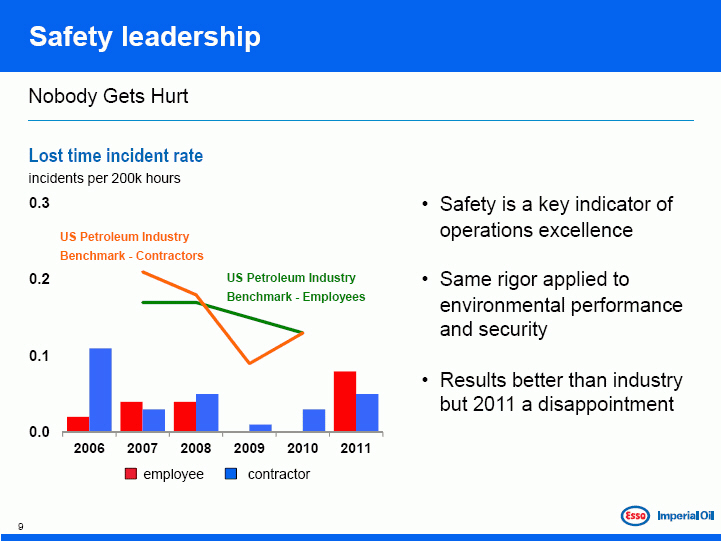
Safety leadership
Nobody Gets Hurt
Lost time incident rate
incidents per 200k hours
• Safety is a key indicator of operations excellence
• Same rigor applied to environmental performance and security
• Results better than industry but 2011 a disappointment
9
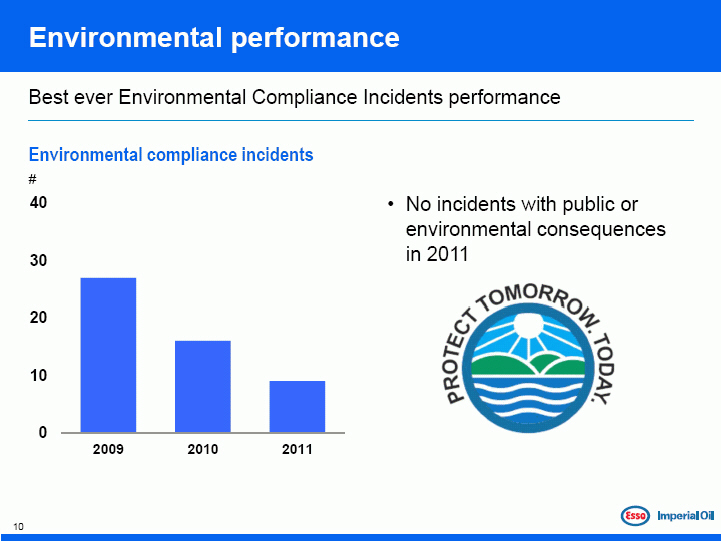
Environmental performance
Best ever Environmental Compliance Incidents performance
Environmental compliance incidents
#
• No incidents with public or environmental consequences in 2011
10
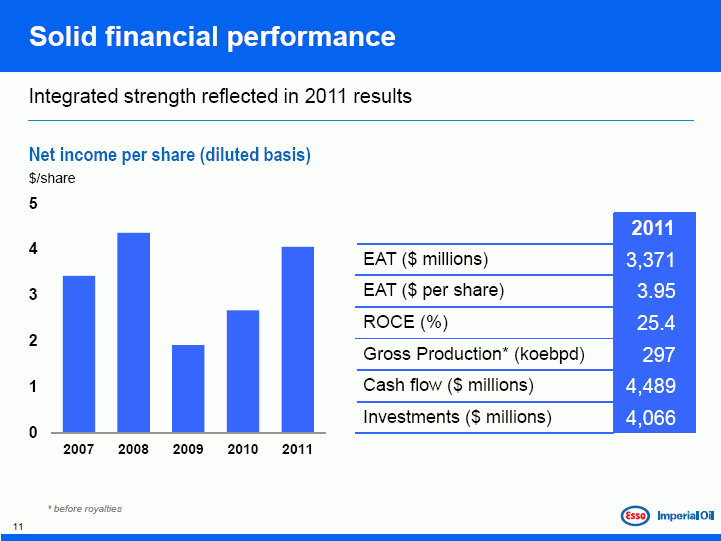
Solid financial performance
Integrated strength reflected in 2011 results
Net income per share (diluted basis)
2011
EAT ($ millions) 3,371
EAT ($ per share) 3.95
ROCE (%) 25.4
Gross Production* (koebpd) 297
Cash flow ($ millions) 4,489
Investments ($ millions) 4,066
* before royalties
11
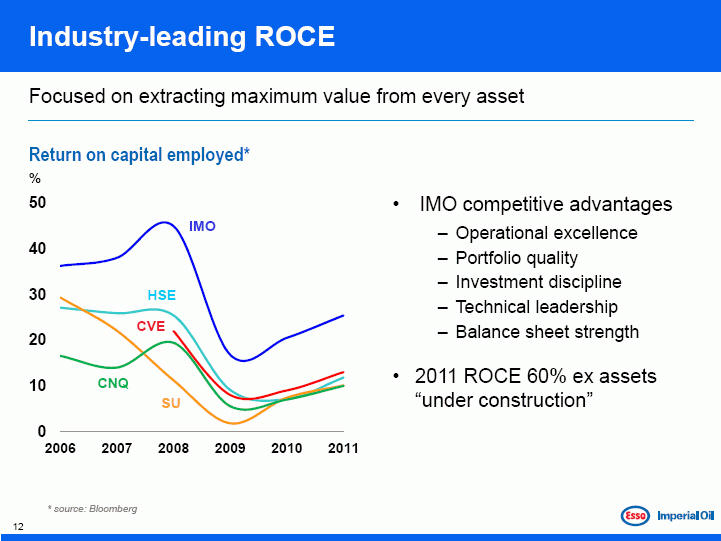
Industry-leading ROCE
Focused on extracting maximum value from every asset
[Graphic Appears Here]
• IMO competitive advantages
3 Operational excellence
3 Portfolio quality
3 Investment discipline
– Technical leadership
– Balance sheet strength
• 2011 ROCE 60% ex assets “under construction”
* source: Bloomberg
12
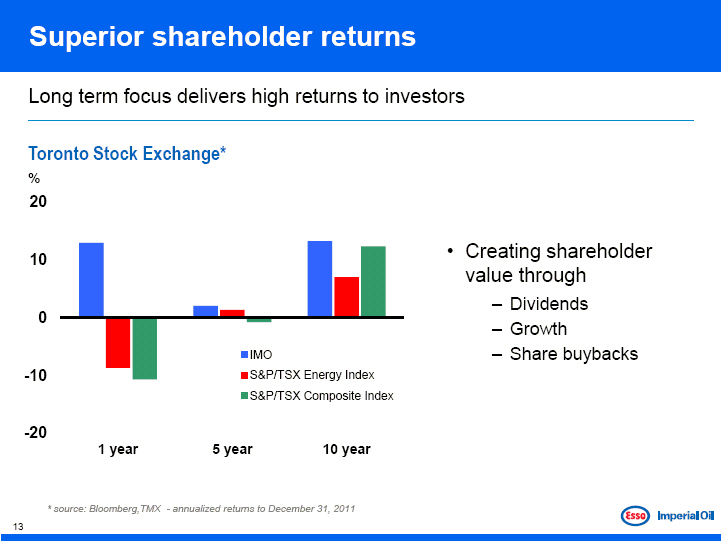
Superior shareholder returns
Long term focus delivers high returns to investors
[Graphic Appears Here]
• Creating shareholder value through
3 Dividends
– Growth
– Share buybacks
* source: Bloomberg,TMX —annualized returns to December 31, 2011
13
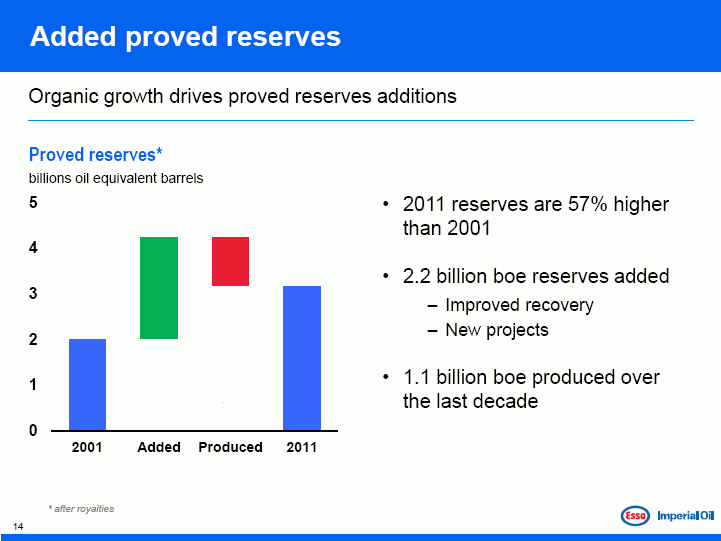
Added proved reserves
Organic growth drives proved reserves additions
[Graphic Appears Here]
• 2011 reserves are 57% higher than 2001
• 2.2 billion boe reserves added
3 Improved recovery
3 New projects
• 1.1 billion boe produced over the last decade
* after royalties
14
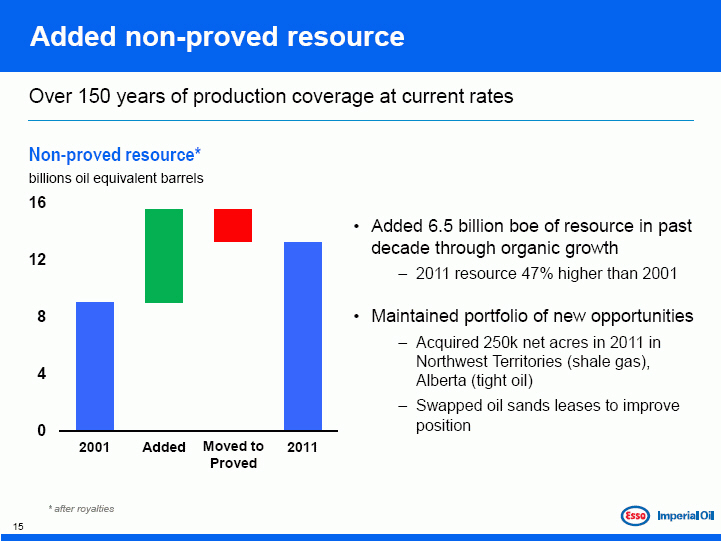
Added non-proved
Over 150 years of production coverage at current rates
[Graphic Appears Here]
• Added 6.5 billion boe of resource in past decade through organic growth
– 2011 resource 47% higher than 2001
• Maintained portfolio of new opportunities
– Acquired 250k net acres in 2011 in Northwest Territories (shale gas), Alberta (tight oil)
– Swapped oil sands leases to improve position
* after royalties
15
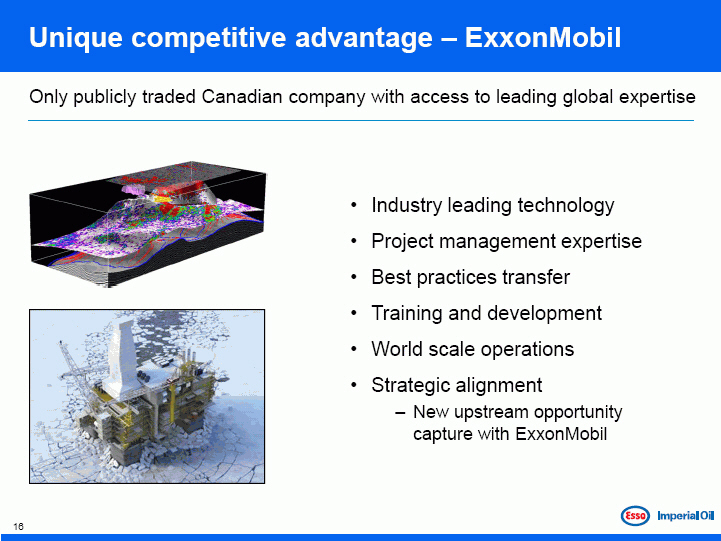
Unique competitive advantage – ExxonMobil
Only publicly traded Canadian company with access to leading global expertise
[Graphic Appears Here]
• Industry leading technology
• Project management expertise
• Best practices transfer
• Training and development
• World scale operations
• Strategic alignment
3 New upstream opportunity capture with ExxonMobil
16
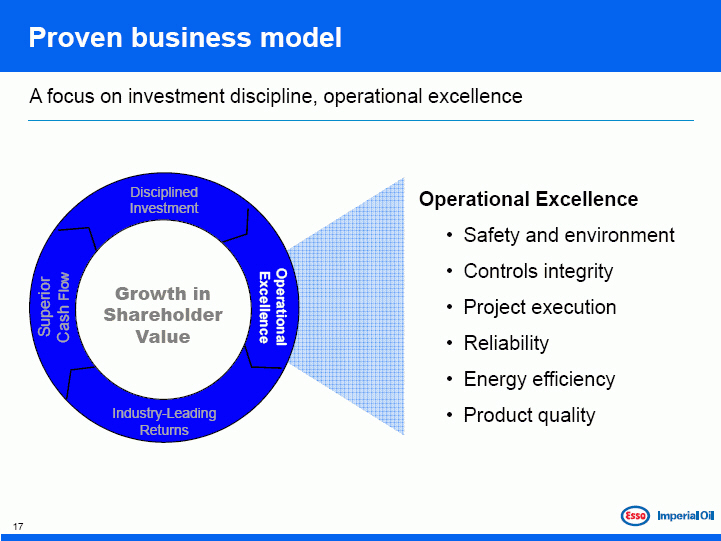
Proven business model
A focus on investment discipline, operational excellence
[Graphic Appears Here]
Operational Excellence
• Safety and environment
• Controls integrity
• Project execution
• Reliability
• Energy efficiency
• Product quality
17
[Graphic Appears Here]
Doubling Upstream Production by 2020
Glenn Scott
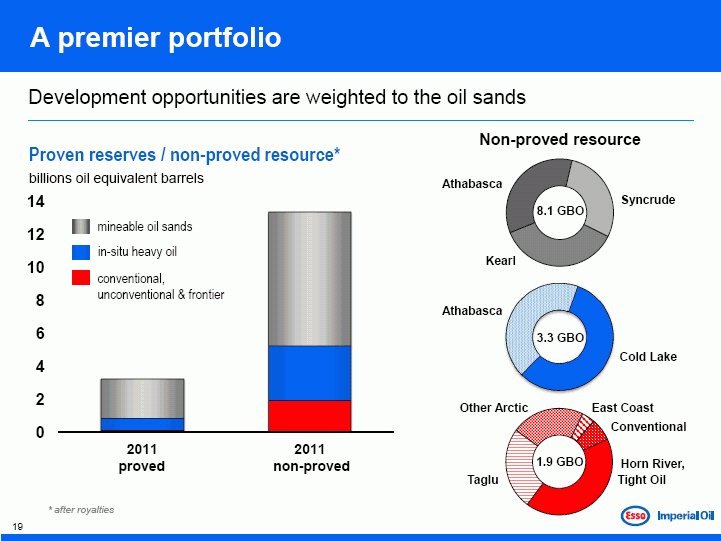
A premier portfolio
Development opportunities are weighted to the oil sands
[Graphic Appears Here]
* after royalties
19
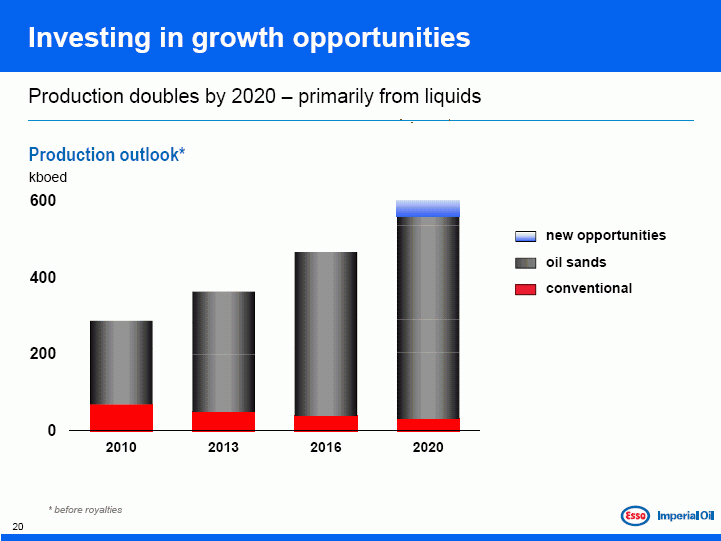
Investing in growth opportunities
Production doubles by 2020 – primarily from liquids
[Graphic Appears Here]
* before royalties
20
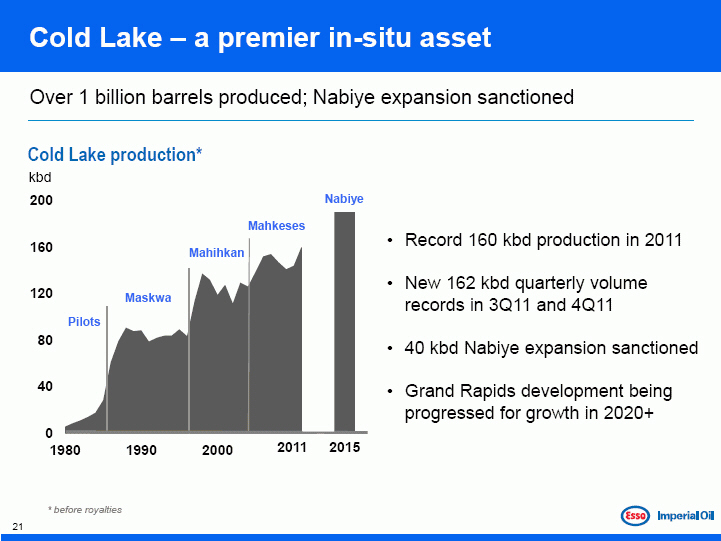
Cold Lake – a premier in-situ asset
Over 1 billion barrels produced; Nabiye expansion sanctioned
[Graphic Appears Here]
• Record 160 kbd production in 2011
• New 162 kbd quarterly volume records in 3Q11 and 4Q11
• 40 kbd Nabiye expansion sanctioned
• Grand Rapids development being progressed for growth in 2020+
* before royalties
21
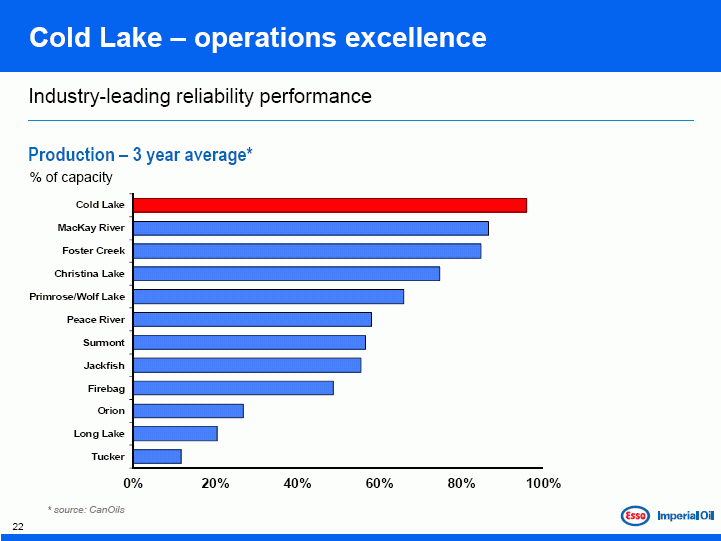
Cold Lake – operations excellence
Industry-leading reliability performance
[Graphic Appears Here]
* source: CanOils
22
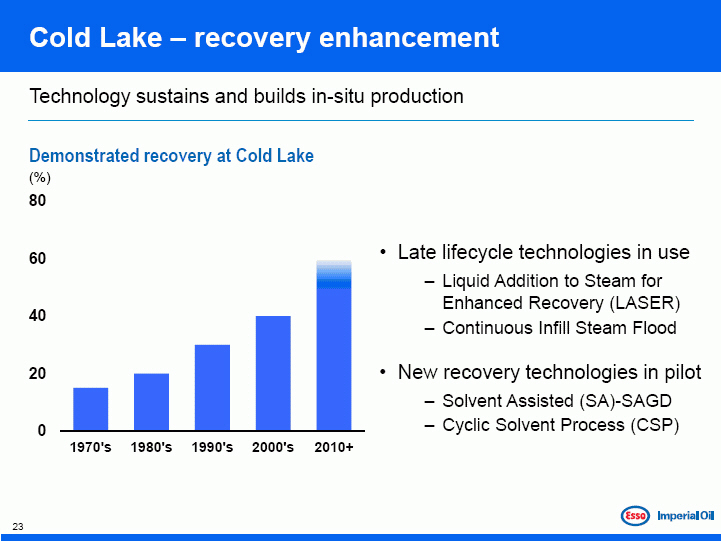
Cold Lake – recovery enhancement
Technology sustains and builds in-situ production
[Graphic Appears Here]
• Late lifecycle technologies in use
– Liquid Addition to Steam for Enhanced Recovery (LASER)
– Continuous Infill Steam Flood
• New recovery technologies in pilot
– Solvent Assisted (SA)-SAGD
– Cyclic Solvent Process (CSP)
23
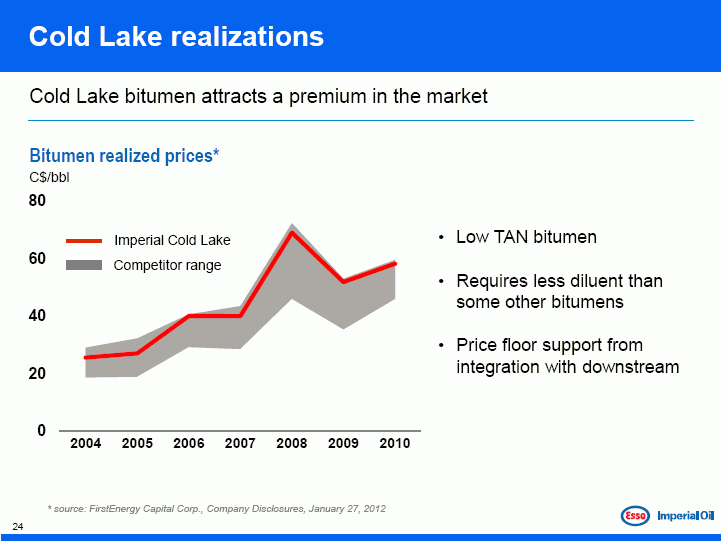
Cold Lake realizations
Cold Lake bitumen attracts a premium in the market
[Graphic Appears Here]
• Low TAN bitumen
• Requires less diluent than some other bitumens
• Price floor support from integration with downstream
* source: FirstEnergy Capital Corp., Company Disclosures, January 27, 2012
24
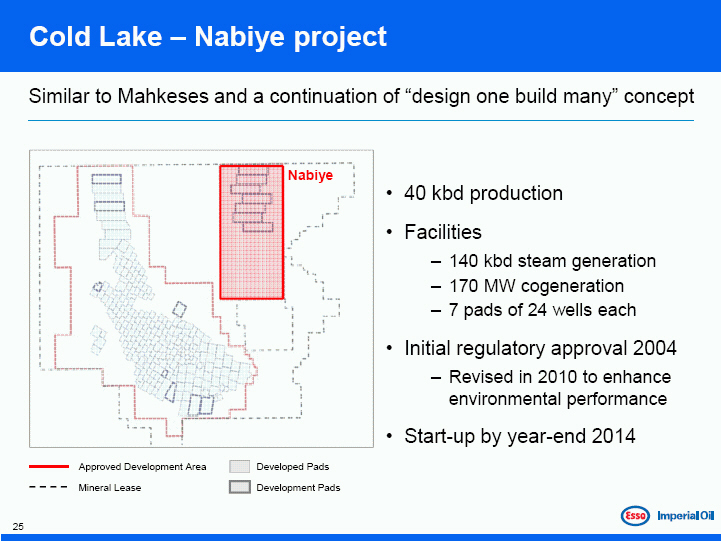
Cold Lake – Nabiye project
Similar to Mahkeses and a continuation of “design one build many” concept
Similar to Mahkeses and a continuation of “design one build many” concept
[Graphic Appears Here]
• 40 kbd production
• Facilities
3 140 kbd steam generation
3 170 MW cogeneration
3 7 pads of 24 wells each
• Initial regulatory approval 2004
3 Revised in 2010 to enhance environmental performance
• Start-up by year-end 2014
25
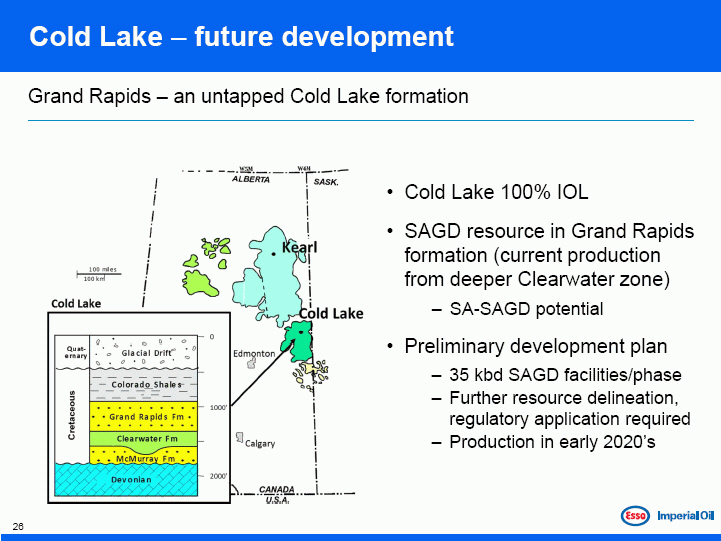
Cold Lake – future development
Grand Rapids – an untapped Cold Lake formation
[Graphic Appears Here]
• Cold Lake 100% IOL
• SAGD resource in Grand Rapids formation (current production from deeper Clearwater zone)
3 SA-SAGD potential
• Preliminary development plan
3 35 kbd SAGD facilities/phase
3 Further resource delineation, regulatory application required
3 Production in early 2020’s
26
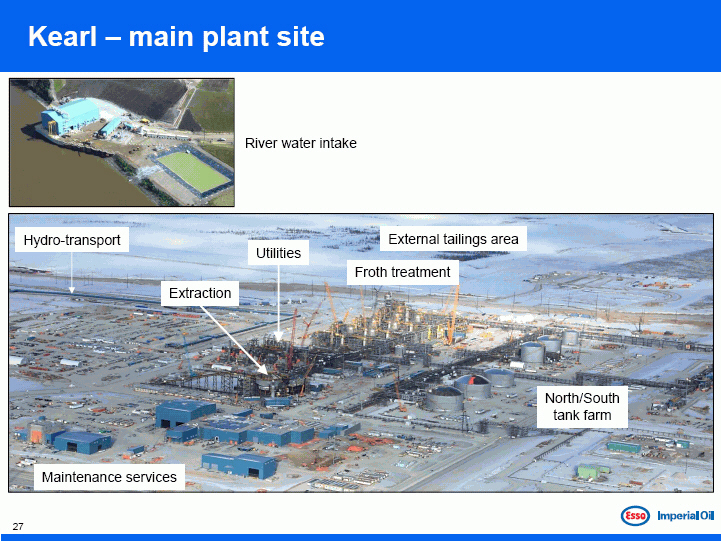
Kearl – main plant site
[Graphic Appears Here]
27
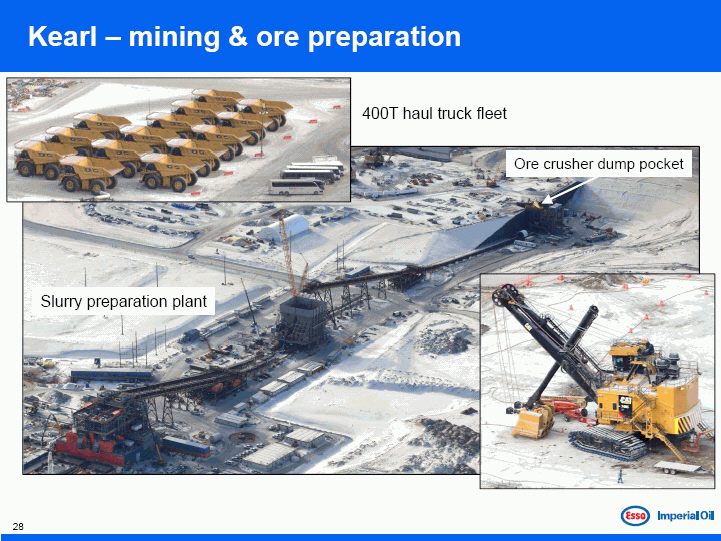
Kearl – mining & ore preparation
[Graphic Appears Here]
28
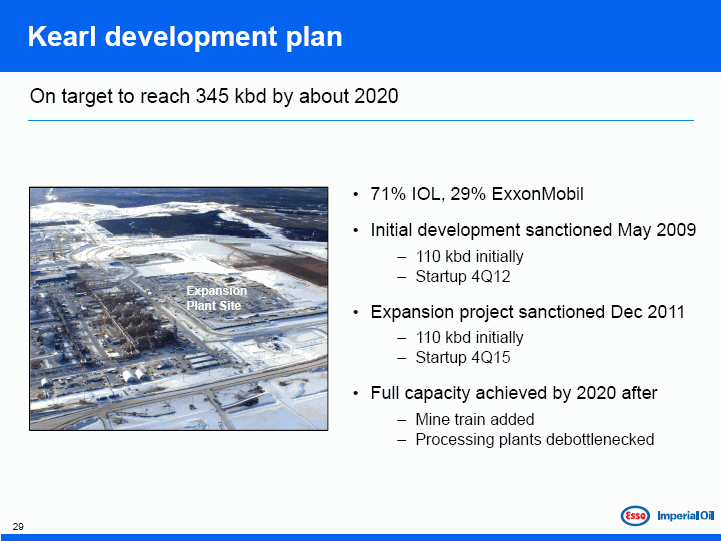
Kearl development plan
[Graphic Appears Here]
On target to reach 345 kbd by about 2020
• 71% IOL, 29% ExxonMobil
• Initial development sanctioned May 2009
3 110 kbd initially
3 Startup 4Q12
• Expansion project sanctioned Dec 2011
3 110 kbd initially
3 Startup 4Q15
• Full capacity achieved by 2020 after
3 Mine train added
3 Processing plants debottle necked
29
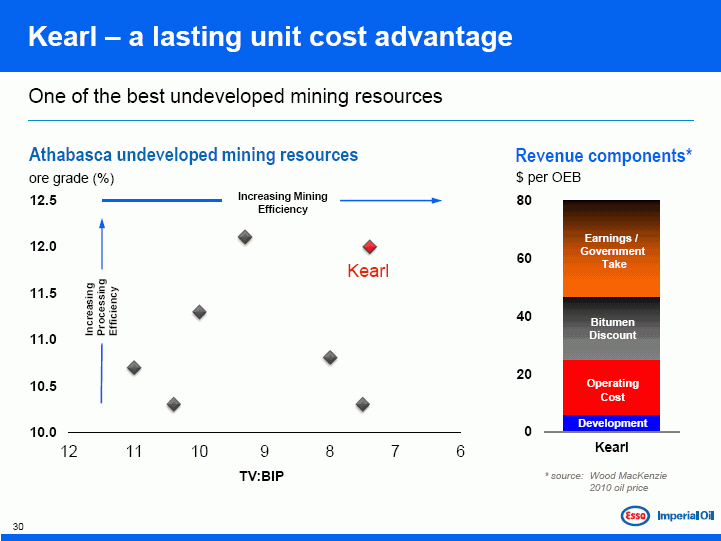
Kearl – a lasting unit cost advantage
One of the best undeveloped mining resources
[Graphic Appears Here]
* source: Wood MacKenzie 2010 oil price
30
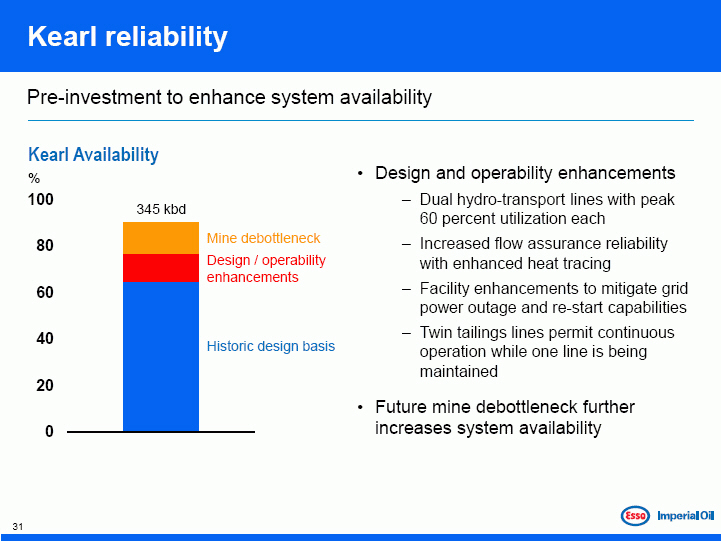
Kearl reliability
Pre-investment to enhance system availability
[Graphic Appears Here]
• Design and operability enhancements
3 Dual hydro-transport lines with peak 60 percent utilization each
3 Increased flow assurance reliability with enhanced heat tracing
3 Facility enhancements to mitigate grid power outage and re-start capabilities
3 Twin tailings lines permit continuous operation while one line is being maintained
• Future mine debottleneck further increases system availability
31
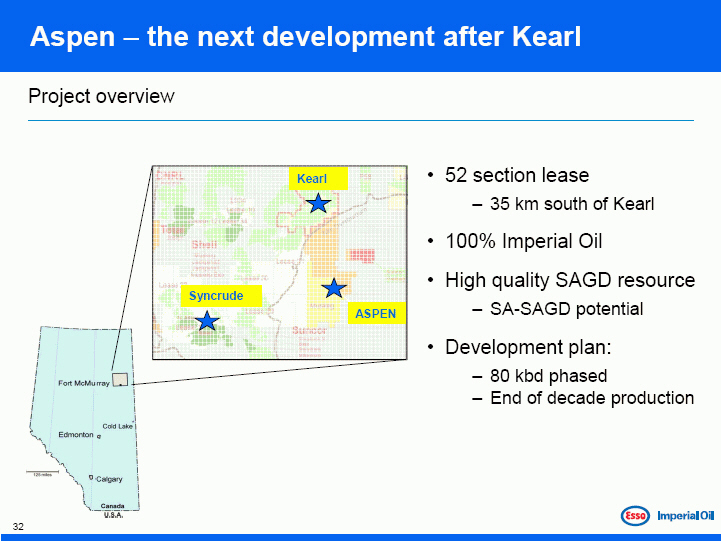
Aspen – the next development after Kearl
Project overview
[Graphic Appears Here]
• 52 section lease
3 35 km south of Kearl
• 100% Imperial Oil
• High quality SAGD resource
3 SA-SAGD potential
• Development plan:
3 80 kbd phased
3 End of decade production
32
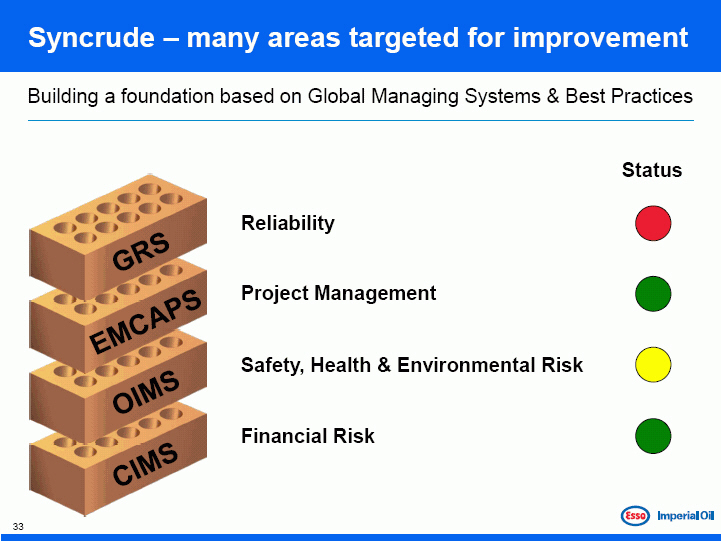
Syncrude – many areas targeted for improvement
Building a foundation based on Global Managing Systems & Best Practices
[Graphic Appears Here]
33
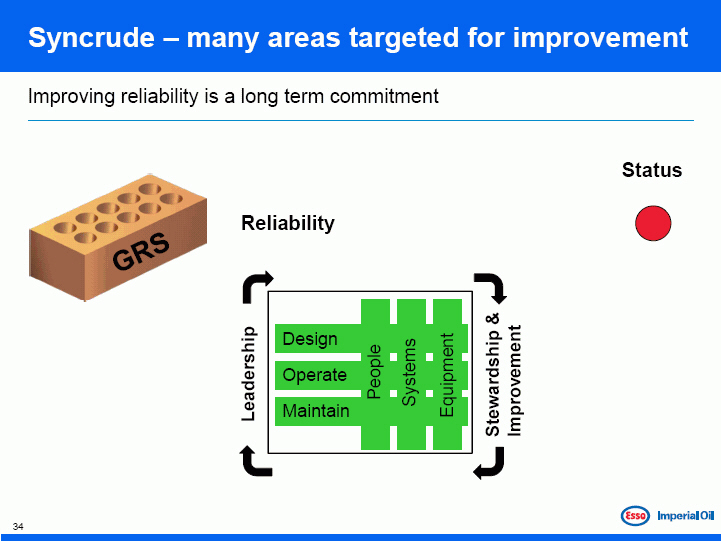
Syncrude – many areas targeted for improvement
Improving reliability is a long term commitment
[Graphic Appears Here]
34
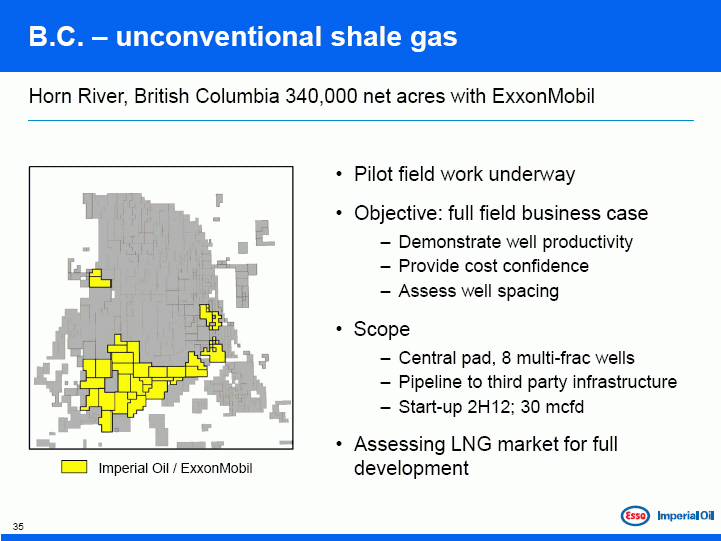
B.C. – unconventional shale gas
Horn River, British Columbia 340,000 net acres with ExxonMobil
[Graphic Appears Here]
• Pilot field work underway
• Objective: full field business case
3 Demonstrate well productivity
3 Provide cost confidence
3 Assess well spacing
• Scope
3 Central pad, 8 multi-frac wells
3 Pipeline to third party infrastructure
3 Start-up 2H12; 30 mcfd
• Assessing LNG market for full development
35
[Graphic Appears Here]
BREAK
36

Technology Leadership
Bruce March
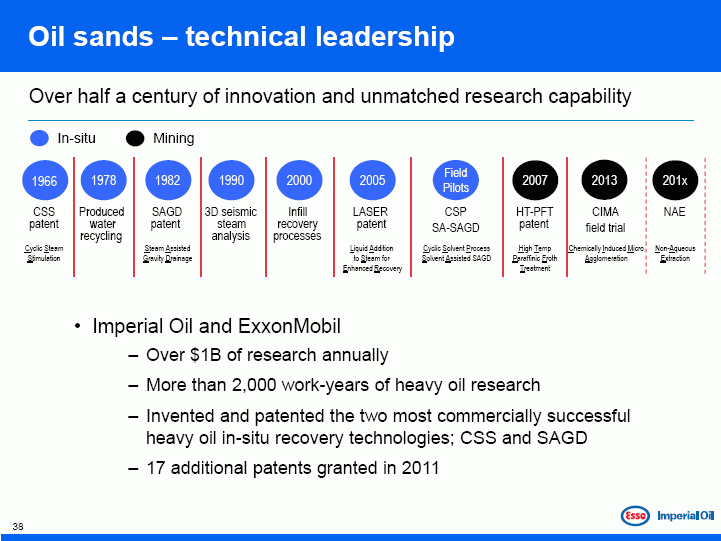
Oil sands – technical leadership
Over half a century of innovation and unmatched research capability
[Graphic Appears Here]
• Imperial Oil and ExxonMobil
– Over $1B of research annually
– More than 2,000 work-years of heavy oil research
– Invented and patented the two most commercially successful heavy oil in-situ recovery technologies; CSS and SAGD
– 17 additional patents granted in 2011
38
Oil | | sands – technical leadership |
50+ | | years of innovation and unmatched research capability |
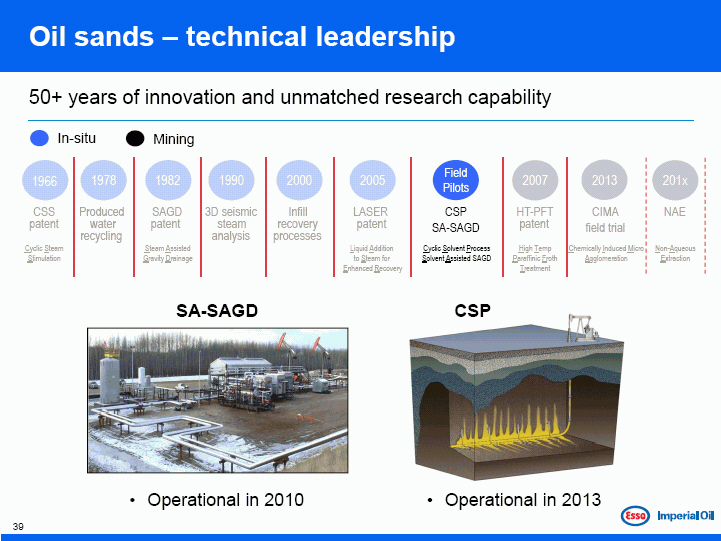
Oil sands – technical leadership
50+ years of innovation and unmatched research capability
[Graphic Appears Here]
40
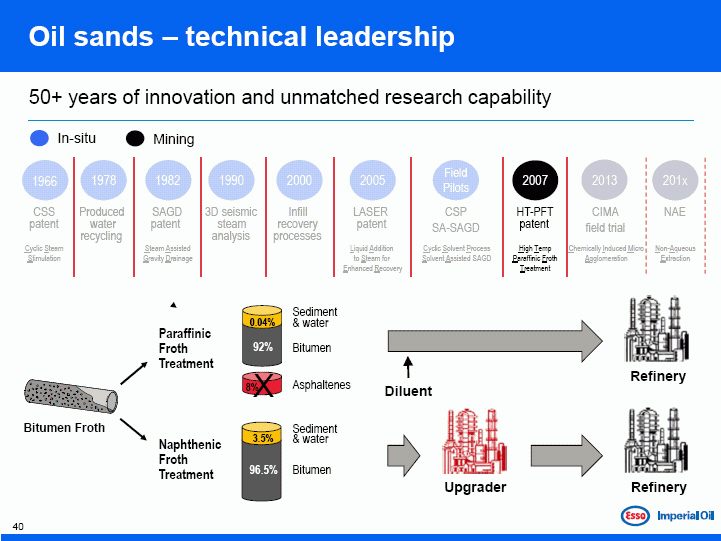
Oil sands – technical leadership
50+ years of innovation and unmatched research capability
[Graphic Appears Here]
41
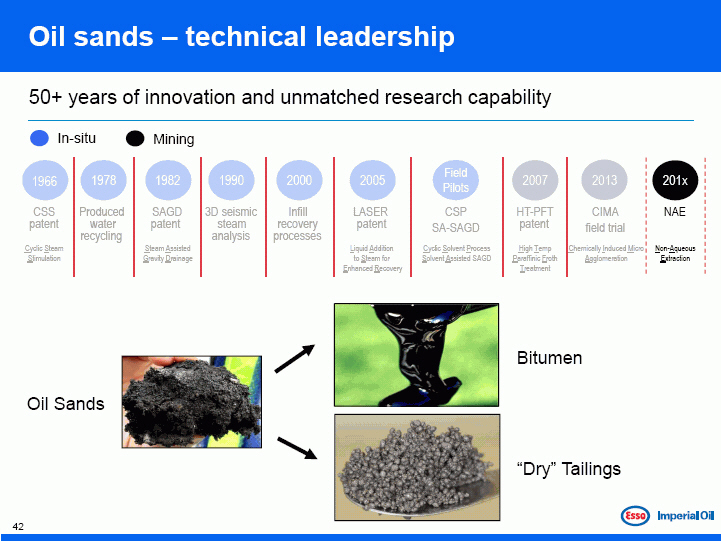
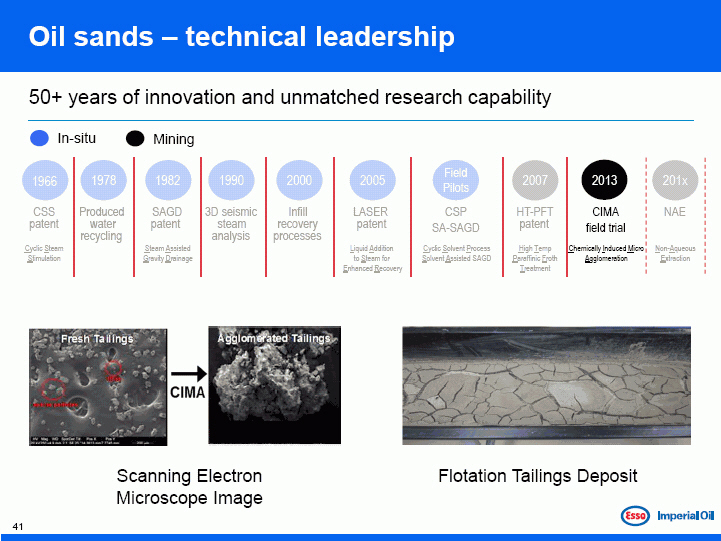
Oil sands – technical leadership
50+ years of innovation and unmatched research capability
[Graphic Appears Here]
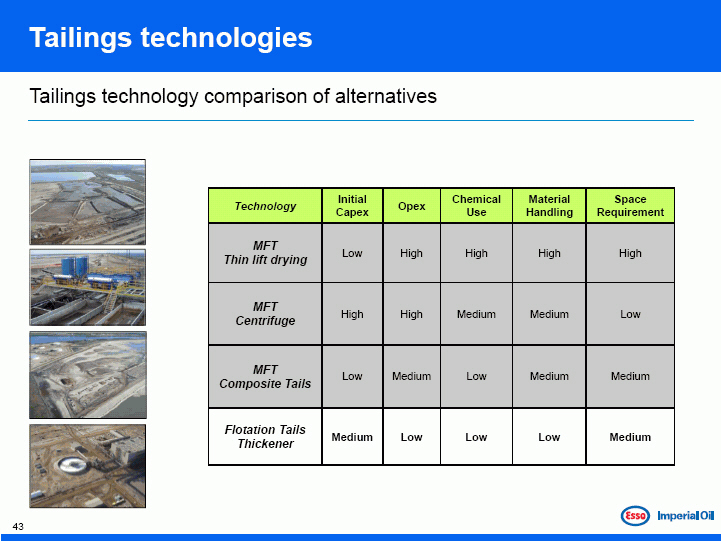
Tailings technologies
Tailings technology comparison of alternatives
[Graphic Appears Here]
43
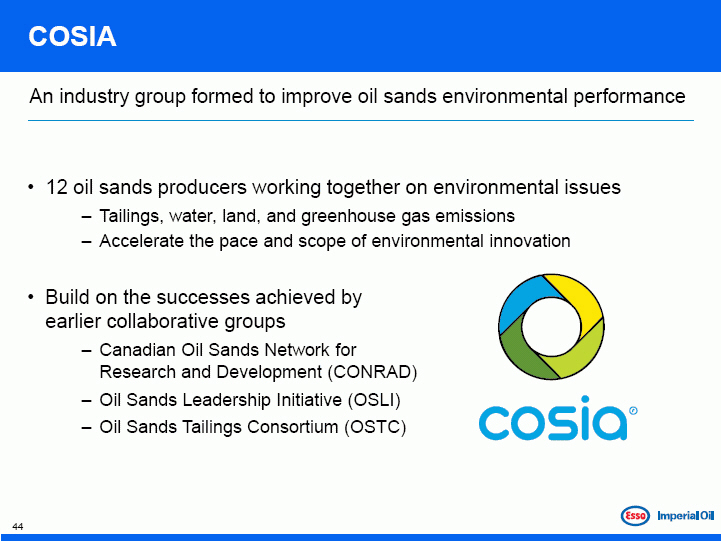
COSIA
An industry group formed to improve oil sands environmental performance
• 12 oil sands producers working together on environmental issues
– Tailings, water, land, and greenhouse gas emissions
– Accelerate the pace and scope of environmental innovation
• Build on the successes achieved by earlier collaborative groups
Canadian Oil Sands Network for
Research and Development (CONRAD)
Oil Sands Leadership Initiative (OSLI)
Oil Sands Tailings Consortium (OSTC)
[Graphic Appears Here]
[Graphic Appears Here]
North American Downstream & Chemicals Businesses
Bruce March
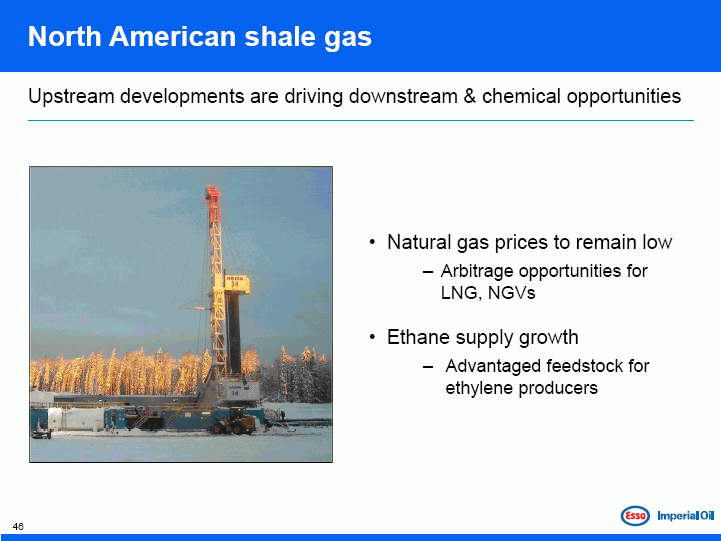
North American shale gas
Upstream developments are driving downstream & chemical opportunities
[Graphic Appears Here]
• Natural gas prices to remain low
– Arbitrage opportunities for LNG, NGVs
• Ethane supply growth
3 Advantaged feedstock for ethylene producers
46

North American tight oil
Upstream developments are driving downstream opportunities
• Growing supply of mid-continent tight oil
– Volatile WTI-Brent differentials
– High utilization of complex refining but not deep resid conversion
– Supports export of gasoline and diesel
• With pipelines, Canadian oil sands meets demand growth for deep conversion capacity in PADD II, III
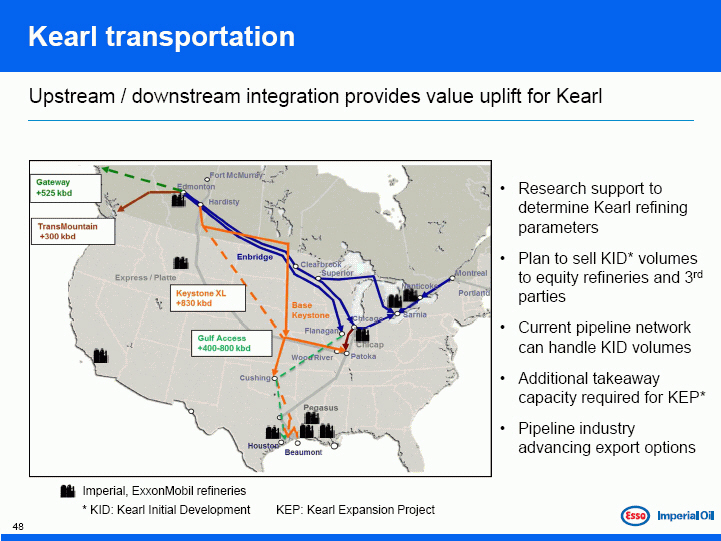
Kearl transportation
Upstream / downstream integration provides value uplift for Kearl
• Research support to determine Kearl refining parameters
• Plan to sell KID* volumes to equity refineries and 3rd parties
• Current pipeline network can handle KID volumes
• Additional takeaway capacity required for KEP*
• Pipeline industry advancing export options
Imperial, ExxonMobil refineries
* KID: Kearl Initial Development KEP: Kearl Expansion Project
Financial Performance & Discipline
Paul Masschelin
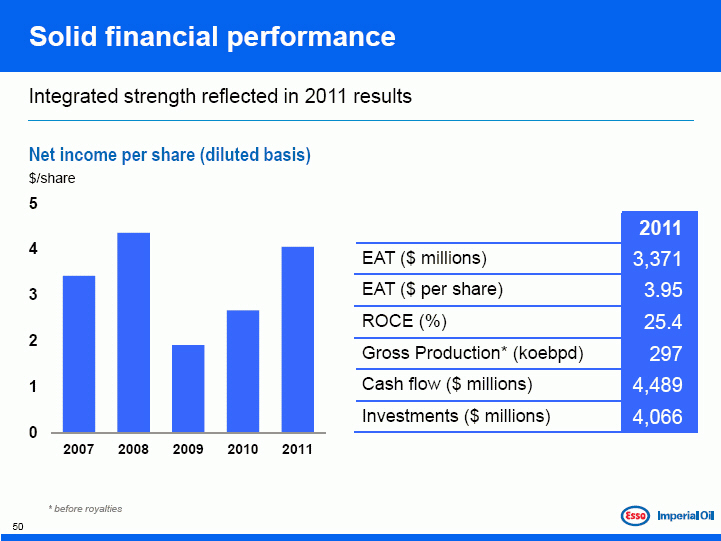
Solid financial performance
Integrated strength reflected in 2011 results
Net income per share (diluted basis)
$/share
2011
EAT ($ millions) 3,371
EAT ($ per share) 3.95
ROCE (%) 25.4
Gross Production* (koebpd) 297
Cash flow ($ millions) 4,489
Investments ($ millions) 4,066
* before royalties
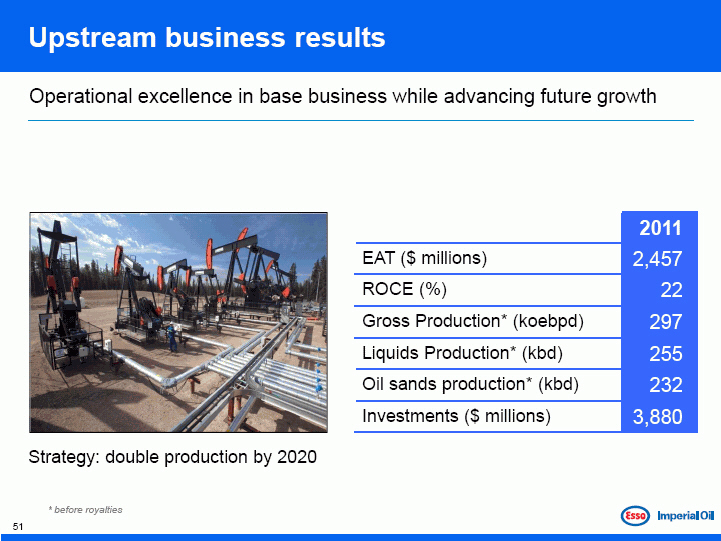
Upstream business results
Operational excellence in base business while advancing future growth
2011
EAT ($ millions) 2,457
ROCE (%) 22
Gross Production* (koebpd) 297
Liquids Production* (kbd) 255
Oil sands production* (kbd) 232
Investments ($ millions) 3,880
Strategy: double production by 2020
* before royalties
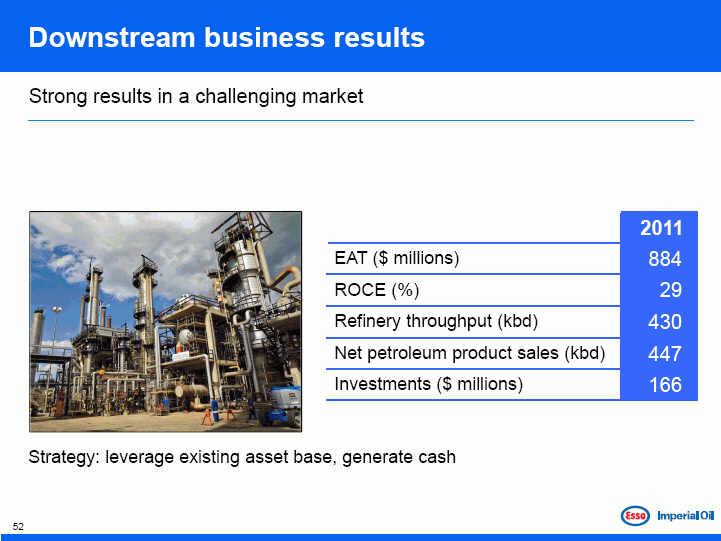
Downstream business results
Strong results in a challenging market
2011
EAT ($ millions) 884
ROCE (%) 29
Refinery throughput (kbd) 430
Net petroleum product sales (kbd) 447
Investments ($ millions) 166
Strategy: leverage existing asset base, generate cash
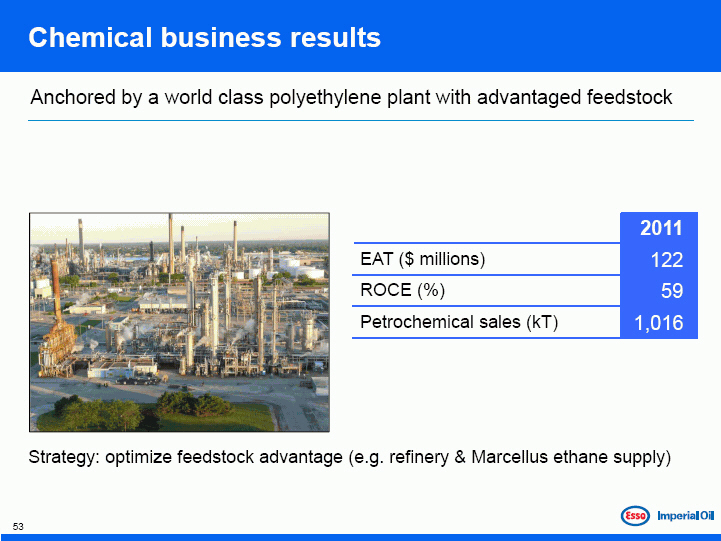
Chemical business results
Anchored by a world class polyethylene plant with advantaged feedstock
2011
EAT ($ millions) 122
ROCE (%) 59
Petrochemical sales (kT) 1,016
Strategy: optimize feedstock advantage (e.g. refinery & Marcellus ethane supply)
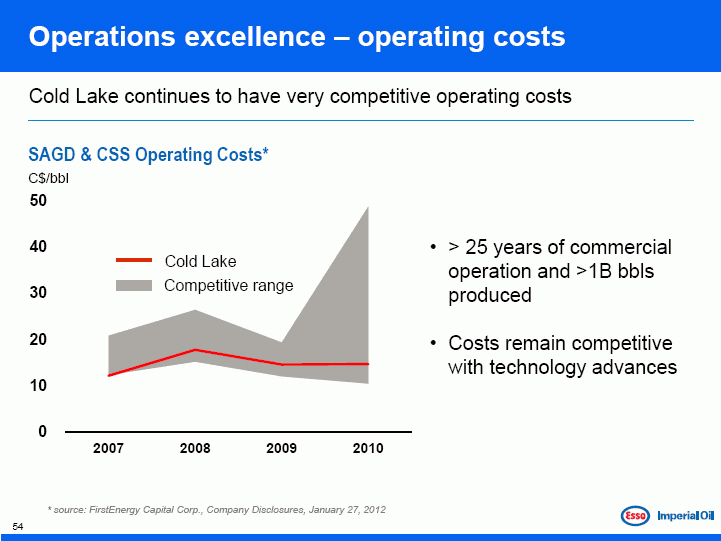
Operations excellence – operating costs
Cold Lake continues to have very competitive operating costs
SAGD & CSS Operating Costs*
C$/bbl
• > 25 years of commercial operation and >1B bbls produced
• Costs remain competitive with technology advances
* source: FirstEnergy Capital Corp., Company Disclosures, January 27, 2012
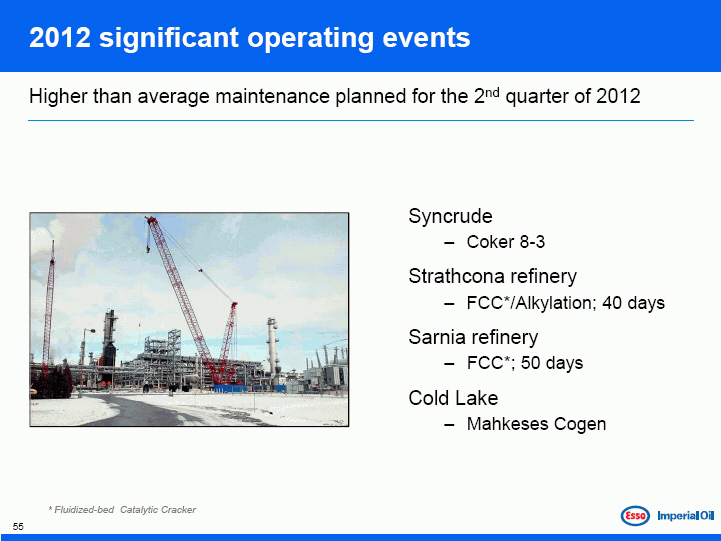
2012 significant operating events
Higher than average maintenance planned for the 2nd quarter of 2012
Syncrude
3 Coker 8-3
Strathcona refinery
3 FCC*/Alkylation; 40 days
Sarnia refinery
3 FCC*; 50 days
Cold Lake
3 Mahkeses Cogen
* Fluidized-bed Catalytic Cracker

Uninterrupted dividends since 1891
Per share dividend payments have increased every year for last 17 years
Annual paid dividends per share*
$/share
$5.7 billion returned to shareholders
• Dividends per share have increased 50% since 2006
* payments during calendar year from 1995-2011 adjusted for 3:1 share splits in 1998 and 2006
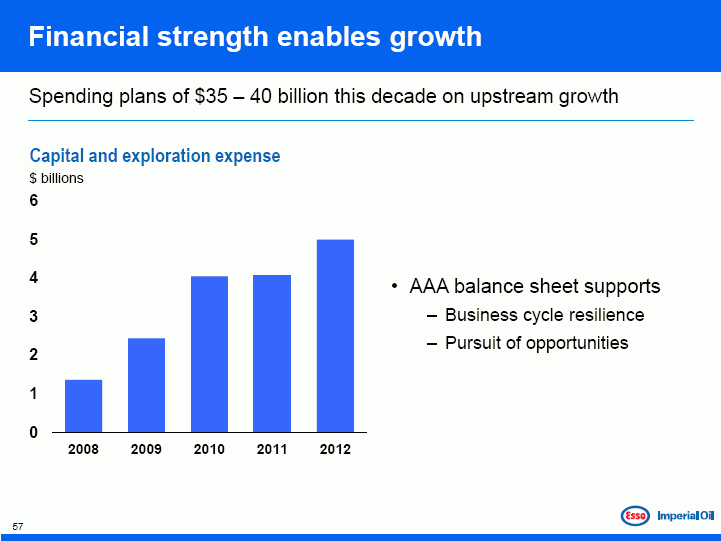
Financial strength enables growth
Spending plans of $35 – 40 billion this decade on upstream growth
Capital and exploration expense
$ billions
• AAA balance sheet supports
– Business cycle resilience
– Pursuit of opportunities
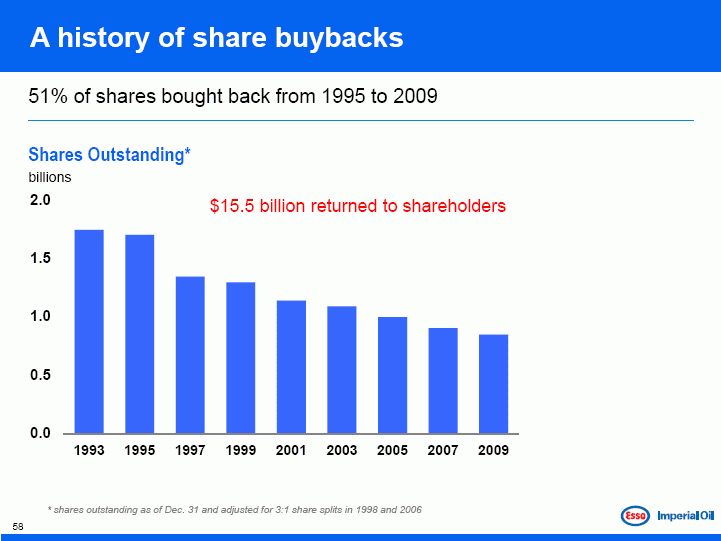
A history of share buybacks
51% of shares bought back from 1995 to 2009
Shares Outstanding*
billions
$15.5 billion returned to shareholders
* shares outstanding as of Dec. 31 and adjusted for 3:1 share splits in 1998 and 2006
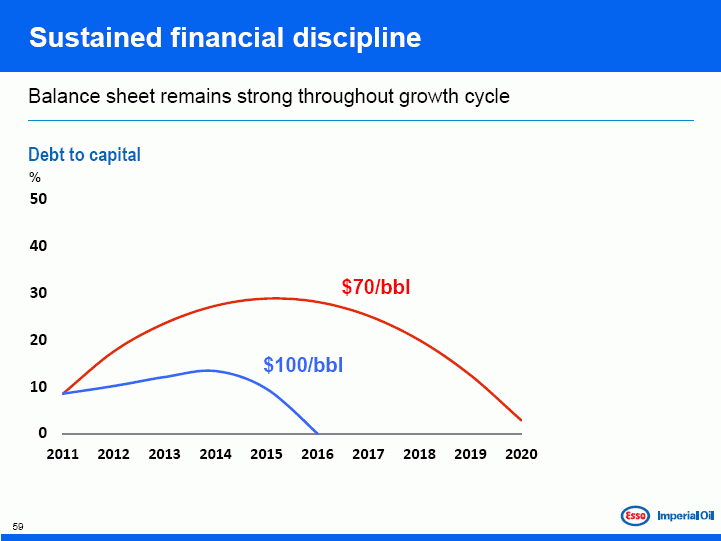
Sustained financial discipline
Balance sheet remains strong throughout growth cycle
Debt to capital
%
The Competitive Advantage
Bruce March
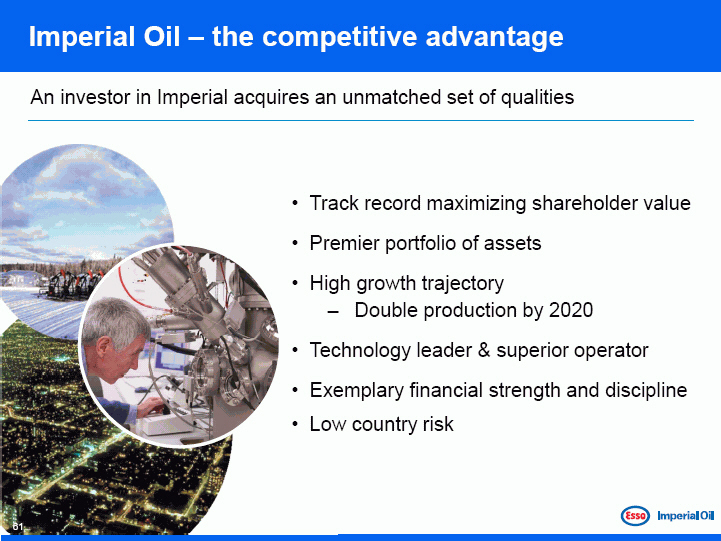
Imperial Oil – the competitive advantage
An investor in Imperial acquires an unmatched set of qualities
• Track record maximizing shareholder value
• Premier portfolio of assets
• High growth trajectory
3 Double production by 2020
• Technology leader & superior operator
• Exemplary financial strength and discipline
• Low country risk
For more information www.imperialoil.ca
For more detailed investor information, or to receive annual and interim reports, please contact:
John A. Charlton
Manager, Investor Relations Imperial Oil Limited 237 Fourth Avenue SW Calgary, Alberta T2P 3M9 Email: john.a.charlton@esso.ca Phone: (403) 237-4537
Imperial Oil
Esso