Exhibit 99.1
Imperial
Investor Day
September 23, 2015
Cautionary statement
Statements of future events or conditions in these materials, including projections, targets, expectations, estimates, and business plans, are forward-looking statements. Such statements are not guarantees of future performance and involve a number of risks and uncertainties. Actual future results, including demand growth and energy source mix; production growth and mix; project plans, dates, costs and capacities; first production dates; costs to develop; production rates, production life, and resource recoveries; cost savings; product sales; financing sources; and capital and environmental expenditures could differ materially depending on a number of factors, such as changes in the price, supply of and demand for crude oil, natural gas, and petroleum and petrochemical products; availability and allocation of capital by Imperial; currency exchange rates; political or regulatory events; project schedules; commercial negotiations; regulatory and third-party approvals; unanticipated operational disruptions; unexpected technological developments; and other factors discussed in these materials and Item 1A of Imperial’s most recent Form 10-K available at www.sedar.com and www.sec.gov. Imperial’s actual results may differ materially from those expressed or implied by its forward-looking statements and readers are cautioned not to place undue reliance on them. Imperial undertakes no obligation to update any forward-looking statements contained herein, except as required by applicable law.
All financial information is presented in Canadian dollars, unless otherwise indicated.
In these materials, certain natural gas volumes have been converted to barrels of oil equivalent (BOE) on the basis of six thousand cubic feet (Mcf) to one barrel (bbl). BOE may be misleading, particularly if used in isolation. A BOE conversion ratio of 6 Mcf to one bbl is based on an energy-equivalency conversion method primarily applicable at the burner tip and does not represent a value equivalency at the wellhead. Given that the value ratio based on the current price of crude oil as compared to natural gas is significantly different than the energy equivalency ratio of 6 Mcf to 1 bbl, using a 6:1 conversion ratio may be misleading as an indication of value.
All reserves and contingent resources estimates provided in these materials are effective as of December 31, 2014, and based on definitions from the Canadian Oil and Gas Evaluation Handbook and are presented in accordance with National Instrument 51-101, as disclosed in Imperial’s Form 51-101F1 for the fiscal year ending December 31, 2014.
Except as otherwise disclosed herein, reserves and contingent resource information are an estimate of the company’s working interest before royalties at year-end 2014, as determined by Imperial’s internal qualified reserves evaluator.
Reserves are the estimated remaining quantities of oil and natural gas and related substances anticipated to be recoverable from known accumulations, from a given date forward, based on: analysis of drilling, geological, geophysical and engineering data, the use of established technology, and specified economic conditions, which are generally accepted as being reasonable. Proved reserves are those reserves which can be estimated with a high degree of certainty to be recoverable. Probable reserves are those additional reserves that are less certain to be recovered than proved reserves.
Contingent resources do not constitute, and should not be confused with, reserves. Contingent resources are those quantities of petroleum considered to be potentially recoverable from known accumulations using established technology or technology under development, but are currently not considered to be commercially recoverable due to one or more contingencies. Contingencies that preclude the classification of Imperial’s contingent resources as reserves include, but are not limited to, the need for further design and the associated uncertainty in development costs and timelines; regulatory approvals; need for internal approvals to proceed with development; lack of market access; and the need for further delineation analysis to improve certainty of resources. Contingent resource volumes represented in these materials are technical best estimate volumes, considered to be a realistic estimate of the quantity that may actually be recovered; it is equally likely that the actual quantities recovered may be greater or less than the technical best estimate. Estimates of contingent resources have not been adjusted for risk based on the chance of development. There is uncertainty that it will be commercially viable to produce any portion of the resource, nor is there certainty as to the timing of any such development. Significant positive and negative factors relevant to the estimate include, but are not limited to, the commodity price environment and regulatory and tax uncertainty.
The estimates of various classes of reserves (proved and probable) and of contingent resources in these materials represent arithmetic sums of multiple estimates of such classes for different properties, which statistical principles indicate may be misleading as to volumes that may actually be recovered. Readers should give attention to the estimates of individual classes of reserves and contingent resources and appreciate the differing probabilities of recovery associated with each class.
The term “project” as used in these materials can refer to a variety of different activities and does not necessarily have the same meaning as in any government payment transparency reports.
Imperial | 2015 | 2
A worldwide view to 2040
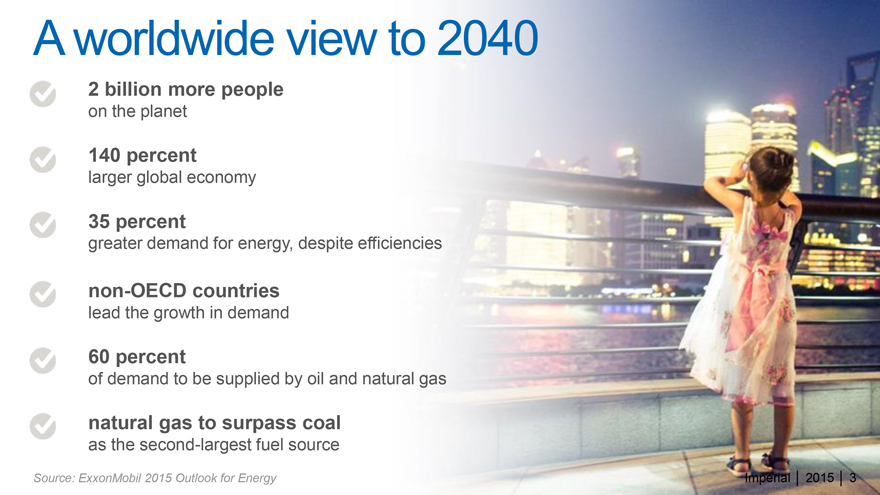
2 billion more people
on the planet
140 percent
larger global economy
35 percent
greater demand for energy, despite efficiencies
non-OECD countries
lead the growth in demand
60 percent
of demand to be supplied by oil and natural gas
natural gas to surpass coal
as the second-largest fuel source
Source: ExxonMobil 2015 Outlook for Energy
Imperial | 2015 | 3
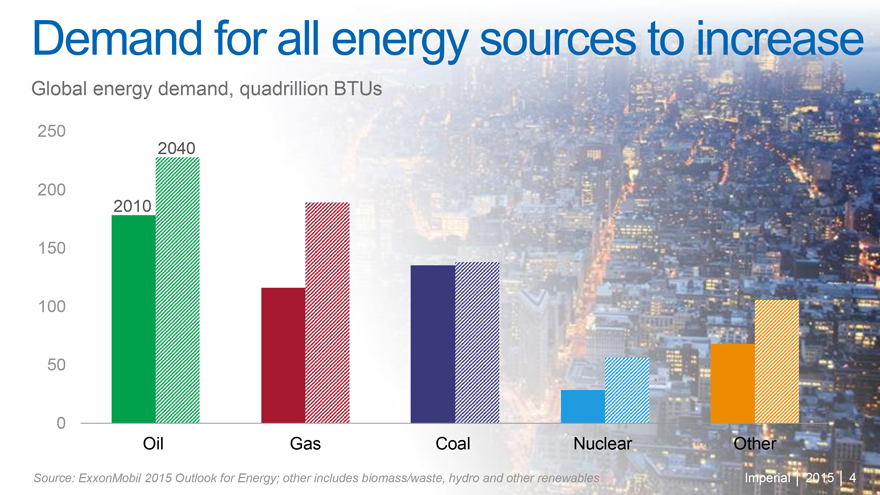
Demand for all energy sources to increase
Global energy demand, quadrillion BTUs
250
2040
200
2010
150
100
50
0
Oil Gas Coal Nuclear Other
Source: ExxonMobil 2015 Outlook for Energy; other includes biomass/waste, hydro and other renewables
Imperial | 2015 | 4
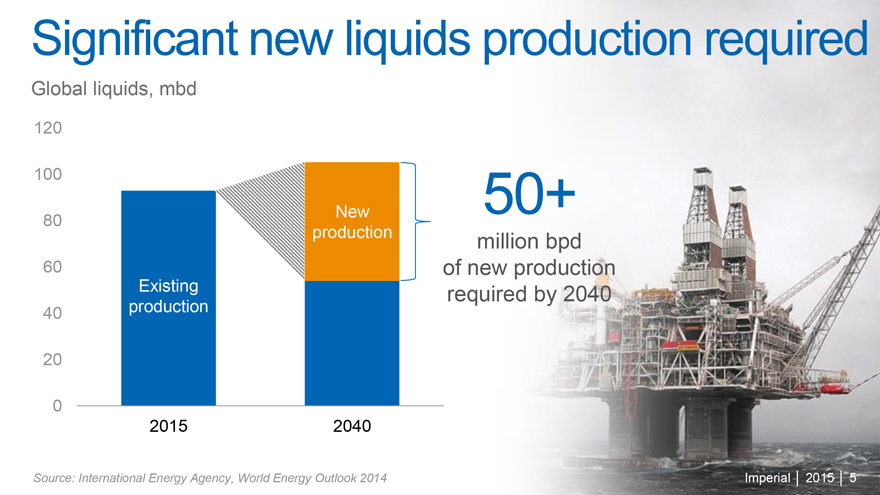
Significant new liquids production required
Global liquids, mbd
120
100
80 New production
60
40 Existing production
20
0
2015 2040
50+
million bpd
of new production
required by 2040
Source: International Energy Agency, World Energy Outlook 2014
Imperial | 2015 | 5
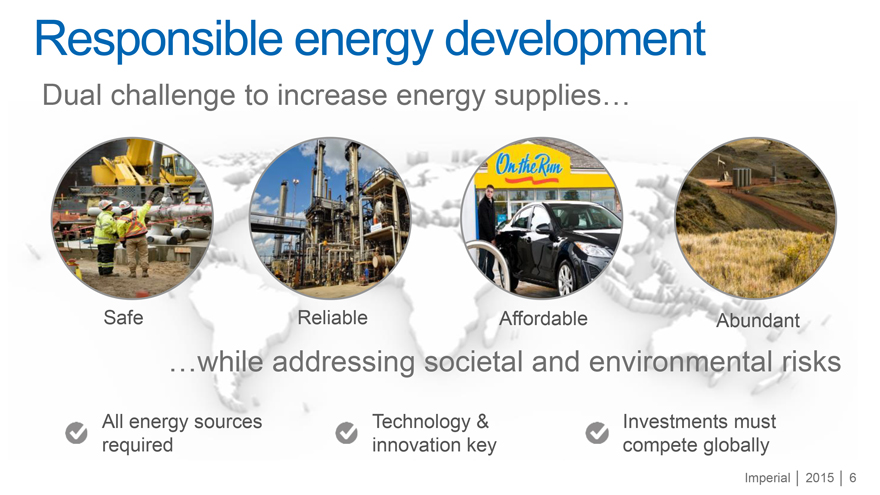
Responsible energy development
Dual challenge to increase energy supplies…
Safe Reliable Affordable Abundant
…while addressing societal and environmental risks
All energy sources required Technology & innovation key Investments must compete globally
Imperial | 2015 | 6
Canadian business environment
Large, accessible upstream resources
Mature, competitive downstream markets
Relative political stability, competitive fiscal regime
Evolving regulatory, environmental framework
Market access limitations, uncertainties
Regional cost pressures, alleviating with downturn
Imperial | 2015 | 7
Imperial’s business model
Deliver superior, long-term shareholder value
Long-life, competitively advantaged assets
Disciplined investment and cost management
Value-chain integration and synergies
High-impact technologies and innovation
Operational excellence and responsible growth
ExxonMobil relationship
Imperial | 2015 | 8
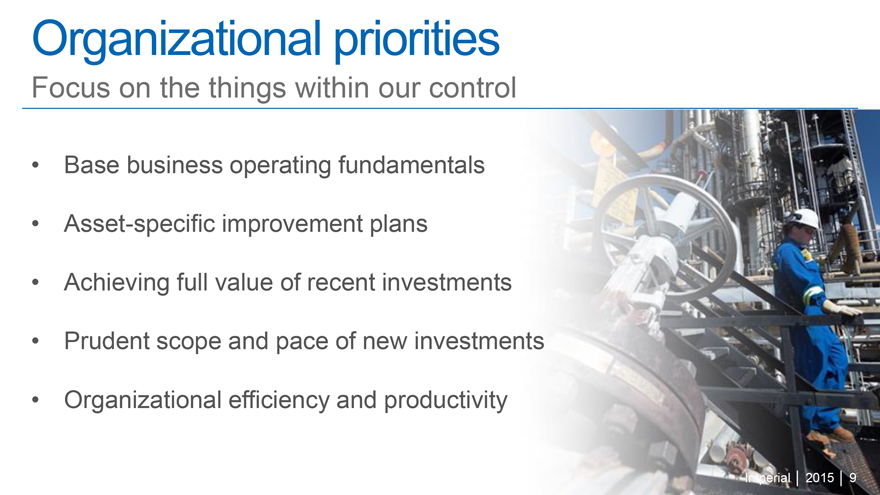
Organizational priorities
Focus on the things within our control
Base business operating fundamentals
Asset-specific improvement plans
Achieving full value of recent investments
Prudent scope and pace of new investments
Organizational efficiency and productivity
Imperial | 2015 | 9
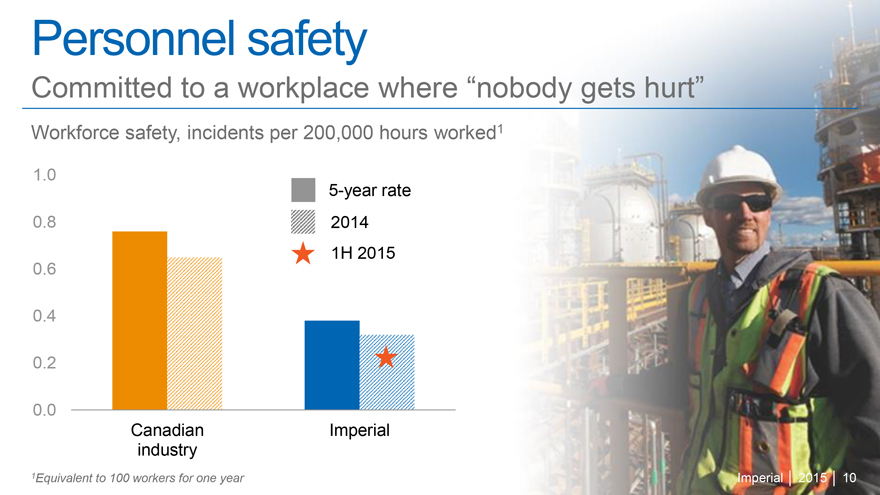
Personnel safety
Committed to a workplace where “nobody gets hurt”
Workforce safety, incidents per 200,000 hours worked1
1.0
0.8
0.6
0.4
0.2
0.0
Canadian industry Imperial
5-year rate
2014
1H 2015
1Equivalent to 100 workers for one year
Imperial | 2015 | 10
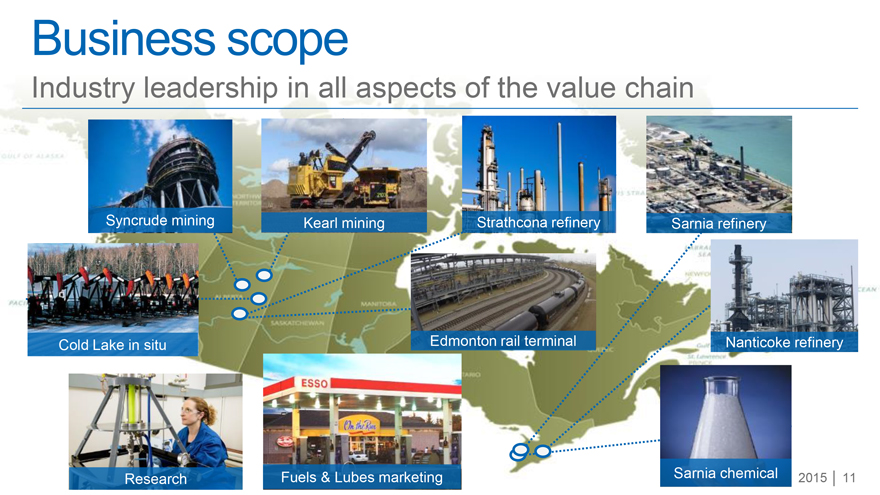
Business scope
Industry leadership in all aspects of the value chain
Syncrude mining Kearl mining Strathcona refinery Sarnia refinery
Cold Lake in situ Edmonton rail terminal Nanticoke refinery
Research Fuels & Lubes marketing Sarnia chemical
2015 | 11
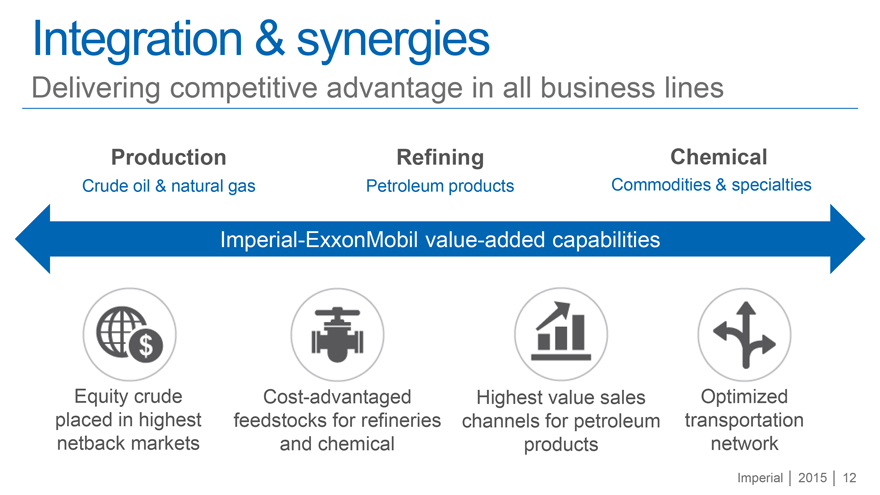
Integration & synergies
Delivering competitive advantage in all business lines
Production Refining Chemical
Crude oil & natural gas Petroleum products Commodities & specialties
Imperial-ExxonMobil value-added capabilities
Equity crude placed in highest netback markets Cost-advantaged feedstocks for refineries and chemical Highest value sales channels for petroleum products Optimized transportation network
Imperial | 2015 | 12
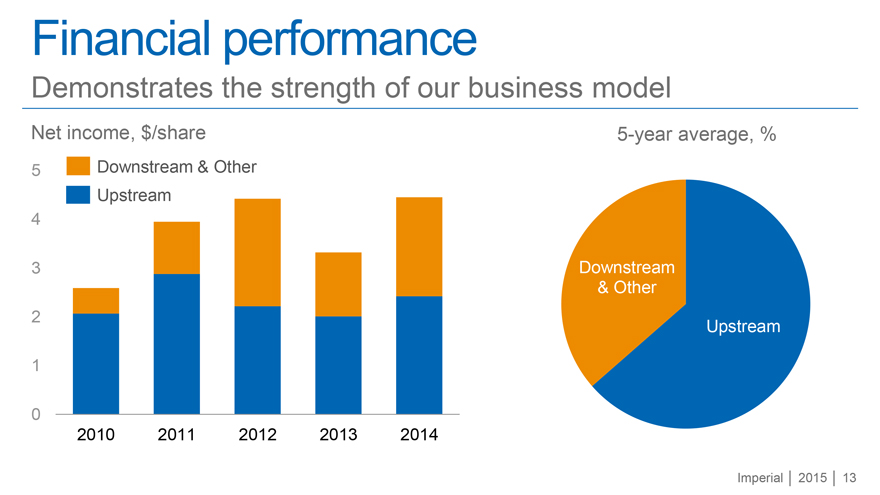
Financial performance
Demonstrates the strength of our business model
Net income, $/share
5 Downstream & Upstream Other
4
3
2
1
0
2010 2011 2012 2013 2014
5-year average, %
Downstream
& Other
Upstream
Imperial | 2015 | 13
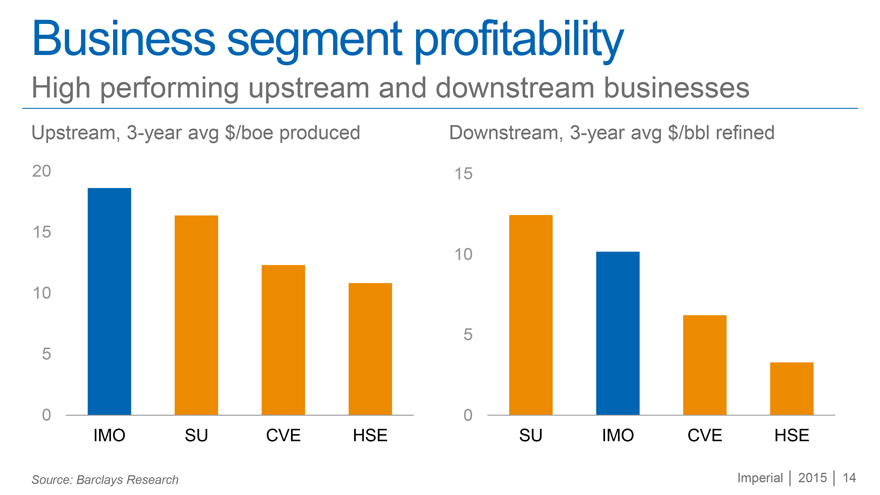
Business segment profitability
High performing upstream and downstream businesses
Upstream, 3-year avg $/boe produced
20
15
10
5
0
IMO SU CVE HSE
Downstream, 3-year avg $/bbl refined
15
10
5
0
SU IMO CVE HSE
Source: Barclays Research
Imperial | 2015 | 14
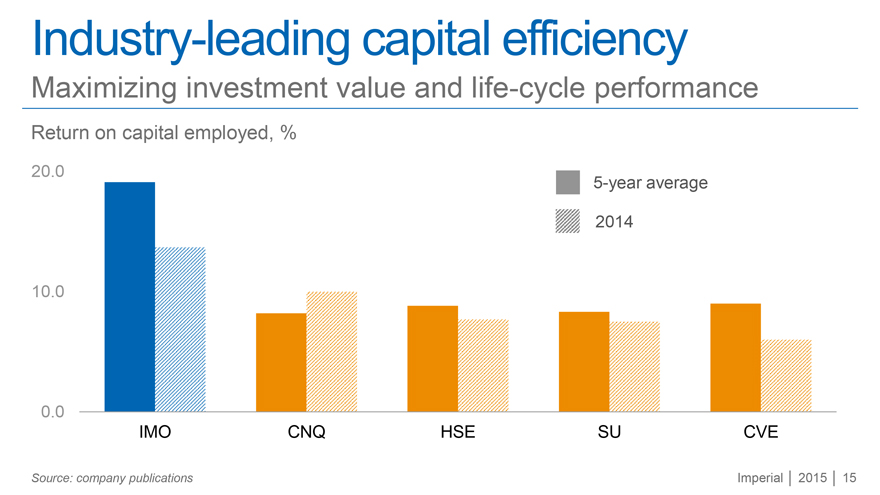
Industry-leading capital efficiency
Maximizing investment value and life-cycle performance
Return on capital employed, %
20.0
10.0
0.0
IMO CNQ HSE SU CVE
5-year average
2014
Source: company publications
Imperial | 2015 | 15
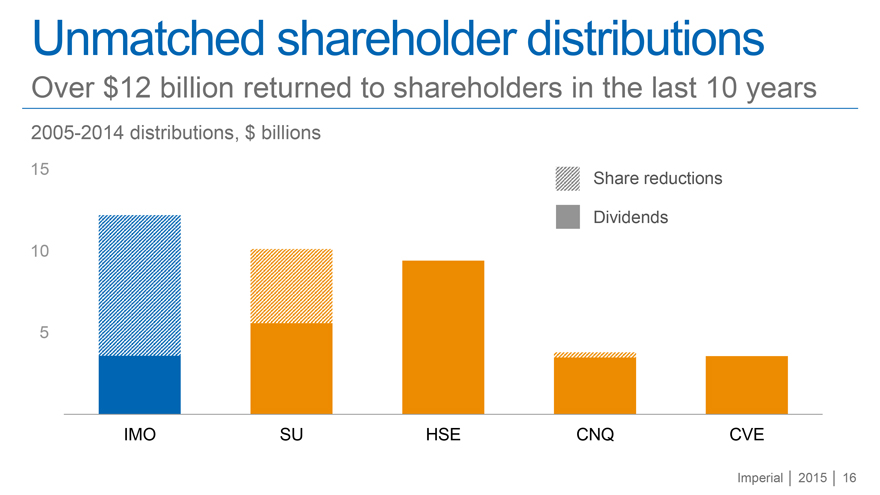
Unmatched shareholder distributions
Over $12 billion returned to shareholders in the last 10 years
2005-2014 distributions, $ billions
| 15 |
| 10 |
| 5 |
IMO SU HSE CNQ CVE
Share reductions
Dividends
Imperial | 2015 | 16
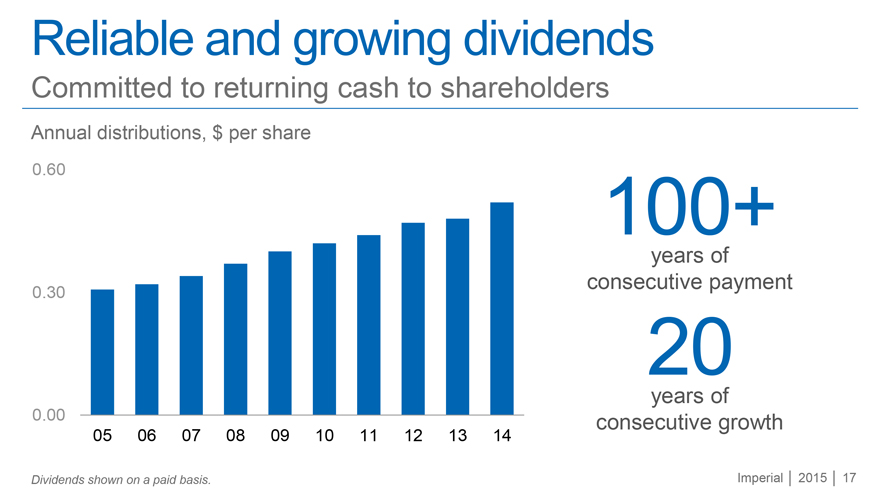
Reliable and growing dividends
Committed to returning cash to shareholders
Annual distributions, $ per share
0.60
0.30
0.00
05 06 07 08 09 10 11 12 13 14
100+
years of
consecutive payment
20
years of
consecutive growth
Dividends shown on a paid basis.
Imperial | 2015 | 17
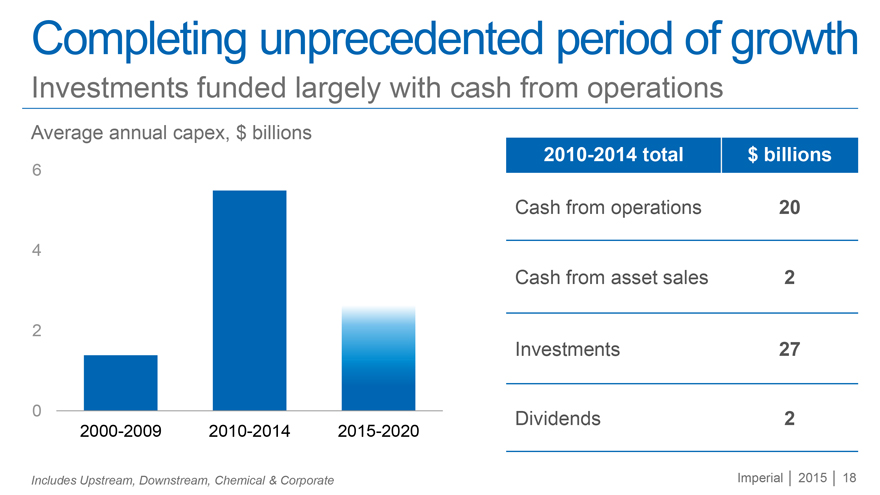
Completing unprecedented period of growth
Investments funded largely with cash from operations
Average annual capex, $ billions
6
4
2
0
2000-2009 2010-2014 2015-2020
2010-2014 total $ billions
Cash from operations 20
Cash from asset sales 2
Investments 27
Dividends 2
Includes Upstream, Downstream, Chemical & Corporate
Imperial | 2015 | 18
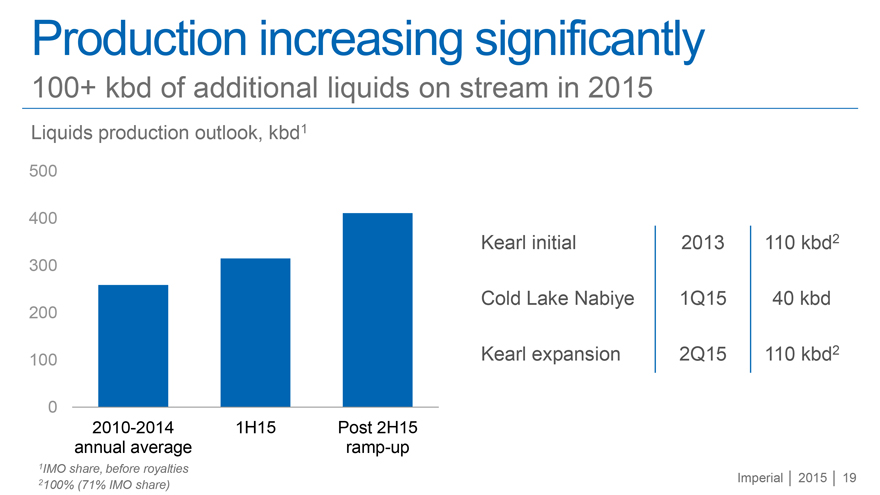
Production increasing significantly
100+ kbd of additional liquids on stream in 2015
Liquids production outlook, kbd1
500
400
300
200
100
0
2010-2014 annual average 1H15 Post 2H15 ramp-up
Kearl initial 2013 110 kbd2
Cold Lake Nabiye 1Q15 40 kbd
Kearl expansion 2Q15 110 kbd2
1IMO share, before royalties
2100% (71% IMO share)
Imperial | 2015 | 19
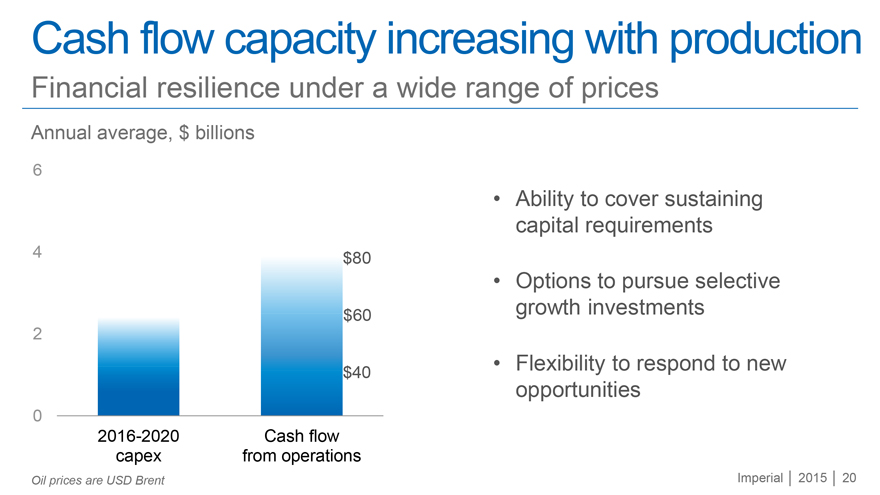
Cash flow capacity increasing with production
Financial resilience under a wide range of prices
Annual average, $ billions
6
4 $80
$60
2
$40
0
2016-2020 capex Cash flow from operations
Ability to cover sustaining capital requirements
Options to pursue selective growth investments
Flexibility to respond to new opportunities
Oil prices are USD Brent
Imperial | 2015 | 20
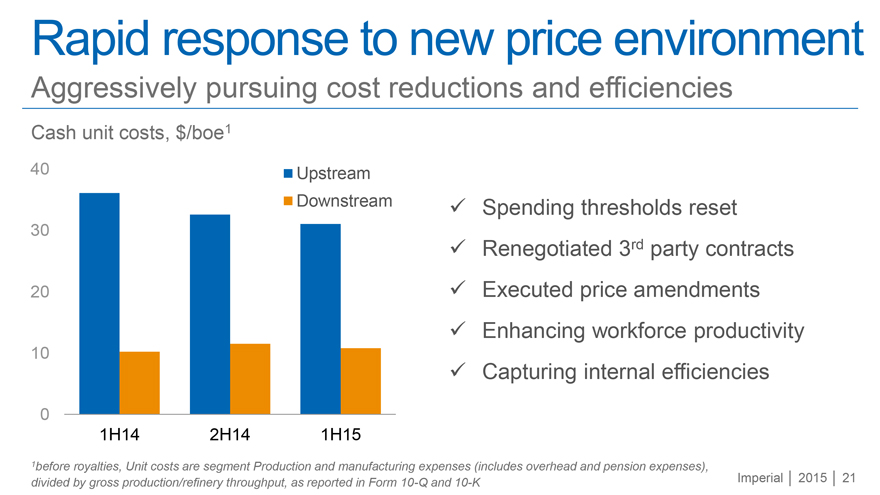
Rapid response to new price environment
Aggressively pursuing cost reductions and efficiencies
Cash unit costs, $/boe1
40 Upstream
Downstream
30
20
10
0
1H14 2H14 1H15
Spending thresholds reset
Renegotiated 3rd party contracts
Executed price amendments
Enhancing workforce productivity
Capturing internal efficiencies
1before royalties, Unit costs are segment Production and manufacturing expenses (includes overhead and pension expenses), divided by gross production/refinery throughput, as reported in Form 10-Q and 10-K
Imperial | 2015 | 21
Clarify. Simplify. Focus.
Watch the video on Imperial’s YouTube channel
Imperial | 2015 | 22
YouTube
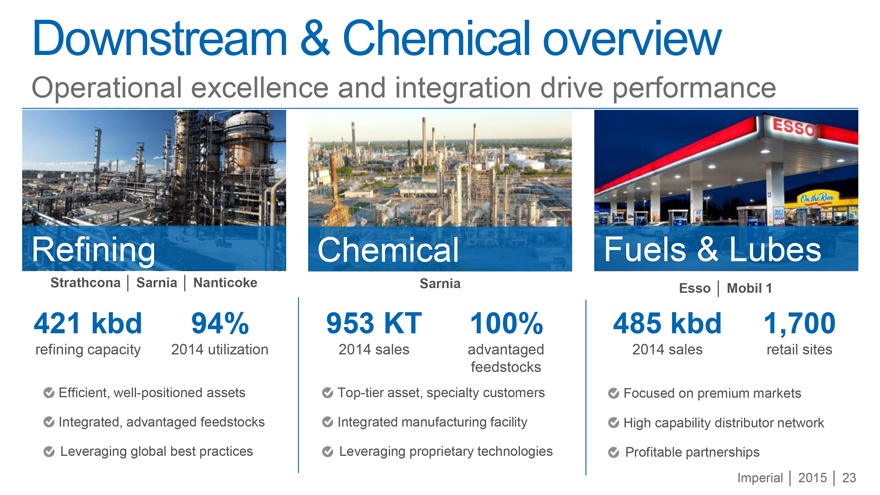
Downstream & Chemical overview
Operational excellence and integration drive performance
Refining
Strathcona | Sarnia | Nanticoke
421 kbd 94%
refining capacity 2014 utilization
Efficient, well-positioned assets Integrated, advantaged feedstocks Leveraging global best practices
Chemical
Sarnia
953 KT 100%
2014 sales advantaged feedstocks
Top-tier asset, specialty customers Integrated manufacturing facility Leveraging proprietary technologies
Fuels & Lubes
Esso | Mobil 1
485 kbd 1,700
2014 sales retail sites
Focused on premium markets High capability distributor network Profitable partnerships
Imperial | 2015 | 23
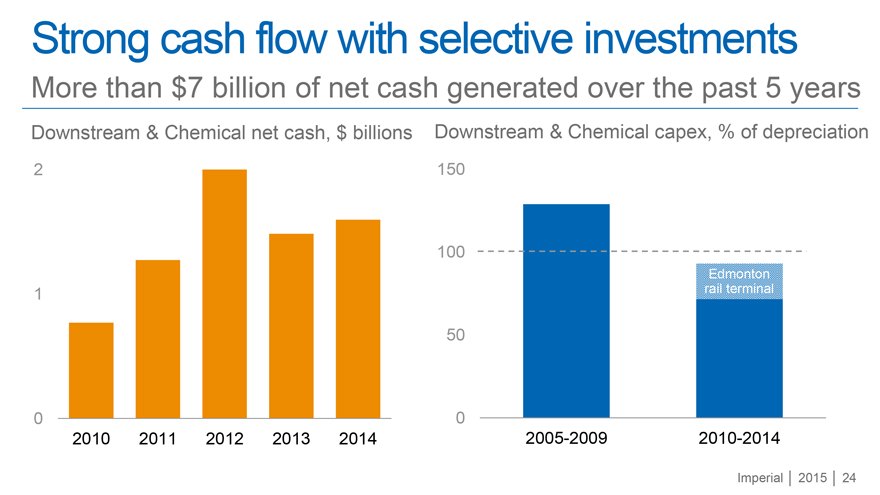
Strong cash flow with selective investments
More than $7 billion of net cash generated over the past 5 years
Downstream & Chemical net cash, $ billions Downstream & Chemical capex, % of depreciation
2
1
0
2010 2011 2012 2013 2014
150
100
Edmonton rail terminal
50
0
2005-2009 2010-2014
Imperial | 2015 | 24
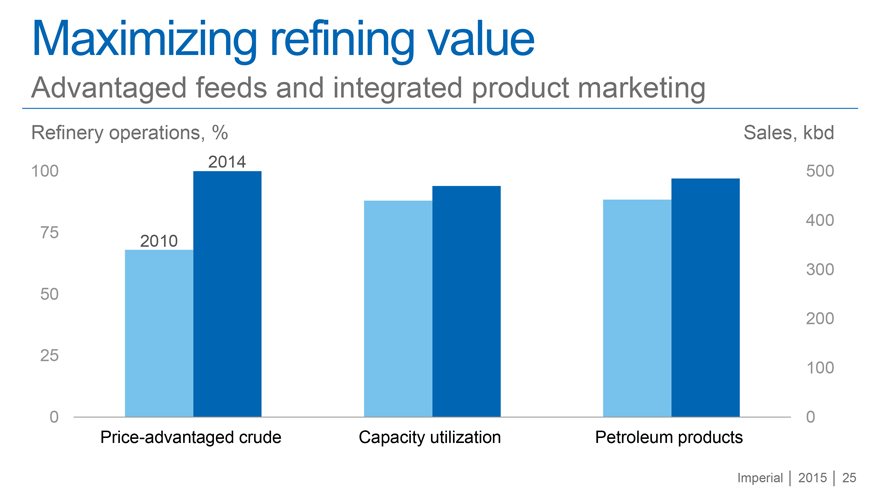
Maximizing refining value
Advantaged feeds and integrated product marketing
Refinery operations, % Sales, kbd
2014
100 500
400 75 2010 300 50 200
25
100
0 0
Price-advantaged crude Capacity utilization Petroleum products
Imperial | 2015 | 25
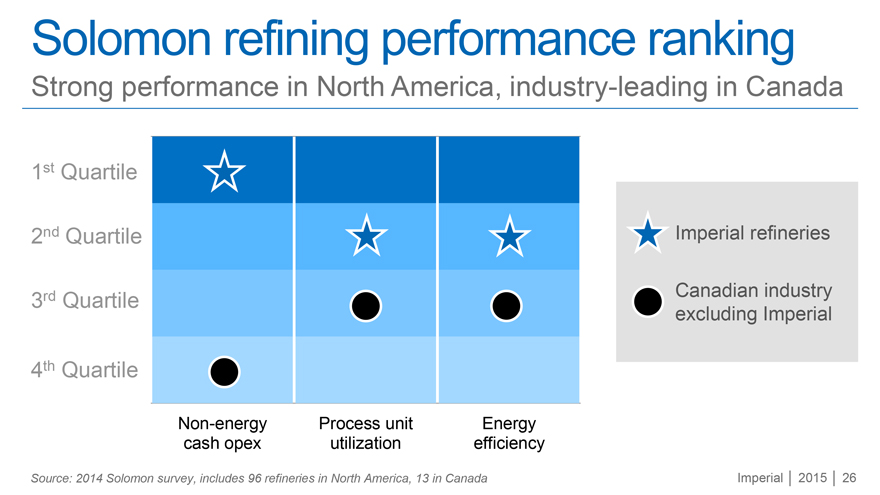
Solomon refining performance ranking
Strong performance in North America, industry-leading in Canada
1st Quartile
2nd Quartile
3rd Quartile
4th Quartile
Non-energy Process unit Energy
cash opex utilization efficiency
Imperial refineries
Canadian industry excluding Imperial
Source: 2014 Solomon survey, includes 96 refineries in North America, 13 in Canada
Imperial | 2015 | 26
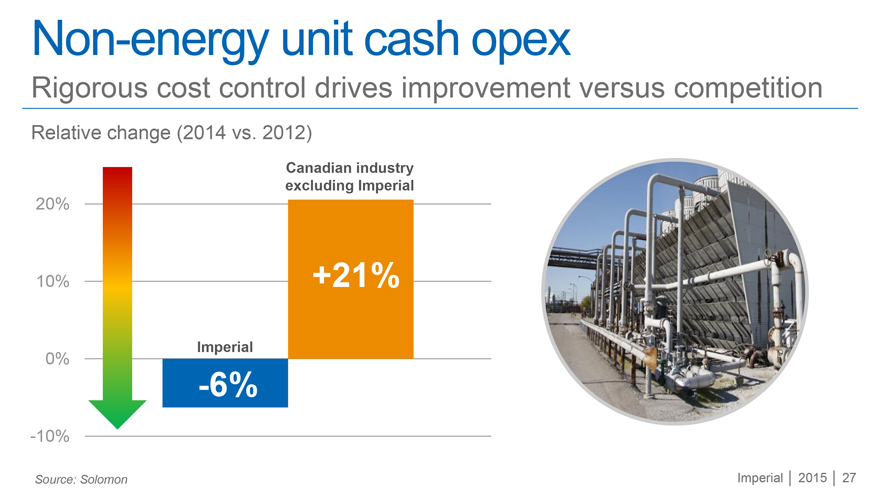
Non-energy unit cash opex
Rigorous cost control drives improvement versus competition
Relative change (2014 vs. 2012)
Canadian industry excluding Imperial
20%
10% +21%
Imperial
0%
-6%
-10%
Source: Solomon Imperial | 2015 | 27
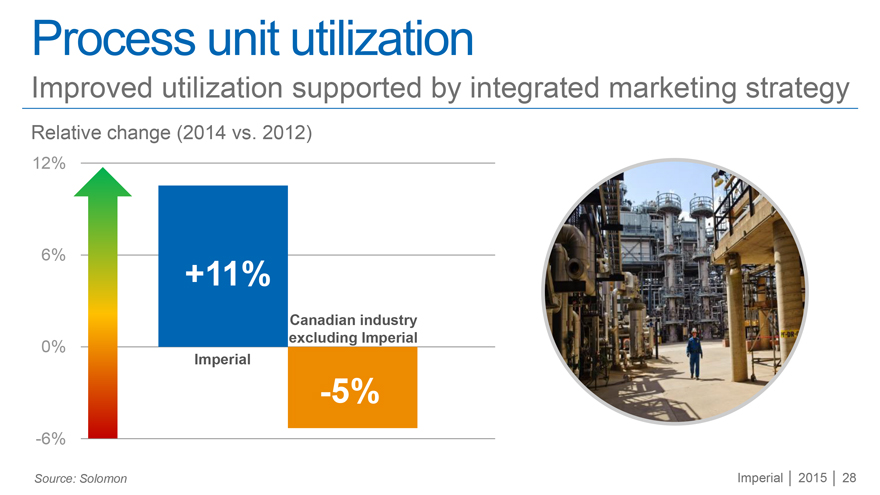
Process unit utilization
Improved utilization supported by integrated marketing strategy
Relative change (2014 vs. 2012)
12%
6%
+11%
Canadian industry excluding Imperial
0%
Imperial
-5%
-6%
Source: Solomon
Imperial | 2015 | 28
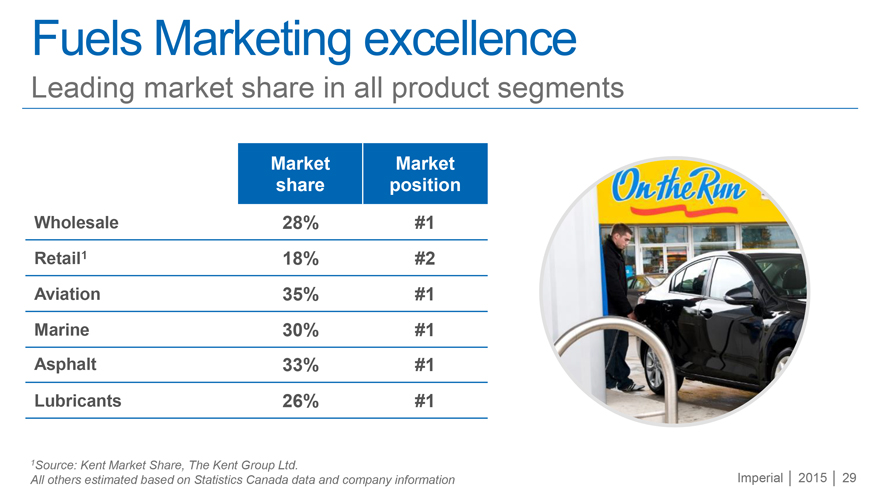
Fuels Marketing excellence
Leading market share in all product segments
Market Market
share position
Wholesale 28% #1
Retail1 18% #2
Aviation 35% #1
Marine 30% #1
Asphalt 33% #1
Lubricants 26% #1
1Source: Kent Market Share, The Kent Group Ltd.
All others estimated based on Statistics Canada data and company information
Imperial | 2015 | 29 On the Run
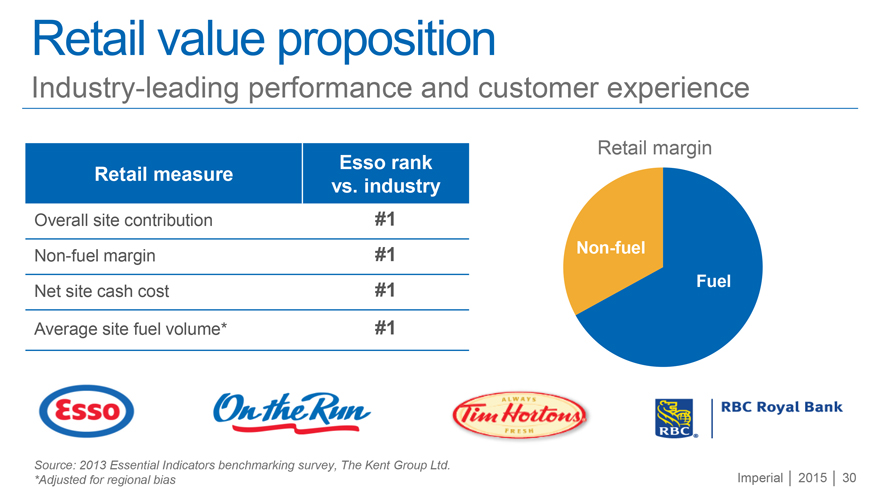
Retail value proposition
Industry-leading performance and customer experience
Esso rank
Retail measure vs. industry
Overall site contribution #1
Non-fuel margin #1
Net site cash cost #1
Average site fuel volume* #1
Retail margin
Non-fuel
Fuel
Esso On the Run ALWAYS Tim Hortons FRESH RBC® RBC Royal Bank
Source: 2013 Essential Indicators benchmarking survey, The Kent Group Ltd. *Adjusted for regional bias
Imperial | 2015 | 30
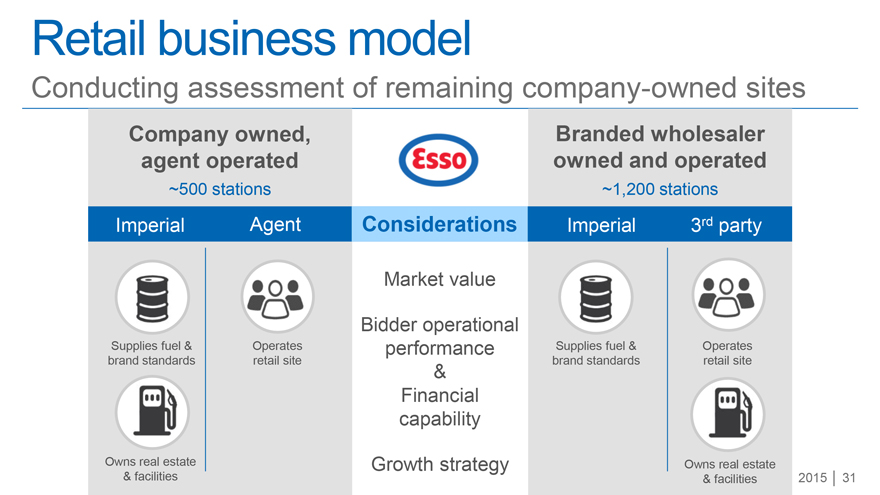
Retail business model
Conducting assessment of remaining company-owned sites
| Company owned, | ||
| agent operated | ||
| ~500 stations | ||
| Imperial | Agent | |
| Supplies fuel & | Operates | |
| brand standards | retail site | |
| Owns real estate | ||
| & facilities | ||
Considerations
Market value
Bidder operational performance & Financial capability
Growth strategy
| Branded wholesaler | ||
| owned and operated | ||
| ~1,200 stations | ||
| Imperial | 3rd party | |
| Supplies fuel & | Operates | |
| brand standards | retail site | |
| Owns real estate | ||
| & facilities | ||
2015 | 31
Downstream integration & operational excellence
Watch the video on Imperial’s YouTube channel
Imperial | 2015 | 32 YouTube
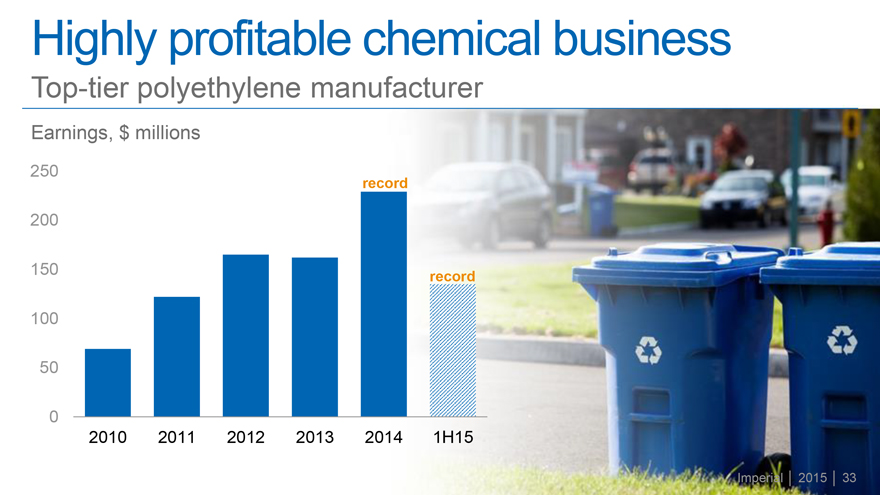
Highly profitable chemical business
Top-tier polyethylene manufacturer
Earnings, $ millions
250
record
200
150 record
100
50
0
2010 2011 2012 2013 2014 1H15
Imperial | 2015 | 33
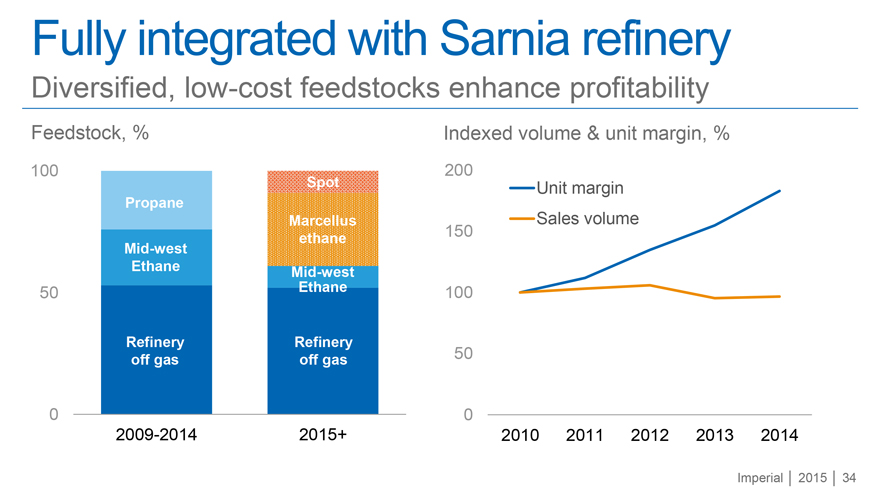
Fully integrated with Sarnia refinery
Diversified, low-cost feedstocks enhance profitability
| Feedstock, % 100 Spot Propane Marcellus ethane Mid-west Ethane Mid-west 50 Ethane Refinery Refinery off gas off gas 0 2009-2014 2015+ |
| Indexed volume & unit margin, % |
| 200 |
| Unit margin |
| Sales volume |
| 150 |
| 100 |
| 50 |
| 0 |
| 2010 2011 2012 2013 2014 |
Imperial | 2015 | 34
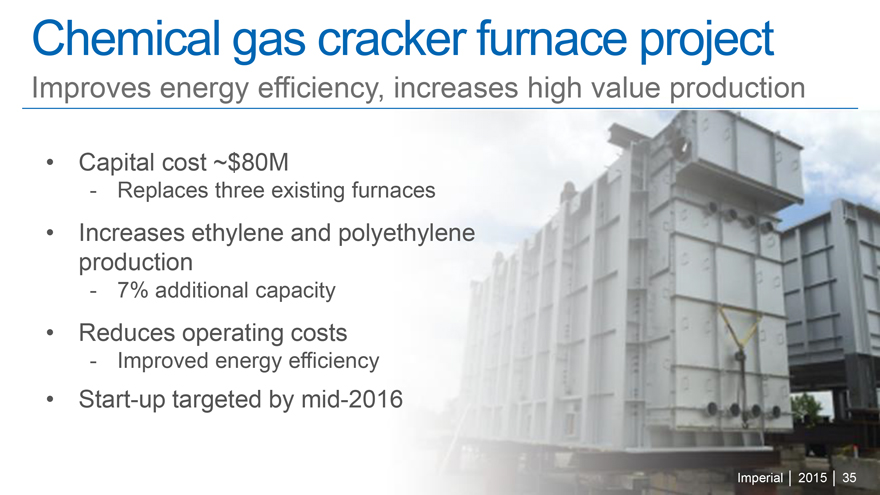
Chemical gas cracker furnace project
Improves energy efficiency, increases high value production
Capital cost ~$80M
- Replaces three existing furnaces
Increases ethylene and polyethylene production
- 7% additional capacity
Reduces operating costs
- Improved energy efficiency
Start-up targeted by mid-2016
Imperial | 2015 | 35
Break
Imperial
Imperial | 2015 | 36
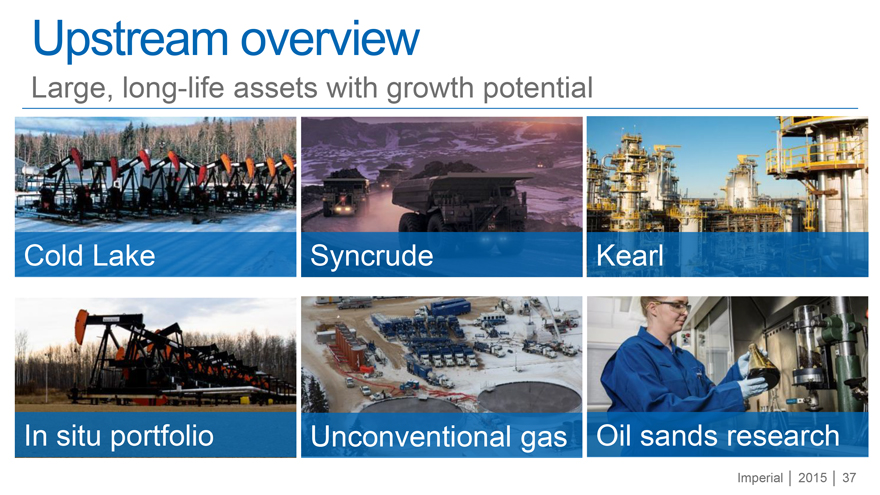
Upstream overview
Large, long-life assets with growth potential
Cold Lake Syncrude Kearl
In situ portfolio Unconventional gas Oil sands research
Imperial | 2015 | 37
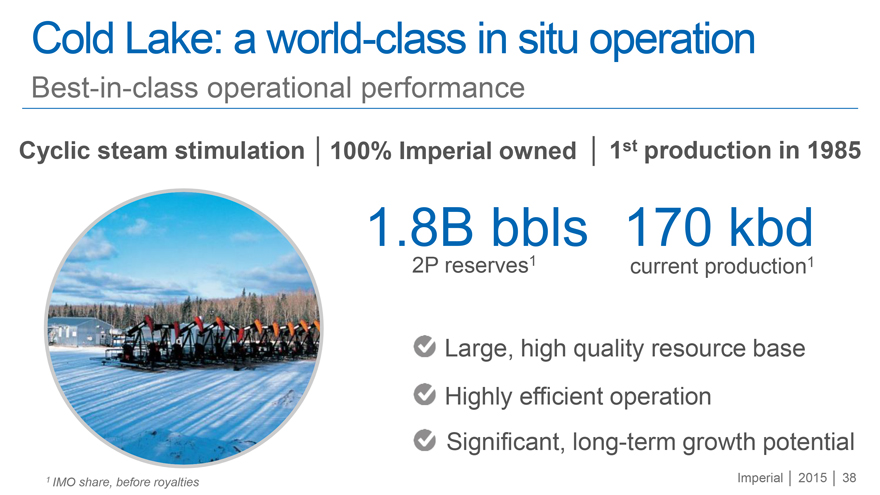
Cold Lake: a world-class in situ operation
Best-in-class operational performance
Cyclic steam stimulation | 100% Imperial owned | 1st production in 1985
1.8B bbls 170 kbd
2P reserves1 current production1
Large, high quality resource base Highly efficient operation Significant, long-term growth potential
1 IMO share, before royalties
Imperial | 2015 | 38
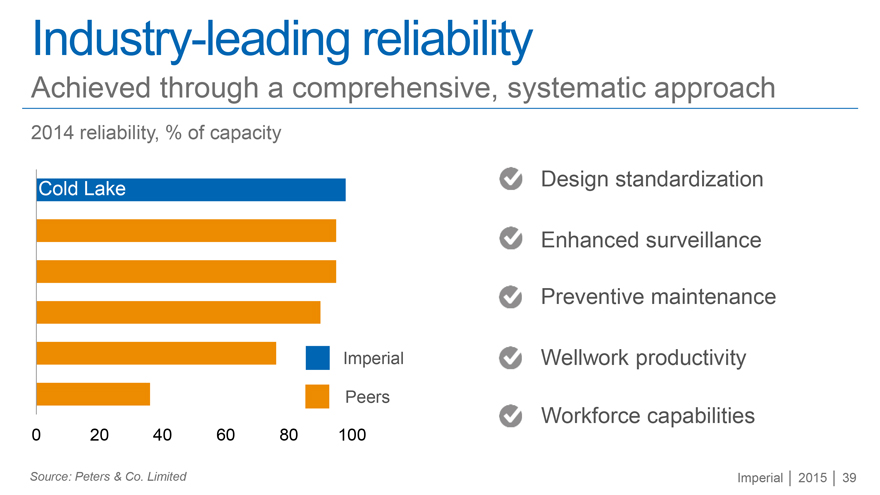
Industry-leading reliability
Achieved through a comprehensive, systematic approach
2014 reliability, % of capacity
Cold Lake
Imperial
Peers
0 20 40 60 80 100
Design standardization
Enhanced surveillance
Preventive maintenance
Wellwork productivity
Workforce capabilities
Source: Peters & Co. Limited Imperial | 2015 | 39
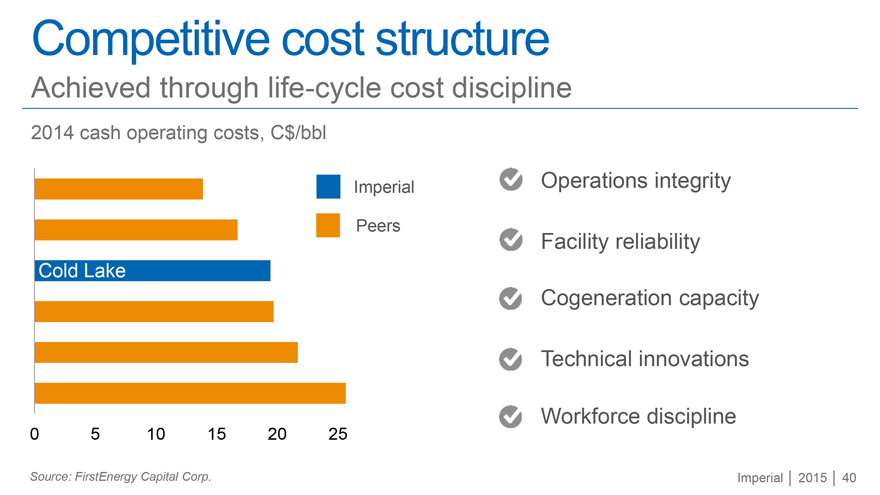
Competitive cost structure
Achieved through life-cycle cost discipline
2014 cash operating costs, C$/bbl
Imperial
Peers
Cold Lake
0 5 10 15 20 25
Operations integrity
Facility reliability
Cogeneration capacity
Technical innovations
Workforce discipline
Source: FirstEnergy Capital Corp.
Imperial | 2015 | 40
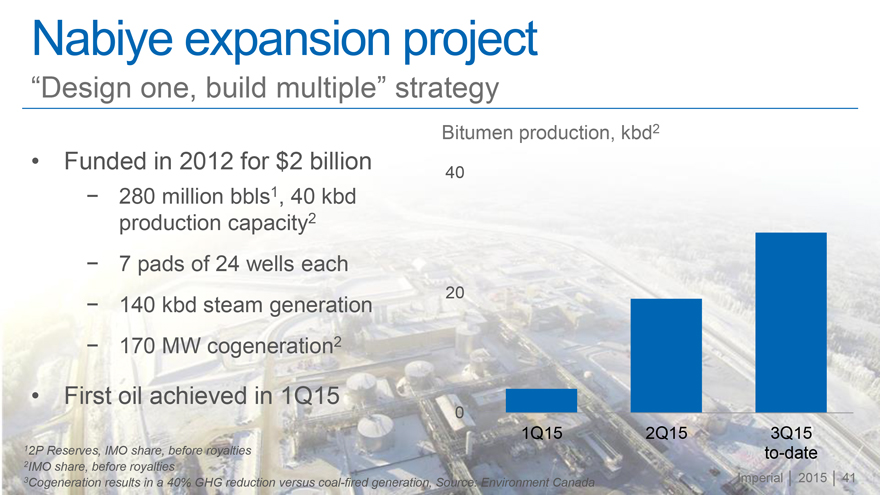
Nabiye expansion project
“Design one, build multiple” strategy
Funded in 2012 for $2 billion
- 280 million bbls1, 40 kbd production capacity2
- 7 pads of 24 wells each
- 140 kbd steam generation
- 170 MW cogeneration2
First oil achieved in 1Q15
Bitumen production, kbd2
40
20
0
1Q15 2Q15 3Q15
to-date
1 2P Reserves, IMO share, before royalties
2 IMO share, before royalties
3 Cogeneration results in a 40% GHG reduction versus coal-fired generation, Source: Environment Canada
Imperial | 2015 | 41
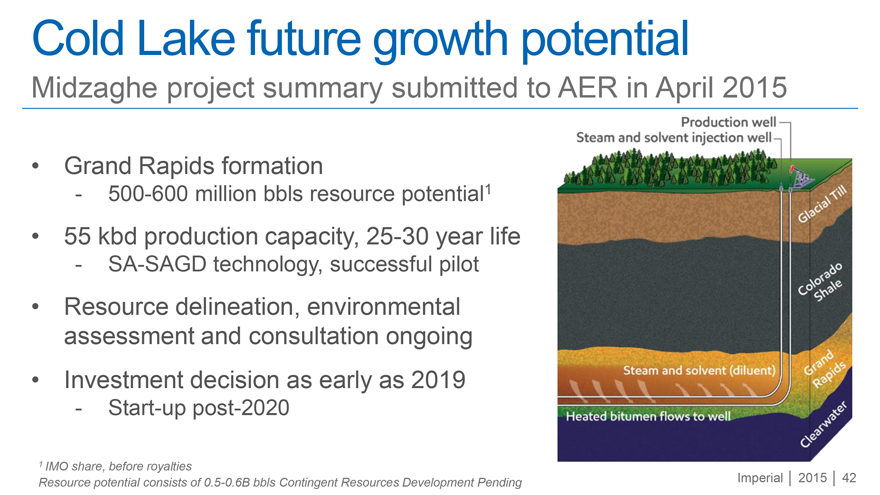
Cold Lake future growth potential
Midzaghe project summary submitted to AER in April 2015
Grand Rapids formation
- 500-600 million bbls resource potential1
55 kbd production capacity, 25-30 year life
- SA-SAGD technology, successful pilot
Resource delineation, environmental assessment and consultation ongoing
Investment decision as early as 2019
- Start-up post-2020
1 IMO share, before royalties
Resource potential consists of 0.5-0.6B bbls Contingent Resources Development Pending
Production well
Steam and solvent injection well
Glacial Till
Colorado Shale
Grand Rapids
Clearwater
Steam and Solvent (diluents)
Heated bitumen flows to well
Imperial | 2015 | 42
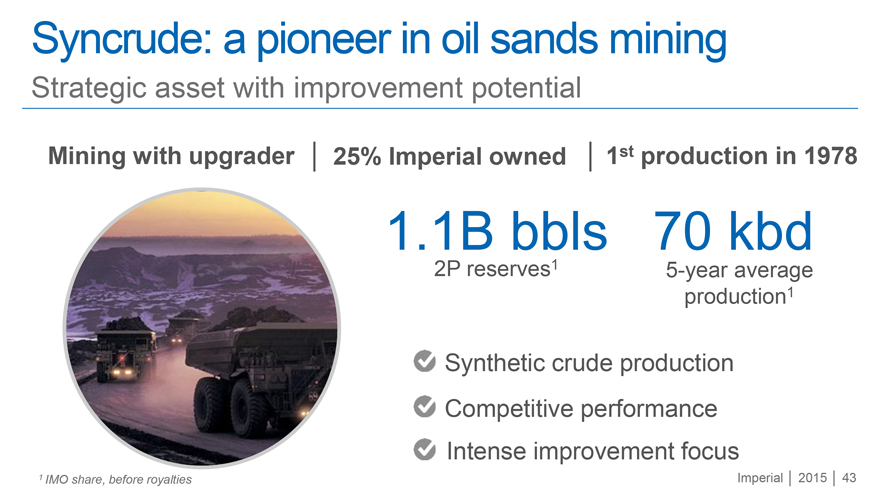
Syncrude: a pioneer in oil sands mining
Strategic asset with improvement potential
Mining with upgrader | 25% Imperial owned | 1st production in 1978
1.1B bbls 70 kbd
2P reserves1 5-year average
production1
Synthetic crude production
Competitive performance
Intense improvement focus
1 IMO share, before royalties
Imperial | 2015 | 43
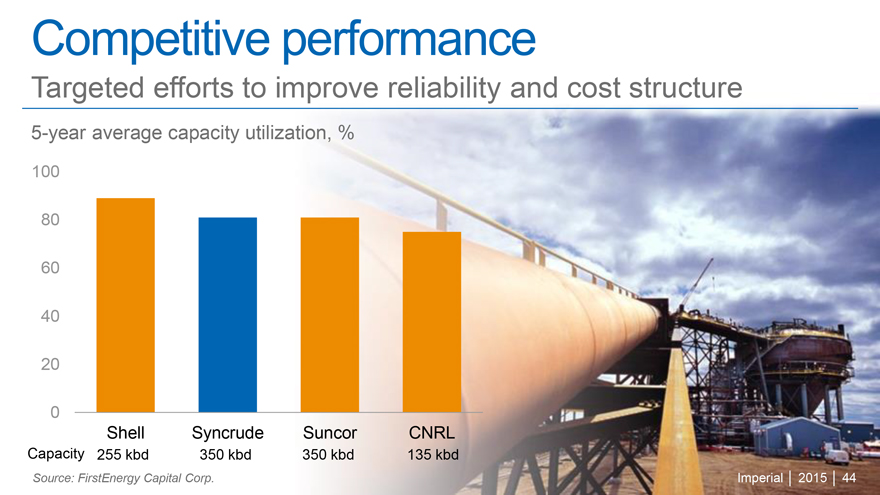
Competitive performance
Targeted efforts to improve reliability and cost structure
5-year average capacity utilization, %
100
80
60
40
20
0
Shell Syncrude Suncor CNRL
Capacity 255 kbd 350 kbd 350 kbd 135 kbd
Source: FirstEnergy Capital Corp.
Imperial | 2015 | 44
Syncrude focus areas
Improving resilience in low price environment
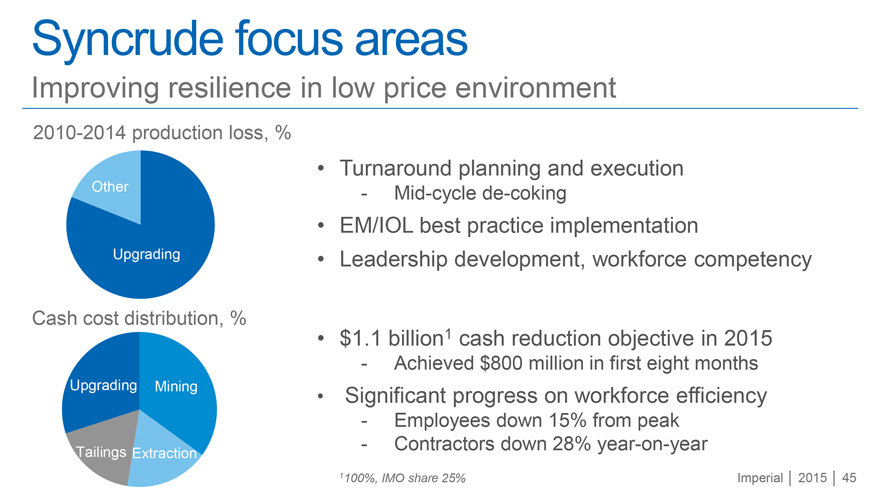
2010-2014 production loss, %
Other
Upgrading
Cash cost distribution, %
Upgrading Mining
Tailings Extraction
Turnaround planning and execution
- Mid-cycle de-coking
EM/IOL best practice implementation
Leadership development, workforce competency
$1.1 billion1 cash reduction objective in 2015
- Achieved $800 million in first eight months
Significant progress on workforce efficiency
- Employees down 15% from peak
- Contractors down 28% year-on-year
1100%, IMO share 25% Imperial | 2015 | 45
Kearl: next generation oil sands mining
Establishing new performance standards
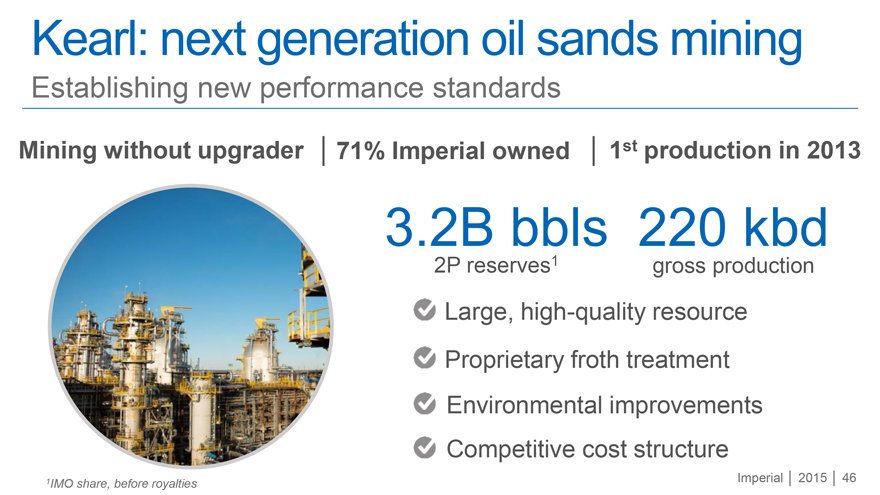
Mining without upgrader | 71% Imperial owned | 1st production in 2013
3.2B bbls
220 kbd
2P reserves1
gross production
Large, high-quality resource
Proprietary froth treatment
Environmental improvements
Competitive cost structure
1IMO share, before royalties
Imperial | 2015 | 46
Proprietary froth treatment
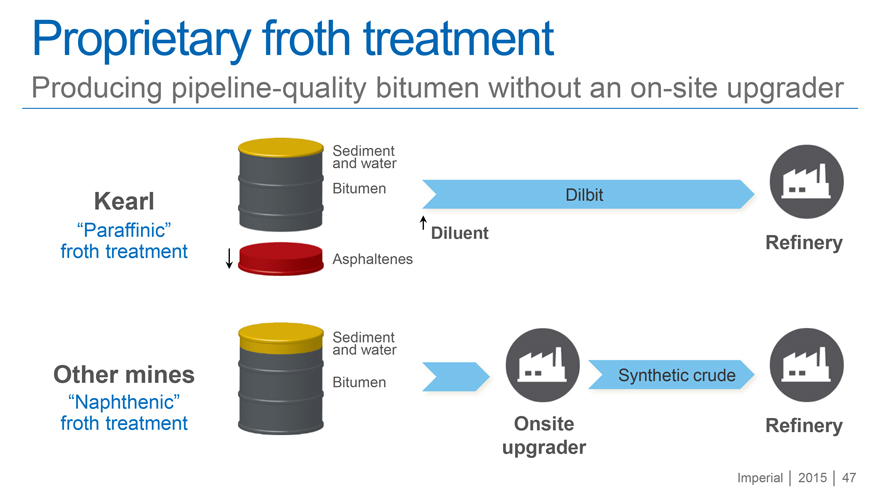
Producing pipeline-quality bitumen without an on-site upgrader
Sediment
and water
Kearl Bitumen Dilbit
“Paraffinic” Diluent
froth treatment Refinery
Asphaltenes
Sedimentand water
Other mines Bitumen Synthetic crude
“Naphthenic” froth treatment Onsite Refinery
upgrader
Imperial | 2015 | 47
Improved environmental performance
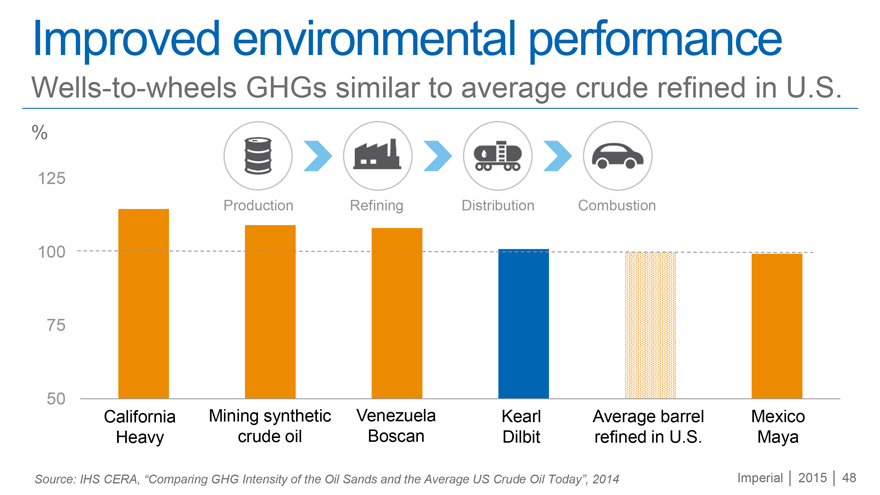
Wells-to-wheels GHGs similar to average crude refined in U.S.
%
125
Production Refining Distribution Combustion
100
75
50
California Mining synthetic Venezuela Kearl Average barrel Mexico
Heavy crude oil Boscan Dilbit refined in U.S. Maya
Source: IHS CERA, “Comparing GHG Intensity of the Oil Sands and the Average US Crude Oil Today”, 2014
Imperial | 2015 | 48
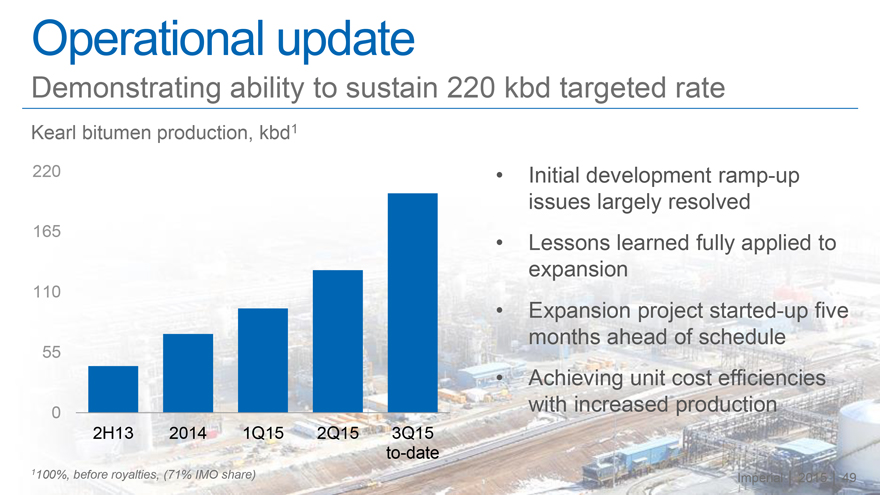
Operational update
Demonstrating ability to sustain 220 kbd targeted rate
Kearl bitumen production, kbd1
220
165
110
55
0
2H13 2014 1Q15 2Q15 3Q15
to-date
1100%, before royalties, (71% IMO share)
Initial development ramp-up issues largely resolved
Lessons learned fully applied to expansion
Expansion project started-up five months ahead of schedule
Achieving unit cost efficiencies with increased production
Imperial | 2015 | 49
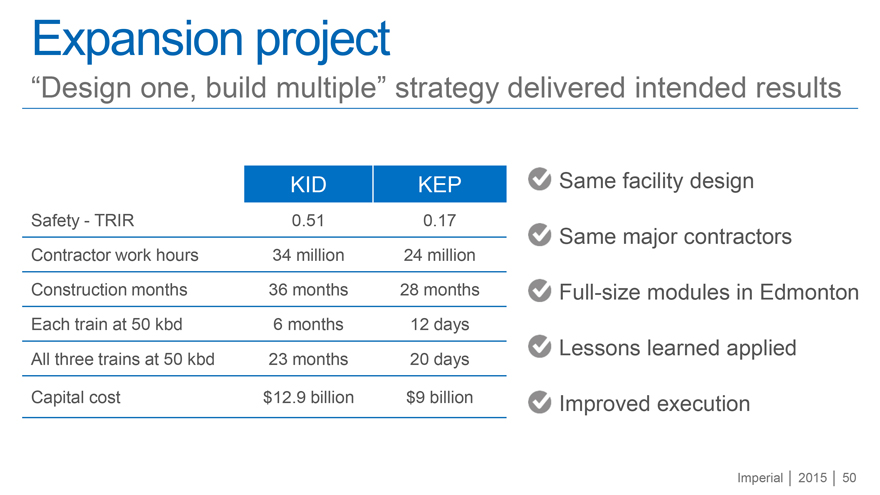
Expansion project
“Design one, build multiple” strategy delivered intended results
KID KEP
Safety - TRIR 0.51 0.17
Contractor work hours 34 million 24 million
Construction months 36 months 28 months
Each train at 50 kbd 6 months 12 days
All three trains at 50 kbd 23 months 20 days
Capital cost $12.9 billion $9 billion
Same facility design
Same major contractors
Full-size modules in Edmonton
Lessons learned applied
Improved execution
Imperial | 2015 | 50
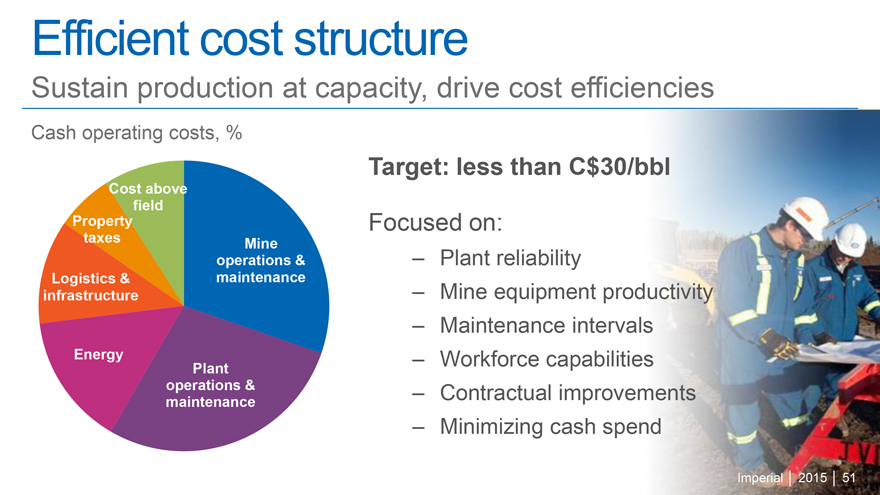
Efficient cost structure
Sustain production at capacity, drive cost efficiencies
Cash operating costs, %
Cost above field
Property taxes
Logistics & infrastructure
Energy
Mine operations & maintenance
Plant operations & maintenance
Target: less than C$30/bbl
Focused on:
– Plant reliability
– Mine equipment productivity
– Maintenance intervals
– Workforce capabilities
– Contractual improvements
– Minimizing cash spend
Imperial | 2015 | 51
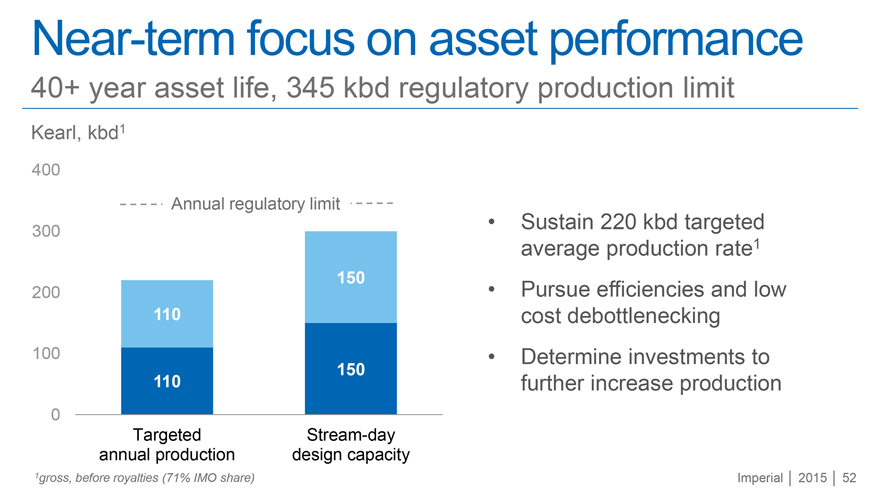
Near-term focus on asset performance
40+ year asset life, 345 kbd regulatory production limit
Kearl, kbd1
400
300
200
100
0
- - - - Annual regulatory limit - - - -
150
110
150
110
Targeted annual production
Stream-day design capacity
Sustain 220 kbd targeted average production rate1
Pursue efficiencies and low cost debottlenecking
Determine investments to further increase production
1gross, before royalties (71% IMO share)
Imperial | 2015 | 52
Market access strategy
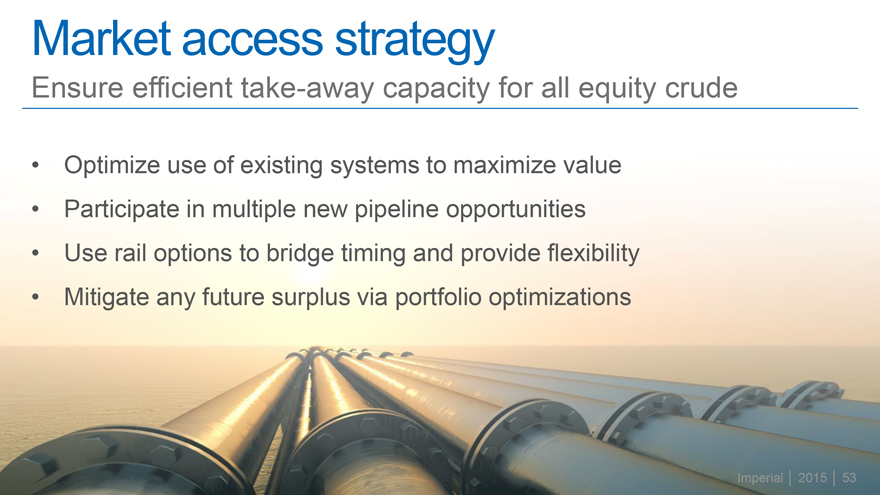
Ensure efficient take-away capacity for all equity crude
Optimize use of existing systems to maximize value
Participate in multiple new pipeline opportunities
Use rail options to bridge timing and provide flexibility
Mitigate any future surplus via portfolio optimizations
Imperial | 2015 | 53
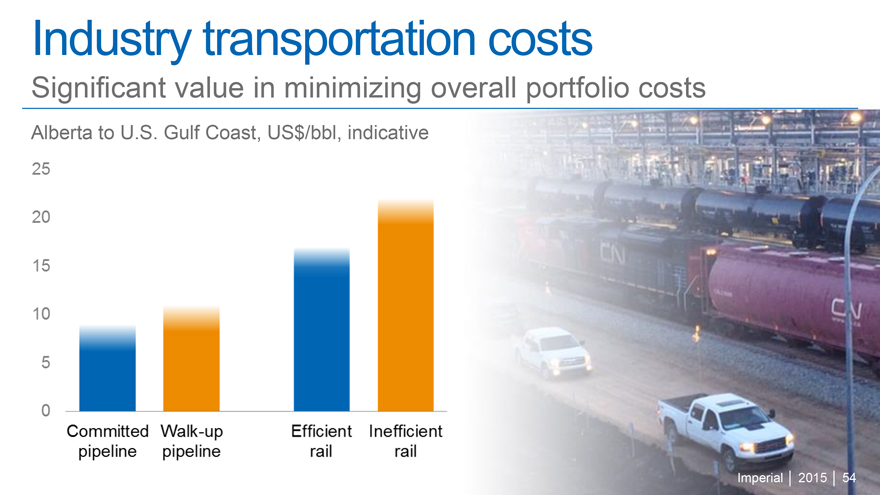
Industry transportation costs
Significant value in minimizing overall portfolio costs
Alberta to U.S. Gulf Coast, US$/bbl, Indicative
25
20
15
10
5
0
Committed pipeline
Walk-up pipeline
Efficient rail
Inefficient rail
Imperial | 2015 | 54
Pipeline transportation
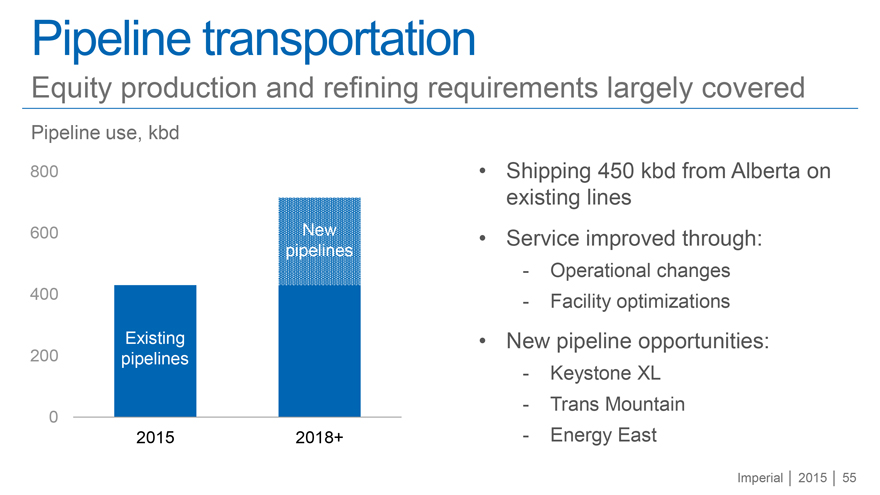
Equity production and refining requirements largely covered
Pipeline use, kbd
800
600 New pipelines
400
200 Existing pipelines
0
2015 2018+
Shipping 450 kbd from Alberta on existing lines
Service improved through:
Operational changes
Facility optimizations
New pipeline opportunities:
Keystone XL
Trans Mountain
Energy East
Imperial | 2015 | 55
Edmonton rail terminal
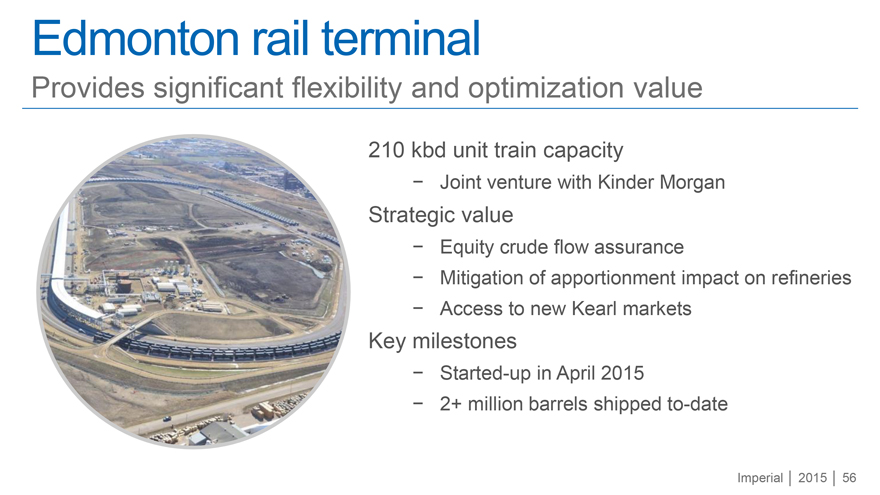
Provides significant flexibility and optimization value
210 kbd unit train capacity
- Joint venture with Kinder Morgan
Strategic value
- Equity crude flow assurance
- Mitigation of apportionment impact on refineries
- Access to new Kearl markets
Key milestones
- Started-up in April 2015
- 2+ million barrels shipped to-date
Imperial | 2015 | 56
Future opportunities
Imperial
Imperial | 2015 | 57
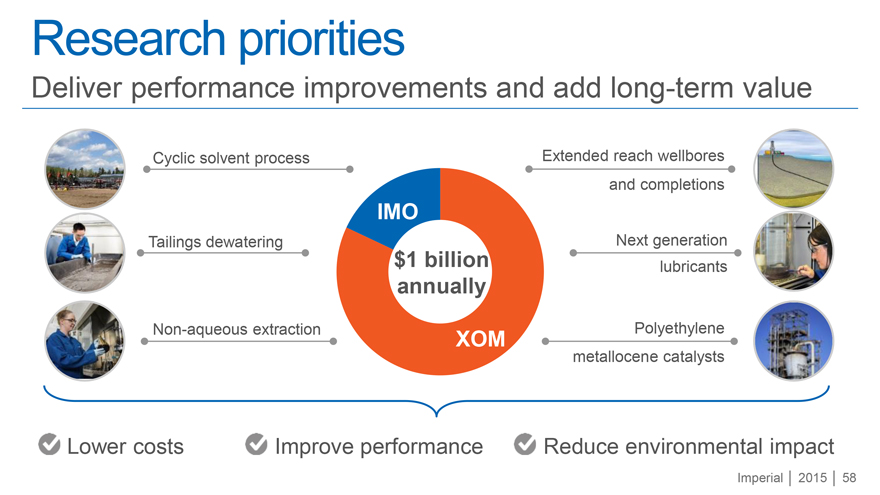
Research priorities
Deliver performance improvements and add long-term value
Cyclic solvent process Extended reach wellbores and completions
Tailings dewatering Next generation lubricants
Non-aqueous extraction Polyethylene metallocene catalysts
IMO
$1 billion
annually
XOM
Lower costs Improve performance Reduce environmental impact
Imperial | 2015 | 58
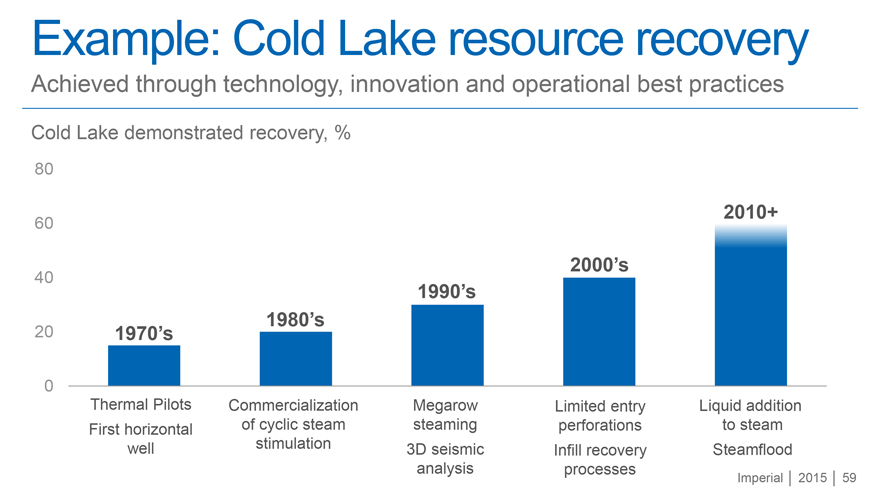
Example: Cold Lake resource recovery
Achieved through technology, innovation and operational best practices
Cold Lake demonstrated recovery, %
80
60
40
20
0
2010+
2000’s
1990’s
1980’s
1970’s
Thermal Pilots First horizontal well
Commercialization of cyclic steam stimulation
Megarow steaming 3D seismic analysis
Limited entry perforations Infill recovery processes
Liquid addition to steam Steamflood
Imperial | 2015 | 59
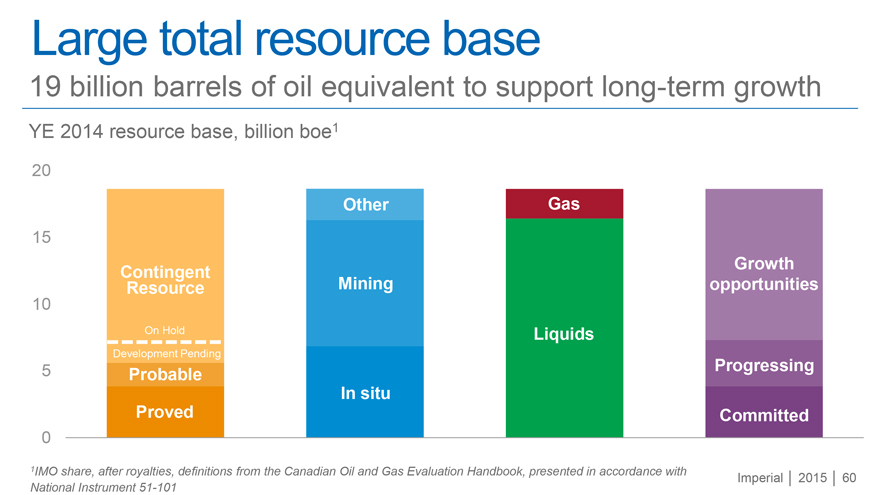
Large total resource base
19 billion barrels of oil equivalent to support long-term growth
YE 2014 resource base, billion boe1
20
15
10
5
0
Contingent Resource On Hold Development Pending Probable Proved
Other Mining In situ
Gas Liquids
Growth opportunities
Progressing
Committed
1IMO share, after royalties, definitions from the Canadian Oil and Gas Evaluation Handbook, presented in accordance with National Instrument 51-101
Imperial | 2015 | 60
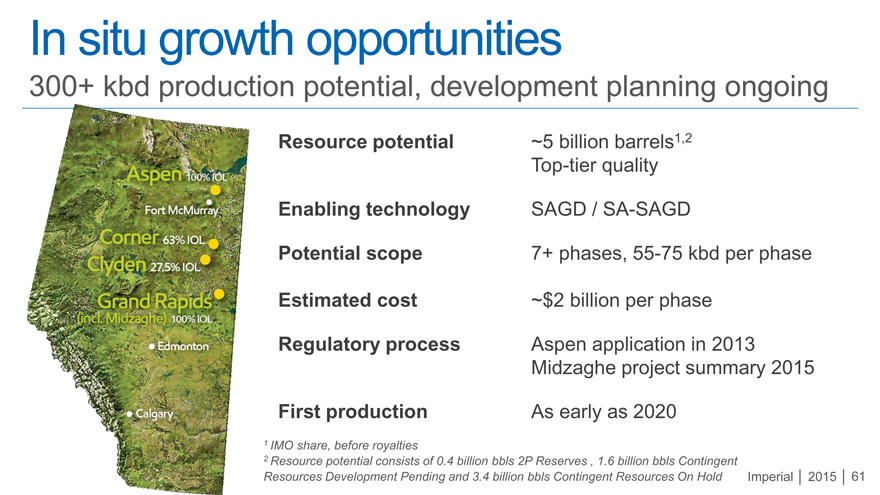
In situ growth opportunities
300+ kbd production potential, development planning ongoing
Aspen 100% IOL
Fort McMurray
Corner 63% IOL
Clyden 27.5% IOL
Grand Rapids (incl. Midzaghe) 100% IOL
Edmonton
Calgary
Resource potential ~5 billion barrels1,2
Top-tier quality
Enabling technology SAGD / SA-SAGD
Potential scope 7+ phases, 55-75 kbd per phase
Estimated cost ~$2 billion per phase
Regulatory process Aspen application in 2013
Midzaghe project summary 2015
First production As early as 2020
1 IMO share, before royalties
2 Resource potential consists of 0.4 billion bbls 2P Reserves , 1.6 billion bbls Contingent
Resources Development Pending and 3.4 billion bbls Contingent Resources On Hold
Imperial | 2015 | 61
In situ development strategy
Technical progression of multiple projects to provide optionality
Subsurface
Technical definition
- Resource delineation program
Enhancing drilling efficiency and reducing costs
Technology enhancements
- Solvent Assisted-SAGD
Surface facilities
Design standardization
- “Design one, build multiple”
Modular manufacturing
Technology enhancements
- High efficiency cogeneration
- Steam plant efficiency
Imperial | 2015 | 62
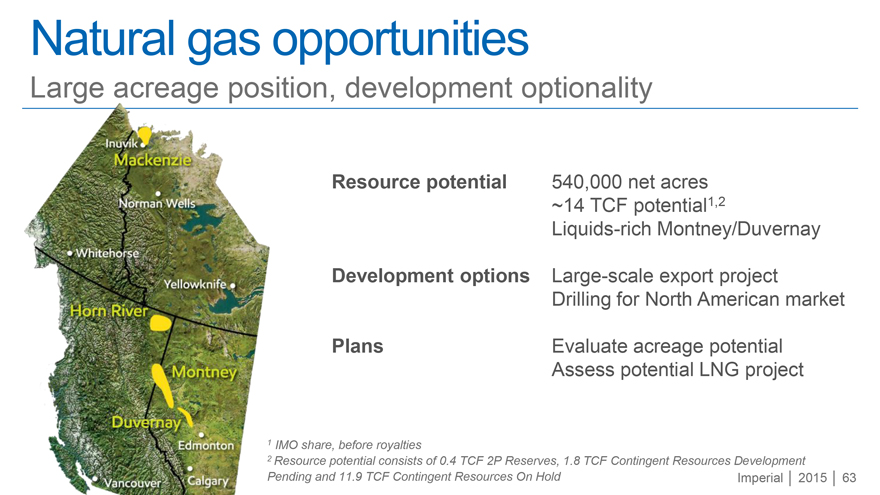
Natural gas opportunities
Large acreage position, development optionality
Inuvik
Mackenzie
Norman Wells
Whitehorse
Yellowknife
Horn River
Montney
Duvernay
Edmonton
Vancouver
Calgary
Resource potential
Development options
Plans
540,000 net acres
~14 TCF potential1,2
Liquids-rich Montney/Duvernay
Large-scale export project
Drilling for North American market
Evaluate acreage potential
Assess potential LNG project
1 IMO share, before royalties
2 Resource potential consists of 0.4 TCF 2P Reserves, 1.8 TCF Contingent Resources Development
Pending and 11.9 TCF Contingent Resources On Hold
Imperial | 2015 | 63
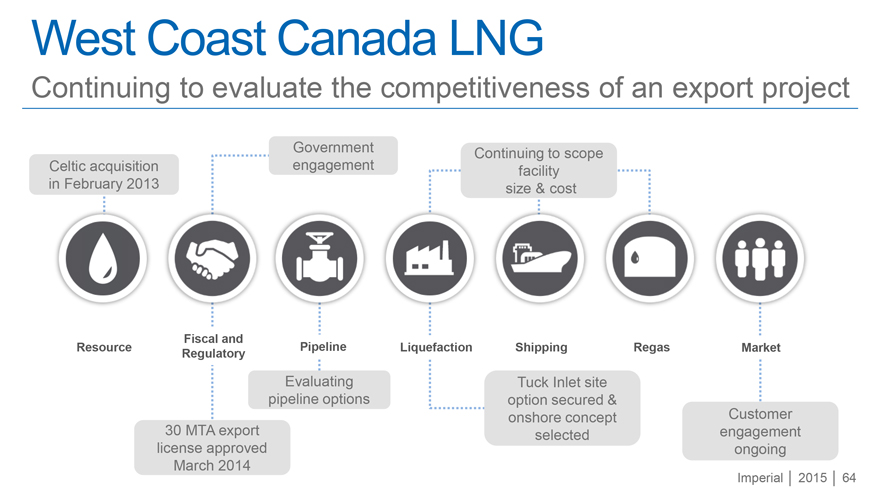
West Coast Canada LNG
Continuing to evaluate the competitiveness of an export project
Celtic acquisition in February 2013
Resource
Fiscal and Regulatory
30 MTA export
license approved
March 2014
Government engagement
Pipeline
Evaluating pipeline options
Continuing to scope facility size & cost
Liquefaction
Shipping
Tuck Inlet site option secured & onshore concept selected
Regas
Market
Customer engagement ongoing
Imperial | 2015 | 64
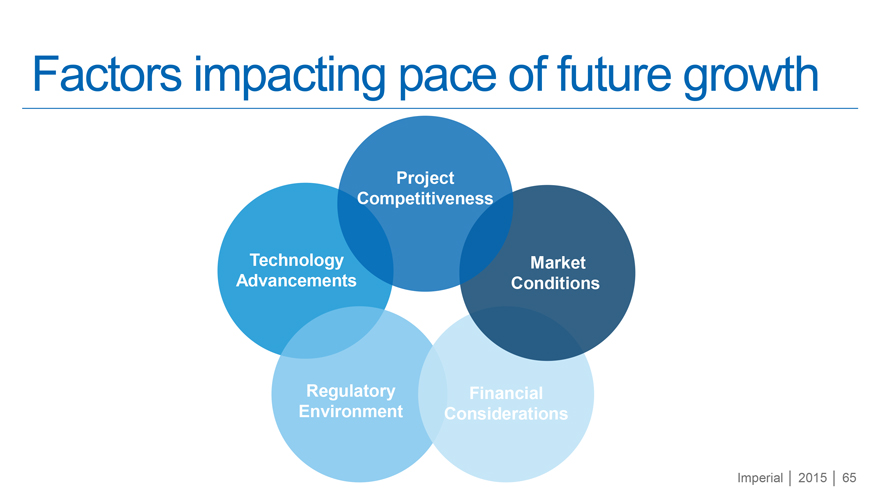
Factors impacting pace of future growth
Project Competitiveness
Technology Advancements
Market Conditions
Regulatory Environment
Financial Considerations
Imperial | 2015 | 65
Executive summary
Deliver superior, long-term shareholder value
History of industry-leading financial and operating performance
Significant value delivered through technology, integration and synergies
Completion of growth projects greatly enhances cash flow capacity
Business environment supports focusing on what is within our control
Significant inventory of future growth opportunities
Imperial | 2015 | 66
For more information
www.imperialoil.ca
Twitter /ImperialOil YouTube /ImperialOil LinkedIn /Imperial-Oil
For more detailed investor information, or to receive annual and interim reports, please
contact:
Meredith C. Milne
Manager, Investor Relations
Imperial Oil Limited
237 Fourth Avenue SW
Calgary, Alberta T2P 3M9
Email: meredith.c.milne@esso.ca
Phone: +1 (587) 476-4743

Imperial