
© 2015 Tesoro Corporation. All Rights Reserved. Driven to Create Value 2015 Investor and Analyst Day December 9, 2015 Exhibit 99.2

Forward Looking Statements This Presentation includes forward-looking statements within the meaning of the Private Securities Litigation Reform Act of 1995. These statements relate to, among other things: •the ability to maintain and benefit from our competitive advantages; • our ability to execute on our strategic priorities, including operational efficiency and effectiveness, high performing culture, value-driven growth, value chain optimization and financial discipline, as well as the potential impact of such execution; • EBITDA estimates, growth and targets for Tesoro, Tesoro Logistics LP (“TLLP”) and various portions of their businesses (including the EBITDA contribution from new business investments and business improvements); • expectations regarding annual improvements in throughput and capture rates, annual business improvements, and new business investments; • the market outlook, including expectations regarding the Tesoro index, marketing margins, the balance between refined product production and demand, crude oil differentials and refined product exports; • expectations regarding operational availability, refining utilization and gross margin capture; • our advantaged refining network, including access to and volume of advantaged feedstocks, transportation and logistics advantages, concentrated product demand markets, and gross margin advantages; • the advantages of our refining flexibility; • anticipated spending for turnarounds, sustaining capital and growth capital and the benefits of such spending; • the cost, timing and benefits of our Los Angeles integration and compliance project, our the Port of Vancouver marine terminal joint venture, our mixed xylenes project, our isomerization project, and other major projects (including capital projects, organic projects designed to create new business opportunities, and strategic acquisitions by both Tesoro and TLLP), including expectations regarding anticipated rates of return and incremental EBITDA improvements; • the global market for mixed xylenes, transportation advantages and our potential competitiveness as a supplier of xylene; • the cost, timing and results of our logistics growth strategy, including TLLP’s asset optimization and organic growth opportunities, opportunities for strategic third-party and Tesoro acquisitions, and the expansion of TLLP’s third- party business; • the potential EBITDA generated by possible future logistics asset sales to TLLP; • TLLP’s strategic approach to acquisitions; • the expected completion of the acquisition of the Alaska marketing and logistics business from Flint Hills Resources, the acquisition of Great Northern Midstream, the timing and benefits related to such acquisitions, and the subsequent offer of such assets to TLLP; • expectations regarding TLLP continuing to drive unitholder value; • our plans to create additional value through our marketing business, including enhancements to the existing business, organic growth, and strategic acquisitions, including targeted business improvements, EBITDA, branded volumes and retail site counts; • maintaining Tesoro’s financial priorities and executing its financial strategy, including expectations for free cash flow, targeted returns for capital projects and delivering best-in-class return on invested capital, maintaining minimum cash balances, target debt capitalization levels, target leverage levels, achievement and benefits of investment-grade credit ratings, continued dividend growth,. and returning cash to shareholders; • the anticipated percentage of our EBITDA generated by refining, marketing and logistics assets; • the multiple applicable to Tesoro’s general partner interest in TLLP and the implied value of Tesoro’s stake in TLLP; and • enhanced commercial opportunities and other growth prospects for both Tesoro and TLLP. We have used the words "anticipate", "believe", "could", "estimate", "expect", "intend", "may", "plan", "predict", "project", “should”, "will" and similar terms and phrases to identify forward-looking statements in this Presentation. Although we believe the assumptions upon which these forward-looking statements are based are reasonable, any of these assumptions could prove to be inaccurate and the forward-looking statements based on these assumptions could be incorrect. Our operations and anticipated transactions involve risks and uncertainties, many of which are outside our control, and any one of which, or a combination of which, could materially affect our results of operations and whether the forward-looking statements ultimately prove to be correct. Actual results and trends in the future may differ materially from those suggested or implied by the forward-looking statements depending on a variety of factors which are described in greater detail in our filings with the SEC. All future written and oral forward-looking statements attributable to us or persons acting on our behalf are expressly qualified in their entirety by the previous statements. We undertake no obligation to update any information contained herein or to publicly release the results of any revisions to any forward-looking statements that may be made to reflect events or circumstances that occur, or that we become aware of, after the date of this Presentation. We have included various estimates of EBITDA and free cash flow, each of which are non-GAAP financial measures, throughout the presentation. Please see Appendix for the definition and reconciliation of these EBITDA and free cash flow estimates.

Tesoro 3 Steven Sterin EVP, Chief Financial Officer CJ Warner EVP, Strategy & Business Development Keith Casey EVP, Operations Greg Goff Chairman, President and CEO Phil Anderson President, Tesoro Logistics GP, LLC Tesoro’s Leadership Team Charles Parrish EVP, General Counsel & Secretary Daryl Schofield SVP, Commercial Craig LaTorre SVP, Chief Human Resources Officer Brenda Peterson VP, Enterprise Business Improvement Brian Sullivan VP, Corporate Affairs
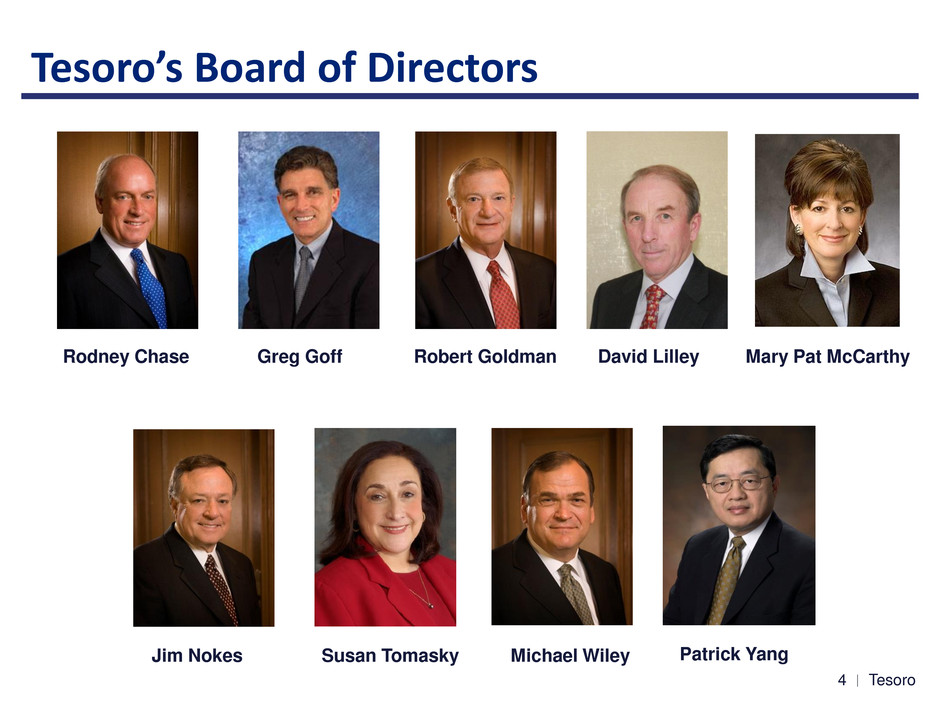
Tesoro 4 Tesoro’s Board of Directors Rodney Chase Greg Goff Robert Goldman David Lilley Mary Pat McCarthy Jim Nokes Susan Tomasky Michael Wiley Patrick Yang

© 2015 Tesoro Corporation. All Rights Reserved. Driven to Create Value Greg Goff Chairman and CEO
Tesoro 6 Tesoro’s Competitive Advantage • The leading integrated refining, marketing and logistics company in our strategic footprint • Driving significant business improvements and creating sustainable earnings growth • Demonstrated track record of delivering results and achieving ambitions • Well diversified earnings portfolio with strong growth opportunities • Disciplined approach to capital allocation to create significant shareholder value
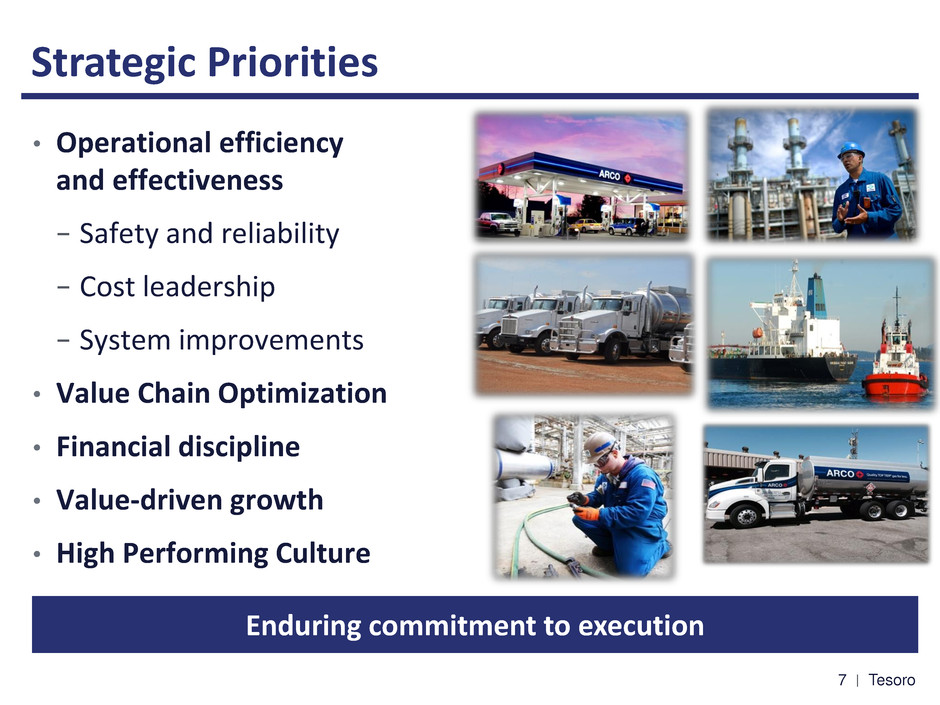
Tesoro 7 Strategic Priorities • Operational efficiency and effectiveness − Safety and reliability − Cost leadership − System improvements • Value Chain Optimization • Financial discipline • Value-driven growth • High Performing Culture Enduring commitment to execution
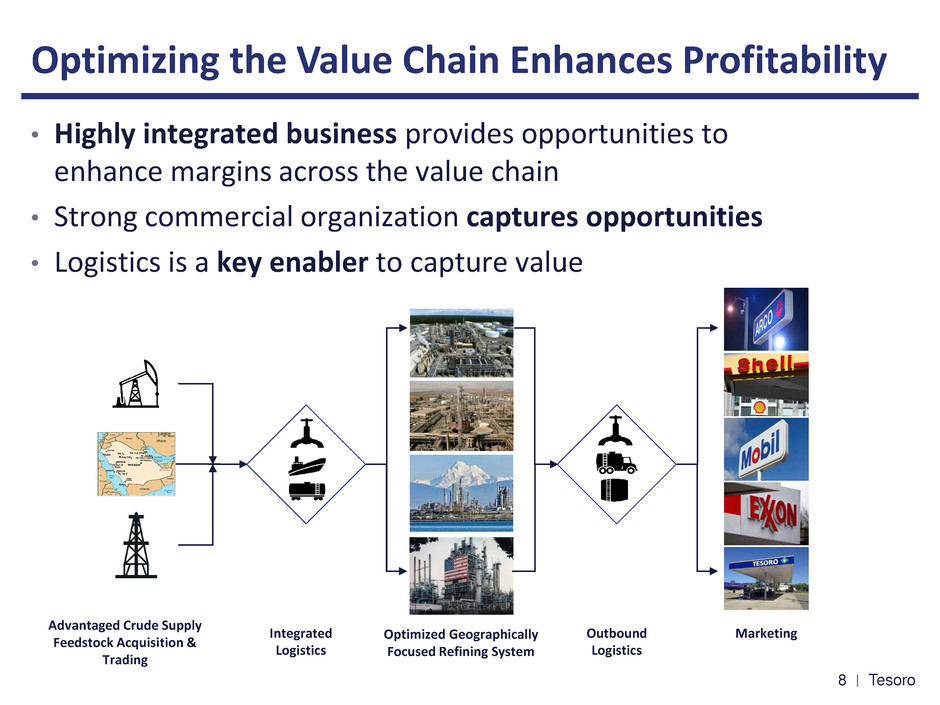
Tesoro 8 Optimizing the Value Chain Enhances Profitability • Highly integrated business provides opportunities to enhance margins across the value chain • Strong commercial organization captures opportunities • Logistics is a key enabler to capture value Integrated Logistics Outbound Logistics Advantaged Crude Supply Feedstock Acquisition & Trading Optimized Geographically Focused Refining System Marketing
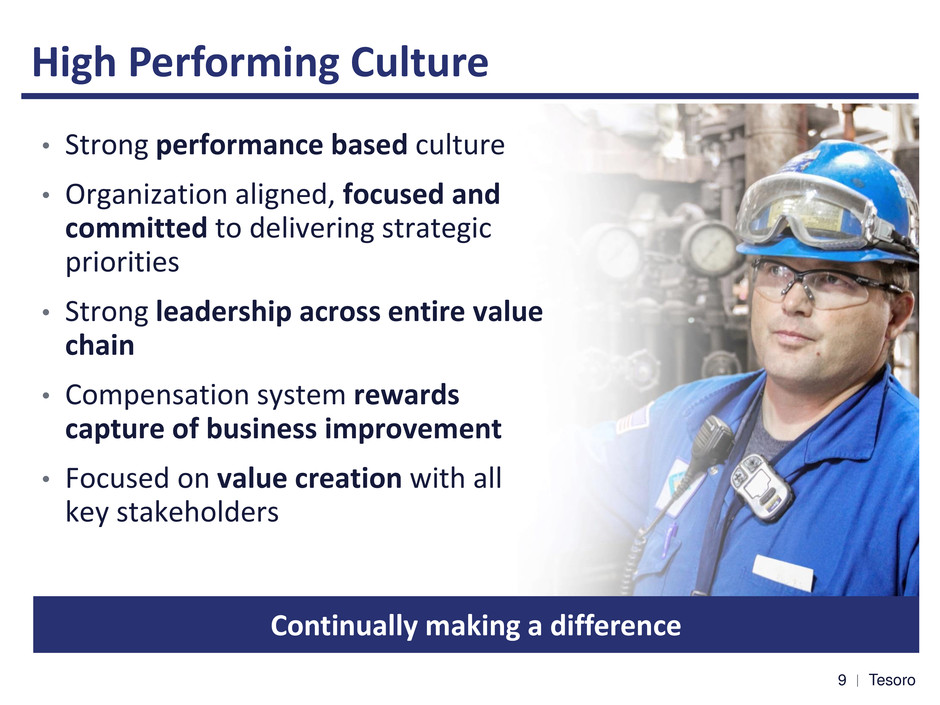
Tesoro 9 High Performing Culture Continually making a difference • Strong performance based culture • Organization aligned, focused and committed to delivering strategic priorities • Strong leadership across entire value chain • Compensation system rewards capture of business improvement • Focused on value creation with all key stakeholders

Tesoro 10 Creating Shared Value for Key Stakeholders • Positively impacts the mutual value created between Tesoro and key stakeholders • Principled based approach to conducting business • Reinforces our license to operate and grow • Shapes our reputation as a Company • Fully aligned with our High Performing Culture

Tesoro 11 Changes in Tesoro’s Business 2010 - 2015 Key Metrics 2010 2015E EBITDA ($ in millions) 551 3,9001 Enterprise Value ($ in billions) 3.5 18.62 Refining Capacity (MBD) 665 875 Refining Complexity 9.8 11.5 Crude oil, refined product and natural gas pipelines (miles) 900+ 3,500+ Branded Retail Stations 880 2,300 Marketing Integration (%) 31 93 Employees 5,300 5,800 Los Angeles, CA 380 MBD Martinez, CA 166 MBD Kenai, AK 72 MBD Anacortes, WA 120 MBD Salt Lake City, UT 63 MBD Mandan, ND 74 MBD 1) First call as of 12/3/2015 2) As of 12/3/2015
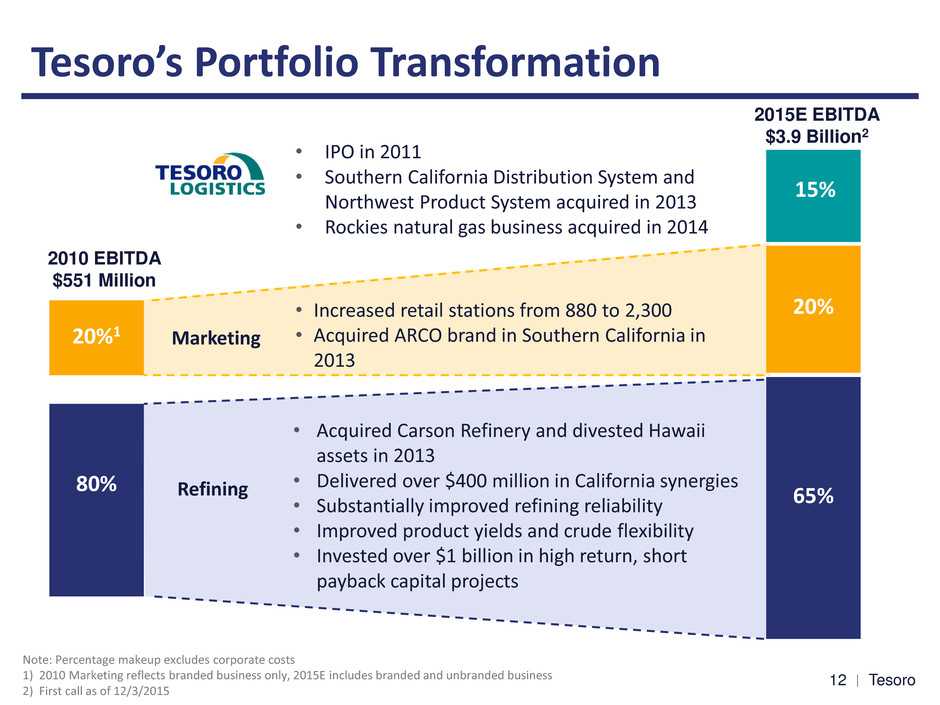
Tesoro 12 Tesoro’s Portfolio Transformation 20%1 80% 20% 65% 15% • IPO in 2011 • Southern California Distribution System and Northwest Product System acquired in 2013 • Rockies natural gas business acquired in 2014 • Acquired Carson Refinery and divested Hawaii assets in 2013 • Delivered over $400 million in California synergies • Substantially improved refining reliability • Improved product yields and crude flexibility • Invested over $1 billion in high return, short payback capital projects • Increased retail stations from 880 to 2,300 • Acquired ARCO brand in Southern California in 2013 2010 EBITDA $551 Million 2015E EBITDA $3.9 Billion2 Note: Percentage makeup excludes corporate costs 1) 2010 Marketing reflects branded business only, 2015E includes branded and unbranded business 2) First call as of 12/3/2015 Marketing Refining
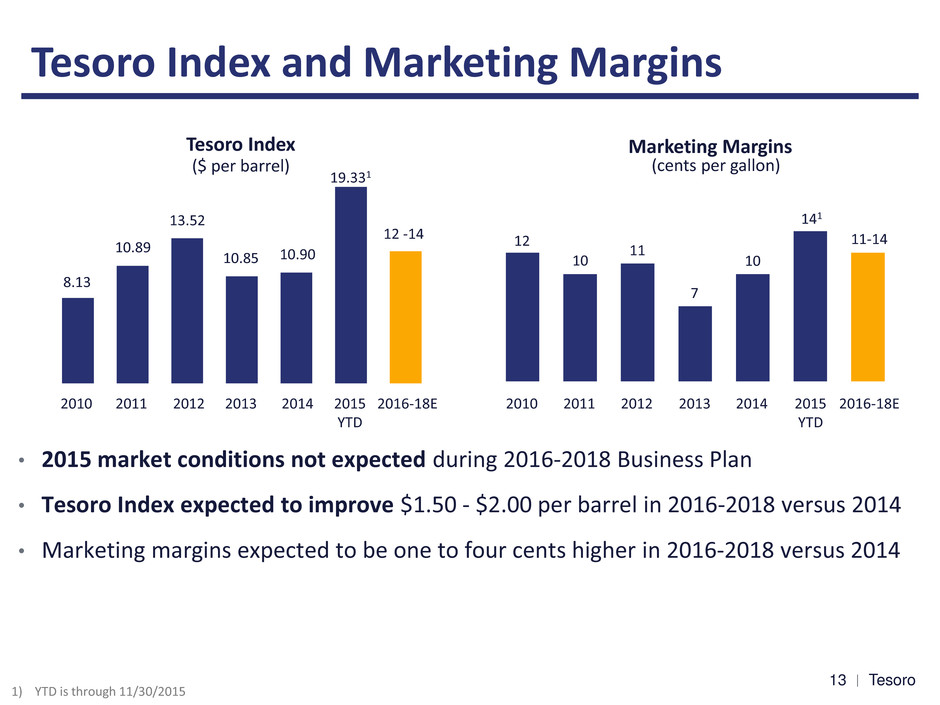
Tesoro 13 Tesoro Index and Marketing Margins 1) YTD is through 11/30/2015 8.13 10.89 13.52 10.85 10.90 19.331 12 -14 12 10 11 7 10 141 11-14 2010 2011 2012 2013 2014 2015 YTD 2016-18E 2010 2011 2012 2013 2014 2015 YTD 2016-18E Tesoro Index Marketing Margins ($ per barrel) (cents per gallon) • 2015 market conditions not expected during 2016-2018 Business Plan • Tesoro Index expected to improve $1.50 - $2.00 per barrel in 2016-2018 versus 2014 • Marketing margins expected to be one to four cents higher in 2016-2018 versus 2014

Tesoro 14 PADD V Shows Strong Rebound 2010 2011 2012 2013 2014 2015 -4% -2% 0% 2% 4% 6% 8% Vehicle Miles Traveled PADD 5 US Source : PADD V Supply and Demand Balance: EIA 1) Clean product production only, excludes inter-PADD movements and ethanol blending in gasoline Source: Vehicle Miles Traveled: FHWA Average MBD Production1 Demand Exports Gasoline 1,592 1,573 - Diesel 582 531 95 Jet 427 459 (21) Total 2,601 2,563 74 PADD V Supply Demand Balance Oct 2014 - Sep 2015 • PADD V supply and demand is well balanced • Total refined product production exceeded demand by less than 2% • Vehicle Miles Traveled consistently growing, outpacing the U.S. average (2%) (4%)

Tesoro 15 Mid-Continent Continues as a Strong Market • Favorable market conditions expected to continue • Lower crude oil price environment supportive to product demand • Crude oil differentials expected to be lower than 2011-2014 period ($50) ($40) ($30) ($20) ($10) $0 $10 2010 2011 2012 2013 2014 2015E Crude Diffs vs Brent ($ per barrel) LLS WTI WCS ANS $0 $5 $10 $15 $20 $25 $30 2010 2011 2012 2013 2014 2015E Mandan Index SLC Index GC 3-2-1 vs LLS ($ per barrel)

Tesoro 16 Successfully Delivered Growth During 2015 • Continued strong execution of West Coast business improvements • Strong growth and exceptional execution in the logistics business despite current commodity price environment 16 ($ in millions) 2015 Target 2015 YTD1 2015E Deliver West Coast Improvements 95 - 125 130 190 Capture Margin Improvements 130 - 170 120 170 Grow Logistics 325 - 375 255 340 Total 550 - 670 505 700 2015 commitment from 2014 Investor and Analyst Day 1) YTD as of 9/30/2015

Tesoro 17 Growth Beyond 2015 • Expect $900 million to $1.1 billion of year over year earnings growth in 2016 from ongoing business and operational improvements • Logistics on track for $1 billion of EBITDA in 2017 • Expect Marketing EBITDA of $650 to $700 million in 2016; and approximately $1 billion by 2018 • New business investments add approximately $50 to $100 million of earnings growth in 2017 - 2018; over $350 million annualized after 2018 • Improvements to value chain optimization expected to improve capture rate Targeting $3.5 billion to $4.0 billion of EBITDA in 2018 1) $3.5 billion to $4.0 billion target is based on $13 TSO Index assumption

Tesoro 18 Clear Plan for Improvements in 2016 ($ in millions) 2016E Refining1 200 - 250 Logistics1 175 - 200 Marketing 25 - 50 Business Improvements 400 - 500 Higher Utilization and Capture2 500 - 600 Total Improvements 900 - 1,100 1) Includes a drop-down of $50-75 million of EBITDA from Refining to Logistics 2) Improvement assumes no labor disruption in 2016 3) 2013 excludes Carson acquisition 2011 2012 2013 2014 2015E 2016E 700 175 175 225 560 Annual Improvements 400 – 500 3

Tesoro 19 Growth in Improvements Beyond 2016 19 ($ in millions) 2017E – 2018E Refining1 100 - 200 Logistics1 250 - 275 Marketing 325 - 450 New Business Investments 50 - 100 Total 725 - 1,025 1) Includes a drop-down of $50-75 million of EBITDA per year from Refining to Logistics 2) 2013 excludes Carson acquisition 2011 2012 2013 2014 2015E 2016E 2017E - 2018E 700 175 175 225 560 Annual Improvements 400 – 500 725 – 1,025 2

© 2015 Tesoro Corporation. All Rights Reserved. Driving Refining Excellence; New Business Investments Keith Casey EVP, Operations

Tesoro 21 0.3 0.2 0.2 0.1 0.1 2011 2012 2013 2014 2015 YTD Safety and Environmental Stewardship Personal Safety Incident Rates OSHA Recordable Rate per 200,000 Hours Process Safety Incident Rates API Tier 1 and 2 Rate per 200,000 Hours 0.4 0.4 0.3 0.3 0.2 2011 2012 2013 2014 2015 YTD 79 78 68 62 2011 2012 2013 2014 Total Air Emissions Tons per million barrels of throughput 1 1 1) 2015 YTD through 9/30/2015

Tesoro 22 Highly Competitive Refining System • Regionally advantaged crude oil access • System-wide value chain optimization resulting in strong gross margin capture • Operational excellence enabling world class asset availability of >97% • Business Improvement conviction delivering approximately $200 million annually • High Performing Culture driving continuous improvement • Strategic projects enhance feedstock flexibility, yields and lower costs 22
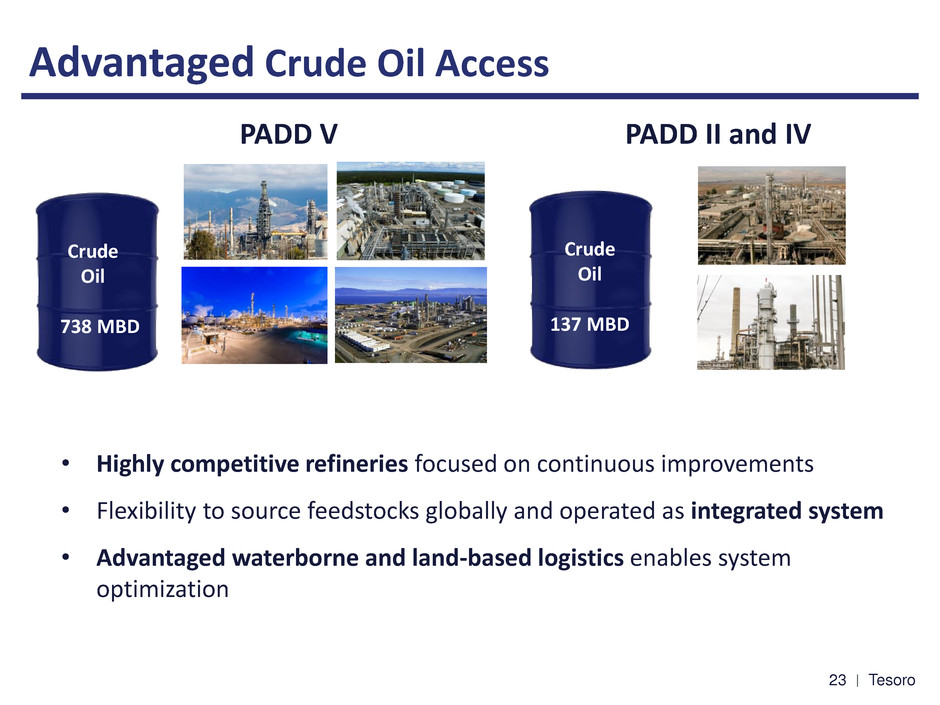
Tesoro 23 Advantaged Crude Oil Access • Highly competitive refineries focused on continuous improvements • Flexibility to source feedstocks globally and operated as integrated system • Advantaged waterborne and land-based logistics enables system optimization PADD V PADD II and IV Crude Oil 738 MBD Crude Oil 137 MBD Crude Oil 137 MBD
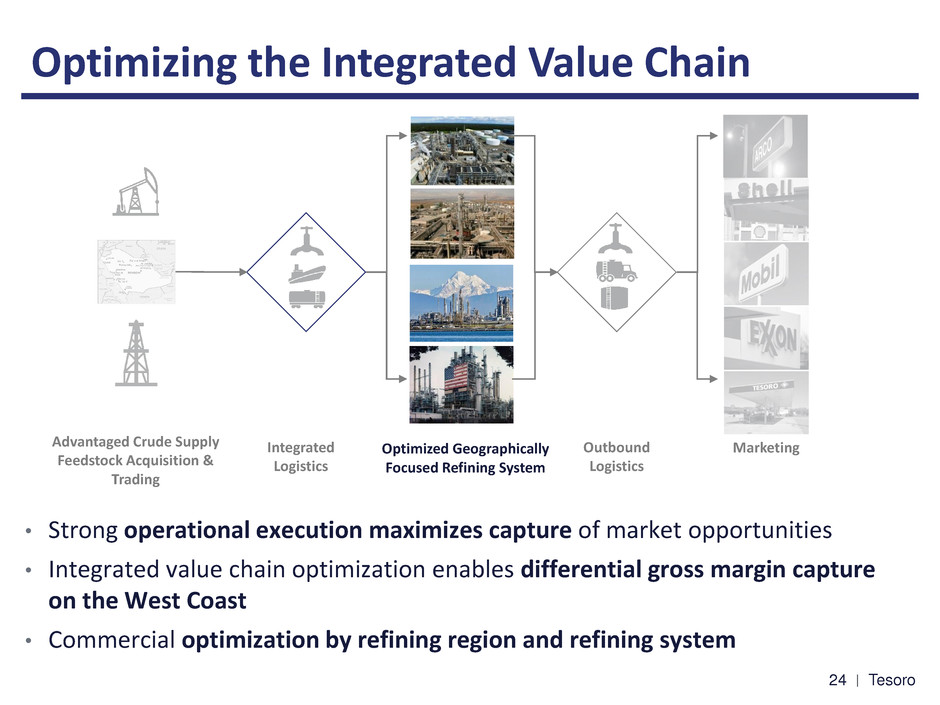
Tesoro 24 Optimizing the Integrated Value Chain • Strong operational execution maximizes capture of market opportunities • Integrated value chain optimization enables differential gross margin capture on the West Coast • Commercial optimization by refining region and refining system Integrated Logistics Outbound Logistics Optimized Geographically Focused Refining System Marketing Advantaged Crude Supply Feedstock Acquisition & Trading

Tesoro 25 25 Refining Flexibility Extends Commercial Agility • Yield flexibility and value chain optimization enables capture in volatile markets • Swing capability increased to 8-10% through organic projects and strategic acquisitions • Los Angeles Integration and Compliance Project further increases flexibility ($20) ($10) $0 $10 $20 $30 2010 2011 2012 2013 2014 2015 LA CARBOB vs CARB ULSD ($ per barrel)
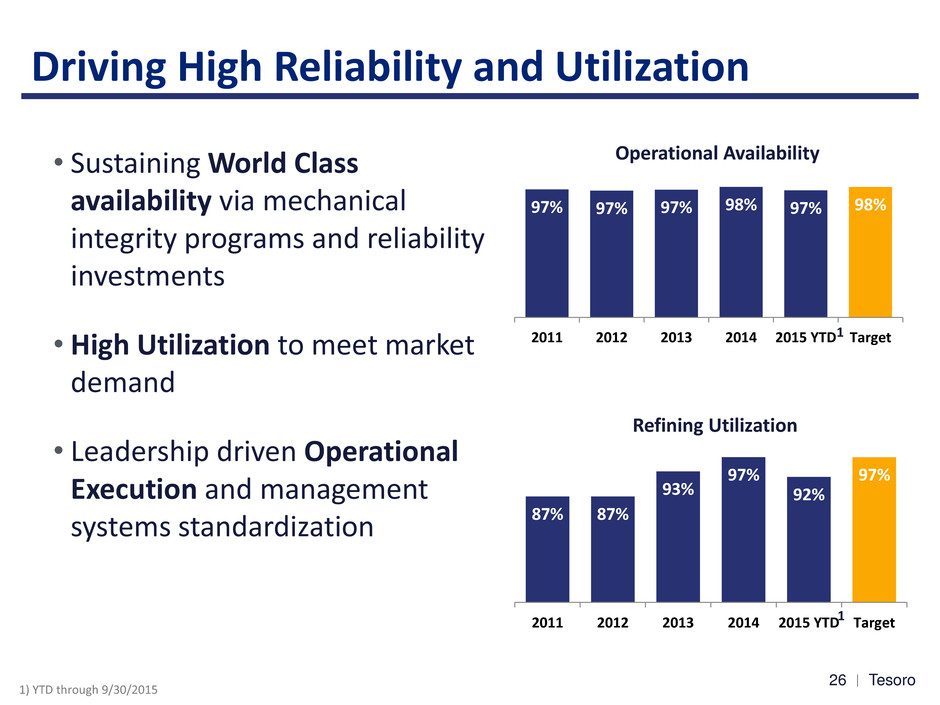
Tesoro 26 26 Driving High Reliability and Utilization • Sustaining World Class availability via mechanical integrity programs and reliability investments • High Utilization to meet market demand • Leadership driven Operational Execution and management systems standardization 87% 87% 93% 97% 92% 97% 2011 2012 2013 2014 2015 YTD Target 97% 97% 97% 98% 97% 98% 2011 2012 2013 2014 2015 YTD Target Refining Utilization Operational Availability 1 1 1) YTD through 9/30/2015
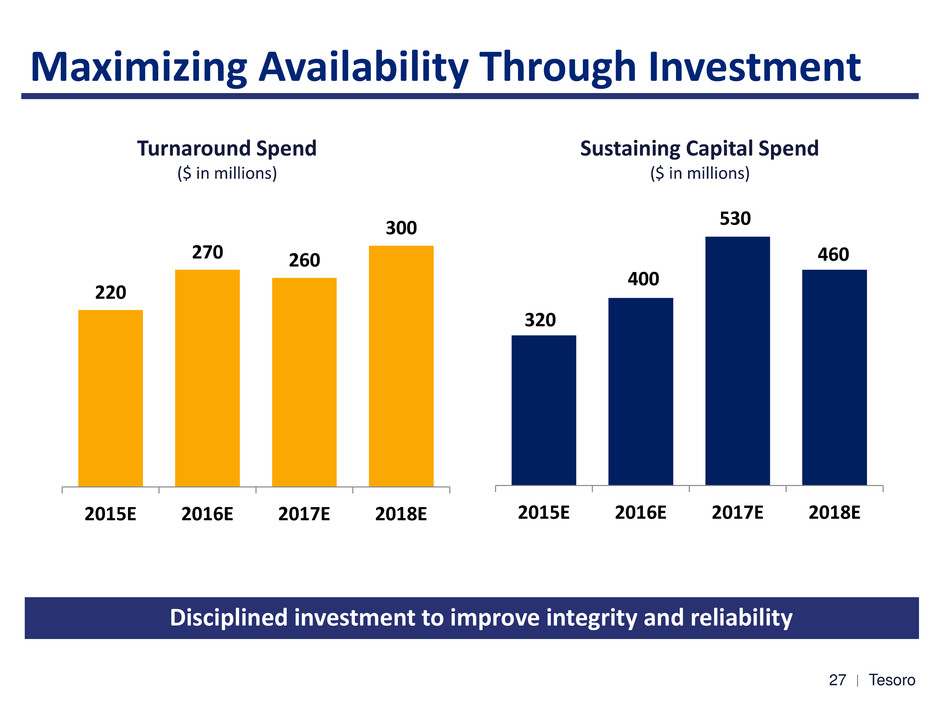
Tesoro 27 Maximizing Availability Through Investment Turnaround Spend ($ in millions) 220 270 260 300 2015E 2016E 2017E 2018E 320 400 530 460 2015E 2016E 2017E 2018E Sustaining Capital Spend ($ in millions) Disciplined investment to improve integrity and reliability
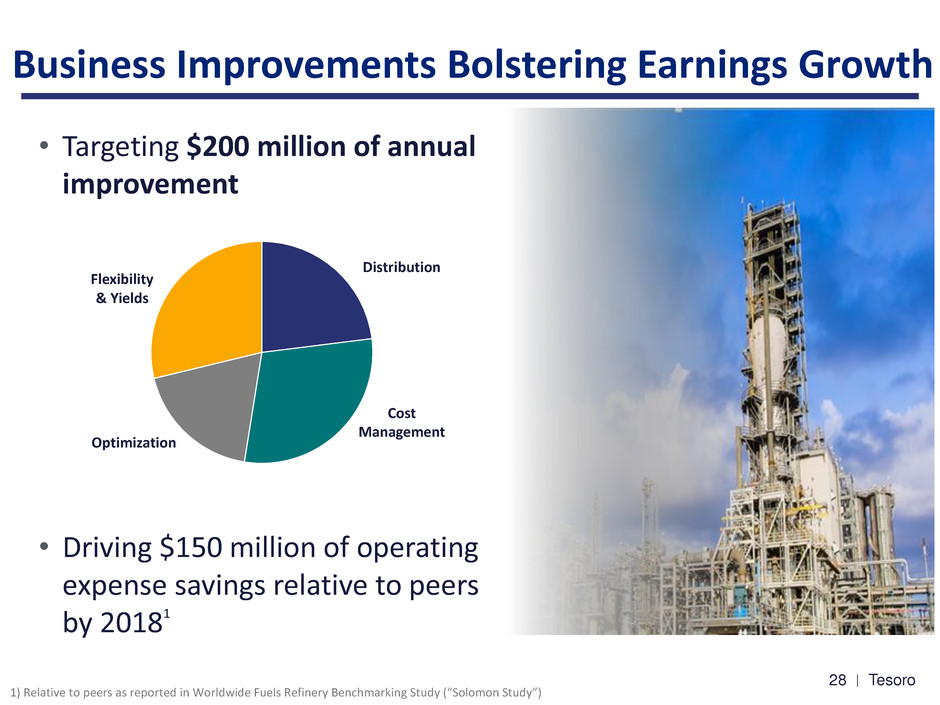
Tesoro 28 28 Business Improvements Bolstering Earnings Growth • Targeting $200 million of annual improvement • Driving $150 million of operating expense savings relative to peers by 20181 1) Relative to peers as reported in Worldwide Fuels Refinery Benchmarking Study (“Solomon Study”) Flexibility & Yields Distribution Optimization Cost Management

Tesoro 29 Performance Culture Driving Competitiveness 1) Peer average is Valero and Phillips 66, source financial filings • 2014 Solomon Study affirmed Tesoro Mid-Continent refineries “Best in Class” for Net Cash Margin • Study also affirmed Tesoro refinery system improvement; trajectory to “Top Quartile” in all areas • West Coast refining system continues to deliver more than $1 per barrel advantage in gross margin over peers1 High Performing Culture fostering improvements
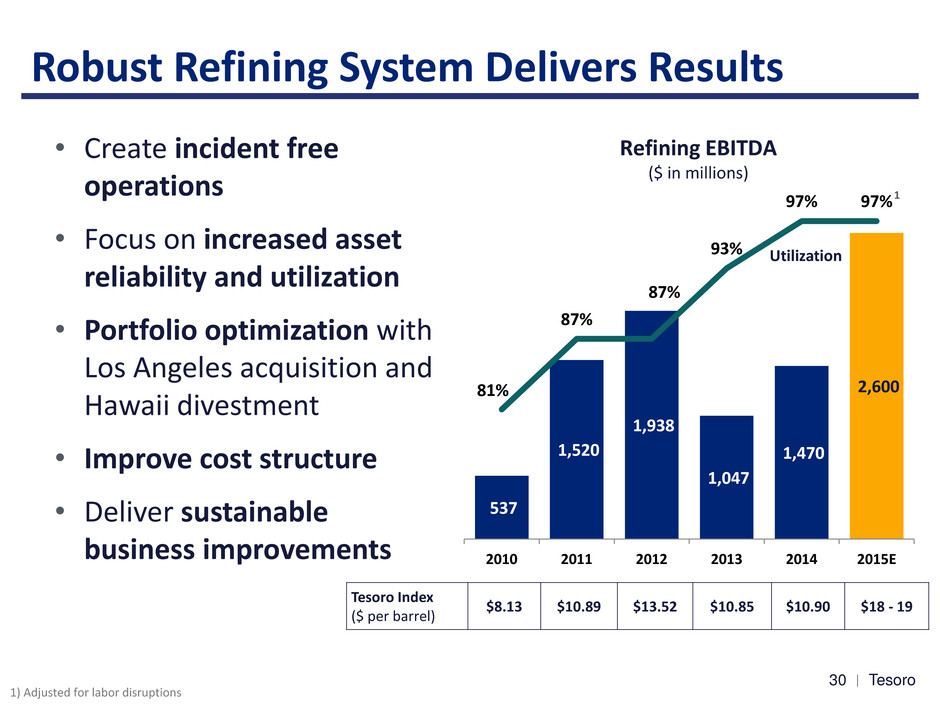
Tesoro 30 Robust Refining System Delivers Results • Create incident free operations • Focus on increased asset reliability and utilization • Portfolio optimization with Los Angeles acquisition and Hawaii divestment • Improve cost structure • Deliver sustainable business improvements 537 1,520 1,938 1,047 1,470 2,600 81% 87% 87% 93% 97% 97% 2010 2011 2012 2013 2014 2015E Refining EBITDA ($ in millions) 1 1) Adjusted for labor disruptions Utilization Tesoro Index ($ per barrel) $8.13 $10.89 $13.52 $10.85 $10.90 $18 - 19
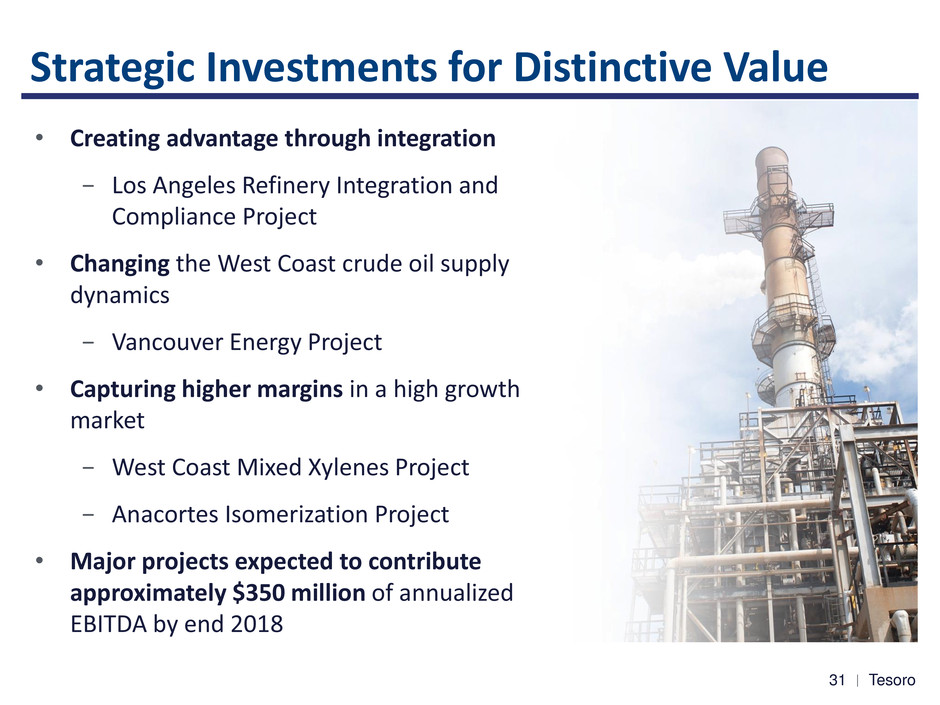
Tesoro 31 Strategic Investments for Distinctive Value 31 • Creating advantage through integration − Los Angeles Refinery Integration and Compliance Project • Changing the West Coast crude oil supply dynamics − Vancouver Energy Project • Capturing higher margins in a high growth market − West Coast Mixed Xylenes Project − Anacortes Isomerization Project • Major projects expected to contribute approximately $350 million of annualized EBITDA by end 2018

Tesoro 32 Creating Competitive Advantage at the Los Angeles Refinery Los Angeles Integration and Compliance Project • Completes full integration of Los Angeles Refinery • Provides 30 to 40 MBD of gasoline and distillate yield flexibility • Improves intermediate feedstock flexibility • CO2 emissions reduced over 300,000 tons annually 1 • Reduces NOx, SOx and CO emissions Estimated Project Details • Completion in mid-20172 • CAPEX $460 million • EBITDA $100 million • IRR 20%3 Enhancing West Coast competitive position 1) CO2 reduction associated with expected operations 2) Subject to permitting 3) Includes benefits from capital avoidance

Tesoro 33 Supplying Advantaged Crude Oil to the West Coast Vancouver Energy Project • Joint venture with Savage Companies • Up to 360 MBD Rail-to-Marine Terminal • Most efficient route to West Coast for Bakken crude oil • Significant infrastructure exists; low development cost Strategic Crude Supply • Increases West Coast competitive crude supply • Relative refining values of $3 to $5 per barrel Logistics Growth • Potential assets for offer to TLLP • Tesoro a major, dedicated customer • Significant third party revenue Estimated Project Details • Completion late 20171 • CAPEX $200 million2 • EBITDA $100 million3 • Tesoro IRR 40%+ 1) Subject to permitting 2) Tesoro and Savage capital expenditures 3) Tesoro expected EBITDA

Tesoro 34 Supplying Mixed Xylene to Asia Advantaged Optimization Advantaged Logistics Long term offtake Advantaged Feedstocks ASIA Tesoro US Gulf Coast N.Asia Average N.Asia Incremental Market price in Asia West Coast Mixed Xylene Project • Upgrading gasoline components to mixed xylene • Large and growing market in Asia • Transportation cost advantage relative to the Gulf Coast • Manufacturing cost advantage • New logistics business opportunity Estimated Project Details • Start-up mid -20181 • CAPEX $300 million • EBITDA $100 million • IRR 20% Relative Mixed Xylene Production Cost 1) Subject to permitting

Tesoro 35 Optimize Gasoline Production at Anacortes Isomerization Project at Anacortes Refinery • Reduces octane production costs • Efficiently meets Tier III sulfur requirements • Increases Mixed Xylenes production Estimated Project Details • Start-up mid-20181 • CAPEX $100 million • EBITDA $40 million • IRR 20% 1) Subject to permitting

© 2015 Tesoro Corporation. All Rights Reserved. Growing Logistics Phil Anderson President, Tesoro Logistics

Tesoro 37 Tesoro Logistics’ Competitive Advantage • Leading provider of logistics services to oil and gas producers and refining and marketing companies in strategic footprint • Tesoro’s strategy supports integration and drives high growth • Clear path to reach $1 billion of EBITDA by 2017 • Positioned to invest $1.2 - $1.5 billion of growth capital by 2018 • Pursuing acquisitions that fit integrated business model in proximity to strategic footprint

Tesoro 38 Asset Footprint Provides Unique Platform for Growth Key Metrics Crude oil, refined product and Natural gas pipelines 3,500+ miles Natural gas throughput capacity 2,900+ MMcf/d Natural gas inlet processing capacity 1,500+ MMcf/d Crude oil gathering pipeline throughput 190+ MBD Marketing terminal capacity 955+ MBD Marine terminal capacity 795 MBD Rail terminal capacity 50 MBD Dedicated storage capacity 9,200+ MBBLS Mandan, ND Los Angeles, CA Martinez, CA Kenai, AK Salt Lake City, UT Anacortes, WA

Tesoro 39 Track Record of Robust Value Creation EBITDA growth of 1,467%; distribution growth of 122% 1) 2015 EBITDA is First Call EBITDA as of 12/3/15 1.35 3.00 2Q1 1 2Q1 2 2Q1 3 2Q1 4 2Q1 5 Distributions Per LP Unit ($ annualized) 2011 EBITDA $42 Million 2015E EBITDA $658 Million1 Natural Gas Gathering & Processing Terminalling & Transportation Crude Oil Gathering Terminalling & Transportation IPO Natural Gas Gathering & Processing Crude Oil Gathering Terminalling & Transportation

Tesoro 40 Strategic Framework to Drive Growth Focus on Stable, Fee-Based Business • Provide full-service logistics offering • Minimal commodity price exposure Optimize Existing Asset Base • Enhance operational efficiency and maximize asset utilization • Capture Tesoro volumes moving through non-TLLP assets • Expand third party business Pursue Organic Expansion Opportunities • Focus on low-risk, accretive growth projects • Invest to support Tesoro value chain optimization • Enhance and strengthen existing logistics system Grow through Strategic Acquisitions • Attractive opportunities in geographic footprint • Partner in Tesoro’s strategic growth • Capture full value of Tesoro’s logistics assets

Tesoro 41 Distinctive Growth Strategy $ in millions 2015E 2016E 2017E 2018E Organic Growth and Optimization Gathering 240 - 250 275 - 290 305 - 335 350 - 390 Processing 155 - 160 155 - 170 165 - 185 180 - 200 Terminalling and Transportation 300 - 305 365 - 375 380 - 405 400 - 425 Total1 695 - 715 795 - 835 850 - 925 930 - 1,015 Drop Downs from Tesoro N/A 60 - 70 165 - 175 220 - 240 Total EBITDA2 650 - 660 815 - 855 970 - 1,050 1,100 - 1,200 Clear path to $1 billion in 2017 driven by organic growth and drop downs 1) Sub-total segment EBITDA excludes general & administrative expenses that are not allocated to each segment or drop downs from Tesoro 2) Total expected EBITDA includes general & administrative expenses that are not allocated to each segment or drop downs from Tesoro

Tesoro 42 Gathering and Processing Growth Outlook • Capture integrated crude oil and natural gas opportunities across mid- continent basins • Targeting to grow EBITDA by $150 million by 2018 • Expand Bakken gathering and aggregation system • Enhance Rockies natural gas volume capture 42 395 - 410 530 - 590 2011 2012 2013 2014 2015E 2016E 2017E 2018E EBITDA Outlook ($ in millions)
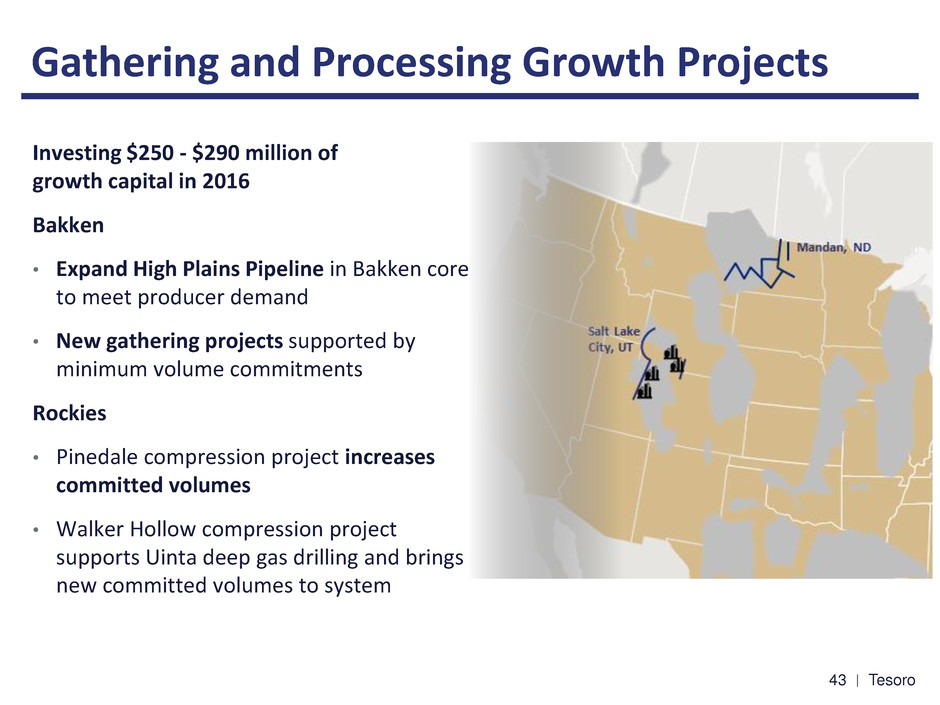
Tesoro 43 Gathering and Processing Growth Projects Investing $250 - $290 million of growth capital in 2016 Bakken • Expand High Plains Pipeline in Bakken core to meet producer demand • New gathering projects supported by minimum volume commitments Rockies • Pinedale compression project increases committed volumes • Walker Hollow compression project supports Uinta deep gas drilling and brings new committed volumes to system

Tesoro 44 Terminalling and Transportation Growth Outlook • Capture growing market demand and Tesoro-driven infrastructure projects • Targeting organic EBITDA growth of $100 - $120 million by 2018 • Investing $400 - $600 million through 2018 300 - 305 400 - 425 2011 2012 2013 2014 2015E 2016E 2017E 2018E EBITDA Outlook ($ in millions) Low commodity price environment supports strong demand growth

Tesoro 45 Terminalling and Transportation Growth Projects Investing $150 - $160 million of growth capital in 2016 Terminalling: • Capture growth from expansion of Mandan, Stockton, Pasco and Anacortes product terminals • Salt Lake City rail access and services expansion • Crude storage expansion in Southern California Transportation Pipelines: • Los Angeles Refinery Interconnect Pipeline system • Expand Northwest Product System capacity and services • Biofuel services

Tesoro 46 Organic Investment Drives EBITDA Growth 46 Note: All capital spend is gross of any Tesoro reimbursements 275 - 300 690 - 740 2015E 2016E 2017E 2018E 100 - 120 155 - 210 235 - 300 2016E 2017E 2018E 1,090 - 1,190 1,490 - 1,640 Targeting projects with at least 15% IRR Cumulative Growth Capital Spend ($ in millions) Cumulative Expected EBITDA Growth ($ in millions)

Tesoro 47 Future Drop Downs to Capture Additional Value 47 Growing inventory of drop downs drive $500 - $800 million of new growth • Marine terminals • Crude oil pipelines • Refinery tank terminals • Rail terminals • Petroleum coke handling • Refined products distribution terminals • Refined products pipelines • Rail and truck unloading terminals • Wholesale distribution system $350 - $550 million of Earnings from Existing Assets $150 - $250 million of Earnings from New Business Investments • Bakken pipeline & rail • Mixed xylenes logistics infrastructure • Vancouver Energy • Distribution expansion in support of Marketing growth • Alaska logistics
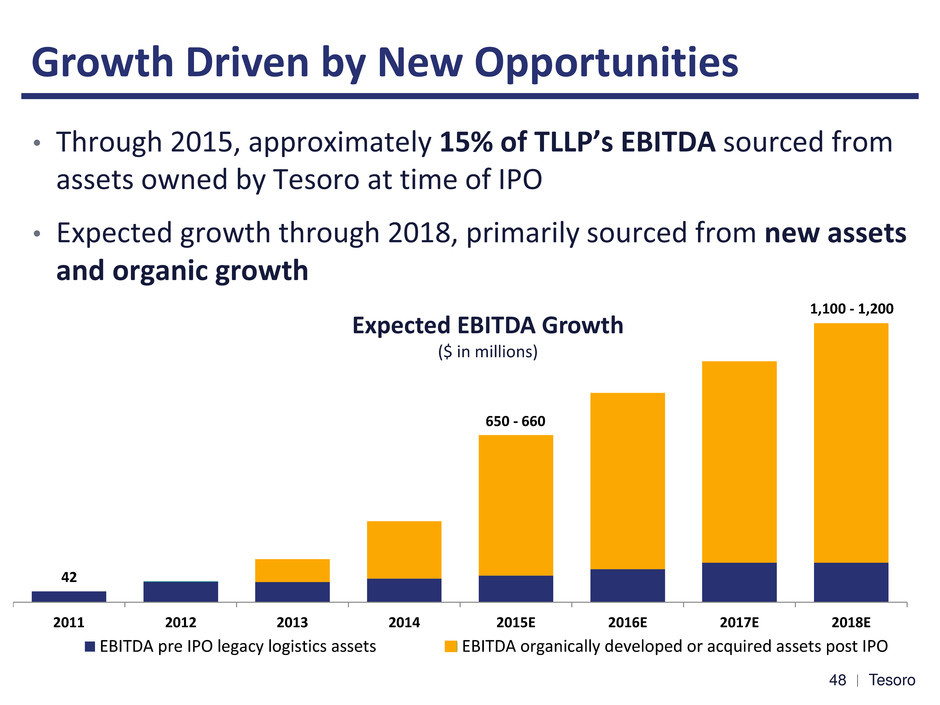
Tesoro 48 • Through 2015, approximately 15% of TLLP’s EBITDA sourced from assets owned by Tesoro at time of IPO • Expected growth through 2018, primarily sourced from new assets and organic growth 48 2011 2012 2013 2014 2015E 2016E 2017E 2018E EBITDA pre IPO legacy logistics assets EBITDA organically developed or acquired assets post IPO 42 650 - 660 1,100 - 1,200 Growth Driven by New Opportunities Expected EBITDA Growth ($ in millions)

Tesoro 49 Strategic Approach to Acquisitions • Principally focused on Tesoro’s strategic footprint • Expanding acquisition horizon to include adjacent geographies • Pursuing opportunities that provide Tesoro access to advantaged feedstocks and new markets • Participating in Tesoro-driven acquisitions that include embedded logistics assets • Continuing to reduce Tesoro’s third party logistics costs • Continuing to diversify revenue from third parties
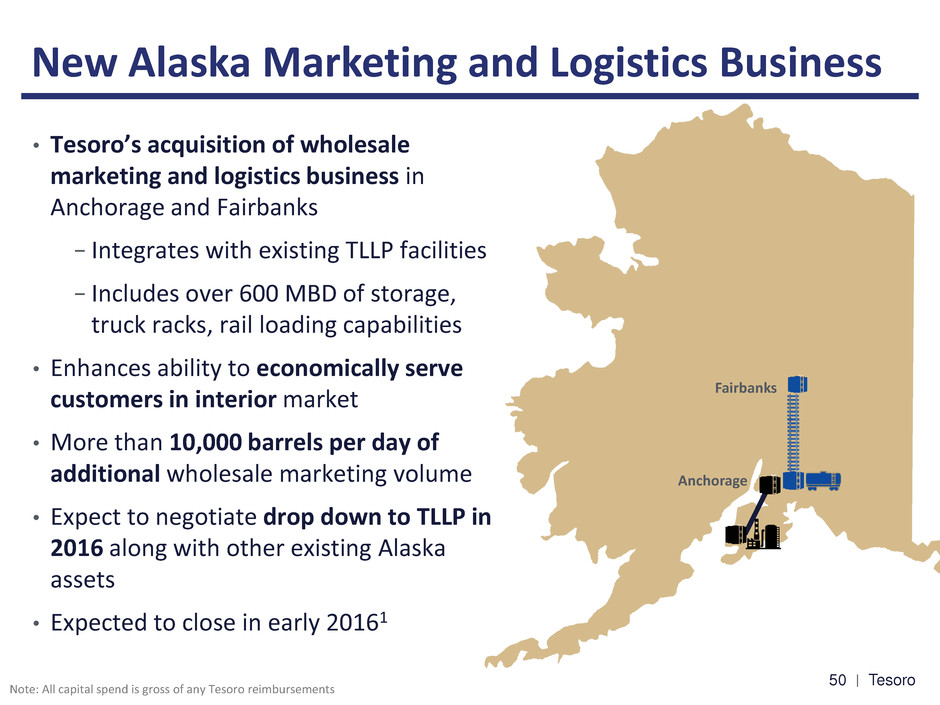
Tesoro 50 New Alaska Marketing and Logistics Business • Tesoro’s acquisition of wholesale marketing and logistics business in Anchorage and Fairbanks − Integrates with existing TLLP facilities − Includes over 600 MBD of storage, truck racks, rail loading capabilities • Enhances ability to economically serve customers in interior market • More than 10,000 barrels per day of additional wholesale marketing volume • Expect to negotiate drop down to TLLP in 2016 along with other existing Alaska assets • Expected to close in early 20161 Fairbanks Anchorage Note: All capital spend is gross of any Tesoro reimbursements

Tesoro 51 Acquisition of Great Northern Midstream • Tesoro acquiring Bakken crude oil gathering and transportation pipelines, storage and rail loading terminal • Provides Tesoro West Coast facilities with cost-effective access to advantaged crude • Integrates with TLLP assets, creating enhanced delivery options for producers • Expected to close early 2016 • Plan to offer drop down to TLLP late 2016 after restructuring Canada North Dakota Montana BASH Facility Tesoro High Plains Pipeline BakkenLink Pipeline Bakken Core Area Fryburg Rail Terminal

Tesoro 52 Continuing to Drive Unitholder Value 52 Well-Positioned Assets Attractive, Visible Growth Opportunities Experienced Management Team Strong Sponsorship Stable, Fee-Based Cash Flow 1
© 2015 Tesoro Corporation. All Rights Reserved. Creating Value through Marketing CJ Warner EVP, Strategy and Business Development
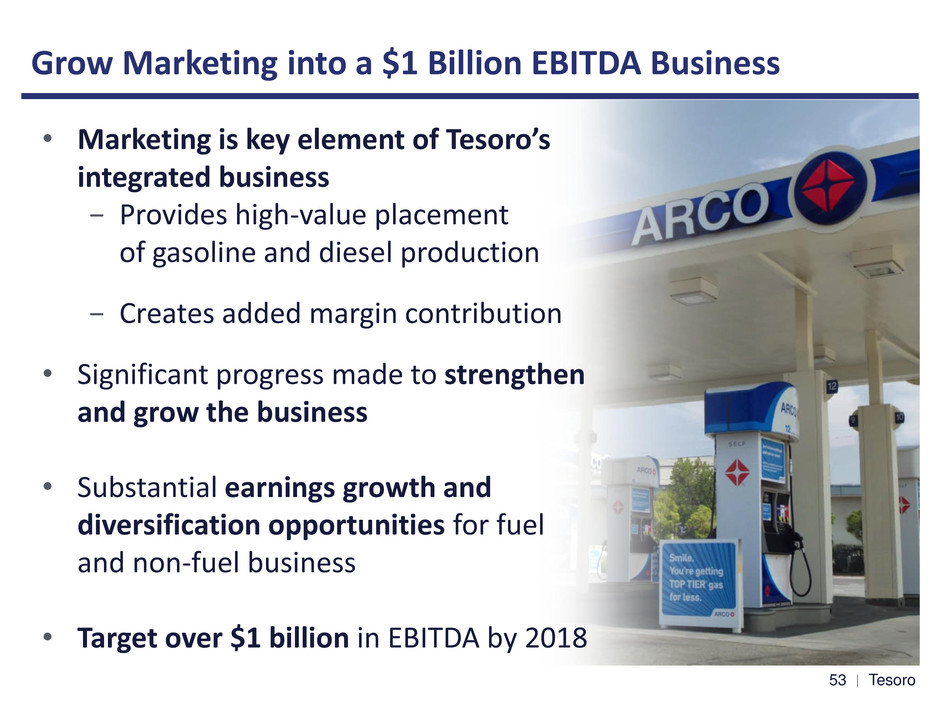
Tesoro 54 Grow Marketing into a $1 Billion EBITDA Business • Marketing is key element of Tesoro’s integrated business − Provides high-value placement of gasoline and diesel production − Creates added margin contribution • Significant progress made to strengthen and grow the business • Substantial earnings growth and diversification opportunities for fuel and non-fuel business • Target over $1 billion in EBITDA by 2018 3

Tesoro 55 Company Owned Retail Station Unbranded Wholesale Branded Wholesale Franchisee Owned Retail Marketing Margin Maximizing Integrated Value through Marketing Cu st ome r Fa ci n g Sp ot Sa le W h o les al e C rud e Cu st ome rs Marketing Integration supports high refining utilization Channel Optimization strengthens marketing margins • Provides a secure and ratable offtake • Enables refineries to optimize production schedules, run economically at maximum capacity • Minimizes product transportation costs by securing in-region placement Refining Margin 4

Tesoro 56 Tesoro Marketing Overview • We market fuel under premium brands and value brands • Distinctive multi-brand portfolio provides competitive advantage − Serves broader customer base − Fosters more rapid growth − Addresses regional customer preferences Pacific Northwest Site Count = 150 California Site Count = 1,500 Mandan, ND Salt Lake City, UT Anacortes, WA Martinez, CA Los Angeles, CA Mid-Continent Site Count = 650 5

Tesoro 57 Transforming Tesoro’s Marketing Business 281 900 2010 2015E EBITDA ($ in millions) Volume (MBD) • 2010 - 2012 – Expanded rights to Los Angeles and Mid-Continent – Acquired 175+ stations and re- branded to • 2013 - 2014 – acquisition added approximately 155 MBD of branded sales volume – convenience store offer added to portfolio – Acquired rights to and brands – Acquired 15 high value stations in Salt Lake City and converted to • 2015 – Acquired 15 high value sites in Southern California 2010 2015E 258 560 Branded Unbranded Unbranded Branded 6
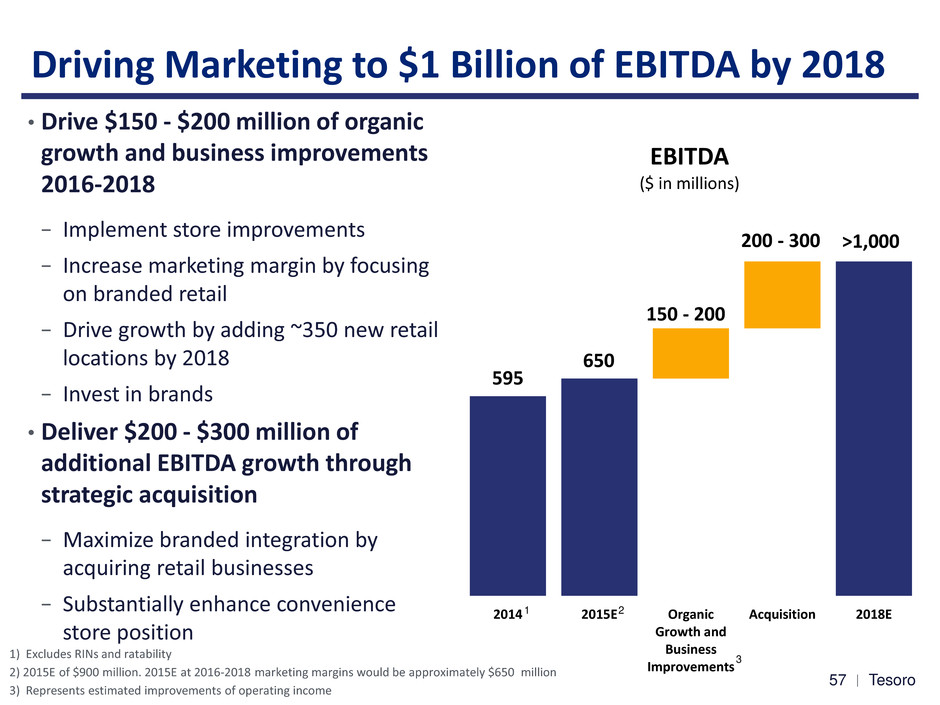
Tesoro 58 Driving Marketing to $1 Billion of EBITDA by 2018 • Drive $150 - $200 million of organic growth and business improvements 2016-2018 − Implement store improvements − Increase marketing margin by focusing on branded retail − Drive growth by adding ~350 new retail locations by 2018 − Invest in brands • Deliver $200 - $300 million of additional EBITDA growth through strategic acquisition − Maximize branded integration by acquiring retail businesses − Substantially enhance convenience store position 2014 2015E Organic Growth and Business Improvements Acquisition 2018E EBITDA ($ in millions) >1,000 200 - 300 150 - 200 650 595 3 1) Excludes RINs and ratability 2) 2015E of $900 million. 2015E at 2016-2018 marketing margins would be approximately $650 million 3) Represents estimated improvements of operating income 2 1 7
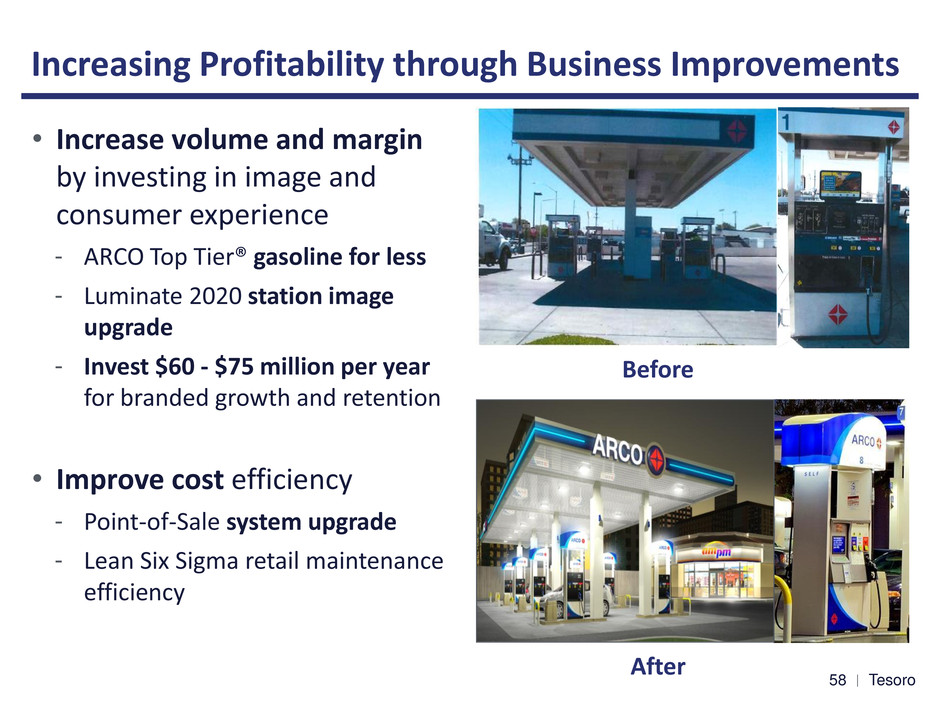
Tesoro 59 59 Increasing Profitability through Business Improvements • Increase volume and margin by investing in image and consumer experience - ARCO Top Tier® gasoline for less - Luminate 2020 station image upgrade - Invest $60 - $75 million per year for branded growth and retention • Improve cost efficiency - Point-of-Sale system upgrade - Lean Six Sigma retail maintenance efficiency Before After 8
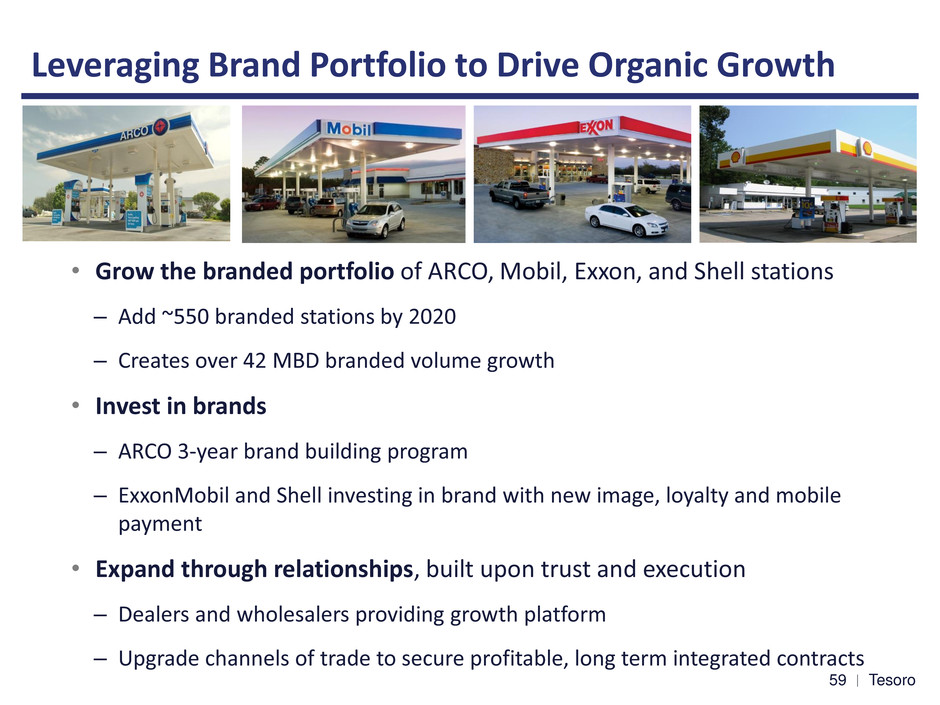
Tesoro 60 60 Leveraging Brand Portfolio to Drive Organic Growth • Grow the branded portfolio of ARCO, Mobil, Exxon, and Shell stations – Add ~550 branded stations by 2020 – Creates over 42 MBD branded volume growth • Invest in brands – ARCO 3-year brand building program – ExxonMobil and Shell investing in brand with new image, loyalty and mobile payment • Expand through relationships, built upon trust and execution – Dealers and wholesalers providing growth platform – Upgrade channels of trade to secure profitable, long term integrated contracts 59
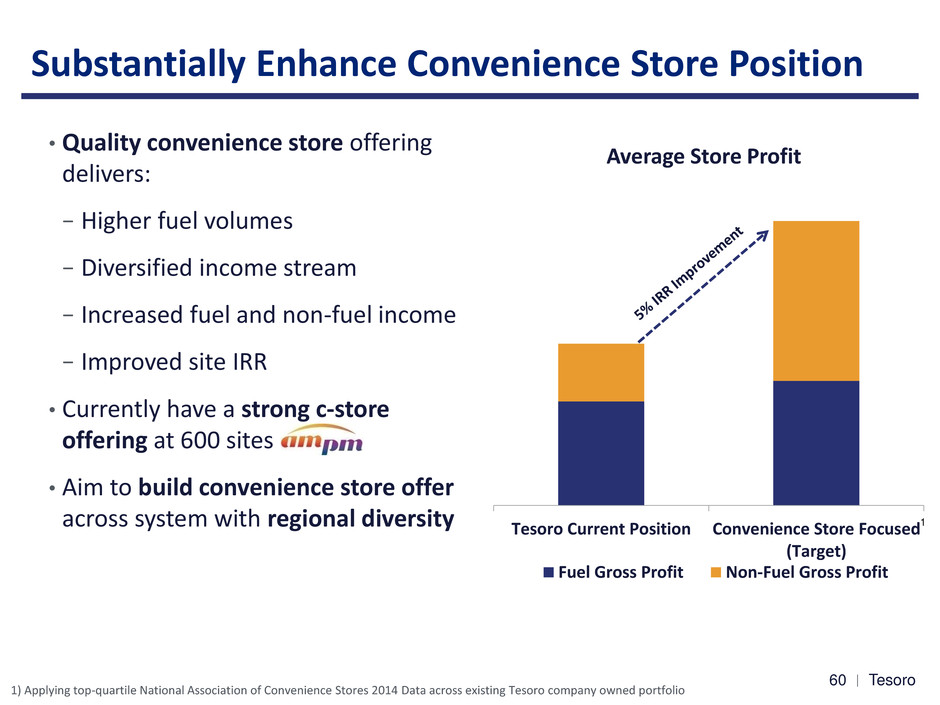
Tesoro 61 Substantially Enhance Convenience Store Position • Quality convenience store offering delivers: − Higher fuel volumes − Diversified income stream − Increased fuel and non-fuel income − Improved site IRR • Currently have a strong c-store offering at 600 sites under • Aim to build convenience store offer across system with regional diversity Tesoro Current Position Convenience Store Focused (Target) Fuel Gross Profit Non-Fuel Gross Profit Average Store Profit 1 1) Applying top-quartile National Association of Convenience Stores 2014 Data across existing Tesoro company owned portfolio 0

Tesoro 62 • Grow retail business through acquisition − Improve branded integration and margin capture − Additional product sales from third party volumes • Prioritize acquisitions of retail with strong convenience offer • Target channel and brand strategy by region − Customer preference and channel profitability varies by region and segment Accelerate Retail Growth with Acquisitions 87 280 400 2010 2015E 2018E 880 2,300 3,800 2010 2015E 2018E Branded Volume (MBD) Retail Site Count 1

Tesoro 63 Marketing is a Platform for Growth • Target over $1 billion in EBITDA by 2018 − Organic growth and business improvement − Significantly expanded convenience store − Accelerated growth through acquisitions • Implementation creates a platform for growth − Larger scale fosters increased brand success and associated growth − Ownership of retail/convenience offer enables: • Rapid response to consumer trends and preferences • Leadership through innovation 2
© 2015 Tesoro Corporation. All Rights Reserved. Financial Overview Steven Sterin EVP, Chief Financial Officer
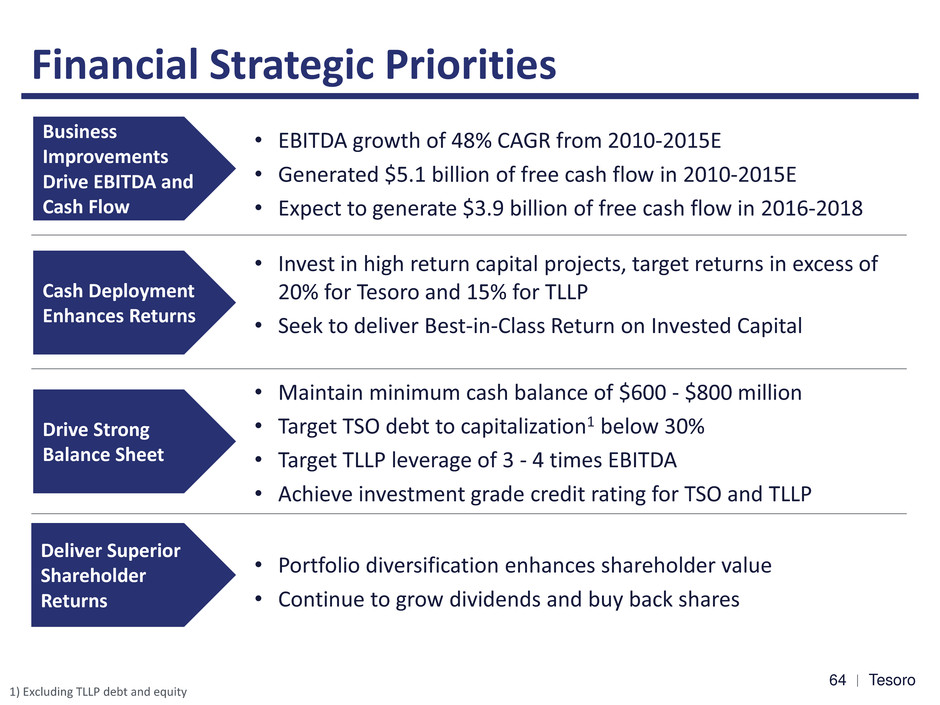
Tesoro 65 65 Financial Strategic Priorities Business Improvements Drive EBITDA and Cash Flow • EBITDA growth of 48% CAGR from 2010-2015E • Generated $5.1 billion of free cash flow in 2010-2015E • Expect to generate $3.9 billion of free cash flow in 2016-2018 Drive Strong Balance Sheet • Maintain minimum cash balance of $600 - $800 million • Target TSO debt to capitalization1 below 30% • Target TLLP leverage of 3 - 4 times EBITDA • Achieve investment grade credit rating for TSO and TLLP Deliver Superior Shareholder Returns • Portfolio diversification enhances shareholder value • Continue to grow dividends and buy back shares 1) Excluding TLLP debt and equity Cash Deployment Enhances Returns • Invest in high return capital projects, target returns in excess of 20% for Tesoro and 15% for TLLP • Seek to deliver Best-in-Class Return on Invested Capital 4
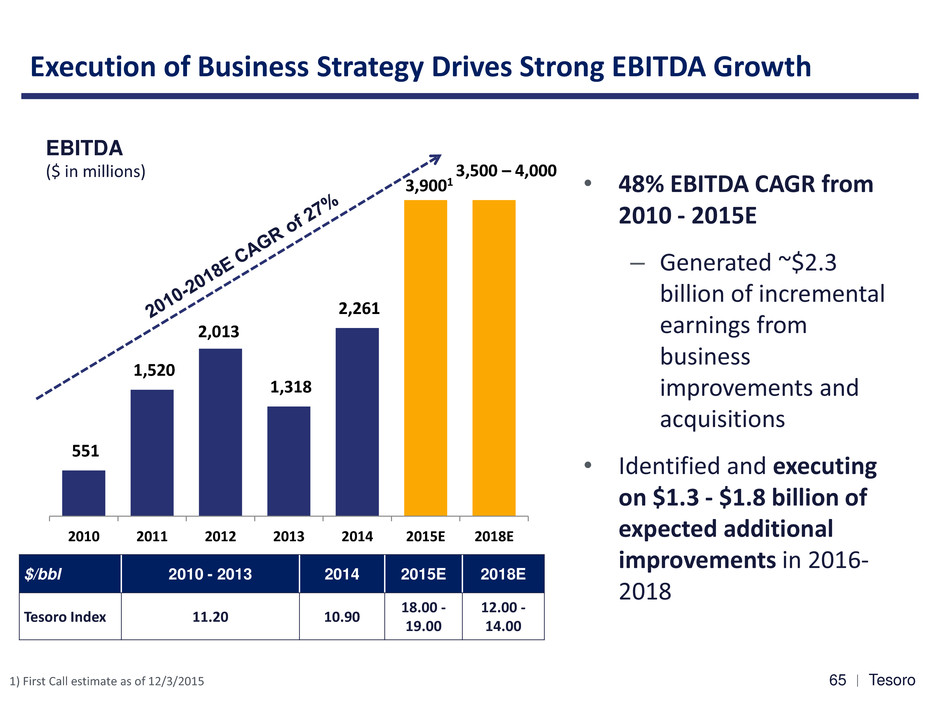
Tesoro 66 551 1,520 2,013 1,318 2,261 2010 2011 2012 2013 2014 2015E 2018E 66 Execution of Business Strategy Drives Strong EBITDA Growth • 48% EBITDA CAGR from 2010 - 2015E – Generated ~$2.3 billion of incremental earnings from business improvements and acquisitions • Identified and executing on $1.3 - $1.8 billion of expected additional improvements in 2016- 2018 EBITDA ($ in millions) $/bbl 2010 - 2013 2014 2015E 2018E Tesoro Index 11.20 10.90 18.00 - 19.00 12.00 - 14.00 1) First Call estimate as of 12/3/2015 3,9001 3,500 – 4,000 5
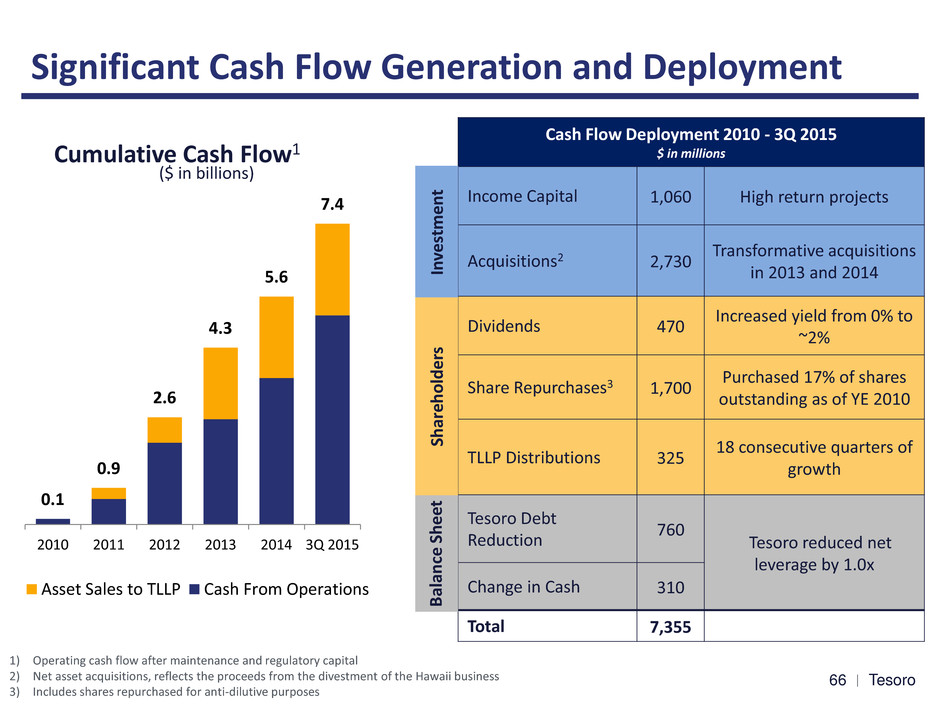
Tesoro 67 67 Significant Cash Flow Generation and Deployment Cash Flow Deployment 2010 - 3Q 2015 $ in millions Income Capital 1,060 High return projects Acquisitions2 2,730 Transformative acquisitions in 2013 and 2014 Dividends 470 Increased yield from 0% to ~2% Share Repurchases3 1,700 Purchased 17% of shares outstanding as of YE 2010 TLLP Distributions 325 18 consecutive quarters of growth Tesoro Debt Reduction 760 Tesoro reduced net leverage by 1.0x Change in Cash 310 Total 7,355 0.1 0.9 2.6 4.3 5.6 7.4 2010 2011 2012 2013 2014 3Q 2015 Asset Sales to TLLP Cash From Operations Cumulative Cash Flow1 ($ in billions) 1) Operating cash flow after maintenance and regulatory capital 2) Net asset acquisitions, reflects the proceeds from the divestment of the Hawaii business 3) Includes shares repurchased for anti-dilutive purposes In ve st me n t Sh ar eh o ld e rs B al an ce She et 6

Tesoro 68 68 Narrowing Gap in ROIC Relative to Peers Source: Public filings 1) Peers include HFC and VLO 2) Peers include HFC, MPC and VLO 3) Peers include HFC, MPC, PSX and VLO 4) 2015 YTD annualized Return on Invested Capital (%) • Substantial improvements in ROIC relative to peers driven by: – High return organic projects – Business improvements – Los Angeles refinery and Rockies natural gas business acquisitions – Logistics and Marketing growth 2.8 11.7 16.8 6.5 9.8 18.2 6.6 17.5 19.4 11.8 11.4 16.0 2010 2011 2012 2013 2014 2015 TSO Peers 1 2 3 3 3 3,4 7

Tesoro 69 69 Cash Generation and Investment Outlook • Cumulative Cash Generation −$3.9 billion of free cash flow expected from 2016 – 20181 −$850 million from asset sales to TLLP • $3.7 billion of cumulative excess cash by 2018, after funding identified income capital projects −Continue to allocate cash consistent with priorities: • High return capital projects • Continue to grow dividends and repurchase shares • Maintain a strong balance sheet 1) Cash flow after maintenance and regulatory capital 2) Represents 50% of proceeds – cash only Cumulative Cash Generation Outlook ($ in millions) Cumulative Income Capital Outlook - TSO ($ in millions) 1,400 2,850 4,750 2016E 2017E 2018E Free Cash Flow Asset Sales to TLLP2 430 960 1,090 2016E 2017E 2018E Investment Shareholders Balance Sheet 8

Tesoro 70 • Target TSO debt to capitalization1 below 30% and TLLP leverage of 3 – 4 times • Average cost of debt at Tesoro is 4.9% with a duration of 8.2 years2 • Average cost of debt at TLLP is 5.4% with a duration of 6.8 years2 70 Maintaining a Strong Balance Sheet 1) Excluding TLLP debt and equity 2) Cost of debt is pre-tax and issuance duration is weighted average 3) Debt to capitalization ratio excludes TLLP total debt and non-controlling interest 4) As defined in TLLP’s Credit Agreement (Pro Forma) Debt Debt / Capitalization3 Debt Debt / EBITDA 4 0% 5% 10% 15% 20% 25% 30% 35% 40% $0.0 $1.0 $2.0 $3.0 2010 2011 2012 2013 2014 2015YTD Th o u sa n d s Tesoro 0.0 1.0 2.0 3.0 4.0 5.0 $0.0 $2.0 $4.0 2011 2012 2013 2014 2015YTD Th o u sa n d s TLLP Target < 30% Target 3x-4x EBITDA Debt to Capitalization Debt to EBITDA ($ in billions) ($ in billions) 69
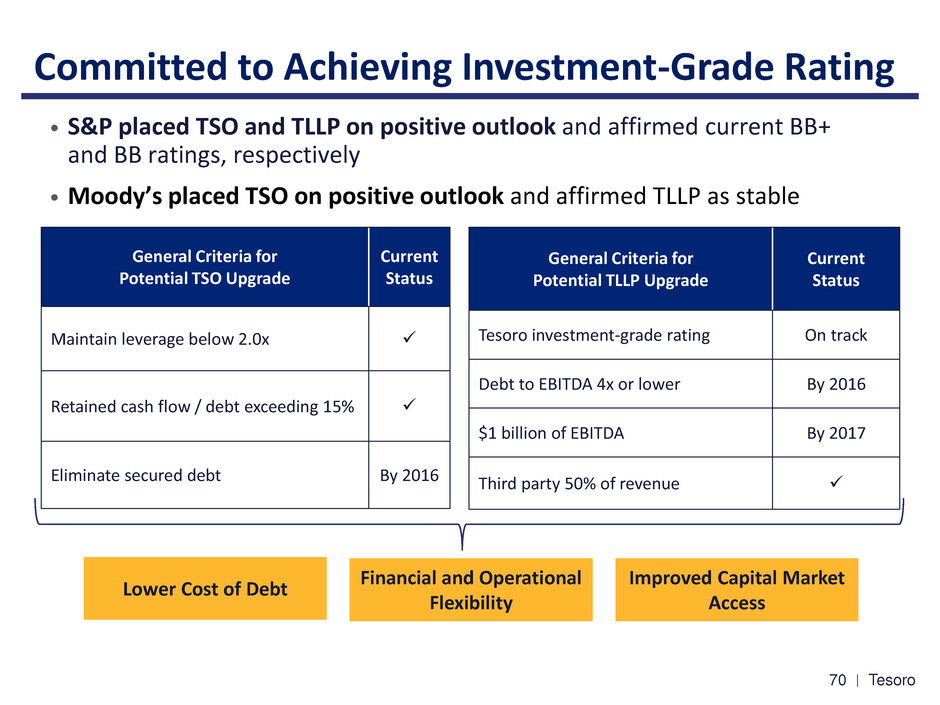
Tesoro 71 Committed to Achieving Investment-Grade Rating • S&P placed TSO and TLLP on positive outlook and affirmed current BB+ and BB ratings, respectively • Moody’s placed TSO on positive outlook and affirmed TLLP as stable General Criteria for Potential TSO Upgrade Current Status Maintain leverage below 2.0x Retained cash flow / debt exceeding 15% Eliminate secured debt By 2016 General Criteria for Potential TLLP Upgrade Current Status Tesoro investment-grade rating On track Debt to EBITDA 4x or lower By 2016 $1 billion of EBITDA By 2017 Third party 50% of revenue Lower Cost of Debt Improved Capital Market Access Financial and Operational Flexibility 0

Tesoro 72 72 Significant Benefits of Achieving Investment-Grade Rating Financial & Operational Flexibility • Ability to extend debt maturities • Fewer restrictive covenants and better commercial terms • Access to commercial paper market Improved Capital Market Access • Stability of investment grade market • Greater liquidity and pool of investors Lower Cost of Debt • Lower relative debt spreads 150 - 200 bps1 • Potential interest cost savings of $80 - $105 million2 1) Based on historical trading level spreads between BBB and BB bonds 2) $20 – $25 million at TSO and $60 – $80 million at TLLP 1
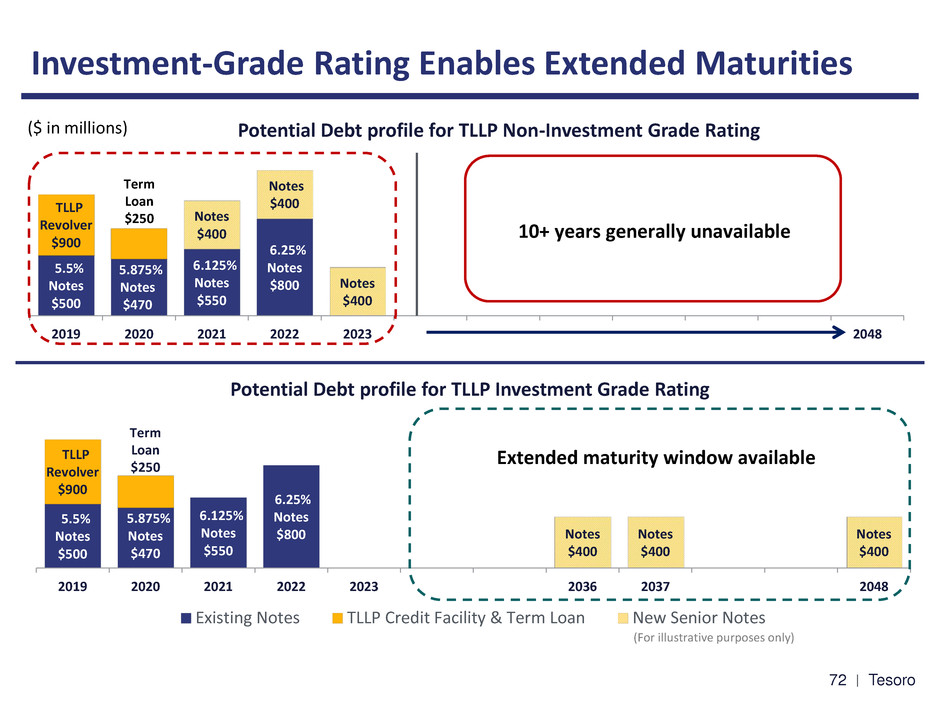
Tesoro 73 5.875% Notes $470 6.125% Notes $550 6.25% Notes $800 5.5% Notes $500 TLLP Revolver $900 Notes $400 Notes $400 Notes $400 2019 2020 2021 2022 2023 2024 2025 2026 2027 2028 2029 2048 10+ years generally unavailable Term Loan $250 Investment-Grade Rating Enables Extended Maturities 5.875% Notes $470 6.125% Notes $550 6.25% Notes $800 5.5% Notes $500 TLLP Revolver $900 Notes $400 Notes $400 Notes $400 2019 2020 2021 2022 2023 2024 2025 2036 2037 2046 2047 2048 Existing Notes TLLP Credit Facility & Term Loan New Senior Notes Extended maturity window available ($ in millions) Term Loan $250 Potential Debt profile for TLLP Non-Investment Grade Rating Potential Debt profile for TLLP Investment Grade Rating (For illustrative purposes only) 2
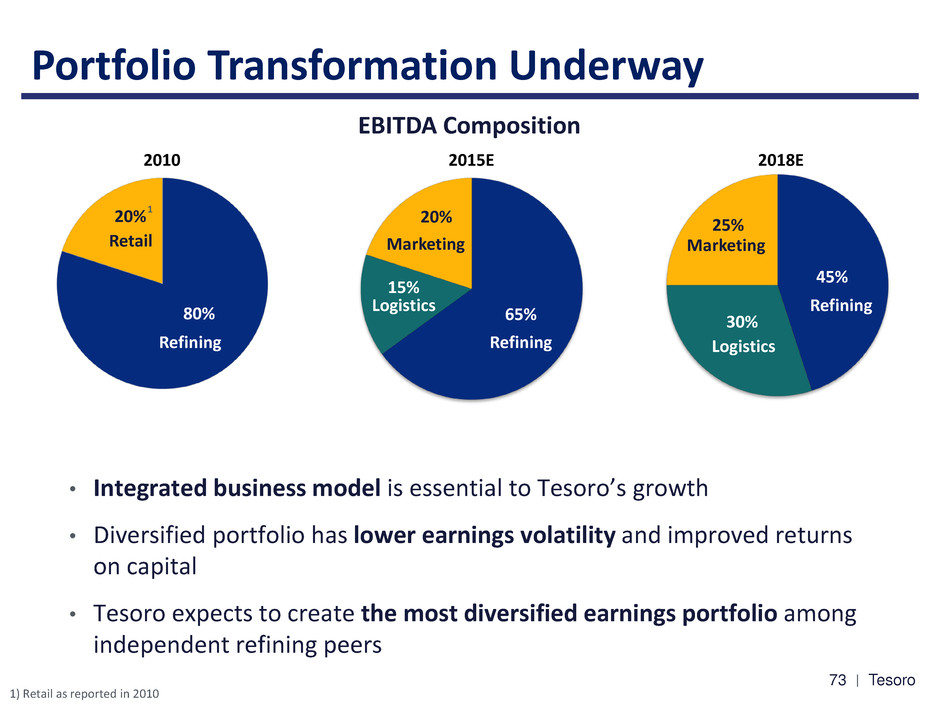
Tesoro 74 • Integrated business model is essential to Tesoro’s growth • Diversified portfolio has lower earnings volatility and improved returns on capital • Tesoro expects to create the most diversified earnings portfolio among independent refining peers 74 Portfolio Transformation Underway EBITDA Composition 25% 15% 25% 80% 20% 2015E 2018E 2010 65% 15% 20% 1 1) Retail as reported in 2010 Refining Refining Retail Marketing Logistics Logistics 45% 30% 25% Logistics Marketing Refining 3

Tesoro 75 75 Tesoro Logistics Implied Value to TSO 4Q Annualized GP Distributions ($ in millions) GP Cash Multiple1 Total Value of TLLP ($ in millions) Implied Value Per TSO Share 1) LP value based on market price and GP value based on 35x distributions. General partner value estimated using a range of Wall Street Incentive Distribution Rights (IDR) market multiples for publicly traded GP holding companies and does not necessarily reflect the appropriate multiple for GP. The multiple is applied to the annualized 4Q IDR distributions to the GP. LP unit price as of 11/30/2015. LP Units Owned Unit Price1 $44 $52 $59 $50 2012 2013 2014 2015ECurrent 6 22 65 99 2012 2013 2014 2015E 17 19 28 32 2012 2013 2014 2015E 2012 2013 2014 2015E $7 $13 $31 $41 30 - 40x 920 1,769 3,942 5,080 2012 2013 2014 2015E 4
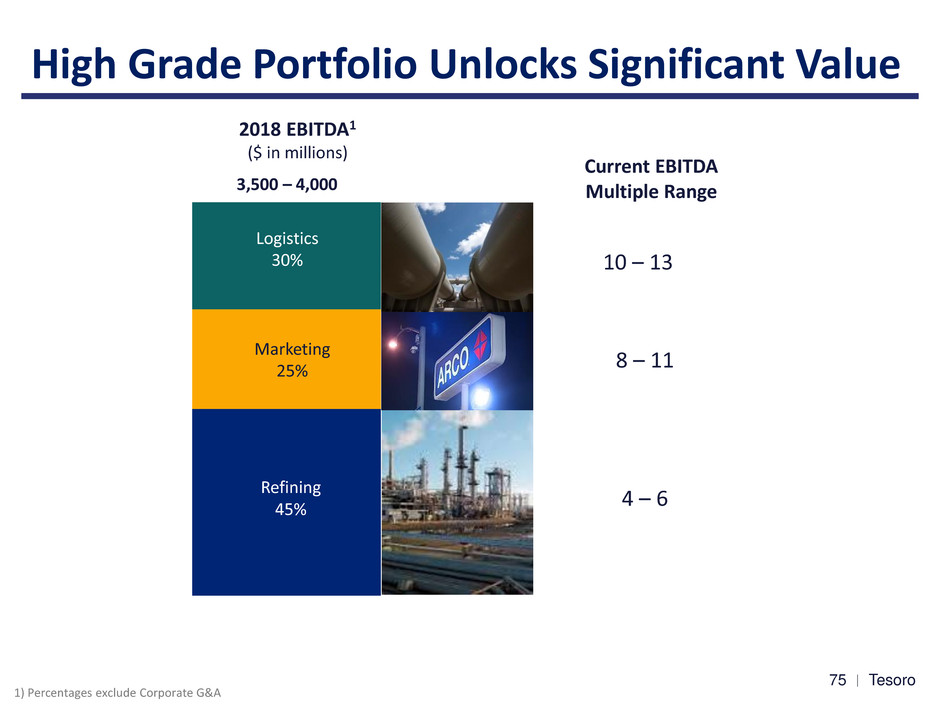
Tesoro 76 High Grade Portfolio Unlocks Significant Value 4 – 6 8 – 11 10 – 13 Current EBITDA Multiple Range 1) Percentages exclude Corporate G&A 2018 EBITDA1 ($ in millions) Logistics 30% Marketing 25% Refining 45% 3,500 – 4,000 5

Tesoro 77 77 Best-in-Class Shareholder Value Creation • Distinctive business improvements create significant shareholder value • Balanced approach among growth initiatives, strengthening the balance sheet and returning cash to shareholders • Continue to drive dividend growth - ~67% increase over past year • Active share repurchase program - $1.5 billion repurchased since 2012 - Current authorization outstanding of $1.5 billion2 Value Proposition to Equity Shareholders Dividends, Share Repurchases and Share Price Appreciation Since 1/1/20131 1) Dividends, repurchases and share price appreciation from 1/1/2013 to 9/30/2015; total dividends and repurchases as a percentage of beginning of period equity value 2) As of 9/30/2015 7% 9% 7% 8% 16% 23% 20% 27% 17% 9% 121% 76% 47% 45% 14% TSO VLO MPC PSX HFC Dividends Share Repurchaes Share Price AppreciationShare Repurchases 6

© 2015 Tesoro Corporation. All Rights Reserved. Driven to Create Value Greg Goff Chairman and CEO

79 HIGH PERFORMING COMPANY OPERATIONAL EFFICIENCY & EFFECTIVENESS COMMERCIAL EXCELLENCE FINANCIAL DISCIPLINE VALUE – DRIVEN GROWTH H igh P e rf ormi n g Cult u re Vision: Everyday we create a safer and cleaner future as efficient providers of reliable transportation fuel solutions 78
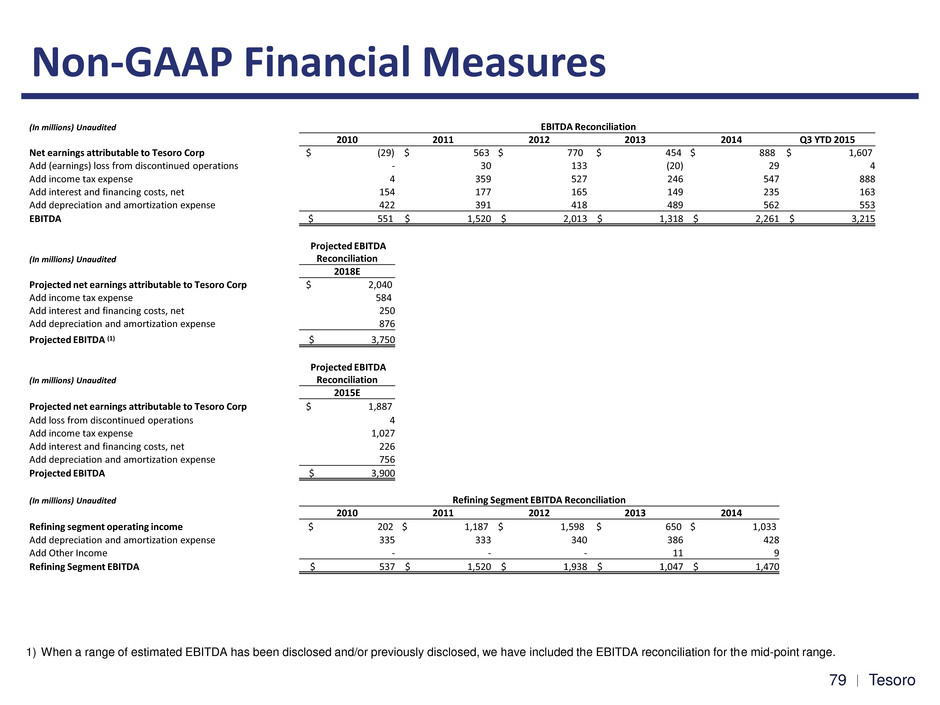
Tesoro 80 Non-GAAP Financial Measures 1) When a range of estimated EBITDA has been disclosed and/or previously disclosed, we have included the EBITDA reconciliation for the mid-point range. (In millions) Unaudited EBITDA Reconciliation 2010 2011 2012 2013 2014 Q3 YTD 2015 Net earnings attributable to Tesoro Corp $ (29) $ 563 $ 770 $ 454 $ 888 $ 1,607 Add (earnings) loss from discontinued operations - 30 133 (20) 29 4 Add income tax expense 4 359 527 246 547 888 Add interest and financing costs, net 154 177 165 149 235 163 Add depreciation and amortization expense 422 391 418 489 562 553 EBITDA $ 551 $ 1,520 $ 2,013 $ 1,318 $ 2,261 $ 3,215 (In millions) Unaudited Projected EBITDA Reconciliation 2018E Projected net earnings attributable to Tesoro Corp $ 2,040 Add income tax expense 584 Add interest and financing costs, net 250 Add depreciation and amortization expense 876 Projected EBITDA (1) $ 3,750 (In millions) Unaudited Projected EBITDA Reconciliation 2015E Projected net earnings attributable to Tesoro Corp $ 1,887 Add loss from discontinued operations 4 Add income tax expense 1,027 Add interest and financing costs, net 226 Add depreciation and amortization expense 756 Projected EBITDA $ 3,900 (In millions) Unaudited Refining Segment EBITDA Reconciliation 2010 2011 2012 2013 2014 Refining segment operating income $ 202 $ 1,187 $ 1,598 $ 650 $ 1,033 Add depreciation and amortization expense 335 333 340 386 428 Add Other Income - - - 11 9 Refining Segment EBITDA $ 537 $ 1,520 $ 1,938 $ 1,047 $ 1,470 79
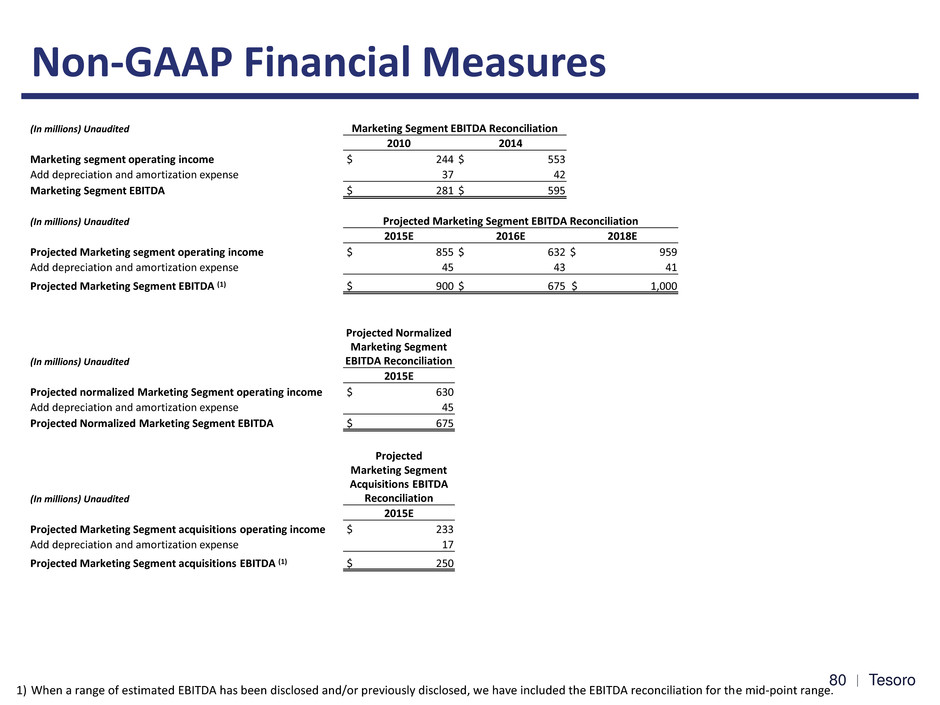
Tesoro 81 Non-GAAP Financial Measures 1) When a range of estimated EBITDA has been disclosed and/or previously disclosed, we have included the EBITDA reconciliation for the mid-point range. (In millions) Unaudited Marketing Segment EBITDA Reconciliation 2010 2014 Marketing segment operating income $ 244 $ 553 Add depreciation and amortization expense 37 42 Marketing Segment EBITDA $ 281 $ 595 (In millions) Unaudited Projected Marketing Segment EBITDA Reconciliation 2015E 2016E 2018E Projected Marketing segment operating income $ 855 $ 632 $ 959 Add depreciation and amortization expense 45 43 41 Projected Marketing Segment EBITDA (1) $ 900 $ 675 $ 1,000 (In millions) Unaudited Projected Normalized Marketing Segment EBITDA Reconciliation 2015E Projected normalized Marketing Segment operating income $ 630 Add depreciation and amortization expense 45 Projected Normalized Marketing Segment EBITDA $ 675 (In millions) Unaudited Projected Marketing Segment Acquisitions EBITDA Reconciliation 2015E Projected Marketing Segment acquisitions operating income $ 233 Add depreciation and amortization expense 17 Projected Marketing Segment acquisitions EBITDA (1) $ 250 0

Tesoro 82 Non-GAAP Financial Measures 1) When a range of estimated EBITDA has been disclosed and/or previously disclosed, we have included the EBITDA reconciliation for the mid-point range 2) TLLP EBITDA is not representative of Tesoro consolidated EBITDA as intercompany transactions between TLLP and Tesoro are eliminated upon consolidation 3) For the purposes of the Gathering, Processing, and Terminalling & Transportation segments, interest expense is only recorded at a consolidated level and is excluded from these reconciliations 4) Consolidated projected EBITDA total includes general & administrative expenses that are not allocated to each segment or drop downs from Tesoro (In millions) Unaudited Projected Annual EBITDA LA Refinery Integration and Compliance Project Vancouver Energy Mixed Xylene Isomerization Other Projects Total Projected net earnings $ 52 $ 59 $ 56 $ 22 $ 5 $ 195 Add income tax expense 32 36 34 14 3 119 Add depreciation and amortization expense 16 5 10 4 2 36 Projected EBITDA $ 100 $ 100 $ 100 $ 40 $ 10 $ 350 (In millions) Unaudited TLLP EBITDA(2) Reconciliation 2011 Net earnings $ 26 Add loss attributable to Predecessor 8 Add interest and financing costs, net 2 Add depreciation and amortization expense 6 EBITDA $ 42 (In millions) Unaudited Tesoro Logistics LP Consensus EBITDA(2) 2015E Projected net earnings $ 305 Add interest and financing costs, net 150 Add depreciation and amortization expense 203 Projected EBITDA $ 658 (In millions) Unaudited Tesoro Logistics LP Distinctive Growth Strategy Annual Projected EBITDA(2) 2015E Gathering (Incl. Natural Gas)(3) Processing(3) Terminalling and Transportation(3) Segment Totals Tesoro Asset Acquisitions Consolidated Total(4) Projected net earnings $ 138 $ 128 $ 237 $ 503 $ - $ 302 Add interest and financing costs, net - - - - - 150 Add depreciation and amortization expense 107 30 65 202 - 203 Projected EBITDA (1) $ 245 $ 158 $ 302 $ 705 $ - $ 655 1
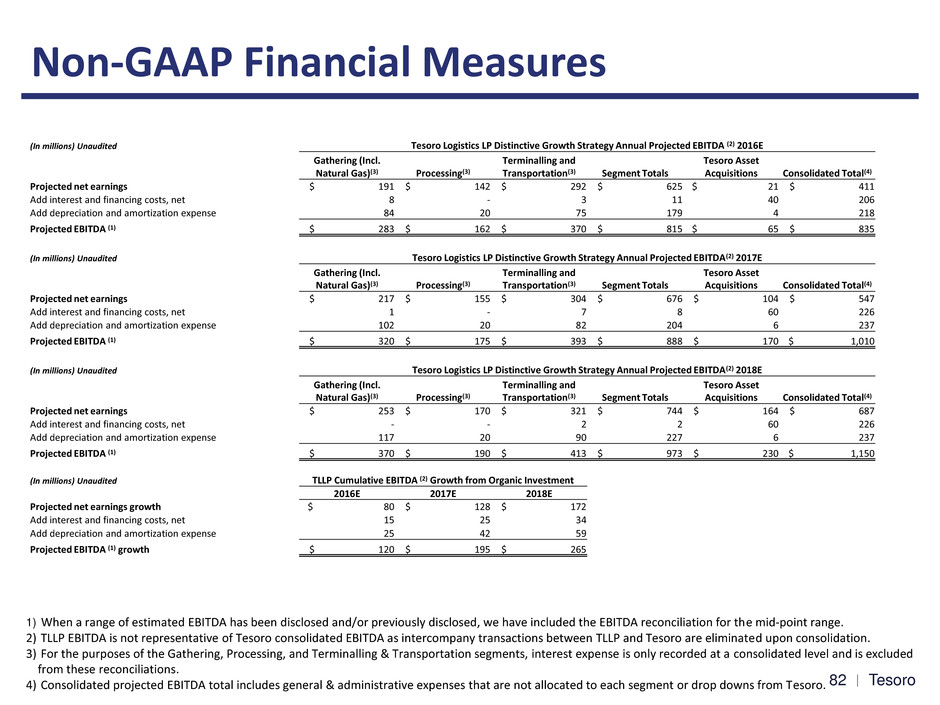
Tesoro 83 Non-GAAP Financial Measures 1) When a range of estimated EBITDA has been disclosed and/or previously disclosed, we have included the EBITDA reconciliation for the mid-point range. 2) TLLP EBITDA is not representative of Tesoro consolidated EBITDA as intercompany transactions between TLLP and Tesoro are eliminated upon consolidation. 3) For the purposes of the Gathering, Processing, and Terminalling & Transportation segments, interest expense is only recorded at a consolidated level and is excluded from these reconciliations. 4) Consolidated projected EBITDA total includes general & administrative expenses that are not allocated to each segment or drop downs from Tesoro. (In millions) Unaudited Tesoro Logistics LP Distinctive Growth Strategy Annual Projected EBITDA (2) 2016E Gathering (Incl. Natural Gas)(3) Processing(3) Terminalling and Transportation(3) Segment Totals Tesoro Asset Acquisitions Consolidated Total(4) Projected net earnings $ 191 $ 142 $ 292 $ 625 $ 21 $ 411 Add interest and financing costs, net 8 - 3 11 40 206 Add depreciation and amortization expense 84 20 75 179 4 218 Projected EBITDA (1) $ 283 $ 162 $ 370 $ 815 $ 65 $ 835 (In millions) Unaudited Tesoro Logistics LP Distinctive Growth Strategy Annual Projected EBITDA(2) 2017E Gathering (Incl. Natural Gas)(3) Processing(3) Terminalling and Transportation(3) Segment Totals Tesoro Asset Acquisitions Consolidated Total(4) Projected net earnings $ 217 $ 155 $ 304 $ 676 $ 104 $ 547 Add interest and financing costs, net 1 - 7 8 60 226 Add depreciation and amortization expense 102 20 82 204 6 237 Projected EBITDA (1) $ 320 $ 175 $ 393 $ 888 $ 170 $ 1,010 (In millions) Unaudited Tesoro Logistics LP Distinctive Growth Strategy Annual Projected EBITDA(2) 2018E Gathering (Incl. Natural Gas)(3) Processing(3) Terminalling and Transportation(3) Segment Totals Tesoro Asset Acquisitions Consolidated Total(4) Projected net earnings $ 253 $ 170 $ 321 $ 744 $ 164 $ 687 Add interest and financing costs, net - - 2 2 60 226 Add depreciation and amortization expense 117 20 90 227 6 237 Projected EBITDA (1) $ 370 $ 190 $ 413 $ 973 $ 230 $ 1,150 (In millions) Unaudited TLLP Cumulative EBITDA (2) Growth from Organic Investment 2016E 2017E 2018E Projected net earnings growth $ 80 $ 128 $ 172 Add interest and financing costs, net 15 25 34 Add depreciation and amortization expense 25 42 59 Projected EBITDA (1) growth $ 120 $ 195 $ 265 2
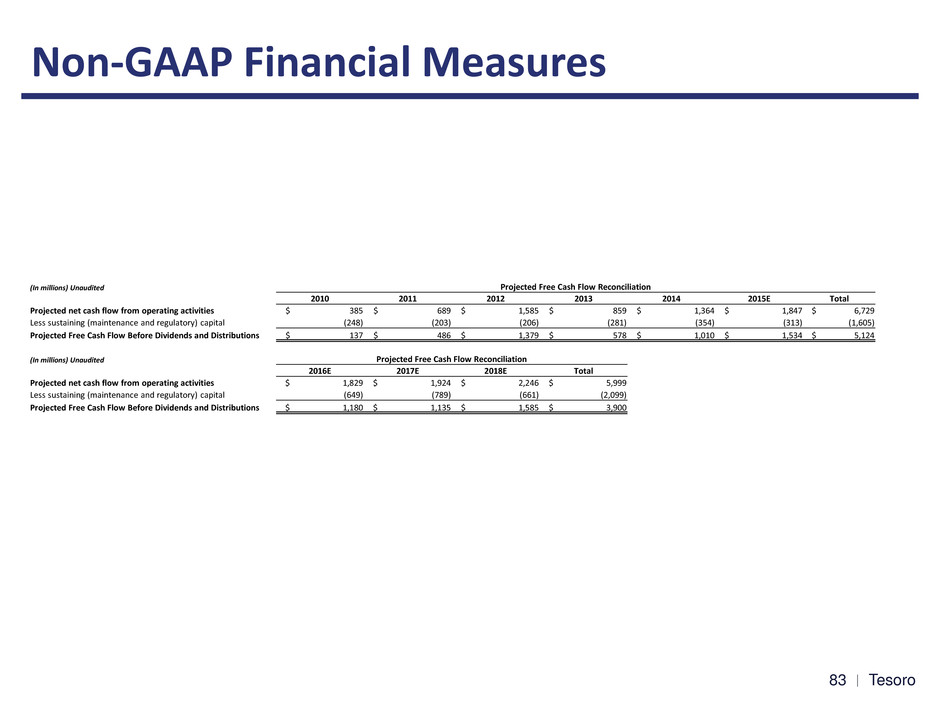
Tesoro 84 Non-GAAP Financial Measures (In millions) Unaudited Projected Free Cash Flow Reconciliation 2010 2011 2012 2013 2014 2015E Total Projected net cash flow from operating activities $ 385 $ 689 $ 1,585 $ 859 $ 1,364 $ 1,847 $ 6,729 Less sustaining (maintenance and regulatory) capital (248) (203) (206) (281) (354) (313) (1,605) Projected Free Cash Flow Before Dividends and Distributions $ 137 $ 486 $ 1,379 $ 578 $ 1,010 $ 1,534 $ 5,124 (In millions) Unaudited Projected Free Cash Flow Reconciliation 2016E 2017E 2018E Total Projected net cash flow from operating activities $ 1,829 $ 1,924 $ 2,246 $ 5,999 Less sustaining (maintenance and regulatory) capital (649) (789) (661) (2,099) Projected Free Cash Flow Before Dividends and Distributions $ 1,180 $ 1,135 $ 1,585 $ 3,900 3