UNITED STATES SECURITIES AND EXCHANGE COMMISSION
Washington, D.C. 20549
_________________________
FORM 10‑K
(Mark One)
| þ | ANNUAL REPORT PURSUANT TO SECTION 13 OR 15(d) OF THE SECURITIES EXCHANGE ACT OF 1934 |
For the fiscal year ended December 31, 2016
or
| o | TRANSITION REPORT PURSUANT TO SECTION 13 OR 15(d) OF THE SECURITIES EXCHANGE ACT OF 1934 |
For the transition period from ______________ to __________
Commission File Number 1‑3473
TESORO CORPORATION
(Exact name of registrant as specified in its charter)
| Delaware |  | 95-0862768 |
(State or other jurisdiction of incorporation or organization) | (I.R.S. Employer Identification No.) | |
| 19100 Ridgewood Pkwy, San Antonio, Texas 78259-1828 | ||
| (Address of principal executive offices) (Zip Code) | ||
| 210-626-6000 | ||
| (Registrant’s telephone number, including area code) | ||
Securities registered pursuant to Section 12(b) of the Act:
| Title of Each Class | Name of Each Exchange on Which Registered | |
Common Stock, $0.16 2/3 par value | New York Stock Exchange | |
Securities registered pursuant to Section 12(g) of the Act: None
Indicate by check mark if the registrant is a well-known seasoned issuer, as defined in Rule 405 of the Securities Act. Yes þ No o
Indicate by check mark if the registrant is not required to file reports pursuant to Section 13 or Section 15(d) of the Act. Yes o No þ
Indicate by check mark whether the registrant (1) has filed all reports required to be filed by Section 13 or 15(d) of the Securities Exchange Act of 1934 during the preceding 12 months (or for such shorter period that the registrant was required to file such reports), and (2) has been subject to such filing requirements for the past 90 days. Yes þ No o
Indicate by check mark whether the registrant has submitted electronically and posted on its corporate Web site, if any, every Interactive Data File required to be submitted and posted pursuant to Rule 405 of Regulation S-T (§232.405 of this chapter) during the preceding 12 months (or for such shorter period that the registrant was required to submit and post such files). Yes þ No o
Indicate by check mark if the disclosure of delinquent filers pursuant to Item 405 of Regulation S-K is not contained herein, and will not be contained, to the best of the registrant’s knowledge, in definitive proxy or information statements incorporated by reference in Part III of this Form 10-K or any amendment to this Form 10-K. þ
Indicate by check mark whether the registrant is a large accelerated filer, an accelerated filer, a non-accelerated filer, or a smaller reporting company. See definitions of “large accelerated filer,” “accelerated filer” and “smaller reporting company” in Rule 12b-2 of the Exchange Act. (Check one):
| Large accelerated filer | þ | Accelerated filer | o | |||
| Non-accelerated filer | o (Do not check if a smaller reporting company) | Smaller reporting company | o | |||
Indicate by check mark whether the registrant is a shell company (as defined in Rule 12b-2 of the Exchange Act). Yes o No þ
At June 30, 2016, the aggregate market value of the voting common stock held by non-affiliates of the registrant was approximately $8.8 billion based upon the closing price of its common stock on the New York Stock Exchange Composite tape. At February 15, 2017, there were 116,986,291 shares of the registrant’s common stock outstanding.
DOCUMENTS INCORPORATED BY REFERENCE:
Portions of the registrant’s Proxy Statement to be filed pursuant to Regulation 14A pertaining to the 2016 Annual Meeting of Stockholders are incorporated by reference into Part III hereof. The Company intends to file such Proxy Statement no later than 120 days after the end of the fiscal year covered by this Form 10-K.
| TABLE OF CONTENTS | ||
TESORO CORPORATION
ANNUAL REPORT ON FORM 10-K
This Annual Report on Form 10-K (including documents incorporated by reference herein) contains statements with respect to our expectations or beliefs as to future events. These types of statements are “forward-looking” and subject to uncertainties. See “Important Information Regarding Forward-Looking Statements.”
| IMPORTANT INFORMATION REGARDING FORWARD-LOOKING STATEMENTS | ||
IMPORTANT INFORMATION REGARDING FORWARD-LOOKING STATEMENTS
This Annual Report on Form 10-K (including information incorporated by reference) contains “forward-looking statements” within the meaning of Section 27A of the Securities Act of 1933 and Section 21E of the Securities Exchange Act of 1934. All statements other than statements of historical fact, including without limitation statements regarding expectations regarding refining margins, revenues, cash flows, capital expenditures, turnaround expenses and other financial items, our business strategy, goals and expectations concerning our market position, future operations, margins and profitability, are forward-looking statements. Forward-looking statements may be identified by use of the words “anticipate,” “believe,” “could,” “estimate,” “expect,” “intend,” “may,” “plan,” “predict,” “project,” “will,” “would” and similar terms and phrases. Although we believe our assumptions concerning future events are reasonable, a number of risks, uncertainties and other factors could cause actual results and trends to differ materially from those projected, including, but not limited to:
| • | the constantly changing margin between the price we pay for crude oil and other refinery feedstocks as well as renewable identification numbers (“RINs”) and environmental credits, and the prices at which we are able to sell refined products; |
| • | changes in the expected value of and benefits derived from acquisitions and capital projects; |
| • | changes in global economic conditions on our business, especially in California, and the business of our suppliers, customers, business partners and credit lenders; |
| • | changes in fuel and utility costs for our facilities; |
| • | changes in the cost or availability of third-party vessels, pipelines and other means of transporting crude oil feedstocks and refined products; |
| • | regulatory and other requirements concerning the transportation of crude oil, particularly from the Bakken area; |
| • | changes in the carrying costs of our inventory; |
| • | the timing and extent of changes in commodity prices and underlying demand for our refined products, natural gas and natural gas liquids; |
| • | the availability and costs of crude oil, other refinery feedstocks, refined products and RINs; |
| • | changes in our cash flow from operations; |
| • | earthquakes or other natural disasters affecting operations; |
| • | direct or indirect effects on our business resulting from actual or threatened terrorist incidents, cyber-security breaches or acts of war; |
| • | weather conditions affecting our operations or the areas in which our refined products are marketed; |
| • | actions of customers and competitors; |
| • | state and federal environmental, economic, health and safety, energy and other policies and regulations, including those related to climate change and any changes therein, and any legal or regulatory investigations, delays, compliance costs or other factors beyond our control; |
| • | delays in obtaining necessary approvals and permits; |
| • | adverse rulings, judgments, or settlements in litigation or other legal or tax matters, including unexpected environmental remediation costs in excess of any reserves; |
| • | operational hazards inherent in refining operations and in transporting and storing crude oil and refined products; |
| • | changes in our credit profile; |
| • | changes in capital requirements or in execution of planned capital projects; |
| • | disruptions due to equipment interruption or failure at our facilities or third-party facilities; |
| • | seasonal variations in demand for refined products and natural gas; |
| • | risks related to labor relations and workplace safety; |
| • | political developments; and |
| • | the factors described in greater detail under “Competition” and “Risk Factors” in Items 1 and 1A, and our other filings with the SEC. |
All forward-looking statements included in this report are based on information available to us on the date of this report. We undertake no obligation to revise or update any forward-looking statements as a result of new information, future events or otherwise.
December 31, 2016 | 1 | ||
| GLOSSARY OF TERMS | ||
GLOSSARY OF TERMS
Alkylation - A process that chemically combines isobutane with other hydrocarbons through the control of temperature and pressure in the presence of an acid catalyst. This process produces alkylates, which have a high octane value and are blended into gasoline to improve octane values.
API - American Petroleum Institute - The main U.S. trade association for the oil and natural gas industry.
API Gravity - A scale for denoting the lightness or heaviness of crude oil and other liquid hydrocarbons. Calibrated in API degrees (or degrees API), it is used universally to express a crude oil’s relative density in an inverse measure - the lighter the crude, the higher the API gravity, and vice versa.
Blendstocks - Components used for blending or compounding into finished jet or gasoline (e.g., straight-run gasoline, alkylate, reformulate, benzene, toluene, and xylene). Excludes oxygenates (alcohols, ethers), butane and pentanes.
Calcining - A process whereby green or raw petroleum coke from the refining process is converted to a high grade coke by thermally treating it to remove moisture and volatile combustible matter. The upgraded high grade calcined coke is typically used by the aluminum industry.
CARB - California Air Resources Board - Gasoline and diesel fuel sold in the state of California are regulated by CARB and require stricter quality and emissions reduction performance than required by other states.
Cracking - The process of breaking down larger hydrocarbon molecules into smaller molecules using catalysts and/or elevated temperatures and pressures.
D&A - Depreciation and amortization expenses.
Deasphalting - A solvent extraction process of recovering higher-value oils from refining residues.
Delayed Coking - A process by which the heaviest crude oil fractions can be thermally cracked under conditions of elevated temperatures to produce both refined products and petroleum coke.
Exchange Arrangement - An agreement providing for the delivery of crude oil or refined products to/from a third party, in exchange for the delivery of crude oil or refined products to/from the third party.
FERC - Federal Energy Regulatory Commission.
Fluid Catalytic Cracking - A process that breaks down larger, heavier, and more complex hydrocarbon molecules into simpler and lighter molecules through the use of a catalytic agent and is used to increase the yield of gasoline. Fluid catalytic cracking uses a catalyst in the form of very fine particles, which behave as a fluid when aerated with a vapor.
Fractionation - The process of separating natural gas liquids into its component parts by heating the natural gas liquid stream and boiling off the various fractions in sequence from the lighter to the heavier hydrocarbon.
Fuel Margin - The margin on fuel products sold through our Marketing segment calculated as revenues less cost of sales. Cost of sales in fuel margin are based on purchases from our refining segment and third parties using average bulk market prices adjusted for transportation and other differentials.
Gas Processing - A complex industrial process designed to remove the heavier and more valuable natural gas liquids components from raw natural gas allowing the residue gas remaining after extraction to meet the quality specifications for long-haul pipeline transportation or commercial use.
Gross Refining Margin - The margin on products manufactured and purchased, including those sold to our Marketing segment. Gross refining margin is the difference between the prices of all manufactured refined products sold and the cost of crude oil and other feedstocks used to produce refined products, including the cost of transportation and distribution.
Heavy Crude Oil - Crude oil with an API gravity of 24 degrees or less. Heavy crude oil is typically sold at a discount to lighter crude oil.
Heavy Fuel Oils, Residual Products, Internally Produced Fuel and Other - Products other than gasoline, jet fuel and diesel fuel produced in the refining process. These products include residual fuels, gas oils, propane, petroleum coke, asphalt and internally produced fuel.
Hydrocracking - A process that uses a catalyst to crack heavy hydrocarbon molecules in the presence of hydrogen. Major products from hydrocracking are distillates, naphtha, propane and gasoline components such as butane.
Hydrotreating - A process that removes sulfur from refined products in the presence of catalysts and substantial quantities of hydrogen to reduce sulfur dioxide emissions that result from the use of the products.
Isomerization - A process that alters the fundamental arrangement of atoms in the molecule without adding or removing anything from the original material. The process is used to convert normal butane into isobutane and normal pentane into isopentane and hexane into isohexane.
2 | Tesoro Corporation | ||
| GLOSSARY OF TERMS | ||
Jobber/Dealer - Retail station owned by a third party that sells products purchased from or through us.
Light Crude Oil - Crude oil with an API gravity greater than 24 degrees. Light crude oil is typically sold at a premium to heavy crude oil.
Manufacturing Costs - Costs associated directly with the manufacturing process including cash operating expenses, but excluding depreciation and amortization.
Mbpd - Thousand barrels per day.
MMBtu - Million British thermal units.
MMMBtu - Billion British thermal units.
MMcf - Million cubic feet.
Multi-Site Operator (“MSO”) - Companies licensed to operate retail stations in which we have a fee or leasehold interest in the property and title to the fuel until sold to the consumer. MSOs operate the non-fuel business at the location and employ the operating personnel.
Naphtha - Refined product used as a gasoline blending component, a feedstock for reforming and as a petrochemical feedstock.
NGLs - Natural gas liquids.
OPEC - Organization of the Petroleum Exporting Countries
Other Feedstocks - Any non-crude raw or semi-finished material, which is further processed in various units of a refinery.
Refined Products - Hydrocarbon compounds, such as gasoline, diesel fuel, jet fuel and residual fuel that are produced by a refinery.
Refining Yield - Volumes of product produced from crude oil and feedstocks.
Reforming - A process that uses controlled heat and pressure with catalysts to rearrange certain hydrocarbon molecules into petrochemical feedstocks and higher octane stocks suitable for blending into finished gasoline.
Residual crude oil - The remainder of the crude oil after gasoline and distillate fuel oils have been extracted through distillation.
SG&A - Selling, general and administrative expenses.
Sweet crude oil - Crude oil containing less than 0.45% sulfur.
Sour crude oil - Crude oil containing greater than 0.45% sulfur.
Tesoro Index - A performance benchmark that uses several crude oils and approximately 8 to 10 products to provide a potentially closer representation of the trends in the available margin. Our actual gross refining margins differ from the Tesoro Index based on the actual slate of crude oil that is run at our refineries and the products we produce or yield. The published Tesoro Index, including a reconciliation of the included components, is available on our website at www.tsocorp.com.
Throughput - The quantity of crude oil and other feedstocks processed at a refinery measured in barrels per day.
Turnaround - The scheduled shutdown of a refinery processing unit for significant overhaul and refurbishment. Turnaround expenditures are capitalized and amortized over the period of time until the next planned turnaround of the unit.
Unit Train - A train consisting of approximately one hundred rail cars containing a single material (such as crude oil) that is transported by the railroad as a single unit from its origin point to the destination, enabling decreased transportation costs and faster deliveries.
Vacuum Distillation - Distillation under reduced pressure, which lowers the boiling temperature of crude oil in order to distill crude oil components that have high boiling points.
December 31, 2016 | 3 | ||
| BUSINESS | ||
As used in this Annual Report on Form 10-K, the terms “Tesoro,” the “Company,” “we,” “us” or “our” may refer to Tesoro Corporation, one or more of its consolidated subsidiaries or all of them taken as a whole. The words “we,” “us” or “our” generally include Tesoro Logistics LP (“TLLP”), a publicly traded limited partnership, and its subsidiaries as consolidated subsidiaries of Tesoro Corporation with certain exceptions where there are transactions or obligations between TLLP and Tesoro Corporation or its other subsidiaries. When used in descriptions of agreements and transactions, “TLLP” or the “Partnership” refers to TLLP and its consolidated subsidiaries.
PART I
ITEM 1. BUSINESS
Tesoro was incorporated in Delaware in 1968. Headquartered in San Antonio, Texas, we are one of the largest independent petroleum refining, logistics and marketing companies in the United States. Our common stock trades on the New York Stock Exchange under the symbol “TSO.”
Our business is organized into three operating segments:
REFINING. Our refining operating segment refines crude oil and other feedstocks into transportation fuels, such as gasoline and gasoline blendstocks, jet fuel and diesel fuel, as well as other products, including heavy fuel oils, liquefied petroleum gas and petroleum coke for sale in bulk markets to a wide variety of customers within our markets.
TLLP. Our logistics operating segment, which is comprised of TLLP’s assets and operations, includes certain crude oil and natural gas gathering assets, natural gas and
NGLs processing assets, and crude oil and refined products terminalling, transportation and storage assets acquired from Tesoro and third parties. The TLLP financial and operational data presented include the historical results of all assets acquired from Tesoro prior to the dates they were acquired by TLLP. The historical results of operations of these assets have been retrospectively adjusted to conform to the current presentation.
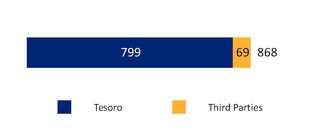
MARKETING. Our marketing segment sells transportation fuels through branded and unbranded channels. The branded business sells transportation fuels using a unique brand portfolio with the ARCO®, Shell®, Exxon®, Mobil®, USA GasolineTM, RebelTM, ThriftyTM and Tesoro® brands across a network of 2,492 retail stations.
See Notes 15 and 19 to our consolidated financial statements in Item 8 for additional information on our operating segments and properties.
 REFINING
OVERVIEW. We currently own and operate seven petroleum refineries located in the western United States with a combined crude oil capacity of 895 Mbpd. Our Refining segment buys and refines crude oil and other feedstocks into transportation fuels that we sell to a wide variety of customers. Demand for gasoline is higher during the spring and summer months than during the fall and winter months in most of our markets due to seasonal changes in vehicle miles traveled. As a result, our operating results for both the Refining and Marketing segments for the first and fourth quarters are typically lower than the second and third quarters.
REGIONS. We currently operate the Refining segment in three separate regions: California, Pacific Northwest and Mid-Continent. Our geographic footprint and integrated logistics and marketing businesses enable our refineries to interact across these regions providing higher asset utilization and lower operating costs while maintaining well-balanced product supplies to better serve our customers.
CALIFORNIA REFINERIES
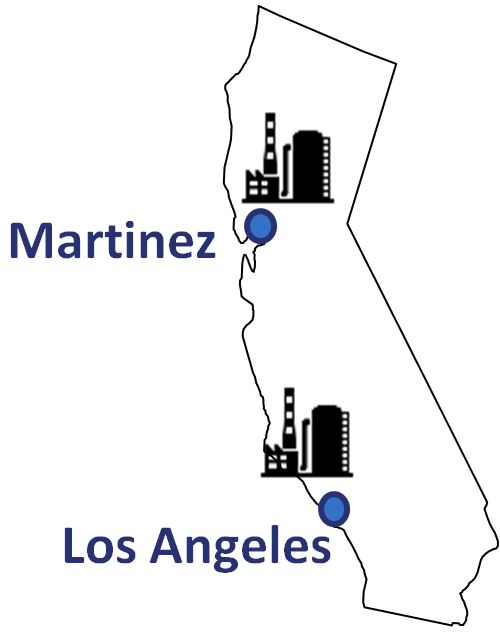
Crude Oil Capacity / 2016 Throughput (in Mbpd)
Los Angeles: 380 / 364
Martinez: 166 / 143
4 | Tesoro Corporation | ||
| BUSINESS | ||
LOS ANGELES. Our Los Angeles refinery is located on approximately 930 acres in the Carson-Wilmington area of California about 20 miles south of Los Angeles. The refinery’s major processing units include crude distillation, vacuum distillation, delayed coking, hydrocracking, naphtha reforming, hydrotreating, fluid catalytic cracking, butane isomerization and alkylation. The refinery produces a high proportion of transportation fuels, including CARB gasoline and CARB diesel fuel, conventional gasoline, diesel fuel and jet fuel. The refinery also produces heavy fuel oils, liquefied petroleum gas, petroleum coke, calcined coke and electricity.
MARTINEZ. Our Martinez refinery is located on approximately 2,200 acres in Martinez, California about 30 miles east of San Francisco. The refinery’s major processing units include crude distillation, vacuum distillation, delayed coking, hydrocracking, naphtha reforming, hydrotreating, fluid catalytic cracking and alkylation units. The refinery produces a high proportion of transportation fuels, including CARB gasoline and CARB diesel fuel, conventional gasoline and diesel fuel. The refinery also produces liquefied petroleum gas and petroleum coke.
PACIFIC NORTHWEST REFINERIES
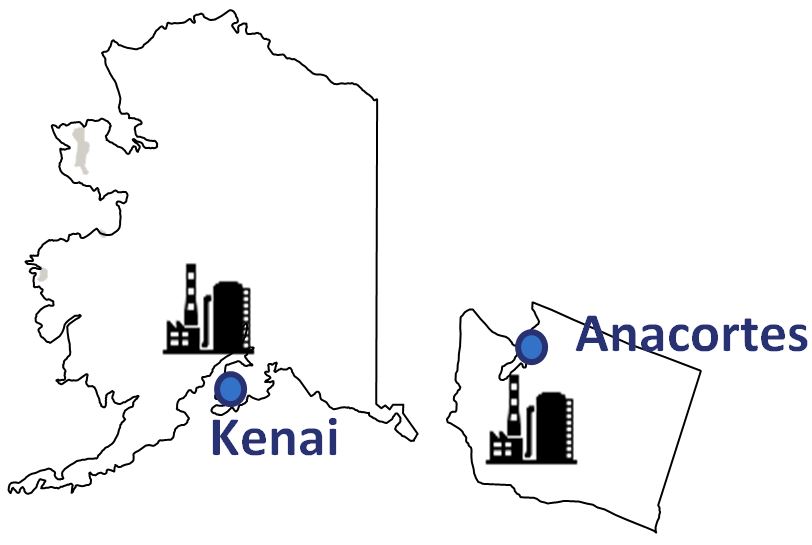
Crude Oil Capacity / 2016 Throughput (in Mbpd)
Anacortes: 120 / 124 (a)
Kenai: 72 / 57
(a) Throughput can exceed crude oil capacity due to the processing of other feedstocks in addition to crude oil.
ANACORTES. Our Anacortes refinery is located on approximately 950 acres in northwest Washington about 70 miles north of Seattle. The refinery’s major processing units include crude distillation, vacuum distillation, deasphalting, naphtha reforming, hydrotreating, fluid catalytic cracking, butane isomerization and alkylation units, which enable us to produce a high proportion of transportation fuels such as conventional gasoline, diesel fuel and jet fuel. The refinery also produces heavy fuel oils and liquefied petroleum gas.
KENAI. Our Kenai refinery is located on approximately 450 acres on the Cook Inlet near Kenai, Alaska about 60 miles southwest of Anchorage. The refinery’s major processing units include crude distillation, vacuum distillation, hydrocracking, hydrotreating, naphtha reforming, diesel desulfurizing and light naphtha isomerization units, which produce transportation fuels, including gasoline and gasoline blendstocks, jet fuel and diesel fuel, as well as other products, including heating oil, heavy fuel oils, liquefied petroleum gas and asphalt.
MID-CONTINENT REFINERIES
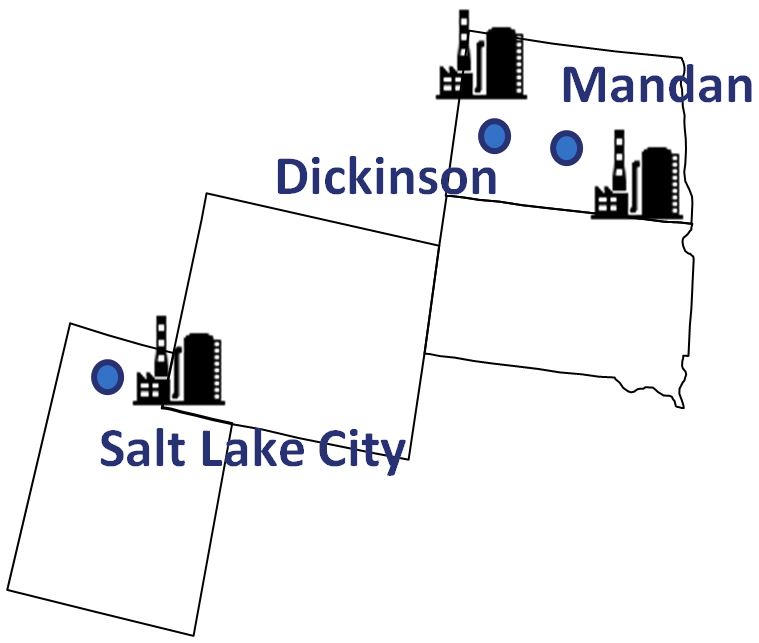
Crude Oil Capacity / 2016 Throughput (in Mbpd)
Salt Lake City: 63 / 58
Mandan: 74 / 71
Dickinson: 20 / 14 (b)
| (b) | Throughput for the 2016 period for Dickinson measured since our acquisition of the refinery on June 28, 2016. |
SALT LAKE CITY. Our Salt Lake City refinery is located on approximately 150 acres in Salt Lake City, Utah. The refinery’s major processing units include crude distillation, fluid catalytic cracking, naphtha reforming, hydrotreating and alkylation units, which produce transportation fuels, including gasoline, diesel fuel and jet fuel, as well as other products, including heavy fuel oils and liquefied petroleum gas.
MANDAN. Our Mandan refinery is located on approximately 950 acres along the Missouri River near Mandan, North Dakota. The refinery’s major processing units include crude distillation, fluid catalytic cracking, naphtha reforming, hydrotreating and alkylation units, which produce transportation fuels, including gasoline, diesel fuel and jet fuel, as well as other products, including heavy fuel oils and liquefied petroleum gas.
DICKINSON. Acquired during 2016, our Dickinson refinery is located on 318 acres approximately 100 miles west of the Mandan refinery near Dickinson, North Dakota. The refinery produces ultra-low sulfur diesel, naphtha and residuals.
December 31, 2016 | 5 | ||
| BUSINESS | ||
FEEDSTOCK PURCHASES. We purchase crude oil and other feedstocks from domestic and foreign sources either through the spot market or term agreements with renewal provisions and volume commitments. We purchase domestic crude oil produced primarily in North Dakota, Alaska, California, Utah and Wyoming. We purchase foreign crude oil produced in South America, the Middle East, Canada, western Africa and other locations. We lease access to the Trans-Panama pipeline (the “Panama Pipeline”) and several tanks in Panama through agreements expiring in April 2017 that allow us to deliver the crude oil acquired in Africa and the Atlantic region of South America to refineries on the West Coast. We also transport crude oil across the Panama Pipeline for third parties. At December 31, 2016, we held title to approximately 5.2 million barrels of crude oil in transit or in Panama for delivery to our refineries on the West Coast or to third parties.
SOURCES OF OUR CRUDE OIL PURCHASES BASED ON VOLUMES PURCHASED
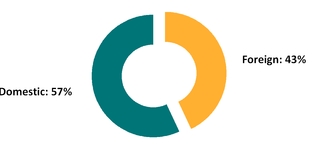
Our refineries process both heavy and light crude oil. Light crude oil, when refined, produces a greater proportion of higher value transportation fuels such as gasoline, diesel and jet fuel, and as a result is typically more expensive than heavy crude oil. In contrast, heavy crude oil produces more low value by-products and heavy residual oils. These lower value products can be upgraded to higher value products through additional, more complex and expensive refining processes.
PRIMARY CRUDE OIL CHARACTERISTICS AND SOURCES OF CRUDE OIL FOR OUR REFINERIES
| Characteristics | Sources | |||||||||||||||||||||||||||||||
| Sweet | Sour | Residual | Other Feedstocks | Blendstocks | United States | Canada | South & Central America | Asia | Middle East & Africa | |||||||||||||||||||||||
| Los Angeles | ||||||||||||||||||||||||||||||||
| Martinez | ||||||||||||||||||||||||||||||||
| Anacortes | ||||||||||||||||||||||||||||||||
| Kenai | ||||||||||||||||||||||||||||||||
| Mandan | ||||||||||||||||||||||||||||||||
| Salt Lake City | ||||||||||||||||||||||||||||||||
| Dickinson | ||||||||||||||||||||||||||||||||
REFINED PRODUCTS. The total products produced in the refining process are referred to as the refining yield. The refining yield consists primarily of transportation fuels, including gasoline and gasoline blendstocks, jet fuel and diesel fuel, but may also include other products such as heavy fuel oils, liquefied petroleum gas, petroleum coke, calcined coke and asphalt.
6 | Tesoro Corporation | ||
| BUSINESS | ||
2016 THROUGHPUT VOLUMES AND REFINING YIELDS
| California | Pacific Northwest | Mid-Continent | Total Refining | |||||||||||||||||
| Volume | % | Volume | % | Volume | % | Volume | % | |||||||||||||
| Throughput | ||||||||||||||||||||
| Heavy crude | 170 | 34 | 6 | 3 | — | — | 176 | 21 | ||||||||||||
| Light crude | 304 | 60 | 162 | 90 | 132 | 96 | 598 | 73 | ||||||||||||
| Other feedstocks | 33 | 6 | 13 | 7 | 5 | 4 | 51 | 6 | ||||||||||||
| Total | 507 | 100 | 181 | 100 | 137 | 100 | 825 | 100 | ||||||||||||
| Yield | ||||||||||||||||||||
| Gasoline and gasoline blendstocks | 294 | 53 | 80 | 42 | 77 | 55 | 451 | 51 | ||||||||||||
| Diesel fuel | 113 | 21 | 35 | 19 | 41 | 29 | 189 | 22 | ||||||||||||
| Jet fuel | 71 | 13 | 35 | 19 | 12 | 8 | 118 | 13 | ||||||||||||
| Heavy fuel oils, residual products, internally produced fuel and other (a) | 74 | 13 | 37 | 20 | 11 | 8 | 122 | 14 | ||||||||||||
| Total (b) | 552 | 100 | 187 | 100 | 141 | 100 | 880 | 100 | ||||||||||||
| (a) | The majority of internally produced fuel is consumed during the refining process. |
| (b) | Refined product sales may exceed our yield due to purchased refined products. |
LOGISTICS ASSETS
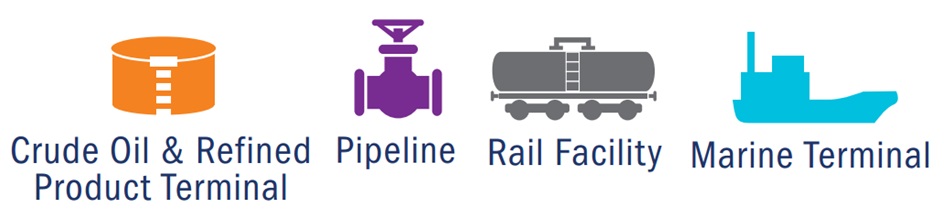
TERMINAL AND PIPELINES. We transport, store and distribute crude oil, feedstocks and refined products through our terminals and pipelines or terminals and pipelines owned by TLLP and third-parties in our market areas as well as through purchases and exchange arrangements with other refining and marketing companies. Our refineries are integrated with each other via pipelines, terminals and barges. The transportation links that connect our refineries allow for movement of intermediate and finished products, which permit us to optimize our value chain and maximize utilization.
MARINE. We charter tankers to optimize the transportation of crude oil, feedstocks, and refined products to support our refinery system and ensure adequate shipping capacity. Our current U.S.-flag and foreign-flag tanker time charters will expire with varying dates between 2017 and 2021, unless we exercise renewal options. We also time charter tug and barge units and a ship assist tug with varying expiration dates between 2017 through 2018, unless we exercise renewal options. We continually look to optimize our marine fleet and minimize costs, and from time to time we sub-charter vessels in our fleet to third-parties to maintain high utilization. All of our chartered tankers and barges are double-hulled.
RAIL. We maintain a fleet of leased rail cars to transport crude and refined products in support of our refining
operations. In 2016, Tesoro placed an order for 525 additional tank cars for crude oil service that exceed the U.S. Department of Transportation’s 117 standards that were announced in 2015 (“DOT120J200”). These cars started delivering in the second half of 2016 and will complement the 210 DOT120J200 tank cars currently in our fleet. We intend to continue ordering new rail cars that are among the safest available at the time of order and to comply with all relevant regulatory requirements.
REFINED PRODUCT SALES
Our Marketing segment provides a committed outlet for the majority of gasoline produced by our refineries; however, we also sell gasoline and gasoline blendstocks, jet fuel, diesel fuel, heavy fuel oils and residual products in bulk markets in the western U.S. We also opportunistically export gasoline and diesel fuel to certain foreign markets. Our bulk sales are primarily to independent unbranded distributors, other refining and marketing companies, utilities, railroads, airlines and marine and industrial end-users. Our sales include refined products that we manufacture, purchase or receive through exchange arrangements.
SALES OF PURCHASED PRODUCTS. In the normal course of business, we purchase refined products manufactured by others for resale through our marketing and bulk operations to our customers to meet local market demands and fulfill supply commitments. We purchase these refined products, primarily gasoline, jet fuel, diesel fuel and industrial and marine fuel blendstocks, mainly in the spot market.
December 31, 2016 | 7 | ||
| BUSINESS | ||


 TLLP
TLLPOVERVIEW. TLLP is a fee-based, growth-oriented Delaware limited partnership formed by us to own, operate, develop and acquire logistics assets. TLLP is a publicly traded limited partnership that is traded on the New York Stock Exchange under the symbol “TLLP.” TLLP’s operations are organized into three businesses: Gathering, Processing, and Terminalling and Transportation. TLLP owns and operates a network of crude oil, refined products and natural gas pipelines, terminals with dedicated and non-dedicated storage capacity for crude oil and refined products, rail facilities with loading and off-loading capabilities, marine terminals and trucking fleets. In addition, TLLP owns and operates natural gas processing and fractionation complexes. TLLP generates revenues by charging fees for gathering crude oil and natural gas, for processing natural gas, and for terminalling, transporting and storing crude oil and refined products. TLLP’s customers experience modest seasonality due to regulatory restrictions, weather conditions and seasonal refined product demand, resulting in higher volumes during the summer months and lower volumes during the winter months. Many of the effects of
seasonality on TLLP’s operating results are mitigated through fee-based commercial agreements that include minimum volume commitments. On January 1, 2017, TLLP acquired crude oil, natural gas and produced water gathering systems and two natural gas processing facilities (“North Dakota Gathering and Processing Assets”). The North Dakota Gathering and Processing Assets include over 650 miles of crude oil, natural gas, and produced water gathering pipelines, 170 MMcf per day of natural gas processing capacity and 18,700 bpd of fractionation capacity in the Sanish and Pronghorn fields of the Williston Basin in North Dakota.
TLLP intends to continue expanding its business through organic growth, including the construction of new assets and increasing the utilization of existing assets, and by acquiring assets from us and third parties. TLLP’s continued expansion of the logistics business is expected to allow us to optimize the value of our assets within the midstream and downstream value chain. Below is a map of TLLP’s strategic assets in relation to our refineries.

8 | Tesoro Corporation | ||
| BUSINESS | ||
GATHERING. TLLP’s Gathering business consists of crude oil, natural gas and produced water gathering systems in the North Dakota Williston Basin/Bakken Shale area (the “Bakken Region”) and the Uinta, Vermillion and greater Green River basins. TLLP’s High Plains System, located in the Bakken Region, gathers and transports crude oil from various production locations in this area for transportation to Tesoro’s North Dakota refinery and other destinations in the Bakken Region, including export rail terminals and pipelines. In addition in the High Plains System, we own and operate a truck-based crude oil gathering operation and a pipeline regulated by the FERC. TLLP’s natural gas gathering systems include the Uinta Basin, Vermillion, Williston, Green River, and Three Rivers gathering systems, its equity method investments in Rendezvous Gas Services, L.L.C., Uintah Basin Field Services, L.L.C. and Three Rivers Gathering, LLC, and two pipelines regulated by the FERC through which it provides natural gas and crude oil transportation services.
TLLP GATHERING - VOLUMES TRANSPORTED IN 2016

| (a) | Also includes barrels that were gathered and delivered into TLLP’s High Plains System by truck. |
PROCESSING. TLLP’s Processing business consists of natural gas processing and fractionation complexes with a combined processing throughput capacity of approximately 1,600 MMcf/d and fractionation throughput capacity of approximately 34 Mbpd. TLLP processes gas for certain producers under keep-whole processing agreements. Under a keep-whole agreement, a producer transfers title to the NGLs produced during gas processing and the processor, in exchange, delivers to the producer natural gas with a BTU content equivalent to the NGLs removed. The operating margin for these agreements is determined by the spread between NGLs sales prices and the price paid to purchase the replacement natural gas (“Shrink Gas”). We are party to a five-year agreement, entered into in December 2014 and amended in February 2016, with TLLP that substantially transfers the commodity risk exposure associated with these keep-whole processing agreements from TLLP to us (the “Keep-Whole Commodity Agreement”). Under the Keep-Whole Commodity Agreement, we pay TLLP a fee to process NGLs related to keep-whole agreements and deliver Shrink Gas to the producers on behalf of TLLP. TLLP pays us a marketing fee in exchange for assuming the commodity risk.
As of 2016, pricing under this agreement is subject to a tiered pricing structure with pricing for a base level of NGLs production and pricing for incremental volumes over 315,000 gallons per day. The pricing for both the base and incremental volumes are subject to revision each year.
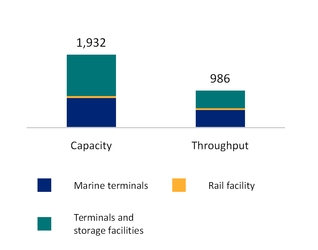
TERMINALLING AND TRANSPORTATION. TLLP’s Terminalling and Transportation business consists of: crude oil and refined products terminals and storage facilities in the western and midwestern U.S. that are supplied by Tesoro-owned and third-party pipelines, trucks and barges; marine terminals in California that load and unload vessels; pipelines that transport products and crude oil from our refineries to nearby facilities in Salt Lake City and Los Angeles; a 50% fee interest in a pipeline that transports jet fuel from our Los Angeles refinery to the Los Angeles International Airport; a regulated common carrier products pipeline running from Salt Lake City, Utah to Spokane, Washington and a jet fuel pipeline to the Salt Lake City International Airport (the “Northwest Products Pipeline”); a rail-car unloading facility in Washington that receives crude oil transported on unit trains we lease; a petroleum coke handling and storage facility in Los Angeles that handles and stores petroleum coke from our Los Angeles refinery; and a regulated common carrier refined products pipeline system connecting our Kenai refinery to Anchorage, Alaska.
TLLP TRANSPORTATION VOLUME (in Mbpd)
TLLP TERMINALLING THROUGHPUT (in Mbpd)
December 31, 2016 | 9 | ||
| BUSINESS | ||
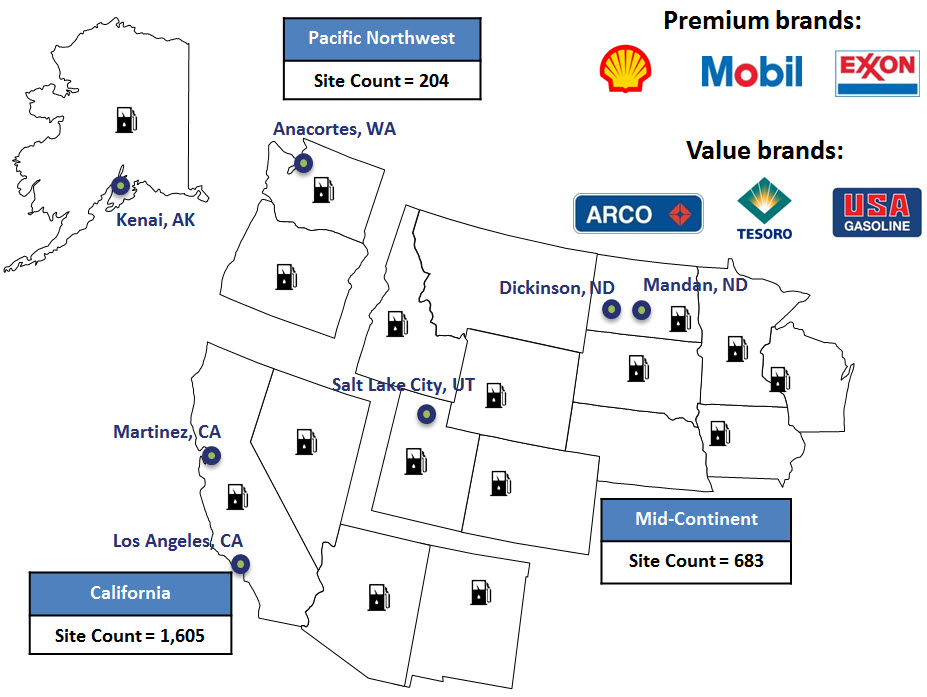
 MARKETING
Our Marketing segment sells gasoline and diesel fuel in the western U.S. through branded and unbranded channels. Our branded operations include transportation fuel sales through retail stations and agreements with third-party dealers and distributors. Our unbranded business includes volumes sold through agreements with third-party distributors/operators. Our branded and unbranded
channels provide a committed outlet for the majority of the gasoline produced by our refineries. The map below shows the approximate number of retail outlets by region included in our Marketing segment’s branded network of retail stations under the ARCO®, Shell®, Exxon®, Mobil®, USA GasolineTM, RebelTM, ThriftyTM and Tesoro® brands as of December 31, 2016.
COMPETITION
The refining industry is highly competitive and includes a diverse set of competitors. Our primary competitors are typically the other local refining, marketing and logistics companies within the regions we operate, but may include companies from across the globe depending on the market environment. The competitors range from small independently owned businesses to some of the largest integrated multi-national oil companies in the world.
We obtain all of our crude oil from third-party sources and compete in the world market for the crude oil and feedstocks we process, and for the customers who purchase refined products. The availability and cost of crude oil and other feedstocks, as well as the prices of the products we produce, are heavily influenced by global supply and demand dynamics.
10 | Tesoro Corporation | ||
| BUSINESS | ||
We compete with other refiners and with importers for customers in most of our market areas including sales of our distillate production through wholesale and bulk channels. Competition and concentrations specific to each of our refineries are:
| • | Our Martinez, Los Angeles and Anacortes refineries compete with several refiners in the U.S., Canada and throughout the Pacific Rim; |
| • | Our Kenai refinery competes with two other in-state refineries along with refineries on the West Coast and in Asia. Our jet fuel sales in Alaska are concentrated in Anchorage, where we are one of the principal suppliers at the Anchorage International Airport; and |
| • | Our mid-continent refineries in Mandan, Dickinson, and Salt Lake City compete with supplies provided from refineries in surrounding states and pipeline supply from the Midwest and Gulf Coast regions. |
We sell gasoline through our network of branded retail stations as well as on an unbranded, or wholesale, and bulk basis. Our marketing operations compete with other independent marketers, integrated oil companies and high-volume retailers. Competitive factors that affect Marketing include product price, location, convenience and brand appeal.
TLLP’s gathering business competes with a number of transportation, midstream, and trucking companies for the gathering and transportation of crude oil and natural gas, as applicable, in the areas in which they operate. TLLP’s gathering business competes for opportunities to build gathering lines from producers or other pipeline companies, to provide accessible and flexible service to producers, and facilitate the transportation of crude oil and natural gas to applicable markets. In processing, TLLP competes with midstream companies and producers primarily based on reputation, commercial terms, reliability, service levels, flexibility, access to markets, location, available capacity, capital expenditures and fuel efficiencies. TLLP’s terminalling and transportation business competes predominately with independent terminal and pipeline companies, integrated petroleum companies, refining and marketing companies and distribution companies with marketing and trading arms. Competition in particular geographic areas is affected primarily by the volumes of refined products produced by refineries located in those areas, the availability of refined products and the cost of transportation to those areas from refineries located in other areas.
HEALTH & SAFETY
Improving personal and process safety is a core value at Tesoro. We are committed to operating our refineries, pipelines, retail stations and other facilities in a manner that promotes the health and safety of our employees, our customers and the communities where we do business.
Our Environmental, Health & Safety (EH&S) policy in conjunction with our Operational Excellence Management System establish metrics, expectations and responsibilities for achieving our goals for these key areas:
PERSONAL SAFETY. At Tesoro, we consider the health and safety of our people a core value and an essential area of focus of our leadership. We strive to instill a culture of personal responsibility among our employees and contractors by setting clear expectations around our safety standards and policies. We conduct regular audits, assessments and program reviews to ensure these practices are being followed and to identify improvements to enhance our workplace safety.
PROCESS SAFETY. Our facilities are designed, constructed, operated and maintained to ensure safe work environments. To maintain the integrity of our operating systems, we enforce a disciplined framework that includes comprehensive design, engineering, operating and maintenance practices. We use industry-recognized methodologies to assure process safety and asset integrity and reduce the risk of incidents.
TRANSPORTATION SAFETY. We are committed to conducting business in a manner that promotes the safety of our employees and those living around us. This includes the operations of our pipelines, storage facilities, rail cars and trucking fleet, which transports crude oil and other feedstock, as well as fuel and other products. We proactively led the industry in the safe transport of crude oil via rail by working collaboratively with tank car manufacturers to develop enhanced rail cars (120J) that surpass regulatory standards.
December 31, 2016 | 11 | ||
| BUSINESS | ||
GOVERNMENT REGULATION AND LEGISLATION
REGULATORY CONTROLS AND EXPENDITURES. Like other companies engaged in similar businesses, we are subject to extensive and frequently changing federal, state, regional and local laws, regulations and ordinances relating to the environment, including those governing emissions or discharges to land, air and water, the handling and disposal of solid and hazardous wastes and the remediation of contamination. While we believe our facilities are in substantial compliance with current requirements, we will continue to engage in efforts to meet new legislative and regulatory requirements applicable to our operations. Compliance with these laws and regulations may require us to make significant expenditures.
For example:
| • | The U.S. Environmental Protection Agency (“EPA”) has promulgated multiple regulations to control greenhouse gas emissions under the Federal Clean Air Act. The first of these regulations, finalized on April 1, 2010, set standards for the control of greenhouse gas emissions from light trucks and cars. The U.S. Congress may also consider legislation regarding greenhouse gas emissions in the future. |
| • | The Energy Independence and Security Act of 2007 mandates the blending of increasing amounts of renewable fuels in the supply of transportation fuels used domestically. This use of renewable fuels is required of all manufacturers and importers of transportation fuels sold domestically. The EPA implemented the second renewable fuel standard (“RFS2”) through regulation and RFS2 requires transportation fuel manufacturers to provide proof of purchase of these renewable fuels. The costs associated with RFS2 compliance are uncertain and fluctuate with market dynamics. |
| • | The EPA finalized amendments to the Clean Air Act Risk Management Planning regulations in 2016 significantly expanding the regulatory requirements. |
| • | The Department of Transportation (“DOT”) issued new regulations in 2015 governing the design of rail cars used to transport petroleum and other materials. |
| • | In California, Senate Bill 32 (“SB 32”) set a new greenhouse gas emission reduction requirement of 40% below 1990 levels by 2030. Assembly Bill (“AB 197”) mandated direct emission reductions of greenhouse gases from large stationary sources such as our refineries. Assembly Bill 32 (“AB 32”), previously created a statewide cap on greenhouse gas emissions now replaced by SB 32 but also created a low carbon fuel standard, which requires a 10% reduction in the carbon intensity of fuels by 2020. |
| • | In California, the Board for the South Coast Air Quality Management District passed amendments to the Regional Clean Air Incentives Market (“RECLAIM”) on December 4, 2015. The RECLAIM Amendments became effective in 2016 and required a staged reduction of Nitrogen Oxides through 2022. |
| • | In California, new and expanded Process Safety Management and Refinery Safety and Prevention regulations were proposed in 2016 in response to recommendations made in 2014 by the Governor’s Interagency Refinery Safety Working Group. |
The impact of these and other regulatory and legislative developments is likely to result in increased compliance costs, additional operating restrictions on our business and an increase in the cost of the products we manufacture. Depending on market conditions, we may attempt to pass these costs on to consumers. If that is not possible, the changes could have an adverse impact on our financial position, results of operations, and liquidity. We cannot currently determine the amounts of such future impacts. For additional information regarding our environmental matters see “Environmental and Other Matters” in Item 7.
OIL SPILL PREVENTION AND RESPONSE. We operate in environmentally sensitive coastal waters, where tanker, pipeline, rail cars and other petroleum product transportation operations are regulated by federal, state and local agencies and monitored by environmental interest groups. The transportation of crude oil and refined products involves risk and subjects us to the provisions of the Federal Oil Pollution Act of 1990 and related state requirements, which require that most petroleum refining, transport and storage companies maintain and update various oil spill prevention and oil spill contingency plans. Our spill prevention plans and procedures are frequently reviewed and modified to prevent releases and to minimize potential impacts to land and water should a release occur. We have submitted these plans and received federal and state approvals necessary to comply with the Federal Oil Pollution Act of 1990 and related regulations. At our facilities adjacent to water, federally certified Oil Spill Response Organizations (“OSROs”) are available to respond to a spill on water from above ground storage tanks or pipelines. We have contracts in place to ensure support from the respective OSROs for spills in both open and inland waters, as well as on land.
We currently charter tankers to ship crude oil from foreign and domestic sources to our California, Washington and Alaska refineries. The tanker owners contract with OSROs to comply with federal, state and local requirements, except in Alaska where we contract with the OSROs. The OSROs are capable of responding to an oil spill equal to the greatest tanker volume delivering crude oil to our refineries. Those volumes range from 350,000 barrels to two million barrels.
12 | Tesoro Corporation | ||
| BUSINESS | ||
We have entered into spill-response contracts with various OSROs to provide spill-response services, if required, to respond to a spill of oil originating from our facilities. We have spill-response agreements in Alaska with Cook Inlet Spill Prevention and Response, Incorporated and with Alyeska Pipeline Service Company. We also have entered into contracts with Marine Spill Response Corporation for the San Francisco Bay, Puget Sound, the Port of Los Angeles and the Port of Long Beach, and the Clean Rivers Cooperative, Inc. for the Columbia River, and Bay West, Inc. in our Mid-Continent region. These OSROs are capable of responding to an oil spill on water equal to the greatest volume above ground storage tank at our facilities or pipelines. Those volumes range from 50,000 to 600,000 barrels. We also contract with one spill-response organization outside the U.S. to support our shipments in foreign waters. In addition, we contract with various spill-response specialists to ensure appropriate expertise is available for any contingency. We believe these contracts provide the additional services necessary to meet or exceed all regulatory spill-response requirements and support our commitment to environmental stewardship.
The OSROs we contract with have the highest available rating and certification from the U.S. Coast Guard and are required to annually demonstrate their response capability to the U.S. Coast Guard and state agencies. We maintain our own spill-response resources to mitigate the impact of a spill from a tanker at our refineries until an OSRO can deploy its resources. Our spill response capability meets the U.S. Coast Guard and state requirements to either deploy on-water containment equipment two and one-half times the length of a vessel at our dock or have smaller vessels available.
The services provided by the OSROs principally consist of operating response-related equipment, managing certain aspects of a response and providing technical expertise. The OSROs provide various resources in response to an oil spill. The resources include dedicated vessels that have skimming equipment to recover oil, storage barges to temporarily store recovered oil, containment boom to control the spread of oil on water and land and to protect shorelines, and various pumps and other equipment supporting oil recovery efforts and the protection of natural resources. The OSROs have full-time personnel and contract with third parties to provide additional personnel when needed.
As a general matter, our agreements with these organizations do not contain specific physical or financial limitations. General physical limitations of these organizations would include the geographical area for which services are available and the amount of resources available at the initiation of a request for services or the duration of response and recovery efforts.
Additionally, we require all tankers and barges engaged in moving crude oil, heavy and finished products to be double hulled. All vessels used by us to transport crude oil and refined products over water are examined or evaluated and subject to our approval prior to their use.
RAIL CAR SAFETY. Tesoro maintains a fleet of leased rail cars to transport crude and support our refining operations. Generally, rail operations are subject to federal, state and local regulations. Over the last year, Tesoro has added over 700 new DOT120J200 tank cars to its crude oil fleet. These cars exceed the new federal standards issued by the DOT during 2015. The new DOT regulations allow for an orderly phase out or retrofit of previous generation rail cars. In 2016, Tesoro retrofit 250 cars while phasing out 500 older CPC-1232 tank cars. Tesoro will continue to comply with all regulatory requirements and order only new rail cars that are among the safest and most robust available at the time of order. TLLP rail operations are limited to loading and unloading rail cars at its facilities. TLLP believes its entire rail car loading and unloading operations meet or exceed all applicable regulations.
PIPELINE SAFETY. Our pipelines, gathering systems and terminal operations, including those owned by TLLP, are subject to increasingly strict safety laws and regulations. The transportation and storage of refined products, natural gas and crude oil involve a risk that hazardous liquids may be released into the environment, potentially causing harm to the public or the environment. The DOT, through the Pipeline and Hazardous Materials Safety Administration and state agencies, enforce safety regulations with respect to the design, construction, operation, maintenance, inspection and management of our pipeline and storage facilities.
REGULATION OF PIPELINES. Operations on portions of our pipelines are regulated by state agencies in Alaska and California. In addition, TLLP owns and operates crude oil, refined product and natural gas pipelines, which are common carriers regulated by various federal, state and local agencies. The FERC regulates interstate transportation on TLLP’s High Plains System, Northwest Products Pipeline and natural gas pipeline under the Interstate Commerce Act, the Energy Policy Act of 1992 and the rules and regulations promulgated under those laws.
Federal regulation of interstate pipelines extends to such matters as rates, services, and terms and conditions of service; the types of services offered to customers; the certification and construction of new facilities; the acquisition, extension, disposition or abandonment of facilities; the maintenance of accounts and records; relationships between affiliated companies; the initiation and continuation of services; market manipulation in connection with interstate sales, purchases or transportation of commodities; and participation by interstate pipelines in cash management arrangements.
December 31, 2016 | 13 | ||
| BUSINESS | ||
The intrastate operation of TLLP’s Alaska pipeline is regulated by the Regulatory Commission of Alaska. The state regulatory authorities require that we notify shippers of proposed tariff increases to provide the shippers an opportunity to protest the increases. In addition to challenges to new or proposed rates, challenges to existing intrastate rates are permitted by complaint of an interested person or by independent action of the appropriate regulatory authority. The intrastate operations of TLLP’s High
Plains System in North Dakota are regulated by the North Dakota Public Service Commission. Applicable state law requires that pipelines operate as common carriers, that access to transportation services and pipeline rates be non-discriminatory, that if more crude oil is offered for transportation than can be transported immediately the crude oil volumes transported be apportioned equitably and that pipeline rates be just and reasonable.
WORKING CAPITAL
We fund our business operations through a combination of available cash and equivalents and cash flows generated from operations. In addition, our revolving lines of credit are available for additional working capital needs. For additional information regarding working capital see “Capital Resources and Liquidity” in Item 7.
EMPLOYEES
We had more than 6,300 full-time employees at December 31, 2016, approximately 2,090 of whom are full-time represented union employees covered by collective bargaining agreements. The agreements for approximately 1,750 of these employees will expire on February 1, 2019, the agreements for approximately 80 of these employees will expire on March 1, 2017, and the agreements for the remaining represented employees expire on May 1, 2019.
EXECUTIVE OFFICERS
The following is a list of our executive officers, their ages and their positions at Tesoro, effective as of February 21, 2017.
There are no family relationships among the officers listed, and there are no arrangements or understandings pursuant to which any of them were elected as officers. Officers are elected annually by our Board of Directors (the “Board”) in conjunction with the annual meeting of stockholders. The term of each office runs until the corresponding meeting of the Board in the next year or until a successor has been elected or qualified. Positions held for at least the past five years for each of our executive officers are described below (positions, unless otherwise specified, are with Tesoro).
Gregory J. Goff, 60, was named President and Chief Executive Officer in May 2010 and Chairman of our Board of Directors in December 2014. Mr. Goff also serves as Chief Executive Officer and Chairman of the Board of Directors of Tesoro Logistics GP, LLC (“TLGP”), the general partner of TLLP. Since March 2015, Mr. Goff has served as Chairman of the Board of the American Fuel & Petrochemical Manufacturers. Before joining Tesoro, he served as Senior Vice President, Commercial for ConocoPhillips Corporation (“ConocoPhillips”), an international, integrated energy company, from 2008 to 2010. Mr. Goff held various positions at ConocoPhillips from 1981 to 2008, including Managing Director and CEO of Conoco JET Nordic from 1998 to 2000; Chairman and Managing Director of Conoco Limited, a UK-based refining and marketing affiliate, from 2000 to 2002; President of ConocoPhillips Europe and Asia Pacific downstream operations from 2002 to 2004; President of ConocoPhillips specialty businesses and business development from 2006 to 2008; and President of ConocoPhillips specialty businesses and business development from 2006 to 2008. Mr. Goff serves as Chairman of the Board of the American Fuel and Petrochemical Manufacturers trade association and on the National Advisory Board of the University of Utah Business School. Previously, Mr. Goff served on the board of Chevron Phillips Chemical Company and was a member of the upstream and downstream committees of the American Petroleum Institute. In addition, Mr. Goff has public company experience from his prior service on the board of directors of DCP Midstream GP, LLC. Mr. Goff received a Bachelor’s degree in Science and Master’s degree in Business Administration from the University of Utah.
Keith M. Casey, 50, was named Executive Vice President, Marketing and Commercial in August 2016. Prior to his current role, Mr. Casey served as Executive Vice President, Operations, since May 2014. Prior to that, he served as Senior Vice President, Strategy and Business Development beginning in April 2013. Prior to joining Tesoro, Mr. Casey served as Vice President, BP Products North America, Texas City Refinery beginning in September 2006.
14 | Tesoro Corporation | ||
| BUSINESS | ||
Kim K.W. Rucker, 50, joined Tesoro in March 2016 as Executive Vice President, General Counsel and Secretary. Ms. Rucker also serves as Executive Vice President and General Counsel for TLGP. Before joining Tesoro, Ms. Rucker served as Executive Vice President, Corporate and Legal Affairs, General Counsel and Corporate Secretary of Kraft Food Groups, Inc., a food and beverage company (now The Kraft-Heinz Company), from October 2012 to July 2015. She joined Mondelēz International as Executive Vice President, Corporate & Legal Affairs, Kraft Foods North America in September 2012. Prior to that, she served as Senior Vice President, General Counsel and Chief Compliance Officer of Avon Products, Inc., a global manufacturer of beauty and related products, beginning in March 2008 and as Corporate Secretary in February 2009. Ms. Rucker also served as Senior Vice President, Secretary and Chief Governance Officer of Energy Future Holdings Corp. (formerly TXU Corp.), an energy company, from 2004 to 2008. She was Corporate Counsel for Kimberly-Clark Corporation and a Partner in the Corporate & Securities group at Sidley Austin LLP in Chicago. Ms. Rucker serves on the board of directors of Lennox International Inc. She holds a bachelor of business administration degree in economics from the University of Iowa, a law degree from the Harvard Law School and a master’s in public policy from the John F. Kennedy School of Government at Harvard University.
Steven M. Sterin, 45, was named Executive Vice President and Chief Financial Officer in August 2014. In August 2016, he also assumed leadership of corporate development in support of our growth plans. Mr. Sterin also serves as Executive Vice President and Chief Financial Officer of TLGP. Prior to joining Tesoro, Mr. Sterin served as the Senior Vice President and Chief Financial Officer of Celanese Corporation, a global technology and specialty material company, from July 2007 until May 2014 and continued to serve as an employee until August 2014. From December 2010 through January 2013, he was president of Celanese’s Advanced Fuel Technologies business. Mr. Sterin joined Celanese in 2003 as Director of Finance and Controller for the company’s chemical business and also served as Corporate Controller and Principal Accounting Officer before being appointed CFO. Before Celanese, Mr. Sterin spent six years with global chemicals company Reichhold, Inc. in a variety of financial positions, including Director of Tax and Treasury in the Netherlands, Global Treasurer and Vice President of Finance for one of the company’s divisions in North Carolina. Mr. Sterin holds a Master of Professional Accounting degree and a Bachelor of Business Administration degree in accounting, which he earned concurrently at the University of Texas at Austin. He is also a certified public accountant in Texas.
Cynthia J. Warner, 58, was named Executive Vice President, Operations in August 2016. Prior to her current role, Mrs. Warner served as Executive Vice President, Strategy and Business Development since October 2014. Before joining Tesoro, Mrs. Warner served as President, Chief Executive Officer, and Chairman of the Board of Sapphire Energy beginning in 2009.
Blane W. Peery, 50, was named Vice President and Controller of both Tesoro and TLGP in November 2016. Prior to that, he served as Vice President, Process Excellence and Chief Information Officer from February 2015 through October 2016. Mr. Peery has experience leading global accounting organizations, business planning and analysis functions, supply chain groups, global shared services including finance, human resources, information technology, and mergers and acquisitions integration. From March 2014 to February 2015, Mr. Peery served as VP, Global Business Services at Mylan N.V., a leading global pharmaceutical company. Prior to that he worked for Celanese Corporation, a global technology and specialty materials company, for over 20 years in roles with increasing responsibility, including positions as its Vice President, Global Business Services from October 2012 to March 2014, its Vice President, Supply Chain from October 2011 to October 2012 and its first-ever Global Accounting Director. Mr. Peery began his career as an auditor for PricewaterhouseCoopers and is a Certified Public Accountant (CPA). Mr. Peery holds a Bachelor of Business Administration degree in accounting, which he earned at the University of Texas at Austin.
Stephan E. Tompsett, 40, was named Vice President, Treasurer and Credit in August 2016. From May 2015 through August 2016, he served as Chief Financial Officer, Logistics of Tesoro Companies, Inc. Prior to joining Tesoro, Mr. Tompsett served in a variety of finance roles at Energy Transfer Partners from February 2011 to May 2015. From September 2008 to January 2011, he was Vice President, Corporate Development at Synthesis Energy Systems. He was an associate at JPMorgan from July 2005 to August 2008. Mr. Tompsett holds a Master of Business Administration degree from the University of Texas at Austin - Red McCombs School of Business and a Bachelors of Science degree in biology and mathematics from the University of Texas at Austin.
WEBSITE ACCESS TO REPORTS AND OTHER INFORMATION
Our Internet website address is http://www.tsocorp.com. Information contained on our Internet website is not part of this Annual Report on Form 10-K.
Our Annual Reports on Form 10-K, Quarterly Reports on Form 10-Q, Current Reports on Form 8-K and other public filings with the Securities and Exchange Commission (“SEC”) are available, free of charge, on our website as soon as reasonably practicable after we file them with, or furnish them to, the SEC. You may also access these reports on the SEC’s website at http://www.sec.gov.
December 31, 2016 | 15 | ||
| RISK FACTORS | ||
ITEM 1A. RISK FACTORS
Our proposed acquisition of Western Refining is subject to significant risks and uncertainties.
As described elsewhere in this Annual Report on Form 10-K, we have entered into a merger agreement, dated as of November 16, 2016, with Western Refining, Inc. (“Western Refining”) pursuant to which, on the terms and subject to the conditions included therein, we have agreed to acquire Western Refining. Our ability to complete the proposed acquisition on a timely basis or at all is subject to numerous risks and uncertainties, including, but not limited to, the following:
| • | we may not obtain required shareholder approval; |
| • | we may not obtain required regulatory approvals or receipt of regulatory approvals may take longer than expected or may impose conditions to the proposed acquisition that are not presently anticipated or cannot be met; |
| • | conditions to the proposed acquisition may not be fulfilled in a timely manner or at all; or |
| • | unforeseen events and those beyond our control. |
The proposed acquisition also subjects us to business uncertainties while it is pending and places other restrictions on our business, including, without limitation:
| • | our ability to attract, retain and motivate key personnel until the proposed acquisition is completed and for a period of time thereafter; |
| • | our ability to maintain our relationships with our customers and other third parties we transact with, who may seek to change their existing business relationships with us as a result of the proposed acquisition; and |
| • | restrictions imposed on us under the merger agreement that prohibit us from entering into certain corporate transactions and taking other specified actions without the consent of Western Refining, which may prevent us from pursuing attractive business opportunities that may arise prior to the completion of the acquisition. |
We have incurred and expect to continue to incur significant transaction and acquisition-related costs associated with the proposed acquisition. These, as well as other unanticipated costs and expenses could have a material adverse effect on our financial condition and operating results. Combining our businesses may be more difficult, costly or time consuming than expected. Integration involves numerous challenges, including our ability to integrate our businesses in an efficient and timely manner, integrate our systems and controls as well as integrate our relationships with our customers, suppliers, employees and other third parties. The integration process may, for us and Western Refining, result in the loss of key employees, the disruption of ongoing businesses or inconsistencies in standards, controls, procedures and policies.
The success of the proposed acquisition will depend on, among other things, our ability to realize the anticipated benefits and cost savings from combining our and Western Refining’s businesses in a manner that facilitates growth opportunities and realizes anticipated synergies and costs savings. These anticipated benefits and cost savings may not be realized fully or at all, or may take longer to realize than expected or could have other adverse effects that we do not currently foresee.
The volatility of crude oil prices, refined product prices and natural gas and electrical power prices may have a material adverse effect on our cash flow and results of operations.
Our refining margins are influenced by the price of our refining feedstocks-crude oil and other feedstocks-and the price of our refined products. These prices often move independently of each other, which can negatively impact our margins, earnings or cash flows. In recent years, prices have fluctuated significantly due to global and local factors that are beyond our control, including:
| • | production and availability of foreign and domestic crude oil and refined products; |
| • | production controls set and maintained by the members of the Organization of the Petroleum Exporting Countries; |
| • | transportation infrastructure availability, local market conditions, operation levels of other refineries in our markets, and the import or export of crude and refined products; |
| • | political instability, threatened or actual terrorist incidents, acts of war, and other global political conditions; |
| • | domestic and foreign governmental regulations and taxes; |
| • | the price, availability and efficiency of competing energy sources; |
| • | local, regional, national and worldwide economic conditions; and |
| • | weather conditions, hurricanes or other natural disasters. |
16 | Tesoro Corporation | ||
| RISK FACTORS | ||
Some of these factors can vary by region and may change quickly, adding to market volatility, while others may have longer-term effects. The long-term effects of these and other factors on prices for crude oil, refinery feedstocks and refined products are uncertain and could negatively impact our margins, earnings or financial condition.
The short-term effects of these fluctuations could affect our margins, earnings and cash flows. We purchase our refinery feedstocks weeks before manufacturing and selling the refined products. Price level changes during the period between purchasing feedstocks and selling the refined products could affect our margins, earnings or cash flows. In addition, we purchase refined products manufactured by others to sell to our customers. If we are unable to manage our commodity exposure risk, it could affect our business, financial condition and results of operations. Lower refining margins may reduce the amount of refined products we produce, which may reduce our revenues, income from operations or cash flows. Significant reductions in margins could require us to reduce our capital expenditures or impair the carrying value of our assets.
Volatile prices for natural gas and electricity used by our refineries and other operations affect manufacturing and operating costs. Natural gas and electricity prices have been, and will continue to be, affected by supply and demand for fuel and utility services in both local and regional markets. In addition, the volume of crude oil, refined products, natural gas and NGLs that TLLP distributes and stores at its terminals, transports and processes depends substantially on our and other customers’ profit margins, the market price of crude oil, natural gas, NGLs and other refinery feedstocks, and product demand.
A substantial change to fiscal or tax policies may adversely affect our business.
Recent events have given rise to a heightened possibility of a substantial change to fiscal and tax policies, which may include comprehensive tax reform. We cannot predict the impact these changes will have on our business; however, it is possible that these changes could adversely affect our business, our cash flows, our profitability, and our ability to compete domestically and internationally. Until we know what changes are enacted, we will not know the type or extent of the effects on our business.
We may be unsuccessful in integrating the operations of the assets we have acquired or may acquire in the future, or in realizing all or any part of the anticipated benefits of any such acquisition.
If we are unable to successfully integrate our acquisitions into our business, we may never realize their expected benefits. With each acquisition, we may discover unexpected costs, environmental liabilities, delays, or lower than expected cost savings or synergies. In addition, we may be unable to successfully integrate the diverse company cultures, retain key personnel, apply our expertise to new competencies, or react to adverse changes in commodity prices or industry conditions.
We cannot predict with certainty the benefits of these acquisitions, which often constitute multi-year endeavors. For example, our proposed acquisition of Western Refining is uncertain and, if completed, will require substantial capital during 2017 and later years. If we are unable to realize all or part of the projected benefits from this or other acquisitions within our expected timeframes, our business, results of operations and financial condition may suffer.
We are subject to interruptions of supply and increased costs as a result of our reliance on logistics assets for the transportation of crude oil, feedstocks and refined products within our business.
Our subsidiaries own and operate seven refineries in the western United States, which refine crude oil and other feedstocks into refined products for sale to a wide variety of markets. We rely on a variety of logistics assets to transport crude oil, feedstocks and refined products, including, but not limited to, marine vessels, marine terminals, rail, pipelines, product terminals, storage tanks and trucks. Some of these assets are owned and operated by third-parties. In particular, losing access to certain assets owned by TLLP could halt production at some of our refineries. Accidents, natural disasters, government regulation, third-party actions or other events outside of our control could impede our use or increase the cost of using these assets, which could have a material adverse effect on our financial condition and results of operations.
Adverse changes in global economic conditions and the demand for transportation fuels may impact our business and financial condition in ways that we currently cannot predict.
Our business is affected by the strength of the U.S. and global economies, and the risk of global economic downturn continues. Prolonged downturns could result in declines in consumer and business confidence and spending as well as increased unemployment and reduced demand for transportation fuels. These conditions may decrease the creditworthiness of our suppliers, customers and business partners, which could interrupt or delay our suppliers’ performance of our contracts, reduce or delay customer purchases, delay or prevent customers from obtaining financing to purchase our products, or result in bankruptcy of customers or business partners. Any of these events may adversely affect our cash flow, profitability and financial condition.
December 31, 2016 | 17 | ||
| RISK FACTORS | ||
Our business includes selling products in international markets, and we are subject to risks of doing business on a global level.
We sell some of our products internationally, primarily to markets in Mexico, South America and Asia. Our operating results or financial condition could be negatively impacted by disruptions in any of these markets, including economic instability, restrictions on the transfer of funds, duties and tariffs, transportation delays, import and export controls, changes in governmental policies, labor unrest and changing regulatory and political environments. In addition, if trade relationships deteriorate with these countries, if existing trade agreements are modified or terminated, or if taxes, border adjustments or tariffs make trading with these countries more costly, it could have a material adverse effect on our business.
The availability and cost of renewable identification numbers could have an adverse effect on our financial condition and results of operations.
The RFS2 requires refiners to add annually increasing amounts of “renewable fuels” to their petroleum products or to purchase credits, known as renewable identification numbers (“RINs”), in lieu of such blending. Due to regulatory uncertainty and in part due to the nation’s fuel supply approaching the “blend wall” (the 10% ethanol limit prescribed by most automobile warranties), the price and availability of RINs has been volatile.
While we generate RINs by blending renewable fuels manufactured by third parties, we purchase RINs on the open market to comply with the RFS2. We cannot predict the future prices of RINs, and the costs to obtain the necessary RINs could be material. Our financial condition and results of operations could be adversely affected if we are unable to pass the cost of compliance on to our customers, pay significantly higher prices for RINs, and generate or purchase RINs to meet RFS2 mandated standards.
Meeting the requirements of, including the cost to comply with evolving environmental, health and safety laws and regulations including those related to climate change could materially affect our performance, financial condition and results of operations.
Environmental, health and safety laws and regulations may continue to raise our operating costs and require significant capital investments. If we discover new conditions at our facilities that require remediation, or if environmental, health and safety, and energy requirements change materially, we could be required to increase our capital expenditures, which could negatively impact our financial condition. We cannot predict developments in federal or state laws or regulations governing environmental, health and safety or energy matters, or how these changes may affect our business or financial condition.
Currently, multiple legislative and regulatory measures to address greenhouse gas (including carbon dioxide, methane and nitrous oxides) and other emissions are in various phases of consideration, promulgation or implementation. These include actions to develop national, statewide or regional programs, each of which could require reductions in our greenhouse gas or other emissions and decrease the demand for our refined products. Requiring reductions in these emissions could result in increased costs to (i) operate and maintain our facilities, (ii) install new emission controls at our facilities and (iii) administer and manage any emissions programs, including acquiring emission credits or allotments. For example:
| • | In California, the state legislature adopted SB 32 in 2016. SB 32 set a cap on emissions of 40% below 1990 levels by 2030 but did not establish a particular mechanism to achieve that target. The legislature also adopted a companion bill -AB 197 that most significantly directs the California Air Resources Board to prioritize direct emission reductions on large stationary sources. While AB 197 does not specifically preclude a market mechanism, it is expected to result in future regulations that will target greenhouse gas reductions at refineries, in addition to the mandates imposed by the existing cap and trade and low carbon fuel standard programs created by AB 32. AB 32 requires the state to reduce its greenhouse gas (“GHG”) emissions to 1990 levels by 2020. Two regulations implemented to achieve this goal are Cap-and-Trade and the Low Carbon Fuel Standard (“LCFS”). In 2012, the California Air Resource Board implemented Cap-and-Trade. This program currently places a cap on GHGs and we are required to acquire a sufficient number of credits to cover emissions from our refineries and our in-state sales of gasoline, diesel, and some LPGs. In 2009, CARB adopted the LCFS, which requires a 10% reduction in the carbon intensity of gasoline and diesel by 2020. Compliance is demonstrated by blending lower carbon intensity biofuels into gasoline and diesel or by purchasing credits. Compliance with each of these programs is demonstrated through a market-based credit system. If we are unable to pass the costs of compliance on to our customers, sufficient credits are unavailable for purchase, we have to pay a significantly higher price for credits, or if we are otherwise unable to meet our compliance obligation, our financial condition and results of operations could be adversely affected. |
| • | In California, the Board for the South Coast Air Quality Management District passed amendments to the RECLAIM on December 4, 2015. The RECLAIM Amendments became effective in 2016 and require a staged reduction of NOx through 2022. |
18 | Tesoro Corporation | ||
| RISK FACTORS | ||
| • | The EPA adopted a new rule in 2015 requiring further reductions in the National Ambient Air Quality Standard for ozone. |
In addition, pre-rulemaking is underway in California to implement the recommendations made in 2014 by the Governor’s Interagency Refinery Safety Working Group to significantly expand the scope and requirements of California’s process safety management regulations. The final requirements could have a material impact on our cash flows, profitability and financial condition.
Regulatory and other requirements concerning the transportation of crude oil and other commodities by rail may cause increases in transportation costs or limit the amount of crude that we can transport by rail.
We rely on a variety of systems to transport crude oil, including rail. In 2012, we completed the construction of a 50 Mbpd crude oil rail car unloading facility in Anacortes, Washington (the “Anacortes Rail Facility”), which TLLP subsequently acquired from us. The Anacortes Rail Facility allows us to receive crude oil into our Anacortes refinery. We have also entered into a joint venture with Savage Companies to construct, own and operate a unit train unloading and marine loading terminal at the Port of Vancouver, USA. The construction of the terminal is subject to approval by regulatory agencies and will have a capacity up to 360 Mbpd.
In 2015 the U.S. Department of Transportation issued new standards and regulations applicable to crude-by-rail transportation (Enhanced Tank Car Standards and Operational Controls for High-Hazard Flammable Trains). These or other regulations could increase the time required to move crude oil from production areas to our refineries, increase the cost of rail transportation and decrease the efficiency of shipments of crude oil by rail within our operations. Any of these outcomes could have a material adverse effect on our business and results of operations.
We rely upon certain critical information systems for the operation of our business, and the failure of any critical information system, including a cyber-security breach, may result in harm to our reputation and business.
We depend heavily on our technology infrastructure and critical information systems, including data networks, telecommunications, remote connectivity, cloud-based information controls, software applications and hardware, including those that are critical to operating our refineries, pipelines, terminals, retail stations and other business operations. In addition, we collect sensitive data, including personally identifiable information of our customers using credit cards at our retail outlets.
We are in the process of completing the enterprise resource planning project (see further discussion in Item 7) which aims to simplify business processes by implementing a standardized and scalable technology platform. Large information systems and business process transformations such as this one are complex and require significant investments in system software, business process development and employee resources. Our business and results of operations may be adversely affected if we experience operating problems, scheduling delays, cost overages or service limitations. Additionally, we may not achieve all of the expected synergies with this project which may impact our ability to achieve the project’s objectives.
Our technology infrastructure and information systems are subject to damage or interruption from a number of potential sources including natural disasters, software viruses or other malware, power failures, cyber-attacks, employee error or malfeasance, and other events. Although we have experienced actual or attempted breaches of our cybersecurity, none of these breaches have had a material effect on our business, operations or reputation (or compromised any customer data). However, no cybersecurity or emergency recovery processes is failsafe, and if our safeguards fail or our data or technology infrastructure is compromised, the safety and efficiency of our operations could be materially harmed, our reputation could suffer, and we could be subject us to additional costs, liabilities, and costly legal challenges, including those involving privacy of customer data. Any of these outcomes could materially harm our business and operations. Finally, state and federal legislation relating to cybersecurity could impose new requirements, which could increase our costs or reduce our efficiency.
Disruption of our ability to obtain crude oil could adversely affect our operations, revenue and cash flow.
To maintain or increase production levels at our refineries, we must continually contract for crude oil supplies from third parties. A material decrease in crude oil production from the fields that supply our refineries as a result of decreased exploration and production activity, natural production declines or otherwise, could result in a decline in the volume of crude oil available to our refineries. Such an event could result in an overall decline in volumes of refined products processed at our refineries and a corresponding reduction in our revenue and cash flow.
In addition, many of our logistics agreements contain minimum volume commitments. If we do not satisfy the minimum volume commitments, we will still be responsible for payment for transportation and storage services as if we had utilized such minimum volumes.
December 31, 2016 | 19 | ||
| RISK FACTORS | ||
Terrorist attacks aimed at our facilities or that impact our customers or the markets we serve could adversely affect our business.
The U.S. government has issued warnings that energy assets in general, including the nation’s refining, pipeline and terminal infrastructure, may be future targets of terrorist organizations. Any future terrorist attacks on our facilities, those of our customers, or on any transportation networks, including pipelines, could have a material adverse effect on our business. Similarly, any future terrorist attacks that severely disrupt the markets we serve could materially and adversely affect our results of operations, financial position and cash flows.
Our inventory risk management activities may result in substantial derivative variability or losses.
We enter into derivative transactions to manage the risks from changes in the prices of crude oil, refined products, natural gas, and other feedstocks associated with our physical inventories and future production, and these may result in substantial derivatives variability or losses, which could increase the volatility of our earnings. We manage price risk on inventories above or below our target levels to minimize the impact these price fluctuations have on our earnings and cash flows. Consequently, our results may fluctuate significantly from one reporting period to the next depending on commodity price fluctuations and our relative physical inventory positions. These transactions may also expose us to risks for financial losses; for example, if our production is less than we anticipated at the time we entered into a hedge agreement or if a counterparty to our hedge agreement fails to perform its obligations under the agreements. See Item 7A.
Competition in the refining, logistics and marketing industry is intense, and an increase in competition in the markets in which we sell our products could adversely affect our earnings and profitability.
We compete with a broad range of refining and marketing companies, including certain multinational oil companies. Competitors with greater geographic diversity, larger or more complex refineries, integrated operations with exploration and productions resources and broader access to resources, may be better able to withstand volatile market conditions and to bear the risks inherent in the refining industry. For example, competitors that engage in exploration and production of crude oil may be better positioned to withstand periods of depressed refining margins or feedstock shortages. Our competitors’ recent consolidations and acquisitions and their plans for projects that could increase refining capacity or efficiency could increase competition in our markets, reduce our margins and affect our cash flow.
In addition, we compete with alternative energy and fuel producers for some industrial, commercial and individual consumers. There is significant governmental and consumer pressure to increase the use of alternative fuels and vehicles in the United States. If these alternative energy sources gain support as a result of governmental regulations and subsidies, technological advances, consumer demand, or other causes, they could impact demand for our products and our financial condition.
Our operations are subject to operational hazards that could expose us to potentially significant losses.
Refineries, gas processing plants, pipelines, rail cars, terminals and other components of our business are subject to potential operational hazards and risks inherent in refining operations and in transporting and storing crude oil, natural gas, refined products and waste. Operational hazards, such as fires, floods, earthquakes, explosions, third-party accidents, maritime disasters, security breaches, pipeline ruptures and spills, mechanical failure of equipment, severe weather and other natural disasters, at our or third-party facilities, could result in business interruptions or shutdowns and damage to our properties and the properties of others. A serious accident at our facilities could also result in serious injury or death to our employees or contractors and could expose us to significant liability for personal injury claims and reputational risk. These events could create significant liabilities that are outside the limits or scope or our insurance policies, and could expose us to penalties under federal, state and local laws. The costs that we could have to pay in penalties or for clean-up, remediation and damages could have a material adverse effect on our business, financial condition and operations. Any such unplanned event or shutdown could have a material adverse effect on our business, financial condition and results of operations.
In addition, we operate in and adjacent to environmentally sensitive coastal waters where tanker, pipeline, rail car and refined product transportation and storage operations are closely regulated by federal, state and local agencies and monitored by environmental interest groups. Our coastal refineries receive crude oil and other feedstocks by tanker. In addition, our refineries receive crude oil and other feedstocks by rail car and truck. Transportation and storage of crude oil, other feedstocks and refined products over and adjacent to water involves inherent risk and subjects us to the provisions of the Federal Oil Pollution Act of 1990 and state laws in California, Washington and Alaska. If we are unable to promptly and adequately contain any accident or discharge involving tankers, pipelines, rail cars or above ground storage tanks transporting or storing crude oil, other feedstocks or refined products, we may be subject to substantial liability. In addition, the service providers we have contracted to aid us in a discharge response may be unavailable due to weather conditions, governmental regulations or other local or global events. State or federal rulings could divert our response resources to other global events.
20 | Tesoro Corporation | ||
| RISK FACTORS | ||
We are also required to ensure the quality and purity of the products loaded at our loading racks and pipeline connections. If our quality control measures were to fail or be compromised, we may have contaminated or off-specification products commingled in our pipelines and storage tanks that could be sent to customers and other end users. These types of incidents could result in product liability claims from our customers or other pipelines to which our pipelines connect. These product liability claims may have a material adverse effect on our business or results or operations or our ability to maintain existing customers or retain new customers.
We do not maintain insurance coverage against all potential losses. Marine vessel charter agreements may not provide complete indemnity for oil spills, and any marine charterer’s liability insurance we carry may not cover all losses. If a loss event is not fully covered by insurance or if our insurers fail to honor their coverage commitments for an insured event or if our counterparties fail to honor any indemnification agreements, it could have a material adverse effect on our business, financial condition and results of operations.
Our operations are also subject to general environmental risks, expenses and liabilities, which could affect our results of operations.
From time to time we have been, and presently are, subject to litigation and investigations with respect to environmental and related matters, including product liability claims related to the oxygenate methyl tertiary butyl ether. We may become involved in further litigation or other civil or criminal proceedings, or we may be held responsible in any existing or future litigation or proceedings, the costs of which could be material.
We operate and have in the past operated retail stations with underground storage tanks in various jurisdictions. Federal and state regulations and legislation govern the storage tanks, and compliance with these requirements can be costly. The operation of underground storage tanks poses certain risks, including leaks. Leaks from underground storage tanks, which may occur at one or more of our retail stations, or which may have occurred at our previously operated retail stations, may impact soil or groundwater and could result in fines or civil liability for us.
Large capital projects can take several years to complete, and if we are unable to complete capital projects at their expected costs or in a timely manner, or if market conditions deteriorate significantly between the project approval date and the project startup date, our results of operations, cash flows or project returns could be adversely impacted.
We are constructing several new projects and expanding existing ones, such as the construction of the Vancouver Energy Project and the Clean Product Upgrade Project. The construction process involves numerous regulatory, environmental, political and legal uncertainties, most of which are not fully within our control. If we are unable to complete capital projects at their expected costs or in a timely manner our results of operations or cash flows could be adversely affected. In addition, our revenues may not increase immediately upon the expenditure of funds because construction or expansion may occur over an extended period of time, and we may not receive any material increases in revenues until after substantial completion of the project.
To approve a large-scale capital project, the project must meet an acceptable level of return on the capital to be employed in the project. We base these economic projections on our best estimate of future market conditions that are not within our control. Most large-scale projects take many years to complete and during this multi-year period, market conditions can change from those we forecast due to changes in general economic conditions, available alternative supply and changes in customer demand. Accordingly, we may not be able to realize our expected returns from a large investment in a capital project, and this could negatively impact our results of operations, cash flows and return on capital employed.
Because of our debt obligations, our business, financial condition, results of operations and cash flows could be negatively impacted by a deterioration of our credit profile, a decrease in debt capacity or unsecured commercial credit available to us, or by factors adversely affecting credit markets generally.
At December 31, 2016, our total debt obligations for borrowed money and capital lease obligations were $7.0 billion. We may incur substantial additional debt obligations in the future.
Our indebtedness may impose various restrictions and covenants on us that could have material adverse consequences, including:
| • | increasing our vulnerability to changing economic, regulatory and industry conditions; |
| • | limiting our ability to compete and our flexibility in planning for, or reacting to, changes in our business and the industry; |
| • | limiting our ability to pay dividends to our stockholders; |
| • | limiting our ability to borrow additional funds; and |
December 31, 2016 | 21 | ||
| RISK FACTORS | ||
| • | requiring us to dedicate a substantial portion of our cash flow from operations to payments on our debt, thereby reducing funds available for working capital, capital expenditures, acquisitions and other purposes. |
Refining optimization requires precise inventory management, which we perform through combinations of working capital and debt. A decrease in our debt or commercial credit capacity, including unsecured credit extended by third-party suppliers, or a deterioration in our credit profile, could increase our costs of borrowing money or limit our access to the capital markets and commercial credit, which could affect our ability to manage our inventory or otherwise materially and adversely affect our business, financial condition, results of operations and cash flows.
Our business may be negatively affected by work stoppages, slowdowns or strikes by our employees, as well as new labor requirements.
As of December 31, 2016, approximately 2,090 of our employees are covered by collective bargaining agreements at our Anacortes, Mandan, Martinez, Los Angeles and Salt Lake City refineries. The agreements for approximately 1,750 of these employees will expire on February 1, 2019, agreements for approximately 80 others will expire on March 1, 2017, and agreements for the remaining represented employees expire on May 1, 2019. A strike, work stoppage or other labor action could have an adverse effect on our financial condition or results of operations.
In addition, California requires refinery owners to pay prevailing wages to contract craft workers and restricts refiners’ ability to hire qualified employees to a limited pool of applicants. Legislation or changes in regulations (e.g. the U.S. Department of Labor’s recent interpretation regarding joint employers/independent contractors) could result in labor shortages higher labor costs, and an increased risk that contract employees become joint employees of Tesoro, which could trigger bargaining issues, employment discrimination liability issues as well as wage and benefit consequences, especially during critical maintenance and construction periods.
Ownership of the general partner of TLLP may involve a greater exposure to legal liability than our historic business operations.
One of our subsidiaries acts as the general partner of TLLP. Our control of the general partner may increase the possibility of claims of breach of fiduciary duties including claims of conflicts of interest related to TLLP. Any liability resulting from such claims could have a material adverse effect on our future business, financial condition, results of operations and cash flows.
ITEM 1B. UNRESOLVED STAFF COMMENTS
None.
ITEM 2. PROPERTIES
Our principal properties are described in Item 1 under “Refining,” “TLLP” and “Marketing.” We believe that our properties and facilities are adequate for our operations and are adequately maintained. We, along with TLLP, are the lessee under a number of cancellable and noncancellable leases for certain properties, including office facilities, retail facilities, ship charters, barges and equipment used in the storage, transportation and production of feedstocks and refined products. We conduct our marketing business through a network of 2,492 retail stations. Our unbranded business includes volumes sold through agreements with third-party distributors/operators at terminals supporting our refineries. See Note 12 and 15 to our consolidated financial statements in Item 8 for additional information on our leased properties.
ITEM 3. LEGAL PROCEEDINGS
In the ordinary course of business, we become party to lawsuits, administrative proceedings and governmental investigations, including environmental, regulatory and other matters. Large, and sometimes unspecified, damages or penalties may be sought from us in some matters and certain matters may require years to resolve. Although we cannot provide assurance, we believe that an adverse resolution of the matters described below will not have a material adverse impact on our liquidity, financial position, or results of operations.
UNRESOLVED MATTERS
MERGER-RELATED LITIGATION. On February 7, 2017, a Tesoro stockholder filed a purported class action complaint in the Court of Chancery of the State of Delaware, captioned Carl Arias v. Gregory J Goff, et al., Case No. 2017-0094-, on behalf of himself and all other Tesoro stockholders against the current members of our board of directors. The complaint alleges that our directors breached their fiduciary duties of care, loyalty, good faith and/or disclosure by failing to disclose to our stockholders all material
22 | Tesoro Corporation | ||
| LEGAL PROCEEDINGS | ||
information necessary to make an informed decision regarding whether to approve the issuance of Tesoro common stock in connection with our proposed acquisition of Western Refining. Among other remedies, the plaintiff seeks to enjoin the merger and to hold our directors liable for allegedly breaching their fiduciary duties. The action also seeks to recover costs and disbursements from the defendants, including attorneys’ fees and experts’ fees. The defendants intend to defend the action vigorously.
WASHINGTON REFINERY FIRE. The naphtha hydrotreater unit at our Washington refinery was involved in a fire in April 2010, which fatally injured seven employees and rendered the unit inoperable. The Washington State Department of Labor & Industries (“L&I”) initiated an investigation of the incident. L&I completed its investigation in October 2010, issued a citation and assessed approximately a $2 million fine, which we appealed. We disagree with L&I’s characterizations of operations at our Washington refinery and believe, based on available evidence and scientific reviews, that many of the agency’s conclusions are mistaken. We filed an appeal of the citation in January 2011. In separate September 2013, November 2013 and February 2015 orders, the Board of Industrial Insurance Appeals (“BIIA”) granted partial summary judgment in our favor rejecting 33 of the original 44 allegations in the citation as lacking legal or evidentiary support. The hearing on the remaining 11 allegations concluded in July 2016, and we expect the judge to issue a recommended decision for the BIIA’s review in 2017. While we cannot currently estimate the final amount or timing of the resolution of this matter, we have established an accrual based on our best estimate at the time.
AIR QUALITY REGULATIONS. On February 12, 2016, we received an offer to settle 35 Notice of Violations (“NOV”) received from the Bay Area Air Quality Management District (“BAAQMD”). The NOVs were issued from May 2011 to November 2015 and allege violations of air quality regulations for ground level monitors located at our Martinez refinery. While we are negotiating a settlement of the allegations with the BAAQMD, we cannot currently estimate the amount or timing of the resolution of this matter, and we believe the outcome will not have a material impact on our liquidity, financial position, or results of operations.
Also, on January 31, 2017, we received an offer to settle 51 NOVs received from the BAAQMD. The NOVs were issued from July 2011 to July 2015 and allege violations of various air quality regulations at our Martinez refinery. While we are evaluating the allegations and cannot currently estimate the amount or timing of the resolution of this matter, we believe the outcome will not have a material impact on our liquidity, financial position, or results of operations.
FUEL STANDARDS. On April 19, 2016, we received an offer to settle two NOVs received from CARB. The NOVs were issued in February 2016 and allege certain batches of fuels produced in June and July 2015 at our Martinez and Los Angeles refineries violated fuel standards within the California Code of Regulations. While we are actively discussing a settlement of the allegations with CARB, we cannot currently estimate the amount or timing of the resolution of this matter.
RESOLVED MATTERS
In December 2016, we settled allegations from CARB related to reports filed by our Los Angeles refinery in 2013 and 2014 under California’s Greenhouse Gas Mandatory Reporting Program. The amount paid to settle this matter did not have a material impact on our liquidity, financial positions or results of operations. Also in December 2016, we agreed to settle three NOVs from the County of San Diego, Department of Environmental Health. The NOVs were issued after the inspection of three marketing sites between December 2014 and June 2015 and alleged improper operation of underground storage tank leak detection equipment as required by the California Health and Safety Code. The amount we have agreed to pay to settle this matter will not have a material impact on our liquidity, financial position or results of operations.
ITEM 4. MINE SAFETY DISCLOSURES
Not applicable.
December 31, 2016 | 23 | ||
MARKET FOR EQUITY, STOCKHOLDER MATTERS AND PURCHASES OF EQUITY SECURITIES | ||
PART II
ITEM 5. MARKET FOR REGISTRANT’S COMMON EQUITY, RELATED STOCKHOLDER MATTERS AND ISSUER PURCHASES OF EQUITY SECURITIES
PERFORMANCE GRAPH
The performance graph below compares the cumulative total return of our common stock to (a) the cumulative total return of the S&P 500 Composite Index and (b) a composite peer group (“Peer Group”) comprised of HollyFrontier Corporation, Marathon Petroleum, Phillips 66 and Valero Energy Corporation. The graph below is for the five year period commencing December 31, 2011 and ending December 31, 2016.
We selected the Peer Group to include four domestic refining companies we believe follow a similar business model to ours, including refining, transporting, storing and marketing transportation fuels and related products. The Peer Group is representative of companies that we internally benchmark against.
COMPARISON OF FIVE YEAR CUMULATIVE TOTAL RETURN
AMONG THE COMPANY, THE S&P COMPOSITE 500 INDEX AND COMPOSITE PEER GROUPS (a)
| 12/31/2011 | 12/31/2012 | 12/31/2013 | 12/31/2014 | 12/31/2015 | 12/31/2016 | ||||||||||||||||||
| Tesoro | $ | 100.00 | $ | 189.79 | $ | 256.32 | $ | 331.66 | $ | 479.25 | $ | 408.45 | |||||||||||
| S&P 500 | 100.00 | 116.00 | 153.57 | 174.60 | 177.01 | 198.18 | |||||||||||||||||
| Peer Group | 100.00 | 173.58 | 258.76 | 250.29 | 315.43 | 328.51 | |||||||||||||||||
| (a) | Assumes that the value of the investments in common stock and each index was $100 on December 31, 2011, and that all dividends were reinvested. Investment is weighted on the basis of market capitalization. |
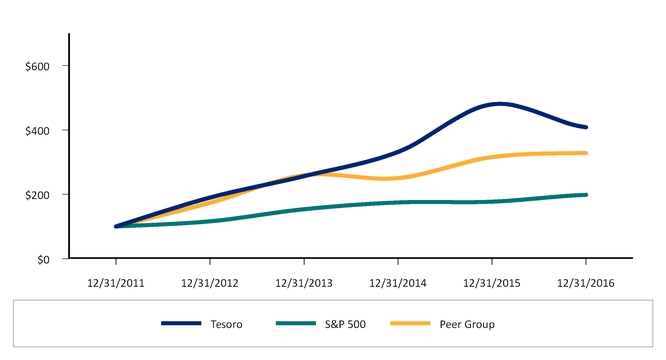
Note: The stock price performance shown on the graph is not necessarily indicative of future performance.
24 | Tesoro Corporation | ||
MARKET FOR EQUITY, STOCKHOLDER MATTERS AND PURCHASES OF EQUITY SECURITIES | ||
STOCK PRICES AND DIVIDENDS PER COMMON SHARE
Our common stock is listed under the symbol “TSO” on the New York Stock Exchange.
HIGH AND LOW SALES PRICES AND DIVIDENDS DECLARED AND PAID ON OUR COMMON STOCK
| Sales Prices per Common Share | Dividends per Common Share | ||||||||||
| Quarter Ended | High | Low | |||||||||
| December 31, 2016 | $ | 93.06 | $ | 78.32 | $ | 0.55 | |||||
| September 30, 2016 | 84.89 | 69.49 | 0.55 | ||||||||
| June 30, 2016 | 87.85 | 70.78 | 0.50 | ||||||||
| March 31, 2016 | 109.24 | 67.80 | 0.50 | ||||||||
| December 31, 2015 | 119.67 | 95.37 | 0.50 | ||||||||
| September 30, 2015 | 110.74 | 83.75 | 0.50 | ||||||||
| June 30, 2015 | 93.14 | 81.77 | 0.425 | ||||||||
| March 31, 2015 | 94.83 | 64.16 | 0.425 | ||||||||
DIVIDEND DECLARATION
Our Board of Directors (the “Board”) declared a quarterly cash dividend on common stock of $0.55 per share on February 3, 2017. The dividend is payable on March 15, 2017 to holders of record at the close of business on February 28, 2017. There were approximately 916 holders of record of our 116,986,291 outstanding shares of common stock on February 15, 2017. For information regarding restrictions on future dividend payments and stock purchases, see Item 7 and Note 16 to our consolidated financial statements in Item 8.
PURCHASES OF EQUITY SECURITIES
We are authorized by our Board to purchase shares of our common stock in open market transactions at our discretion. The Board’s authorization has no time limit and may be suspended or discontinued at any time. Purchases of our common stock can also be made to offset the dilutive effect of stock-based compensation awards and to meet our obligations under employee benefit and compensation plans, including the exercise of stock options and vesting of restricted stock and to fulfill other stock compensation requirements. Our Board authorized a $1.0 billion share repurchase program on July 30, 2014. On October 28, 2015, our Board approved a new $1.0 billion share repurchase program to become effective upon the full completion of the previous $1.0 billion share repurchase authorized. On November 16, 2016 the Board approved an additional $1.0 billion of share repurchases. We purchased approximately 3.2 million and 6.9 million shares of our common stock in the years ended December 31, 2016 and 2015 for approximately $250 million and $644 million, respectively. We have $2.1 billion remaining under our authorized programs as of December 31, 2016.
PURCHASES BY TESORO OF ITS COMMON STOCK
| Period | Total Number of Shares Purchased (a) | Average Price Paid per Share | Total Number of Shares Purchased as Part of Publicly Announced Plans or Programs | Approximate Dollar Value of Shares that May Yet Be Purchased Under the Plans or Programs (in millions) | |||||||||
| October 2016 | 94,074 | $ | 81.53 | 94,074 | $ | 1,106 | |||||||
| November 2016 | 221 | $ | 86.56 | — | $ | 2,106 | |||||||
| December 2016 | — | $ | — | — | $ | 2,106 | |||||||
| Total | 94,295 | 94,074 | |||||||||||
| (a) | Includes 221 shares acquired from employees during the fourth quarter of 2016 to satisfy tax withholding obligations in connection with the vesting of restricted stock issued to them. |
December 31, 2016 | 25 | ||
| SELECTED FINANCIAL DATA | |||
ITEM 6. SELECTED FINANCIAL DATA
The following table sets forth certain selected consolidated financial data of Tesoro as of and for each year in the five-year period ended December 31, 2016. The selected consolidated financial information presented below has been derived from our historical financial statements. The following table should be read in conjunction with Item 7 and our consolidated financial statements in Item 8.
| Years Ended December 31, | |||||||||||||||||||
| 2016 | 2015 | 2014 | 2013 | 2012 | |||||||||||||||
| (in millions except per share amounts) | |||||||||||||||||||
| Statement of Consolidated Operations Data | |||||||||||||||||||
| Revenues | $ | 24,582 | $ | 28,711 | $ | 40,633 | $ | 37,601 | $ | 29,809 | |||||||||
| Net Earnings from Continuing Operations | 850 | 1,694 | 917 | 434 | 903 | ||||||||||||||
| Net Earnings from Continuing Operations Attributable to Tesoro Corporation | 724 | 1,544 | 872 | 392 | 876 | ||||||||||||||
| Net Earnings from Continuing Operations per Share: | |||||||||||||||||||
| Basic | 6.11 | 12.53 | 6.79 | 2.90 | 6.28 | ||||||||||||||
| Diluted | 6.04 | 12.39 | 6.67 | 2.85 | 6.20 | ||||||||||||||
| Dividends per Share | 2.10 | 1.85 | 1.10 | 0.90 | 0.27 | ||||||||||||||
| As of December 31, | |||||||||||||||||||
| 2016 | 2015 | 2014 | 2013 | 2012 | |||||||||||||||
| (In millions) | |||||||||||||||||||
| Consolidated Balance Sheet Data | |||||||||||||||||||
| Total Current Assets | $ | 7,414 | $ | 4,307 | $ | 5,074 | $ | 5,262 | $ | 4,522 | |||||||||
| Total Assets | 20,398 | 16,332 | 16,491 | 13,252 | 10,538 | ||||||||||||||
| Total Debt, Net of Unamortized Issuance Costs | 6,933 | 4,073 | 4,167 | 2,756 | 1,538 | ||||||||||||||
| Total Liabilities | 12,271 | 8,592 | 9,515 | 7,767 | 5,801 | ||||||||||||||
| Tesoro Corporation Stockholders’ Equity | 5,465 | 5,213 | 4,454 | 4,302 | 4,251 | ||||||||||||||
| Total Equity | 8,127 | 7,740 | 6,976 | 5,485 | 4,737 | ||||||||||||||
26 | Tesoro Corporation | ||
| MANAGEMENT’S DISCUSSION AND ANALYSIS | ||
ITEM 7. MANAGEMENT’S DISCUSSION AND ANALYSIS OF FINANCIAL CONDITION AND RESULTS OF OPERATIONS
The following information concerning our results of operations and financial condition should be read in conjunction with Items 1 and 2 and our consolidated financial statements in Item 8.
Management’s Discussion and Analysis is our analysis of our financial performance, financial condition and significant trends that may affect future performance. All statements in this section, other than statements of historical fact, are forward-looking statements that are inherently uncertain. See “Important Information Regarding Forward-Looking Statements” for a discussion of the factors that could cause actual results to differ materially from those projected in these statements.
BUSINESS STRATEGY AND OVERVIEW
In recent years, we have implemented strategies to transform the composition of our portfolio of refining, logistics and marketing assets. In 2010, the majority of our operating income was generated through our Refining segment with only a small portion attributable to our previous retail segment and we did not have commercial logistics operations. As of 2016, Tesoro Logistics, LP (“TLLP”) has grown significantly and our Marketing segment continues to expand at a steady rate as a percentage of contribution to our consolidated operating income. We are committed to further integrating our business model, improving our value chain optimization and continuing to diversify our portfolio amongst our segments and be a leader among our independent refining peers. To help us achieve this strategy, organic growth and growth by acquisition are key contributors. See our Capital Expenditures discussion within the Capital Resources and Liquidity section for more on our organic growth strategy.
On November 16, 2016, Tesoro entered into an Agreement and Plan of Merger with Western Refining, Inc. (“Western Refining”) and other Tesoro wholly-owned subsidiaries (the “Merger”). Western Refining has
| • | three refineries in Texas, New Mexico and Minnesota with a total refining capacity of approximately 254 Mbpd, which would expand the combined company’s operational capabilities and improve our access to advantaged crude oil and extended product regions; |
| • | three premium and value retail and convenience store brands to better serve a broader customer base and regional preferences; and |
| • | an extensive and complementary logistics network with access to advantaged crude oil basins, including the Permian. |
The completion of the Merger is expected in the first half of 2017, subject to certain customary mutual conditions and regulatory approval. We believe the Merger aligns with the strategic objectives for our refining, marketing and logistics businesses, which are discussed below. Per the registration statement on Form S-4, which was declared effective February 16, 2017, the transaction was valued at approximately $4.1 billion consisting of stock and cash consideration. See Note 2 in Part II, Item 8 for more details about the Merger.
STRATEGY AND GOALS
As the leading integrated refining, marketing and logistics company in our strategic foot print, we are driven to create value by driving significant business improvements to provide for sustainable earnings growth, utilizing a disciplined approach to capital allocation to create significant long-term shareholder value and consistently executing on our goals in the delivery of results. Our diversified and integrated portfolio of assets and operations provides us with strong growth opportunities across the refining, marketing and logistics value chain. The following discussion outlines how we create value in each of our business segments.
REFINING. In our Refining segment, our strategy focuses on our ability to access regionally advantaged crude oil, optimize our system-wide value chain to drive strong gross refining margin capture, drive operational excellence enabling asset availability in excess of 97% and deliver other annual improvement objectives discussed in the Market Conditions and Performance Objectives section below. To meet our strategic objectives, we invest in high return capital projects designed to enhance our feedstock flexibility, improve our yields and lower our costs. See the Capital Expenditures section for discussion of major capital projects in development or in process.
TLLP. Through our ownership of TLLP and TLLP’s continued growth, we expect our logistics assets and in-region placement to minimize our transportation costs and maximize our overall performance by focusing on a stable, fee-based business, optimizing its existing asset base, pursuing organic expansion opportunities and growing through strategic acquisitions. Additionally, our ownership in TLLP creates value to our shareholders through the lower cost of capital available to TLLP as a limited partnership and our receipt of TLLP’s quarterly distributions. As the distributions per unit increase, our proportion of the total distributions grow at an accelerated rate due to our incentive distribution rights. For example, we received $245 million in distributions from TLLP during 2016 compared to $148 million and $87 million in 2015 and 2014, respectively. We believe TLLP is well positioned
December 31, 2016 | 27 | ||
| MANAGEMENT’S DISCUSSION AND ANALYSIS | ||
to achieve its primary business objectives and execute business strategies based on its long-term fee-based contracts, relationship with us, strategically positioned assets and financial flexibility provided by its balanced capital structure, revolving credit facility capacity, dropdown credit facility, ability to access equity capital markets through its continuous issuance program and financial support from us.
MARKETING. Our marketing assets provide a secure and ratable offtake of high value gasoline and diesel production from our refineries. We are driving growth and improvements in our Marketing segment by focusing on higher value, branded distribution channels, adding new retail sites to our network, and implementing store improvements, to enhance our convenience store position.
Underpinning our strategy and goals for all of our businesses is a high performing culture where every employee leads according to our guiding principles and has the opportunity to make a difference. These guiding principles are as follows:
| • | CORE VALUES – We act individually and collectively with the highest level of integrity and we are steadfast in our commitment to safety, health and the environment. |
| • | EXCEPTIONAL PEOPLE – We employ the best people and develop our capabilities and leadership to realize our objectives. |
| • | SHARED PURPOSE – Everyone clearly understands and owns our vision, strategy, how they fit and what they are expected to contribute. |
| • | POWERFUL COLLABORATION – We leverage the power of collaboration and our individual and collective expertise to create value and competitive advantage. |
| • | SUPERIOR EXECUTION – We pursue and deliver our objectives with energy, passion and a sense of urgency to deliver industry-leading results. |
By following our guiding principles, we aim to achieve strategic priorities that are focused on the delivery of operational efficiency and effectiveness, value chain optimization, financial discipline, and value-driven growth. In addition, we take a principles-based approach to conducting our business, seeking to create shared value for key stakeholders including employees, communities, business partners, government and the environment.
| STRATEGIC PRIORITIES | ||||||||
OPERATIONAL EFFICIENCY & EFFECTIVENESS continuously improving safety, compliance, reliability, system improvements and cost leadership | ||||||||
HIGH PERFORMING CULTURE fostering a culture that is committed to building leadership at all levels of the organization and across our value chain with employees from diverse backgrounds and experiences while being firmly grounded in our guiding principles | ||||||||
VALUE CHAIN OPTIMIZATION enhancing margin capture through our supply and trading activities, optimization of our integrated businesses and customer focus | ||||||||
FINANCIAL DISCIPLINE maintaining a strong financial position by exercising capital discipline and focusing on a balanced use of free cash flow | ||||||||
VALUE-DRIVEN GROWTH extending our capabilities and growing earnings through growth in our logistics and marketing businesses and other strategic opportunities accretive to shareholder value | ||||||||
28 | Tesoro Corporation | ||
| MANAGEMENT’S DISCUSSION AND ANALYSIS | ||
The following table outlines how significant accomplishments during 2016 align with our strategic priorities:
SIGNIFICANT ACCOMPLISHMENTS DURING 2016
Operational Efficiency & Effectiveness | Value Chain Optimization | Financial Discipline | Value Driven Growth | High Performing Culture | |
Tesoro announced on November 17, 2016 it entered into a definitive agreement to acquire Western Refining. The transaction will result in a highly integrated and geographically diversified refining, marketing and logistics company. In conjunction with the acquisition, Tesoro: - completed an offering of $1.6 billion aggregate principal amount senior notes due 2023 and 2026 with the proceeds to be used to refinance certain Western Refining debt; and - amended its revolving credit agreement to provide an incremental $1.0 billion revolving facility. - filed a registration statement on Form S-4, which was declared effective February 16, 2017, to issue up to approximately 47.8 million shares to complete the Merger. | • | • | • | • | |
| TLLP announced it had entered into a purchase and sale agreement on November 21, 2016 to buy crude oil, natural gas and produced water gathering pipelines and two processing facilities in the Bakken Region of North Dakota for $700 million that closed on January 1, 2017. | • | • | • | ||
Tesoro completed the following acquisitions: - Virent, Inc., an innovative renewable fuels and chemicals company that supports Tesoro’s renewable fuels strategy of developing high-quality, lower carbon, renewable feedstocks and blendstocks that can either be co-processed in existing refineries or blended seamlessly with traditional fuels; - Dakota Prairie Refining, LLC, including its refinery (“Dickinson Refinery”) with crude oil capacity of 20 Mbpd and produces ultra-low sulfur diesel, naphtha and atmospheric residuals; - crude oil pipeline and gathering system as well as transportation, storage and rail loading facilities in the Williston Basin; and - refined product terminals, truck racks, storage and rail loading facilities in Alaska along with wholesale fuel marketing contracts. | • | • | • | • | |
| Anacortes refinery achieved one year of operations without an OSHA recordable injury and received the Elite Silver Award from AFPM as part of their Distinguished Safety Awards process. | • | • | |||
| TLLP’s Colton Clean Products fleet reached 10 years and 8 million miles without an on-road preventable accident. | • | • | |||
TLLP completed its acquisition of: - the Alaska Storage and Terminalling Assets from Tesoro; and - the Northern California Terminalling and Storage Assets from Tesoro. | • | • | • | ||
| Tesoro entered into a new senior revolving credit agreement which provides a total capacity of $2.0 billion which is free from borrowing base redeterminations, becomes unsecured if investment grade credit rating is achieved, and matures in September 2020. | • | ||||
During 2016, TLLP: - amended its credit agreement and entering into a new dropdown credit facility providing additional resources for organic expansion opportunities and strategic acquisitions; - completed a $700 million registered senior notes offering with the proceeds used to repay amounts then borrowed on its credit facilities; and - completed an offering of $750 million aggregate principal amount of senior notes with the proceeds used to repay amounts outstanding due to the dropdown acquisitions. | • | ||||
December 31, 2016 | 29 | ||
| MANAGEMENT’S DISCUSSION AND ANALYSIS | ||
MARKET CONDITIONS AND PERFORMANCE OBJECTIVES
Our year-over-year operating performance and results are impacted significantly by prevailing market conditions and our ability to drive value creation across our businesses through high utilization, operational effectiveness and other annual improvements to our base business model. The following sections outline the general market conditions impacting our business throughout 2016 and our delivery on previously established performance objectives designed to maximize utilization, operate effectively and improve our core operations through other annual improvements. These sections should be read in conjunction with the Results of Operations discussion in the following pages of this Management’s Discussion and Analysis.
MARKET CONDITIONS
2015 SUMMARY. During most of 2015, we experienced above average margin environments in our regions due to various events and factors impacting supply and demand. We saw crude oil price volatility continue in the fourth quarter of 2015 due to multiple factors including weak global demand, continued supply growth outside the U.S. and political factors within the U.S., namely the lifting of the crude export ban. All of these events resulted in narrowing of U.S. domestic crude differentials compared to similar world markets. Weaker seasonal product demand in the fourth quarter resulted in lower margins than previous quarters, but continued growth in West Coast gasoline demand and local supply disruptions brought about higher than normal margins in our West Coast regions for the fourth quarter. Gasoline margins were better than typically seen in the fourth quarter on growth in U.S. demand, while distillate margins were lower due to global oversupply and slowing growth in both domestic and emerging economies.
2016 DOMESTIC. Domestic markets have continued to experience volatility, with the price of Brent crude oil increasing over 50% in 2016 and nearly 12% in the fourth quarter. Supply growth in the Middle East and Russia in conjunction with declines in US crude production resulted in narrow domestic crude differentials relative to other global regions in a post export ban environment. Supply outages, changing logistical infrastructure, political aftereffects as well as improving domestic macroeconomic conditions have influenced all portions of our business.
In the markets in which we operate, product margins continue to reflect both global and regional fundamentals. Strong regional gasoline production was offset by demand growth which kept West Coast gasoline cracks near seasonal norms. In the 4th quarter, weaker seasonal demand resulted in lower gasoline cracks than the 3rd quarter, but increased exports to Mexico and Latin America provided support with West Coast margins averaging slightly below the five-year fourth quarter average. During the first three quarters of the year, slower global economic growth with the associated slower global diesel demand growth resulted in a surplus of global inventory which weighed heavily on diesel product cracks. However, West Coast distillate margins improved in the last quarter of 2016 due to seasonal turnaround maintenance which resulted in lower production and inventory declines. While U.S. product stocks ended the year at the top of the five year historical range, West Coast inventories of both gasoline and distillate were below the five year average reflecting a stronger fundamental environment compared to the other domestic regions. We continue to monitor the impact of changes on prices and fundamentals on our business.
2016 GLOBAL. The global energy markets have also experienced volatility due to uncertainty for growth in the developing regions of the world, the OPEC/non-OPEC crude production agreement, and fluctuations in the financial markets. The market for crude oil, natural gas and refined products is affected by changes in economic conditions and the associated supply and demand balance changes. Product values and crude oil prices are set by the market and are outside our control. We expect global market conditions to drive continued volatility in our markets.
30 | Tesoro Corporation | ||
| MANAGEMENT’S DISCUSSION AND ANALYSIS | ||
PERFORMANCE OBJECTIVES
UTILIZATION AND OPERATIONAL EFFECTIVENESS. In December 2015, we laid out plans to deliver $500 to $600 million of improvements to operating income in 2016 resulting from improved utilization and operational effectiveness as compared to our 2015 operating performance. In 2015, we experienced lower than normal utilization and operational effectiveness primarily due to the work stoppage and an extended turnaround at our Utah refinery, both of which negatively impacted our operating results during those times. As a result, we set forth these improvement objectives to provide a way to compare our operating results in 2016 to 2015, exclusive of market impacts and the annual improvements to operating income discussed below. Our expectations for 2016 were a Tesoro Index (as defined in our Glossary of Terms) of $12 to $14 per throughput barrel in our Refining segment, fuel margins of 11 to 14 cents per gallon in our Marketing segment and crude oil differentials reflecting transportation costs which impact our Refining segment results. For the full year 2016, the Tesoro Index was at the low end of the range and Marketing fuel margins were in line with expectations. Crude oil differentials were significantly narrower than expectations and resulted in lower year-over-year capture rates and refining profitability. For the full year 2016, we delivered an estimated $485 million of year-over-year improvements compared to 2015 from higher utilization and operational efficiencies versus our original commitment of $500 to $600 million, which was revised to $400 to $500 million in the second quarter of 2016. Given the results in 2016 and the expectations about the Tesoro Index and marketing fuel margins remain the same as experienced in 2016 along with the crude oil differentials existing in the market at the end of 2016, no separate improvement goal for utilization and operational effectiveness is being established for 2017.
OTHER ANNUAL IMPROVEMENTS. In December 2015, we also committed to delivering $400 to $500 million of annual improvements to operating income in 2016, consisting of $200 to $250 million in Refining, $175 to $200 million in TLLP and $25 to $50 million in Marketing. For the full year 2016, we estimate that we delivered approximately $420 million of annual improvements to operating income, including Refining segment improvements of approximately $245 million, TLLP segment improvements of approximately $130 million and Marketing segment improvements of approximately $45 million. Estimated TLLP operating income improvements were below the range primarily due to the weak commodity price environment, which impacted crude oil and natural gas volumes and organic growth. Our 2016 achievements include the following in our Refining segment:
| • | Renegotiated a legacy product supply contract at our Los Angeles refinery, which will allow for greater yield flexibility and increased alternatives for sale and distribution of specialty products; |
| • | Installed a new preflash tower at our Los Angeles refinery, which allows for greater yield flexibility and energy savings; |
| • | Sourced new types of crude oils resulting in crude optimizations; |
| • | Shared new crude oil cargos between the Los Angeles refinery and our Martinez refinery; |
| • | Improved crude blending capabilities at the Carson crude terminal that resulted in higher throughput volumes; |
| • | Improved pipeline connectivity between the Los Angeles refinery sites; |
| • | Integrated naphtha and gasoline blendstocks on the West Coast; |
| • | Re-distributed in-bound crude oil to our Kenai refinery during maintenance and turnaround activities at our Anacortes refinery to optimize our west coast system; |
| • | Transported intermediates from our Dickinson refinery to our Anacortes and Salt Lake City refineries for additional upgrading; |
| • | Operated our Salt Lake City refinery’s fluid catalytic cracker during the third quarter turnaround by running intermediates from our Dickinson refinery and waxy crude oil; and |
| • | Completed the second phase of the Salt Lake City Refinery Expansion project. |
Additionally, in our TLLP segment, operating income was positively impacted by the strategic acquisition of assets from Tesoro during 2016, optimization of existing terminalling and transportation assets and the completion of the second phase of gathering systems connecting additional wells located in the North Dakota Williston Basin/Bakken Shale area (the “High Plains System”). Further, our Marketing segment experienced continued growth in its retail station network with the addition of 95 sites during the year.
As announced in November 2016, we plan to deliver $475 to $575 million of annual improvements to operating income during 2017 in addition to the improvements delivered in 2016.
December 31, 2016 | 31 | ||
| MANAGEMENT’S DISCUSSION AND ANALYSIS | ||
RESULTS OF OPERATIONS
A discussion and analysis of the factors contributing to our results of operations is presented below. The accompanying consolidated financial statements in Item 8, together with the following information, are intended to provide investors with a reasonable basis for assessing our historical operations, but should not serve as the only criteria for predicting our future performance.
ITEMS IMPACTING COMPARABILITY
The TLLP financial and operational data presented include the historical results of all assets acquired from Tesoro prior to the acquisition dates. The acquisitions from Tesoro were transfers between entities under common control. Accordingly, the financial information of TLLP contained herein has been retrospectively adjusted to include the historical results of the assets acquired from Tesoro prior to the effective date of each acquisition for all periods presented and do not include revenue for transactions with Tesoro with the exception of regulatory tariffs on its pipeline assets. The TLLP financial data is derived from the combined financial results of the TLLP predecessor (the “TLLP Predecessor”). We refer to the TLLP Predecessor and, prior to each acquisition date, the acquisitions from Tesoro collectively, as “TLLP’s Predecessors.”
NON-GAAP MEASURES
Our management uses certain “non-GAAP” performance measures to analyze operating segment performance and non-GAAP financial measures to evaluate past performance and prospects for the future to supplement our GAAP financial information presented in accordance with accounting principles generally accepted in the United States of America (“U.S. GAAP”). These financial non-GAAP measures are important factors in assessing our operating results and profitability and include:
| • | EBITDA-U.S. GAAP-based net earnings before interest, income taxes, and depreciation and amortization expenses |
| • | Debt to capitalization ratio excluding TLLP-the ratio achieved by dividing the net result of our consolidated debt less all debt owed by TLLP (both net of unamortized issuance costs) by the sum of our consolidated debt less TLLP’s total debt (both net of unamortized issuance costs) and our total equity less noncontrolling interest associated with the public ownership of TLLP |
We present these measures because we believe they may help investors, analysts, lenders and ratings agencies analyze our results of operations and liquidity in conjunction with our U.S. GAAP results, including but not limited to:
| • | our operating performance as compared to other publicly traded companies in the refining, logistics and marketing industries, without regard to historical cost basis or financing methods; |
| • | our ability to incur and service debt and fund capital expenditures; and |
| • | the viability of acquisitions and other capital expenditure projects and the returns on investment of various investment opportunities. |
Management also uses these measures to assess internal performance, and we believe they may provide meaningful supplemental information to the users of our financial statements. Non-GAAP measures have important limitations as analytical tools, because they exclude some, but not all, items that affect net earnings and operating income. These measures should not be considered substitutes for their most directly comparable U.S. GAAP financial measures.
32 | Tesoro Corporation | ||
| MANAGEMENT’S DISCUSSION AND ANALYSIS | ||
HIGHLIGHTS (in millions)
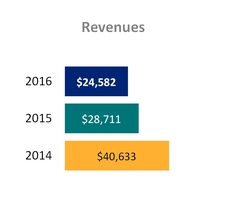
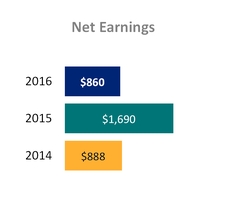
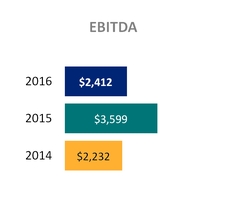
RECONCILIATION OF NET EARNINGS TO EBITDA (in millions)
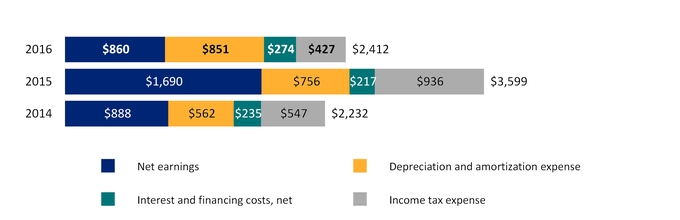
2016 COMPARED TO 2015
OVERVIEW. Our net earnings in 2016 of $860 million decreased from net earnings of $1.7 billion in 2015 primarily due to the weaker margin environment within our Refining segment. Similarly, EBITDA of $2.4 billion in 2016 declined $1.2 billion, or 33%, from $3.6 billion in 2015 as a result of the weaker margin environment.
GROSS MARGINS. Our gross refining margin decreased $1.2 billion during 2016 compared to 2015 primarily driven by a weaker margin environment across all the regions in which we operate. The $4.70 decrease in our gross refining margin per barrel included the benefits of higher throughput in the year due to continued demand growth and the positive impact of the net lower of cost or market inventory adjustment of $359 million reversing in 2016 compared to an additional charge of $317 million in 2015. With a continued volatile price environment, the impact of our lower of cost of market adjustment can vary and may increase in the future. TLLP revenues, net of operating expenses, increased $92 million due to higher storage fees as well as terminalling and pipeline transportation throughput volumes driven by assets acquired in the year and continued organic expansion. Our gross marketing margin decreased $68 million primarily due to lower fuel margins in 2016 partially offset by increased fuel sales in the year.
OPERATING AND OTHER EXPENSES. Operating expenses remained relatively flat at $2.5 billion in 2016 compared to 2015. Depreciation and amortization expenses increased $95 million to $851 million in 2016 compared to 2015 primarily due to depreciation and amortization associated with the Great Northern Midstream acquisition along with new assets and turnarounds placed into service during the year.
INTEREST AND FINANCING COSTS, NET. Interest and financing costs increased approximately $57 million to $274 million during 2016 from $217 million in 2015. The increase was attributable to the write-off of deferred financing costs related to revolver amendments, bridge facility fees in anticipation of the Western Refining acquisition and new debt issuances in the year, primarily the $250 million aggregate principal amount of TLLP’s 6.125% Senior Notes due in 2021 and the $450 million aggregate principal amount of TLLP’s 6.375% Senior Notes due in 2024 issued in May 2016.
December 31, 2016 | 33 | ||
| MANAGEMENT’S DISCUSSION AND ANALYSIS | ||
OTHER INCOME. Other income during 2016 included gains of $15 million related to pipeline tariff refunds received in California, $13 million proceeds related to an insurance settlement on contaminated crude oil shipment we received in 2013 and $9 million gain related to an adjustment permitted in the agreement from the 2013 acquisition of the ARCO® brand. In 2015, other income included a gain for an insurance settlement of $11 million related to the Washington Refinery Fire.
INCOME TAX EXPENSE. Our income tax expense from continuing operations totaled $427 million in 2016 versus $936 million in 2015. The decreased income tax expense is attributable to the decrease in earnings before income taxes. The combined federal and state effective income tax rate was 33.4% and 35.6% during 2016 and 2015, respectively. Compared to 2015, the income from non-taxable noncontrolling interests attributable to TLLP was a higher percentage of earnings before income taxes. The 2016 rate also benefited from a $16 million decrease in expense related to the early adoption of Accounting Standards Updated (“ASU”) 2016-09, “Improvements to Employee Share-Based Payment Accounting.” See Note 1 to our consolidated financial statements in Item 8 for additional information on ASU 2016-09.
EARNINGS (LOSS) FROM DISCONTINUED OPERATIONS, NET OF INCOME TAX. Earnings from discontinued operations related to the Hawaii Business, net of tax, were $10 million in 2016, compared to a $4 million loss in 2015. The earnings in 2016 primarily related to proceeds from the calendar year 2015 earn-out owed to the Company. The loss in 2015 was related to a change in estimate for the regulatory improvements we are required to make.
2015 COMPARED TO 2014
OVERVIEW. Our net earnings in 2015 were $1.7 billion compared with $888 million in 2014 due primarily to the stronger margin environment in our Refining segment and lower operating expenses. Similarly, EBITDA of $3.6 billion in 2015 increased $1.4 billion, or 61%, from $2.2 billion in 2014 driven by the margin environment.
GROSS MARGINS. Our gross refining margin increased $691 million during 2015 compared to 2014 primarily driven by a stronger margin environment across the California and Pacific Northwest regions. The increase in our gross refining margin was driven by an increase of $2.99 in our gross margin per barrel partially offset by the impact of the work stoppage and three refinery turnarounds on our refinery utilization during 2015 as well as the net lower of cost or market inventory adjustments of $317 million for 2015 compared to $42 million for 2014. With a continued volatile price environment, the impact of our lower of cost of market adjustments can vary and may increase in the future. TLLP revenues, net of operating expenses, increased $365 million due to higher throughput volumes driven by a full year of operating from the Rockies Natural Gas Business (defined in Item 8, Note 2), and additional operations from other acquired assets as well as continued expansion of its crude oil gathering assets. Our Marketing gross margin increased $296 million primarily driven by favorable fuel margins and strong demand.
OTHER COSTS AND EXPENSES. Operating expenses were largely in line at $2.5 billion in 2015 compared to 2014 primarily due to declining natural gas costs and the conversion of company-operated retail sites to MSOs that reduced costs associated with the management of station operations partially offset by increased expenses from a full year of operations from the Rockies Natural Gas Business. Depreciation and amortization expense increased $194 million to $756 million in 2015 compared to 2014 primarily due to depreciation and amortization associated with the Rockies Natural Gas Business and new assets placed into service. Loss on asset disposals and impairments for 2015 include various projects that were discontinued due to their lack of economic viability given the current market environment.
INTEREST AND FINANCING COSTS, NET. Interest and financing costs decreased approximately $18 million to $217 million during 2015 from $235 million during 2014. The decrease consisted primarily of financing transactions that occurred in 2014 that did not have a comparable transaction in 2015. These transactions include a $39 million charge for premiums paid, unamortized debt issuance costs and discounts related to the redemption of the 9.750% Senior Notes due 2019 and TLLP 5.875% Senior Notes due 2020 in 2014 as well as bridge fees in connection with TLLP’s Rockies Natural Gas Business acquisition. These decreases were partially offset by a full year of incremental interest on TLLP’s 5.500% Senior Notes due 2019 and TLLP’s 6.250% Senior Notes due 2022.
OTHER INCOME. Other income during 2015 included an insurance settlement gain of $11 million related to the Washington Refinery Fire and in 2014 included a refund and settlement from a crude pipeline network rate case settlement of $59 million.
INCOME TAX EXPENSE. Our income tax expense from continuing operations totaled $936 million in 2015 versus $547 million in 2014 with the increase attributable to the increase in earnings before income tax. The combined federal and state effective income tax rate was 35.6% and 37.4% during 2015 and 2014, respectively. Compared to 2014, the income from non-taxable noncontrolling interests attributable to TLLP was a higher percentage of earnings before income taxes.
34 | Tesoro Corporation | ||
| MANAGEMENT’S DISCUSSION AND ANALYSIS | ||
LOSS FROM DISCONTINUED OPERATIONS, NET OF INCOME TAX. Losses from discontinued operations related to the Hawaii Business, net of tax, were $4 million in 2015, compared to $29 million in 2014. The loss in 2014 primarily related to $42 million in charges related to regulatory improvements we are obligated to make at the Hawaii refinery to resolve the Clean Air Act matters discussed in Note 4 to our consolidated financial statements in Item 8. The loss in 2015 is related to a change in estimate for the regulatory improvements we are required to make.
REFINING SEGMENT
HIGHLIGHTS (in millions)
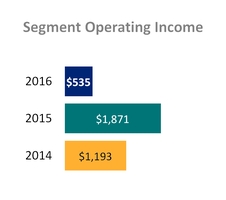
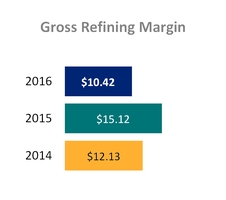
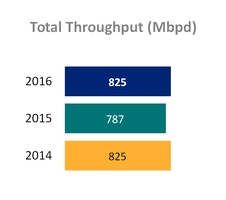
We currently own and operate seven petroleum refineries located in the western United States and sell transportation fuels to a wide variety of customers. Our refineries produce the majority of the transportation fuels that we sell. Our seven refineries have a combined crude oil capacity of 895 Mbpd. We purchase crude oil and other feedstocks from domestic and foreign sources, including the Middle East, South America, western Africa, Canada, and other locations either in the spot market or through term agreements with renewal provisions. Our Marketing segment, including its branded retail network, provides a committed outlet for the majority of the gasoline produced by our refineries; however, we also sell gasoline and gasoline blendstocks, jet fuel, diesel fuel, heavy fuel oils and residual products in bulk and opportunistically export refined products to certain foreign markets.
REFINING UTILIZATION (a)
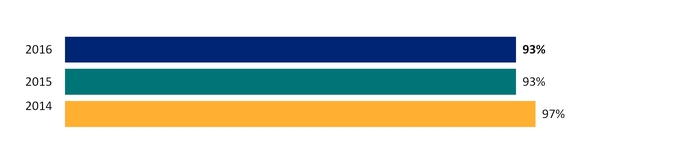
| (a) | Tesoro had a total refining capacity of 895 Mbpd in 2016 following the acquisition of the Dickinson refinery in June, in line with our acquisition oriented growth strategy. In December 2015, we updated our capacity to 875 Mbpd after the completion of several key capital projects. For purposes of the utilization calculation above, a total refining capacity of 850 Mbpd was used for the years ended December 31, 2015 and 2014. |
MARKET OVERVIEW. Results from our Refining segment are highly volatile and subject to many factors that are beyond our control. Revenue is not a good proxy for financial performance as the key driver of revenue is the underlying price per barrel of crude oil. Gross refining margin, refinery throughputs, crack spreads and crude oil differentials are better metrics to measure the performance of the Refining segment.
The gross refining margin is the difference between the prices of all manufactured refined products sold and the cost of crude oil and other feedstocks used to produce refined products, including the cost of transportation and distribution paid to TLLP and third parties at contractual rates. The market for crude oil and products is affected by changes in economic conditions and supply and demand balance. Product values and crude oil prices are set by the market and are outside of our control. When evaluating the markets in which we operate, we utilize the U.S. Energy Information Administration and other industry sources, to gather supply, demand, utilization, import and export information to forecast and monitor market conditions for our operating
December 31, 2016 | 35 | ||
| MANAGEMENT’S DISCUSSION AND ANALYSIS | ||
regions. We focus on PADD V, or the West Coast of the U.S. where the majority of our operations are located. PADD V is defined by the Petroleum Administration for Defense Districts (“PADD”) as the states of Alaska, Arizona, California, Hawaii, Nevada, Oregon and Washington.
As a performance benchmark and a comparison with other industry participants, we utilize the West Coast and Mid-Continent crack spreads. The crack spread is a measure of the difference between market prices for crude oil and refined products and is a commonly used proxy within the industry to estimate or identify trends in gross refining margins. Crack spreads can fluctuate significantly over time as a result of market conditions and supply and demand balances. The West Coast 321 crack spread is calculated using 3 barrels of Alaska North Slope crude oil (“ANS”) producing 2 barrels of Los Angeles CARB gasoline and 1 barrel of Los Angeles CARB diesel. The Mid-Continent 321 crack spread is calculated using 3 barrels of West Texas Intermediate crude oil (“WTI”) producing 2 barrels of Group 3 gasoline and 1 barrel of Group 3 diesel.
Our actual gross refining margins differ from these crack spreads based on the actual slate of crude oil we run at our refineries and the products we produce. The global commodity markets for crude oil and refined products are subject to significant volatility resulting in rapidly changing prices and margin environments. Our refineries process a variety of crude oils that are sourced from around the world. The slate of crude oil we process can vary over time as a result of changes in market prices and shipping rates. Additionally, our refining gross margin is impacted by the changing crude oil price differentials, which is the difference between the benchmark crude oils, WTI and Brent crude oil (“Brent”), and the actual crude oil we run at our refineries. We may experience financial risk associated with price volatility of crude oil and refined products and we may utilize financial hedge instruments to help mitigate such risks where possible.
KEY INFORMATION USED TO MONITOR OUR BUSINESS - CRUDE OIL DIFFERENTIALS (in $/barrel)
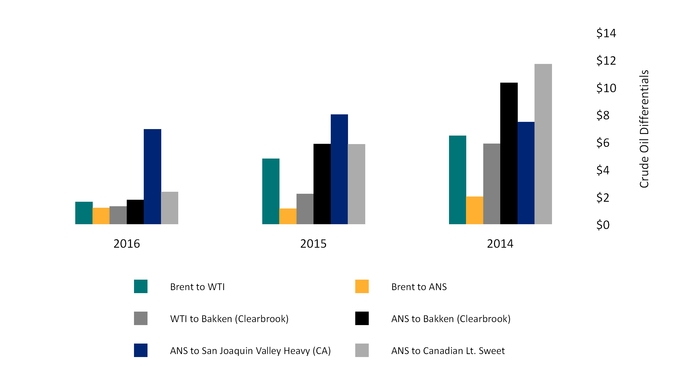
Source: PLATTS
WEST COAST. Average U.S. West Coast crack spreads were down approximately 35.9% in 2016 compared to 2015 but were up approximately 55.9% in 2015 compared to 2014. The decreased crack spreads in 2016 resulted from increased supply year over year, partially offset by continued growth in demand. 2015 crack spreads were up versus 2014 due to several extended unplanned refinery outages in the West Coast (PADD V) region, including our own as discussed below, which reduced West Coast refinery utilization in the year.
36 | Tesoro Corporation | ||
| MANAGEMENT’S DISCUSSION AND ANALYSIS | ||
MID-CONTINENT. Average Mid-Continent crack spreads were down approximately 10.9% in 2016 compared to 2015 but were up approximately 10.2% in 2015 versus 2014. Margins and differentials both decreased in 2016 over 2015 resulting in lower gross refining margin. The region had experienced strong growth driven by crude oil drilling in recent years, but 2016 experienced lower crude oil prices and significantly reduced drilling activities which lowered crude oil supply, which led to decreasing differentials, and lowered product demand, which reduced margins. The WTI to Bakken differential decreased approximately $0.91 per barrel, increasing the price of Bakken, which resulted in a lower gross margin in 2016 compared to 2015. Bakken crude oil represented about 57% of the crude oil consumed by our Mid-Continent system in 2016.
OPERATIONAL DATA AND RESULTS. Management uses various operating metrics to evaluate performance and efficiency and to compare profitability to other companies in the industry. These measures include:
| • | Gross refining margin per barrel is calculated by dividing gross refining margin (revenues less costs of feedstocks, purchased refined products, transportation and distribution) by total refining throughput; and |
| • | Manufacturing costs before depreciation and amortization expense (“Manufacturing Costs”) per barrel is calculated by dividing Manufacturing Costs by total refining throughput. |
Investors and analysts use these financial measures to help analyze and compare companies in the industry on the basis of operating performance. These financial measures should not be considered alternatives to segment operating income, revenues, costs of sales and operating expenses or any other measure of financial performance presented in accordance with U.S. GAAP.
REFINING THROUGHPUT (Mbpd)
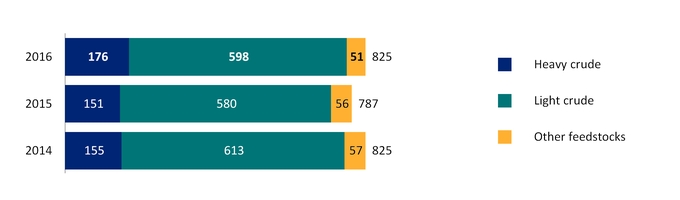
December 31, 2016 | 37 | ||
| MANAGEMENT’S DISCUSSION AND ANALYSIS | ||
REFINING SEGMENT OPERATING DATA AND RESULTS (dollars in millions, except per barrel amounts)
| Years Ended December 31, | |||||||
| 2016 | 2015 | ||||||
Yield (Mbpd) | |||||||
| Gasoline and gasoline blendstocks | 451 | 409 | |||||
| Diesel fuel | 189 | 169 | |||||
| Jet fuel | 118 | 119 | |||||
| Other | 122 | 139 | |||||
| Total Yield | 880 | 836 | |||||
Refined Product Sales (Mbpd) (a) | |||||||
| Gasoline and gasoline blendstocks | 523 | 510 | |||||
| Diesel fuel | 210 | 204 | |||||
| Jet fuel | 149 | 152 | |||||
| Other | 102 | 92 | |||||
| Total Refined Product Sales | 984 | 958 | |||||
Revenues | |||||||
| Refined products (b) | $ | 21,213 | $ | 25,443 | |||
| Crude oil resales and other | 1,043 | 946 | |||||
| Total Revenues | 22,256 | 26,389 | |||||
| Refining Cost of Sales | |||||||
| Cost of sales (excluding LCM) (c) | 19,469 | 21,728 | |||||
| LCM | (359 | ) | 317 | ||||
| Total Cost of Sales | 19,110 | 22,045 | |||||
| Gross refining margin | 3,146 | 4,344 | |||||
| Expenses | |||||||
| Operating expenses | |||||||
| Manufacturing costs | 1,591 | 1,594 | |||||
| Other operating expenses | 429 | 329 | |||||
| SG&A | 2 | 14 | |||||
| D&A | 588 | 504 | |||||
| Other | 1 | 32 | |||||
| Segment Operating Income | $ | 535 | $ | 1,871 | |||
| Gross Refining Margin per throughput barrel | $ | 10.42 | $ | 15.12 | |||
| Manufacturing Costs per throughput barrel | $ | 5.27 | $ | 5.55 | |||
2016 COMPARED TO 2015
OVERVIEW. Operating income for our Refining segment decreased $1.3 billion, or 71%, to $535 million in 2016 compared to 2015 due to a weaker margin environment. Average U.S. West Coast and Mid-Continent crack spreads were down approximately $5.53 per barrel in 2016 at an average $16.18 per barrel compared to an average $21.71 per barrel in 2015. Total refinery utilization of 93% in 2016 was largely in line with the 93% experienced in 2015.
REFINING THROUGHPUT. Total refining throughput increased 38 Mbpd, or 5%, to 825 Mbpd in 2016 compared to 787 Mbpd in 2015. The increase is primarily attributable to the California region where work stoppages and large planned turnarounds in 2015 negatively impacted throughput, the Anacortes refinery where a turnaround in mid-2015 decreased throughput and the Dickinson refinery, which was acquired in June 2016.
GROSS REFINING MARGIN. Our gross refining margin per barrel decreased $4.70 per barrel, or 31%, to $10.42 per barrel in 2016 compared to 2015 given a weaker margin environment across all regions, particularly California and Mid-Continent, partially offset by the positive impact of the lower of cost or market adjustment in 2016.
Total gross refining margin decreased $1.2 billion, or 28%, to $3.1 billion in 2016 compared to 2015. Gross margins in the California, Pacific Northwest and Mid-Continent regions decreased by $824 million, $165 million and $209 million, respectively. Declining crack spreads and crude oil differentials in the regions within which we operate largely contributed to the decrease in gross refining margin in the year. Partially offsetting the regional decreases was continued demand growth for our refined products and a $359 million benefit from lower of cost or market adjustments reversing in 2016 related to our inventory compared to an additional $317 million charge in 2015. Our continued focus on realizing business improvements and synergies also contributed to our results across all regions.
38 | Tesoro Corporation | ||
| MANAGEMENT’S DISCUSSION AND ANALYSIS | ||
REFINING SEGMENT OPERATING DATA AND RESULTS (dollars in millions, except per barrel amounts)
| Years Ended December 31, | |||||||
| 2015 | 2014 | ||||||
Yield (Mbpd) | |||||||
| Gasoline and gasoline blendstocks | 409 | 429 | |||||
| Diesel fuel | 169 | 191 | |||||
| Jet fuel | 119 | 127 | |||||
| Other | 139 | 132 | |||||
| Total Yield | 836 | 879 | |||||
Refined Product Sales (Mbpd) (a) | |||||||
| Gasoline and gasoline blendstocks | 510 | 507 | |||||
| Diesel fuel | 204 | 206 | |||||
| Jet fuel | 152 | 149 | |||||
| Other | 92 | 87 | |||||
| Total Refined Product Sales | 958 | 949 | |||||
Revenues | |||||||
| Refined products (b) | $ | 25,443 | $ | 37,365 | |||
| Crude oil resales and other | 946 | 1,456 | |||||
| Total Revenues | 26,389 | 38,821 | |||||
| Refining Cost of Sales | |||||||
| Cost of sales (excluding LCM) (c) | 21,728 | 35,126 | |||||
| LCM | 317 | 42 | |||||
| Total Cost of Sales | 22,045 | 35,168 | |||||
| Gross refining margin | 4,344 | 3,653 | |||||
| Expenses | |||||||
| Operating expenses | |||||||
| Manufacturing costs | 1,594 | 1,693 | |||||
| Other operating expenses | 329 | 324 | |||||
| SG&A | 14 | 19 | |||||
| D&A | 504 | 421 | |||||
| Other | 32 | 3 | |||||
| Segment Operating Income | $ | 1,871 | $ | 1,193 | |||
Gross Refining Margin per throughput barrel | $ | 15.12 | $ | 12.13 | |||
| Manufacturing Costs per throughput barrel | $ | 5.55 | $ | 5.62 | |||
2015 COMPARED TO 2014
OVERVIEW. Operating income for our Refining segment increased $678 million, or 57%, to $1.9 billion in 2015 compared to 2014 due to a stronger margin environment. Average U.S. West Coast crack spreads margins were approximately $25 per barrel, over $9 per barrel higher, in 2015 compared to 2014. Total refinery utilization was 93% in 2015 compared to 97% in 2014 primarily as a result of the work stoppage and an increase in our stated overall refining capacity to 875 Mbpd compared to 850 Mbpd in 2014.
REFINING THROUGHPUT. Total refining throughput decreased 38 Mbpd, or 5%, to 787 Mbpd in 2015 as compared to 825 Mbpd in 2014. The decrease is primarily due the work stoppage and large planned turnarounds at our Los Angeles and Martinez refineries and project activity at our Salt Lake City refinery. Our California region was most significantly impacted by the work stoppage at our Martinez refinery resulting in it being idled and reduced throughput in the Carson portion of our Los Angeles refinery.
GROSS REFINING MARGINS. Our gross refining margin increased $2.99 per barrel, or 25%, to $15.12 per barrel in 2015 compared to 2014 given a stronger margin environment across the California and Pacific Northwest regions, which was offset by the impact of work stoppages and three refinery turnarounds during 2015.
Total gross refining margin increased $691 million, or 19%, to $4.3 billion in 2015 compared to 2014. Gross margins in the California and Pacific Northwest regions increased by $920 million and $97 million, respectively, while margins in the Mid-Continent decreased by $326 million. The gross margin increases in the California and the Pacific Northwest regions were due to favorable market conditions caused by strong clean product demand growth and supported by lower consumer prices as a result of falling crude oil price. The West Coast (PADD V) region also experienced several unplanned refinery outages, which impacted overall regional supply. Margins decreased in the Mid-Continent region primarily as a result of lower crude oil differentials. Our continued focus on realizing business improvements and synergies also contributed to our results across all regions. Partially offsetting the regional increases was a $317 million impact from lower of cost or market adjustments related to our inventory in 2015 compared to $42 million in 2014.
| (a) | Sources of total refined product sales include refined products manufactured at our refineries and refined products purchased from third parties. Total refined product sales include sales of manufactured and purchased refined products. Refined product sales include all sales through our Marketing segment as well as in bulk markets and exports through our Refining segment. |
| (b) | Refined product sales include intersegment sales to our Marketing segment of $13.7 billion, $16.3 billion and $22.2 billion in 2016, 2015 and 2014, respectively. |
| (c) | Refining segment costs for services provided by our TLLP segment were $715 million, $615 million and $497 million for the years ended December 31, 2016, 2015 and 2014, respectively. These amounts are eliminated upon consolidation. |
December 31, 2016 | 39 | ||
| MANAGEMENT’S DISCUSSION AND ANALYSIS | ||
REFINING SEGMENT OPERATING RESULTS BY REGION (in millions, except per barrel amounts)
| Years Ended December 31, | |||||||||||||||||||||||||||||||||||
| 2016 | 2015 | 2014 | 2016 | 2015 | 2014 | 2016 | 2015 | 2014 | |||||||||||||||||||||||||||
California (Martinez and Los Angeles) | Pacific Northwest (Washington and Alaska) | Mid-Continent (North Dakota and Utah) | |||||||||||||||||||||||||||||||||
Revenues | |||||||||||||||||||||||||||||||||||
| Refined products | $ | 14,231 | $ | 17,317 | $ | 24,733 | $ | 4,030 | $ | 4,767 | $ | 7,175 | $ | 2,952 | $ | 3,359 | $ | 5,457 | |||||||||||||||||
| Crude oil resales and other | 312 | 344 | 267 | 226 | 350 | 851 | 505 | 252 | 338 | ||||||||||||||||||||||||||
| Total Revenues | 14,543 | 17,661 | 25,000 | 4,256 | 5,117 | 8,026 | 3,457 | 3,611 | 5,795 | ||||||||||||||||||||||||||
| Refining Cost of Sales | |||||||||||||||||||||||||||||||||||
| Cost of sales (excluding LCM) | 12,671 | 14,522 | 22,958 | 3,825 | 4,361 | 7,435 | 2,973 | 2,845 | 4,733 | ||||||||||||||||||||||||||
| LCM | (236 | ) | 207 | 30 | (84 | ) | 76 | 8 | (39 | ) | 34 | 4 | |||||||||||||||||||||||
| Total Cost of Sales | 12,435 | 14,729 | 22,988 | 3,741 | 4,437 | 7,443 | 2,934 | 2,879 | 4,737 | ||||||||||||||||||||||||||
| Gross refining margin (a) | 2,108 | 2,932 | 2,012 | 515 | 680 | 583 | 523 | 732 | 1,058 | ||||||||||||||||||||||||||
| Expenses | |||||||||||||||||||||||||||||||||||
| Manufacturing costs | 1,119 | 1,144 | 1,228 | 258 | 256 | 273 | 214 | 194 | 192 | ||||||||||||||||||||||||||
| Other operating expenses (a) | 210 | 206 | 225 | 65 | 64 | 44 | 154 | 59 | 55 | ||||||||||||||||||||||||||
| SG&A | 1 | 13 | 17 | 1 | — | 2 | — | 1 | — | ||||||||||||||||||||||||||
| D&A | 375 | 336 | 258 | 96 | 86 | 85 | 117 | 82 | 78 | ||||||||||||||||||||||||||
| Other | — | 10 | 1 | — | 6 | 1 | 1 | 16 | 1 | ||||||||||||||||||||||||||
| Operating Income | $ | 403 | $ | 1,223 | $ | 283 | $ | 95 | $ | 268 | $ | 178 | $ | 37 | $ | 380 | $ | 732 | |||||||||||||||||
| Refining throughput (Mbpd) | 507 | 493 | 523 | 181 | 170 | 171 | 137 | 124 | 131 | ||||||||||||||||||||||||||
| Gross refining margin per throughput barrel | $ | 11.36 | $ | 16.29 | $ | 10.54 | $ | 7.77 | $ | 10.96 | $ | 9.34 | $ | 10.43 | $ | 16.17 | $ | 22.13 | |||||||||||||||||
| Manufacturing costs per throughput barrel | $ | 6.02 | $ | 6.37 | $ | 6.43 | $ | 3.90 | $ | 4.14 | $ | 4.37 | $ | 4.29 | $ | 4.26 | $ | 4.00 | |||||||||||||||||
| (a) | Included in the Mid-Continent region’s other operating expenses is $43 million for the year ended December 31, 2016, related to our acquisition of Great Northern Midstream LLC. Revenues associated with those costs are recognized in gross refining margin. |
TLLP SEGMENT
HIGHLIGHTS (in millions)
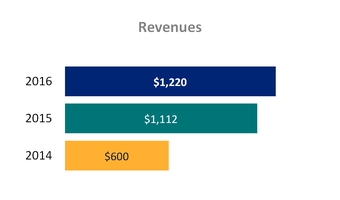
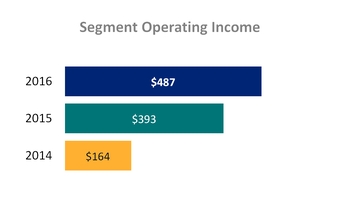
TLLP is a publicly traded limited partnership that was formed to own, operate, develop and acquire logistics assets. A significant portion of its assets are integral to the success of Tesoro’s refining and marketing operations and generate revenue by charging fees for gathering crude oil, natural gas, and water, for terminalling, transporting and storing crude oil and refined products and for processing and fractionating NGLs.
40 | Tesoro Corporation | ||
| MANAGEMENT’S DISCUSSION AND ANALYSIS | ||
OPERATIONAL DATA AND RESULTS. Management uses average revenue per barrel and average revenue per MMBtu to evaluate performance and compare profitability to other companies in the industry. We calculate average revenue per barrel as revenue divided by total throughput and total processing volumes, respectively, while average revenue per MMBtu is calculated as revenue divided by total volume. Investors and analysts use these financial measures to help analyze and compare companies in the industry on the basis of operating performance. These financial measures should not be considered as an alternative to segment operating income, revenues and operating expenses or any other measure of financial performance presented in accordance with U.S. GAAP.
MARKET OVERVIEW. During the past year, spot prices of the commodities that TLLP handles, including crude oil, natural gas, and refined products, declined, while natural gas liquids increased. The lower price levels along with increased volatility in the commodity price environment created challenges for crude oil and natural gas producers who modified their drilling and production plans. The U.S. oil and gas drilling rig count continued to see declines in the first half of 2016 but reversed course in the second half of the year leaving year-over-year count relatively unchanged. Looking forward, price appreciation, improved producer economics, advanced drilling techniques and better well management along with a backlog of uncompleted wells available for completion could positively impact overall U.S. production volumes.
Lower retail prices and favorable economic conditions throughout 2016 supported increased demand for refined products from TLLP’s downstream refining and marketing customers. Changes in the U.S. political landscape, namely around the lifting of the 40 year old crude oil export ban in December 2015, had a minimal impact on TLLP’s business and TLLP believes this will continue to be the case in the short term. TLLP continues to monitor the impact of these changes in market prices and fundamentals as it relates to TLLP’s business. Currently, TLLP believes its diversified portfolio, which is underpinned by long-term contracts, many of which are supported by minimum volume commitments, adequately supports its goals and objectives outlined above.
The results of operations for TLLP’s natural gas gathering and processing operations are shown in Mbpd, per barrel, MMBtu and per MMBtu amounts.
TLLP SEGMENT OPERATING DATA
| Years Ended December 31, | |||||||||||
| 2016 | 2015 | 2014 | |||||||||
| Gathering | |||||||||||
| Gas gathering volume (thousands of MMBtu/d) (a) (b) | 879 | 1,077 | 1,046 | ||||||||
| Average gas gathering revenue per MMBtu (a) | $ | 0.51 | $ | 0.43 | $ | 0.41 | |||||
| Crude oil gathering pipeline throughput (Mbpd) | 212 | 188 | 123 | ||||||||
| Average crude oil gathering pipeline revenue per barrel | $ | 1.72 | $ | 1.79 | $ | 1.46 | |||||
| Crude oil trucking volume (Mbpd) | 30 | 38 | 49 | ||||||||
| Average crude oil trucking revenue per barrel | $ | 3.23 | $ | 3.25 | $ | 3.23 | |||||
| Processing | |||||||||||
| NGLs processing throughput (Mbpd) (b) | 7.3 | 7.6 | 6.5 | ||||||||
| Average keep-whole fee per barrel of NGLs | $ | 36.53 | $ | 34.46 | $ | 35.51 | |||||
| Fee-based processing throughput (thousands of MMBtu/day) (b) | 639 | 743 | 693 | ||||||||
| Average fee-based processing revenue per MMBtu | $ | 0.45 | $ | 0.39 | $ | 0.30 | |||||
| Terminalling and Transportation | |||||||||||
| Terminalling throughput (Mbpd) | 984 | 955 | 952 | ||||||||
| Average terminalling revenue per barrel | $ | 1.33 | $ | 1.08 | $ | 0.96 | |||||
| Pipeline transportation throughput (Mbpd) | 868 | 825 | 822 | ||||||||
| Average pipeline transportation revenue per barrel | $ | 0.39 | $ | 0.39 | $ | 0.36 | |||||
| (a) | Prior to deconsolidation of Rendezvous Gas Services, L.L.C. (“RGS”) as of January 1, 2016, fees paid by TLLP to RGS were eliminated upon consolidation and third-party transactions, including revenue and throughput volumes, were included in TLLP’s results of operations. Third party volumes associated with RGS, included in gas gathering volume for the years ended December 31, 2015 and 2014, were 141 thousand MMBtu/d and 148 thousand MMBtu/d, respectively, and reduced TLLP’s average gas gathering revenue per MMBtu by approximately $0.05 for both periods. |
| (b) | TLLP commenced natural gas gathering and processing operations with the acquisition of the Rockies Natural Gas Business in December 2014. Per day calculations only reflect the period of 2014 that TLLP owned the Rockies Natural Gas Business. |
December 31, 2016 | 41 | ||
| MANAGEMENT’S DISCUSSION AND ANALYSIS | ||
TLLP SEGMENT OPERATING RESULTS (in millions)
| Years Ended December 31, | |||||||
| 2016 (a) | 2015 (a) | ||||||
| Segment Operating Income | |||||||
| Revenues | |||||||
| Gathering | |||||||
| Gas gathering | $ | 163 | $ | 170 | |||
| Crude oil gathering pipeline | 133 | 123 | |||||
| Crude oil trucking | 36 | 46 | |||||
| Other | 7 | — | |||||
| Processing | |||||||
| NGLs processing | 98 | 96 | |||||
| Fee-based processing | 106 | 107 | |||||
| Other processing | 72 | 75 | |||||
| Terminalling and transportation | |||||||
| Terminalling | 480 | 377 | |||||
| Pipeline transportation | 125 | 118 | |||||
| Total Revenues (c) | 1,220 | 1,112 | |||||
| Expenses | |||||||
| Operating expenses (d) | 444 | 428 | |||||
| SG&A (e) | 95 | 103 | |||||
| D&A | 190 | 187 | |||||
| Other | 4 | 1 | |||||
| Segment Operating Income | $ | 487 | $ | 393 | |||
2016 COMPARED TO 2015
OVERVIEW. Operating income for our TLLP segment increased $94 million to $487 million due to higher revenues, partially offset by an increase in operating expenses.
REVENUES AND THROUGHPUT. Terminalling and pipeline transportation throughput increased as a result of terminalling assets from the Alaska Storage and Terminalling Assets acquisition, stronger customer demand and organic growth projects adding new capabilities to TLLP’s system. Gas gathering volume decreased largely due to the deconsolidation of RGS in 2016 while crude oil pipeline throughput increased due to increased activity and the completion of expansion projects. Natural gas fee-based processing was down in the year due to limited drilling activity and lower resulting production in the areas we service. Revenues for 2016 increased $108 million, or 9.7%, to $1.2 billion primarily driven by the full year impact of the LA Storage and Handling Assets purchased from Tesoro in November 2015 and the Alaska Storage and Terminalling Assets purchased in 2016.
OPERATING AND OTHER EXPENSES. Operating expenses increased $16 million in 2016 compared to 2015 primarily resulting from the inclusion of gross operating expenses related to TLLP’s transactions with RGS in 2016 that were previously eliminated upon consolidation as well as additional expenses related to acquisitions during 2016 partially offset by a reduction in the environmental remediation costs recognized in 2016 compared to 2015 related to the 2013 release of crude oil in a rural field northeast of Tioga, North Dakota.
42 | Tesoro Corporation | ||
| MANAGEMENT’S DISCUSSION AND ANALYSIS | ||
TLLP SEGMENT OPERATING RESULTS (in millions)
| Years Ended December 31, | |||||||
| 2015 (a) | 2014 (a) | ||||||
| Segment Operating Income | |||||||
| Revenues | |||||||
| Gathering (b) | |||||||
| Gas gathering | $ | 170 | $ | 11 | |||
| Crude oil gathering pipeline | 123 | 66 | |||||
| Crude oil trucking | 46 | 58 | |||||
| Processing (b) | |||||||
| NGLs processing | 96 | 7 | |||||
| Fee-based processing | 107 | 6 | |||||
| Other processing | 75 | 10 | |||||
| Terminalling and transportation | |||||||
| Terminalling | 377 | 333 | |||||
| Pipeline transportation | 118 | 109 | |||||
| Total Revenues (c) | 1,112 | 600 | |||||
| Expenses | |||||||
| Operating expenses (d) | 428 | 281 | |||||
| SG&A (e) | 103 | 74 | |||||
| D&A | 187 | 85 | |||||
| Other | 1 | (4 | ) | ||||
| Segment Operating Income | $ | 393 | $ | 164 | |||
2015 COMPARED TO 2014
OVERVIEW. Operating income for our TLLP segment increased $229 million to $393 million due to higher revenues, offset by an increase in operating expenses resulting from increased labor and operating costs associated with the acquired operations. The Rockies Natural Gas Business, which was acquired in December 2014, contributed significantly towards the increase in TLLP’s operating income during 2015.
REVENUES AND THROUGHPUT. Gathering throughput volume increased as a result of the assets acquired in the Rockies Natural Gas Business acquisition and the continuing expansion of the High Plains System. TLLP commenced natural gas gathering and processing operations with the acquisition of the Rockies Natural Gas Business in December 2014. The increase in volumes for crude oil gathering pipeline throughput was almost entirely due to third-party volumes. NGLs processing throughput and fee-based processing throughput volumes also increased as a result of a full year of operations of the assets acquired in the Rockies Natural Gas Business acquisition. These higher throughput volumes resulted in an increase to revenues of $512 million during 2015 to $1.1 billion compared to $600 million in 2014.
OPERATING AND OTHER EXPENSES. Operating expenses increased $147 million in 2015 compared to 2014 primarily related to operations acquired in the Rockies Natural Gas Business acquisition in late 2014. Included in 2015 operating expenses is an incremental accrual of $24 million related to the 2013 release of crude oil in a rural field northeast of Tioga, North Dakota compared to $18 million recognized in 2014. General and administrative expenses increased by $29 million in 2015 due to higher allocations of overhead costs associated with increased costs to support the growth of the business.
| (a) | Includes historical results of TLLP’s Predecessors for the years ended December 31, 2016, 2015 and 2014. See additional information regarding TLLP’s Predecessors under “Items Impacting Comparability.” |
| (b) | TLLP commenced natural gas gathering and processing operations with the acquisition of the Rockies Natural Gas Business in December 2014. |
| (c) | TLLP segment revenues from services provided to our Refining segment were $715 million, $615 million and $497 million for the years ended December 31, 2016, 2015 and 2014, respectively. These amounts are eliminated upon consolidation. |
| (d) | TLLP segment operating expenses include amounts billed by Tesoro for services provided to TLLP under various operational contracts. Amounts billed by Tesoro totaled $166 million, $135 million and $111 million for the years ended December 31, 2016, 2015 and 2014, respectively. Operating expenses also include imbalance gains and reimbursements of $24 million, $42 million and $43 million in the years ended December 31, 2016, 2015 and 2014, respectively. These amounts are eliminated upon consolidation. TLLP segment third-party operating expenses related to the transportation of crude oil and refined products are reclassified to cost of sales in our statements of consolidated operations upon consolidation. |
| (e) | TLLP segment general and administrative expenses include amounts charged by Tesoro for general and administrative services provided to TLLP under various operational and administrative contracts. These amounts totaled $69 million, $72 million and $39 million for the years ended December 31, 2016, 2015 and 2014, respectively. These amounts are eliminated upon consolidation. TLLP segment third-party general and administrative expenses are reclassified to cost of sales in our statements of consolidated operations upon consolidation. |
December 31, 2016 | 43 | ||
| MANAGEMENT’S DISCUSSION AND ANALYSIS | ||
MARKETING SEGMENT
HIGHLIGHTS
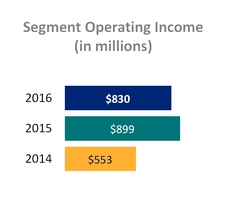


We sell gasoline and diesel fuel in the western U.S. through branded and unbranded channels. Our branded operations are made up of Jobber/Dealers. Our unbranded business includes volumes sold through agreements with third-party distributors/operators. Our branded and unbranded channels provide profitable and committed outlets for the majority of the gasoline produced by our refineries. Our Marketing segment included a network of retail stations under the ARCO®, Shell®, Exxon®, Mobil®, USA GasolineTM, RebelTM, ThriftyTM and Tesoro® brands. Our unique brand portfolio allows us to regionally select premium and value brands consistent with consumer preferences. In addition to added profitability, our Marketing business enables our refineries to run optimally, which lowers overall operating costs per barrel.
OPERATIONAL DATA AND RESULTS. Management uses fuel margin per gallon to compare fuel results to other companies in the industry. There are a variety of ways to calculate fuel margin per gallon; different companies may calculate it in different ways. We calculate fuel margin per gallon by dividing fuel gross margin by fuel sales volumes. Investors and analysts may use fuel margin per gallon to help analyze and compare companies in the industry on the basis of operating performance. This financial measure should not be considered an alternative to revenues, segment operating income or any other measure of financial performance presented in accordance with U.S. GAAP. Fuel margin and fuel margin per gallon include the effect of intersegment purchases from the Refining segment.
NUMBER OF BRANDED STATIONS
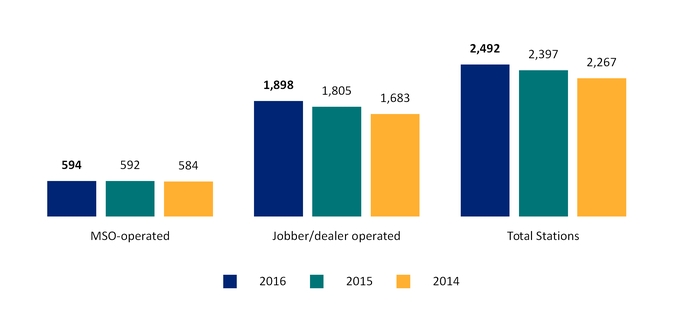
44 | Tesoro Corporation | ||
| MANAGEMENT’S DISCUSSION AND ANALYSIS | ||
MARKETING SEGMENT OPERATING DATA AND RESULTS (dollars in millions, except cents per gallon)
| Years Ended December 31, | |||||||||||
| 2016 | 2015 | 2014 | |||||||||
| Marketing Revenues | |||||||||||
| Fuel | $ | 15,405 | $ | 18,081 | $ | 23,701 | |||||
| Other non-fuel (a) (b) | 85 | 63 | 240 | ||||||||
| Total Revenues | 15,490 | 18,144 | 23,941 | ||||||||
| Marketing Cost of Sales | |||||||||||
| Fuel | 14,275 | 16,873 | 22,842 | ||||||||
| Other non-fuel | 17 | 5 | 129 | ||||||||
| Total Cost of Sales | 14,292 | 16,878 | 22,971 | ||||||||
| Marketing Gross Margins | |||||||||||
| Fuel (c) | 1,130 | 1,208 | 859 | ||||||||
| Other non-fuel (a) (b) | 68 | 58 | 111 | ||||||||
| Total Gross Margins | 1,198 | 1,266 | 970 | ||||||||
| Expenses | |||||||||||
| Operating expenses | 298 | 300 | 352 | ||||||||
| SG&A | 17 | 15 | 17 | ||||||||
| D&A | 49 | 46 | 42 | ||||||||
| Other | 4 | 6 | 6 | ||||||||
| Segment Operating Income (c) | $ | 830 | $ | 899 | $ | 553 | |||||
Fuel Sales (millions of gallons) | 8,879 | 8,611 | 8,306 | ||||||||
Fuel Margin (¢/gallon) | 12.7 | ¢ | 14.0 | ¢ | 10.3 | ¢ | |||||
2016 COMPARED TO 2015
OVERVIEW. Operating income decreased $69 million, or 8%, to $830 million in 2016 compared to $899 million in 2015 primarily due to lower gasoline margins in 2016 in all of the regions we operate in, particularly in the West Coast (PADD V) region. Higher gasoline prices in 2015 were experienced in the West Coast (PADD V) region during the second and third quarters as a result of several unplanned refinery outages, largely returning to normal by the fourth quarter.
GROSS MARGIN. Gross margin decreased $68 million to $1.2 billion during 2016 compared to $1.3 billion in 2015. The decrease is primarily due to lower gasoline margins in 2016, offset in part by a 3% year over year increase in fuel sales driven by increased demand and growth in our retail site network.
OPERATING AND OTHER EXPENSES. Operating and other expenses were relatively flat year over year with $368 million in 2016 compared to $367 million in 2015.
2015 COMPARED TO 2014
OVERVIEW. Operating income increased $346 million, or 63%, to $899 million in 2015 compared to $553 million in 2014, primarily as a result of increased fuel sales volumes driven by strong demand and growth in our retail site network and reduced operating expenses.
GROSS MARGIN. Gross margin increased $296 million to $1.3 billion during 2015 compared to $970 million in 2014. We experienced higher fuel margin driven by favorable market conditions and strong demand. Fuel sales volumes increased 4% during 2015 and 2014 from strong demand attributed to lower fuel prices and continued economic improvement in the markets in which we operate.
OPERATING AND OTHER EXPENSES. The decrease of $52 million in operating expenses was primarily driven by the conversion of our retail stations to the MSO model that reduced costs associated with management of station operations.
| (a) | In December 2014, we converted our company-operated retail stations to MSO retail stations. The impact of this change was not material to our Marketing segment results. |
| (b) | Primarily includes royalty and franchise income for the years ended December 31, 2016 and 2015 and primarily merchandise revenue for the year ended December 31, 2014. |
| (c) | Starting in 2015, we changed our segment reporting methodology to better reflect market trends. This primarily included discounting the price that Marketing pays for refined product to Refining by the value of renewable identification numbers (“RINs”). This change was effective January 1, 2015 and we have not adjusted financial information presented for our Refining and Marketing segments for the year ended December 31, 2014. Had we made this change effective January 1, 2014, operating income in our Refining segment would have reduced by $125 million with a corresponding increase to operating income in our Marketing segment for the year ended December 31, 2014. |
December 31, 2016 | 45 | ||
| MANAGEMENT’S DISCUSSION AND ANALYSIS | ||
CAPITAL RESOURCES AND LIQUIDITY
OVERVIEW
We operate in an environment where our capital resources and liquidity are impacted by changes in the price of crude oil and refined products, availability of trade credit, market uncertainty and a variety of additional factors beyond our control. These factors include the level of consumer demand for transportation fuels, weather conditions, fluctuations in seasonal demand, governmental regulations, geo-political conditions and overall market and global economic conditions. See “Important Information Regarding Forward-Looking Statements” for further information related to risks and other factors. Future capital expenditures, as well as borrowings under our credit agreements and other sources of capital, may be affected by these conditions. Debt is described in greater detail in Note 12 to our consolidated financial statements in Item 8.
CAPITALIZATION
CAPITAL STRUCTURE (in millions)
| As of December 31, | |||||||
| Debt, including current maturities: | 2016 | 2015 | |||||
| Tesoro Corporation Revolving Credit Facility | $ | — | $ | — | |||
| 4.250% Senior Notes due 2017 | 450 | 450 | |||||
| 5.375% Senior Notes due 2022 | 475 | 475 | |||||
| 4.750% Senior Notes due 2023 | 850 | — | |||||
| 5.125% Senior Notes due 2024 | 300 | 300 | |||||
| 5.125% Senior Notes due 2026 | 750 | — | |||||
| Term Loan Facility (a) | 64 | — | |||||
| Capital lease obligations and other | 44 | 39 | |||||
| Tesoro Debt | 2,933 | 1,264 | |||||
| TLLP Revolving Credit Facility | 330 | 305 | |||||
| TLLP Dropdown Credit Facility | — | — | |||||
| TLLP Unsecured Term Loan Facility | — | 250 | |||||
| TLLP 5.500% Senior Notes due 2019 | 500 | 500 | |||||
| TLLP 5.875% Senior Notes due 2020 | 470 | 470 | |||||
| TLLP 6.125% Senior Notes due 2021 | 800 | 550 | |||||
| TLLP 6.250% Senior Notes due 2022 | 800 | 800 | |||||
| TLLP 6.375% Senior Notes due 2024 | 450 | — | |||||
| TLLP 5.250% Senior Notes due 2025 | 750 | — | |||||
| Capital lease obligations and other | 9 | 8 | |||||
| TLLP Debt | 4,109 | 2,883 | |||||
| Total Debt | 7,042 | 4,147 | |||||
| Unamortized Issuance Costs (b) | (109 | ) | (74 | ) | |||
| Debt, Net of Unamortized Issuance Costs | 6,933 | 4,073 | |||||
| Total Equity | 8,127 | 7,740 | |||||
| Total Capitalization | $ | 15,060 | $ | 11,813 | |||
| (a) | In connection with our acquisition of the Dickinson Refinery, we assumed $66 million of term loan debt. |
| (b) | The unamortized issuance costs for TLLP were $55 million and $39 million at December 31, 2016 and 2015, respectively, including unamortized premiums of $4 million for both periods. |
46 | Tesoro Corporation | ||
| MANAGEMENT’S DISCUSSION AND ANALYSIS | ||
SENIOR NOTES BY MATURITY (in millions)
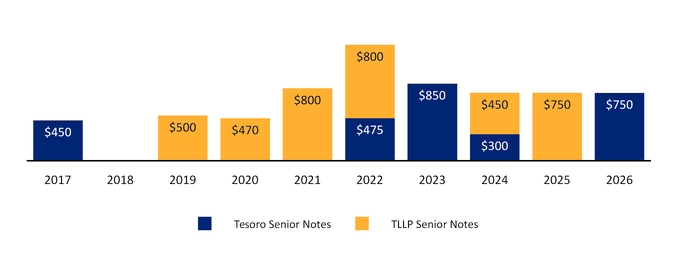
Our debt, net of unamortized issuance costs, to capitalization ratio was 46% and 34% at December 31, 2016 and 2015, respectively. Our debt, net of unamortized issuance costs, to capitalization ratio, excluding TLLP, was 35% and 19% at December 31, 2016 and 2015, respectively, which excludes TLLP total debt, net of unamortized issuance costs and TLLP capital leases of $4.1 billion and $2.8 billion at December 31, 2016 and 2015, respectively, and excludes noncontrolling interest of $2.7 billion and $2.5 billion at December 31, 2016 and 2015, respectively. TLLP’s debt is non-recourse to Tesoro, except for Tesoro Logistics GP, LLC.
2016 DEBT TRANSACTIONS
During 2016, both Tesoro and TLLP were active in the debt markets, in part due to acquisition related activities. In anticipation of the Western Refining merger, Tesoro completed a $1.6 billion senior notes offering in December 2016 and entered into a financing commitment letter in November 2016 committing banks to provide up to $2.2 billion in the form of a bridge credit facility. In addition, the Company amended its revolving credit facility to take advantage of improved terms and to better position itself for funding the Western Refining transaction with an incremental $1.0 billion capacity, at which time the commitment letter was reduced to $1.2 billion and ultimately terminated. In connection with acquisitions from Tesoro, TLLP completed a $750 million offering in December 2016 and completed another offering of $700 million in May 2016. In addition to a senior notes exchange in February 2016, TLLP entered in a new $1.0 billion Dropdown Credit Facility and amended its revolving credit facility in January 2016.
See Note 12 in Item 8 for a more detailed discussion regarding the company’s debt transactions in the year.
CREDIT FACILITIES OVERVIEW
Our primary sources of liquidity are cash flows from operations with additional sources available under borrowing capacity from our revolving lines of credit. We ended 2016 with $3.3 billion of cash and cash equivalents, no borrowings outstanding under the Tesoro Corporation revolving credit facility (the “Revolving Credit Facility”) or the TLLP Dropdown Credit Facility and $330 million of borrowings outstanding under the TLLP Revolving Credit Facility. We believe available capital resources will be adequate to meet our capital expenditure, working capital and debt service requirements.
December 31, 2016 | 47 | ||
| MANAGEMENT’S DISCUSSION AND ANALYSIS | ||
AVAILABLE CAPACITY UNDER REVOLVING CREDIT FACILITIES (in millions)
Total Capacity | Amount Borrowed as of December 31, 2016 | Outstanding Letters of Credit | Available Capacity | Expiration | |||||||||||||
| Tesoro Corporation Revolving Credit Facility (a) | $ | 2,000 | $ | — | $ | 4 | $ | 1,996 | September 30, 2020 | ||||||||
| TLLP Revolving Credit Facility | 600 | 330 | — | 270 | January 29, 2021 | ||||||||||||
| TLLP Dropdown Credit Facility | 1,000 | — | — | 1,000 | January 29, 2021 | ||||||||||||
| Letter of Credit Facilities (b) | 975 | — | 22 | 953 | |||||||||||||
| Total Credit Facilities | $ | 4,575 | $ | 330 | $ | 26 | $ | 4,219 | |||||||||
| (a) | The $2.0 billion total capacity does not include the additional $1.0 billion related to the incremental revolving facility, as discussed further in Note 12 in Item 8. |
| (b) | Letters of credit outstanding under these agreements incur fees ranging from 0.45% to 0.90% and are secured by the crude oil inventories for which they are issued. Capacity under these letter of credit agreements is available on an uncommitted basis and can be terminated by either party at any time. |
REVOLVING CREDIT FACILITIES EXPENSES AND FEES
| Credit Facility | 30 day Eurodollar (LIBOR) Rate | Eurodollar Margin | Base Rate | Base Rate Margin | Commitment Fee (unused portion) | ||||
| Tesoro Corporation Revolving Credit Facility ($2.0 billion) | 0.77% | 1.75% | 3.75% | 0.75% | 0.300% | ||||
| TLLP Revolving Credit Facility ($600 million) (a) | 0.77% | 2.00% | 3.75% | 1.00% | 0.375% | ||||
| TLLP Dropdown Credit Facility ($1.0 billion) | 0.77% | 2.01% | 3.75% | 1.01% | 0.375% | ||||
| (a) | The weighted average interest rate for borrowings under the secured TLLP Revolving Credit Facility was 2.76% at December 31, 2016. |
COVENANTS. Our Revolving Credit Facility, as amended, senior notes, TLLP Revolving Credit Facility, TLLP Dropdown Credit Facility and TLLP senior notes include certain negative, affirmative and financial covenants, a number of which will either no longer apply or become less restrictive if an investment grade rating from either Moody's Investors Service or S&P Global Ratings is achieved, that may limit or restrict the ability of Tesoro and its subsidiaries to:
| • | pay dividends and make other distributions with respect to our capital stock and purchase, redeem or retire our capital stock; |
| • | enter into certain hedging agreements; |
| • | incur additional indebtedness; |
| • | sell assets unless the proceeds from those sales are used to repay debt or are reinvested in our business; |
| • | incur liens on assets to secure certain debt; |
| • | engage in certain business activities; |
| • | make certain payments and distributions from our subsidiaries; |
| • | engage in certain investments, mergers or consolidations and transfers of assets; and |
| • | enter into non-arm’s length transactions with affiliates. |
We do not believe that the limitations will restrict our ability to pay dividends (distributions for TLLP) or repurchase stock under our current programs. We also have financial covenants that require Tesoro or TLLP to maintain certain interest coverage and leverage ratios. There were no changes to the TLLP Revolving Credit Facility covenants during the year ended December 31, 2016. We were in compliance with our debt covenants as of and for the year ended December 31, 2016. See Note 12 to our consolidated financial statements in Item 8 for additional information on our debt obligations.
TLLP REVOLVING CREDIT FACILITY AMENDMENT. On January 29, 2016, TLLP amended its existing secured TLLP Revolving Credit Facility. As a result of the amendment, TLLP decreased the aggregate available facility limit from $900 million to $600 million and improved terms related to pricing and financial covenants.
48 | Tesoro Corporation | ||
| MANAGEMENT’S DISCUSSION AND ANALYSIS | ||
TLLP DROPDOWN CREDIT FACILITY. On January 29, 2016, TLLP syndicated a new $1.0 billion secured TLLP Dropdown Credit Facility. The primary use of proceeds under this facility will be to fund TLLP asset acquisitions. This facility provides TLLP a flexible capital structure with a segregated source of financing for future asset acquisitions including transactions with Tesoro. The terms, covenants and restrictions under this facility are substantially the same with its amended secured TLLP Revolving Credit Facility.
The secured TLLP Revolving Credit Facility and the secured TLLP Dropdown Credit Facility ratably share collateral comprised primarily of TLLP property, plant and equipment and both facilities mature January 29, 2021. In addition, upon an upgrade of TLLP’s corporate family rating to investment grade, certain covenants and restrictions under each facility will automatically be eliminated or improved. See further discussion in Note 12 to our consolidated financial statements in Item 8.
SHARE REPURCHASES
We are authorized by our Board of Directors (the “Board”) to purchase shares of our common stock in open market transactions at our discretion. The Board’s authorization has no time limit and may be suspended or discontinued at any time. Purchases of our common stock can be made to offset the dilutive effect of stock-based compensation awards and to meet our obligations under employee benefit and compensation plans, including the exercise of stock options and vesting of restricted stock and to fulfill other stock compensation requirements. We purchased approximately 3.2 million shares of our common stock for the year ended December 31, 2016 at an average price of $78.56 per share and 6.9 million shares of our common stock for the year ended December 31, 2015 at an average price of $93.60 per share for approximately $250 million and $644 million for the years ended December 31, 2016 and 2015, respectively. In October 2015, our Board approved a new $1.0 billion share repurchase program to become effective upon the full completion of the current $1.0 billion share repurchase authorized in July 2014. In connection with the Merger with Western Refining, our Board approved a new $1.0 billion share repurchase program. We have over $2.1 billion remaining under our authorized programs.
CASH DIVIDENDS
On February 3, 2017, our Board declared a cash dividend of $0.550 per share, payable on March 15, 2017 to shareholders of record on February 28, 2017.
CASH DIVIDENDS PAID
| 2016 | 2015 | 2014 | ||||||||||||||||||||||||||||||||||
| Q4 | Q3 | Q2 | Q1 | Q4 | Q3 | Q2 | Q1 | Q4 | Q3 | Q2 | Q1 | |||||||||||||||||||||||||
| Annual cash dividends paid | $249 million | $228 million | $141 million | |||||||||||||||||||||||||||||||||
| Quarterly per share amount declared | $ | 0.550 | $ | 0.550 | $ | 0.500 | $ | 0.500 | $ | 0.500 | $ | 0.500 | $ | 0.425 | $ | 0.425 | $ | 0.300 | $ | 0.300 | $ | 0.250 | $ | 0.250 | ||||||||||||
CASH FLOW SUMMARY
Working capital (excluding cash) decreased $270 million in 2016 primarily related to the 4.250% senior notes due 2017 and the timing of our payments for crude oil and refined product purchases partially offset by a higher inventory balance due to higher crude oil prices and the timing of receivables. Working capital (excluding cash) increased $191 million in 2015 compared to 2014 primarily related to the timing of our payments for crude oil and refined product purchases, which was offset by timing of receivables, and the net decrease in inventories, which included a $359 million net lower of cost or market inventory adjustment due to the lower price environment we experienced during 2015.
COMPONENTS OF OUR CASH FLOWS (in millions)
| Years Ended December 31, | |||||||||||
| 2016 | 2015 | 2014 | |||||||||
| Cash Flows From (Used in): | |||||||||||
| Operating activities | $ | 1,304 | $ | 2,131 | $ | 1,364 | |||||
| Investing activities | (1,317 | ) | (1,129 | ) | (3,172 | ) | |||||
| Financing activities | 2,366 | (1,060 | ) | 1,570 | |||||||
| Increase (Decrease) in Cash and Cash Equivalents | $ | 2,353 | $ | (58 | ) | $ | (238 | ) | |||
December 31, 2016 | 49 | ||
| MANAGEMENT’S DISCUSSION AND ANALYSIS | ||
2016 COMPARED TO 2015
OPERATING ACTIVITIES. Net cash from operating activities decreased $827 million, or 39%, to $1.3 billion in 2016 compared to $2.1 billion in 2015. The decrease in net cash from operating activities was primarily due to $830 million in lower net earnings in 2016 versus 2015 coupled with a $676 million change in the lower cost of market adjustment offset by change in working capital in the period.
INVESTING ACTIVITIES. Net cash used in investing activities increased $188 million, or 17%, to $1.3 billion in 2016 compared to $1.1 billion in 2015 primarily due to funds used for acquisitions in the year partially offset by reduced capital expenditures in 2016. See “Capital Expenditures” in this Item.
FINANCING ACTIVITIES. Net cash from financing activities during 2016 totaled $2.4 billion compared to net cash used of $1.1 billion in 2015. The $3.4 billion year on year change was primarily due to $3.1 billion of proceeds from debt offerings in 2016, $265 million more proceeds from issuances of TLLP common units and $394 million less purchases of common stock in the year partially offset by no borrowings under the TLLP term loan credit agreement in 2016 versus $250 million in 2015. The 2016 debt offerings primarily consisted of the $1.6 billion of senior notes issuances in late 2016 in anticipation of the Western Refining transaction, the $700 million of senior notes issuances by TLLP in May 2016 and the $750 million of senior notes issued in December 2016 by TLLP. Dividend payments and payments to noncontrolling interests increased $55 million during 2016 compared to 2015.
2015 COMPARED TO 2014
OPERATING ACTIVITIES. Net cash from operating activities increased $767 million, or 56%, to $2.1 billion in 2015 compared to $1.4 billion in 2014. The increase in net cash from operating activities was primarily attributable to $802 million in higher net earnings in 2015 offset by an $86 million increase in turnaround and branding charges during 2015.
INVESTING ACTIVITIES. Net cash used in investing activities decreased $2.0 billion, or 64% to $1.1 billion in 2015 compared to $3.2 billion in 2014 primarily due to cash paid of $2.5 billion for TLLP’s acquisition of the Rockies Natural Gas Business with no comparable acquisition in 2015. Partially offsetting this decrease was an increase in cash capital expenditures of $345 million primarily in our Refining segment. See “Capital Expenditures” in this Item.
FINANCING ACTIVITIES. Net cash used in financing activities during 2015 totaled $1.1 billion compared to net cash from financing activities of $1.6 billion in 2014. The $2.6 billion change was primarily due to TLLP’s financing activities during 2014 including senior note issuances of $1.3 billion, net proceeds of approximately $949 million from the issuance of TLLP common units, and borrowings on the TLLP Revolving Credit Facility to fund its 2014 acquisitions. Additionally, we completed the issuance of $300 million of 5.125% senior notes used to repay the 9.750% Senior Notes due 2019. Dividend payments and payments to noncontrolling interests increased $173 million and purchases of common stock under our share repurchase programs increased $144 million during 2015 versus 2014.
CAPITAL EXPENDITURES
Our capital spending reflects the Company’s emphasis on long term strategic priorities including continued focus on safety, reliability and value-driven growth. Growth capital expenditures include purchases or construction of new assets and expansion of existing facilities or services that increase throughput capacity or operational capabilities of our assets. Maintenance capital expenditures include projects to extend the life or maintain equipment reliability and integrity. Tesoro regulatory capital expenditures include projects to attain or maintain compliance with regulatory standards. We monitor the effectiveness of our investments in capital projects as part of our focus on financial discipline and continuous improvement. In addition, for major capital projects, we routinely review project assumptions and project execution as well as obtain third-party evaluations to assist in improving our project planning and execution. Actual and estimated amounts described below include amounts representing capitalized interest and labor. Tesoro primarily funds capital expenditures with cash generated from operations. TLLP primarily funds its capital expenditures with cash generated from operations, reimbursements for certain growth and maintenance capital expenditures, borrowings under the TLLP Revolving Credit Facility and issuances of additional TLLP debt and equity securities, as needed.
50 | Tesoro Corporation | ||
| MANAGEMENT’S DISCUSSION AND ANALYSIS | ||
2016 CAPITAL EXPENDITURES (in millions)
| Tesoro (a) | TLLP | ||||||
| Growth | $ | 210 | $ | 209 | |||
| Maintenance | 301 | 64 | |||||
| Regulatory | 164 | — | |||||
| Total 2016 Capital Expenditures | $ | 675 | $ | 273 | |||
| (a) | Tesoro capital expenditures exclude TLLP. |
2017 EXPECTED CAPITAL EXPENDITURES (in millions)
| Tesoro (a) | TLLP | ||||||
| Growth | $ | 325 | $ | 230 | |||
| Maintenance | 455 | 95 | |||||
| Regulatory | 90 | — | |||||
| Total 2017 Expected Capital Expenditures | $ | 870 | $ | 325 | |||
| (a) | Tesoro capital expenditures exclude TLLP. |
Cost estimates for projects currently in process or under development are subject to further review, analysis and permitting requirements resulting in revisions to our current spend estimates.
MAJOR CAPITAL PROJECTS IN PROCESS OR UNDER DEVELOPMENT (in millions)
| Major Projects | Total Project Expected Capital Expenditures | Actual 2016 Capital Expenditures | |||||
| Los Angeles Refinery Integration and Compliance Project (a) | $ | 510 | $ | 97 | |||
| Mixed Xylenes Project (b) | 410 | 24 | |||||
| Enterprise Resource Planning Project (c) | 230 | 97 | |||||
| Vancouver Energy Terminal Project (d) | 210 | 10 | |||||
| Avon Wharf Project (e) | 190 | 58 | |||||
| Mandan Tier 3 Project (f) | 190 | 3 | |||||
| Naphtha Isomerization Project (g) | 170 | 36 | |||||
| (a) | The integration and compliance project at the Los Angeles refinery is designed to improve the flexibility of gasoline and diesel yields and reduce carbon dioxide emissions. The proposed project, subject to project scoping, engineering and regulatory approval, includes decommissioning the fluid catalytic cracking unit at our Wilmington, California facility. Of the total expected capital expenditure related to this project, we anticipate a portion may be incurred and paid by TLLP. |
| (b) | The Mixed Xylenes Project is a portion of the Clean Products Upgrade Project at our Anacortes, Washington refinery that will help diversify our product mix through the extraction of existing mixed xylene from gasoline and improve our capability to deliver cleaner local transportation fuels and global feedstocks, primarily for polyester. The Mixed Xylenes Project and its components remain subject to final board and regulatory approval. |
| (c) | The Enterprise Resource Planning Project will simplify business processes by implementing a standardized and scalable platform across the Company to transform our business information and technology systems and to further streamline our operations, reduce costs and provide for future growth. We expect this project to be a complex, multi-year process that will require significant investments in software and technology. We completed the design phase in October 2016 and have transitioned to the build phase of this process. |
| (d) | The Vancouver Energy Terminal project is a partnership with Savage Companies to construct, own and operate a unit train unloading and marine loading terminal at Port of Vancouver, USA with a total capacity of 360 Mbpd allowing for the delivery of cost-advantaged North American crude oil to the U.S. West Coast. The project cost estimate will be updated once the project has completed the permitting process in the state of Washington. The project’s construction is estimated to take nine to twelve months, however initial operations are expected to begin within a few months of construction start. Effective September 1, 2016, we became majority owner of Vancouver Energy and as a result are reporting the total project costs above. |
| (e) | The regulatory and compliance project for the Avon Wharf in Martinez, California is required under the California building code for Marine Oil Terminal Engineering and Maintenance Standards (“MOTEMS”). The project is nearly complete and has replaced the marine berth with a MOTEMS compliant structure that will improve clean product movements and has received all regulatory approval and permits. |
December 31, 2016 | 51 | ||
| MANAGEMENT’S DISCUSSION AND ANALYSIS | ||
| (f) | The Mandan Tier 3 Project is designed to lower the sulfur content in gasoline, which aligns with the new Federal Tier 3 standards. The project will install a gasoline hydrotreater and associated infrastructure with completion expected before the end of 2019. The Mandan Tier 3 Project remains subject to final board approval as well as the review and approval by regulatory agencies. |
| (g) | The Naphtha Isomerization Project is a portion of the Clean Products Upgrade Project at our Anacortes, Washington refinery that will improve our capability to deliver cleaner local transportation fuels. The project is progressing with construction and is designed to lower the sulfur content in gasoline, which aligns with the new Federal Tier 3 standards. |
TURNAROUNDS AND BRANDING CHARGES
In addition to our capital spending program, we have expenditures for turnarounds, catalyst and branding charges.
SIGNIFICANT PLANNED TURNAROUNDS BY LOCATION AND BRANDING CHARGES (in millions)
| Significant Turnarounds | Los Angeles | Martinez | Anacortes | Kenai | Mandan | Salt Lake City | Turnarounds and catalysts | Branding Charges | Total Expenditures | ||||||
| 2016 | ● | ● | ● | $ | 334 | $ | 80 | $ | 414 | ||||||
| Planned 2017 | ● | ● | ● | ● | ● | 360 | 100 | 460 | |||||||
OFF-BALANCE SHEET ARRANGEMENTS
We have not entered into any transactions, agreements or other contractual arrangements, other than our leasing arrangements described in Note 1 to our consolidated financial statements in Item 8 that would result in off-balance sheet liabilities.
ENVIRONMENTAL
We are a party to various litigation and contingent loss situations, including environmental and income tax matters, arising in the ordinary course of business. Although we cannot predict the ultimate outcomes of these matters with certainty, we have accrued for the estimated liabilities when appropriate. We believe that the outcome of these matters will not have a material impact on our liquidity or financial position, although the resolution of certain of these matters could have a material impact on our interim or annual results of operations. Additionally, if applicable, we accrue receivables for probable third-party recoveries.
ENVIRONMENTAL LAWS AND REGULATIONS. We are subject to extensive federal, state and local environmental laws and regulations. These laws, which change frequently, regulate the discharge of materials into the environment and may require us to remove or mitigate the environmental effects of the disposal or release of petroleum or chemical substances at various sites, install additional controls or make other modifications to certain emission sources, equipment or facilities.
Future expenditures may be required to comply with the Clean Air Act and other federal, state and local requirements for our various sites, including our refineries, tank farms, pipelines and currently and previously owned or operated terminal and retail station properties. The impact of these legislative and regulatory requirements, including any greenhouse gas cap-and-trade program or low carbon fuel standards, could result in increased compliance costs, additional operating restrictions on our business and an increase in the cost of the products we manufacture, which could have a material adverse impact on our liquidity, consolidated financial position, or results of operations.
The Energy Independence and Security Act was enacted into federal law in December 2007 creating a second Renewable Fuels Standard (“RFS2”) requiring the total volume of renewable transportation fuels (including ethanol and advanced biofuels) sold or introduced in the U.S. to reach 20.5 billion gallons in 2015 and to increase to 36.0 billion gallons by 2022. These requirements could reduce future demand growth for petroleum products that we manufacture. In the near term, the RFS2 presents ethanol production and logistics challenges for the ethanol, alternative fuel and refining and marketing industries. We are currently meeting the RFS2 requirements through a combination of RINs that were carried over from prior periods, blending renewable fuels obtained from third parties and purchases of RINs in the open market. The spending related to the purchases of RINs for 2016 was not material to our operations and the spending for 2017 is not expected to be material based on our operations and the current regulatory environment. Actual costs related to RINs may differ due to changes in the market price of RINs and the ultimate destinations of our products. Additional expenditures could be required to logistically accommodate the increased use of renewable transportation fuels. While we cannot currently estimate the ultimate impact of this statute and implementing its regulations for future blending mandates, and currently believe that the outcome will not have a material impact on our liquidity or financial position, the ultimate outcome could have a material impact on our results of operations.
52 | Tesoro Corporation | ||
| MANAGEMENT’S DISCUSSION AND ANALYSIS | ||
In California, Assembly Bill 32 (“AB 32”) created a statewide cap on greenhouse gas emissions by requiring that the state return to 1990 emission levels by 2020. In 2016, Senate Bill 32 (“SB 32”) set a new emissions reduction target of 40% below 1990 levels by 2030. AB 32 focuses on using market mechanisms, such as a cap-and-trade program and a low carbon fuel standard (“LCFS”), to achieve emissions reduction targets. The LCFS became effective in January 2010 and requires a 10% reduction in the carbon intensity of gasoline and diesel fuel by 2020. In 2011, CARB approved cap-and-trade requirements that became effective in January 2013, and all of AB 32 related regulations are to be fully implemented by 2020. In December 2011, a U.S. District Court ruled that the LCFS violates the U.S. Constitution. CARB appealed the decision and, on September 18, 2013, the U.S. Ninth Circuit Court of Appeals reversed the lower court’s decision and remanded the case to the lower court to rule on whether the ethanol provisions of the LCFS are unconstitutional. We cannot predict the ultimate outcome of the lower court’s ruling on the LCFS, and the implementation and implications of AB 32 and SB 32 will take many years to realize. On January 1, 2015, transportation fuels were brought into the California cap-and-trade program, making fuel suppliers responsible for carbon emission from their products. The cost for carbon emissions is being passed through to customers. While we believe that the cap and trade requirements will not materially impact our liquidity, financial position, or results of operations, we cannot currently predict the impact of the LCFS and other AB 32 or expected SB 32-related regulations on our liquidity, financial position, or results of operations.
ENVIRONMENTAL LIABILITIES. We are incurring and expect to continue to incur expenses for environmental remediation liabilities at a number of currently and previously owned or operated refining, pipeline, terminal and retail station properties. We have accrued liabilities totaling $227 million and $255 million, including $22 million and $33 million for TLLP, at December 31, 2016 and 2015, respectively.
On October 17, 2016, the U.S. 5th Circuit Court of Appeals upheld the July 10, 2015 federal court order denying coverage pursuant to an insurance policy for environmental remediation liabilities at our Martinez refinery. In November 2016, the Court of Appeals denied our petitions for a rehearing. The liabilities are included in our accruals as we have not recognized possible insurance recoveries under the policies. See Note 15 to our consolidated financial statements in Item 8 for additional information on our environmental obligations.
OTHER MATTERS
In the ordinary course of business, we become party to lawsuits, administrative proceedings and governmental investigations, including environmental, regulatory and other matters. Large, and sometimes unspecified, damages or penalties may be sought from us in some matters. We have not established accruals for these matters unless a loss is probable and the amount of loss is currently estimable.
WASHINGTON REFINERY FIRE. The naphtha hydrotreater unit at our Washington refinery was involved in a fire in April 2010, which fatally injured seven employees and rendered the unit inoperable. The Washington State Department of Labor & Industries (“L&I”) initiated an investigation of the incident. L&I completed its investigation in October 2010, issued a citation and assessed approximately a $2 million fine, which we appealed. We disagree with L&I’s characterizations of operations at our Washington refinery and believe, based on available evidence and scientific reviews, that many of the agency’s conclusions are mistaken. We filed an appeal of the citation in January 2011. In separate September 2013, November 2013 and February 2015 orders, the Board of Industrial Insurance Appeals (“BIIA”) granted partial summary judgment in our favor rejecting 33 of the original 44 allegations in the citation as lacking legal or evidentiary support. The hearing on the remaining 11 allegations concluded in July 2016, and we expect the judge to issue a recommended decision for the BIIA’s review in 2017. While we cannot currently estimate the final amount or timing of its resolution of this matter, we have established an accrual based on our best estimate at this time.
ENVIRONMENTAL. We have investigated conditions at certain active wastewater treatment units at our Martinez refinery pursuant to an order received in 2004 from the San Francisco Bay Regional Water Quality Control Board that named us as well as two previous owners of the Martinez refinery. We cannot currently estimate the amount of the ultimate resolution of the order, but we believe it will not have a material adverse impact on our liquidity, financial position, or results of operations.
On October 26, 2016, the Utah Supreme Court rejected the Utah Physicians for a Healthy Environment’s and the Utah Chapter of the Sierra Club’s (“Petitioners”) challenge of an air permit issued by the Utah Department of Environmental Quality (“UDEQ”) to our Salt Lake City refinery in September 2012. Petitioners had filed a Request for Agency Action (the “Request”) with UDEQ challenging UDEQ’s permitting of our refinery conversion project alleging that the permit did not conform to the requirements of the Clean Air Act. After proceedings before an administrative law judge and the Executive Director of UDEQ’s subsequent dismissal of Petitioners’ Request, Petitioners filed a petition for review with the Utah Court of Appeals in December 2014, and the Court of Appeals certified the case to the Utah Supreme Court. On December 27, 2016 the Utah Supreme Court denied the Petitioners’ petition for rehearing.
December 31, 2016 | 53 | ||
| MANAGEMENT’S DISCUSSION AND ANALYSIS | ||
In response to incidents in February and March 2014 at our Martinez refinery involving sulfuric acid exposure at the Alkylation Unit, the U.S. Environmental Protection Agency is conducting an investigation to evaluate the Martinez refinery’s compliance with certain federal environmental acts and the Risk Management Plan requirements under the Clean Air Act. While we cannot currently predict the timing and the resolution of this investigation, we believe the outcome will not have a material impact on our liquidity, financial position, or results of operations.
TAX. We are subject to extensive federal, state and foreign tax laws and regulations. Newly enacted tax laws and regulations, and changes in existing tax laws and regulations, could result in increased expenditures in the future. See Note 13 to our consolidated financial statements in Item 8 for additional information on our tax matters.
LONG-TERM COMMITMENTS
During the ordinary course of business, we enter into contractual commitments for purchases associated with the operation of our refineries along with other debt service and lease arrangements (see Notes 12 and 15 to our consolidated financial statements in Item 8 for additional information). We also have minimum contractual spending requirements for certain capital projects. The contractual commitments detailed below do not include our contractual obligations to TLLP under our various fee-based commercial agreements as these related-party transactions are eliminated in the consolidated financial statements.
SUMMARY OF CONTRACTUAL OBLIGATIONS (in millions)
| Contractual Obligation | 2017 | 2018 | 2019 | 2020 | 2021 | Thereafter | Total | ||||||||||||||||||||
| Long-term debt obligations (a) | $ | 823 | $ | 372 | $ | 877 | $ | 811 | $ | 1,431 | $ | 4,952 | $ | 9,266 | |||||||||||||
| Capital lease obligations (b) | 9 | 10 | 9 | 6 | 5 | 12 | 51 | ||||||||||||||||||||
| Operating lease obligations (b) | 413 | 323 | 259 | 227 | 224 | 392 | 1,838 | ||||||||||||||||||||
| Crude oil supply obligations (c) | 3,225 | 886 | 486 | 395 | 164 | — | 5,156 | ||||||||||||||||||||
| Other purchase obligations (d) | 317 | 241 | 182 | 143 | 125 | 105 | 1,113 | ||||||||||||||||||||
| Capital expenditure obligations (e) | 459 | — | — | — | — | — | 459 | ||||||||||||||||||||
| Total Contractual Obligations | $ | 5,246 | $ | 1,832 | $ | 1,813 | $ | 1,582 | $ | 1,949 | $ | 5,461 | $ | 17,883 | |||||||||||||
| (a) | Includes maturities of principal and interest payments, excluding capital lease obligations. Amounts and timing may be different from our estimated commitments due to potential voluntary debt prepayments and borrowings. Interest payments assume the interest rate in effect as of December 31, 2016. |
| (b) | Capital lease obligations include amounts classified as interest. Operating lease obligations primarily represent our future minimum noncancellable lease commitments. Operating lease obligations primarily include lease arrangements with initial or remaining noncancellable terms in excess of one year and are not reduced by minimum rentals to be received by us under subleases. |
| (c) | Represents an estimate of our long-term contractual purchase commitments for crude oil, having initial or remaining terms in excess of one year. At December 31, 2016, these agreements have remaining terms ranging from one month to six years. Prices under these term agreements fluctuate due to market-responsive pricing provisions. To estimate our annual commitments under these contracts, we estimated crude oil prices using exchange-traded crude future prices by crude oil type as of December 31, 2016, with prices ranging from $56 per barrel to $57 per barrel, and volumes based on the contract’s minimum purchase requirements over the term of the contract. We also purchase additional crude oil under short-term renewable contracts and in the spot market, which are not included in the table above. |
| (d) | Represents long-term commitments primarily for the transportation of crude oil, refined products and NGLs as well as to purchase industrial gases, chemical processing services and utilities at our refineries. These purchase obligations are based on the contract’s minimum volume requirements. |
| (e) | Minimum contractual spending requirements for certain capital projects. |
We also have other noncurrent liabilities pertaining to our defined benefit plans and other postretirement benefits, environmental liabilities and asset retirement obligations. With the exception of amounts classified as current, there is uncertainty as to the timing of future cash flows related to these obligations. As such, we have excluded the future cash flows from the contractual commitments table above. See additional information on pension and other postretirement benefits, environmental liabilities and asset retirement obligations in Notes 14 and 15, respectively, to our consolidated financial statements in Item 8.
In addition, due to the uncertainty of the timing of future cash flows with our unrecognized tax benefits, with the exception of amounts classified as current, we are unable to make reasonably reliable estimates of the period of cash settlement. Accordingly, we have excluded from the table $6 million of unrecognized tax benefits recorded as liabilities in our consolidated balance sheets. Related to these unrecognized tax benefits, and also excluded from the table, is a liability for potential interest and penalties of $2 million at December 31, 2016. See Note 13 to our consolidated financial statements in Item 8 for further information.
54 | Tesoro Corporation | ||
| MANAGEMENT’S DISCUSSION AND ANALYSIS | ||
PENSION FUNDING
We provide a qualified defined benefit retirement plan for all eligible employees, with benefits based age and compensation. Our long-term expected return on plan assets is 6.50% as of December 31, 2016, and the actual return on our funded employee pension plan assets was a $30 million, or 7.1%, gain in 2016 and a $15 million, or 3.8%, loss in 2015. Based on a 4.12% discount rate and fair values of plan assets as of December 31, 2016, the assets in our funded employee pension plan were equal to approximately 54% of the projected benefit obligation. For funding purposes, the Moving Ahead for Progress in the 21st Century Act, as signed into law in July 2012 and later modified by the Bipartisan Budget Act of 2015 (“BBA”) stipulates that the discount rate must remain within a specified corridor of a 25-year average corporate bond rate, with such corridor widening from 10% to 30% between 2012 and 2024. On the BBA basis, the adjusted funding target attainment percentage (a funding status measure defined under applicable pension funding regulations) was 101% at January 1, 2016. Although our funded employee retirement plan fully meets all of the funding requirements under applicable laws and regulations, we contributed $60 million during 2016 to improve the plan’s funded status. Future contributions are affected by returns on plan assets, discount rates, employee demographics, regulatory environments and other factors. See Note 14 to our consolidated financial statements in Item 8 for additional information on our benefit plans.
ACCOUNTING STANDARDS
CRITICAL ACCOUNTING POLICIES
Our significant accounting policies are described in Note 1 to our consolidated financial statements in Item 8. We prepare our consolidated financial statements in conformity with U.S. GAAP, which require us to make estimates and assumptions about future events that affect the amounts reported in the consolidated financial statements and accompanying footnotes. Actual results could differ from those estimates. For additional information concerning certain estimates and assumptions, see the respective footnotes to our consolidated financial statements in Item 8. We believe that the following discussion addresses our most critical accounting policies, which are those that are most important to the portrayal of our financial condition and results of operations and require management’s most difficult, subjective and complex judgments.
IMPAIRMENT OF LONG-LIVED ASSETS. Long-lived assets (which include property, plant, and equipment, intangible assets with defined useful lives, deferred refinery turnaround and catalyst costs) are evaluated for potential impairment when an asset disposition is probable or when there are indicators of impairment (for example, current period operating losses combined with a history of operating losses or a temporary shutdown of a refinery) and, if so, assessing whether the asset net book values are recoverable from estimated future undiscounted cash flows. The actual amount of an impairment loss to be recorded, if any, is equal to the amount by which the asset’s net book value exceeds its fair market value. Fair market value is based on the present values of estimated future cash flows in the absence of quoted market prices. Estimates of future cash flows and fair market values of assets require subjective assumptions with regard to several factors, including an assessment of global market conditions, future operating results and forecasts of the remaining useful lives of the assets. Actual results could differ from those estimates. Providing sensitivity analysis if other assumptions were used in performing the impairment evaluations is not practicable due to the significant number of assumptions involved in the estimates.
GOODWILL AND OTHER IDENTIFIED INTANGIBLE ASSETS WITH INDEFINITE LIVES. Goodwill represents the excess of the consideration paid over the fair value of the net assets acquired in a business combination. Goodwill acquired in a business combination is not amortized, but instead tested for impairment at least annually or more frequently should an event occur or circumstances indicate that the carrying amount may be impaired. Such events or circumstances may be a significant change in business climate, economic and industry trends, legal factors, negative operating performance indicators, significant competition, changes in strategy, or disposition of a reporting unit or a portion thereof. Goodwill impairment testing is performed at the reporting unit level on November 1 of each year and when circumstances change that might indicate impairment.
We test goodwill for impairment by performing an optional qualitative assessment process and/or using a two-step quantitative assessment process. If we choose to perform a qualitative assessment process and determine it is more likely than not (that is, a likelihood of more than 50 percent) that the carrying value of the net assets is more than the fair value of the reporting unit, the two-step quantitative assessment process is then performed; otherwise, no further testing is required. We may elect not to perform the qualitative assessment process and, instead, proceed directly to the two-step quantitative assessment process. For reporting units where the two-step quantitative assessment process is performed, the first step involves comparing the carrying value of net assets, including goodwill, to the fair value of the reporting unit. If the fair value exceeds its carrying amount, goodwill is not considered impaired and the second step of the process is unnecessary. If the carrying amount of a reporting unit’s goodwill exceeds its fair value, the second step measures the impairment loss, if any.
December 31, 2016 | 55 | ||
| MANAGEMENT’S DISCUSSION AND ANALYSIS | ||
We elected to perform our annual goodwill impairment analysis using a two-step quantitative assessments process on the goodwill recorded in five reporting units of our TLLP segment and the qualitative assessment process on the remaining goodwill in the reporting units in our other two segments as of November 1, 2016.
As part of our two-step quantitative goodwill impairment process for TLLP’s five reporting units, we engaged a third-party appraisal firm to assist in the determination of estimated fair value for each reporting unit. This determination includes estimating the fair value of each reporting unit using both the income and market approaches. The income approach requires management to estimate a number of factors for each reporting unit, including projected future operating results, economic projections, anticipated future cash flows and discount rates. The market approach estimates fair value using comparable marketplace fair value data from within a comparable industry grouping. The determination of the fair value of the reporting units requires us to make significant estimates and assumptions. These estimates and assumptions primarily include, but are not limited to, the selection of appropriate peer group companies, control premiums appropriate for acquisitions in the industries in which we compete, the discount rates, terminal growth rates, and forecasts of revenue, operating income, depreciation and amortization and capital expenditures.
Factors utilized in the qualitative assessment include, among other things, macroeconomic conditions, industry and market considerations, cost factors, overall financial performance, company specific operating results and other relevant entity-specific events affecting individual reporting units.
We determined that no impairment charges resulted from our November 1, 2016 goodwill impairment assessment. Furthermore, the fair value of each of the five reporting units tested in step one of the goodwill impairment test were materially in excess of the carrying value, and as such, we were not required to perform step two. There were no impairments of goodwill during the years ended December 31, 2016, 2015 and 2014.
We evaluate our indefinite-lived intangible assets for impairment annually in the fourth quarter and at other times when an event occurs or circumstances change such that an impairment may exist. In evaluating our indefinite-lived intangible assets for impairment, we assess qualitative factors to determine whether it is more likely than not that the fair value of an indefinite-lived intangible asset is less than its carrying value. If, after completing the qualitative assessment, we determine it is more likely than not that the fair value of the indefinite-lived intangible asset is greater than its carrying amount, the asset is not impaired. If we conclude it is more likely than not that the fair value of the indefinite-lived intangible assets is less than the carrying value, we would then proceed to a quantitative impairment test, which consists of a comparison of the fair value of the intangible assets to their carrying amounts. There were no impairments of indefinite-lived intangible assets during the years ended December 31, 2016, 2015 and 2014.
INCOME TAXES. As part of the process of preparing our consolidated financial statements, we must assess the likelihood that our deferred income tax assets will be recovered through future taxable income. We must establish a valuation allowance to the extent we believe that recovery is not likely. Significant management judgment is required in determining any valuation allowance recorded against deferred income tax assets. We have recorded a valuation allowance of $26 million on certain federal and state net operating loss and tax credit carryforwards as of December 31, 2016, most of which were obtained with the acquisition of Virent. The valuation allowance is primarily due to certain tax restrictions placed on Virent’s loss carryforwards after the change in control. The valuation allowance on other tax credit carryforwards pre-dating the Virent acquisition is based on our estimate of taxable income in each jurisdiction in which we operate and the period over which deferred income tax assets will be recoverable. We may need to establish an additional valuation allowance if actual results differ from these estimates or we make adjustments to these estimates in future periods. We also recognize the financial statement effects of a tax position when it is more likely than not that the position will be sustained upon examination.
PENSION AND OTHER POSTRETIREMENT BENEFITS. Accounting for pensions and other postretirement benefits involves several assumptions and estimates including discount rates, expected rate of return on plan assets, rates of compensation, health care cost trends, inflation, retirement rates and mortality rates. We must assume a rate of return on funded pension plan assets in order to estimate our obligations under our defined benefit plans. Due to the nature of these calculations, we engage an actuarial firm to assist with these estimates and the calculation of certain employee benefit expenses. We record an asset for our plans overfunded status or a liability if the plans are underfunded. The funded status represents the difference between the fair value of our plans’ assets and the projected benefit obligations. While we believe the assumptions we used are appropriate, significant differences in actual experience or significant changes in assumptions would affect pension and other postretirement benefits costs and obligations. We determine the discount rate primarily by reference to the effective yields on high quality corporate bonds that have a comparable cash flow pattern to the expected payments to be made under our plans. The expected return on plan assets is based upon the weighted averages of the expected long-term rates of return for the broad categories of investments held in our plans and also uses a three-year average of the market value of plan assets. These assumptions can have a significant effect on the amounts reported in our consolidated financial statements.
56 | Tesoro Corporation | ||
| MANAGEMENT’S DISCUSSION AND ANALYSIS | ||
ONE-PERCENTAGE-POINT CHANGE IN EXPECTED RATE OF RETURN AND DISCOUNT RATE
1-Percentage- Point Increase | 1-Percentage- Point Decrease | ||||||
| Expected Rate of Return: | |||||||
| Effect on net periodic pension expense | $ | (4 | ) | $ | 4 | ||
| Discount Rate: | |||||||
| Effect on net periodic pension expense | $ | (6 | ) | $ | 9 | ||
| Effect on projected benefit obligation | (77 | ) | 110 | ||||
See Note 14 to our consolidated financial statements in Item 8 for more information regarding costs and assumptions.
ENVIRONMENTAL LIABILITIES. We record environmental liabilities when environmental assessments and/or proposed environmental remedies are probable and can be reasonably estimated. Usually, the timing of our accruals coincides with assessing the liability and then completing a feasibility study or committing to a formal plan of action. When we complete our analysis or when we commit to a plan of action, we accrue a liability based on the minimum range of the expected costs, unless we consider another amount more likely. We base our cost estimates on the extent of remedial actions required by applicable governing agencies, experience gained from similar environmental projects and the amounts to be paid by other responsible parties.
Accruals for our environmental liabilities require judgment due to the uncertainties related to the magnitude of the liability and timing of the remediation effort. Our environmental liability estimates are subject to change due to potential changes in environmental laws, regulations or interpretations, additional information related to the extent and nature of the liability, and potential improvements in remediation technologies. We do not discount our estimated liabilities to present value. An estimate of the sensitivity for changes in those factors is not practicable due to the number of contingencies that must be assessed, the number of underlying assumptions, and the wide range of possible outcomes.
ACQUISITIONS. We allocate the fair value of purchase consideration to the tangible assets acquired, liabilities assumed, and intangible assets acquired based on their estimated fair values. The excess of the fair value of purchase consideration over the fair values of these identifiable assets and liabilities is recorded as goodwill. Determining the fair value of these items requires management’s judgment, the utilization of independent valuation experts, and involves the use of significant estimates and assumptions with respect to the timing and amounts of future cash inflows and outflows, discount rates, market prices, and asset lives, among other items. The judgments made in the determination of the estimated fair value assigned to the assets acquired and the liabilities assumed, as well as the estimated useful life of each asset and the duration of each liability, can materially impact the financial statements in periods after acquisition, such as through depreciation and amortization.
While management believes those expectations and assumptions are reasonable, they are inherently uncertain. Unanticipated market or macroeconomic events and circumstances may occur, which could affect the accuracy or validity of the estimates and assumptions.
NEW ACCOUNTING STANDARDS AND DISCLOSURES
New accounting standards and disclosures are discussed in Note 1 to our consolidated financial statements in Item 8.
ITEM 7A. QUANTITATIVE AND QUALITATIVE DISCLOSURES ABOUT MARKET RISK
RISK MANAGEMENT
We have established a risk committee comprised of senior level leadership from our financial, strategic, governance, administrative and operational functions. The risk committee’s responsibilities include performing an annual review to assess and prioritize the Company’s risks in coordination with our subject matter experts, assessing the status and effectiveness of risk prevention and mitigation activities, identifying emerging risks and facilitate management’s development of risk assessment and management practices. The risk committee is also responsible for assessing and advising management on our system of controls to ensure policies and procedures are properly followed and appropriate accountability is present. Our controls are designed to:
| • | create and maintain a comprehensive risk management framework; |
| • | provide for authorization by the appropriate levels of management; |
| • | provide for segregation of duties; |
December 31, 2016 | 57 | ||
| QUANTITATIVE AND QUALITATIVE DISCLOSURES | ||
| • | maintain appropriate level of knowledge regarding the execution of and the accounting for derivative instruments; and |
| • | implement key indicators to measure the performance of hedging activities. |
The risk committee meets at least monthly to review priority and emerging risks and risk prevention and mitigation activities. In addition, our risk committee chairman presents a quarterly risk update to executive management and an annual update to our Board of Directors concerning the status and effectiveness of our risk prevention and mitigation activities, emerging risks and risk assessment and management practices.
COMMODITY PRICE RISKS
Our primary source of market risk emanates from the difference between the sale prices for our refined products and the purchase prices for crude oil and other feedstocks. Refined product prices are directly influenced by the price of crude oil. Our earnings and cash flows from operations depend on the margin, relative to fixed and variable expenses (including the costs of crude oil and other feedstocks) at which we are able to sell our refined products. The prices of crude oil and refined products fluctuate substantially and depend on many factors including the global supply and demand for crude oil and refined products. This demand is impacted by changes in the global economy, the level of foreign and domestic production of crude oil, natural gas and refined products, geo-political conditions, the availability of imports of crude oil and refined products, the relative strength of the U.S. dollar, the marketing of alternative and competing fuels and the impact of government regulations. Our refined product sale prices are also affected by local factors such as local market conditions and the level of operations of other suppliers in our markets.
In most cases, an increase or decrease in the price of crude oil results in a corresponding increase or decrease in the price of gasoline and other refined products. The timing, direction and the overall change in refined product prices versus crude oil prices could have a significant impact on our profit margins, earnings and cash flows. Assuming all other factors remained constant, a $1 per barrel change in average gross refining margins, based on our average throughput of 825 Mbpd, would change annualized pre-tax operating income by approximately $300 million. This analysis may differ from actual results.
We maintain inventories of crude oil, intermediate products and refined products, the values of which are subject to fluctuations in market prices. The valuation of our inventories can significantly impact amounts reported in our balance sheet where changes therein can then impact amounts recorded in our results of operations. Our inventories of refinery feedstocks and refined products totaled 45 million barrels and 48 million barrels at December 31, 2016 and 2015, respectively. Since market prices declined to a level below the average cost of our inventories, we recorded a net lower of cost or market inventory adjustment (charge to earnings and reduction in inventory carrying value) of $359 million as of December 31, 2015. There was no net lower of cost or market inventory adjustment as of December 31, 2016. Due to the increase in market prices in 2016, as of December 31, 2016, we fully reversed the lower of cost or market reserve to zero and, as a result, we recognized a gain of $359 million in our results of operations during 2016.
We use non-trading physical derivative instruments to manage exposure to commodity price risks associated with the purchase or sale of crude oil and finished products and inventories above or below our target levels. We also use these instruments to manage the impact of market volatility and arbitrage opportunities for crude oil where the price of crude oil is higher in the future than the current spot price. For the purchase or sale of crude oil and finished products to be used in our normal operations, we enter into physical commodity forward purchase and sale contracts (“Forward Contracts”), which are not typically classified and reported as derivatives for accounting purposes. The gains or losses associated with these Forward Contracts are recognized as incurred in our financial statements separate from the gains or losses associated with other derivative instruments reported below and in Note 10 to our consolidated financial statements in Item 8.
Also, we entered into financial derivative contracts such as exchange-traded futures, over-the-counter swaps, options and over-the-counter options, most of which had remaining durations of less than one year as of December 31, 2016, to economically hedge price risk associated with our physical commodity Forward Contracts or to take advantage of other market opportunities. We mark-to-market these derivative instruments each period during the contract term, which can create timing differences for gain or loss recognition in our financial statements. The derivative gains or losses presented below do not reflect the realized losses or gains, respectively, from the settlement of our physical commodity transactions. Both the derivative and the physical commodity Forward Contracts’ gains and losses are reflected in our gross refining margin in the refining segment. We evaluate our performance based on all contract types available to manage our risk, which includes contracts that may or may not be classified and reported as derivatives for accounting purposes.
58 | Tesoro Corporation | ||
| QUANTITATIVE AND QUALITATIVE DISCLOSURES | ||
We believe the governance structure that we have in place is adequate given the size and sophistication of our commodity optimization, inventory management and trading activities. Our governance over commodity activities includes regular monitoring of the performance of our risk management strategies and limits over dollar and volume based transactional authority, commodity position, aggregate spread, stop-loss and value-at-risk. Performance against our strategies and authorized limits is monitored daily via position reports and profit and loss analysis and is reviewed on a regular basis, at least monthly, by our risk committee.
COMPOSITION OF NET GAIN (LOSS) ON OUR COMMODITY DERIVATIVE POSITIONS (in millions)
| Years ended December 31, | |||||||
| 2016 | 2015 | ||||||
| Unrealized gain carried on open derivative positions from prior period | $ | (44 | ) | $ | (177 | ) | |
| Realized gain on settled derivative positions | 26 | 412 | |||||
| Unrealized gain (loss) on open net derivative positions | (49 | ) | 44 | ||||
| Net Gain (Loss) | $ | (67 | ) | $ | 279 | ||
Our open derivative positions at December 31, 2016 will expire at various times through 2018. We prepared a sensitivity analysis to estimate our exposure to market risk associated with our derivative instruments. Based on our open net positions at December 31, 2016, a 1% change in quoted market prices of our derivative instruments, assuming all other factors remain constant, could change the fair value of our derivative instruments and pre-tax operating income by approximately $4 million. This analysis may differ from actual results.
With the exception of a small amount of condensate and pipeline loss allowances, TLLP is not exposed to commodity price risk with respect to any of the crude oil, natural gas, NGLs or refined products that are handled. See Note 3 to our consolidated financial statements in Item 8 for additional information on our Keep-Whole Commodity Agreement.
COUNTERPARTY CREDIT RISK
We have exposure to concentrations of credit risk related to our counterparties’ ability to meet their contractual payment obligations, and the potential non-performance by counterparties to deliver contracted commodities or services at the contracted price. Customer concentrations within the refining industry and oil and gas producers may affect our overall exposure to counterparty risk because these customers may be similarly impacted by changes in economic or other conditions. In addition, financial services companies are the counterparties in certain of our price risk management activities, and such financial services companies could be adversely impacted by periods of uncertainty and illiquidity in the credit or capital markets. We have credit management processes in place by which we closely monitor the status of our counterparties by performing ongoing credit evaluations of their financial condition. In certain circumstances, we require prepayments, letters of credit or other credit enhancement.
INTEREST RATE RISK
Our use of fixed or variable-rate debt directly exposes us to interest rate risk. Fixed rate debt, such as our senior notes, exposes us to changes in the fair value of our debt due to changes in market interest rates. Fixed rate debt also exposes us to the risk that we may need to refinance maturing debt with new debt at higher rates or that our current fixed rate debt may be higher than the current market. Variable-rate debt, such as borrowings under our Revolving Credit Facility, exposes us to short-term changes in market rates that impact our interest expense. The fair value of our debt was estimated primarily using quoted market prices. The carrying and fair values of our debt were approximately $7.0 billion and $7.3 billion at December 31, 2016, respectively, and approximately $4.1 billion for both the carrying and fair values at December 31, 2015. These carrying and fair values of our debt do not consider the unamortized issuance costs, which are netted against our total debt. Unless interest rates increase significantly in the future, our exposure to interest rate risk should be minimal. With all other variables constant, a 0.25% change in the interest rate associated with the borrowings outstanding would change annual interest expense by less than $1 million under any of our variable-rate debt. We currently do not use interest rate swaps to manage our exposure to interest rate risk; however, we continue to monitor the market and our exposure, and may in the future enter into these transactions to mitigate risk. We believe in the short-term we have acceptable interest rate risk and continue to monitor the risk on our long-term obligations. There were no borrowings outstanding under the Revolving Credit Facility and TLLP Dropdown Credit Facility, and $330 million borrowings outstanding under the TLLP Revolving Credit Facility as of December 31, 2016.
December 31, 2016 | 59 | ||
| FINANCIAL STATEMENTS | ||
ITEM 8. FINANCIAL STATEMENTS AND SUPPLEMENTARY DATA
REPORT OF INDEPENDENT REGISTERED PUBLIC ACCOUNTING FIRM
To the Board of Directors and Stockholders of
Tesoro Corporation
We have audited the accompanying consolidated balance sheets of Tesoro Corporation as of December 31, 2016 and 2015, and the related consolidated statements of operations, comprehensive income, equity, and cash flows for each of the three years in the period ended December 31, 2016. These financial statements are the responsibility of the Company’s management. Our responsibility is to express an opinion on these financial statements based on our audits.
We conducted our audits in accordance with the standards of the Public Company Accounting Oversight Board (United States). Those standards require that we plan and perform the audit to obtain reasonable assurance about whether the financial statements are free of material misstatement. An audit includes examining, on a test basis, evidence supporting the amounts and disclosures in the financial statements. An audit also includes assessing the accounting principles used and significant estimates made by management, as well as evaluating the overall financial statement presentation. We believe that our audits provide a reasonable basis for our opinion.
In our opinion, the financial statements referred to above present fairly, in all material respects, the consolidated financial position of Tesoro Corporation at December 31, 2016 and 2015, and the consolidated results of its operations and its cash flows for each of the three years in the period ended December 31, 2016, in conformity with U.S. generally accepted accounting principles.
We also have audited, in accordance with the standards of the Public Company Accounting Oversight Board (United States), Tesoro Corporation’s internal control over financial reporting as of December 31, 2016, based on criteria established in Internal Control-Integrated Framework issued by the Committee of Sponsoring Organizations of the Treadway Commission (2013 framework), and our report dated February 21, 2017 expressed an unqualified opinion thereon.
/s/ ERNST & YOUNG LLP
San Antonio, Texas
February 21, 2017
60 | Tesoro Corporation | ||
| FINANCIAL STATEMENTS | ||
TESORO CORPORATION
STATEMENTS OF CONSOLIDATED OPERATIONS
| Years Ended December 31, | ||||||||||||
| Note | 2016 | 2015 | 2014 | |||||||||
| (in millions except per share amounts) | ||||||||||||
| Revenues (a) | $ | 24,582 | $ | 28,711 | $ | 40,633 | ||||||
| Cost and Expenses: | ||||||||||||
| Cost of sales (excluding the lower of cost or market inventory valuation adjustment) (a) | 19,658 | 21,928 | 35,603 | |||||||||
| Lower of cost or market inventory valuation adjustment | 5 | (359 | ) | 317 | 42 | |||||||
| Operating expenses | 2,541 | 2,455 | 2,444 | |||||||||
| Selling, general and administrative expenses | 401 | 386 | 346 | |||||||||
| Depreciation and amortization expense | 851 | 756 | 562 | |||||||||
| Loss on asset disposals and impairments | 9 | 42 | 4 | |||||||||
| Operating Income | 1,481 | 2,827 | 1,632 | |||||||||
| Interest and financing costs, net | (274 | ) | (217 | ) | (235 | ) | ||||||
| Equity in earnings of equity method investments | 8 | 13 | 7 | 10 | ||||||||
| Other income, net | 57 | 13 | 57 | |||||||||
| Earnings Before Income Taxes | 1,277 | 2,630 | 1,464 | |||||||||
| Income tax expense | 13 | 427 | 936 | 547 | ||||||||
| Net Earnings from Continuing Operations | 850 | 1,694 | 917 | |||||||||
| Earnings (loss) from discontinued operations, net of tax | 4 | 10 | (4 | ) | (29 | ) | ||||||
| Net Earnings | 860 | 1,690 | 888 | |||||||||
| Less: Net earnings from continuing operations attributable to noncontrolling interest | 126 | 150 | 45 | |||||||||
| Net Earnings Attributable to Tesoro Corporation | $ | 734 | $ | 1,540 | $ | 843 | ||||||
| Net Earnings (Loss) Attributable to Tesoro Corporation: | ||||||||||||
| Continuing operations | $ | 724 | $ | 1,544 | $ | 872 | ||||||
| Discontinued operations | 10 | (4 | ) | (29 | ) | |||||||
| Total | $ | 734 | $ | 1,540 | $ | 843 | ||||||
| Net Earnings (Loss) Per Share - Basic: | ||||||||||||
| Continuing operations | $ | 6.11 | $ | 12.53 | $ | 6.79 | ||||||
| Discontinued operations | 0.08 | (0.03 | ) | (0.23 | ) | |||||||
| Total | $ | 6.19 | $ | 12.50 | $ | 6.56 | ||||||
| Weighted average common shares outstanding - Basic | 16 | 118.5 | 123.2 | 128.5 | ||||||||
| Net Earnings (Loss) Per Share - Diluted: | ||||||||||||
| Continuing operations | $ | 6.04 | $ | 12.39 | $ | 6.67 | ||||||
| Discontinued operations | 0.08 | (0.03 | ) | (0.23 | ) | |||||||
| Total | $ | 6.12 | $ | 12.36 | $ | 6.44 | ||||||
| Weighted average common shares outstanding - Diluted | 16 | 119.9 | 124.6 | 130.8 | ||||||||
| Dividends per Share | $ | 2.10 | $ | 1.85 | $ | 1.10 | ||||||
| Supplemental Information: | ||||||||||||
| (a) Includes excise taxes collected by our Marketing segment | $ | 577 | $ | 561 | $ | 581 | ||||||
The accompanying notes are an integral part of these consolidated financial statements.
December 31, 2016 | 61 | ||
| FINANCIAL STATEMENTS | ||
TESORO CORPORATION
STATEMENTS OF CONSOLIDATED COMPREHENSIVE INCOME
| Years Ended December 31, | ||||||||||||
| Note | 2016 | 2015 | 2014 | |||||||||
| (in millions) | ||||||||||||
| Net Earnings | $ | 860 | $ | 1,690 | $ | 888 | ||||||
| Pension and other postretirement benefit liability adjustments | 14 | (65 | ) | — | (159 | ) | ||||||
| Income tax benefit on pension and other postretirement benefit liability adjustments | 26 | — | 62 | |||||||||
| Total Comprehensive Income | 821 | 1,690 | 791 | |||||||||
| Less: Noncontrolling interest in comprehensive income | 126 | 150 | 45 | |||||||||
| Comprehensive Income Attributable to Tesoro Corporation | $ | 695 | $ | 1,540 | $ | 746 | ||||||
The accompanying notes are an integral part of these consolidated financial statements.
62 | Tesoro Corporation | ||
| FINANCIAL STATEMENTS | ||
TESORO CORPORATION
CONSOLIDATED BALANCE SHEETS
| December 31, | ||||||||
| Note | 2016 | 2015 | ||||||
| (in millions, except share data) | ||||||||
| ASSETS | ||||||||
| Current Assets | ||||||||
Cash and cash equivalents (TLLP: $688 and $16, respectively) | $ | 3,295 | $ | 942 | ||||
| Receivables, net of allowance for doubtful accounts | 5 | 1,108 | 792 | |||||
| Inventories, net of lower of cost or market valuation | 5 | 2,640 | 2,302 | |||||
| Prepayments and other current assets | 371 | 271 | ||||||
| Total Current Assets | 7,414 | 4,307 | ||||||
| Property, Plant and Equipment, Net | ||||||||
| Property, plant and equipment, at cost | 13,472 | 12,562 | ||||||
| Accumulated depreciation and amortization | (3,496 | ) | (3,021 | ) | ||||
Property, Plant and Equipment, Net (TLLP: $3,444 and $3,681, respectively) | 6 | 9,976 | 9,541 | |||||
| Other Noncurrent Assets | ||||||||
Acquired intangibles, net (TLLP: $947 and $976, respectively) | 7 | 1,277 | 1,211 | |||||
Other, net (TLLP: $531 and $222, respectively) | 9 | 1,731 | 1,273 | |||||
| Total Other Noncurrent Assets | 3,008 | 2,484 | ||||||
| Total Assets | $ | 20,398 | $ | 16,332 | ||||
| LIABILITIES AND EQUITY | ||||||||
| Current Liabilities | ||||||||
| Accounts payable | $ | 2,032 | $ | 1,568 | ||||
| Current maturities of debt | 12 | 465 | 6 | |||||
| Other current liabilities | 9 | 1,057 | 956 | |||||
| Total Current Liabilities | 3,554 | 2,530 | ||||||
| Deferred Income Taxes | 13 | 1,428 | 1,222 | |||||
Debt, Net of Unamortized Issuance Costs (TLLP: $4,053 and $2,844, respectively) | 12 | 6,468 | 4,067 | |||||
| Other Noncurrent Liabilities | 9 | 821 | 773 | |||||
| Total Liabilities | 12,271 | 8,592 | ||||||
| Commitments and Contingencies | 15 | |||||||
| Equity | ||||||||
| Tesoro Corporation Stockholder’s Equity | ||||||||
Common stock, par value $0.162/3; authorized 200,000,000 shares; 159,474,572 shares issued (158,457,663 in 2015) | 27 | 26 | ||||||
| Additional paid-in capital | 1,473 | 1,391 | ||||||
| Retained earnings | 6,437 | 5,954 | ||||||
| Treasury stock, 42,574,625 common shares (39,064,342 in 2015), at cost | (2,284 | ) | (2,009 | ) | ||||
| Accumulated other comprehensive loss, net of tax | (188 | ) | (149 | ) | ||||
| Total Tesoro Corporation Stockholders’ Equity | 5,465 | 5,213 | ||||||
| Noncontrolling Interest | 16 | 2,662 | 2,527 | |||||
| Total Equity | 8,127 | 7,740 | ||||||
| Total Liabilities and Equity | $ | 20,398 | $ | 16,332 | ||||
The accompanying notes are an integral part of these consolidated financial statements.
December 31, 2016 | 63 | ||
| FINANCIAL STATEMENTS |
TESORO CORPORATION
STATEMENTS OF CONSOLIDATED EQUITY
| Tesoro Corporation Stockholders’ Equity (In millions) | |||||||||||||||||||||||||||||||||
| Common Stock | Additional Paid-In Capital | Retained Earnings | Treasury Stock | Accumulated Other Comprehensive Loss | Non- controlling Interest | Total Equity | |||||||||||||||||||||||||||
| Shares | Amount | Shares | Amount | ||||||||||||||||||||||||||||||
| At December 31, 2013 | 154.7 | $ | 26 | $ | 1,186 | $ | 3,940 | (22.9 | ) | $ | (798 | ) | $ | (52 | ) | $ | 1,183 | $ | 5,485 | ||||||||||||||
| Net earnings | — | — | — | 843 | — | — | — | 45 | 888 | ||||||||||||||||||||||||
| Purchases of common stock | — | — | — | — | (8.4 | ) | (500 | ) | — | — | (500 | ) | |||||||||||||||||||||
| Additional noncontrolling interest from Rockies Natural Gas Business | — | — | — | — | — | — | — | 432 | 432 | ||||||||||||||||||||||||
| Net proceeds from issuance of Tesoro Logistics LP Common Units | — | — | (11 | ) | — | — | — | — | 960 | 949 | |||||||||||||||||||||||
| Shares issued for equity-based compensation awards, net of tax | 1.9 | — | 19 | — | (0.4 | ) | (22 | ) | — | — | (3 | ) | |||||||||||||||||||||
| Excess tax benefits from stock-based compensation arrangements | — | — | 20 | — | — | — | — | — | 20 | ||||||||||||||||||||||||
| Amortization of equity settled awards | — | — | 36 | — | — | — | — | 2 | 38 | ||||||||||||||||||||||||
| Dividend payments | — | — | — | (141 | ) | — | — | — | — | (141 | ) | ||||||||||||||||||||||
| Distributions to noncontrolling interest | — | — | — | — | — | — | — | (96 | ) | (96 | ) | ||||||||||||||||||||||
| Other comprehensive loss, net of tax | — | — | — | — | — | — | (97 | ) | — | (97 | ) | ||||||||||||||||||||||
| Other | — | — | 5 | — | — | — | — | (4 | ) | 1 | |||||||||||||||||||||||
| At December 31, 2014 | 156.6 | $ | 26 | $ | 1,255 | $ | 4,642 | (31.7 | ) | $ | (1,320 | ) | $ | (149 | ) | $ | 2,522 | $ | 6,976 | ||||||||||||||
| Net earnings | — | — | — | 1,540 | — | — | — | 150 | 1,690 | ||||||||||||||||||||||||
| Purchases of common stock | — | — | — | — | (6.9 | ) | (644 | ) | — | — | (644 | ) | |||||||||||||||||||||
| Net proceeds from issuance of Tesoro Logistics LP Common Units | — | — | (2 | ) | — | — | — | — | 101 | 99 | |||||||||||||||||||||||
| Transfers to (from) noncontrolling interest, net of tax | — | — | 47 | — | — | — | — | (70 | ) | (23 | ) | ||||||||||||||||||||||
| Shares issued for equity-based compensation awards, net of tax | 1.8 | — | 12 | — | (0.5 | ) | (45 | ) | — | — | (33 | ) | |||||||||||||||||||||
| Excess tax benefits from stock-based compensation arrangements | — | — | 37 | — | — | — | — | — | 37 | ||||||||||||||||||||||||
| Amortization of equity settled awards | — | — | 42 | — | — | — | — | 4 | 46 | ||||||||||||||||||||||||
| Dividend payments | — | — | — | (228 | ) | — | — | — | — | (228 | ) | ||||||||||||||||||||||
| Distributions to noncontrolling interest | — | — | — | — | — | — | — | (182 | ) | (182 | ) | ||||||||||||||||||||||
| Other | — | — | — | — | — | — | — | 2 | 2 | ||||||||||||||||||||||||
| At December 31, 2015 | 158.4 | $ | 26 | $ | 1,391 | $ | 5,954 | (39.1 | ) | $ | (2,009 | ) | $ | (149 | ) | $ | 2,527 | $ | 7,740 | ||||||||||||||
| Net earnings | — | — | — | 734 | — | — | — | 126 | 860 | ||||||||||||||||||||||||
| Purchases of common stock | — | — | — | — | (3.2 | ) | (250 | ) | — | — | (250 | ) | |||||||||||||||||||||
| Shares issued for equity-based compensation awards, net of tax | 1.1 | 1 | 1 | — | (0.3 | ) | (25 | ) | — | — | (23 | ) | |||||||||||||||||||||
| Net proceeds from issuance of Tesoro Logistics LP Common Units | — | — | (2 | ) | — | — | — | — | 366 | 364 | |||||||||||||||||||||||
| Amortization of equity settled awards | — | — | 43 | — | — | — | — | 5 | 48 | ||||||||||||||||||||||||
| Transfers to (from) noncontrolling interest, net of tax | — | — | 41 | — | — | — | — | (69 | ) | (28 | ) | ||||||||||||||||||||||
| Dividend payments | — | — | — | (249 | ) | — | — | — | — | (249 | ) | ||||||||||||||||||||||
| Distributions to noncontrolling interest | — | — | — | — | — | — | — | (216 | ) | (216 | ) | ||||||||||||||||||||||
| Other comprehensive loss, net of tax | — | — | — | — | — | — | (39 | ) | — | (39 | ) | ||||||||||||||||||||||
| Deconsolidation of RGS | — | — | — | — | — | — | — | (84 | ) | (84 | ) | ||||||||||||||||||||||
| Consolidation of Vancouver Energy | — | — | — | — | — | — | — | 8 | 8 | ||||||||||||||||||||||||
| Other | — | — | (1 | ) | (2 | ) | — | — | — | (1 | ) | (4 | ) | ||||||||||||||||||||
| At December 31, 2016 | 159.5 | $ | 27 | $ | 1,473 | $ | 6,437 | (42.6 | ) | $ | (2,284 | ) | $ | (188 | ) | $ | 2,662 | $ | 8,127 | ||||||||||||||
The accompanying notes are an integral part of these consolidated financial statements.
64 | Tesoro Corporation | ||
| FINANCIAL STATEMENTS |
TESORO CORPORATION
STATEMENTS OF CONSOLIDATED CASH FLOWS
| Years Ended December 31, | |||||||||||
| 2016 | 2015 | 2014 | |||||||||
| (In millions) | |||||||||||
| Cash Flows From (Used In) Operating Activities | |||||||||||
| Net earnings | $ | 860 | $ | 1,690 | $ | 888 | |||||
| Adjustments to reconcile net earnings to net cash from operating activities: | |||||||||||
| Depreciation and amortization expense | 851 | 756 | 562 | ||||||||
| Lower of cost or market inventory valuation adjustment | (359 | ) | 317 | 42 | |||||||
| Amortization of debt issuance costs and discounts | 17 | 16 | 15 | ||||||||
| Debt redemption charges | 9 | 1 | 41 | ||||||||
| (Gain) loss related to Hawaii Business | (17 | ) | 6 | 42 | |||||||
| Loss on asset disposals and impairments | 9 | 42 | 4 | ||||||||
| Stock-based compensation expense | 35 | 75 | 55 | ||||||||
| Deferred income taxes | 203 | 65 | 246 | ||||||||
| Excess tax benefits from stock-based compensation arrangements | — | (38 | ) | (20 | ) | ||||||
| Turnaround and branding charges | (388 | ) | (342 | ) | (256 | ) | |||||
| Other non-cash operating activity | 16 | 12 | 45 | ||||||||
| Changes in current assets and current liabilities: | |||||||||||
| Receivables | (259 | ) | 638 | 10 | |||||||
| Inventories | 40 | (179 | ) | 107 | |||||||
| Prepayments and other | (91 | ) | (77 | ) | (47 | ) | |||||
| Accounts payable and other current liabilities | 427 | (863 | ) | (298 | ) | ||||||
| Changes in noncurrent assets and noncurrent liabilities | (49 | ) | 12 | (72 | ) | ||||||
| Net cash from operating activities | 1,304 | 2,131 | 1,364 | ||||||||
| Cash Flows From (Used In) Investing Activities | |||||||||||
| Capital expenditures | (894 | ) | (1,030 | ) | (685 | ) | |||||
| Acquisitions, net of cash | (413 | ) | (97 | ) | (2,496 | ) | |||||
| Deposits for acquisitions | (33 | ) | — | — | |||||||
| Proceeds from asset sales | 25 | — | 18 | ||||||||
| Other investing activities | (2 | ) | (2 | ) | (9 | ) | |||||
| Net cash used in investing activities | (1,317 | ) | (1,129 | ) | (3,172 | ) | |||||
| Cash Flows From (Used In) Financing Activities | |||||||||||
| Borrowings under revolving credit agreements | 1,451 | 476 | 646 | ||||||||
| Repayments on revolving credit agreements | (1,426 | ) | (431 | ) | (386 | ) | |||||
| Borrowings under term loan credit agreement | — | 250 | — | ||||||||
| Proceeds from debt offerings | 3,051 | — | 1,600 | ||||||||
| Repayments of debt | (260 | ) | (404 | ) | (434 | ) | |||||
| Dividend payments | (249 | ) | (228 | ) | (141 | ) | |||||
| Proceeds from stock options exercised | 2 | 13 | 19 | ||||||||
| Net proceeds from issuance of Tesoro Logistics LP common units | 364 | 99 | 949 | ||||||||
| Distributions to noncontrolling interest | (216 | ) | (182 | ) | (96 | ) | |||||
| Purchases of common stock | (250 | ) | (644 | ) | (500 | ) | |||||
| Taxes paid related to net share settlement of equity awards | (25 | ) | (45 | ) | (22 | ) | |||||
| Payments of debt issuance costs | (37 | ) | (2 | ) | (24 | ) | |||||
| Excess tax benefits from stock-based compensation arrangements | — | 38 | 20 | ||||||||
| Other financing activities | (39 | ) | — | (61 | ) | ||||||
| Net cash from (used in) financing activities | 2,366 | (1,060 | ) | 1,570 | |||||||
| Increase (Decrease) in Cash and Cash Equivalents | 2,353 | (58 | ) | (238 | ) | ||||||
| Cash and Cash Equivalents, Beginning of Year | 942 | 1,000 | 1,238 | ||||||||
| Cash and Cash Equivalents, End of Year | $ | 3,295 | $ | 942 | $ | 1,000 | |||||
The accompanying notes are an integral part of these consolidated financial statements.
December 31, 2016 | 65 | ||
| NOTES TO CONSOLIDATED FINANCIAL STATEMENTS | ||
NOTE 1 – DESCRIPTION OF BUSINESS AND SUMMARY OF SIGNIFICANT ACCOUNTING POLICIES
DESCRIPTION AND NATURE OF BUSINESS
As used in this report, the terms “Tesoro,” the “Company,” “we,” “us” or “our” may refer to Tesoro Corporation, one or more of its consolidated subsidiaries or all of them taken as a whole. The words “we,” “us” or “our” generally include Tesoro Logistics LP (“TLLP”) and its subsidiaries as consolidated subsidiaries of Tesoro Corporation with certain exceptions where there are transactions or obligations between TLLP and Tesoro Corporation or its other subsidiaries. When used in descriptions of agreements and transactions, “TLLP” or the “Partnership” refers to TLLP and its consolidated subsidiaries.
Tesoro was incorporated in Delaware in 1968. Based in San Antonio, Texas, we are one of the largest independent petroleum refining and marketing companies in the United States. Our subsidiaries, operating through three business segments, primarily transport crude oil and manufacture, transport and sell transportation fuels. Our refining operating segment (“Refining”), which owns and operates seven refineries in the western United States, refines crude oil and other feedstocks into transportation fuels, such as gasoline and gasoline blendstocks, jet fuel and diesel fuel, as well as other products, including heavy fuel oils, liquefied petroleum gas and petroleum coke for sale in bulk markets to a wide variety of customers within our markets. Our refineries have a combined crude oil capacity of approximately 895 Mbpd. Our logistics operating segment, which is comprised of TLLP’s assets and operations, includes certain crude oil and natural gas gathering assets, natural gas and NGLs processing assets, and crude oil and refined products terminalling, transportation and storage assets acquired from Tesoro and third parties. The TLLP financial and operational data presented include the historical results of all assets acquired from Tesoro prior to the dates they were acquired by TLLP. The historical results of operations of these assets have been retrospectively adjusted to conform to the current presentation. Our marketing operating segment (“Marketing”) sells transportation fuels in 16 states through a network of 2,492 retail stations under the ARCO®, Shell®, Exxon®, Mobil®, USA GasolineTM, RebelTM, ThriftyTM and Tesoro® brands. Our unbranded, or wholesale, business includes volumes sold through agreements with third-party dealers.
Our earnings, cash flows from operations and liquidity depend upon many factors, including producing and selling refined products at margins above fixed and variable expenses. The prices of crude oil and refined products fluctuate substantially and our financial results are significantly influenced by the timing of changes in crude oil costs and how quickly refined product prices adjust to reflect these changes. These price fluctuations depend on numerous factors beyond our control, including the global supply and demand for crude oil and refined products, which are subject to factors including changes in the global economy, the level of foreign and domestic production of crude oil and refined products, geo-political conditions, availability of crude oil and refined product imports, the infrastructure to transport crude oil and refined products, weather conditions, earthquakes and other natural disasters, seasonal variations, government regulations, threatened or actual terrorist incidents or acts of war, and local factors, including market conditions and the level of operations of other suppliers in our markets. Margin fluctuations resulting from these factors have a significant impact on our results of operations, cash flows, liquidity and financial position.
PRINCIPLES OF CONSOLIDATION AND BASIS OF PRESENTATION
The accompanying consolidated financial statements include the accounts of Tesoro and its subsidiaries. All intercompany accounts and transactions have been eliminated. We have evaluated subsequent events through the filing of this Form 10-K. Any material subsequent events that occurred during this time have been properly recognized or disclosed in our financial statements.
Certain reclassifications have been made to prior period presentations to conform to the current year. In the first quarter of 2016, we revised the process by which we reclassify certain logistics costs, primarily recognized by TLLP, during consolidation from operating expenses and selling, general and administrative expense to costs of sales. This better reflects the distribution costs related to Tesoro’s sale of refined products during the ordinary course of business. This change in process did not impact current or prior segment operating results. However, we reclassified $221 million and $28 million from costs of sales and recognized $177 million and $24 million in operating expenses and $44 million and $4 million in selling, general and administrative expenses of the condensed statement of consolidated operations for the years ended December 31, 2015 and 2014, respectively, to conform to current period presentation.
Our consolidated financial statements include TLLP, a variable interest entity. Tesoro Logistics GP, LLC (“TLGP”), Tesoro’s fully consolidated subsidiary, serves as TLLP’s general partner. As the general partner of TLLP, we have the sole ability to direct the activities of TLLP that most significantly impact its economic performance. We are also considered to be the primary beneficiary
66 | Tesoro Corporation | ||
| NOTES TO CONSOLIDATED FINANCIAL STATEMENTS | |
for accounting purposes and are TLLP’s primary customer. Under our long-term transportation agreements with TLLP (discussed further below), transactions with us accounted for 59%, 55% and 83% of TLLP’s total revenues for the years ended December 31, 2016, 2015 and 2014, respectively. In the event TLLP incurs a loss, our operating results will reflect TLLP’s loss, net of intercompany eliminations, to the extent of our ownership interest in TLLP. All intercompany transactions with TLLP are eliminated upon consolidation.
USE OF ESTIMATES
We prepare our consolidated financial statements in conformity with accounting principles generally accepted in the United States of America (“U.S. GAAP”), which requires management to make estimates and assumptions that affect the reported amounts and disclosures of assets and liabilities at the date of the financial statements and the reported amounts of revenues and expenses during the year. We review our estimates on an ongoing basis, based on currently available information. Changes in facts and circumstances may result in revised estimates and actual results could differ from those estimates.
CASH AND CASH EQUIVALENTS
Cash and cash equivalents include bank deposits and low-risk short-term investments with original maturities of three months or less at the time of purchase. Cash equivalents are stated at cost, which approximates market value. We place our cash deposits and temporary cash investments with high credit quality financial institutions. Our cash and cash equivalents may be uninsured or in deposit accounts that exceed the Federal Deposit Insurance Corporation insurance limit. Approximately $1.8 billion of our cash and cash equivalents are held in money market funds and are valued at the net asset value (“NAV”) of the fund as determined by the fund manager, using fixed and floating NAVs as a practical expedient. These money market funds are invested in high quality, short-term securities, including obligations issued or guaranteed by the U.S. government or its agencies, floating and variable rate demand notes of U.S. and foreign corporations and other short-term obligations with minimal volatility in principal. Currently, there are no redemption notice requirements or penalties, however, the funds may impose a fee upon the sale of the investment or may temporarily suspend our ability to sell shares if the liquidity falls below required minimums because of market conditions or other factors.
RECEIVABLES
Our receivables primarily consist of customer accounts receivable. Open credit is extended based on an ongoing evaluation of our customers’ financial condition and other factors. In certain circumstances, we may require prepayments, letters of credit, guarantees, or other forms of collateral. Credit risk with respect to trade receivables is mitigated by the large number of customers comprising our customer base and their dispersion across various industries and geographic areas of operations. Our allowance for doubtful accounts is based on numerous factors including current sales amounts, historical charge-offs and specific accounts identified as high risk. After reasonable efforts to collect the amounts have been exhausted, balances are deemed uncollectible and are charged against the allowance for doubtful accounts. Write-offs were immaterial in 2016, 2015 and 2014. The Company does not have any off-balance-sheet credit exposure related to its customers.
INVENTORIES
Inventories are stated at the lower of cost or market. We use the last-in, first-out method to determine the cost of petroleum commodities, oxygenates and by-products held by our U.S. subsidiaries. We determine the carrying value of inventories of crude oil held by our foreign subsidiaries using the first-in, first-out cost method. We value merchandise along with materials and supplies at average cost.
PROPERTY, PLANT AND EQUIPMENT
We capitalize the cost of additions, major improvements and modifications to property, plant and equipment (“Property Assets”). The cost of repairs to, and normal maintenance of, Property Assets is expensed as incurred. Major improvements and modifications of Property Assets are those expenditures that extend the useful life, increase the capacity or improve the operating efficiency of the asset, or improve the safety of our operations. The cost of Property Assets constructed includes interest and certain overhead costs allocable to the construction activities. Capitalized interest totaled $31 million, $36 million and $25 million during 2016, 2015 and 2014, respectively, and is recorded as a reduction to net interest and financing costs in our statements of consolidated operations.
December 31, 2016 | 67 | ||
| NOTES TO CONSOLIDATED FINANCIAL STATEMENTS | ||
We compute depreciation of Property Assets using the straight-line method, based on the estimated useful life and salvage value of each asset. The useful lives range from 3 to 28 years for Refining segment assets, 3 to 28 years for TLLP segment assets, 3 to 16 years for Marketing segment assets, and 3 to 25 years for corporate assets. We record Property Assets under capital leases at the lower of the present value of minimum lease payments using our incremental borrowing rate or the fair value of the leased property at the date of lease inception. We depreciate leasehold improvements and Property Assets acquired under capital leases over the lesser of the lease term or the economic life of the asset. Depreciation expense totaled $537 million, $491 million and $363 million for 2016, 2015 and 2014, respectively.
ASSET RETIREMENT OBLIGATIONS. We record asset retirement obligations (“AROs”) at fair value in the period in which we have a legal obligation to incur costs, whether by government action or contractual arrangement, to retire a tangible asset and can make a reasonable estimate of the fair value of the liability. AROs are calculated based on the present value of the estimated removal and other closure costs using our credit-adjusted risk-free rate given an estimated settlement date for the obligation. We estimate settlement dates by considering our past practice, industry practice, management’s intent and estimated economic lives. We cannot currently estimate the fair value for certain potential AROs primarily because we cannot estimate settlement dates (or range of dates) associated with these assets. These AROs include, but are not limited to, the disposal of hazardous materials used in our production processes and the removal or dismantlement of refining and terminal facilities, pipelines and other buildings. We have not historically incurred significant AROs for hazardous materials disposal or other removal costs associated with asset retirements or replacements during scheduled maintenance projects. This precludes development of assumptions about the potential timing of settlement dates based on there being no plans to retire or dispose of the assets, our plans to extend the assets’ economic lives through scheduled maintenance and updating for technological advances, our history of rarely retiring similar assets in the past and industry practices for similar assets. As of December 31, 2016 and 2015, we had $26 million and $30 million recorded for AROs, respectively. No material changes in AROs occurred in 2016. During 2015, as a result of our finalization of the purchase price allocation of TLLP’s Rockies Natural Gas Business Acquisition, we determined that majority of the AROs initially recognized were not estimable resulting in a $29 million reduction to our liability for AROs.
ACQUIRED INTANGIBLES AND GOODWILL
Acquired intangibles are recorded at fair value as of the date acquired and consist primarily of customer relationships, air emission credits, refinery permits, trade names and plans and a master franchise license for the ampm® convenience store brand (“ampm® License”). We amortize acquired intangibles with finite lives on a straight-line basis over estimated useful lives of 1 to 35 years, and we include the amortization of acquired intangibles in depreciation and amortization expense in our statements of consolidated operations. Our indefinite-lived intangible assets consist of the ARCO® brand and associated registered trademarks for certain of our retail stations as well as perpetual emission credits. See Note 7 for further information on our amortization expense for acquired intangibles.
Goodwill represents the amount the purchase price exceeds the fair value of net assets acquired in a business combination. We do not amortize goodwill or indefinite-lived intangible assets. We are required, however, to review goodwill and indefinite-lived intangible assets for impairment annually, or more frequently if events or changes in business circumstances indicate the book value of the assets may not be recoverable. In such circumstances, we record the impairment in loss on asset disposals and impairments in our statements of consolidated operations. We review the recorded value of goodwill for impairment on November 1st of each year, or sooner if events or changes in circumstances indicate the carrying amount may exceed fair value using qualitative and/or quantitative assessments at the reporting level. Our review of goodwill is discussed further in Note 7.
IMPAIRMENT OF LONG-LIVED ASSETS
We review Property Assets and other long-lived assets, including acquired intangible assets with finite lives, for impairment whenever events or changes in business circumstances indicate the net book values of the assets may not be recoverable. Impairment is indicated when the undiscounted cash flows estimated to be generated by those assets are less than the assets’ net book value. If this occurs, an impairment loss is recognized for the difference between the fair value and net book value. Factors that indicate potential impairment include: a significant decrease in the market value of the asset, operating or cash flow losses associated with the use of the asset and a significant change in the asset’s physical condition or use.
68 | Tesoro Corporation | ||
| NOTES TO CONSOLIDATED FINANCIAL STATEMENTS | |
INVESTMENTS - EQUITY METHOD AND JOINT VENTURES
For equity investments that are not required to be consolidated under the variable interest model, we evaluate the level of influence we are able to exercise over an entity’s operations to determine whether to use the equity method of accounting. Our judgment regarding the level of control over an equity method investment includes considering key factors such as our ownership interest, participation in policy-making and other significant decisions and material intercompany transactions. Amounts recognized for equity method investments are included in other noncurrent assets in our consolidated balance sheets and adjusted for our share of the net earnings or losses of the investee, which are presented separately in our statements of consolidated operations, capital contributions made and cash dividends received. We evaluate our equity method investments for impairment whenever events or changes in circumstances indicate that the carrying amounts of such investments may be impaired. An impairment loss is recorded in earnings in the current period to write down the carrying value of the investment to fair value if a decline in the value of an equity method investment is determined to be other than temporary. There were no impairments of our equity method investments during the years ended December 31, 2016, 2015 and 2014.
OTHER NONCURRENT ASSETS
We defer turnaround costs and the costs of certain catalysts (“Deferred Charges”) used in the refinery processing units that have a benefit period that exceeds one year and amortize these costs on a straight-line basis over the expected periods of benefit, normally ranging from 2 to 10 years. Deferred Charges are amortized over the period of time until the next planned turnaround of the processing unit. Amortization for Deferred Charges, which is included in depreciation and amortization expense in our statements of consolidated operations, amounted to $251 million, $222 million and $182 million in 2016, 2015 and 2014, respectively.
ENVIRONMENTAL CREDITS AND ENVIRONMENTAL CREDIT OBLIGATIONS
We are subject to extensive and frequently changing federal, state, regional and local laws, regulations and ordinances relating to the environment, including those governing emissions or discharges to land, air and water, the handling and disposal of solid and hazardous wastes and the remediation of contamination. In order to comply with certain of these regulations and ordinances, we are required to reduce our emissions or blend certain levels of biofuels. Otherwise, we are required to obtain allowances or credits (“environmental credits”) to offset the obligations created by our operations. Specific to the renewable identification numbers (“RINs”) required to comply with the second renewable fuels standard (“RFS2”) implemented by the U.S. Environmental Protection Agency (“EPA”) along with allowances and credits needed to comply with the cap-and-trade emission reduction program and low carbon fuel standard implemented by the state of California, we account for environmental credits using an inventory method of accounting. Environmental credits are recorded on our consolidated balance sheet at weighted average cost and expensed as cost of sales as they are used to offset obligations incurred by our operations. In determining the weighted average cost of environmental credits, we record environmental credits purchased from third parties at the price paid and environmental credits allocated to us by regulatory agencies or attached to commodities purchased for use in our operations at a cost of zero unless market data indicates an incremental price was paid for the acquisition of the environmental credit. Costs incurred to obtain allowances or credits necessary to comply with other federal, state or local regulations or ordinances are expensed as incurred. The amounts associated with these other regulations or ordinances are not material to our consolidated financial statements.
We record obligations associated with RFS2 and the California programs as obligations are incurred. Our liabilities for environmental credit obligations is comprised of the weighted average cost of credits we hold but are required to be remitted for satisfaction of the obligation generated by our operations plus amounts recognized at fair value for any deficiency in environmental credits held compared to our obligation. Refer to Note 11 for amounts recognized at fair value for environmental credit obligations.
DERIVATIVE INSTRUMENTS
We use non-trading derivative instruments to manage exposure to commodity price risks associated with the purchase or sale of feedstocks, refined products and energy supplies to or from our refineries, terminals, marketing operations and customers. We also use non-trading derivative instruments to manage price risks associated with inventories above or below our target levels. These derivative instruments typically involve physical commodity forward purchase and sale contracts (“Forward Contracts”), exchange-traded futures (“Futures Contracts”), over-the-counter swaps, including those cleared on an exchange (“Swap Contracts”), options (“Options”) and over-the-counter options (“OTC Option Contracts”), most of which had remaining
December 31, 2016 | 69 | ||
| NOTES TO CONSOLIDATED FINANCIAL STATEMENTS | ||
durations of less than one year as of December 31, 2016. Our positions are monitored daily by our trading controls group to ensure compliance with our risk management policies.
We mark-to-market our derivative instruments and recognize the changes in their fair values, realized or unrealized, in either revenues or cost of sales in our statements of consolidated operations, depending on the purpose for acquiring and holding the derivatives. All derivatives are recorded and carried at fair value in receivables, other current assets or accounts payable in our consolidated balance sheets. Margin deposits represent cash collateral paid between our counterparties and us to support our commodity contracts. We net our asset and liability positions associated with multiple derivative instruments that are executed with the same counterparty under master netting arrangements.
FINANCIAL INSTRUMENTS
The carrying value of certain of our financial instruments, including cash and cash equivalents, receivables, accounts payable and certain accrued liabilities approximate fair value primarily because of the short-term maturities of these instruments. The borrowings under the Tesoro Corporation revolving credit facility (our “Revolving Credit Facility”), the TLLP Revolving Credit Facility (the “TLLP Revolving Credit Facility”), and TLLP’s drop down credit facility agreement (the “TLLP Dropdown Facility”), which include variable interest rates, approximate fair value. We estimate the fair value for our fixed rate debt primarily using prices from recent trade activity.
INCOME TAXES
We record deferred tax assets and liabilities for future income tax consequences that are attributable to differences between the financial statement carrying amounts of assets and liabilities and their income tax bases. We base the measurement of deferred tax assets and liabilities on enacted tax rates that we expect will apply to taxable income in the year we expect to settle or recover those temporary differences. We recognize the effect on deferred tax assets and liabilities of any change in income tax rates in the period that includes the enactment date. We provide a valuation allowance for deferred tax assets if it is more likely than not that those items will either expire before we are able to realize their benefit or their future deductibility is uncertain. We recognize the financial statement effects of a tax position when it is more likely than not that the position will be sustained upon examination.
We use the flow-through method to account for state investment tax credits earned on eligible capital expenditures. Under this method, the investment tax credits are recognized as a reduction to income tax expense in the year they are earned, except to the extent there is a continuing obligation.
PENSION AND OTHER POSTRETIREMENT BENEFITS
We recognize separately the overfunded or underfunded status of our pension and other postretirement plans as an asset or liability. A change in the funded status of our defined benefit retirement plan is recognized in other comprehensive income in the period the change occurs. The funded status represents the difference between the projected benefit obligation and the fair value of the plan assets. The projected benefit obligation is the present value of benefits earned to date by plan participants, including the effect of assumed future salary increases. Plan assets are measured at fair value. We use a December 31st measurement date for plan assets and obligations for all of our plans.
CONTINGENCIES
ENVIRONMENTAL MATTERS. We are subject to extensive federal, state and local environmental laws and regulations. These laws, which change frequently, regulate the discharge of materials into the environment and may require us to remove or mitigate the environmental effects of the disposal or release of petroleum or chemical substances at various sites, install additional controls or make other modifications to certain emission sources, equipment or facilities.
We capitalize environmental expenditures that extend the life or increase the capacity of facilities as well as expenditures that prevent environmental contamination. We expense costs that relate to an existing condition caused by past operations and that do not contribute to current or future revenue generation. We record liabilities when environmental assessments and/or remedial efforts are probable and can be reasonably estimated. Cost estimates are based on the expected timing and extent of remedial actions required by governing agencies, experience gained from similar sites for which environmental assessments or remediation have been completed and the amount of our anticipated liability considering the proportional liability and financial
70 | Tesoro Corporation | ||
| NOTES TO CONSOLIDATED FINANCIAL STATEMENTS | |
abilities of other responsible parties. Usually, the timing of these accruals coincides with the completion of a feasibility or engineering study and or our commitment to a formal plan of action where a range of costs can be reliably estimated and supported. Estimated liabilities are not discounted to present value and environmental expenses are recorded primarily in operating expenses in our statements of consolidated operations.
LEGAL MATTERS. In the ordinary course of business, we become party to lawsuits, administrative proceedings and governmental investigations. These matters may involve large or unspecified damages or penalties that may be sought from us and may require years to resolve. We record a liability related to a loss contingency attributable to such legal matters in accrued liabilities or other noncurrent liabilities on our consolidated balance sheet, depending on the classification as current or noncurrent if we determine the loss to be both probable and estimable. The liability is recorded for an amount that is management’s best estimate of the loss, or when a best estimate cannot be made, the minimum loss amount of a range of possible outcomes.
ACQUISITIONS
We use the acquisition method of accounting for the recognition of assets acquired and liabilities assumed with acquisitions at their estimated fair values as of the date of acquisition. Any excess consideration transferred over the estimated fair values of the identifiable net assets acquired is recorded as goodwill. While we use our best estimates and assumptions to measure the fair value of the identifiable assets acquired and liabilities assumed at the acquisition date, our estimates are inherently uncertain and subject to refinement. As a result, during the measurement period, not to exceed one year from the date of acquisition, any changes in the estimated fair values of the net assets recorded for the acquisitions will result in an adjustment to goodwill. Upon the conclusion of the measurement period or final determination of the values of assets acquired or liabilities assumed, whichever comes first, any subsequent adjustments are recorded to our statements of consolidated operations.
REVENUE RECOGNITION
We recognize revenues upon delivery of goods or services to a customer. For goods, this is the point at which title is transferred and when payment has either been received or collection is reasonably assured. Revenues for services are recorded when the services have been provided. We record certain transactions in cost of sales in our statements of consolidated operations on a net basis. These transactions include nonmonetary crude oil and refined product exchange transactions used to optimize our refinery supply, and sale and purchase transactions entered into with the same counterparty that are deemed to be in contemplation with one another. We include transportation and processing fees charged to customers in revenues in our statements of consolidated operations, while the related costs are included in cost of sales.
Federal excise and state motor fuel taxes, which are remitted to governmental agencies through our refining segment and collected from customers in our marketing segment, are included in both revenues and cost of sales in our statements of consolidated operations. These taxes were primarily related to sales of gasoline and diesel fuel from continuing operations and totaled $577 million, $561 million and $581 million in 2016, 2015 and 2014, respectively.
STOCK-BASED COMPENSATION
Our stock-based compensation includes stock appreciation rights (“SARs”), performance share awards, market stock units, stock options, restricted common stock, restricted stock units, and phantom stock options. The grant date fair value of performance share awards based on performance conditions, restricted common stock awards and restricted stock units are equal to the market price of our common stock on the date of grant. The fair values of market stock units and stock options are estimated using the Monte Carlo simulation and the Black-Scholes option-pricing model, respectively, on the date of grant. The fair values of our SARs, phantom stock options and certain performance share awards based on market conditions are remeasured at the end of each reporting period. SARs and phantom stock options are recorded in other current liabilities in our statement of financial position. We primarily amortize the fair value of our stock-based awards using the straight-line method over the vesting period. Our stock-based compensation expense includes estimates for forfeitures and volatility based on our historical experience. If actual forfeitures differ from our estimates, we adjust stock-based compensation expense accordingly. Expenses related to stock-based compensation are included in selling, general and administrative expenses in our statements of consolidated operations.
December 31, 2016 | 71 | ||
| NOTES TO CONSOLIDATED FINANCIAL STATEMENTS | ||
EARNINGS PER SHARE
We compute basic earnings per share by dividing net earnings attributable to Tesoro Corporation stockholders by the weighted average number of common shares outstanding during the period. Diluted earnings per share include the effects of potentially dilutive shares, principally consisting of common stock options and unvested restricted stock, restricted stock units, market stock units and performance share awards outstanding during the period. Additionally, for the diluted earnings per share computation, net earnings attributable to Tesoro Corporation is reduced, where applicable, for the decrease in earnings from Tesoro’s limited partner unit ownership in TLLP that would have resulted assuming the incremental units related to TLLP’s equity incentive plans had been issued during the respective periods.
NEW ACCOUNTING STANDARDS AND DISCLOSURES
REVENUE RECOGNITION. In May 2014, the Financial Accounting Standards Board (“FASB”) issued Accounting Standards Update (“ASU”) 2014-09, “Revenue from Contracts with Customers” (“ASU 2014-09”) and has since amended the standard with ASU 2015-14, “Revenue from Contracts with Customers: Deferral of the Effective Date”, ASU 2016-08, “Revenue from Contracts with Customers: Principal versus Agent Considerations (Reporting Revenue Gross versus Net)”, ASU 2016-10, “Revenue from Contracts with Customers: Identifying Performance Obligations and Licensing”, and ASU 2016-12, “Revenue from Contracts with Customers: Narrow-Scope Improvements and Practical Expedients”. These standards replace existing revenue recognition rules with a single comprehensive model to use in accounting for revenue arising from contracts with customers. We are required to adopt ASU 2014-09 on January 1, 2018.
We have been and continue to evaluate the impact of the standard’s revenue recognition model on our contracts with customers in the refining, marketing and TLLP segments. While we have made substantial progress in our review and documentation of the impact of the standard on our revenue agreements, we continue to assess the impact in certain other areas where industry consensus continues to be formed such as agreements with terms that include non-cash consideration and tiered pricing structures. At this time, we are unable to estimate the full impact of the standard until the industry reaches a consensus on certain industry specific issues, especially in relation to the TLLP segment. However, we do not expect the standard to have a material impact to the amount or timing of revenues recognized for the vast majority of our revenue arrangements in the Refining and Marketing segments.
We are currently in early stages of our implementation plan and are evaluating the impact of the standard on our business processes, accounting systems, controls and financial statement disclosures. We preliminarily expect to transition to the new standard under the modified retrospective transition method, whereby a cumulative effect adjustment is recognized upon adoption and the guidance is applied prospectively.
CONSOLIDATION. In February 2015, the FASB issued ASU 2015-02 “Amendments to the Consolidation Analysis” (“ASU 2015-02”). This standard modifies existing consolidation guidance for reporting organizations that are required to evaluate whether they should consolidate certain legal entities. ASU 2015-02 is effective for interim and annual periods beginning after December 15, 2015, and requires either a retrospective or a modified retrospective approach to adoption. We adopted this guidance using the modified retrospective approach as of January 1, 2016 and performed the required reassessments outlined by the guidance. For further information on the results of the reassessments, refer to Note 8, Investments - Equity Method and Joint Ventures.
BUSINESS COMBINATION. In September 2015, the FASB issued ASU 2015-16, “Simplifying the Accounting for Measurement-Period Adjustments” (“ASU 2015-16”). The standard requires an acquirer to recognize the cumulative impact of adjustments to provisional purchase price amounts that are identified during the measurement period in the reporting period, in which the adjustment amounts are determined. The standard also requires an entity to present separately on the face of the income statement or disclose in the notes the portion of the amount recorded in current-period earnings by line item that would have been recorded in previous reporting periods if the adjustment to the provision amounts had been recognized as of the acquisition date. ASU 2015-16 is effective for the interim and annual periods beginning after December 15, 2015, and must be applied prospectively to adjustments that occur after the effective date. Early application is permitted for financial statements that have not been issued. We adopted this guidance as of January 1, 2016 with no impact to our financial statements.
72 | Tesoro Corporation | ||
| NOTES TO CONSOLIDATED FINANCIAL STATEMENTS | |
LEASES. In February 2016, the FASB issued ASU 2016-02, “Leases” (“ASU 2016-02”), which amends existing accounting standards for lease accounting and adds additional disclosures about leasing arrangements. Under the new guidance, lessees are required to recognize lease assets and lease liabilities on the balance sheet for all leases with terms longer than 12 months. Leases will be classified as either finance or operating, with classification affecting the pattern of expense recognition in the income statement and presentation of cash flow in the statement of cash flows. ASU 2016-02 is effective for annual reporting periods beginning after December 15, 2018, and interim reporting periods within those annual reporting periods. Early adoption is permitted and modified retrospective application is required. We are still evaluating the impact of ASU 2016-02 on our financial statements.
SHARE-BASED COMPENSATION. In March 2016, the FASB issued ASU 2016-09, “Improvements to Employee Share-Based Payment Accounting” (“ASU 2016-09”), which simplifies several aspects of the accounting for employee share-based payment transactions including accounting for income taxes, cash flow presentation of tax impacts, forfeitures, and liability versus equity accounting due to statutory tax withholding requirements. ASU 2016-09 is effective for interim and annual periods beginning after December 15, 2016, with early adoption permitted. As of January 1, 2016, we early adopted ASU 2016-09 on a prospective basis and with respect to the guidance on forfeitures, we have elected to continue to estimate forfeitures on the date of grant to account for the estimated number of awards for which the requisite service period will not be rendered. The adoption of ASU 2016-09 had a $16 million impact for the year ended December 31, 2016, resulting in a lower effective tax rate and immaterial changes to our cash flow presentation.
CREDIT LOSSES. In June 2016, the FASB issued ASU 2016-13, “Measurement of Credit Losses on Financial Instruments” (“ASU 2016-13”), which amends guidance on the impairment of financial instruments. The ASU estimates credit losses based on expected losses, modifies the impairment model for available-for-sale debt securities and provides for a simplified accounting model for purchased financial assets with credit deterioration. ASU 2016-13 is effective for annual reporting periods beginning after December 15, 2019, and interim reporting periods within those annual reporting periods. Early adoption is permitted for annual reporting periods beginning after December 15, 2018. While we are still evaluating the impact of ASU 2016-13, we do not expect the adoption of this standard to have a material impact on our financial statements.
STATEMENT OF CASH FLOWS. In August 2016, the FASB issued ASU 2016-15, “Clarification of Certain Cash Receipts and Cash Payments” (“ASU 2016-15”), which eliminates the diversity in practice related to the classification of certain cash receipts and payments in the statement of cash flows, by adding or clarifying guidance on eight specific cash flow issues. ASU 2016-15 is effective for interim and annual reporting periods beginning after December 15, 2017, with early adoption permitted. The amendments in this update should be applied retrospectively to all periods presented, unless deemed impracticable, in which case, prospective application is permitted. We early adopted this standard retrospectively as of December 31, 2016, which did not have an impact on our financial statements.
DEFINITION OF A BUSINESS. In January 2017, the FASB issued ASU 2017-01, “Clarifying the Definition of a Business” (“ASU 2017-01”), which revises the definition of a business and assists in the evaluation of when a set of transferred assets and activities is a business. ASU 2017-01 is effective for interim and annual reporting periods beginning after December 15, 2017, and should be applied prospectively on or after the effective date. Early adoption is permitted under certain circumstances. At this time, we are evaluating the potential impact of this standard on our financial statements.
NOTE 2 – ACQUISITIONS
2016 ACQUISITIONS
Individually and on an aggregate basis, the following acquisitions were immaterial to our consolidated financial statements.
GREAT NORTHERN MIDSTREAM. On January 8, 2016, we closed the acquisition of Great Northern Midstream LLC (“Great Northern Midstream”), a crude oil logistics provider which owns and operates a crude oil pipeline and gathering system, along with transportation, storage and rail loading facilities in the Williston Basin of North Dakota. The acquisition includes a crude oil pipeline, a proprietary gathering system in the core of the Bakken, and a facility for rail loading and storage in Fryburg, North Dakota.
FLINT HILLS RESOURCES. On June 20, 2016, we closed the acquisition of Flint Hills Resources’ (“FHR”) wholesale marketing and logistics assets in Anchorage and Fairbanks, Alaska. This acquisition includes all FHR’s wholesale fuel marketing contracts in Alaska and an Anchorage terminal with storage capacity, a truck rack, and rail loading capability. In addition, the acquisition
December 31, 2016 | 73 | ||
| NOTES TO CONSOLIDATED FINANCIAL STATEMENTS | ||
includes a Fairbanks airport terminal that includes jet fuel storage and a truck rack, as well as a multi-year terminalling agreement at FHR’s North Pole terminal, which will provide efficient rail offload capabilities and provide access to Alaska’s interior. The terminalling and storage assets acquired were sold to TLLP during the third quarter of 2016.
DAKOTA PRAIRIE REFINING. On June 28, 2016, we acquired Dakota Prairie Refining, LLC, which owns a refinery near Dickinson, North Dakota, which we refer to as our Dickinson Refinery, with strategic access to advantaged Bakken crude oil and is located approximately 100 miles west of the Tesoro Mandan refinery. This acquired refinery produces ultra-low sulfur diesel, naphtha and atmospheric residuals. Tesoro plans to continue to market the ultra-low sulfur diesel to local customers and utilize the naphtha and atmospheric residuals in its integrated value chain system.
VIRENT. On September 28, 2016, we acquired Virent, Inc. (“Virent”), an innovative renewable fuels and chemicals company, to support Virent in bringing its biofuels technology to commercial scale. Virent's BioForming® technology can convert sugars and other biomass derived feedstocks into renewable gasoline blendstocks and aromatics, which are fully compatible with the nation's existing fuel infrastructure and current vehicle warranties. Virent's aromatics product can also be used for renewable chemicals, most notably paraxylene, a key component in polyester.
OTHER TRANSACTIONS
WESTERN REFINING. On November 16, 2016, Tesoro entered into an Agreement and Plan of Merger with Western Refining, Inc. (“Western Refining”) and Tesoro’s wholly-owned subsidiaries Tahoe Merger Sub 1, Inc. and Tahoe Merger Sub 2, LLC (the “Merger”). Under the terms of the agreement, Western Refining’s shareholders can elect to receive 0.4350 shares of Tesoro for each share of Western Refining stock they own, or $37.30 in cash per share of Western Refining stock. Elections to receive cash will be subject to proration to the extent they exceed approximately 10.8 million shares (or approximately $404 million in the aggregate). Stock elections will not be subject to proration. Completion of the Merger is expected in the first half of 2017, subject to certain customary mutual conditions and regulatory approval. See Note 12 for further information about additional financing the Company obtained in 2016 in anticipation of the Merger. The aggregate proceeds of the debt financing, together with the available cash of the Company, will be sufficient for the Company to pay the aggregate cash consideration, refinance certain indebtedness of Western Refining and its subsidiaries and pay all related fees and expenses payable in connection with the Merger.
NOTE 3 – TESORO LOGISTICS LP
TLLP is a publicly traded limited partnership that was formed to own, operate, develop and acquire logistics assets. Its assets are integral to the success of Tesoro’s refining and marketing operations and are used to gather crude oil and natural gas, process natural gas and distribute, transport and store crude oil and refined products. TLLP provides us with various pipeline transportation, trucking, terminal distribution, storage and petroleum-coke handling services under long-term, fee-based commercial agreements. Each of these agreements, with the exception of the storage and transportation services agreement, contain minimum volume commitments. We do not provide financial or equity support through any liquidity arrangements or financial guarantees to TLLP. At December 31, 2016, assets consisted of:
| • | crude oil and refined products terminals and storage facilities in the western and midwestern U.S. that are supplied by Tesoro-owned and third-party pipelines, trucks and barges; |
•crude oil, feedstock and refined product storage and marine terminals in California that load and unload vessels;
| • | pipelines, which transport products and crude oil from Tesoro’s refineries to nearby facilities in Salt Lake City and Los Angeles and a 50% fee interest in a pipeline that transports jet fuel from Tesoro’s Los Angeles refinery to the Los Angeles International Airport; |
| • | a regulated common carrier products pipeline running from Salt Lake City, Utah to Spokane, Washington and a jet fuel pipeline to the Salt Lake City International Airport; |
| • | a rail car unloading facility in Washington that receives crude oil transported on unit trains leased by Tesoro; |
| • | a petroleum coke handling and storage facility in Los Angeles that handles and stores petroleum coke from Tesoro’s Los Angeles refinery; and |
| • | a regulated common carrier refined products pipeline system connecting our Kenai refinery terminals to terminals in Anchorage, Alaska. |
TLGP, our wholly-owned subsidiary, serves as the general partner of TLLP. We held an approximate 34% interest in TLLP at December 31, 2016, including a 2% general partner interest and all the incentive distribution rights. This interest at December 31, 2016 includes 34,055,042 common units and 2,100,900 general partner units.
74 | Tesoro Corporation | ||
| NOTES TO CONSOLIDATED FINANCIAL STATEMENTS | |
2016 ACQUISITIONS
ALASKA STORAGE AND TERMINALLING ASSETS. Effective July 1, 2016, TLLP entered into an agreement to purchase certain terminalling and storage assets owned by Tesoro for total consideration of $444 million and was completed in two phases (“Alaska Storage and Terminalling Assets Acquisition”). On July 1, 2016, TLLP completed the acquisition of the first phase consisting of tankage, related equipment and ancillary facilities used for the operations at Tesoro’s Kenai refinery. The second phase was completed on September 16, 2016 and consisted of refined product terminals in Anchorage and Fairbanks. Consideration paid for the first phase was $266 million, comprised of approximately $240 million in cash, financed with borrowings under the TLLP Dropdown Credit Facility and TLLP’s issuance of equity to Tesoro with a fair value of $26 million. Consideration for the second phase was $178 million, comprised of approximately $160 million in cash, financed with borrowings under the TLLP Dropdown Credit Facility and TLLP issuing equity securities with a fair value of approximately $18 million.
NORTHERN CALIFORNIA TERMINALLING AND STORAGE ASSETS. Effective November 21, 2016, the Partnership acquired certain terminalling and storage assets owned by Tesoro (“Northern California Terminalling and Storage Assets Acquisition”) for total consideration of $400 million comprised of $360 million of cash financed with borrowings on TLLP’s Dropdown Credit Facility and $40 million of common and general partner units to Tesoro. The assets purchased consisted of tankage with crude oil, feedstock, and refined product storage capacity at Tesoro’s Martinez refinery along with a marine terminal capable of handling feedstock and refined product throughput.
2015 ACQUISITIONS
LA STORAGE AND HANDLING ASSETS. On November 12, 2015, TLLP purchased crude oil and refined product storage and pipeline assets in Los Angeles, California owned by Tesoro for a total consideration of $500 million (the “LA Storage and Handling Asset Acquisition”). Assets included in the transaction consisted of a crude oil, feedstock, and refined product storage tank facility and a 50% fee interest in a pipeline that transports jet fuel from Tesoro’s Los Angeles refinery to the Los Angeles International Airport. The acquisition price of $500 million included cash of approximately $250 million, funded in part from a TLLP unsecured term loan facility and the issuance of common and general partner units to Tesoro, valued at approximately $250 million.
2014 ACQUISITIONS
WEST COAST LOGISTICS ASSETS. During the year ended December 31, 2014, TLLP purchased certain terminalling and pipeline assets owned by Tesoro and two of our subsidiaries for total consideration of $270 million. On July 1, 2014, TLLP closed on the purchase of the first portion consisting of marketing terminals and a storage facility in exchange for consideration of $241 million, comprised of approximately $214 million in cash financed with borrowings under TLLP’s revolving credit facility, and the issuance of equity to us with a fair value of $27 million. On September 30, 2014, TLLP completed the second portion by acquiring Tesoro Alaska Pipeline Company LLC, which owns a refined products pipeline located in Alaska, for total cash consideration of $29 million, financed with borrowings under TLLP’s revolving credit facility.
ROCKIES NATURAL GAS BUSINESS. On December 2, 2014, the TLLP acquired all of the limited liability company interests of QEP Field Services, LLC (“QEPFS”) for an aggregate purchase price of approximately $2.5 billion, which includes environmental obligations, existing legal obligations and $230 million QEP Midstream Partners, LP (“QEPM”) debt. QEPFS is the direct or indirect owner of assets related to, and entities engaged in, natural gas gathering, transportation and processing in or around the Green River Basin located in Wyoming and Colorado, the Uinta Basin located in eastern Utah, and the portion of the Williston Basin located in North Dakota. During 2015, TLLP recorded measurement period adjustments, which reduced goodwill by $34 million, after obtaining additional information regarding, among other things, asset valuations and liabilities assumed.
On July 22, 2015, TLLP and QEPM completed the transaction in which TLLP Merger Sub LLC merged with and into QEPM, with QEPM surviving the merger as a wholly-owned subsidiary of TLLP (the “QEPM Merger”). TLLP issued additional TLLP Common Units to QEPM unitholders as a result of the QEPM Merger. There was no impact to the purchase price allocation as a result of the QEPM Merger.
During the years ended December 31, 2015 and 2014, we incurred transaction costs of $2 million and $33 million, respectively, related to the Rockies Natural Gas Business Acquisition directly attributable to the transaction. These costs are included in general and administrative expenses and interest and financing costs, net in our combined consolidated statements of operations.
December 31, 2016 | 75 | ||
| NOTES TO CONSOLIDATED FINANCIAL STATEMENTS | ||
OTHER TRANSACTIONS
NORTH DAKOTA GATHERING AND PROCESSING ASSETS. On November 21, 2016, TLLP agreed to acquire crude oil, natural gas and produced water gathering systems and two natural gas processing facilities from Whiting Oil and Gas Corporation, GBK Investments, LLC and WBI Energy Midstream, LLC (the "North Dakota Gathering and Processing Assets") for total consideration of approximately $700 million. The North Dakota Gathering and Processing Assets include crude oil, natural gas and produced water gathering pipelines, natural gas processing and fractionation capacity in the Sanish and Pronghorn fields of the Williston Basin in North Dakota. The acquisition, which was subject to customary closing conditions including regulatory approval, closed January 1, 2017. Given the acquisition date, it was impracticable for TLLP to develop an initial estimate for the fair value of identifiable assets acquired, residual goodwill or pro forma information for disclosure in these financial statements.
ADDITIONAL EQUITY ISSUANCES
UNIT ISSUANCE. TLLP closed a registered public offering of 6.3 million common units representing limited partner interests, including the over-allotment option exercised by the underwriter for the purchase of an additional 825 thousand common units, at a public offering price of $47.13 per unit on June 10, 2016. The net proceeds of $293 million were used for general partnership purposes, including debt repayment, acquisitions, capital expenditures and additions to working capital.
ATM PROGRAM. On August 24, 2015, TLLP filed a prospectus supplement to its shelf registration statement filed with the Securities and Exchange Commission (“SEC”) on August 6, 2015, authorizing the continuous issuance of up to an aggregate of $750 million of common units, in amounts, at prices and on terms to be determined by market conditions and other factors at the time of its offerings (such continuous offering program, or at-the-market program, referred to as the “2015 ATM Program”). Prior to then, TLLP issued shares under a June 25, 2014 filed prospectus supplement to its shelf registration statement filed with the SEC in 2012 (the “2014 ATM Program”). During the years ended December 31, 2016 and 2015, TLLP issued under both the 2015 ATM Program and the 2014 ATM Program an aggregate of 1,492,637 and 1,912,996 common units, respectively, generating proceeds of approximately $72 million and $103 million, respectively, before issuance costs. In 2014, under the 2014 ATM Program, TLLP issued 199,400 common units generating proceeds of approximately $14 million before issuance costs. The net proceeds from issuances under these programs were used for general partnership purposes, which included debt repayment, future acquisitions, capital expenditures and additions to working capital.
COMMERCIAL AGREEMENTS WITH TLLP
TLLP generates revenue by charging fees for gathering crude oil and natural gas, processing natural gas and for distributing, transporting and storing crude oil and refined products. We do not provide financial or equity support through any liquidity arrangements or financial guarantees to TLLP. In connection with the acquisitions between Tesoro and TLLP, we entered into long-term, fee-based storage and throughput and use agreements.
TLLP provides us with various pipeline transportation, trucking, terminal distribution, gas processing, storage and coke-handling services under long-term, fee-based commercial agreements expiring 2017 through 2026. These include ten-year use and throughput agreements and ten-year transportation agreements. Each of these agreements, with the exception of the storage and transportation services agreement, contain minimum volume commitments. Each agreement has fees that are indexed for inflation and provides us options to renew for two additional five-year term.
OTHER AGREEMENTS WITH TLLP
THIRD AMENDED AND RESTATED OMNIBUS AGREEMENT. We entered into an omnibus agreement with TLLP at the closing of TLLP’s initial public offering in April 2011 (the “Initial Offering”). The omnibus agreement, most recently amended on November 21, 2016 (the “Third Amended Omnibus Agreement”) in connection with TLLP’s purchase of certain terminalling and pipeline assets owned by Tesoro and two of our subsidiaries, contains the following key provisions:
| • | Non-compete clause between us and TLLP effective under certain circumstances; |
| • | Right of first offer to TLLP for certain of our retained logistics assets, including certain terminals, pipelines, docks, storage facilities and other related assets located in California, Alaska and Washington; |
| • | Payment of an annual fee to us for the provision of various general and administrative services; |
| • | Reimbursement to TLLP for certain maintenance and expansion capital expenditures; and |
| • | Indemnification to TLLP for certain matters, including pre-Initial Offering environmental, title and tax matters. |
76 | Tesoro Corporation | ||
| NOTES TO CONSOLIDATED FINANCIAL STATEMENTS | |
Additional acquisitions of assets by TLLP from us are governed by the Third Amended Omnibus Agreement, with the exception of the indemnifications for the acquisition of the six marketing and storage terminal facilities (the “Los Angeles Terminal Assets”) and the acquisition of the remaining logistics assets (the “Los Angeles Logistics Assets”) initially acquired by us as part of the Los Angeles Acquisition in Southern California (the “Los Angeles Logistics Assets Acquisition”), which are covered by the Carson Assets Indemnity Agreement.
CARSON ASSETS INDEMNITY AGREEMENT. We entered into the Carson Assets Indemnity Agreement with TLLP at the closing of the Los Angeles Logistics Assets Acquisition effective December 6, 2013. The Carson Assets Indemnity Agreement establishes indemnification to TLLP for certain matters including known and unknown environmental liabilities arising out of the use or operation of the Los Angeles Terminal Assets and the Los Angeles Logistics Assets prior to the respective acquisition dates.
SECONDMENT AND LOGISTICS SERVICES AGREEMENT. In connection with TLLP’s purchase of certain terminalling and pipeline assets owned by Tesoro and two of our subsidiaries on July 1, 2014, TLLP terminated the operational services agreement entered into at the closing of the Initial Offering and entered into the Secondment and Logistics Services Agreement (the “Secondment Agreement”) with Tesoro to govern the provision of seconded employees to or from Tesoro, TLLP, and its subsidiaries, as applicable. The Secondment Agreement, as amended as recently as November 2016, also governs the use of certain facilities of the parties by the various entities. The services to be provided by such seconded employees, along with the fees for such services, will be provided on the service schedules attached to the Secondment Agreement. Specialized services and the use of various facilities, along with the fees for such services, will be provided for in service orders to be executed by parties requesting and receiving the service. All fees to be paid pursuant to the Secondment Agreement are indexed for inflation.
KEEP-WHOLE COMMODITY AGREEMENT. TLLP processes gas for certain producers under “keep-whole” processing agreements. Under a keep-whole agreement, a producer transfers title to the NGLs produced during gas processing, and the processor, in exchange, delivers to the producer natural gas with a BTU content equivalent to the NGLs removed. The operating margin for these contracts is typically determined by the spread between NGLs sales prices and the price paid to purchase the replacement natural gas (“Shrink Gas”). TLLP entered into a five-year agreement with Tesoro, which transfers the commodity risk exposure associated with these keep-whole processing agreements from TLLP to Tesoro (the “Keep-Whole Commodity Agreement”). Under the Keep-Whole Commodity Agreement with Tesoro, Tesoro pays TLLP a fee to process NGLs related to keep-whole agreements and delivers Shrink Gas to the producers on behalf of TLLP. TLLP pays Tesoro a marketing fee in exchange for assuming the commodity risk. As of 2016, pricing under this agreement is subject to a tiered pricing structure with pricing for a base level of NGLs production and pricing for incremental volumes over 315,000 gallons per day. The pricing for both the base and incremental volumes are subject to revision each year.
INCENTIVE DISTRIBUTION RIGHTS. Concurrent with the close of the Northern California Terminalling and Storage Assets Acquisition and the announcement of the North Dakota Gathering and Processing Assets transaction, TLGP has agreed to waive $100 million of general partner incentive distributions with respect to 2017 and 2018, or $12.5 million per quarter, to support the balanced growth of the general and limited partners’ interests and maintain strong financial metrics.
ENVIRONMENTAL LIABILITIES
In September 2013, the Partnership responded to the release of crude oil in a rural field northeast of Tioga, North Dakota (the “Crude Oil Pipeline Release”). The environmental liabilities related to the Crude Oil Pipeline Release include amounts estimated for remediation activities that will be conducted during the next few years to restore the site for agricultural use. We accrued an additional $7 million during the year ended December 31, 2016 to reflect improved scope definition and estimates, which resulted in an increase in the total estimated cost associated with the project. This incident was covered by our pollution liability insurance policy, subject to a $1 million deductible and a $25 million loss limit in place at that time. Pursuant to this policy, there were no insurance recovery receivables related to the Crude Oil Pipeline Release at both December 31, 2016 and 2015. The estimated remediation costs of $73 million exceeded our policy loss limit by $48 million as of December 31, 2016. We received no insurance proceeds for the year ended December 31, 2016, and $18 million and $7 million in reimbursement of costs incurred during the years ended December 31, 2015 and 2014, respectively.
On October 7, 2015, TLLP received an offer to settle a Notice of Violation (“NOV”) from the North Dakota Department of Health (“NDDOH”). The NOV was issued on March 21, 2015, and alleges violations of water pollution regulations as a result of a release of crude oil that occurred near Tioga, North Dakota on our gathering and transportation pipeline system in September 2013. TLLP is currently negotiating the settlement of this matter with the NDDOH. The ultimate resolution of the matter will not have a material impact on our liquidity, financial position, or results of operations.
December 31, 2016 | 77 | ||
| NOTES TO CONSOLIDATED FINANCIAL STATEMENTS | ||
NOTE 4 – DISCONTINUED OPERATIONS
On September 25, 2013, we completed the sale of all our interest in Tesoro Hawaii, LLC, (the “Hawaii Business”). We received gross proceeds of $539 million, including $75 million from the sale of assets and $464 million from the sale of inventory and other net working capital. Additional contingent consideration includes an earnout arrangement payable over three years for an aggregate amount of up to $40 million based on consolidated gross margins. Any income related to the earnout arrangement will not be recorded until it is considered realizable. During the year ended December 31, 2016, we received $1 million and $15 million related to the 2014 and 2015 calendar year earnout periods, respectively. These amounts were recorded as a gain on the sale of the Hawaii Business when received. We have also agreed to indemnify the purchaser for up to $15 million of environmental remediation costs related to the Hawaii Business, subject to limitations described in the purchase agreement, and retained responsibility for the resolution of certain Clean Air Act allegations described in Note 15.
The results of operations for this business have been presented as discontinued operations in the statements of consolidated operations for the years ended December 31, 2016, 2015 and 2014.
REVENUES AND EARNINGS (LOSS), BEFORE AND AFTER TAX FROM THE DISCONTINUED HAWAII BUSINESS (in millions)
| Years Ended December 31, | |||||||||||
| 2016 | 2015 | 2014 | |||||||||
| Earnings (loss) from discontinued operations, before tax (a) | $ | 17 | $ | (6 | ) | $ | (46 | ) | |||
| Less: income tax expense (benefit) | 7 | (2 | ) | (17 | ) | ||||||
| Earnings (loss) from discontinued operations, net of tax | $ | 10 | $ | (4 | ) | $ | (29 | ) | |||
| (a) | Includes charges totaling $6 million and $42 million for the years ended December 31, 2015 and 2014, respectively, related to regulatory improvements we are obligated to make at the at the Hawaii refinery to resolve the Clean Air Act matters discussed in Note 15. There were no additional charges during the year ended December 31, 2016. |
Cash flows related to the Hawaii Business have been combined with the cash flows from continuing operations in the statements of consolidated cash flows for all three years presented. Cash flows from operating activities were $6 million for the year ended December 31, 2016. Cash flows used in operating activities were $5 million and $3 million for the years ended December 31, 2015 and 2014, respectively.
NOTE 5 – RECEIVABLES AND INVENTORIES
RECEIVABLES
COMPONENTS OF RECEIVABLES (in millions)
| December 31, | |||||||
| 2016 | 2015 | ||||||
| Trade receivables | $ | 1,092 | $ | 778 | |||
| Tax receivables | 21 | 22 | |||||
| Other receivables | 2 | 5 | |||||
| Allowance for doubtful accounts (a) | (7 | ) | (13 | ) | |||
| Total Receivables, Net | $ | 1,108 | $ | 792 | |||
| (a) | Allowances for doubtful accounts of $7 million and $13 million at December 31, 2016 and 2015, respectively, relate to estimated uncollectible amounts on our trade receivables. |
78 | Tesoro Corporation | ||
| NOTES TO CONSOLIDATED FINANCIAL STATEMENTS | |
INVENTORIES
COMPONENTS OF INVENTORIES (in millions)
| December 31, | |||||||
| 2016 | 2015 | ||||||
| Domestic crude oil and refined products | $ | 2,099 | $ | 2,142 | |||
| Foreign subsidiary crude oil | 310 | 325 | |||||
| Materials and supplies | 149 | 140 | |||||
| Oxygenates and by-products | 81 | 54 | |||||
| Merchandise | 1 | — | |||||
| Less: Lower of cost or market reserve | — | (359 | ) | ||||
| Total Inventories, Net | $ | 2,640 | $ | 2,302 | |||
The replacement cost of our crude oil and refined product inventories exceeded carrying value by approximately $107 million at December 31, 2016. We recorded a lower of cost or market reserve of $359 million at December 31, 2015 to cost of sales for our crude oil, refined products, oxygenates and by-product inventories to adjust the carrying value of our inventories to reflect replacement cost. We reverse any lower of cost or market reserve in the subsequent period because the inventories are sold or used and then perform a complete lower of cost or market assessment of ending inventories at the end of each reporting period to determine if a reserve is required.
NOTE 6 – PROPERTY, PLANT AND EQUIPMENT
PROPERTY, PLANT AND EQUIPMENT (in millions)
| December 31, | |||||||
| 2016 | 2015 | ||||||
| Refining | $ | 8,067 | $ | 7,189 | |||
| TLLP | 4,059 | 4,162 | |||||
| Marketing | 934 | 915 | |||||
| Corporate | 412 | 296 | |||||
| Property, Plant and Equipment, at Cost | 13,472 | 12,562 | |||||
| Accumulated depreciation | (3,496 | ) | (3,021 | ) | |||
| Property, Plant and Equipment, Net | $ | 9,976 | $ | 9,541 | |||
December 31, 2016 | 79 | ||
| NOTES TO CONSOLIDATED FINANCIAL STATEMENTS | ||
NOTE 7 – ACQUIRED INTANGIBLES AND GOODWILL
ACQUIRED INTANGIBLES
NET BOOK VALUE FOR EACH MAJOR CLASS OF ACQUIRED INTANGIBLE ASSETS, EXCLUDING GOODWILL (in millions)
| December 31, 2016 | December 31, 2015 | ||||||||||||||||||||||
Historical Cost | Accumulated Amortization | Net Book Value | Historical Cost | Accumulated Amortization | Net Book Value | ||||||||||||||||||
| Business relationships (a) | $ | 1,071 | $ | 81 | $ | 990 | $ | 1,008 | $ | 32 | $ | 976 | |||||||||||
| Refining operating permits, emissions credits and other | 331 | 137 | 194 | 283 | 128 | 155 | |||||||||||||||||
| Trade names | 49 | 17 | 32 | 49 | 15 | 34 | |||||||||||||||||
ampm® license | 31 | 4 | 27 | 31 | 3 | 28 | |||||||||||||||||
| Marketing supply network | 45 | 29 | 16 | 46 | 28 | 18 | |||||||||||||||||
| Intellectual property | 18 | — | 18 | — | — | — | |||||||||||||||||
| Total | $ | 1,545 | $ | 268 | $ | 1,277 | $ | 1,417 | $ | 206 | $ | 1,211 | |||||||||||
| (a) | In connection with the Rockies Natural Gas Business acquisition in 2014, TLLP recognized $1.0 billion of business relationships associated with the acquired natural gas processing and gathering operations. The value for the identified business relationships consists of cash flows expected from existing contracts and future arrangements from the existing customer base. The amounts and useful lives associated with these business relationships were finalized within TLLP’s measurement period of the purchase price allocation. In addition, during 2016, we recognized $44 million and $19 million of business relationships associated with the FHR and Great Northern Midstream acquisitions, respectively. |
All of our acquired intangible assets are subject to amortization with the exception of certain indefinite-lived intangible assets totaling $62 million and $14 million at December 31, 2016 and 2015, respectively. These indefinite-lived intangible assets relate to the ARCO® brand included in the trade names category and perpetual emission credits within the refining operating permits, emissions credits and other category. Amortization expense of acquired intangible assets was $63 million, $43 million and $17 million for the years ended December 31, 2016, 2015 and 2014, respectively. As of December 31, 2016, our estimated amortization expense is expected to be $46 million for 2017 and $45 million for each of the next four years thereafter. In accordance with our policies, we performed an impairment assessment on our indefinite-lived intangible assets and no impairments were recognized during the years ended December 31, 2016, 2015 and 2014.
GOODWILL
Goodwill in our Refining segment was $47 million and $31 million at December 31, 2016 and 2015, respectively, reflecting acquisitions in the year. See Note 2 for further details regarding our acquisitions. TLLP’s goodwill was $117 million and $130 million at December 31, 2016 and 2015, respectively, reflecting the deconsolidation of RGS. In our Marketing segment, goodwill was $26 million and $27 million at December 31, 2016 and 2015, respectively.
For 2016, we elected to perform our annual goodwill impairment using a two-step quantitative assessment process on TLLP’s goodwill and the qualitative assessment process on our Refining segment’s goodwill and our Marketing segment’s goodwill. Factors utilized in the qualitative assessments performed on goodwill in our Refining and Marketing segments include, among other things, macroeconomic conditions, industry and market considerations, cost factors, overall financial performance, company specific operating results and other relevant entity-specific events affecting individual reporting units.
As part of our two-step quantitative goodwill impairment process for TLLP, we engaged a third party appraisal firm to assist in the determination of estimated fair value for each reporting unit. This determination includes estimating the fair value of each TLLP reporting unit using both the income and market approaches. The income approach requires management to estimate a number of factors for each reporting unit, including projected future operating results, economic projections, anticipated future cash flows and discount rates. The market approach estimates fair value using comparable marketplace fair value data from within a comparable industry grouping. The determination of the fair value of the reporting units requires us to make significant estimates and assumptions. These estimates and assumptions primarily include, but are not limited to, the selection of appropriate peer group companies, control premiums appropriate for acquisitions in the industries in which we compete, the discount rates, terminal growth rates, and forecasts of revenue, operating income, depreciation and amortization and capital expenditures.
80 | Tesoro Corporation | ||
| NOTES TO CONSOLIDATED FINANCIAL STATEMENTS | |
We determined that no impairment charges resulted from our November 1, 2016 goodwill impairment assessments. Furthermore, the fair value of each of TLLP’s five reporting units tested in step one of the goodwill impairment test exceeded the carrying value such that we were not required to perform step two. There were no impairments of goodwill during the years ended December 31, 2016, 2015 and 2014.
NOTE 8 – INVESTMENTS - EQUITY METHOD AND JOINT VENTURES
For each of the following investments, we have the ability to exercise significant influence over each of these investments through our participation in the management committees, which make all significant decisions. However, since we have equal or proportionate influence over each committee as a joint interest partner and all significant decisions require consent of the other investor(s) without regard to our economic interest, we have determined that these entities should not be consolidated and apply the equity method of accounting with respect to our investments in each entity.
| • | WATSON COGENERATION COMPANY (“Watson”). We own a 51% interest in Watson, which produces steam and electricity at a facility located at our Los Angeles refinery. Our transactions with Watson, which do not have intra-entity profits requiring elimination, consist of sales of fuel gas and water, purchases of steam and electricity and charges for general and administrative support. |
| • | RENDEZVOUS GAS SERVICES, L.L.C. (“RGS”). TLLP has a 78% interest in RGS, which owns and operates the infrastructure that transports gas from certain fields to several re-delivery points in southwestern Wyoming, including natural gas processing facilities that are owned by TLLP or a third party. Prior to 2016, Tesoro and TLLP consolidated RGS, however, upon the reassessment performed in conjunction with the adoption of ASU 2015-02 as of January 1, 2016, we determined RGS represented a variable interest entity to TLLP for which we are not the primary beneficiary. Under the limited liability company agreement, we do not have voting rights commensurate with our economic interest due to veto rights available to our partner in RGS. Certain business decisions, including, but not limited to, decisions with respect to significant expenditures or contractual commitments, annual budgets, material financings, dispositions of assets or amending the members’ gas servicing agreements, require unanimous approval of the members. |
| • | THREE RIVERS GATHERING, LLC (“TRG”). TLLP owns a 50% interest in TRG which operates natural gas gathering assets within the southeastern Uinta Basin and is primarily supported by long-term, fee-based gas gathering agreements with minimum volume commitments. |
| • | UINTAH BASIN FIELD SERVICES, L.L.C. (“UBFS”). TLLP owns a 38% interest in UBFS which owns and operates the natural gas gathering infrastructure located in the southeastern Uinta Basin and is supported by long-term, fee-based gas gathering agreements that contain firm throughput commitments, which generate fees whether or not the capacity is used, and is operated by TLLP. |
December 31, 2016 | 81 | ||
| NOTES TO CONSOLIDATED FINANCIAL STATEMENTS | ||
EQUITY METHOD INVESTMENTS (in millions)
| Watson | Vancouver Energy | TLLP | |||||||||||||||||||||
| RGS | TRG | UBFS | Total | ||||||||||||||||||||
| Balance at December 31, 2014 | $ | 103 | $ | 9 | $ | — | $ | 40 | $ | 18 | $ | 170 | |||||||||||
| Investments | — | 1 | — | 3 | (b) | — | (b) | 4 | |||||||||||||||
| Equity in earnings (loss) | 1 | (1 | ) | — | 5 | 2 | 7 | ||||||||||||||||
| Distributions received | (12 | ) | — | — | (6 | ) | (4 | ) | (22 | ) | |||||||||||||
| Balance at December 31, 2015 (a) | 92 | 9 | — | 42 | 16 | 159 | |||||||||||||||||
| Effect of deconsolidation (c) | — | — | 295 | — | — | 295 | |||||||||||||||||
| Effect of consolidation (d) | — | (8 | ) | — | — | — | (8 | ) | |||||||||||||||
| Equity in earnings (loss) | 1 | (1 | ) | 8 | 2 | 3 | 13 | ||||||||||||||||
| Distributions received | (10 | ) | — | (22 | ) | (4 | ) | (3 | ) | (39 | ) | ||||||||||||
| Balance at December 31, 2016 (a) | $ | 83 | $ | — | $ | 281 | $ | 40 | $ | 16 | $ | 420 | |||||||||||
| (a) | The carrying amount of our investments in Watson, RGS, TRG and UBFS exceeded the underlying equity in net assets by $65 million, $135 million, $16 million and $7 million, respectively, at December 31, 2016. The carrying amount of our investments in Watson, TRG and UBFS exceeded the underlying equity in net assets by $68 million, $17 million and $8 million, respectively, at December 31, 2015. The carrying amounts of our investments that exceed the underlying equity in net assets are amortized over the useful life of the underlying fixed assets and included in equity in earnings (loss). |
| (b) | Includes the final fair value adjustment resulting from measurement period changes related to TLLP’s Rockies Natural Gas Business in 2015. |
| (c) | The reassessment of the investments performed by TLLP resulted in the deconsolidation of RGS and the reporting of RGS as an equity method investment. TLLP recognized an increase of $295 million to equity method investments as of January 1, 2016 as a result of the deconsolidation. |
| (d) | Effective September 1, 2016, we became majority owner of our venture with Savage Companies to construct, own and operate a unit train unloading and marine loading terminal at Port of Vancouver, USA (the “Vancouver Energy” terminal). As a result, Vancouver Energy was consolidated. |
NOTE 9 – OTHER ASSETS AND LIABILITIES
OTHER NONCURRENT ASSETS
COMPONENTS OF NONCURRENT ASSETS (in millions)
| December 31, | |||||||
| 2016 | 2015 | ||||||
| Deferred charges, net of amortization | $ | 743 | $ | 650 | |||
| Investments - equity method and joint ventures | 420 | 159 | |||||
| Goodwill | 190 | 188 | |||||
| Deferred branding costs, net of amortization | 160 | 95 | |||||
| Environmental credits | 89 | 97 | |||||
| Other assets, net of amortization | 129 | 84 | |||||
| Total Other Noncurrent Assets | $ | 1,731 | $ | 1,273 | |||
82 | Tesoro Corporation | ||
| NOTES TO CONSOLIDATED FINANCIAL STATEMENTS | |
OTHER LIABILITIES
COMPONENTS OF OTHER CURRENT LIABILITIES AND OTHER NONCURRENT LIABILITIES (in millions)
| December 31, | |||||||
| 2016 | 2015 | ||||||
| Other Current Liabilities: | |||||||
| Taxes other than income taxes | $ | 288 | $ | 320 | |||
| Employee costs | 229 | 298 | |||||
| RINs liabilities | 126 | 40 | |||||
| Environmental credit obligations | 123 | — | |||||
| Interest | 62 | 46 | |||||
| Environmental liabilities | 60 | 64 | |||||
| Income taxes payable | 38 | — | |||||
| Current liabilities related to discontinued operations | 22 | 22 | |||||
| Pension and other postretirement benefits | 11 | 10 | |||||
| Asset retirement obligations | 6 | 5 | |||||
| Legal costs | 2 | 5 | |||||
| Other | 90 | 146 | |||||
| Total Other Current Liabilities | $ | 1,057 | $ | 956 | |||
| Other Noncurrent Liabilities: | |||||||
| Pension and other postretirement benefits | $ | 430 | $ | 401 | |||
| Environmental liabilities | 167 | 191 | |||||
| Employee costs, excluding pension and other postretirement benefits | 50 | 35 | |||||
| Environmental credit obligations | 42 | 10 | |||||
| Deferred income | 39 | 37 | |||||
| Asset retirement obligations | 20 | 25 | |||||
| Liability for unrecognized tax benefits, including interest and penalties | 8 | 7 | |||||
| Noncurrent liabilities related to discontinued operations | 1 | 19 | |||||
| Other | 64 | 48 | |||||
| Total Other Noncurrent Liabilities | $ | 821 | $ | 773 | |||
NOTE 10 – DERIVATIVE INSTRUMENTS
In the ordinary course of business, our profit margins, earnings and cash flows are impacted by the timing, direction and overall change in pricing for commodities used throughout our operations. We use non-trading derivative instruments to manage our exposure to the following:
| • | price risks associated with the purchase or sale of feedstocks, refined products and energy supplies related to our refineries, terminals, marketing fuel inventory and customers; |
| • | price risks associated with inventories above or below our target levels; |
| • | future emission credit requirements; and |
| • | exchange rate fluctuations on our purchases of Canadian crude oil. |
Our accounting for derivative instruments depends on whether the underlying commodity will be used or sold in the normal course of business. For contracts where the crude oil or refined products are expected to be used or sold in the normal course of business, we apply the normal purchase normal sale exception and follow the accrual method of accounting. All other derivative instruments are recorded at fair value using mark-to-market accounting.
December 31, 2016 | 83 | ||
| NOTES TO CONSOLIDATED FINANCIAL STATEMENTS | ||
Our derivative instruments can include Forward Contracts, Futures Contracts, over-the-counter swaps, including swap Contracts, Options, and OTC Option Contracts. Forward Contracts are agreements to buy or sell the commodity at a predetermined price at a specified future date. Futures Contracts are standardized agreements, traded on a futures exchange, to buy or sell the commodity at a predetermined price at a specified future date. Options provide the right, but not the obligation to buy or sell the commodity at a specified price in the future. Swap Contracts and OTC Option Contracts require cash settlement for the commodity based on the difference between a contracted fixed or floating price and the market price on the settlement date. Certain of these contracts require cash collateral to be received or paid if our asset or liability position, respectively, exceeds specified thresholds. We believe that we have minimal credit risk with respect to our counterparties.
The following table presents the fair value of our derivative instruments as of December 31, 2016 and 2015. The fair value amounts below are presented on a gross basis and do not reflect the netting of asset and liability positions permitted under the terms of our master netting arrangements including cash collateral on deposit with, or received from, brokers. We offset the recognized fair value amounts for multiple derivative instruments executed with the same counterparty in our financial statements when a legal right of offset exists. As a result, the asset and liability amounts below will not agree with the amounts presented in our consolidated balance sheets.
DERIVATIVE ASSETS AND LIABILITIES (in millions)
| Derivative Assets | Derivative Liabilities | |||||||||||||||
| Balance Sheet Location | December 31, 2016 | December 31, 2015 | December 31, 2016 | December 31, 2015 | ||||||||||||
| Commodity Futures Contracts | Prepayments and other current assets | $ | 821 | $ | 711 | $ | 871 | $ | 673 | |||||||
| Commodity Swap Contracts | Prepayments and other current assets | 11 | 15 | 13 | 14 | |||||||||||
| Commodity Swap Contracts | Receivables | — | 7 | — | — | |||||||||||
| Commodity Swap Contracts | Accounts payable | — | — | 2 | — | |||||||||||
| Commodity Option Contracts | Prepayments and other current assets | 1 | — | — | — | |||||||||||
| Commodity Forward Contracts | Receivables | 6 | 2 | — | — | |||||||||||
| Commodity Forward Contracts | Accounts payable | — | — | 2 | 4 | |||||||||||
| Total Gross Mark-to-Market Derivatives | 839 | 735 | 888 | 691 | ||||||||||||
| Less: Counterparty Netting and Cash Collateral (a) | (744 | ) | (675 | ) | (832 | ) | (687 | ) | ||||||||
| Total Net Fair Value of Derivatives | $ | 95 | $ | 60 | $ | 56 | $ | 4 | ||||||||
| (a) | Certain of our derivative contracts, under master netting arrangements, include both asset and liability positions. We offset both the fair value amounts and any related cash collateral amounts recognized for multiple derivative instruments executed with the same counterparty when there is a legally enforceable right and an intention to settle net or simultaneously. As of December 31, 2016 and December 31, 2015, we had provided cash collateral amounts of $88 million and $12 million, respectively, related to our unrealized derivative positions. Cash collateral amounts are netted with mark-to-market derivative assets. |
GAIN (LOSSES) ON MARK-TO-MARKET DERIVATIVES (in millions)
| Years Ended December 31, | |||||||||||
| 2016 | 2015 | 2014 | |||||||||
| Commodity Contracts | $ | (67 | ) | $ | 279 | $ | 482 | ||||
| Foreign Currency Forward Contracts (a) | — | (6 | ) | (5 | ) | ||||||
| Total Gain (Loss) Mark-to-Market Derivatives | $ | (67 | ) | $ | 273 | $ | 477 | ||||
| (a) | Losses for our foreign currency forward contracts are located in other income, net in our statements of consolidated operations. |
84 | Tesoro Corporation | ||
| NOTES TO CONSOLIDATED FINANCIAL STATEMENTS | |
INCOME STATEMENT LOCATION OF GAINS (LOSSES) ON MARK-TO-MARKET DERIVATIVES (in millions)
| Years Ended December 31, | |||||||||||
| 2016 | 2015 | 2014 | |||||||||
| Revenues | $ | (4 | ) | $ | 67 | $ | 26 | ||||
| Cost of sales | (63 | ) | 212 | 456 | |||||||
| Other income, net | — | (6 | ) | (5 | ) | ||||||
| Total Gain (Loss) on Mark-to-Market Derivatives | $ | (67 | ) | $ | 273 | $ | 477 | ||||
We did not designate any of our derivatives for hedge accounting during the years ended December 31, 2016, 2015 and 2014.
OPEN LONG (SHORT) POSITIONS
OUTSTANDING COMMODITY AND OTHER CONTRACTS (units in thousands)
| Contract Volumes by Year of Maturity | |||||||
| Mark-to-Market Derivative Instrument | 2017 | 2018 | Unit of Measure | ||||
| Crude oil, refined products and blending products: | |||||||
| Futures - short | (6,457 | ) | — | Barrels | |||
| Futures - long | — | 15 | Barrels | ||||
| Swap Contracts - long | 467 | — | Barrels | ||||
| Forwards - short | (261 | ) | — | Barrels | |||
| Environmental credits: | |||||||
| Futures - long | 1,000 | — | Tons | ||||
| Corn: | |||||||
| Futures - short | (6,310 | ) | — | Bushels | |||
At December 31, 2016, we had open Forward Currency Contracts to purchase CAD $16 million that matured on January 24, 2017.
NOTE 11 – FAIR VALUE MEASUREMENTS
RECURRING FAIR VALUE MEASUREMENTS
We classify financial assets and liabilities according to the fair value hierarchy. Financial assets and liabilities classified as level 1 instruments are valued based on quoted prices in active markets for identical assets and liabilities. Level 2 instruments are valued based on quoted prices for similar assets and liabilities in active markets, and inputs other than quoted prices, such as liquidity, that are observable for the asset or liability. Our level 2 instruments include derivatives valued using market quotations from independent price reporting agencies, third-party brokers and commodity exchange price curves that are corroborated with market data. Level 3 instruments are valued using significant unobservable inputs that are not supported by sufficient market activity. We do not have any financial assets or liabilities classified as level 3 at December 31, 2016 or December 31, 2015.
Our financial assets and liabilities measured at fair value on a recurring basis include derivative instruments. Additionally, our financial liabilities include obligations for RINs and cap and trade emission credits for the state of California (together with RINs, our “Environmental Credit Obligations”). See Note 10 for further information on our derivative instruments. Amounts presented below for Environmental Credit Obligations represent the estimated fair value amount at each balance sheet date for which we do not have sufficient RINs and California cap and trade credits to satisfy our obligations to the EPA and the state of California, respectively.
December 31, 2016 | 85 | ||
| NOTES TO CONSOLIDATED FINANCIAL STATEMENTS | ||
FINANCIAL ASSETS AND LIABILITIES AT FAIR VALUE (in millions)
| December 31, 2016 | |||||||||||||||||||
| Level 1 | Level 2 | Level 3 | Netting and Collateral (a) | Total | |||||||||||||||
| Assets: | |||||||||||||||||||
| Commodity Futures Contracts | $ | 821 | $ | — | $ | — | $ | (733 | ) | $ | 88 | ||||||||
| Commodity Swap Contracts | — | 11 | — | (11 | ) | — | |||||||||||||
| Commodity Option Contracts | 1 | — | — | — | 1 | ||||||||||||||
| Commodity Forward Contracts | — | 6 | — | — | 6 | ||||||||||||||
| Total Assets | $ | 822 | $ | 17 | $ | — | $ | (744 | ) | $ | 95 | ||||||||
| Liabilities: | |||||||||||||||||||
| Commodity Futures Contracts | $ | 870 | $ | 1 | $ | — | $ | (821 | ) | $ | 50 | ||||||||
| Commodity Swap Contracts | — | 15 | — | (11 | ) | 4 | |||||||||||||
| Commodity Forward Contracts | — | 2 | — | — | 2 | ||||||||||||||
| Environmental Credit Obligations | — | 79 | — | — | 79 | ||||||||||||||
| Total Liabilities | $ | 870 | $ | 97 | $ | — | $ | (832 | ) | $ | 135 | ||||||||
| December 31, 2015 | |||||||||||||||||||
| Level 1 | Level 2 | Level 3 | Netting and Collateral (a) | Total | |||||||||||||||
| Assets: | |||||||||||||||||||
| Commodity Futures Contracts | $ | 711 | $ | — | $ | — | $ | (660 | ) | $ | 51 | ||||||||
| Commodity Swap Contracts | — | 22 | — | (15 | ) | 7 | |||||||||||||
| Commodity Forward Contracts | — | 2 | — | — | 2 | ||||||||||||||
| Total Assets | $ | 711 | $ | 24 | $ | — | $ | (675 | ) | $ | 60 | ||||||||
| Liabilities: | |||||||||||||||||||
| Commodity Futures Contracts | $ | 673 | $ | — | $ | — | $ | (673 | ) | $ | — | ||||||||
| Commodity Swap Contracts | — | 14 | — | (14 | ) | — | |||||||||||||
| Commodity Forward Contracts | — | 4 | — | — | 4 | ||||||||||||||
| Environmental Credit Obligations | — | 40 | — | — | 40 | ||||||||||||||
| Total Liabilities | $ | 673 | $ | 58 | $ | — | $ | (687 | ) | $ | 44 | ||||||||
| (a) | Certain of our derivative contracts, under master netting arrangements, include both asset and liability positions. We offset both the fair value amounts and any related cash collateral amounts recognized for multiple derivative instruments executed with the same counterparty when there is a legally enforceable right and an intention to settle net or simultaneously. As of December 31, 2016 and December 31, 2015, we had provided cash collateral amounts of $88 million and $12 million, respectively, related to our unrealized derivative positions. Cash collateral amounts are netted with mark-to-market derivative assets. |
We believe the carrying value of our other financial instruments, including cash and cash equivalents, receivables, accounts payable and certain accrued liabilities approximate fair value. Our fair value assessment incorporates a variety of considerations, including the short-term duration of the instruments and the expected future insignificance of bad debt expense, which includes an evaluation of counterparty credit risk. The borrowings under the Revolving Credit Facility, the TLLP Revolving Credit Facility, TLLP Unsecured Term Loan Facility and our Term Loan Credit Facility, which include variable interest rates, approximate fair value. The fair value of our fixed rate debt is based on prices from recent trade activity and is categorized in level 2 of the fair value hierarchy. The carrying and fair values of our debt were approximately $7.0 billion and $7.3 billion at December 31, 2016, respectively, and approximately $4.1 billion for both the carrying and fair values at December 31, 2015. These carrying and fair values of our debt do not consider the unamortized issuance costs, which are netted against our total debt.
86 | Tesoro Corporation | ||
| NOTES TO CONSOLIDATED FINANCIAL STATEMENTS | |
NONRECURRING FAIR VALUE MEASUREMENTS
Except as discussed in Note 2 and Note 3 related to our purchase price allocations associated with the Rockies Natural Gas Business acquisition, the Great Northern Midstream acquisition, the FHR acquisition, the Dickinson Refinery acquisition and the Virent acquisition, no other nonrecurring asset and liability fair value measurements were performed during the years ended December 31, 2016 and 2015.
NOTE 12 – DEBT
TOTAL DEBT COMPOSITION (in millions)
| December 31, | |||||||
| 2016 | 2015 | ||||||
| Revolving credit facilities: | |||||||
| Tesoro Corporation Revolving Credit Facility | $ | — | $ | — | |||
| TLLP Revolving Credit Facility | 330 | 305 | |||||
| TLLP Dropdown Credit Facility | — | — | |||||
| Tesoro debt: | |||||||
| Term Loan Facility | 64 | — | |||||
| 4.250% Senior Notes due 2017 | 450 | 450 | |||||
| 5.375% Senior Notes due 2022 | 475 | 475 | |||||
| 4.750% Senior Notes due 2023 | 850 | — | |||||
| 5.125% Senior Notes due 2024 | 300 | 300 | |||||
| 5.125% Senior Notes due 2026 | 750 | — | |||||
| TLLP debt: | |||||||
| TLLP Unsecured Term Loan Facility | — | 250 | |||||
| TLLP 5.500% Senior Notes due 2019 | 500 | 500 | |||||
| TLLP 5.875% Senior Notes due 2020 (a) | 470 | 470 | |||||
| TLLP 6.125% Senior Notes due 2021 (a) | 800 | 550 | |||||
| TLLP 6.250% Senior Notes due 2022 | 800 | 800 | |||||
| TLLP 6.375% Senior Notes due 2024 | 450 | — | |||||
| TLLP 5.250% Senior Notes due 2025 | 750 | — | |||||
| Capital lease obligations and other | 53 | 47 | |||||
| Total Debt | 7,042 | 4,147 | |||||
| Unamortized issuance costs (a) (b) | (109 | ) | (74 | ) | |||
| Current maturities, net of unamortized issuance costs | (465 | ) | (6 | ) | |||
| Debt, Net of Current Maturities and Unamortized Issuance Costs | $ | 6,468 | $ | 4,067 | |||
| (a) | Unamortized premiums of $4 million associated with these senior notes are included in unamortized issuance costs at both December 31, 2016 and 2015. |
| (b) | Unamortized debt issuance costs of $113 million and $78 million are recorded as a reduction to debt on the balance sheet at December 31, 2016 and 2015, respectively. |
The aggregate maturities of our debt, including capital leases, for each of the five years following December 31, 2016, are as follows: 2017 — $465 million; 2018 — $17 million; 2019 — $526 million; 2020 — $488 million; and 2021 — $1.2 billion.
December 31, 2016 | 87 | ||
| NOTES TO CONSOLIDATED FINANCIAL STATEMENTS | ||
REVOLVING CREDIT FACILITIES
AVAILABLE CAPACITY UNDER CREDIT FACILITIES (in millions)
Total Capacity | Amount Borrowed as of December 31, 2016 | Outstanding Letters of Credit | Available Capacity | Expiration | |||||||||||||
| Tesoro Corporation Revolving Credit Facility (a) | $ | 2,000 | $ | — | $ | 4 | $ | 1,996 | September 30, 2020 | ||||||||
| TLLP Revolving Credit Facility | 600 | 330 | — | 270 | January 29, 2021 | ||||||||||||
| TLLP Dropdown Credit Facility | 1,000 | — | — | 1,000 | January 29, 2021 | ||||||||||||
| Letter of Credit Facilities | 975 | — | 22 | 953 | |||||||||||||
| Total Credit Facilities | $ | 4,575 | $ | 330 | $ | 26 | $ | 4,219 | |||||||||
| (a) | The $2.0 billion total capacity does not include the additional $1.0 billion related to the incremental revolving facility, as discussed further below. |
EXPENSES AND FEES OF OUR CREDIT FACILITIES
| Credit Facility | 30 day Eurodollar (LIBOR) Rate | Eurodollar Margin | Base Rate | Base Rate Margin | Commitment Fee (unused portion) | |||||
| Tesoro Corporation Revolving Credit Facility ($2.0 billion) | 0.77% | 1.75% | 3.75% | 0.75% | 0.300% | |||||
| TLLP Revolving Credit Facility ($600 million) | 0.77% | 2.00% | 3.75% | 1.00% | 0.375% | |||||
| TLLP Dropdown Credit Facility ($1.0 billion) | 0.77% | 2.01% | 3.75% | 1.01% | 0.375% | |||||
TESORO CORPORATION REVOLVING CREDIT FACILITY. On September 30, 2016, we entered into a new senior revolving credit agreement (the “Revolving Credit Agreement”) with a syndicate of banks and financial institutions that provides for a total available revolving capacity of $2.0 billion. The credit availability is not subject to borrowing base redetermination and is scheduled to mature on September 30, 2020. Once certain conditions are satisfied, the Revolving Credit Agreement allows Tesoro to request an increase in capacity to $2.3 billion prior to an investment grade credit rating from either Moody's Investors Service or S&P Global Ratings and up to $3.0 billion afterward, subject to receiving increased commitments from lenders. We had unused credit availability of approximately 100% of the borrowing capacity at December 31, 2016. The Revolving Credit Agreement replaced Tesoro’s Sixth Amended and Restated Credit Agreement dated January 4, 2013, which was terminated on September 30, 2016.
Borrowings bear interest at either a base rate (3.75% at December 31, 2016), plus the applicable spread, or a Eurodollar rate (0.77% at December 31, 2016 (1M LIBOR)), plus the applicable spread. The applicable spread at December 31, 2016 was 0.75% in the case of the base rate and 1.75% in the case of the Eurodollar rate but will vary generally based on the credit ratings in effect on Tesoro’s senior, unsecured, non-credit enhanced long-term debt. The commitment fee for the unused portion of the facility was 0.30% at December 31, 2016.
On December 13, 2016, in connection with the Merger with Western Refining, Tesoro entered into an amendment to the Revolving Credit Agreement (the “Amendment Agreement”) with the banks which provides for an incremental revolving facility in an aggregate principal amount of $1.0 billion (the “Incremental Revolver”) and increases the aggregate commitments from $2.0 billion to $3.0 billion. Subject to certain conditions, the Incremental Revolver may be initially borrowed to fund the potential cash consideration payable in connection with the Company’s acquisition of Western Refining, the repayment and redemption of certain outstanding indebtedness of Western Refining and its subsidiaries in connection with the Merger and the payment of fees and expenses associated with the foregoing.
Following the initial borrowing of the Incremental Revolver and subject to certain conditions, the Incremental Revolver will convert into a single tranche with the existing commitments and will be available for working capital and general corporate purposes. Following the conversion of the Incremental Revolver, the Company will have a single tranche of $3.0 billion of commitments under the Amendment Agreement.
88 | Tesoro Corporation | ||
| NOTES TO CONSOLIDATED FINANCIAL STATEMENTS | |
The availability of the Incremental Revolver is subject to customary conditions, including the completion of the Merger. The Amendment Agreement also amends certain provisions to, among other things permit the consummation of the Merger, permit the incurrence of additional unsecured indebtedness in an aggregate principal amount not to exceed $2.2 billion, permit the incurrence of certain pre-existing debt of Western Refining and its subsidiaries pursuant to the terms of the Merger Agreement, and exclude Western Refining Logistics, LP and its subsidiaries from any requirement to guarantee or secure the Amendment Agreement. Other than with respect to the amendments, the terms of the Amendment Agreement are substantially the same as the terms of the Revolving Credit Agreement.
The Revolving Credit Agreement includes certain negative, affirmative and financial covenants, a number of which will either no longer apply or become less restrictive if an investment grade rating from either Moody's Investors Service or S&P Global Ratings is achieved, that may limit or restrict the ability of Tesoro and its subsidiaries to:
| • | pay dividends and make other distributions with respect to our capital stock and purchase, redeem or retire our capital stock; |
| • | enter into certain hedging agreements; |
| • | incur additional indebtedness; |
| • | sell assets unless the proceeds from those sales are used to repay debt or are reinvested in our business; |
| • | incur liens on assets to secure certain debt; |
| • | engage in certain business activities; |
| • | make certain payments and distributions from our subsidiaries; |
| • | engage in certain investments, mergers or consolidations and transfers of assets; and |
| • | enter into non-arm’s length transactions with affiliates. |
At present, the Revolving Credit Facility is guaranteed by substantially all of Tesoro’s active domestic subsidiaries, excluding TLGP, TLLP and its subsidiaries, certain foreign subsidiaries and other specified subsidiaries and is secured by substantially all of Tesoro’s active domestic subsidiaries’ crude oil and refined product inventories, cash and receivables, other than those of the excluded subsidiaries. If Tesoro achieves an investment grade credit rating from either Moody's Investors Service or S&P Global Ratings, the guarantees and collateral shall be released and the facility will become unsecured.
The Revolving Credit Facility allows us to obtain letters of credit under separate letter of credit agreements for foreign crude oil purchases. Our uncommitted letter of credit agreements had $22 million outstanding as of December 31, 2016. Letters of credit outstanding under these agreements incur fees ranging from 0.45% to 0.90% and are secured by the crude oil inventories for which they are issued. Capacity under these letter of credit agreements is available on an uncommitted basis and can be terminated by either party at any time.
TLLP REVOLVING CREDIT FACILITY AND DROPDOWN CREDIT FACILITY. The TLLP Revolving Credit Facility provided for total loan availability of $600 million as of December 31, 2016, and TLLP may request that the loan availability be increased up to an aggregate of $1.6 billion, subject to receiving increased commitments from the lenders. The TLLP Revolving Credit Facility is non-recourse to Tesoro, except for TLGP, and is guaranteed by all of TLLP’s subsidiaries, with the exception of certain non-wholly owned subsidiaries acquired in the Rockies Natural Gas Business acquisition and secured by substantially all of TLLP’s assets. Borrowings are available under the TLLP Revolving Credit Facility up to the total loan availability of the facility. As of December 31, 2016, there was $330 million in borrowings outstanding under the TLLP Revolving Credit Facility, which had unused credit availability of approximately 45% of the borrowing capacity. The weighted average interest rate for borrowings under TLLP Revolving Credit Facility was 2.76% at December 31, 2016.
On January 29, 2016, TLLP amended its existing secured TLLP Revolving Credit Facility to improve key terms related to pricing and financial covenants and decreased the aggregate available facility limit from $900 million to $600 million. Additionally, on January 29, 2016, TLLP syndicated a new $1.0 billion secured TLLP Dropdown Credit Facility. The primary use of proceeds under this facility will be to fund asset acquisitions. The terms, covenants and restrictions under this facility are substantially the same as the amended secured TLLP Revolving Credit Facility.
The secured TLLP Revolving Credit Facility and the secured Dropdown Credit Facility ratably share collateral comprised primarily of TLLP property, plant and equipment and both facilities mature on January 29, 2021. In addition, upon an upgrade of TLLP’s corporate family rating to investment grade, certain covenants and restrictions under each facility will automatically be eliminated or improved.
December 31, 2016 | 89 | ||
| NOTES TO CONSOLIDATED FINANCIAL STATEMENTS | ||
TESORO DEBT
4.250% SENIOR NOTES DUE 2017. In September 2012, we issued $450 million aggregate principal amount of senior notes due in October 2017 (the “2017 Notes”) at 4.250%, which approximates the effective interest rate. The 2017 Notes have a five-year maturity and are subject to optional redemption by Tesoro at any time prior to September 1, 2017 at a make-whole price plus accrued and unpaid interest, and par thereafter, plus accrued and unpaid interest. The 2017 Notes contain terms, events of default and covenants that are customary for notes of this nature and of non-investment grade securities. These notes are unsecured obligations and guaranteed by certain of our domestic subsidiaries, excluding TLGP and TLLP and its subsidiaries.
5.375% SENIOR NOTES DUE 2022. In September 2012, the Company issued $475 million aggregate principal amount of senior notes due in 2022 (“2022 Notes”) at 5.375%, which approximates the effective interest rate. The 2022 Notes have a ten-year maturity and are subject to optional redemption by Tesoro at any time prior to October 1, 2017, at a make-whole price plus any accrued and unpaid interest. On or after October 1, 2017, the 2022 Notes may be redeemed at premiums of 2.688% through September 30, 2018; 1.792% through September 30, 2019; 0.896% through September 30, 2020; and at par thereafter, plus accrued and unpaid interest. These notes are unsecured obligations and guaranteed by certain of our domestic subsidiaries, excluding TLGP and TLLP and its subsidiaries, and contain customary terms, events of default and covenants for an issuance of non-investment grade securities.
4.750% SENIOR NOTES DUE 2023. In connection with the Western Refining acquisition, in December 2016 Tesoro completed its offering of $850 million aggregate principal amount of senior notes due in 2023 (the “2023 Notes”) at 4.750%, which approximates the effective interest rate, pursuant to a private placement transaction conducted under Rule 144A and Regulation S of the Securities Act of 1933, as amended. The 2023 Notes have a seven-year maturity and are subject to optional redemption by Tesoro at any time prior to October 15, 2023 at a redemption price equal to the greater of 100% of the principal amount of the notes to be redeemed or the sum of the present values of the remaining scheduled payment of principal and interest on the notes to be redeemed discounted to the date of redemption on a semiannual basis at the then-current treasury rate plus 50 basis points. If the notes are redeemed on or after October 15, 2023, the Company will pay a redemption price equal to 100% of the principal amount of the notes redeemed. In the event the Merger with Western Refining does not take place on or prior to November 30, 2017 or if the plan for the Merger is terminated, Tesoro will redeem all of the 2023 Notes at a price equal to 101% of the principal amount thereof plus accrued and unpaid interest. These notes are unsecured obligations and guaranteed by certain of our domestic subsidiaries, excluding TLGP and TLLP and its subsidiaries. Following the completion of the Merger, Western Refining and certain of its subsidiaries will also guarantee these notes.
Tesoro agreed to complete a registered exchange offer to exchange the 2023 Notes for debt securities with substantially identical terms within 180 days of the closing date of the Merger.
5.125% SENIOR NOTES DUE 2024. In March 2014, we issued $300 million aggregate principal amount of senior notes due in 2024 (the “2024 Notes”) at 5.125%, which approximates the effective interest rate. The 2024 Notes have a ten-year maturity and are subject to optional redemption by Tesoro any time on or after April 1, 2019 at premiums of 2.563% through March 31, 2020; 1.708% through March 31, 2021; 0.854% through March 31, 2022; and at par thereafter. Prior to April 1, 2019, the 2024 Notes may be redeemed at a make-whole price plus accrued and unpaid interest. In addition, at any time prior to April 1, 2017, we may redeem up to 35% of the aggregate principal amount at 105.125% of face value with proceeds from certain equity issuances. These notes are unsecured obligations and guaranteed by certain of our domestic subsidiaries, excluding TLGP and TLLP and its subsidiaries.
5.125% SENIOR NOTES DUE 2026. In connection with the Western Refining acquisition, in December 2016 Tesoro completed its offering of $750 million aggregate principal amount of senior notes due in 2026 (the “2026 Notes”) at 5.125%, which approximates the effective interest rate, pursuant to a private placement transaction conducted under Rule 144A and Regulation S of the Securities Act of 1933, as amended. The 2026 Notes have a ten-year maturity and are subject to optional redemption by Tesoro at any time prior to September 15, 2026 at a redemption price equal to the greater of 100% of the principal amount of the notes to be redeemed or the sum of the present values of the remaining scheduled payment of principal and interest on the notes to be redeemed discounted to the date of redemption on a semiannual basis at the then-current treasury rate plus 50 basis points. If the notes are redeemed on or after September 15, 2026, the Company will pay a redemption price equal to 100% of the principal amount of the notes redeemed. In the event the Merger with Western Refining does not take place on or prior to November 30, 2017 or if the plan for the Merger is terminated, Tesoro will redeem all of the 2026 Notes at a price equal to 101% of the principal amount thereof plus accrued and unpaid interest. These notes are unsecured obligations and guaranteed by certain of our domestic subsidiaries, excluding TLGP and TLLP and its subsidiaries. Following the completion of the Merger, Western Refining and certain of its subsidiaries will also guarantee these notes.
90 | Tesoro Corporation | ||
| NOTES TO CONSOLIDATED FINANCIAL STATEMENTS | |
Tesoro agreed to complete a registered exchange offer to exchange the 2026 Notes for debt securities with substantially identical terms within 180 days of the closing date of the Merger.
The terms of the 2023 Notes, 2024 Notes and 2026 Notes are generally less restrictive than those contained in our senior notes due in 2017 and 2022, and exclude some limitations on restricted payments, asset sales and other transactions that are included in those senior notes.
TLLP DEBT
TLLP 5.500% SENIOR NOTES DUE 2019. In October 2014, TLLP completed a private offering of $1.3 billion aggregate principal amount of senior notes pursuant to a private placement transaction conducted under Rule 144A and Regulation S of the Securities Act of 1933, as amended. The senior notes offering consisted of $500 million of senior notes due 2019 (the “TLLP 2019 Notes”) at 5.500%, which approximates the effective interest rate, and $800 million of 6.250% senior notes due in 2022. The proceeds from the TLLP 2019 Notes were used to repay amounts outstanding under the TLLP Revolving Credit Facility related to the West Coast Logistics Asset Acquisition. The remaining net proceeds from the TLLP 2019 Notes were used to fund the Rockies Natural Gas Business acquisition.
The TLLP 2019 Notes have no sinking fund requirements and TLLP may redeem some or all of the notes prior to September 15, 2019, at a make-whole price, and at par thereafter, plus accrued and unpaid interest. The TLLP 2019 Notes are unsecured and guaranteed by all of TLLP’s subsidiaries, with the exception of a certain non-wholly owned subsidiary acquired in the Rockies Natural Gas Business acquisition and Tesoro Logistics Finance Corp., the co-issuer, and are non-recourse to Tesoro, except for TLGP. The TLLP 2019 Notes contain customary terms, events of default and covenants for an issuance of non-investment grade securities.
TLLP agreed to complete a registered exchange offer to exchange the TLLP 2019 Notes for debt securities with substantially identical terms within 18 months of the closing date of the senior notes offering. In April 2016, TLLP completed the exchange of all of the TLLP 2019 Notes.
TLLP 5.875% SENIOR NOTES DUE 2020. At December 31, 2016, TLLP had $470 million of outstanding senior notes due in 2020 (the “TLLP 2020 Notes”) at 5.875%, which approximates the effective interest rate, excluding unamortized premiums of $4 million. These TLLP 2020 Notes were issued in two offerings, the initial offering of $350 million of unregistered notes effective September 2012 and the secondary offering of $250 million of unregistered notes effective December 2013, which was issued at 102.25% of face value (together, the “Unregistered Notes”). In July 2014, TLLP completed an offer to exchange these Unregistered Notes for notes registered under the Securities Act of 1933, as amended (the “Exchange Notes”). In accordance with the terms of the Exchange Notes, each holder of the Unregistered Notes was entitled to receive the Exchange Notes, which are identical in all material respects to the Unregistered Notes (including principal amount, interest rate, maturity and redemption rights), except that the Exchange Notes generally are not subject to transfer restrictions.
The TLLP 2020 Notes have no sinking fund requirements and TLLP may redeem some or all of the notes through October 1, 2017 at premiums equal to 2.938%; 1.469% through October 1, 2018; and at par thereafter, plus accrued and unpaid interest. The TLLP 2020 Notes are unsecured and guaranteed by all of TLLP’s subsidiaries, except Tesoro Logistics Finance Corp., the co-issuer, and any non-wholly owned subsidiary acquired in the Rockies Natural Gas Business acquisition, and are non-recourse to Tesoro, except for TLGP, and contain customary terms, events of default and covenants for an issuance of non-investment grade securities.
On August 22, 2014, TLLP completed a public offering of 2.1 million common units representing limited partner interests, at a price of $67.47 per unit. TLLP used the net proceeds for the redemption of $130 million of the TLLP 2020 Notes at a premium. TLLP recorded charges totaling $10 million as net interest and financing costs in our statement of consolidated operations for premiums paid due to the early redemption and expensing of unamortized debt issuance costs. We reimbursed TLLP through a capital contribution of $8 million related to the early debt redemption premiums.
TLLP 6.125% SENIOR NOTES DUE 2021. In August 2013, TLLP completed a private offering which were exchanged for registered notes of $550 million aggregate principal amount of senior notes due in 2021 (the “TLLP 2021 Notes”) at 6.125%, which approximates the effective interest rate. The proceeds of this offering were used to repay the amounts outstanding under the TLLP Revolving Credit Facility, which were used to fund a significant portion of TLLP’s acquisition of the Los Angeles Terminal Assets, and to pay a portion of the fees and expenses related to the offering of the TLLP 2021 Notes.
December 31, 2016 | 91 | ||
| NOTES TO CONSOLIDATED FINANCIAL STATEMENTS | ||
The TLLP 2021 Notes have no sinking fund requirements and TLLP may redeem some or all of the notes at premiums equal to 4.594% through October 15, 2017; 3.063% through October 15, 2018; 1.531% from October 15, 2018 through October 15, 2019; and at par thereafter, plus accrued and unpaid interest. The TLLP 2021 Notes are unsecured and guaranteed by all of TLLP’s subsidiaries, except Tesoro Logistics Finance Corp., the co-issuer, and any subsidiaries acquired with the Rockies Natural Gas Business acquisition, and are non-recourse to Tesoro, except for TLGP and contain customary terms, events of default and covenants for an issuance of non-investment grade securities.
In May 2016, TLLP completed a registered offering of $250 million aggregate principal amount of senior notes due 2021 (“Supplemental TLLP 2021 Notes”) at 6.125%, which approximates the effective interest rate. The Partnership used the proceeds of the offering to repay amounts outstanding under TLLP’s Dropdown Credit Facility.
The Supplemental TLLP 2021 Notes were issued under the same indenture governing the existing $550 million of the TLLP 2021 Notes and have the same terms. The Supplemental TLLP 2021 Notes have no sinking fund requirements and may be redeemed at premiums equal to 4.594% through October 15, 2017; 3.063% through October 15, 2018; 1.531% through October 15, 2019; and at par thereafter, plus accrued and unpaid interest. The Supplemental TLLP 2021 Notes are unsecured and guaranteed by all of TLLP’s subsidiaries, except Tesoro Logistics Finance Corp., the co-issuer, and are non-recourse to Tesoro, except for TLGP, and contain customary terms, events of default and covenants for an issuance of non-investment grade securities.
TLLP 6.250% SENIOR NOTES DUE 2022. In connection with TLLP’s Senior Notes Offering on October 29, 2014, TLLP issued $800 million of senior notes due in 2022 (the “TLLP 2022 Notes”) at 6.250%, which approximates the effective interest rate. The proceeds from the TLLP 2022 Notes were used to fund a portion of the Rockies Natural Gas Business acquisition.
The TLLP 2022 Notes have no sinking fund requirements and TLLP may redeem some or all of the notes prior to October 15, 2018, at a make-whole price, plus any accrued and unpaid interest. On or after October 15, 2018, the TLLP 2022 Notes may be redeemed at premiums equal to 3.125% through October 15, 2019; 1.563% through October 15, 2020; and at par thereafter, plus accrued and unpaid interest. TLLP will have the right to redeem up to 35% of the aggregate principal amount at 106.250% of face value with proceeds from certain equity issuances through October 15, 2017. The TLLP 2022 Notes are unsecured and guaranteed by all of TLLP’s subsidiaries, with the exception of a certain non-wholly owned subsidiary acquired in the Rockies Natural Gas Business acquisition and Tesoro Logistics Finance Corp., the co-issuer, and are non-recourse to Tesoro, except for TLGP, and contain customary terms, events of default and covenants for an issuance of non-investment grade securities.
TLLP agreed to complete a registered exchange offer to exchange the TLLP 2022 Notes for debt securities with substantially identical terms within 18 months of the closing date of the senior notes offering. In April 2016, TLLP completed the exchange of substantially all of the TLLP 2022 Notes.
TLLP 6.375% SENIOR NOTES DUE 2024. In May 2016, TLLP completed a registered offering of $450 million aggregate principal amount of senior notes due in 2024 (the “TLLP 2024 Notes”) at 6.375%, which approximates the effective interest rate. The Partnership used the proceeds of the offering to repay amounts outstanding under the TLLP Revolving Credit Facility and for general partnership purposes.
The TLLP 2024 Notes have no sinking fund requirements and TLLP may redeem some or all of the TLLP 2024 Notes, prior to May 1, 2019, at a make-whole price plus accrued and unpaid interest, if any. On or after May 1, 2019, the TLLP 2024 Notes may be redeemed at premiums equal to 4.781% through May 1, 2020; 3.188% through May 1, 2021; 1.594% through May 1, 2022; and at par thereafter, plus accrued and unpaid interest. The Partnership will have the right to redeem up to 35% of the aggregate principal amount at 106.375% face value with proceeds from certain equity issuances through May 1, 2019. The TLLP 2024 Notes are unsecured and guaranteed by all of TLLP’s subsidiaries, except Tesoro Logistics Finance Corp., the co-issuer, and are non-recourse to Tesoro, except for TLGP, and contain customary terms, events of default and covenants for an issuance of non-investment grade securities.
TLLP 5.250% SENIOR NOTES DUE 2025. In December 2016, TLLP completed a registered offering of $750 million aggregate principal amount of senior notes due in 2025 (the “TLLP 2025 Notes”) at 5.250%, which approximates the effective interest rate. The proceeds from this offering were used to repay amounts outstanding under TLLP’s Dropdown Credit Facility.
92 | Tesoro Corporation | ||
| NOTES TO CONSOLIDATED FINANCIAL STATEMENTS | |
The TLLP 2025 Notes have no sinking fund requirements and TLLP may redeem some or all of the notes prior to January 15, 2021, at a make-whole price, plus any accrued and unpaid interest. On or after January 15, 2021, the TLLP 2025 Notes may be redeemed at premiums equal to 2.625% through January 15, 2022; 1.313% through January 15, 2023; and at par thereafter, plus accrued and unpaid interest. The Partnership will have the right to redeem up to 35% of the aggregate principal amount at 105.250% of face value with proceeds from certain equity issuances through January 15, 2020. The TLLP 2025 Notes are unsecured and guaranteed by all of TLLP’s subsidiaries, except Tesoro Logistics Finance Corp., and are non-recourse to Tesoro, except for TLGP, and contain customary terms, events of default and covenants for an issuance of non-investment grade securities.
DEBT REPAYMENTS
2016 DEBT REPAYMENT. In November 2015, TLLP executed a $250 million unsecured term loan facility (the “TLLP Unsecured Term Loan Facility”) to fund a portion of the LA Storage and Handling Asset Acquisition. On February 3, 2016, TLLP repaid the full amount of the TLLP Unsecured Term Loan Facility, including accrued interest, with proceeds drawn from the TLLP Dropdown Credit Facility. All commitments under the TLLP Unsecured Term Loan Facility were terminated effective with the repayment.
2015 DEBT REPAYMENT. During August 2015, we voluntarily repaid our obligation of $398 million under the Term Loan Facility in its entirety with available cash on hand. The Term Loan Facility originally funded a portion of The Los Angeles Acquisition and was scheduled to mature on May 30, 2016. Amounts paid on the Term Loan Facility cannot be re-borrowed.
2014 DEBT REPAYMENT. We redeemed all outstanding 9.750% Senior Notes due 2019 during 2014, for approximately $329 million, including accrued interest and premiums. We incurred charges totaling $31 million comprised of premiums paid of $19 million and non-cash charges associated with the expensing of $8 million and $4 million of unamortized debt discount and issuance costs, respectively. Our debt redemption charges for the 2019 Notes are recorded in net interest and financing costs in our statements of consolidated operations.
CAPITAL LEASE OBLIGATIONS
Our capital lease obligations relate primarily to the lease of a marine terminal near our Los Angeles refinery that expires in 2023, leases of facilities used for trucking operations in North Dakota with initial terms of 15 years, with five-year renewal options, and the lease of 25 retail stations with initial terms of 17 years, with four five-year renewal options. The total cost of assets under capital leases was $60 million and $55 million with accumulated amortization of $33 million and $28 million at December 31, 2016 and 2015, respectively. We include amortization of the cost of assets under capital leases in depreciation and amortization expense.
FUTURE MINIMUM ANNUAL LEASE PAYMENTS, INCLUDING INTEREST FOR CAPITAL LEASES (in millions)
| December 31, 2016 | |||
| 2017 | $ | 9 | |
| 2018 | 10 | ||
| 2019 | 9 | ||
| 2020 | 6 | ||
| 2021 | 5 | ||
| Thereafter | 12 | ||
| Total minimum lease payments | 51 | ||
| Less amount representing interest | (8 | ) | |
| Capital Lease Obligations | $ | 43 | |
December 31, 2016 | 93 | ||
| NOTES TO CONSOLIDATED FINANCIAL STATEMENTS | ||
NOTE 13 – INCOME TAXES
COMPONENTS OF INCOME TAX EXPENSE FROM CONTINUING OPERATIONS (in millions)
| Years Ended December 31, | |||||||||||
| 2016 | 2015 | 2014 | |||||||||
| Current: | |||||||||||
| Federal | $ | 195 | $ | 697 | $ | 244 | |||||
| State | 36 | 172 | 42 | ||||||||
| Deferred: | |||||||||||
| Federal | 167 | 76 | 212 | ||||||||
| State | 29 | (9 | ) | 49 | |||||||
| Income Tax Expense | $ | 427 | $ | 936 | $ | 547 | |||||
We record deferred tax assets and liabilities for future income tax consequences that are attributable to differences between the financial statement carrying amount of assets and liabilities and their income tax bases.
DEFERRED TAX ASSETS AND LIABILITIES (in millions)
| December 31, | |||||||
| 2016 | 2015 | ||||||
| Deferred tax assets: | |||||||
| Accrued pension and other postretirement benefits | $ | 152 | $ | 141 | |||
| Accrued employee compensation liabilities | 90 | 101 | |||||
| Accrued environmental remediation liabilities | 79 | 87 | |||||
| Other accrued liabilities | 34 | 50 | |||||
| Stock-based compensation | 34 | 47 | |||||
| Net operating losses | 23 | — | |||||
| Tax credit carryforwards | 8 | 8 | |||||
| Asset retirement obligations | 6 | 12 | |||||
| Investment in partnerships | — | 20 | |||||
| Other | 24 | 10 | |||||
| Total deferred tax assets | 450 | 476 | |||||
| Less: valuation allowance | (26 | ) | (7 | ) | |||
| Total deferred tax assets, net | $ | 424 | $ | 469 | |||
| Deferred tax liabilities: | |||||||
| Accelerated depreciation and property related items | $ | 1,357 | $ | 1,341 | |||
| Deferred maintenance costs, including refinery turnarounds | 248 | 224 | |||||
| Inventory | 117 | 22 | |||||
| Investment in partnerships | 61 | — | |||||
| Amortization of intangible assets | 59 | 64 | |||||
| Other | 10 | 40 | |||||
| Total deferred tax liabilities | 1,852 | 1,691 | |||||
| Deferred Tax Liabilities, Net | $ | 1,428 | $ | 1,222 | |||
94 | Tesoro Corporation | ||
| NOTES TO CONSOLIDATED FINANCIAL STATEMENTS | |
With the acquisition of Virent, we acquired federal and state Net Operating Losses (“NOLs”), as well as federal and state credit carryforwards. We have recorded a valuation allowance as of December 31, 2016 for most of the federal NOLs, all of the state NOLs, and all of the acquired federal and state credit carryforwards due to certain tax restrictions placed on Virent’s carryovers after the change in control. Further, we continue to have a valuation allowance on other state credit carryforwards, which after estimating future taxable income in various jurisdictions, we believe will expire unused. The valuation allowance reduces the benefit of the credit carryforwards to the amount that will more likely than not be realized. The realization of our other deferred tax assets depends on Tesoro’s ability to generate future taxable income. Although realization is not assured, we believe it is more likely than not that we will realize those deferred tax assets.
We adopted ASU 2016-09 as of January 1, 2016, which resulted in a $16 million reduction in our income tax provision for the year. See Note 1 for further discussion.
RECONCILIATION OF INCOME TAX EXPENSE FROM CONTINUING OPERATIONS (in millions)
| Years Ended December 31, | |||||||||||
| 2016 | 2015 | 2014 | |||||||||
| Income tax expense at U.S. federal statutory rate | $ | 447 | $ | 921 | $ | 512 | |||||
| Effect of: | |||||||||||
| State income taxes, net of federal income tax effect | 45 | 105 | 59 | ||||||||
| Manufacturing activities deduction | (5 | ) | (43 | ) | (21 | ) | |||||
| Earnings attributable to noncontrolling interest | (44 | ) | (53 | ) | (16 | ) | |||||
| Excess tax benefits from stock-based compensation arrangements | (16 | ) | — | — | |||||||
| Other | — | 6 | 13 | ||||||||
| Income Tax Expense | $ | 427 | $ | 936 | $ | 547 | |||||
INCOME TAX CREDIT AND LOSS CARRYFORWARDS AS OF DECEMBER 31, 2016 (in millions)
| Amount | Expiration | ||||
| Federal NOLs | $ | 58 | 2027 - 2036 | ||
| Federal income tax credits | $ | 1 | 2026 - 2033 | ||
| State NOLs | $ | 53 | 2027 - 2036 | ||
| State income tax credits | $ | 12 | 2017 - 2028 | ||
We are subject to income taxes in the U.S., multiple state jurisdictions, and a few foreign jurisdictions. Our unrecognized tax benefits totaled $182 million and $181 million as of December 31, 2016 and 2015, respectively, of which $6 million and $5 million each year have been recognized as tax liabilities. Included in unrecognized tax benefits as of both December 31, 2016 and 2015 are $172 million (net of the tax benefit on state issues), which would reduce the effective tax rate if recognized.
It is reasonably possible that unrecognized tax benefits could decrease by as much as $13 million in the next twelve months, related primarily to state apportionment matters, none of which is recognized as a liability. We had accrued $2 million at both December 31, 2016 and 2015, respectively, for interest and penalties. We did not recognize an increase or reduction in interest and penalties associated with unrecognized tax benefits during the years ended December 31, 2016, 2015, or 2014. For interest and penalties relating to income taxes we recognize accrued interest in net interest and financing costs and penalties in selling, general and administrative expenses in the statements of consolidated operations. The tax years 2009 forward remain open to examination by the Federal and State taxing authorities, except for California, which remains open from the year 2006.
December 31, 2016 | 95 | ||
| NOTES TO CONSOLIDATED FINANCIAL STATEMENTS | ||
RECONCILIATION OF UNRECOGNIZED TAX BENEFITS (in millions)
| Years Ended December 31, | |||||||||||
| 2016 | 2015 | 2014 | |||||||||
| Balance as of beginning of year | $ | 181 | $ | 21 | $ | 28 | |||||
| Increases related to prior year tax positions | — | 159 | 5 | ||||||||
| Decreases related to prior year tax positions | — | — | (2 | ) | |||||||
| Increases related to current year tax positions | 1 | 1 | 1 | ||||||||
| Decreases related to settlements with taxing authorities | — | — | (11 | ) | |||||||
| Balance as of end of year | $ | 182 | $ | 181 | $ | 21 | |||||
Unrecognized tax benefits increased by $159 million in 2015 for tax positions taken on amended returns filed for 2009-2010. The positions taken exclude certain tax credits for blending biofuels into refined products from taxable income. These tax credits were received from the federal government during the years being amended. However, due to the complex and uncertain nature of the issue, we are unable to conclude that it is more likely than not that we will sustain the claims. Therefore, we have neither recognized a tax benefit, nor recorded a receivable for this item.
NOTE 14 – BENEFIT PLANS
BENEFITS SUMMARY
We sponsor four defined benefit pension plans, including one qualified plan and three nonqualified plans, which are described below.
| • | The funded qualified employee retirement plan (the “Retirement Plan”) provides benefits to all eligible employees. Benefits are determined based on final average compensation and years of service through December 31, 2010, and a cash balance account based formula for service beginning January 1, 2011. Although our funded employee retirement plan fully meets all of the funding requirements under applicable laws and regulations, we contributed $60 million each year during 2016, 2015 and 2014. |
| • | The unfunded nonqualified restoration retirement plan provides for the restoration of retirement benefits to certain senior level employees that are not provided under the qualified retirement plan due to limits imposed by the Internal Revenue Code. |
| • | The unfunded nonqualified executive security plan provides certain executive officers and other key personnel with supplemental pension benefits. These benefits are provided by a nonqualified, noncontributory plan and are based on years of service and compensation. We made payments of $15 million, $1 million and $5 million during 2016, 2015 and 2014, respectively, for current retiree obligations under the plan. |
| • | The unfunded nonqualified supplemental executive retirement plan provides eligible senior level executives a supplemental pension benefit in excess of those earned under the qualified retirement plan. Effective January 1, 2015, this plan was frozen to new participants. |
Tesoro provides health care benefits to retirees who met certain eligibility requirements and were participating in our group health insurance program at retirement. In addition, Tesoro sponsors a 401(k) plan which provides for eligible employees to make contributions, subject to certain limitations, into designated investment funds with a matching contribution by Tesoro.
96 | Tesoro Corporation | ||
| NOTES TO CONSOLIDATED FINANCIAL STATEMENTS | |
PENSION AND OTHER POSTRETIREMENT FINANCIAL INFORMATION
CHANGES IN OBLIGATIONS AND FUNDED STATUS (in millions)
| Pension Benefits | Other Postretirement Benefits | ||||||||||||||
| 2016 | 2015 | 2016 | 2015 | ||||||||||||
| Change in projected benefit obligation: | |||||||||||||||
| Projected benefit obligations at beginning of year | $ | 727 | $ | 767 | $ | 74 | $ | 77 | |||||||
| Service cost | 46 | 45 | 3 | 3 | |||||||||||
| Interest cost | 30 | 30 | 2 | 2 | |||||||||||
| Actuarial loss (gain) | 62 | (44 | ) | — | (2 | ) | |||||||||
| Benefits paid | (72 | ) | (71 | ) | (7 | ) | (6 | ) | |||||||
| Projected Benefit Obligation at End of Year | $ | 793 | $ | 727 | $ | 72 | $ | 74 | |||||||
| Changes in plan assets: | |||||||||||||||
| Fair value of plan assets at beginning of year | $ | 390 | $ | 413 | $ | — | $ | — | |||||||
| Actual return on plan assets | 30 | (15 | ) | — | — | ||||||||||
| Employer contributions | 76 | 63 | 7 | 6 | |||||||||||
| Benefits paid | (72 | ) | (71 | ) | (7 | ) | (6 | ) | |||||||
| Fair Value of Plan Assets at End of Year | 424 | 390 | — | — | |||||||||||
| Funded Status at End of Year | $ | (369 | ) | $ | (337 | ) | $ | (72 | ) | $ | (74 | ) | |||
The accumulated benefit obligation is the present value of benefits earned to date, assuming no future salary growth. The accumulated benefit obligation for our pension benefits at December 31, 2016 and 2015 was $704 million and $629 million, respectively.
LIABILITY AMOUNTS RECOGNIZED IN THE BALANCE SHEET RELATED TO POSTRETIREMENT BENEFITS (in millions)
| Pension Benefits | Other Postretirement Benefits | ||||||||||||||
| 2016 | 2015 | 2016 | 2015 | ||||||||||||
| Other current liabilities | $ | 2 | $ | 2 | $ | 9 | $ | 8 | |||||||
| Other noncurrent liabilities | 367 | 335 | 63 | 66 | |||||||||||
| Total Amount Recognized | $ | 369 | $ | 337 | $ | 72 | $ | 74 | |||||||
COMPONENTS OF PENSION AND OTHER POSTRETIREMENT BENEFIT EXPENSE (INCOME) (in millions)
| Pension Benefits | Other Postretirement Benefits | ||||||||||||||||||||||
| 2016 | 2015 | 2014 | 2016 | 2015 | 2014 | ||||||||||||||||||
| Components of net periodic benefit expense (income): | |||||||||||||||||||||||
| Service cost | $ | 46 | $ | 45 | $ | 44 | $ | 3 | $ | 3 | $ | 3 | |||||||||||
| Interest cost | 30 | 30 | 29 | 2 | 2 | 3 | |||||||||||||||||
| Expected return on plan assets | (27 | ) | (27 | ) | (25 | ) | — | — | — | ||||||||||||||
| Amortization of prior service cost (credit) | — | 1 | 1 | (34 | ) | (34 | ) | (34 | ) | ||||||||||||||
| Recognized net actuarial loss | 19 | 24 | 12 | 4 | 5 | 6 | |||||||||||||||||
| Recognized curtailment and settlement loss | 5 | — | 1 | — | — | — | |||||||||||||||||
| Net Periodic Benefit Expense (Income) | $ | 73 | $ | 73 | $ | 62 | $ | (25 | ) | $ | (24 | ) | $ | (22 | ) | ||||||||
December 31, 2016 | 97 | ||
| NOTES TO CONSOLIDATED FINANCIAL STATEMENTS | ||
WEIGHTED AVERAGE ASSUMPTIONS
| Pension Benefits | Other Postretirement Benefits | ||||||||||||||||
| 2016 | 2015 | 2014 | 2016 | 2015 | 2014 | ||||||||||||
| Projected benefit obligation: | |||||||||||||||||
| Discount rate (a) | 4.12 | % | 4.40 | % | 4.05 | % | 3.38 | % | 3.42 | % | 3.16 | % | |||||
| Rate of compensation increase | 4.33 | % | 4.25 | % | 4.25 | % | — | — | — | ||||||||
| Net periodic benefit expense: | |||||||||||||||||
| Discount rate (a) | 4.40 | % | 4.05 | % | 4.96 | % | 3.42 | % | 3.16 | % | 3.69 | % | |||||
| Rate of compensation increase | 4.33 | % | 4.25 | % | 4.25 | % | — | — | — | ||||||||
| Expected long-term return on plan assets (b) | 6.50 | % | 6.50 | % | 6.50 | % | — | — | — | ||||||||
| (a) | We determine the discount rate primarily by reference to the effective yields on high quality corporate bonds that have a comparable cash flow pattern to the expected pension and other postretirement benefit payments to be made. |
| (b) | The expected return on plan assets reflects the weighted-average of the expected long-term rates of return for the broad categories of investments held for the Retirement Plan. The expected long-term rate of return is adjusted when there are fundamental changes in expected returns on the Retirement Plan’s investments. |
ASSUMED HEALTH CARE COST TREND RATES TO DETERMINE POSTRETIREMENT BENEFIT OBLIGATION
| December 31, | |||||
| 2016 | 2015 | ||||
| Health care cost trend rate assumed for next year | 6.90 | % | 7.20 | % | |
| Rate to which the cost trend rate is assumed to decline (the ultimate trend rate) | 4.80 | % | 4.80 | % | |
| Year that the rate reaches the ultimate trend rate | 2024 | 2024 | |||
Assumed health care cost trend rates could have a significant effect on the amounts reported for the health care plans. However, at December 31, 2016, a one-percentage-point change in assumed health care cost trend rates would have less than a million dollar effect on the service and interest cost components and on our postretirement benefit obligation.
OTHER COMPREHENSIVE INCOME (LOSS) (in millions)
| Pension Benefits | Other Postretirement Benefits | Total | |||||||||||||||||||||
| 2016 | 2015 | 2016 | 2015 | 2016 | 2015 | ||||||||||||||||||
| Net actuarial loss | $ | (323 | ) | $ | (286 | ) | $ | (46 | ) | $ | (51 | ) | $ | (369 | ) | $ | (337 | ) | |||||
| Prior service credit (cost) | (2 | ) | (3 | ) | 62 | 96 | 60 | 93 | |||||||||||||||
| Total Income (Loss) | $ | (325 | ) | $ | (289 | ) | $ | 16 | $ | 45 | $ | (309 | ) | $ | (244 | ) | |||||||
98 | Tesoro Corporation | ||
| NOTES TO CONSOLIDATED FINANCIAL STATEMENTS | |
AMOUNTS RECOGNIZED IN OTHER COMPREHENSIVE INCOME (LOSS), BEFORE INCOME TAXES (in millions)
| Pension Benefits | Other Postretirement Benefits | ||||||||||||||||||||||
| 2016 | 2015 | 2014 | 2016 | 2015 | 2014 | ||||||||||||||||||
| Net gain (loss) arising during the year: | |||||||||||||||||||||||
| Net actuarial loss | $ | (60 | ) | $ | 2 | $ | (144 | ) | $ | 1 | $ | 2 | $ | 2 | |||||||||
| Prior service cost | — | — | (2 | ) | — | — | — | ||||||||||||||||
| Curtailment and settlement loss | 4 | — | — | — | — | — | |||||||||||||||||
| Curtailment - prior service cost | 1 | — | 1 | — | — | — | |||||||||||||||||
| Net (gain) loss reclassified into income: | |||||||||||||||||||||||
| Net actuarial loss | 19 | 24 | 12 | 4 | 5 | 6 | |||||||||||||||||
| Prior service cost (credit) | — | 1 | 1 | (34 | ) | (34 | ) | (35 | ) | ||||||||||||||
| Total Gain (Loss) Recognized In Other Comprehensive Income | $ | (36 | ) | $ | 27 | $ | (132 | ) | $ | (29 | ) | $ | (27 | ) | $ | (27 | ) | ||||||
AMOUNTS INCLUDED IN AOCI, BEFORE INCOME TAXES, EXPECTED TO BE RECOGNIZED AS COMPONENT OF NET PERIODIC BENEFIT EXPENSE (INCOME) (in millions)
Pension Benefits | Other Postretirement Benefits | Total | |||||||||
| Net actuarial (gain) loss | $ | 23 | $ | (34 | ) | $ | (11 | ) | |||
| Prior service cost | — | 3 | 3 | ||||||||
| Total Included In Accumulated Other Comprehensive Income (Loss) | $ | 23 | $ | (31 | ) | $ | (8 | ) | |||
FUTURE CASH FLOWS. Our employee pension plan funding complies with all applicable laws and regulations. Our funding policy is generally to make no less than the minimum required contribution to the plan, nor more than the maximum deductible contribution for the plan year. We contributed $60 million each year during 2016 and 2015, and continue to evaluate our funding strategy for 2017.
ESTIMATED FUTURE BENEFIT PAYMENTS (in millions)
Pension Benefits | Other Postretirement Benefits | ||||||
| 2017 | $ | 62 | $ | 9 | |||
| 2018 | 66 | 8 | |||||
| 2019 | 97 | 8 | |||||
| 2020 | 71 | 8 | |||||
| 2021 | 71 | 7 | |||||
| 2022-2026 | 355 | 31 | |||||
December 31, 2016 | 99 | ||
| NOTES TO CONSOLIDATED FINANCIAL STATEMENTS | ||
RETIREMENT PLAN ASSETS
INVESTMENT POLICIES AND STRATEGIES. The assets supporting the Retirement Plan are invested using a total return investment approach (including dividends, interest, and realized and unrealized capital appreciation) whereby a mix of equity securities, fixed income securities and other investments are used to preserve asset values, diversify risk and achieve our target investment return. Plan assets are managed in a diversified portfolio comprised of two primary components: an equity portion and a fixed income portion. The expected role of the plan’s equity investments is to maximize the long-term real growth of plan assets, while the role of fixed income investments is to generate current income, lower funded status volatility, provide for more stable periodic returns and provide protection against a prolonged decline in the equity markets. Investment strategies and asset allocation decisions are based on careful consideration of risk tolerance, plan liabilities, the plan’s funded status and our financial condition. Our target allocation is as follows: 45% long duration fixed income, 30% equity and 25% other investments comprised primarily of assets that provide protection in inflationary periods and investments, which target a return regardless of market conditions. Our actual allocation of retirement plan assets at December 31, 2016 were 44% long duration fixed income, 33% equity and 23% other investments.
FAIR VALUE OF PLAN ASSETS. We classify plan assets into three classifications or levels in the fair value hierarchy. Our level 1 investments include equity, fixed income and other mutual funds, which are based on market quotations from national securities exchanges. Level 2 investments include short-term investment funds and common/collective trust funds, which are valued at the net asset value of the fund as determined by the fund manager along with individual fixed income securities valued on the basis of evaluated prices from independent pricing services. When market prices are not readily available, the determination of fair value may rely on factors such as significant market activity or security specific events, changes in interest rates and credit quality, and developments in foreign markets. We did not hold any level 3 assets in our investments as of December 31, 2016 and 2015. We do not believe that there are any significant concentrations of risk within our plan assets.
RETIREMENT PLAN’S MAJOR ASSET CATEGORIES MEASURED AT FAIR VALUE (in millions)
| December 31, 2016 | December 31, 2015 | ||||||||||||||||||||||||||||||
| Asset Category | Level 1 | Level 2 | Level 3 | Total | Level 1 | Level 2 | Level 3 | Total | |||||||||||||||||||||||
| Mutual funds (a) | $ | 332 | $ | — | $ | — | $ | 332 | $ | 103 | $ | 49 | $ | — | $ | 152 | |||||||||||||||
| Common/collective trust funds (b) | — | 91 | — | 91 | — | 76 | — | 76 | |||||||||||||||||||||||
| Fixed income (c) | — | — | — | — | — | 155 | — | 155 | |||||||||||||||||||||||
| Short-term investment funds (d) | — | 2 | — | 2 | — | 7 | — | 7 | |||||||||||||||||||||||
| Total | $ | 332 | $ | 93 | $ | — | $ | 425 | $ | 103 | $ | 287 | $ | — | $ | 390 | |||||||||||||||
| (a) | Mutual funds that invest primarily in domestic and international equity and fixed income securities. Fair values are based on market quotations from national securities exchanges. Absolute return and real return mutual funds consist of investments in mutual funds that invest in a broad set of asset classes designed to provide a target return regardless of market conditions or the potential for real returns in excess of U.S. inflation, respectively. The fixed income mutual funds provide diversified exposure to high credit quality, long-term and short-term, U.S. investment grade bonds. All mutual funds and a U.S. equity mutual fund are categorized as level 1 investments. |
| (b) | Common/collective trust funds that invest in primarily equity and fixed income securities. Fair values reflect the net asset value per share, as determined by the investment manager and derived from the quoted prices in active markets of the underlying securities. Common/collective trust funds are classified as level 2 investments. |
| (c) | Fixed income assets represent securities primarily invested in corporate, government-related, mortgage and asset-backed debt obligations with a primary focus on long duration securities. Individual fixed income securities are typically priced on the basis of evaluated prices from independent pricing services. |
| (d) | The short-term investment funds provide for safety of principal and daily liquidity and is valued using the net asset value per share. These assets are classified as level 2 investments. |
100 | Tesoro Corporation | ||
| NOTES TO CONSOLIDATED FINANCIAL STATEMENTS | |
DEFINED CONTRIBUTION PLANS
THRIFT PLAN. We sponsor an employee thrift 401(k) plan (the “Thrift Plan”) that provides for contributions, subject to certain limitations, by eligible employees into designated investment funds with a matching contribution by Tesoro. Employees may elect tax-deferred or Roth treatment in accordance with the provisions of Section 401(k) of the Internal Revenue Code. We match 100% of employee contributions, up to 6% of the employee’s eligible compensation (subject to applicable union collective bargaining agreements).
We began a profit-sharing contribution to the Thrift Plan effective January 1, 2013. This discretionary contribution, calculated as a percentage of employee’s base pay based on a pre-determined target for the calendar year, can range from 0% to 4% based on actual performance. Contributions will normally be made following the performance year. All employees eligible for the Thrift Plan who are employed on December 31st of the year the results are achieved are qualified to receive this contribution, even if they are not contributing to the Thrift Plan. Our contributions to the Thrift Plan amounted to $60 million, $57 million and $42 million in 2016, 2015 and 2014, respectively, of which $24 million were discretionary contributions accrued under the profit-sharing program for 2015 for payment in February 2016. There were no discretionary contributions accrued under the profit-sharing program for 2016. Until September 2015, we sponsored a separate 401(k) savings plan for eligible retail store employees who met the plan’s eligibility requirements (the “Retail Savings Plan”). Eligible employees automatically received a non-elective employer contribution equal to 3% of eligible earnings, regardless of participation. On September 28, 2015, the remaining assets in the Retail Savings Plan were merged into the Thrift Plan.
EXECUTIVE DEFERRED COMPENSATION PLAN
We also sponsor a non-qualified executive deferred compensation plan, which provides eligible employees the opportunity for additional pre-tax deferrals and company contributions not provided under our Thrift Plan due to compensation and deferral limitations imposed under the Internal Revenue Code.
NOTE 15 – COMMITMENTS AND CONTINGENCIES
OPERATING LEASES, PURCHASE OBLIGATIONS AND OTHER COMMITMENTS
We have various cancellable and noncancellable operating leases related to land, office and retail facilities, ship charters, tanks and equipment and other facilities used in the storage, transportation, and sale of crude oil, feedstocks and refined products. Rental expense for all operating leases, gross of sublease income, including leases with a term of one month or less, was $576 million in 2016, $569 million in 2015 and $466 million in 2014.
The majority of our future operating lease payments relate to marine transportation, retail station and tank storage leases. As of December 31, 2016, we had 14 ships on time charter used to transport crude oil and refined products. These ships have remaining time charters expiring between 2017 and 2021, with options to renew. We also time charter tugs and product barges over varying terms ending in 2017 through 2018, most with options to renew and some with rate escalation clauses. Our time charters contain initial terms up to five years. We have operating leases for most of our retail stations with primary remaining terms up to 37 years, most of which contain renewal options and escalation clauses. Our storage tank leases run primarily through 2017.
Tesoro’s contractual purchase commitments consist primarily of crude oil supply contracts for our refineries from several suppliers with noncancellable remaining terms ranging up to five years with renewal provisions. In addition to these purchase commitments, we also have minimum contractual capital spending commitments totaling approximately $459 million in 2017.
We have certain commitments or obligations for the transportation of crude oil refined products and NGLs as well as to purchase industrial gases, chemical processing services and utilities associated with the operation of our refineries. The minimum commitments extend as many as 10 years. We recognized expense of approximately $620 million, $687 million and $666 million in 2016, 2015 and 2014, respectively, under these take-or-pay contracts.
December 31, 2016 | 101 | ||
| NOTES TO CONSOLIDATED FINANCIAL STATEMENTS | ||
MINIMUM ANNUAL PAYMENTS (in millions)
| Minimum Annual Lease Payments (a) | Minimum Crude Oil Supply Commitments (b) | Minimum Annual Take-or-Pay Payments | |||||||||
| 2017 | $ | 413 | $ | 3,225 | $ | 317 | |||||
| 2018 | 323 | 886 | 241 | ||||||||
| 2019 | 259 | 486 | 182 | ||||||||
| 2020 | 227 | 395 | 143 | ||||||||
| 2021 | 224 | 164 | 125 | ||||||||
| Thereafter | 392 | — | 105 | ||||||||
| Total minimum lease payments | $ | 1,838 | $ | 5,156 | $ | 1,113 | |||||
| (a) | Includes operating leases having initial or remaining noncancellable lease terms in excess of one year. |
| (b) | Prices under the term agreements fluctuate due to market-responsive and other contract-specific pricing provisions. To estimate our annual commitments under these contracts, we estimated crude oil prices using exchange-traded crude future prices by crude oil type as of December 31, 2016, with prices ranging from $56 per barrel to $57 per barrel, and volumes based on the contract’s minimum purchase requirements over the term of the contract. |
ENVIRONMENTAL LIABILITIES
We are incurring and expect to continue to incur expenses for environmental remediation liabilities at a number of currently and previously owned or operated refining, pipeline, terminal and retail station properties. We have accrued liabilities for these expenses and believe these accruals are adequate based on current information and projections that can be reasonably estimated. Additionally, we have recognized environmental remediation liabilities assumed in past acquisitions from the prior owners that include amounts estimated for site cleanup and monitoring activities arising from operations at refineries, certain terminals and pipelines, and retail stations prior to the dates of our acquisitions. Our environmental accruals are based on estimates including engineering assessments, and it is possible that our projections will change and that additional costs will be recorded as more information becomes available.
CHANGES IN ENVIRONMENTAL LIABILITIES (in millions)
| December 31, | |||||||
| 2016 | 2015 | ||||||
| Balance at beginning of year (a) | $ | 255 | $ | 274 | |||
| Additions, net | 32 | 46 | |||||
| Liabilities assumed in acquisitions | 5 | 2 | |||||
| Expenditures | (65 | ) | (67 | ) | |||
| Balance at end of year (a) | $ | 227 | $ | 255 | |||
| (a) | Includes $22 million and $33 million of TLLP environmental liabilities at December 31, 2016 and 2015, respectively. |
Our environmental liabilities include $170 million and $192 million as of December 31, 2016 and 2015, respectively, related to amounts estimated for site cleanup activities arising from operations at our Martinez refinery and operations of assets acquired in the Los Angeles Acquisition prior to their respective acquisition dates. We are at various stages of remediation with respect to these assumed liabilities, which may require additional amounts to be recognized for remediation as more information becomes available in the future or changes in scope occur. The amounts recognized to date reflect management’s best estimate of amounts determined to be estimable based on facts known at this time. Future changes in amounts recognized for these assumed liabilities may have a material impact on our results of operations. Of the $170 million accrued at December 31, 2016, approximately $36 million is subject to a cost-share agreement for the Martinez refinery where we are responsible for 75% of the expenditures.
Our estimates for site cleanup activities reflect amounts for which we are responsible under applicable cost-sharing arrangements. On July 10, 2015, a federal court issued an order denying coverage pursuant to insurance policies for environmental remediation liabilities at our Martinez refinery and those liabilities are included in our accruals above. The insurer had filed a
102 | Tesoro Corporation | ||
| NOTES TO CONSOLIDATED FINANCIAL STATEMENTS | |
declaratory relief action challenging coverage of the primary policy assigned to us when we acquired the refinery. The policies provide for coverage up to $190 million for expenditures in excess of $50 million in self-insurance. We have not recognized possible insurance recoveries under the policies and have appealed the order.
Refer to Note 3 for additional environmental matters relating to TLLP.
LEGAL MATTERS
In the ordinary course of business, we become party to lawsuits, administrative proceedings and governmental investigations, including environmental, regulatory and other matters. Large, and sometimes unspecified, damages or penalties may be sought from us in some matters. We have not established accruals for these matters unless a loss is probable, and the amount of loss is currently estimable. See current legal proceedings in Part I, Item 3.
TAX
We are subject to extensive federal, state and foreign tax laws and regulations. Newly enacted tax laws and regulations, and changes in existing tax laws and regulations, could result in increased expenditures in the future. Congress and the administration continue to explore options for reform of the domestic corporate tax code. Several of these options, if enacted into law, could have a significant impact on our tax liability. We are also subject to audits by federal, state and foreign taxing authorities in the normal course of business. It is possible that tax audits could result in claims against us in excess of recorded liabilities. However, we believe that resolution of any such claim(s) would not have a material impact on our liquidity, financial position, or results of operations. It is reasonably possible that unrecognized tax benefits may decrease by as much as $13 million in the next twelve months, related primarily to state apportionment matters.
NOTE 16 – STOCKHOLDERS’ EQUITY
NONCONTROLLING INTEREST
CHANGES IN NONCONTROLLING INTEREST (in millions)
| December 31, | |||||||
| 2016 | 2015 | ||||||
| Balance at Beginning of Year | $ | 2,527 | $ | 2,522 | |||
| Net earnings | 126 | 150 | |||||
| Net proceeds from issuance of Tesoro Logistics LP Common Units | 366 | 101 | |||||
| Distributions to noncontrolling interest | (216 | ) | (182 | ) | |||
| Amortization of TLLP equity settled awards | 5 | 4 | |||||
| Deconsolidation of RGS | (84 | ) | — | ||||
| Consolidation of Vancouver Energy | 8 | — | |||||
| Transfers to (from) noncontrolling interest from (to) Tesoro related to: | |||||||
| TLLP’s sale of common units | (101 | ) | (114 | ) | |||
| Tesoro’s acquisition of TLLP common units (a) | 32 | 44 | |||||
| Other | (1 | ) | 2 | ||||
| Balance at End of Year | $ | 2,662 | $ | 2,527 | |||
| (a) | Includes the net impact of $32 million and $44 million for the years ended December 31, 2016 and 2015, respectively, to noncontrolling interest for ownership changes occurring as a result of TLLP’s issuance of equity to the public and the issuance of TLLP common units to Tesoro for the Alaska Storage and Terminalling Assets Acquisition, the Northern California Terminalling and Storage Assets Acquisition and the LA Storage and Handling Asset Acquisition. |
December 31, 2016 | 103 | ||
| NOTES TO CONSOLIDATED FINANCIAL STATEMENTS | ||
SHARE CALCULATIONS (in millions)
| Years Ended December 31, | ||||||||
| 2016 | 2015 | 2014 | ||||||
| Weighted average common shares outstanding | 118.5 | 123.2 | 128.5 | |||||
| Common stock equivalents | 1.4 | 1.4 | 2.3 | |||||
| Total Diluted Shares | 119.9 | 124.6 | 130.8 | |||||
Potentially dilutive common stock equivalents are excluded from the calculation of diluted earnings per share if the effect of including such securities in the calculation would have been anti-dilutive. Anti-dilutive securities were 0.1 million, 0.6 million and 0.1 million for the years ended December 31, 2016, 2015, and 2014, respectively.
SHARE REPURCHASES
We are authorized by the Board of Directors (our “Board”) to purchase shares of our common stock in open market transactions at our discretion. The Board’s authorization has no time limit and may be suspended or discontinued at any time. Purchases of our common stock can also be made to offset the dilutive effect of stock-based compensation awards and to meet our obligations under employee benefit and compensation plans, including the exercise of stock options and vesting of restricted stock and to fulfill other stock compensation requirements. The current program initially authorized $1.0 billion in share repurchases. In October 2015, the Board authorized an additional $1.0 billion in share repurchases that became effective upon the full completion of the initial program. On November 16, 2016, the Board approved a further $1.0 billion of share repurchases. We purchased approximately 3.2 million and 6.9 million shares of our common stock in each year for approximately $250 million and $644 million during the years ended December 31, 2016 and 2015, respectively.
PREFERRED STOCK
We have 5.0 million shares of preferred stock authorized with no par value per share. No shares of preferred stock were outstanding as of December 31, 2016 and 2015.
CASH DIVIDENDS
On February 3, 2017, our Board declared a cash dividend of $0.550 per share, payable on March 15, 2017 to shareholders of record on February 28, 2017.
CASH DIVIDENDS PAID
| 2016 | 2015 | 2014 | ||||||||||||||||||||||||||||||||||
| Q4 | Q3 | Q2 | Q1 | Q4 | Q3 | Q2 | Q1 | Q4 | Q3 | Q2 | Q1 | |||||||||||||||||||||||||
| Annual cash dividends paid | $249 million | $228 million | $141 million | |||||||||||||||||||||||||||||||||
| Quarterly per share amount declared | $ | 0.550 | $ | 0.550 | $ | 0.500 | $ | 0.500 | $ | 0.500 | $ | 0.500 | $ | 0.425 | $ | 0.425 | $ | 0.300 | $ | 0.300 | $ | 0.250 | $ | 0.250 | ||||||||||||
NOTE 17 – STOCK-BASED COMPENSATION
STOCK-BASED COMPENSATION PLANS
We issue stock-based awards as described below to employees under the 2011 Long-Term Incentive Plan (“2011 Plan”). We also have outstanding awards under our 2006 Long-Term Incentive Plan (“2006 Plan”), Amended and Restated Executive Long-Term Incentive Plan and Non-Employee Director Stock Plan. Tesoro had 3,073,672 shares available for future grants under our plans at December 31, 2016, assuming a 200% payout of performance-based awards. Usually, when stock options are exercised or when restricted common stock is granted, we issue new shares rather than issuing treasury shares. Our plans are described below.
104 | Tesoro Corporation | ||
| NOTES TO CONSOLIDATED FINANCIAL STATEMENTS | |
| • | The 2011 Plan permits the grant of options, SARs, restricted common stock, restricted stock units and incentive bonuses (which may be paid in cash, stock or a combination thereof), any of which may be performance-based. The 2011 Plan became effective in May 2011 and no awards may be granted under the 2011 Plan on or after February 2021. Stock options may be granted at exercise prices not less than the fair market value on the date the options are granted. |
| • | The 2006 Plan permits the grant of options, restricted common stock, deferred stock units, performance stock awards, other stock-based awards and cash-based awards. The 2006 Plan became effective in May 2006. Stock options may be granted at exercise prices not less than the fair market value on the date the options are granted. Options granted become exercisable after one year in 33% annual increments and expire 10 years from the date of grant. No further awards may be granted under this plan. |
| • | The Amended and Restated Executive Long-Term Incentive Plan, which expired in May 2006, allowed grants in a variety of forms, including restricted stock, nonqualified stock options, SARs, performance share and performance unit awards. As of December 31, 2016 and 2015, we no longer have outstanding awards in this plan, although there were awards outstanding during 2015 which were all exercised. |
| • | The 1995 Non-Employee Director Stock Option Plan provided for the grant of nonqualified stock options over the life of the plan to eligible non-employee directors of Tesoro. These automatic, non-discretionary stock options were granted at an exercise price equal to the fair market value per share of Tesoro’s common stock at the date of grant. The term of each option is 10 years, and an option becomes exercisable six months after it is granted. The plan expired in February 2010 and no further options may be granted under this plan. |
TLGP maintains a unit-based compensation plan for officers and directors of TLGP and its affiliates. The TLLP 2011 Long-Term Incentive Plan, as amended and restated in October 2016, (“TLLP Plan”) permits the grant of options, restricted units, phantom units, unit appreciation rights, distribution equivalent rights, unit awards and other unit-based awards. Awards granted during 2016 under the TLLP Plan will be settled with TLLP units. Compensation expense for these awards was not material to our consolidated financial statements for the years ended December 31, 2016, 2015, or 2014.
STOCK-BASED COMPENSATION EXPENSE (BENEFIT) (in millions)
| Years Ended December 31, | |||||||||||
| 2016 | 2015 | 2014 | |||||||||
| Stock appreciation rights | $ | (14 | ) | $ | 25 | $ | 15 | ||||
| Performance share awards | 10 | 11 | 17 | ||||||||
| Market stock units | 29 | 27 | 17 | ||||||||
| Restricted common stock | 5 | 4 | 3 | ||||||||
| Other | 5 | 8 | 3 | ||||||||
| Total Stock-Based Compensation Expense | $ | 35 | $ | 75 | $ | 55 | |||||
We have aggregated expenses for certain award types as they are not considered significant. The income tax effect recognized in the income statement for stock-based compensation was a benefit of $28 million, $28 million and $24 million for the years ended December 31, 2016, 2015 and 2014, respectively. Included in the tax benefit of $28 million for the year ended December 31, 2016 was $16 million of tax benefit attributable to excess tax benefits from exercises and vestings that occurred during the year, the effects of which were recorded in the Statement of Consolidated Operations pursuant to ASU 2016-09. The reduction in current taxes payable recognized from tax deductions resulting from exercises and vestings under all of our stock-based compensation arrangements totaled $37 million, $75 million and $46 million for the years ended December 31, 2016, 2015 and 2014, respectively.
STOCK APPRECIATION RIGHTS
A SAR entitles an employee to receive cash in an amount equal to the excess of the fair market value of one share of common stock on the date of exercise over the grant price of the SAR. Our SARs become exercisable after three years and expire seven years from the date of grant. The fair value of each SAR is estimated at the end of each reporting period using the Black-Scholes option-pricing model. We did not grant SARs to our employees during the years ended December 31, 2016, 2015 or 2014. We paid cash of $21 million, $44 million and $31 million to settle SARs exercised during 2016, 2015 and 2014, respectively. We had $6 million and $41 million recorded in other current liabilities associated with our SARs awards in our consolidated balance sheets at December 31, 2016 and 2015, respectively.
December 31, 2016 | 105 | ||
| NOTES TO CONSOLIDATED FINANCIAL STATEMENTS | ||
SAR ACTIVITY FOR THE YEAR (shares in thousands)
| Number of SARs | Weighted Average Exercise Price | Weighted Average Remaining Contractual Term | ||||
| Outstanding at January 1, 2016 | 463 | $15.72 | 0.43 years | |||
| Exercised | (338 | ) | $16.44 | |||
| Forfeited | (37 | ) | $15.72 | |||
| Outstanding at December 31, 2016 | 88 | $12.93 | 0.34 years | |||
| Vested or expected to vest at December 31, 2016 | 88 | $12.93 | 0.34 years | |||
| Exercisable at December 31, 2016 | 88 | $12.93 | 0.34 years | |||
The expected life of SARs granted is based on historical data and represents the period of time that the awards are expected to be outstanding. Expected volatilities are based on the historical volatility of our stock. We use historical data to estimate SAR exercises and employee termination within the valuation model. Expected dividend yield is based on historical dividends paid. The risk-free rate of the award is based on the U.S. Treasury yield curve in effect at the date of valuation.
WEIGHTED-AVERAGE ASSUMPTIONS USED TO VALUE SARS AND EXPENSE RECOGNIZED
| Years Ended December 31, | |||||
| 2016 | 2015 | 2014 | |||
| Expected life from date of grant (years) | 7 | 7 | 7 | ||
| Expected volatility | 40% | 51% | 57% | ||
| Expected dividend yield | 3% | 2% | 2% | ||
| Risk-free interest rate | 0.7% | 0.4% | 0.2% | ||
PERFORMANCE SHARE AWARDS
PERFORMANCE CONDITIONS. We last granted performance condition performance share awards under the 2011 Plan in February 2014 and have not granted any since. A performance share award represents the right to receive shares of Tesoro common stock at the end of a 3-year performance period depending on the Company’s achievement of pre-established performance measures. The performance share awards can range from 0% to 200% of the number of original shares granted. The value of the award ultimately paid will be based on return on capital employed, which is measured against the performance peer group over the performance period. The fair value of performance share awards tied to performance measures is estimated using the market price of our common stock on the grant date. The estimated fair value of these performance share awards is amortized over a 3-year vesting period using the straight-line method.
MARKET CONDITIONS. We granted market condition performance share awards under the 2011 Plan in February 2015 and January 2016. A market condition award represents the right to receive shares of Tesoro common stock at the end of a 3-year performance period depending on the Company’s achievement of pre-established market conditions. The market condition awards can range from 0% to 200% of the number of original shares granted. The value of the award ultimately paid will be based on relative total shareholder return, which is measured against the performance peer group, XLE Energy Index and the S&P 500 Index over the performance period. The estimated fair value for performance share awards is estimated using a Monte Carlo simulation model as of the grant date and the related expense is amortized over a 3-year vesting period using the straight-line method.
Expected volatilities are based on the historical volatility over the most recent three-year period. Expected dividend yield is based on annualized dividends at the date of valuation. The risk-free rate is based on the U.S. Treasury yield curve in effect at the date of valuation.
106 | Tesoro Corporation | ||
| NOTES TO CONSOLIDATED FINANCIAL STATEMENTS | |
WEIGHTED AVERAGE ASSUMPTIONS USED TO MEASURE PERFORMANCE SHARE AWARDS
| Years Ended December 31, | |||||
| 2016 | 2015 | 2014 | |||
| Expected volatility | 35% | 35% | 43% | ||
| Expected dividend yield | —% | —% | —% | ||
| Risk-free interest rate | 1.0% | 1.0% | 0.6% | ||
Total unrecognized compensation cost related to all non-vested performance share awards totaled $11 million as of December 31, 2016, which is expected to be recognized over a weighted average period of 1.6 years. The estimated weighted average payout percentage for these awards was approximately 111% as of December 31, 2016. The weighted-average grant-date fair value per share of performance share awards granted during 2016, 2015 and 2014 was $87.90, $117.96 and $54.42, respectively.
SUMMARY OF PERFORMANCE SHARE AWARD ACTIVITY, ASSUMING 100% PAYOUT (shares in thousands)
| Number of Shares | Weighted-Average Grant-Date Fair Value | Intrinsic Value (in millions) | ||||
| Nonvested at January 1, 2016 | 431 | $71.76 | $45 | |||
| Granted | 157 | $87.90 | ||||
| Vested | (188 | ) | $55.20 | |||
| Forfeited | (22 | ) | $90.37 | |||
| Nonvested at December 31, 2016 | 378 | $83.53 | $33 | |||
MARKET STOCK UNITS
We granted market stock units under the 2011 Plan in February 2015 and January 2016. These market stock units represent the right to receive a target number of shares that will vest at the end of a 3-year performance period. The number of shares ultimately issued will be based on Tesoro’s stock price changes over the performance period. The market stock units’ potential payout can range from 50% to 200% of the targeted award value, unless the average closing stock price at vesting has decreased more than 50% from the average closing stock price at the grant date, then no market stock units will be paid out. The fair value of each market stock unit is estimated on the grant date using a Monte Carlo simulation model. The estimated fair value of these market stock units is amortized over a 3-year vesting period using the straight-line method. The estimated weighted average payout percentage for these awards was 130% as of December 31, 2016. Total unrecognized compensation cost related to non-vested market stock units totaled $39 million as of December 31, 2016, which is expected to be recognized over a weighted average period of 1.6 years. The weighted-average grant-date fair value per share of market stock units granted during 2016, 2015 and 2014 was $84.84, $114.57 and $57.60, respectively.
SUMMARY OF MARKET STOCK UNIT AWARD ACTIVITY, ASSUMING 100% PAYOUT (units in thousands)
| Number of Units | Weighted-Average Grant-Date Fair Value | Intrinsic Value (in millions) | ||||
| Nonvested at January 1, 2016 | 1,135 | $78.99 | $119 | |||
| Granted | 693 | $84.84 | ||||
| Vested | (711 | ) | $65.95 | |||
| Forfeited | (47 | ) | $89.79 | |||
| Nonvested at December 31, 2016 | 1,070 | $84.78 | $94 | |||
Expected volatilities are based on the historical volatility of our stock. We use historical data to estimate employee termination within the valuation model. Expected dividend yield is based on annualized dividends at the date of grant. The risk-free rate for periods within the performance period is based on the U.S. Treasury yield curve in effect at the time of grant.
December 31, 2016 | 107 | ||
| NOTES TO CONSOLIDATED FINANCIAL STATEMENTS | ||
WEIGHTED AVERAGE ASSUMPTIONS USED TO MEASURE MARKET STOCK UNITS GRANTED
| Years Ended December 31, | |||||
| 2016 | 2015 | 2014 | |||
| Expected volatility | 35% | 35% | 44% | ||
| Expected dividend yield | 2% | 2% | 2% | ||
| Risk-free interest rate | 1.1% | 1.1% | 0.7% | ||
RESTRICTED COMMON STOCK
The fair value of each restricted share on the grant date is equal to the market price of our common stock on that date. The estimated fair value of our restricted common stock is amortized over the vesting period primarily using the straight-line method. These awards primarily vest in annual increments ratably over 3 years. The total fair value of restricted shares vested was $2 million, $4 million and $2 million in 2016, 2015 and 2014, respectively. The weighted-average grant-date fair value per share of restricted common stock granted during 2016, 2015 and 2014 was $85.51, $90.40 and $61.76, respectively. Unrecognized compensation cost related to our non-vested restricted common stock totaled $4 million as of December 31, 2016. This cost is expected to be recognized over a weighted-average period of 1.6 years. The fair value of non-vested restricted common stock, as of December 31, 2016, totaled $10 million.
SUMMARY OF RESTRICTED COMMON STOCK ACTIVITY (shares in thousands)
| Number of Restricted Shares | Weighted-Average Grant-Date Fair Value | |||
| Nonvested at January 1, 2016 | 105 | $57.58 | ||
| Granted | 50 | $85.51 | ||
| Vested | (44 | ) | $53.71 | |
| Forfeited | — | $— | ||
| Nonvested at December 31, 2016 | 111 | $71.45 | ||
STOCK OPTIONS
Under the terms of our stock option plans, the exercise price of options granted is equal to the market price of our common stock on the date of grant. The fair value of each option is estimated on the grant date using the Black-Scholes option-pricing model. The estimated fair value of these stock options is amortized over the vesting period using the straight-line method. There were no options granted to our employees during 2016, 2015 or 2014.
Our options primarily become exercisable after one year in 33% annual increments and expire 10 years from the date of grant. The total intrinsic value for options exercised during 2016, 2015 and 2014 was $3 million, $19 million and $25 million, respectively. There were no non-vested stock options as of December 31, 2016. The reduction in current taxes payable from tax deductions associated with stock options exercised during 2016 totaled $1 million.
SUMMARY OF STOCK OPTION ACTIVITY FOR ALL PLANS (options in thousands)
| Number of Options | Weighted-Average Exercise Price | Weighted-Average Remaining Contractual Term | Aggregate Intrinsic Value (in millions) | |||||
| Outstanding at January 1, 2016 | 344 | $26.55 | 3.0 years | $27 | ||||
| Exercised | (70 | ) | $39.64 | |||||
| Forfeited or expired | — | $— | ||||||
| Outstanding at December 31, 2016 | 274 | $23.20 | 2.5 years | $18 | ||||
| Vested or expected to vest at December 31, 2016 | 274 | $23.20 | 2.5 years | $18 | ||||
| Exercisable at December 31, 2016 | 274 | $23.20 | 2.5 years | $18 | ||||
108 | Tesoro Corporation | ||
| NOTES TO CONSOLIDATED FINANCIAL STATEMENTS | |
NOTE 18 – SUPPLEMENTAL CASH FLOW INFORMATION
SUPPLEMENTAL CASH FLOW DISCLOSURES (in millions)
| Years Ended December 31, | |||||||||||
| 2016 | 2015 | 2014 | |||||||||
| Supplemental Cash Flow Disclosures: | |||||||||||
| Interest paid, net of capitalized interest | $ | 199 | $ | 181 | $ | 129 | |||||
| Income taxes paid, net | 136 | 882 | 309 | ||||||||
| Supplemental Disclosures of Non-cash Investing Activities: | |||||||||||
| Capital expenditures included in accounts payable at end of period | $ | 191 | $ | 137 | $ | 161 | |||||
NOTE 19 – OPERATING SEGMENTS
The Company’s revenues are derived from three operating segments: Refining, TLLP and Marketing. Our Refining segment owns and operates seven petroleum refineries located in California, Washington, Alaska, North Dakota and Utah that manufacture gasoline and gasoline blendstocks, jet fuel, diesel fuel, residual fuel oil and other refined products. We sell these refined products, together with refined products purchased from third parties, to our Marketing segment through terminal facilities and other locations and opportunistically export refined products to foreign markets. TLLP’s assets and operations include certain crude oil gathering assets, natural gas gathering and processing assets and crude oil and refined products terminalling and transportation assets acquired from Tesoro and other third parties. Revenues from the TLLP segment are generated by charging fees for gathering crude oil and natural gas, for processing natural gas, and for terminalling, transporting and storing crude oil, and refined products. Tesoro’s marketing business supplies gasoline and diesel across 16 states through both branded and unbranded marketing channels. We utilize various operating models in the operation of our retail stations. Since we do not have significant operations in foreign countries, revenue generated and long-lived assets located in foreign countries are not material to our operations.
We evaluate the performance of our segments based primarily on segment operating income. Segment operating income includes those revenues and expenses that are directly attributable to management of the respective segment. TLLP and marketing revenues include intersegment transactions with our Refining segment. Corporate depreciation and corporate general and administrative expenses are excluded from segment operating income.
TLLP acquired certain assets from our Refining segment, and the associated liabilities and results of operations are collectively referred to as the “Predecessors.” The accompanying segment information presents certain financial information of the Predecessors at historical cost. The financial statements of the Predecessors have been prepared from the separate records maintained by Tesoro and may not necessarily be indicative of the conditions that would have existed or the results of operations if the Predecessors had been operated as a stand-alone business. The Predecessors did not record revenue for transactions with our Refining segment.
December 31, 2016 | 109 | ||
| NOTES TO CONSOLIDATED FINANCIAL STATEMENTS | ||
SEGMENT INFORMATION RELATED TO CONTINUING OPERATIONS
| Years Ended December 31, | |||||||||||
| 2016 | 2015 | 2014 | |||||||||
| Revenues | (in millions) | ||||||||||
| Refining: | |||||||||||
| Refined products | $ | 21,213 | $ | 25,443 | $ | 37,365 | |||||
| Crude oil resales and other | 1,043 | 946 | 1,456 | ||||||||
| TLLP: | |||||||||||
| Gathering | 339 | 339 | 135 | ||||||||
| Processing | 276 | 278 | 23 | ||||||||
| Terminalling and transportation | 605 | 495 | 442 | ||||||||
| Marketing: | |||||||||||
| Fuel (a) | 15,405 | 18,081 | 23,701 | ||||||||
| Other non-fuel | 85 | 63 | 240 | ||||||||
| Intersegment sales | (14,384 | ) | (16,934 | ) | (22,729 | ) | |||||
| Total Revenues | $ | 24,582 | $ | 28,711 | $ | 40,633 | |||||
| Segment Operating Income | |||||||||||
| Refining (b) | $ | 535 | $ | 1,871 | $ | 1,193 | |||||
| TLLP (c) | 487 | 393 | 164 | ||||||||
| Marketing (b) | 830 | 899 | 553 | ||||||||
| Total Segment Operating Income | 1,852 | 3,163 | 1,910 | ||||||||
| Corporate and unallocated costs | (371 | ) | (336 | ) | (278 | ) | |||||
| Operating Income | 1,481 | 2,827 | 1,632 | ||||||||
| Interest and financing costs, net | (274 | ) | (217 | ) | (235 | ) | |||||
| Equity in earnings of equity method investments | 13 | 7 | 10 | ||||||||
| Other income, net | 57 | 13 | 57 | ||||||||
| Earnings Before Income Taxes | $ | 1,277 | $ | 2,630 | $ | 1,464 | |||||
| Depreciation and Amortization Expense | |||||||||||
| Refining | $ | 588 | $ | 504 | $ | 420 | |||||
| TLLP | 190 | 187 | 85 | ||||||||
| Marketing | 49 | 46 | 42 | ||||||||
| Corporate | 24 | 19 | 15 | ||||||||
| Total Depreciation and Amortization Expense | $ | 851 | $ | 756 | $ | 562 | |||||
| Capital Expenditures | |||||||||||
| Refining | $ | 519 | $ | 530 | $ | 423 | |||||
| TLLP | 273 | 386 | 272 | ||||||||
| Marketing | 34 | 34 | 54 | ||||||||
| Corporate | 122 | 56 | 30 | ||||||||
| Total Capital Expenditures | $ | 948 | $ | 1,006 | $ | 779 | |||||
| (a) | Federal and state motor fuel taxes on sales by our Marketing segment are included in both revenues and cost of sales in our statements of consolidated operations. These taxes totaled $577 million, $561 million and $581 million for the years ended December 31, 2016, 2015 and 2014, respectively. |
| (b) | Our Refining segment uses RINs to satisfy its obligations under the Renewable Fuels Standard, in addition to physically blending required biofuels. At the end of 2014, given the price of RINs had become more transparent in the price of biofuels, we determined our intersegment pricing methodology should include the market value of RINs as a reduction to the price our Marketing segment pays to our Refining segment. We made this change effective January 1, 2015. We have not adjusted financial information presented for our Refining and Marketing segments for the year ended December 31, 2014. Had we made this change effective January 1, 2014, operating income in our Refining segment would have been reduced by $125 million with a corresponding increase to operating income in our Marketing segment for the year ended December 31, 2014. |
| (c) | We present TLLP’s segment operating income net of general and administrative expenses totaling $53 million, $54 million and $39 million representing TLLP’s corporate costs that are not allocated to TLLP’s operating segments for the years ended December 31, 2016, 2015 and 2014, respectively. |
110 | Tesoro Corporation | ||
| NOTES TO CONSOLIDATED FINANCIAL STATEMENTS | |
IDENTIFIABLE ASSETS RELATED TO CONTINUING OPERATIONS (in millions; intersegment balances have been eliminated)
| December 31, | |||||||
| 2016 | 2015 | ||||||
| Refining | $ | 10,350 | $ | 8,878 | |||
| TLLP | 5,759 | 5,046 | |||||
| Marketing | 1,295 | 1,167 | |||||
| Corporate | 2,994 | 1,241 | |||||
| Total Assets | $ | 20,398 | $ | 16,332 | |||
NOTE 20 – QUARTERLY FINANCIAL DATA (UNAUDITED)
SUMMARY OF QUARTERLY FINANCIAL DATA (in millions, except per share amounts)
| Quarters | Total Year | ||||||||||||||||||
| First | Second | Third | Fourth | ||||||||||||||||
| 2016 | |||||||||||||||||||
| Revenues | $ | 5,101 | $ | 6,285 | $ | 6,544 | $ | 6,652 | $ | 24,582 | |||||||||
| Cost of sales (excluding the lower of cost or market inventory valuation adjustment) | 3,866 | 5,023 | 5,236 | 5,533 | 19,658 | ||||||||||||||
| Lower of cost or market inventory valuation adjustment | 147 | (363 | ) | (20 | ) | (123 | ) | (359 | ) | ||||||||||
| Operating expenses | 611 | 602 | 648 | 680 | 2,541 | ||||||||||||||
| Operating income | 179 | 718 | 360 | 224 | 1,481 | ||||||||||||||
| Net earnings from continuing operations | 98 | 449 | 202 | 101 | 850 | ||||||||||||||
| Gain (loss) from discontinued operations, net of tax | 11 | — | (1 | ) | — | 10 | |||||||||||||
| Net earnings | 109 | 449 | 201 | 101 | 860 | ||||||||||||||
| Net earnings attributable to Tesoro Corporation | 69 | 418 | 169 | 78 | 734 | ||||||||||||||
| Net earnings per share (a): | |||||||||||||||||||
| Basic | $ | 0.58 | $ | 3.50 | $ | 1.43 | $ | 0.67 | $ | 6.19 | |||||||||
| Diluted | $ | 0.57 | $ | 3.47 | $ | 1.42 | $ | 0.66 | $ | 6.12 | |||||||||
| 2015 | |||||||||||||||||||
| Revenues | $ | 6,463 | $ | 8,232 | $ | 7,743 | $ | 6,273 | $ | 28,711 | |||||||||
| Cost of sales (excluding the lower of cost or market inventory valuation adjustment) | 5,310 | 6,357 | 5,433 | 4,828 | 21,928 | ||||||||||||||
| Lower of cost or market inventory valuation adjustment | (42 | ) | — | 83 | 276 | 317 | |||||||||||||
| Operating expenses | 574 | 596 | 636 | 649 | 2,455 | ||||||||||||||
| Operating income | 340 | 1,009 | 1,292 | 186 | 2,827 | ||||||||||||||
| Net earnings from continuing operations | 188 | 624 | 799 | 83 | 1,694 | ||||||||||||||
| Loss from discontinued operations, net of tax | — | (4 | ) | — | — | (4 | ) | ||||||||||||
| Net earnings | 188 | 620 | 799 | 83 | 1,690 | ||||||||||||||
| Net earnings attributable to Tesoro Corporation | 145 | 582 | 759 | 54 | 1,540 | ||||||||||||||
| Net earnings per share (a): | |||||||||||||||||||
| Basic | $ | 1.17 | $ | 4.64 | $ | 6.19 | $ | 0.46 | $ | 12.50 | |||||||||
| Diluted | $ | 1.15 | $ | 4.59 | $ | 6.13 | $ | 0.45 | $ | 12.36 | |||||||||
| (a) | Includes earnings attributable to Tesoro from continuing and discontinued operations. The sum of four quarters may not equal annual results due to rounding or the quarterly number of shares outstanding. |
December 31, 2016 | 111 | ||
| NOTES TO CONSOLIDATED FINANCIAL STATEMENTS | ||
NOTE 21 – CONDENSED CONSOLIDATING FINANCIAL INFORMATION
Separate condensed consolidating financial information of Tesoro Corporation (the “Parent”), subsidiary guarantors and non-guarantors are presented below. At December 31, 2016, Tesoro and certain subsidiary guarantors have fully and unconditionally guaranteed our 2017 Notes, 2022 Notes, 2023 Notes, 2024 Notes and 2026 Notes. TLLP, in which we had a 34% ownership interest as of December 31, 2016, and other subsidiaries have not guaranteed these obligations. As a result of these guarantee arrangements, we are required to present the following condensed consolidating financial information, which should be read in conjunction with the accompanying consolidated financial statements and notes thereto. This information is provided as an alternative to providing separate financial statements for guarantor subsidiaries. Separate financial statements of Tesoro’s subsidiary guarantors are not included because the guarantees are full and unconditional and these subsidiary guarantors are 100% owned and are jointly and severally liable for Tesoro’s outstanding senior notes. The information is presented using the equity method of accounting for investments in subsidiaries. Certain intercompany and intracompany transactions between subsidiaries are presented gross and eliminated in the consolidating adjustments column. Additionally, the results of operations of the Hawaii Business have been reported as discontinued operations in these condensed consolidating statements of operations and comprehensive income for the years ended December 31, 2016, 2015 and 2014.
CONDENSED CONSOLIDATING STATEMENT OF OPERATIONS AND
COMPREHENSIVE INCOME FOR THE YEAR ENDED DECEMBER 31, 2016
(In millions)
| Parent | Guarantor Subsidiaries | Non- Guarantors | Consolidating Adjustments | Consolidated | |||||||||||
| Revenues | $ | — | $ | 26,880 | $ | 3,654 | $ | (5,952 | ) | $ | 24,582 | ||||
| Costs and Expenses | |||||||||||||||
| Cost of sales (excluding the lower of cost or market inventory valuation adjustment) | — | 23,048 | 2,220 | (5,610 | ) | 19,658 | |||||||||
| Lower of cost or market inventory valuation adjustment | — | (359 | ) | — | — | (359 | ) | ||||||||
| Operating, selling, general and administrative expenses | 9 | 2,573 | 702 | (342 | ) | 2,942 | |||||||||
| Depreciation and amortization expense | — | 625 | 226 | — | 851 | ||||||||||
| Loss on asset disposals and impairments | — | 6 | 3 | — | 9 | ||||||||||
| Operating Income (Loss) | (9 | ) | 987 | 503 | — | 1,481 | |||||||||
| Equity in earnings of subsidiaries | 792 | 211 | — | (1,003 | ) | — | |||||||||
| Interest and financing costs, net | (84 | ) | (61 | ) | (129 | ) | — | (274 | ) | ||||||
| Equity in earnings of equity method investments | — | — | 13 | — | 13 | ||||||||||
| Other income, net | 3 | 39 | 15 | — | 57 | ||||||||||
| Earnings Before Income Taxes | 702 | 1,176 | 402 | (1,003 | ) | 1,277 | |||||||||
| Income tax expense (benefit) (a) | (22 | ) | 353 | 96 | — | 427 | |||||||||
| Net Earnings from Continuing Operations | 724 | 823 | 306 | (1,003 | ) | 850 | |||||||||
| Earnings from discontinued operations, net of tax | 10 | — | — | — | 10 | ||||||||||
| Net Earnings | 734 | 823 | 306 | (1,003 | ) | 860 | |||||||||
| Less: Net earnings from continuing operations attributable to noncontrolling interest | — | — | 126 | — | 126 | ||||||||||
| Net Earnings Attributable to Tesoro Corporation | $ | 734 | $ | 823 | $ | 180 | $ | (1,003 | ) | $ | 734 | ||||
| Comprehensive Income | |||||||||||||||
| Total Comprehensive Income | $ | 695 | $ | 823 | $ | 306 | $ | (1,003 | ) | $ | 821 | ||||
| Less: Noncontrolling Interest in Comprehensive Income | — | — | 126 | — | 126 | ||||||||||
| Comprehensive Income Attributable to Tesoro Corporation | $ | 695 | $ | 823 | $ | 180 | $ | (1,003 | ) | $ | 695 | ||||
| (a) | The income tax expense (benefit) reflected in each column does not include any tax effect of the equity in earnings from corporate subsidiaries, but does include the tax effect of the corporate partners’ share of partnership income. |
112 | Tesoro Corporation | ||
| NOTES TO CONSOLIDATED FINANCIAL STATEMENTS | |
CONDENSED CONSOLIDATING STATEMENT OF OPERATIONS AND
COMPREHENSIVE INCOME FOR THE YEAR ENDED DECEMBER 31, 2015
(In millions)
| Parent | Guarantor Subsidiaries | Non- Guarantors | Consolidating Adjustments | Consolidated | |||||||||||
| Revenues | $ | — | $ | 31,645 | $ | 3,597 | $ | (6,531 | ) | $ | 28,711 | ||||
| Costs and Expenses | |||||||||||||||
| Cost of sales (excluding the lower of cost or market inventory valuation adjustment) | — | 25,753 | 2,415 | (6,240 | ) | 21,928 | |||||||||
| Lower of cost or market inventory valuation adjustment | — | 317 | — | — | 317 | ||||||||||
| Operating, selling, general and administrative expenses | 11 | 2,542 | 579 | (291 | ) | 2,841 | |||||||||
| Depreciation and amortization expense | — | 565 | 191 | — | 756 | ||||||||||
| Loss on asset disposals and impairments | — | 37 | 5 | — | 42 | ||||||||||
| Operating Income (Loss) | (11 | ) | 2,431 | 407 | — | 2,827 | |||||||||
| Equity in earnings of subsidiaries | 1,590 | 96 | — | (1,686 | ) | — | |||||||||
| Interest and financing costs, net | (45 | ) | (66 | ) | (106 | ) | — | (217 | ) | ||||||
| Equity in earnings of equity method investments | — | — | 7 | — | 7 | ||||||||||
| Other income (expense), net | 3 | 11 | (1 | ) | — | 13 | |||||||||
| Earnings Before Income Taxes | 1,537 | 2,472 | 307 | (1,686 | ) | 2,630 | |||||||||
| Income tax expense (benefit) (a) | (7 | ) | 891 | 52 | — | 936 | |||||||||
| Net Earnings from Continuing Operations | 1,544 | 1,581 | 255 | (1,686 | ) | 1,694 | |||||||||
| Loss from discontinued operations, net of tax | (4 | ) | — | — | — | (4 | ) | ||||||||
| Net Earnings | 1,540 | 1,581 | 255 | (1,686 | ) | 1,690 | |||||||||
| Less: Net earnings from continuing operations attributable to noncontrolling interest | — | — | 150 | — | 150 | ||||||||||
| Net Earnings Attributable to Tesoro Corporation | $ | 1,540 | $ | 1,581 | $ | 105 | $ | (1,686 | ) | $ | 1,540 | ||||
| Comprehensive Income | |||||||||||||||
| Total Comprehensive Income | $ | 1,540 | $ | 1,581 | $ | 255 | $ | (1,686 | ) | $ | 1,690 | ||||
| Less: Noncontrolling Interest in Comprehensive Income | — | — | 150 | — | 150 | ||||||||||
| Comprehensive Income Attributable to Tesoro Corporation | $ | 1,540 | $ | 1,581 | $ | 105 | $ | (1,686 | ) | $ | 1,540 | ||||
| (a) | The income tax expense (benefit) reflected in each column does not include any tax effect of the equity in earnings from corporate subsidiaries, but does include the tax effect of the corporate partners’ share of partnership income. |
December 31, 2016 | 113 | ||
| NOTES TO CONSOLIDATED FINANCIAL STATEMENTS | ||
CONDENSED CONSOLIDATING STATEMENT OF OPERATIONS AND
COMPREHENSIVE INCOME FOR THE YEAR ENDED DECEMBER 31, 2014
(In millions)
| Parent | Guarantor Subsidiaries | Non- Guarantors | Consolidating Adjustments | Consolidated | |||||||||||
| Revenues | $ | — | $ | 45,898 | $ | 6,153 | $ | (11,418 | ) | $ | 40,633 | ||||
| Costs and Expenses | |||||||||||||||
| Cost of sales (excluding the lower of cost or market inventory valuation adjustment) | — | 41,288 | 5,479 | (11,164 | ) | 35,603 | |||||||||
| Lower of cost or market inventory valuation adjustment | — | 42 | — | — | 42 | ||||||||||
| Operating, selling, general and administrative expenses | 10 | 2,632 | 402 | (254 | ) | 2,790 | |||||||||
| Depreciation and amortization expense | — | 472 | 90 | — | 562 | ||||||||||
| (Gain) loss on asset disposals and impairments | — | 8 | (4 | ) | — | 4 | |||||||||
| Operating Income (Loss) | (10 | ) | 1,456 | 186 | — | 1,632 | |||||||||
| Equity in earnings of subsidiaries | 903 | 2 | — | (905 | ) | — | |||||||||
| Interest and financing costs, net | (39 | ) | (126 | ) | (70 | ) | — | (235 | ) | ||||||
| Equity in earnings of equity method investments | — | 9 | 1 | — | 10 | ||||||||||
| Other income, net | 2 | 55 | — | — | 57 | ||||||||||
| Earnings Before Income Taxes | 856 | 1,396 | 117 | (905 | ) | 1,464 | |||||||||
| Income tax expense (benefit) (a) | (16 | ) | 525 | 38 | — | 547 | |||||||||
| Net Earnings from Continuing Operations | 872 | 871 | 79 | (905 | ) | 917 | |||||||||
| Loss from discontinued operations, net of tax | (29 | ) | — | — | — | (29 | ) | ||||||||
| Net Earnings | 843 | 871 | 79 | (905 | ) | 888 | |||||||||
| Less: Net earnings from continuing operations attributable to noncontrolling interest | — | — | 45 | — | 45 | ||||||||||
| Net Earnings Attributable to Tesoro Corporation | $ | 843 | $ | 871 | $ | 34 | $ | (905 | ) | $ | 843 | ||||
| Comprehensive Income | |||||||||||||||
| Total Comprehensive Income | $ | 746 | $ | 871 | $ | 79 | $ | (905 | ) | $ | 791 | ||||
| Less: Noncontrolling Interest in Comprehensive Income | — | — | 45 | — | 45 | ||||||||||
| Comprehensive Income Attributable to Tesoro Corporation | $ | 746 | $ | 871 | $ | 34 | $ | (905 | ) | $ | 746 | ||||
| (a) | The income tax expense (benefit) reflected in each column does not include any tax effect of the equity in earnings from corporate subsidiaries, but does include the tax effect of the corporate partners’ share of partnership income. |
114 | Tesoro Corporation | ||
| NOTES TO CONSOLIDATED FINANCIAL STATEMENTS | |
CONDENSED CONSOLIDATING BALANCE SHEET AS OF DECEMBER 31, 2016
(In millions)
| Parent | Guarantor Subsidiaries | Non- Guarantors | Consolidating Adjustments | Consolidated | |||||||||||
| ASSETS | |||||||||||||||
| Current Assets | |||||||||||||||
| Cash and cash equivalents | $ | — | $ | 2,576 | $ | 719 | $ | — | $ | 3,295 | |||||
| Receivables, net of allowance for doubtful accounts | 10 | 882 | 216 | — | 1,108 | ||||||||||
| Short-term receivables from affiliates | — | 171 | 28 | (199 | ) | — | |||||||||
| Inventories | — | 2,321 | 319 | — | 2,640 | ||||||||||
| Prepayments and other current assets | 50 | 298 | 23 | — | 371 | ||||||||||
| Total Current Assets | 60 | 6,248 | 1,305 | (199 | ) | 7,414 | |||||||||
| Net Property, Plant and Equipment | — | 6,183 | 3,793 | — | 9,976 | ||||||||||
| Investment in Subsidiaries | 9,201 | 785 | — | (9,986 | ) | — | |||||||||
| Long-Term Receivables from Affiliates | 3,326 | — | — | (3,326 | ) | — | |||||||||
| Long-Term Intercompany Note Receivable | — | — | 2,386 | (2,386 | ) | — | |||||||||
| Other Noncurrent Assets: | |||||||||||||||
| Acquired intangibles, net | — | 329 | 948 | — | 1,277 | ||||||||||
| Other, net | 46 | 1,138 | 549 | (2 | ) | 1,731 | |||||||||
| Total Other Noncurrent Assets | 46 | 1,467 | 1,497 | (2 | ) | 3,008 | |||||||||
| Total Assets | $ | 12,633 | $ | 14,683 | $ | 8,981 | $ | (15,899 | ) | $ | 20,398 | ||||
| LIABILITIES AND EQUITY | |||||||||||||||
| Current Liabilities | |||||||||||||||
| Accounts payable | $ | 6 | $ | 1,762 | $ | 264 | $ | — | $ | 2,032 | |||||
| Short-term payables to affiliates | — | 28 | 171 | (199 | ) | — | |||||||||
| Current maturities of debt | 450 | 14 | 1 | — | 465 | ||||||||||
| Other current liabilities | 99 | 853 | 106 | (1 | ) | 1,057 | |||||||||
| Total Current Liabilities | 555 | 2,657 | 542 | (200 | ) | 3,554 | |||||||||
| Long-Term Payables to Affiliates | — | 3,074 | 252 | (3,326 | ) | — | |||||||||
| Deferred Income Taxes | 1,428 | 2 | — | (2 | ) | 1,428 | |||||||||
| Debt | 2,321 | 94 | 4,053 | — | 6,468 | ||||||||||
| Long-Term Intercompany Note Payable | 2,386 | — | — | (2,386 | ) | — | |||||||||
| Other Noncurrent Liabilities | 479 | 289 | 53 | — | 821 | ||||||||||
| Equity-Tesoro Corporation | 5,464 | 8,567 | 1,419 | (9,985 | ) | 5,465 | |||||||||
| Equity-Noncontrolling Interest | — | — | 2,662 | — | 2,662 | ||||||||||
| Total Liabilities and Equity | $ | 12,633 | $ | 14,683 | $ | 8,981 | $ | (15,899 | ) | $ | 20,398 | ||||
December 31, 2016 | 115 | ||
| NOTES TO CONSOLIDATED FINANCIAL STATEMENTS | ||
CONDENSED CONSOLIDATING BALANCE SHEET AS OF DECEMBER 31, 2015
(In millions)
| Parent | Guarantor Subsidiaries | Non- Guarantors | Consolidating Adjustments | Consolidated | |||||||||||
| ASSETS | |||||||||||||||
| Current Assets | |||||||||||||||
| Cash and cash equivalents | $ | — | $ | 895 | $ | 47 | $ | — | $ | 942 | |||||
| Receivables, net of allowance for doubtful accounts | — | 626 | 166 | — | 792 | ||||||||||
| Short-term receivables from affiliates | — | 200 | 3 | (203 | ) | — | |||||||||
| Inventories | — | 1,971 | 331 | — | 2,302 | ||||||||||
| Prepayments and other current assets | 116 | 140 | 16 | (1 | ) | 271 | |||||||||
| Total Current Assets | 116 | 3,832 | 563 | (204 | ) | 4,307 | |||||||||
| Net Property, Plant and Equipment | — | 5,796 | 3,745 | — | 9,541 | ||||||||||
| Investment in Subsidiaries | 8,128 | 609 | — | (8,737 | ) | — | |||||||||
| Long-Term Receivables from Affiliates | 1,522 | — | — | (1,522 | ) | — | |||||||||
| Long-Term Intercompany Note Receivable | — | — | 1,626 | (1,626 | ) | — | |||||||||
| Other Noncurrent Assets: | |||||||||||||||
| Acquired intangibles, net | — | 234 | 977 | — | 1,211 | ||||||||||
| Other, net | 33 | 1,018 | 227 | (5 | ) | 1,273 | |||||||||
| Total Other Noncurrent Assets | 33 | 1,252 | 1,204 | (5 | ) | 2,484 | |||||||||
| Total Assets | $ | 9,799 | $ | 11,489 | $ | 7,138 | $ | (12,094 | ) | $ | 16,332 | ||||
| LIABILITIES AND EQUITY | |||||||||||||||
| Current Liabilities | |||||||||||||||
| Accounts payable | $ | — | $ | 1,390 | $ | 178 | $ | — | $ | 1,568 | |||||
| Short-term payables to affiliates | — | 3 | 200 | (203 | ) | — | |||||||||
| Current maturities of debt | — | 6 | — | — | 6 | ||||||||||
| Other current liabilities | 91 | 756 | 110 | (1 | ) | 956 | |||||||||
| Total Current Liabilities | 91 | 2,155 | 488 | (204 | ) | 2,530 | |||||||||
| Long-Term Payables to Affiliates | — | 1,293 | 229 | (1,522 | ) | — | |||||||||
| Deferred Income Taxes | 1,227 | — | — | (5 | ) | 1,222 | |||||||||
| Debt | 1,190 | 33 | 2,844 | — | 4,067 | ||||||||||
| Long-Term Intercompany Note Payable | 1,626 | — | — | (1,626 | ) | — | |||||||||
| Other Noncurrent Liabilities | 452 | 262 | 59 | — | 773 | ||||||||||
| Equity-Tesoro Corporation | 5,213 | 7,746 | 991 | (8,737 | ) | 5,213 | |||||||||
| Equity-Noncontrolling Interest | — | — | 2,527 | — | 2,527 | ||||||||||
| Total Liabilities and Equity | $ | 9,799 | $ | 11,489 | $ | 7,138 | $ | (12,094 | ) | $ | 16,332 | ||||
116 | Tesoro Corporation | ||
| NOTES TO CONSOLIDATED FINANCIAL STATEMENTS | |
CONDENSED CONSOLIDATING STATEMENT OF CASH FLOWS FOR THE YEAR ENDED DECEMBER 31, 2016
(In millions)
| Parent | Guarantor Subsidiaries | Non- Guarantors | Consolidating Adjustments | Consolidated | |||||||||||
| Cash Flows From (Used in) Operating Activities | |||||||||||||||
| Net cash from (used in) operating activities | $ | (33 | ) | $ | 1,006 | $ | 637 | $ | (306 | ) | $ | 1,304 | |||
| Cash Flows From (Used in) Investing Activities | |||||||||||||||
| Capital expenditures | — | (616 | ) | (278 | ) | — | (894 | ) | |||||||
| Acquisitions | — | (67 | ) | (346 | ) | — | (413 | ) | |||||||
| Deposits for acquisitions | — | — | (33 | ) | — | (33 | ) | ||||||||
| Proceeds from asset sales | 17 | — | 8 | — | 25 | ||||||||||
| Investment in subsidiaries | (321 | ) | (455 | ) | — | 776 | — | ||||||||
| Intercompany notes, net | (1,453 | ) | — | — | 1,453 | — | |||||||||
| Notes to general partner | — | — | (760 | ) | 760 | — | |||||||||
| Other investing activities | — | — | (2 | ) | — | (2 | ) | ||||||||
| Net cash used in investing activities | (1,757 | ) | (1,138 | ) | (1,411 | ) | 2,989 | (1,317 | ) | ||||||
| Cash Flows From (Used in) Financing Activities | |||||||||||||||
| Borrowings under revolving credit agreements | — | — | 1,451 | — | 1,451 | ||||||||||
| Repayments on revolving credit agreements | — | — | (1,426 | ) | — | (1,426 | ) | ||||||||
| Proceeds from debt offerings | 1,600 | — | 1,451 | — | 3,051 | ||||||||||
| Repayments of debt | — | (9 | ) | (251 | ) | — | (260 | ) | |||||||
| Dividend payments | (249 | ) | — | — | — | (249 | ) | ||||||||
| Proceeds from stock options exercised | 2 | — | — | — | 2 | ||||||||||
| Net proceeds from issuance of TLLP common units | — | — | 364 | — | 364 | ||||||||||
| Notes from general partner | 760 | — | — | (760 | ) | — | |||||||||
| Distributions to noncontrolling interest | — | — | (216 | ) | — | (216 | ) | ||||||||
| Purchases of common stock | (250 | ) | — | — | — | (250 | ) | ||||||||
| Taxes paid related to net share settlement of equity awards | (25 | ) | — | — | — | (25 | ) | ||||||||
| Contributions by parent | — | — | 776 | (776 | ) | — | |||||||||
| Net intercompany borrowings (repayments) | — | 1,822 | (369 | ) | (1,453 | ) | — | ||||||||
| Distributions to TLLP unitholders and general partner | — | — | (81 | ) | 81 | — | |||||||||
| Distributions from TLLP and general partner to TSO | — | — | (225 | ) | 225 | — | |||||||||
| Payments of debt issuance costs | (16 | ) | — | (21 | ) | — | (37 | ) | |||||||
| Other financing activities | (32 | ) | — | (7 | ) | — | (39 | ) | |||||||
| Net cash from financing activities | 1,790 | 1,813 | 1,446 | (2,683 | ) | 2,366 | |||||||||
| Increase in Cash and Cash Equivalents | — | 1,681 | 672 | — | 2,353 | ||||||||||
| Cash and Cash Equivalents, Beginning of Year | — | 895 | 47 | — | 942 | ||||||||||
| Cash and Cash Equivalents, End of Year | $ | — | $ | 2,576 | $ | 719 | $ | — | $ | 3,295 | |||||
December 31, 2016 | 117 | ||
| NOTES TO CONSOLIDATED FINANCIAL STATEMENTS | ||
CONDENSED CONSOLIDATING STATEMENT OF CASH FLOWS FOR THE YEAR ENDED DECEMBER 31, 2015
(In millions)
| Parent | Guarantor Subsidiaries | Non- Guarantors | Consolidating Adjustments | Consolidated | |||||||||||
| Cash Flows From (Used in) Operating Activities | |||||||||||||||
| Net cash from operating activities | $ | 11 | $ | 2,030 | $ | 293 | $ | (203 | ) | $ | 2,131 | ||||
| Cash Flows From (Used in) Investing Activities | |||||||||||||||
| Capital expenditures | — | (646 | ) | (384 | ) | — | (1,030 | ) | |||||||
| Acquisitions | — | (91 | ) | (6 | ) | — | (97 | ) | |||||||
| Intercompany notes, net | 1,041 | — | — | (1,041 | ) | — | |||||||||
| Notes to general partner | — | — | (250 | ) | 250 | — | |||||||||
| Other investing activities | — | (2 | ) | — | — | (2 | ) | ||||||||
| Net cash from (used in) investing activities | 1,041 | (739 | ) | (640 | ) | (791 | ) | (1,129 | ) | ||||||
| Cash Flows From (Used in) Financing Activities | |||||||||||||||
| Borrowings under revolving credit agreements | — | — | 476 | — | 476 | ||||||||||
| Repayments on revolving credit agreements | — | — | (431 | ) | — | (431 | ) | ||||||||
| Borrowings under term loan credit agreements | — | — | 250 | — | 250 | ||||||||||
| Repayments of debt | (398 | ) | (6 | ) | — | — | (404 | ) | |||||||
| Dividend payments | (228 | ) | — | — | — | (228 | ) | ||||||||
| Proceeds from stock options exercised | 13 | — | — | — | 13 | ||||||||||
| Net proceeds from issuance of TLLP common units | — | — | 99 | — | 99 | ||||||||||
| Notes from general partner | 250 | — | — | (250 | ) | — | |||||||||
| Distributions to noncontrolling interest | — | — | (182 | ) | — | (182 | ) | ||||||||
| Purchases of common stock | (644 | ) | — | — | — | (644 | ) | ||||||||
| Taxes paid related to net share settlement of equity awards | (45 | ) | — | — | — | (45 | ) | ||||||||
| Net intercompany borrowings (repayments) | — | (1,371 | ) | 330 | 1,041 | — | |||||||||
| Distributions to TLLP unitholders and general partner | — | — | (203 | ) | 203 | — | |||||||||
| Payments of debt issuance costs | — | — | (2 | ) | — | (2 | ) | ||||||||
| Excess tax benefits from stock-based compensation arrangements | — | 38 | — | — | 38 | ||||||||||
| Net cash from (used in) financing activities | (1,052 | ) | (1,339 | ) | 337 | 994 | (1,060 | ) | |||||||
| Decrease in Cash and Cash Equivalents | — | (48 | ) | (10 | ) | — | (58 | ) | |||||||
| Cash and Cash Equivalents, Beginning of Year | — | 943 | 57 | — | 1,000 | ||||||||||
| Cash and Cash Equivalents, End of Year | $ | — | $ | 895 | $ | 47 | $ | — | $ | 942 | |||||
118 | Tesoro Corporation | ||
| NOTES TO CONSOLIDATED FINANCIAL STATEMENTS | |
CONDENSED CONSOLIDATING STATEMENT OF CASH FLOWS FOR THE YEAR ENDED DECEMBER 31, 2014
(In millions)
| Parent | Guarantor Subsidiaries | Non- Guarantors | Consolidating Adjustments | Consolidated | |||||||||||
| Cash Flows From (Used in) Operating Activities | |||||||||||||||
| Net cash from (used in) operating activities | $ | (11 | ) | $ | 1,270 | $ | 208 | $ | (103 | ) | $ | 1,364 | |||
| Cash Flows From (Used in) Investing Activities | |||||||||||||||
| Capital expenditures | — | (443 | ) | (242 | ) | — | (685 | ) | |||||||
| Acquisitions | — | (17 | ) | (2,479 | ) | — | (2,496 | ) | |||||||
| Proceeds from asset sales | — | 4 | 14 | — | 18 | ||||||||||
| Intercompany notes, net | 441 | — | — | (441 | ) | — | |||||||||
| Notes to general partner | — | — | (243 | ) | 243 | — | |||||||||
| Other investing activities | — | (5 | ) | (4 | ) | — | (9 | ) | |||||||
| Net cash from (used in) investing activities | 441 | (461 | ) | (2,954 | ) | (198 | ) | (3,172 | ) | ||||||
| Cash Flows From (Used in) Financing Activities | |||||||||||||||
| Borrowings under revolving credit agreements | — | — | 646 | — | 646 | ||||||||||
| Repayments on revolving credit agreements | — | — | (386 | ) | — | (386 | ) | ||||||||
| Proceeds from debt offerings | 300 | — | 1,300 | — | 1,600 | ||||||||||
| Repayments of debt | (300 | ) | (3 | ) | (131 | ) | — | (434 | ) | ||||||
| Dividend payments | (141 | ) | — | — | — | (141 | ) | ||||||||
| Proceeds from stock options exercised | 19 | — | — | — | 19 | ||||||||||
| Net proceeds from issuance of TLLP common units | — | — | 949 | — | 949 | ||||||||||
| Notes from general partner | 243 | — | — | (243 | ) | — | |||||||||
| Distributions to noncontrolling interest | — | — | (96 | ) | — | (96 | ) | ||||||||
| Purchases of common stock | (500 | ) | — | — | — | (500 | ) | ||||||||
| Taxes paid related to net share settlement of equity awards | (22 | ) | — | — | — | (22 | ) | ||||||||
| Net intercompany borrowings (repayments) | — | (1,044 | ) | 603 | 441 | — | |||||||||
| Distributions to TLLP unitholders and general partner | — | — | (103 | ) | 103 | — | |||||||||
| Payments of debt issuance costs | (5 | ) | — | (19 | ) | — | (24 | ) | |||||||
| Excess tax benefits from stock-based compensation arrangements | — | 20 | — | — | 20 | ||||||||||
| Other financing activities | (24 | ) | — | (37 | ) | — | (61 | ) | |||||||
| Net cash from (used in) financing activities | (430 | ) | (1,027 | ) | 2,726 | 301 | 1,570 | ||||||||
| Decrease in Cash and Cash Equivalents | — | (218 | ) | (20 | ) | — | (238 | ) | |||||||
| Cash and Cash Equivalents, Beginning of Year | — | 1,161 | 77 | — | 1,238 | ||||||||||
| Cash and Cash Equivalents, End of Year | $ | — | $ | 943 | $ | 57 | $ | — | $ | 1,000 | |||||
December 31, 2016 | 119 | ||
| CHANGES AND DISAGREEMENTS, CONTROLS AND PROCEDURES, AND OTHER INFORMATION | ||
ITEM 9. CHANGES IN AND DISAGREEMENTS WITH ACCOUNTANTS ON ACCOUNTING AND FINANCIAL DISCLOSURE
None.
ITEM 9A. CONTROLS AND PROCEDURES
DISCLOSURE CONTROLS AND PROCEDURES
Our disclosure controls and procedures are designed to provide reasonable assurance that the information that we are required to disclose in reports we file under the Securities Exchange Act of 1934, as amended (“the Exchange Act”), is accumulated and appropriately communicated to management. There have been no significant changes in our internal controls over financial reporting (as defined by applicable SEC rules) during the quarter ended December 31, 2016, that have materially affected or are reasonably likely to materially affect our internal controls over financial reporting.
We carried out an evaluation required by Rule 13a-15(b) of the Exchange Act, under the supervision and with the participation of our management, including the Chief Executive Officer and Chief Financial Officer, of the effectiveness of the design and operation of our disclosure controls and procedures at the end of the reporting period covered by this report. Based upon that evaluation, the Chief Executive Officer and Chief Financial Officer concluded that our disclosure controls and procedures are effective.
MANAGEMENT REPORT ON INTERNAL CONTROL OVER FINANCIAL REPORTING
Management of Tesoro Corporation and its subsidiaries (the “Company”) is responsible for establishing and maintaining adequate internal control over financial reporting as defined in Rule 13a-15(f) of the Exchange Act. The Company’s internal control system is designed to provide reasonable assurance regarding the reliability of financial reporting and the preparation of financial statements for external purposes in accordance with generally accepted accounting principles in the United States of America. Due to its inherent limitations, internal control over financial reporting may not prevent or detect misstatements. Therefore, even those systems determined to be effective can provide only reasonable assurance with respect to financial statement preparation and presentation.
Management assessed the effectiveness of our internal control over financial reporting as of December 31, 2016, using the criteria set forth by the Committee of Sponsoring Organizations of the Treadway Commission in Internal Control — Integrated Framework (2013 framework). Based on such assessment, management concluded that, as of December 31, 2016, the Company’s internal control over financial reporting is effective.
The independent registered public accounting firm of Ernst & Young LLP, as auditors of the Company’s consolidated financial statements, has issued an attestation report on the effectiveness of the Company’s internal control over financial reporting, included herein.
ITEM 9B. OTHER INFORMATION
None.
120 | Tesoro Corporation | ||
| INTERNAL CONTROL | ||
REPORT OF INDEPENDENT REGISTERED PUBLIC ACCOUNTING FIRM
To the Board of Directors and Stockholders of
Tesoro Corporation
We have audited Tesoro Corporation’s internal control over financial reporting as of December 31, 2016, based on criteria established in Internal Control-Integrated Framework issued by the Committee of Sponsoring Organizations of the Treadway Commission (2013 framework) (the COSO criteria). Tesoro Corporation’s management is responsible for maintaining effective internal control over financial reporting, and for its assessment of the effectiveness of internal control over financial reporting included in the accompanying Management Report on Internal Control over Financial Reporting. Our responsibility is to express an opinion on the company’s internal control over financial reporting based on our audit.
We conducted our audit in accordance with the standards of the Public Company Accounting Oversight Board (United States). Those standards require that we plan and perform the audit to obtain reasonable assurance about whether effective internal control over financial reporting was maintained in all material respects. Our audit included obtaining an understanding of internal control over financial reporting, assessing the risk that a material weakness exists, testing and evaluating the design and operating effectiveness of internal control based on the assessed risk, and performing such other procedures as we considered necessary in the circumstances. We believe that our audit provides a reasonable basis for our opinion.
A company’s internal control over financial reporting is a process designed to provide reasonable assurance regarding the reliability of financial reporting and the preparation of financial statements for external purposes in accordance with generally accepted accounting principles. A company’s internal control over financial reporting includes those policies and procedures that (1) pertain to the maintenance of records that, in reasonable detail, accurately and fairly reflect the transactions and dispositions of the assets of the company; (2) provide reasonable assurance that transactions are recorded as necessary to permit preparation of financial statements in accordance with generally accepted accounting principles, and that receipts and expenditures of the company are being made only in accordance with authorizations of management and directors of the company; and (3) provide reasonable assurance regarding prevention or timely detection of unauthorized acquisition, use or disposition of the company’s assets that could have a material effect on the financial statements.
Because of its inherent limitations, internal control over financial reporting may not prevent or detect misstatements. Also, projections of any evaluation of effectiveness to future periods are subject to the risk that controls may become inadequate because of changes in conditions, or that the degree of compliance with the policies or procedures may deteriorate.
In our opinion, Tesoro Corporation maintained, in all material respects, effective internal control over financial reporting as of December 31, 2016, based on the COSO criteria.
We also have audited, in accordance with the standards of the Public Company Accounting Oversight Board (United States), the consolidated balance sheets of Tesoro Corporation as of December 31, 2016 and 2015, and the related consolidated statements of operations, comprehensive income, equity, and cash flows for each of the three years in the period ended December 31, 2016 and our report dated February 21, 2017 expressed an unqualified opinion thereon.
/s/ ERNST & YOUNG LLP
San Antonio, Texas
February 21, 2017
December 31, 2016 | 121 | ||
| DIRECTORS, EXECUTIVE OFFICERS, CORPORATE GOVERNANCE AND SECURITY OWNERSHIP | ||
PART III
ITEM 10. DIRECTORS, EXECUTIVE OFFICERS AND CORPORATE GOVERNANCE
Information regarding our executive officers appears in Item 1 of this Annual Report on Form 10-K.
Our Code of Business Conduct and our Code of Business Conduct and Ethics for Senior Financial Executives are available on our website at www.tsocorp.com.
The other information required under this Item is incorporated by reference to “Corporate Governance—The Board of Directors,” “Corporate Governance—Board Leadership and Committees” and “Stock Ownership Information” in our Proxy Statement for our 2017 Annual Meeting of Stockholders, to be filed with the SEC within 120 days of December 31, 2016 (the “2017 Proxy Statement”).
ITEM 11. EXECUTIVE COMPENSATION
Information required under this Item is incorporated by reference to “Director Compensation,” “Corporate Governance—Compensation Committee Interlocks and Insider Participation,” “Compensation Discussion and Analysis” and “Executive Compensation” in our 2017 Proxy Statement.
ITEM 12. SECURITY OWNERSHIP OF CERTAIN BENEFICIAL OWNERS AND MANAGEMENT AND RELATED STOCKHOLDER MATTERS
EQUITY COMPENSATION PLAN INFORMATION
EQUITY COMPENSATION TO EMPLOYEES, OFFICERS, DIRECTORS AND OTHER PERSONS UNDER OUR EQUITY COMPENSATION PLANS, AS OF DECEMBER 31, 2016
| Plan Category | Number of Securities to be Issued Upon Exercise of Outstanding Options, Warrants and Rights | Weighted-Average Exercise Price of Outstanding Options, Warrants and Rights (a) | Number of Securities Remaining Available for Future Issuance under Equity Compensation Plans (b) | |||||||
| Equity compensation plans approved by security holders (c) | 3,066,465 | $ | 45.35 | 3,073,672 | ||||||
| Equity compensation plans not approved by security holders (d) | 151,513 | $ | 13.09 | — | ||||||
| Total | 3,217,978 | $ | 23.20 | 3,073,672 | ||||||
| (a) | Includes only the exercise price for options to purchase common stock. No value is included in this column for restricted stock units, performance share awards or market stock units since they do not have an exercise, or strike, price. |
| (b) | For illustrative purposes, a maximum payout (i.e., a 200% ratio) has been assumed for vesting and payout of outstanding performance share awards and market stock unit grants. |
| (c) | The number of securities to be issued upon exercise under these approved plans includes 122,755 options to purchase common stock, 46,932 restricted stock units, 756,050 performance share awards, and 2,140,728 market stock units. Each performance share award and market stock unit shown in the table represents a right to receive (upon vesting and payout) a specified number of our common shares. Vesting and payout may be conditioned upon achievement of pre-determined performance objectives or only upon continued service with us and our affiliates. For illustrative purposes, the maximum payout (i.e., a 200% ratio) provided by the provisions of the award agreements has been assumed for vesting and payout of performance share awards and market stock unit grants. Payout at target levels (i.e., a 100% ratio) would result in 1,618,076 securities to be issued and 4,524,302 securities remaining available for future issuance under equity compensation plans. |
| (d) | Stock options granted in connection with the inducement awards of the CEO Agreement were not granted under an equity compensation plan. |
Additional information required under this Item is incorporated by reference to “Stock Ownership Information” in our 2017 Proxy Statement.
122 | Tesoro Corporation | ||
| DIRECTORS, EXECUTIVE OFFICERS, CORPORATE GOVERNANCE AND SECURITY OWNERSHIP |
ITEM 13. CERTAIN RELATIONSHIPS AND RELATED TRANSACTIONS AND DIRECTOR INDEPENDENCE
Information required under this Item is incorporated by reference to “Corporate Governance—Director Independence” and “Transactions with Related Parties” in our 2017 Proxy Statement.
ITEM 14. PRINCIPAL ACCOUNTING FEES AND SERVICES
Information required under this Item is incorporated by reference to “Auditor Fees and Services” in our 2017 Proxy Statement.
December 31, 2016 | 123 | ||
| EXHIBITS AND FINANCIAL STATEMENT SCHEDULES | ||
PART IV
ITEM 15. EXHIBITS AND FINANCIAL STATEMENT SCHEDULES
(a) 1. FINANCIAL STATEMENTS
The following consolidated financial statements of Tesoro Corporation and its subsidiaries are included in Part II, Item 8 of this Form 10-K:
| Page | |
| Report of Independent Registered Public Accounting Firm (Ernst & Young LLP) | |
| Statements of Consolidated Operations — Years Ended December 31, 2016, 2015 and 2014 | |
| Statements of Consolidated Comprehensive Income — Years Ended December 31, 2016, 2015 and 2014 | |
| Consolidated Balance Sheets — December 31, 2016 and 2015 | |
| Statements of Consolidated Equity — Years Ended December 31, 2016, 2015 and 2014 | |
| Statements of Consolidated Cash Flows — Years Ended December 31, 2016, 2015 and 2014 | |
| Notes to Consolidated Financial Statements | |
2. FINANCIAL STATEMENT SCHEDULES
No financial statement schedules are submitted because of the absence of the conditions under which they are required, the required information is insignificant or because the required information is included in the consolidated financial statements.
3. EXHIBITS
Incorporated by Reference (File No. 1-3473, unless otherwise indicated) | ||||||||
| Exhibit Number | Description of Exhibit | Form | Exhibit | Filing Date | ||||
| 2.1 | Stock Sale Agreement, dated March 18, 1998, among the Company, BHP Hawaii Inc. and BHP Petroleum Pacific Islands Inc. | S-3 (File No. 333-51789) | 2.1 | 5/4/1998 | ||||
| 2.2 | Stock Purchase Agreement, dated May 1, 1998, among Shell Refining Holding Company, Shell Anacortes Refining Company and the Company | 10-Q | 2.1 | 5/15/1998 | ||||
| 2.3 | Asset Purchase Agreement, dated July 16, 2001, by and among the Company, BP Corporation North America Inc. and Amoco Oil Company | 8-K | 2.1 | 9/21/2001 | ||||
| 2.4 | Asset Purchase Agreement, dated July 16, 2001, by and among the Company, BP Corporation North America Inc. and Amoco Oil Company | 8-K | 2.2 | 9/21/2001 | ||||
| 2.5 | Asset Purchase Agreement, dated July 16, 2001, by and among the Company, BP Corporation North America Inc. and BP Pipelines (North America) Inc. | 10-Q | 2.1 | 11/14/2001 | ||||
| 2.6 | Asset Purchase Agreement by and between the Company and Shell Oil Products U.S. dated as of January 29, 2007 | 8-K | 2.1 | 2/1/2007 | ||||
| 2.7 | Sale and Purchase Agreement for Golden Eagle Refining and Marketing Assets, dated February 4, 2002, by and among Ultramar Inc. and Tesoro Refining and Marketing Company, including First Amendment dated February 20, 2002 and related Purchaser Parent Guaranty dated February 4, 2002 | 10-K | 2.12 | 2/22/2002 | ||||
| 2.8 | Second Amendment to Sale and Purchase Agreement for Golden Eagle Refining and Marketing Assets, dated May 3, 2002 | 8-K | 2.1 | 5/9/2002 | ||||
| 2.9 | Asset Purchase and Sale Agreement by and between the Company and Shell Oil Products U.S. dated as of January 29, 2007 | 8-K | 2.2 | 2/1/2007 | ||||
| 2.10 | Purchase and Sale Agreement and Joint Escrow Instructions by and among the Company and USA Petroleum Corporation, USA Gasoline Corporation, Palisades Gas and Wash, Inc. and USA San Diego LLC dated as of January 26, 2007 | 8-K | 2.3 | 2/1/2007 | ||||
124 | Tesoro Corporation | ||
| EXHIBITS AND FINANCIAL STATEMENT SCHEDULES | ||
Incorporated by Reference (File No. 1-3473, unless otherwise indicated) | ||||||||
| Exhibit Number | Description of Exhibit | Form | Exhibit | Filing Date | ||||
| #2.11 | Letter Agreement to the Purchase and Sale Agreement and Joint Escrow Instructions dated April 30, 2007 between the Company and USA Petroleum Corporation, Palisades Gas and Wash, Inc. and USA San Diego, LLC | 10-Q | 2.1 | 8/7/2007 | ||||
| 2.12 | Purchase and Sale Agreement by and between Tesoro Refining and Marketing Company and the Sellers dated as of August 8, 2012 | 8-K | 2.1 | 8/13/2012 | ||||
| 2.13 | Amendment No. 1 to Purchase and Sale Agreement, dated September 13, 2012, among BP West Coast Products LLC, Atlantic Richfield Company, Arco Midcon LLC, Arco Terminal Services Corporation, Arco Material Supply Company, CH-Twenty, Inc., Products Cogeneration Company, Energy Global Investments (USA) Inc., and Tesoro Refining & Marketing Company LLC | 10-Q | 2.1 | 8/5/2013 | ||||
| 2.14 | Amendment No. 2 to Purchase and Sale Agreement, dated May 31, 2013, among BP West Coast Products LLC, Atlantic Richfield Company, Arco Midcon LLC, Arco Terminal Services Corporation, Arco Material Supply Company, CH-Twenty, Inc., Products Cogeneration Company, Energy Global Investments (USA) Inc., and Tesoro Refining & Marketing Company LLC | 10-Q | 2.2 | 8/5/2013 | ||||
| 2.15 | Amendment No. 3 to Purchase and Sale Agreement, dated May 31, 2013, among BP West Coast Products LLC, Atlantic Richfield Company, Arco Midcon LLC, Arco Terminal Services Corporation, Arco Material Supply Company, Products Cogeneration Company, Energy Global Investments (USA) Inc., and Tesoro Refining & Marketing Company LLC | 10-Q | 2.3 | 8/5/2013 | ||||
| 2.16 | Membership Interest Purchase Agreement, dated June 17, 2013, by and among Tesoro Corporation, Tesoro Hawaii, LLC, and Hawaii Pacific Energy, LLC (Schedules have been omitted pursuant to Item 601(b)(2) of Regulation S-K. Tesoro Corporation agrees to furnish supplementally a copy of such schedules, or any section thereof, to the SEC upon request.) | 10-Q | 2.4 | 8/5/2013 | ||||
| 2.17 | Agreement and Plan of Merger among Western Refining, Inc., Tesoro Corporation, Tahoe Merger Sub 1, Inc., and Tahoe Merger Sub 2, LLC, dated as of November 16, 2016 (Schedules have been omitted pursuant to Item 601(b)(2) of Regulation S-K. Tesoro Corporation agrees to furnish supplementally a copy of such schedules, or any section thereof, to the SEC upon request.) | 8-K | 2.1 | 11/18/2016 | ||||
| 3.1 | Restated Certificate of Incorporation of Tesoro Corporation, dated as of August 10, 2012 | S-3ASR (File No. 333-183872) | 3.1 | 9/13/2012 | ||||
| 3.2 | Amended and Restated Bylaws of Tesoro Corporation effective November 1, 2016 | 8-K | 3.1 | 10/25/2016 | ||||
| 3.3 | First Amended and Restated Agreement of Limited Partnership of Tesoro Logistics LP, dated April 26, 2011 | 8-K | 3.1 | 4/29/2011 | ||||
| 3.4 | Amendment No. 1 to Amended and Restated Agreement of Limited Partnership of Tesoro Logistics LP, dated as of December 2, 2014, entered into and effectuated by Tesoro Logistics GP, LLC | 8-K | 3.1 | 12/8/2014 | ||||
| 3.5 | Amendment No. 2 to First Amended and Restated Agreement of Limited Partnership of Tesoro Logistics LP, dated as of November 21, 2016, entered into and effectuated by Tesoro Logistics GP, LLC | 8-K | 3.1 | 11/21/2016 | ||||
| 4.1 | Indenture (including form of note), dated as of September 27, 2012, among Tesoro Corporation, the guarantors named therein and U.S. Bank National Association, as trustee, relating to the 4.250% Senior Notes due 2017 and the 5.375% Senior Notes due 2022 | 8-K | 4.1 | 10/2/2012 | ||||
| 4.2 | Supplemental Indenture, dated as of February 27, 2013, among Tesoro Corporation, certain subsidiary guarantors and U.S. Bank National Association, as trustee, relating to the 4.250% Senior Notes due 2017 and 5.375% Senior Notes due 2022 | 10-Q | 4.1 | 5/3/2013 | ||||
| 4.3 | Supplemental Indenture, dated as of September 5, 2013, among Tesoro Corporation, certain subsidiary guarantors and U.S. Bank National Association, as trustee, relating to the 4.250% Senior Notes due 2017 and 5.375% Senior Notes due 2022 | 10-K | 4.6 | 2/24/2014 | ||||
| 4.4 | Supplemental Indenture, dated as of March 3, 2014, among Tesoro Corporation, certain subsidiary guarantors and U.S. Bank National Association, as trustee, relating to the 4.250% Senior Notes due 2017 and 5.375% Senior Notes due 2022 | 10-Q | 4.1 | 5/2/2014 | ||||
December 31, 2016 | 125 | ||
| EXHIBITS AND FINANCIAL STATEMENT SCHEDULES | ||
Incorporated by Reference (File No. 1-3473, unless otherwise indicated) | ||||||||
| Exhibit Number | Description of Exhibit | Form | Exhibit | Filing Date | ||||
| 4.5 | Supplemental Indenture, dated as of November 11, 2015, among Tesoro Corporation, certain subsidiary guarantors and U.S. Bank National Association, as trustee, relating to the 4.250% Senior Notes due 2017 and the 5.375% Senior Notes due 2022 | 10-K | 4.8 | 2/25/2016 | ||||
| 4.6 | Supplemental Indenture, dated as of January 7, 2016, among Tesoro Corporation, Tesoro Great Plains Holdings Company LLC, as new guarantor, and U.S. Bank National Association, as trustee, relating to the 4.250% Senior Notes due 2017 and the 5.375% Senior Notes due 2022 | 10-Q | 4.1 | 5/5/2016 | ||||
| 4.7 | Supplemental Indenture, dated as of April 26, 2016, among Tesoro Corporation, certain subsidiary guarantors, and U.S. Bank National Association, as trustee, relating to the 4.250% Senior Notes due 2017 and the 5.375% Senior Notes due 2022 | 10-Q | 4.3 | 8/4/2016 | ||||
| *4.8 | Supplemental Indenture, dated as of November 4, 2016, among Tesoro Corporation, certain subsidiary guarantors, and U.S. Bank National Association, as trustee, relating to the 4.250% Senior Notes due 2017 and the 5.375% Senior Notes due 2022 | |||||||
| 4.9 | Release, dated September 10, 2013, of Tesoro Hawaii, LLC and Smiley’s Super Service, Inc. from Indentures relating to the 9.750% Senior Notes due 2019, 4.250% Senior Notes due 2017 and 5.375% Senior Notes due 2022 | 10-K | 4.7 | 2/24/2014 | ||||
| 4.10 | Indenture (including form of note), dated as of March 18, 2014, among Tesoro Corporation, the guarantors named therein and U.S. Bank National Association, as trustee, relating to the 5.125% Senior Notes due 2024 | 8-K | 4.1 | 3/18/2014 | ||||
| 4.11 | Supplemental Indenture, dated as of November 11, 2015, among Tesoro Corporation, certain subsidiary guarantors and U.S. Bank National Association, as trustee, relating to the 5.125% Senior Notes due 2024 | 10-K | 4.11 | 2/25/2016 | ||||
| 4.12 | Supplemental Indenture, dated as of January 7, 2016, among Tesoro Corporation, Tesoro Great Plains Holdings Company LLC, as new guarantor, and U.S. Bank National Association, as trustee, relating to the 5.125% Senior Notes due 2024 | 10-Q | 4.2 | 5/5/2016 | ||||
| 4.13 | Supplemental Indenture, dated as of April 26, 2016, among Tesoro Corporation, certain subsidiary guarantors, and U.S. Bank National Association, as trustee, relating to the 5.125% Senior Notes due 2024 | 10-Q | 4.4 | 8/4/2016 | ||||
| *4.14 | Supplemental Indenture, dated as of November 4, 2016, among Tesoro Corporation, certain subsidiary guarantors, and U.S. Bank National Association, as trustee, relating to the 5.125% Senior Notes due 2024 | |||||||
| 4.15 | Release, dated December 6, 2013, of Tesoro SoCal Pipeline Company LLC from Indentures relating to the 9.750% Senior Notes due 2019, 4.250% Senior Notes due 2017 and 5.375% Senior Notes due 2022 | 10-K | 4.8 | 2/24/2014 | ||||
| 4.16 | Indenture (including form of Notes), dated as of December 22, 2016, among Tesoro Corporation, the guarantors named therein and U.S. Bank National Association, as trustee, relating to the 4.750% Senior Notes due 2023 and the 5.125% Senior Notes due 2026 | 8-K | 4.1 | 12/22/2016 | ||||
| 4.17 | Indenture, dated as of September 14, 2012, among Tesoro Logistics LP, Tesoro Logistics Finance Corp., the guarantors named therein and U.S. Bank National Association, as trustee, relating to the 5.875% Senior Notes due 2020 | 8-K | 4.1 | 9/17/2012 | ||||
| 4.18 | First Supplemental Indenture, dated as of January 24, 2013, among Tesoro Logistics LP, Tesoro Logistics Finance Corp., the guarantors named therein and U.S. Bank National Association, as trustee, relating to the 5.875% Senior Notes due 2020 | 10-K | 4.8 | 2/22/2013 | ||||
| 4.19 | Second Supplemental Indenture, dated as of December 9, 2013, among Tesoro SoCal Pipeline Company LLC, Tesoro Logistics LP, Tesoro Logistics Finance Corp., and U.S. Bank National Association, as trustee, relating to the 5.875% Senior Notes due 2020 | 10-K | 4.11 | 2/24/2014 | ||||
| 4.20 | Third Supplemental Indenture, dated as of December 17, 2013, among Tesoro Logistics LP, Tesoro Logistics Finance Corp., the guarantors named therein and U.S. Bank National Association, as trustee, relating to the 5.875% Senior Notes due 2020 | 8-K | 4.2 | 12/17/2013 | ||||
| 4.21 | Fourth Supplemental Indenture, dated as of October 8, 2014, among Tesoro Alaska Pipeline Company LLC, Tesoro Logistics LP, Tesoro Logistics Finance Corp., the guarantors named therein and U.S. National Bank Association, as trustee, relating to the 5.875% Senior Notes due 2020 | 10-Q | 4.6 | 10/31/2014 | ||||
126 | Tesoro Corporation | ||
| EXHIBITS AND FINANCIAL STATEMENT SCHEDULES | ||
Incorporated by Reference (File No. 1-3473, unless otherwise indicated) | ||||||||
| Exhibit Number | Description of Exhibit | Form | Exhibit | Filing Date | ||||
| 4.22 | Fifth Supplemental Indenture, dated as of January 8, 2015, among Tesoro Logistics LP, Tesoro Logistics Finance Corp., the guarantors named therein and U.S. National Bank Association, as trustee, relating to the 5.875% Senior Notes due 2020 | 10-K | 4.18 | 2/24/2015 | ||||
| 4.23 | Sixth Supplemental Indenture, dated as of May 21, 2015, among Tesoro Logistics LP, Tesoro Logistics Finance Corp., the guarantors named therein and U.S. Bank National Association, as trustee, relating to the 5.875% Senior Notes due 2020 | 10-Q | 4.3 | 8/6/2015 | ||||
| 4.24 | Indenture, dated as of August 1, 2013, among Tesoro Logistics LP, Tesoro Logistics Finance Corp., the guarantors named therein and U.S. Bank National Association, as trustee, relating to the 6.125% Senior Notes due 2021 | 8-K | 4.1 | 8/2/2013 | ||||
| 4.25 | First Supplemental Indenture, dated as of December 9, 2013, among Tesoro SoCal Pipeline Company LLC, Tesoro Logistics LP, Tesoro Logistics Finance Corp., and U.S. Bank National Association, as trustee, relating to the 6.125% Senior Notes due 2021 | 10-K | 4.15 | 2/24/2014 | ||||
| 4.26 | Second Supplemental Indenture, dated as of October 8, 2014, among Tesoro Alaska Pipeline Company LLC, Tesoro Logistics LP, Tesoro Logistics Finance Corp., the guarantors named therein and U.S. National Bank Association, as trustee, relating to the 6.125% Senior Notes due 2021 | 10-Q | 4.5 | 10/31/2014 | ||||
| 4.27 | Third Supplemental Indenture, dated as of January 8, 2015, among Tesoro Logistics LP, Tesoro Logistics Finance Corp., the guarantors named therein and U.S. National Bank Association, as trustee, relating to the 6.125% Senior Notes due 2021 | 10-K | 4.24 | 2/24/2015 | ||||
| 4.28 | Fourth Supplemental Indenture, dated as of May 21, 2015, among Tesoro Logistics LP, Tesoro Logistics Finance Corp., the guarantors named therein and U.S. Bank National Association, as trustee, relating to the 6.125% Senior Notes due 2021 | 10-Q | 4.2 | 8/6/2015 | ||||
| *4.29 | Fifth Supplemental Indenture, dated as of May 12, 2016, among Tesoro Logistics LP, Tesoro Logistics Finance Corp., the guarantors named therein and U.S. Bank National Association, as trustee, relating to the 6.125% Senior Notes due 2021 | |||||||
| 4.30 | Indenture, dated as of October 29, 2014, among Tesoro Logistics LP, Tesoro Logistics Finance Corp., the guarantors named therein and U.S. Bank National Association, as trustee | 10-Q | 4.3 | 10/31/2014 | ||||
| 4.31 | First Supplemental Indenture, dated as of December 2, 2014, among Tesoro Logistics LP, Tesoro Logistics Finance Corp., QEP Field Services, LLC, the other entities party thereto, and U.S. Bank National Association, as trustee | 8-K | 4.1 | 12/8/2014 | ||||
| 4.32 | Second Supplemental Indenture, dated as of May 21, 2015, among Tesoro Logistics LP, Tesoro Logistics Finance Corp., the guarantors named therein and U.S. Bank National Association, as trustee | 10-Q | 4.1 | 8/6/2015 | ||||
| *4.33 | Indenture, dated as of May 12, 2016, among Tesoro Logistics LP, Tesoro Logistics Finance Corp., the guarantors named therein and U.S. Bank National Association, as trustee, relating to the 6.375% Senior Notes due 2024 | |||||||
| *4.34 | Indenture, dated as of December 2, 2016, among Tesoro Logistics LP, Tesoro Logistics Finance Corp., the guarantors named therein and U.S. Bank National Association, as trustee, relating to the 5.25% Senior Notes due 2025 | |||||||
| 10.1 | Term Loan Credit Agreement, dated as of January 28, 2013, among Tesoro Corporation, JPMorgan Chase Bank, National Association, as administrative agent and collateral agent, and the lending institutions from time to time parties thereto | 8-K | 10.1 | 1/30/2013 | ||||
| 10.2 | Credit Agreement, dated as of September 30, 2016, among Tesoro Corporation, JP Morgan Chase Bank, N.A., as administrative agent, and the other lenders party thereto | 8-K | 10.1 | 10/3/2016 | ||||
| 10.3 | Amendment and Incremental Facility Agreement, dated as of December 13, 2016, to the Credit Agreement dated as of September 30, 2016, among Tesoro Corporation, JPMorgan Chase Bank, N.A., as administrative agent, and the other lenders party thereto | 8-K | 10.1 | 12/13/2016 | ||||
| 10.4 | Commitment Letter, dated November 16, 2016, among Tesoro Corporation, Goldman Sachs Bank USA and Goldman Sachs Lending Partners LLC | 8-K | 10.1 | 11/18/2016 | ||||
December 31, 2016 | 127 | ||
| EXHIBITS AND FINANCIAL STATEMENT SCHEDULES | ||
Incorporated by Reference (File No. 1-3473, unless otherwise indicated) | ||||||||
| Exhibit Number | Description of Exhibit | Form | Exhibit | Filing Date | ||||
| 10.5 | Amended and Restated Commitment Letter, dated November 29, 2016, among Tesoro Corporation, Goldman Sachs Bank USA, JPMorgan Chase Bank, N.A., Mizuho Bank, Ltd., The Bank of Tokyo-Mitsubishi UFJ, Ltd., a member of MUFG, a global financial group, Wells Fargo Bank, National Association, Wells Fargo Securities LLC, WF Investment Holdings LLC, SunTrust Bank, SunTrust Robinson Humphrey, Inc., UBS AG, Stamford Branch and UBS Securities LLC | 8-K | 10.1 | 12/2/2016 | ||||
| 10.6 | Third Amended and Restated Senior Secured Revolving Credit Agreement, dated as of January 29, 2016, among Tesoro Logistics LP, Bank of America, N.A., as administrative agent, and the other lenders party thereto | 8-K | 10.1 | 2/3/2016 | ||||
| 10.7 | Senior Secured Revolving Credit Agreement, dated as of January 29, 2016, among Tesoro Logistics LP, Bank of America, N.A., as administrative agent, and the other lenders party thereto | 8-K | 10.2 | 2/3/2016 | ||||
| 10.8 | Contribution, Conveyance and Assumption Agreement, dated as of November 12, 2015, among Tesoro Corporation, Tesoro Logistics GP, LLC, Tesoro Logistics Operations LLC, Tesoro SoCal Pipeline Company LLC, Tesoro Refining & Marketing Company LLC and Carson Cogeneration Company | 8-K | 2.1 | 11/12/2015 | ||||
| 10.9 | Contribution, Conveyance and Assumption Agreement, dated as of July 1, 2016, among Tesoro Logistics LP, Tesoro Logistics GP, LLC, Tesoro Logistics Operations LLC, Tesoro Alaska Company LLC and Tesoro Corporation | 8-K | 2.1 | 7/7/2016 | ||||
| 10.10 | Revision to the Contribution, Conveyance and Assumption Agreement, dated as of July 27, 2016, among Tesoro Logistics LP, Tesoro Logistics GP, LLC, Tesoro Logistics Operations LLC, Tesoro Alaska Company LLC and Tesoro Corporation | 10-Q | 2.2 | 11/2/2016 | ||||
| *10.11 | Revision to the Contribution, Conveyance and Assumption Agreement, dated as of November 21, 2016, by and among Tesoro Logistics LP, Tesoro Logistics GP, LLC, Tesoro Logistics Operations LLC, Tesoro Corporation and Tesoro Refining & Marketing Company LLC | |||||||
| 10.12 | Third Amended and Restated Omnibus Agreement, dated as of July 1, 2014, among Tesoro Corporation, Tesoro Refining & Marketing Company LLC, Tesoro Companies, Inc., Tesoro Alaska Company LLC, Tesoro Logistics LP and Tesoro Logistics GP, LLC | 8-K | 10.7 | 7/1/2014 | ||||
| 10.13 | Amendment No. 1 to the Third Amended and Restated Omnibus Agreement, dated as of February 20, 2015, among Tesoro Corporation, Tesoro Refining & Marketing Company LLC, Tesoro Companies, Inc., Tesoro Alaska Company LLC, Tesoro Logistics LP and Tesoro Logistics GP, LLC | 10-K | 10.21 | 2/24/2015 | ||||
| 10.14 | Amendment No. 2 to the Third Amended and Restated Omnibus Agreement, dated as of August 3, 2015, among Tesoro Corporation, Tesoro Refining & Marketing Company LLC, Tesoro Companies, Inc., Tesoro Alaska Company LLC, Tesoro Logistics LP, Tesoro Logistics GP, LLC and the other Tesoro entities named therein | 10-Q | 10.2 | 8/6/2015 | ||||
| 10.15 | First Amended and Restated Schedules to the Third Amended and Restated Omnibus Agreement, dated as of November 12, 2015, among Tesoro Corporation, Tesoro Refining & Marketing Company LLC, Tesoro Companies, Inc., Tesoro Alaska Company LLC, Tesoro Logistics LP, Tesoro Logistics GP, LLC and the other Tesoro entities named therein | 8-K | 10.1 | 11/12/2015 | ||||
| 10.16 | Second Amended and Restated Schedules to the Third Amended and Restated Omnibus Agreement, dated as of July 1, 2016, among Tesoro Logistics LP, Tesoro Logistics GP, LLC, Tesoro Corporation, Tesoro Refining & Marketing Company LLC, Tesoro Alaska Company LLC and Tesoro Companies, Inc. | 8-K | 10.2 | 7/7/2016 | ||||
| 10.17 | Third Amended and Restated Schedules to the Third Amended and Restated Omnibus Agreement, dated as of September 16, 2016, by and among Tesoro Corporation, Tesoro Refining & Marketing Company LLC, Tesoro Companies, Inc., Tesoro Alaska Company LLC, Tesoro Logistics LP and Tesoro Logistics GP, LLC | 8-K | 10.4 | 9/22/2016 | ||||
| 10.18 | Fourth Amended and Restated Schedules to the Third Amended and Restated Omnibus Agreement, dated as of November 21, 2016, by and among Tesoro Corporation, Tesoro Refining & Marketing Company LLC, Tesoro Companies, Inc., Tesoro Alaska Company LLC, Tesoro Logistics LP and Tesoro Logistics GP, LLC | 8-K | 10.1 | 11/21/2016 | ||||
| 10.19 | Transportation Services Agreement (Salt Lake City Short-Haul Pipelines), dated as of April 26, 2011, between Tesoro Refining and Marketing Company and Tesoro Logistics Operations LLC | 8-K | 10.4 | 4/29/2011 | ||||
128 | Tesoro Corporation | ||
| EXHIBITS AND FINANCIAL STATEMENT SCHEDULES | ||
Incorporated by Reference (File No. 1-3473, unless otherwise indicated) | ||||||||
| Exhibit Number | Description of Exhibit | Form | Exhibit | Filing Date | ||||
| 10.20 | Salt Lake City Storage and Transportation Services Agreement, dated as of April 26, 2011, between Tesoro Refining and Marketing Company and Tesoro Logistics Operations LLC | 8-K | 10.5 | 4/29/2011 | ||||
| 10.21 | Second Amended and Restated Master Terminalling Services Agreement, dated as of May 3, 2013, among Tesoro Refining & Marketing Company LLC, Tesoro Alaska Company and Tesoro Logistics Operations LLC | 10-Q | 10.5 | 8/5/2013 | ||||
| 10.22 | Amendment No. 1 to the Second Amended and Restated Master Terminalling Services Agreement dated as of September 16, 2016, by and among Tesoro Refining and Marketing Company LLC, Tesoro Alaska Company LLC and Tesoro Logistics Operations LLC | 8-K | 10.1 | 9/22/2016 | ||||
| 10.23 | Terminal Expansion Agreement, dated as of February 27, 2012, between Tesoro Logistics Operations LLC and Tesoro Refining and Marketing Company | 10-Q | 10.6 | 5/3/2012 | ||||
| 10.24 | Amorco Marine Terminal Use and Throughput Agreement, effective April 1, 2012, between Tesoro Refining and Marketing Company and Tesoro Logistics Operations, LLC | 8-K | 10.3 | 4/3/2012 | ||||
| 10.25 | Amended and Restated Long Beach Berth Access Use and Throughput Agreement, dated as of December 6, 2013, among Tesoro Refining & Marketing Company LLC, Tesoro Logistics GP, LLC, Tesoro Logistics LP and Tesoro Logistics Operations LLC | 8-K | 10.9 | 12/9/2013 | ||||
| 10.26 | Long Beach Operating Agreement, dated as of September 14, 2012, among Tesoro Logistics Operations LLC, Tesoro Logistics GP, LLC, Tesoro Logistics LP and Tesoro Refining and Marketing Company | 8-K | 10.5 | 9/17/2012 | ||||
| 10.27 | Transportation Services Agreement (Los Angeles Refinery Short-Haul Pipelines), executed as of September 14, 2012, among Tesoro Logistics Operations LLC, Tesoro Logistics GP, LLC, Tesoro Logistics LP and Tesoro Refining and Marketing Company | 8-K | 10.6 | 9/17/2012 | ||||
| 10.28 | Anacortes Track Use and Throughput Agreement, dated as of November 15, 2012, among Tesoro Logistics LP, Tesoro Logistics GP, LLC, Tesoro Refining and Marketing Company and Tesoro Logistics Operations LLC | 8-K | 10.3 | 11/15/2012 | ||||
| 10.29 | Amended and Restated Master Terminalling Services Agreement - Southern California, dated as of December 6, 2013, among Tesoro Refining & Marketing Company LLC, Tesoro Logistics GP, LLC, Tesoro Logistics LP and Tesoro Logistics Operations LLC | 8-K | 10.11 | 12/9/2013 | ||||
| 10.30 | Carson Storage Services Agreement, dated as of June 1, 2013, among Tesoro Logistics LP, Tesoro Logistics GP, LLC, Tesoro Refining & Marketing Company LLC and Tesoro Logistics Operations LLC | 8-K | 10.4 | 6/3/2013 | ||||
| 10.31 | Carson II Storage Services Agreement, dated as of November 12, 2015, by and between Tesoro Refining & Marketing Company LLC and Tesoro Logistics Operations LLC | 8-K | 10.2 | 11/12/2015 | ||||
| 10.32 | Long Beach Berth Throughput Agreement, dated as of December 6, 2013, among Carson Cogeneration Company, Tesoro Refining & Marketing Company LLC, Tesoro Logistics GP, LLC, Tesoro Logistics LP, and Tesoro Logistics Operations LLC | 8-K | 10.10 | 12/9/2013 | ||||
| 10.33 | Long Beach Storage Services Agreement, dated as of December 6, 2013, among Tesoro Refining & Marketing Company LLC, Tesoro Logistics GP, LLC, Tesoro Logistics LP and Tesoro Logistics Operations LLC | 8-K | 10.12 | 12/9/2013 | ||||
| 10.34 | Transportation Services Agreement (SoCal Pipelines), dated as of December 6, 2013, between Tesoro Refining & Marketing Company LLC and Tesoro SoCal Pipeline Company LLC | 8-K | 10.13 | 12/9/2013 | ||||
| 10.35 | Amendment No. 1 to Transportation Services Agreement (SoCal Pipelines), dated as of November 12, 2015, among Tesoro SoCal Pipeline Company LLC and Tesoro Refining & Marketing Company LLC | 8-K | 10.3 | 11/12/2015 | ||||
| 10.36 | Long Beach Pipeline Throughput Agreement (84/86 Pipelines), dated as of December 6, 2013, between the Operating Company and Tesoro Refining & Marketing Company LLC | 8-K | 10.14 | 12/9/2013 | ||||
| 10.37 | Berth 121 Operating Agreement, dated as of December 6, 2013, between Carson Cogeneration Company and Tesoro Logistics Operations LLC | 8-K | 10.5 | 12/9/2013 | ||||
December 31, 2016 | 129 | ||
| EXHIBITS AND FINANCIAL STATEMENT SCHEDULES | ||
Incorporated by Reference (File No. 1-3473, unless otherwise indicated) | ||||||||
| Exhibit Number | Description of Exhibit | Form | Exhibit | Filing Date | ||||
| 10.38 | Terminals 2 and 3 Operating Agreement, dated as of December 6, 2013, among Tesoro Refining & Marketing Company LLC, Tesoro Logistics GP, LLC, Tesoro Logistics LP and Tesoro Logistics Operations LLC | 8-K | 10.8 | 12/9/2013 | ||||
| 10.39 | Second Amended and Restated Representation and Services Agreement for Oil Spill Contingency Planning, Response and Remediation, dated as of September 16, 2016, by and among Tesoro Companies, Inc., Tesoro Maritime Company, Tesoro Refining & Marketing Company LLC, Tesoro Alaska Company LLC, Kenai Pipe Line Company, Tesoro Alaska Pipeline Company LLC, Carson Cogeneration Company, Tesoro Great Plains Midstream LLC, Tesoro Great Plains Gathering & Marketing LLC, BakkenLink Pipeline LLC, ND Land Holdings LLC, Tesoro Logistics Operations LLC, Tesoro High Plains Pipeline Company LLC, Tesoro Logistics Pipelines LLC, Tesoro Logistics Northwest Pipeline LLC, Tesoro SoCal Pipeline Company LLC, QEP Field Services, LLC, QEPM Gathering I, LLC, Green River Processing, LLC, Rendezvous Pipeline Company, LLC and Tesoro Alaska Terminals LLC | 8-K | 10.3 | 9/22/2016 | ||||
| 10.40 | Berth 121 Sublease Rights Agreement, dated as of December 6, 2013, among Carson Cogeneration Company, Tesoro Refining & Marketing Company LLC, Tesoro Logistics GP, LLC, Tesoro Logistics LP and Tesoro Logistics Operations LLC | 8-K | 10.4 | 12/9/2013 | ||||
| 10.41 | Terminal 2 Sublease Rights Agreement, dated as of December 6, 2013, among Tesoro Refining & Marketing Company LLC, Tesoro Logistics GP, LLC, Tesoro Logistics LP, and Tesoro Logistics Operations LLC | 8-K | 10.6 | 12/9/2013 | ||||
| 10.42 | Terminals 2 and 3 Ground Lease Rights Agreement, dated as of December 6, 2013, among Tesoro Refining & Marketing Company LLC, Tesoro Logistics GP, LLC, Tesoro Logistics LP and Tesoro Logistics Operations LLC | 8-K | 10.7 | 12/9/2013 | ||||
| 10.43 | Terminalling Services Agreement – Nikiski, dated as of July 1, 2014, among Tesoro Alaska Company LLC, Tesoro Logistics GP, LLC, Tesoro Logistics LP, and Tesoro Logistics Operations LLC | 8-K | 10.2 | 7/1/2014 | ||||
| 10.44 | Terminalling Services Agreement – Anacortes, dated as of July 1, 2014, among Tesoro Refining & Marketing Company LLC, Tesoro Logistics GP, LLC, Tesoro Logistics LP and Tesoro Logistics Operations LLC | 8-K | 10.3 | 7/1/2014 | ||||
| 10.45 | Amendment No. 1 to Anacortes Track Use and Throughput Agreement, dated as of July 1, 2014, between Tesoro Refining & Marketing Company LLC and Tesoro Logistics Operations LLC | 8-K | 10.4 | 7/1/2014 | ||||
| 10.46 | Terminalling Services Agreement – Martinez, dated as of July 1, 2014, among Tesoro Refining & Marketing Company LLC, Tesoro Logistics GP, LLC, Tesoro Logistics LP, and Tesoro Logistics Operations LLC | 8-K | 10.5 | 7/1/2014 | ||||
| 10.47 | Storage Services Agreement—Anacortes, dated as of July 1, 2014, among Tesoro Refining & Marketing Company LLC, Tesoro Logistics GP, LLC, Tesoro Logistics LP and Tesoro Logistics Operations LLC | 8-K | 10.6 | 7/1/2014 | ||||
| 10.48 | Secondment and Logistics Services Agreement, dated as of July 1, 2014, among Tesoro Refining & Marketing Company LLC, Tesoro Companies, Inc., Tesoro Alaska Company LLC, Tesoro Logistics GP, LLC, Tesoro Logistics Operations, LLC, Tesoro Logistics Pipelines LLC, Tesoro High Plains Pipeline Company LLC, Tesoro Logistics Northwest Pipeline LLC and Tesoro Alaska Pipeline Company LLC | 8-K | 10.8 | 7/1/2014 | ||||
| 10.49 | Amendment No. 1 to Secondment and Logistics Services Agreement, dated as of December 2, 2014, among Tesoro Refining & Marketing Company LLC, Tesoro Companies, Inc., Tesoro Alaska Company LLC, Tesoro Logistics GP, LLC, Tesoro Logistics Operations, LLC, Tesoro Logistics Pipelines LLC, Tesoro High Plains Pipeline Company LLC, Tesoro Logistics Northwest Pipeline LLC, Tesoro Alaska Pipeline Company LLC, QEP Field Services, LLC, QEP Midstream Partners GP, LLC, QEP Midstream Partners Operating, LLC, QEPM Gathering I, LLC, Rendezvous Pipeline Company, LLC and Green River Processing, LLC | 10-K | 10.49 | 2/24/2015 | ||||
130 | Tesoro Corporation | ||
| EXHIBITS AND FINANCIAL STATEMENT SCHEDULES | ||
Incorporated by Reference (File No. 1-3473, unless otherwise indicated) | ||||||||
| Exhibit Number | Description of Exhibit | Form | Exhibit | Filing Date | ||||
| 10.50 | Amendment No. 2 to Secondment and Logistics Services Agreement, dated as of March 31, 2016, among Tesoro Refining & Marketing Company LLC, Tesoro Companies Inc., Tesoro Alaska Company LLC, Tesoro Great Plains Midstream LLC, Tesoro Great Plains Gathering and Marketing LLC, BakkenLink Pipeline LLC, ND Land Holdings LLC, Tesoro Alaska Terminals LLC, Tesoro Logistics GP LLC, Tesoro Logistics Operations LLC, Tesoro Logistics Pipelines LLC, Tesoro High Plains Pipeline Company LLC, Tesoro Logistics Northwest Pipeline LLC, Tesoro Alaska Pipeline Company LLC, QEP Field Services LLC, QEP Midstream Partners Operating LLC, QEPM Gathering I LLC, Rendezvous Pipeline Company LLC, and Green River Processing LLC | 10-Q | 10.1 | 5/5/2016 | ||||
| 10.51 | Amendment No. 3 to Secondment and Logistics Services Agreement, dated as of November 21, 2016, among Tesoro Companies Inc., Tesoro Refining & Marketing Company LLC, Tesoro Alaska Company LLC, Tesoro Logistics GP, LLC, Tesoro Logistics Operations LLC, Tesoro Logistics Pipelines LLC, Tesoro High Plains Pipeline Company LLC, Tesoro Logistics Northwest Pipeline LLC, and Tesoro Alaska Pipeline Company LLC | 8-K | 10.5 | 11/21/2016 | ||||
| 10.52 | Carson Assets Indemnity Agreement, dated as of December 6, 2013, among Tesoro Corporation, Tesoro Refining & Marketing Company LLC, Tesoro Logistics GP, LLC, Tesoro Logistics LP and Tesoro Logistics Operations LLC | 8-K | 10.3 | 12/9/2013 | ||||
| 10.53 | Keep-Whole Commodity Fee Agreement, dated as of December 7, 2014, among Tesoro Refining & Marketing Company LLC, QEP Field Services, LLC, QEPM Gathering I, LLC and Green River Processing, LLC | 8-K | 4.2 | 12/8/2014 | ||||
| 10.54 | First Amendment to Keep-Whole Commodity Fee Agreement, dated as of February 1, 2016, among QEP Field Services, LLC, QEPM Gathering I, LLC, Green River Processing, LLC, and Tesoro Refining & Marketing Company LLC | 8-K | 10.3 | 2/3/2016 | ||||
| #10.55 | Agreement to Lease between Tesoro Refining and Marketing Company and Thrifty Oil Co. dated effective August 29, 2011 | 10-Q/A | 10.17 | 2/22/2012 | ||||
| 10.56 | License Agreement, dated as of November 12, 2015, among Tesoro Refining & Marketing Company LLC and Tesoro Logistics Operations LLC | 8-K | 10.4 | 11/12/2015 | ||||
| 10.57 | Agreement, dated effective as of February 19, 2016, between Tesoro Refining and Marketing Company LLC and Green River Processing, LLC, related to the back-to-back purchase and sale of waxy crude oil | 10-K | 10.104 | 2/25/2016 | ||||
| 10.58 | Ground Lease, dated as of July 1, 2016, between Tesoro Alaska Company LLC and Tesoro Logistics Operations LLC | 8-K | 10.1 | 7/7/2016 | ||||
| 10.59 | Kenai Storage Services Agreement, dated as of July 1, 2016, among Tesoro Alaska Company LLC, Tesoro Logistics Operations LLC, Tesoro Logistics GP, LLC and Tesoro Logistics LP | 8-K | 10.3 | 7/7/2016 | ||||
| 10.60 | Alaska Terminalling Services Agreement, dated as of September 16, 2016 by and among Tesoro Alaska Company LLC, Tesoro Logistics Operations LLC, Tesoro Alaska Terminals LLC, Tesoro Logistics GP, LLC and Tesoro Logistics LP | 8-K | 10.2 | 9/22/2016 | ||||
| 10.61 | Martinez Storage Services Agreement, dated as of November 21, 2016, by and among Tesoro Refining & Marketing Company LLC, Tesoro Logistics Operations LLC, Tesoro Logistics GP, LLC and Tesoro Logistics LP | 8-K | 10.2 | 11/21/2016 | ||||
| 10.62 | License Agreement, dated as of November 21, 2016, by and among Tesoro Refining & Marketing Company LLC and Tesoro Logistics Operations LLC | 8-K | 10.3 | 11/21/2016 | ||||
| 10.63 | Avon Marine Terminal Operating Agreement, dated as of November 21, 2016, by and among Tesoro Logistics Operations LLC, Tesoro Logistics GP, LLC, Tesoro Logistics LP and Tesoro Refining & Marketing Company LLC | 8-K | 10.4 | 11/21/2016 | ||||
| 10.64 | Sublease, dated as of November 21, 2016, by and among Tesoro Refining & Marketing Company LLC and Tesoro Logistics Operations LLC | 8-K | 10.6 | 11/21/2016 | ||||
| 10.65 | Avon Marine Terminal Use and Throughput Agreement, dated as of November 21, 2016, by and among Tesoro Logistics Operations LLC, Tesoro Logistics GP, LLC, Tesoro Logistics LP and Tesoro Refining & Marketing Company LLC | 8-K | 10.7 | 11/21/2016 | ||||
| 10.66 | Voting and Support Agreement by and among Western Refining, Inc., Tesoro Corporation, Tahoe Merger Sub 1, Inc., Tahoe Merger Sub 2, LLC, Paul L. Foster and Franklin Mountain Investments, dated as of November 16, 2016 | 8-K | 10.2 | 11/18/2016 | ||||
December 31, 2016 | 131 | ||
| EXHIBITS AND FINANCIAL STATEMENT SCHEDULES | ||
Incorporated by Reference (File No. 1-3473, unless otherwise indicated) | ||||||||
| Exhibit Number | Description of Exhibit | Form | Exhibit | Filing Date | ||||
| 10.67 | Voting and Support Agreement by and among Western Refining, Inc., Tesoro Corporation, Tahoe Merger Sub 1, Inc., Tahoe Merger Sub 2, LLC, and Jeff A. Stevens, dated as of November 16, 2016 | 8-K | 10.3 | 11/18/2016 | ||||
| 10.68 | Voting and Support Agreement by and among Western Refining, Inc., Tesoro Corporation, Tahoe Merger Sub 1, Inc., Tahoe Merger Sub 2, LLC, and Scott D. Weaver, dated as of November 16, 2016 | 8-K | 10.4 | 11/18/2016 | ||||
| †10.69 | Amended and Restated Executive Security Plan effective January 1, 2009 | 8-K | 10.1 | 12/18/2008 | ||||
| †10.70 | Amendment No. 1 to the Amended and Restated Executive Security Plan effective as of January 1, 2010 | 10-K | 10.8 | 3/1/2010 | ||||
| †10.71 | 2006 Long-Term Incentive Plan dated effective January 1, 2009 | 8-K | 10.4 | 12/18/2008 | ||||
| †10.72 | Tesoro Corporation Amended and Restated 2011 Long-Term Incentive Plan | DEF 14A | App. A | 3/21/2013 | ||||
| †10.73 | Description of 2015 Incentive Compensation Program | 10-K | 10.59 | 2/24/2015 | ||||
| †10.74 | Description of 2016 Incentive Compensation Program | 10-K | 10.63 | 2/25/2016 | ||||
| †10.75 | Tesoro Corporation 2006 Executive Deferred Compensation Plan effective January 1, 2009 | 8-K | 10.6 | 12/18/2008 | ||||
| †10.76 | Amendment No. 1 to the Tesoro Corporation Executive Deferred Compensation Plan effective January 1, 2011 | 10-K | 10.37 | 2/22/2013 | ||||
| †10.77 | Amendment No. 2 to the Tesoro Corporation Executive Deferred Compensation Plan effective January 1, 2011 | 10-K | 10.38 | 2/22/2013 | ||||
| †10.78 | Amended and Restated Tesoro Corporation Executive Deferred Compensation Plan effective January 1, 2016 | 10-Q | 10.4 | 10/29/2015 | ||||
| †10.79 | Tesoro Corporation Restoration Retirement Plan effective January 1, 2009 | 8-K | 10.5 | 12/18/2008 | ||||
| †10.80 | Amendment No. 1 to the Tesoro Corporation Restoration Retirement Plan effective January 1, 2010 | 10-K | 10.13 | 3/1/2010 | ||||
| †10.81 | 2006 Long-Term Stock Appreciation Rights Plan of Tesoro Corporation | 8-K | 10.1 | 2/8/2006 | ||||
| †10.82 | Tesoro Corporation 2014 Performance Share Award Grant Letter | 8-K | 10.1 | 2/7/2014 | ||||
| †10.83 | Tesoro Corporation 2015 Performance Share Award Grant Letter | 8-K | 10.1 | 2/17/2015 | ||||
| †10.84 | Tesoro Corporation 2016 Performance Share Award Grant Letter | 8-K | 10.4 | 2/3/2016 | ||||
| †10.85 | Tesoro Corporation 2014 Market Stock Unit Award Grant Letter | 8-K | 10.2 | 2/7/2014 | ||||
| †10.86 | Tesoro Corporation 2015 Market Stock Unit Award Grant Letter | 8-K | 10.2 | 2/17/2015 | ||||
| †10.87 | Tesoro Corporation 2016 Market Stock Unit Award Grant Letter | 8-K | 10.5 | 2/3/2016 | ||||
| †10.88 | Tesoro Corporation Performance Share Awards Granted in 2014 Summary of Key Provisions | 8-K | 10.3 | 2/7/2014 | ||||
| †10.89 | Tesoro Corporation Performance Share Awards Granted in 2015 Summary of Key Provisions | 8-K | 10.3 | 2/17/2015 | ||||
| †10.90 | Tesoro Corporation Performance Share Awards Granted in 2016 Summary of Key Provisions | 8-K | 10.6 | 2/3/2016 | ||||
| †10.91 | Tesoro Corporation Market Stock Unit Awards Granted in 2014 Summary of Key Provisions | 8-K | 10.4 | 2/7/2014 | ||||
| †10.92 | Tesoro Corporation Market Stock Unit Awards Granted in 2015 Summary of Key Provisions | 8-K | 10.4 | 2/17/2015 | ||||
| †10.93 | Tesoro Corporation Market Stock Unit Awards Granted in 2016 Summary of Key Provisions | 8-K | 10.7 | 2/3/2016 | ||||
132 | Tesoro Corporation | ||
| EXHIBITS AND FINANCIAL STATEMENT SCHEDULES | ||
Incorporated by Reference (File No. 1-3473, unless otherwise indicated) | ||||||||
| Exhibit Number | Description of Exhibit | Form | Exhibit | Filing Date | ||||
| †10.94 | Amended and Restated 1995 Non-Employee Director Stock Option Plan, as amended through March 15, 2000 | 10-Q | 10.2 | 5/15/2002 | ||||
| †10.95 | Amendment to the Company’s Amended and Restated 1995 Non-Employee Director Stock Option Plan | S-4 (File No. 333-92468) | 10.41 | 7/16/2002 | ||||
| †10.96 | Amendment to the Company’s 1995 Non-Employee Director Stock Option Plan effective as of May 11, 2004 | S-8 (File No. 333-120716) | 4.19 | 11/23/2004 | ||||
| †10.97 | Amended and Restated Board of Directors Deferred Compensation Plan effective May 1, 2009 | 10-Q | 10.1 | 11/9/2009 | ||||
| †10.98 | Board of Directors Deferred Compensation Trust dated February 23, 1995 | 10-K | 10(v) | 3/17/1995 | ||||
| †10.99 | Board of Directors Deferred Phantom Stock Plan effective January 1, 2009 | 8-K | 10.2 | 12/18/2008 | ||||
| †10.100 | 2005 Director Compensation Plan | DEF 14A | Exh. A | 4/1/2005 | ||||
| †10.101 | Tesoro Corporation Non-Employee Director Compensation Program | 10-Q | 10.1 | 5/8/2015 | ||||
| †10.102 | Tesoro Corporation Non-Employee Director Compensation Program | 10-K | 10.99 | 2/25/2016 | ||||
| †10.103 | Amended and Restated Tesoro Corporation Executive Severance and Change in Control Plan effective May 1, 2013 | 10-Q | 10.2 | 5/3/2013 | ||||
| †10.104 | Tesoro Corporation Supplemental Executive Retirement Plan effective January 12, 2011 | 8-K | 10.2 | 1/18/2011 | ||||
| †10.105 | Form of Indemnification Agreement between the Company and its officers | 8-K | 10.2 | 8/4/2008 | ||||
| †10.106 | Form of Indemnification Agreement between the Company and its directors | 8-K | 10.3 | 8/4/2008 | ||||
| *21.1 | Subsidiaries of the Company | |||||||
| *23.1 | Consent of Independent Registered Public Accounting Firm (Ernst & Young LLP) | |||||||
| *31.1 | Certification by Chief Executive Officer Pursuant to Section 302 of the Sarbanes-Oxley Act of 2002 | |||||||
| *31.2 | Certification by Chief Financial Officer Pursuant to Section 302 of the Sarbanes-Oxley Act of 2002 | |||||||
| *32.1 | Certification by Chief Executive Officer Pursuant to 18 U.S.C. Section 1350, as Adopted Pursuant to Section 906 of the Sarbanes-Oxley Act of 2002 | |||||||
| *32.2 | Certification by Chief Financial Officer Pursuant to 18 U.S.C. Section 1350, as Adopted Pursuant to Section 906 of the Sarbanes-Oxley Act of 2002 | |||||||
| **101.INS | XBRL Instance Document | |||||||
| **101.SCH | XBRL Taxonomy Extension Schema Document | |||||||
| **101.CAL | XBRL Taxonomy Extension Calculation Linkbase Document | |||||||
| **101.DEF | XBRL Taxonomy Extension Definition Linkbase Document | |||||||
| **101.LAB | XBRL Taxonomy Extension Label Linkbase Document | |||||||
| **101.PRE | XBRL Taxonomy Extension Presentation Linkbase Document | |||||||
| * | Filed herewith. |
| ** | Submitted electronically herewith. |
| † | Compensatory plan or arrangement. |
| # | Confidential treatment has been granted for certain portions of this Exhibit pursuant to a confidential treatment order granted by the Securities Exchange Commission. Such portions have been omitted and filed separately with the Securities Exchange Commission. |
December 31, 2016 | 133 | ||
| EXHIBITS AND FINANCIAL STATEMENT SCHEDULES | ||
As permitted by Item 601(b)(4)(iii)(A) of Regulation S-K, the Registrant has not filed with this Quarterly Report on Form 10-Q certain instruments defining the rights of holders of long-term debt of the Registrant and its subsidiaries because the total amount of securities authorized under any of such instruments does not exceed 10% of the total assets of the Registrant and its subsidiaries on a consolidated basis. The Registrant agrees to furnish a copy of any such agreements to the Securities and Exchange Commission upon request.
Copies of exhibits filed as part of this Form 10-K may be obtained by stockholders of record at a charge of $0.15 per page, minimum $5.00 each request. Direct inquiries to the Corporate Secretary, Tesoro Corporation, 19100 Ridgewood Pkwy, San Antonio, Texas, 78259-1828.
134 | Tesoro Corporation | ||
SIGNATURES
Pursuant to the requirements of the Securities Exchange Act of 1934, the registrant has duly caused this report to be signed on its behalf by the undersigned thereunto duly authorized.
| TESORO CORPORATION | ||
| /s/ GREGORY J. GOFF | ||
| Gregory J. Goff | ||
| President and Chief Executive Officer | ||
| (Principal Executive Officer) | ||
Dated: February 21, 2017
December 31, 2016 | 135 | ||
Pursuant to the requirements of the Securities Exchange Act of 1934, this report has been signed below by the following persons on behalf of the registrant and in the capacities and on the dates indicated.
| Signature | Title | Date |
| /s/ GREGORY J. GOFF | President, Chief Executive Officer and Chairman of the Board of Directors (Principal Executive Officer) | February 21, 2017 |
| Gregory J. Goff | ||
| /s/ STEVEN M. STERIN | Executive Vice President and Chief Financial Officer (Principal Financial Officer) | February 21, 2017 |
| Steven M. Sterin | ||
| /s/ BLANE W. PEERY | Vice President and Controller (Principal Accounting Officer) | February 21, 2017 |
| Blane W. Peery | ||
| /s/ SUSAN TOMASKY | Independent Lead Director | February 21, 2017 |
| Susan Tomasky | ||
| /s/ RODNEY F. CHASE | Director | February 21, 2017 |
| Rodney F. Chase | ||
| /s/ EDWARD G. GALANTE | Director | February 21, 2017 |
| Edward G. Galante | ||
| /s/ ROBERT W. GOLDMAN | Director | February 21, 2017 |
| Robert W. Goldman | ||
| /s/ DAVID LILLEY | Director | February 21, 2017 |
| David Lilley | ||
| /s/ MARY PAT MCCARTHY | Director | February 21, 2017 |
| Mary Pat McCarthy | ||
| /s/ J.W. NOKES | Director | February 21, 2017 |
| J.W. Nokes | ||
| /s/ WILLIAM H. SCHUMANN, III | Director | February 21, 2017 |
| William H. Schumann, III | ||
| /s/ MICHAEL E. WILEY | Director | February 21, 2017 |
| Michael E. Wiley | ||
| /s/ PATRICK Y. YANG | Director | February 21, 2017 |
| Patrick Y. Yang | ||
136 | Tesoro Corporation | ||