Exhibit 99.1

| April 30th, 2010 1Q 2010 Earnings |
| 2 Forward Looking Statements This Presentation includes forward-looking statements within the meaning of the Private Securities Litigation Reform Act of 1995. These statements relate to, among other things, projections of refining margins, throughput and operating costs. We have used the words "anticipate", "believe", "could", "estimate", "expect", "intend", "may", "plan", "predict", "project", "should", "will" and similar terms and phrases to identify forward-looking statements in this Presentation. Although we believe the assumptions upon which these forward-looking statements are based are reasonable, any of these assumptions could prove to be inaccurate and the forward-looking statements based on these assumptions could be incorrect. Our operations involve risks and uncertainties, many of which are outside our control, and any one of which, or a combination of which, could materially affect our results of operations and whether the forward-looking statements ultimately prove to be correct. Actual results and trends in the future may differ materially from those suggested or implied by the forward-looking statements depending on a variety of factors which are described in greater detail in our filings with the SEC. All future written and oral forward-looking statements attributable to us or persons acting on our behalf are expressly qualified in their entirety by the previous statements. We undertake no obligation to update any information contained herein or to publicly release the results of any revisions to any forward-looking statements that may be made to reflect events or circumstances that occur, or that we become aware of, after the date of this Presentation. |

| 3 2Q 2010 Guidance Pacific Northwest Mid-Pacific Mid-Continent California Throughput (mbpd) 75-85 70-80 85-95 240-250 Opex ($/bbl) $ 6.50 $ 3.00 $ 4.20 $ 6.85 $ in millions, unless noted Corporate/System Refining Depreciation $ 75 Corporate Expense $ 45 Interest Expense Before Interest Income $ 35 |

| 4 Net Income / (Loss) Net Income / (Loss) $ in millions, except per share amounts 1Q 2009 2Q 2009 3Q 2009 4Q 2009 1Q 2010 Refining $ 177 $ 7 $ 84 $ (213) $ (169) Retail (15) 4 53 41 24 Corporate and Unallocated (50) (47) (48) (50) (57) Interest and Financing Costs* (28) (41) (38) (28) (37) Interest Income and Other 1 2 - 1 - Income Tax (Provision) / Benefit (34) 30 (18) 70 84 Net Income / (Loss) $ 51 $ (45) $ 33 $ (179) $ (155) EPS (Diluted) $ 0.37 $ (0.33) $ 0.24 $ (1.30) $ (1.11) EPS (Diluted) * Interest and financing costs include foreign currency gains and losses |
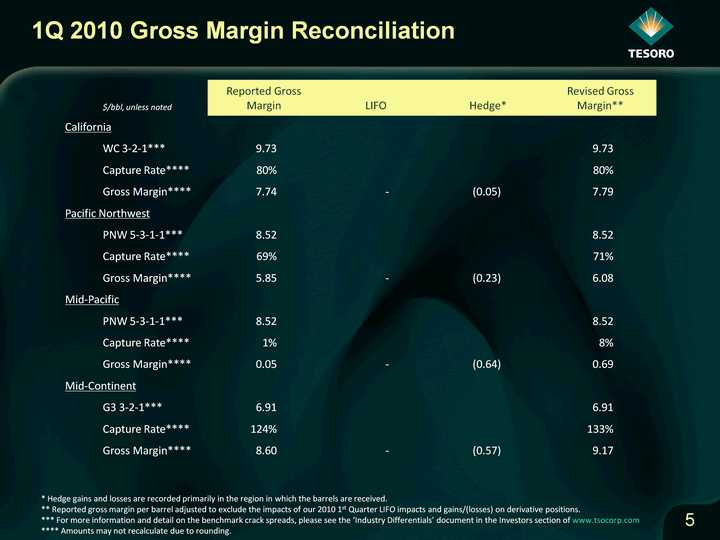
| 5 1Q 2010 Gross Margin Reconciliation $/bbl, unless noted Reported Gross Margin LIFO Hedge* Revised Gross Margin** California California WC 3-2-1*** 9.73 9.73 Capture Rate**** 80% 80% Gross Margin**** 7.74 - (0.05) 7.79 Pacific Northwest Pacific Northwest PNW 5-3-1-1*** 8.52 8.52 Capture Rate**** 69% 71% Gross Margin**** 5.85 - (0.23) 6.08 Mid-Pacific Mid-Pacific PNW 5-3-1-1*** 8.52 8.52 Capture Rate**** 1% 8% Gross Margin**** 0.05 - (0.64) 0.69 Mid-Continent Mid-Continent G3 3-2-1*** 6.91 6.91 Capture Rate**** 124% 133% Gross Margin**** 8.60 - (0.57) 9.17 * Hedge gains and losses are recorded primarily in the region in which the barrels are received. ** Reported gross margin per barrel adjusted to exclude the impacts of our 2009 4th Quarter LIFO impacts and gains/(losses) on derivative positions. *** For more information and detail on the benchmark crack spreads, please see the 'Industry Differentials' document in the Investors section of www.tsocorp.com **** Amounts may not recalculate due to rounding. |
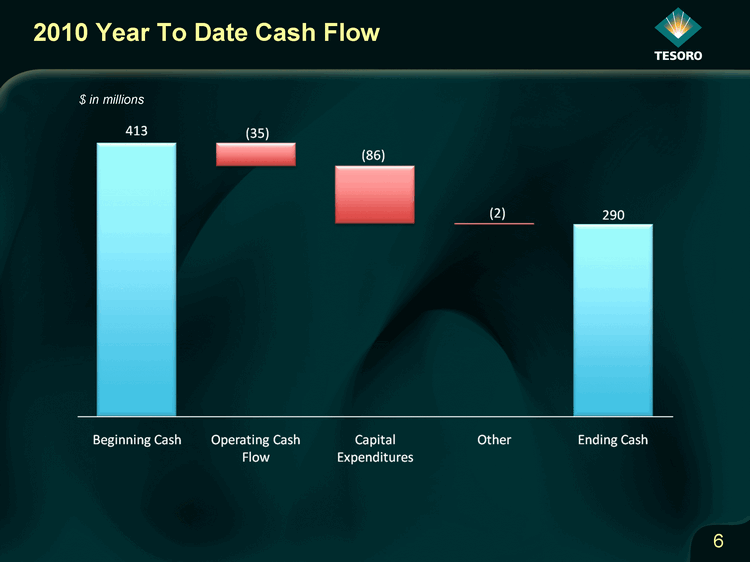
| 6 2010 Year To Date Cash Flow $ in millions |
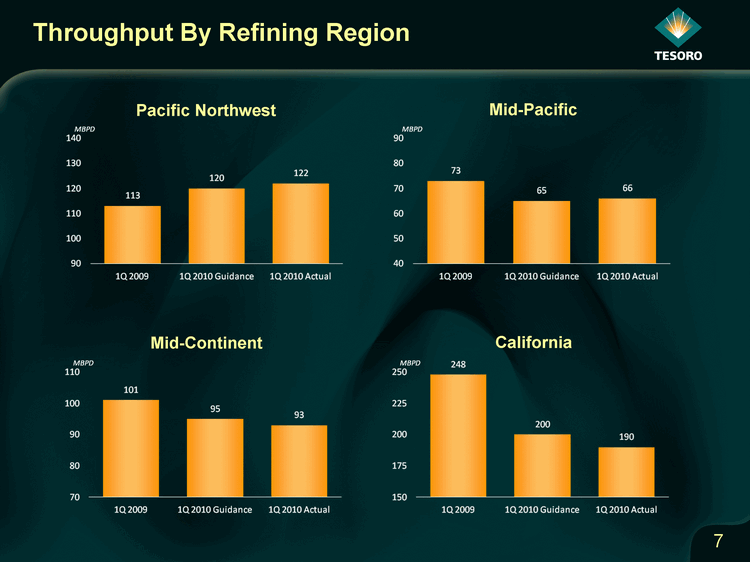
| 7 Throughput By Refining Region Pacific Northwest Mid-Pacific Mid-Continent California |
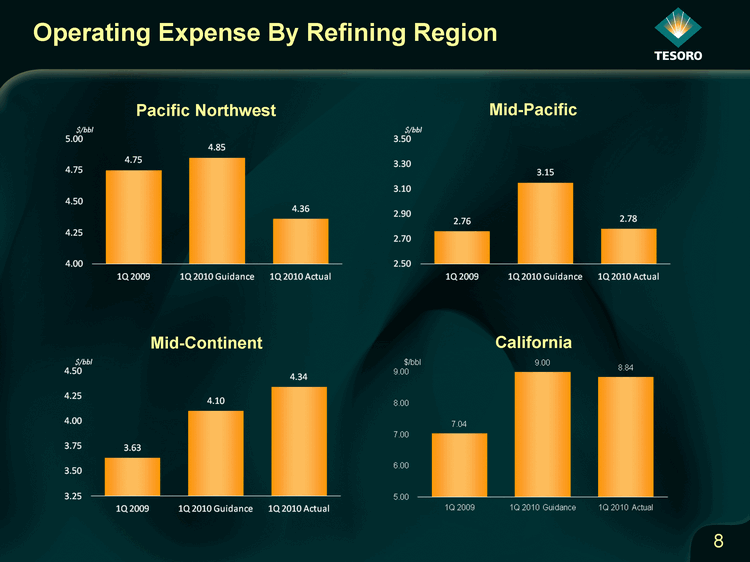
| 8 Operating Expense By Refining Region Pacific Northwest Mid-Pacific Mid-Continent California |