UNITED STATES
SECURITIES AND EXCHANGE COMMISSION
Washington, D.C. 20549
FORM N-CSR
Certified Shareholder Report of
Registered Management Investment Companies
Investment Company Act File Number: 811-02421
The Tax-Exempt Bond Fund of America
(Exact Name of Registrant as Specified in Charter)
333 South Hope Street
Los Angeles, California 90071
(Address of Principal Executive Offices)
Registrant's telephone number, including area code: (213) 486-9200
Date of fiscal year end: July 31
Date of reporting period: July 31, 2014
Courtney R. Taylor
The Tax-Exempt Bond Fund of America
333 South Hope Street
Los Angeles, California 90071
(Name and Address of Agent for Service)
Copies to:
Michael Glazer
Bingham McCutchen LLP
355 South Grand Avenue, Suite 4400
Los Angeles, California 90071
(Counsel for the Registrant)
ITEM 1 – Reports to Stockholders

Invest in municipal bonds
for tax-advantaged income.
| |  | American Funds Short-Term Tax-Exempt Bond Fund®
Limited Term Tax-Exempt Bond Fund of America®
The Tax-Exempt Bond Fund of America®
American High-Income Municipal Bond Fund®
The Tax-Exempt Fund of California®
American Funds Tax-Exempt Fund of New York® |
| | | |
| | | Annual reports for the period ended July 31, 2014 |
American Funds Short-Term Tax-Exempt Bond Fund seeks to provide current income exempt from regular federal income tax, consistent with the maturity and quality standards described in the prospectus, and to preserve capital.
Limited Term Tax-Exempt Bond Fund of America seeks to provide current income exempt from regular federal income tax, consistent with the maturity and quality standards described in the prospectus, and to preserve capital.
The Tax-Exempt Bond Fund of America seeks to provide a high level of current income exempt from federal income tax, consistent with preservation of capital.
American High-Income Municipal Bond Fund seeks to provide a high level of current income exempt from regular federal income tax.
The Tax-Exempt Fund of California seeks to provide a high level of current income exempt from regular federal and California state income taxes, with a secondary objective of preservation of capital.
American Funds Tax-Exempt Fund of New York seeks to provide a high level of current income exempt from regular federal, New York state and New York City income taxes, with a secondary objective of preservation of capital.
Each fund is one of more than 40 offered by one of the nation’s largest mutual fund families, American Funds, from Capital Group. For more than 80 years, Capital has invested with a long-term focus based on thorough research and attention to risk.
Fund results shown in this report, unless otherwise indicated, are for Class A shares at net asset value. If a sales charge had been deducted (maximum 2.50% for American Funds Short-Term Tax-Exempt Bond Fund and Limited Term Tax-Exempt Bond Fund of America; 3.75% for The Tax-Exempt Bond Fund of America, American High-Income Municipal Bond Fund, The Tax-Exempt Fund of California and American Funds Tax-Exempt Fund of New York), the results would have been lower. Results are for past periods and are not predictive of results for future periods. Current and future results may be lower or higher than those shown. Share prices and returns will vary, so investors may lose money. Investing for short periods makes losses more likely. Investments are not FDIC-insured, nor are they deposits of or guaranteed by a bank or any other entity, so they may lose value. For current information and month-end results, visit americanfunds.com.
Here are the total returns on a $1,000 investment with all distributions reinvested for periods ended June 30, 2014 (the most recent calendar quarter-end) and the total annual fund operating expense ratios as of the prospectus dated October 1, 2014 (unaudited):
| | | Cumulative
total returns | | Average annual
total returns | | Gross |
| Class A shares | | 1 year | | 5 years | | 10 years/Lifetime* | | expense ratios |
| | | | | | | | | |
| Reflecting 2.50% maximum sales charge | | | | | | | | | | | | |
| American Funds Short-Term Tax-Exempt Bond Fund | | -1.09 | % | | 1.05 | % | | 1.53 | % | | 0.58 | % |
| Limited Term Tax-Exempt Bond Fund of America | | 0.91 | | | 3.91 | | | 3.42 | | | 0.60 | |
| | | | | | | | | | | | | |
| Reflecting 3.75% maximum sales charge | | | | | | | | | | | | |
| The Tax-Exempt Bond Fund of America | | 2.34 | | | 5.44 | | | 4.17 | | | 0.56 | |
| American High-Income Municipal Bond Fund | | 3.99 | | | 8.02 | | | 4.41 | | | 0.68 | |
| The Tax-Exempt Fund of California | | 3.34 | | | 6.69 | | | 4.48 | | | 0.63 | |
| American Funds Tax-Exempt Fund of New York | | 1.20 | | | — | | | 3.47 | | | 0.73 | |
| * | Applicable only to American Funds Tax-Exempt Fund of New York, which began operations on 11/1/10. All other funds reflect 10-year results. |
For other share class results, visit americanfunds.com.
The five- and 10-year investment results for American Funds Short-Term Tax-Exempt Bond Fund include the fund’s results as a money market fund through the date of its conversion (August 7, 2009) to a short-term tax-exempt bond fund, and therefore are not representative of the fund’s results had it operated as a short-term tax-exempt bond fund for the full term of those periods. Investment results assume all distributions are reinvested and reflect applicable fees and expenses. When applicable, investment results reflect expense reimbursements for American Funds Tax-Exempt Fund of New York, without which results would have been lower. The investment adviser is currently reimbursing a portion of other expenses for American Funds Tax-Exempt Fund of New York. This reimbursement will be in effect through at least September 30, 2014, unless modified or terminated by the fund’s board. The adviser may elect at its discretion to extend, modify or terminate the reimbursement at that time. Visit americanfunds.com for more information.
A summary of each fund’s 30-day yield can be found on page 3.

Individual funds are listed in this report according to their risk potential, with the lowest risk funds listed first.
Fellow investors:
We are pleased to present you with this annual report for six American Funds municipal bond funds: American Funds Short-Term Tax-Exempt Bond Fund, Limited Term Tax-Exempt Bond Fund of America, The Tax-Exempt Bond Fund of America, American High-Income Municipal Bond Fund, The Tax-Exempt Fund of California and American Funds Tax-Exempt Fund of New York. This report covers results from August 1, 2013, through July 31, 2014, the conclusion of the funds’ fiscal year.
Municipal bond investors experienced a healthy market environment for much of the period, as tax-exempt securities rebounded from a turbulent 2013. Mixed economic news and geopolitical conflict drove renewed interest in fixed-income investments. Relatively attractive valuations for municipal bonds and a favorable supply-demand imbalance helped perpetuate the rally.
All six funds generated positive results. Total returns ranged from 1.43% for American Funds Short-Term Tax-Exempt Bond Fund to 9.99% for American High-Income Municipal Bond Fund. (See pages 4 through 16 for fund-specific results and information.)
Rebounding after a volatile 2013
At the start of the funds’ fiscal year last August, prices for most types of tax-exempt bonds were depressed, as investors fled fixed-income securities on concerns that the Federal Reserve would begin reducing its bond purchasing programs and that interest rates would gradually begin to rise. Shortly before the start of the fiscal year, the yield on the benchmark 10-year U.S. Treasury bond had reached its highest level in two years. Municipal bond investors were further unnerved by news coverage of the fiscal troubles facing Detroit and Puerto Rico.
By September, however, a turnaround in the Treasury market and attractive yields for most types of tax-exempt bonds helped trigger a rebound in the municipal market. In the early months of 2014, weather-related weakness in the U.S. economy, growing tensions in the Middle East and Ukraine, and turbulence in a number of overseas markets provided additional momentum for the broad bond market rally, as investors sought the relative safety of Treasuries and other fixed-income securities.
In general, municipal bonds delivered stronger returns than many types of taxable bonds, thanks in part to attractive valuations for tax-exempt bonds both in absolute terms and relative to Treasury securities at the beginning of the fiscal year. While returns for municipal bonds varied across the yield curve, the Barclays Municipal Bond Index, a broad measure of the investment-grade tax-exempt bond market, recorded a 7.27% gain for the fiscal year, compared with a rise of 3.97% for the Barclays U.S. Aggregate Index, a broad measure of the investment-grade taxable fixed-income market. The indexes are unmanaged and, therefore, have no expenses. Investors cannot invest directly in an index.
Attractive supply-and-demand dynamics provided an additional tailwind for the municipal market. After strong outflows through much of 2013, fund flows recovered in the latter half of the fiscal year. As demand increased, however, the supply of municipal bonds declined. For the first six months of 2014, issuance
| American Funds Tax-Exempt Funds | 1 |

was down 15% compared with the same period in 2013.
The fiscal problems confronting Puerto Rico continued to make headlines throughout the year. Bonds issued by Puerto Rico were among the most actively traded municipal securities in the second half of the fiscal year. Investor reaction to the Commonwealth’s challenges, including news of a potential restructuring of its public agencies, remains fluid.
In general, municipal bonds with longer maturities outpaced shorter term bonds, and lower rated securities generated better returns than those of higher quality. As interest rates declined over the period, investors gained confidence and increasingly sought opportunities for yield. In general, most of the tax-exempt bond funds covered in this report maintained relatively short duration positions, which proved to be a drag on overall returns. However, thanks to strong credit selection driven by our disciplined research effort, many of the funds kept pace with the market rally.
Looking forward
U.S. economic activity continues to accelerate, albeit at a modest pace. As growth continues to pick up, inflation is also likely to increase. Given these circumstances, and with the Fed winding down its asset purchase program, we expect interest rates to rise and feel it is likely there will be periods of uncertainty with regard to their future path. In such an environment, bond returns may be muted.
However, periods of rising interest rates provide opportunities to reinvest proceeds from bonds reaching maturity into less expensive bonds at higher yields and therefore higher tax-exempt income. Furthermore, the fiscal and economic outlook for many states and municipalities has improved substantially in recent months. While we maintain a conservative approach to the market, we are continuing to find opportunities to invest in bonds with attractive valuations that offer solid tax-exempt income. As always, we seek to maintain a careful balance between risk and potential return in the funds’ holdings.
We are grateful you have chosen to invest with us, and we look forward to reporting back to you in six months.
Sincerely,

Brenda S. Ellerin
President, American Funds Short-Term
Tax-Exempt Bond Fund and Limited Term
Tax-Exempt Bond Fund of America

Neil L. Langberg
President, The Tax-Exempt Bond Fund
of America and The Tax-Exempt Fund
of California

Karl J. Zeile
President, American High-Income
Municipal Bond Fund and American
Funds Tax-Exempt Fund of New York
September 9, 2014
For current information about the funds, visit americanfunds.com.
| 2 | American Funds Tax-Exempt Funds |
Funds’ 30-day yields
Below is a summary of each fund’s 30-day yield and 12-month distribution rate for Class A shares as of August 31, 2014. Both measures reflect the 2.50%/3.75% maximum sales charge. Each fund’s 30-day yield is calculated in accordance with the U.S. Securities and Exchange Commission (SEC) formula. The SEC yield reflects the rate at which each fund is earning income on its current portfolio of securities while the distribution rate reflects the funds’ past dividends paid to shareholders. Accordingly, the funds’ SEC yields and distribution rates may differ. The equivalent taxable yield assumes a 43.4% tax rate.1
| | | SEC | | Equivalent | | 12-month |
| Class A shares | | 30-day yield | | taxable yield | | distribution rate |
| Reflecting 2.50% maximum sales charge | | | | | | | | | |
| American Funds Short-Term Tax-Exempt Bond Fund | | 0.21 | % | | 0.37 | % | | 1.00 | % |
| Limited Term Tax-Exempt Bond Fund of America | | 0.73 | | | 1.29 | | | 2.42 | |
| | | | | | | | | | |
| Reflecting 3.75% maximum sales charge | | | | | | | | | |
| The Tax-Exempt Bond Fund of America | | 2.07 | | | 3.66 | | | 3.30 | |
| American High-Income Municipal Bond Fund | | 3.32 | | | 5.87 | | | 4.18 | |
| The Tax-Exempt Fund of California | | 2.12 | | | 4.32 | 2 | | 3.41 | |
| American Funds Tax-Exempt Fund of New York | | 2.05 | | | 4.15 | 3 | | 2.82 | |
| 1 | Based on 2014 federal tax rates. For the year 2014, there will be an Unearned Income Medicare Contribution Tax of 3.8% that applies to net investment income for taxpayers whose modified adjusted gross income exceeds $200,000 (for single filers) and $250,000 (for married filing jointly). Thus taxpayers in the highest tax bracket will face a combined 43.4% marginal tax rate on their investment income. The federal rates do not include an adjustment for the loss of personal exemptions and the phaseout of itemized deductions that are applicable to certain taxable income levels. |
| 2 | For investors in the 50.93% federal and California state tax bracket. |
| 3 | For investors in the 50.59% federal, New York state and New York City tax bracket. |
The return of principal for bond funds and for funds with significant underlying bond holdings is not guaranteed. Fund shares are subject to the same interest rate, inflation and credit risks associated with the underlying bond holdings. Income may be subject to state or local income taxes and/or federal alternative minimum taxes. Also, certain other income (such as distributions from gains on the sale of certain bonds purchased at less than par value for The Tax-Exempt Bond Fund of America), as well as capital gain distributions, may be taxable. High-yield/lower rated bonds are subject to greater fluctuations in value and risk of loss of income and principal than investment-grade/higher rated bonds. The Tax-Exempt Fund of California and American Funds Tax-Exempt Fund of New York are more susceptible to factors adversely affecting issuers of each state’s tax-exempt securities than a more widely diversified municipal bond fund. Refer to the fund prospectus and the Risk Factors section of this report for more information on these and other risks associated with investing in the funds.
| American Funds Tax-Exempt Funds | 3 |
American Funds Short-Term Tax-Exempt Bond Fund
The fund produced a 1.43% total return for the fiscal year, exceeding the 1.16% gain of the Lipper Short Municipal Debt Funds Average, a peer group measure. The Barclays Municipal Short 1–5 Years Index recorded a 1.98% total return. The index is unmanaged and, therefore, has no expenses. Investors cannot invest directly in an index.
For the 12 months ended July 31, 2014, the fund paid monthly dividends totaling about 11 cents a share. This amounts to a federally tax-exempt income return of 1.04% for those who reinvested dividends. This is equivalent to a taxable income return of 1.84% for investors in the 43.4%1 maximum federal tax bracket. A portion of the fund’s return also may be exempt from some state and local taxes.
While returns in the municipal bond market were positive overall, securities at the shorter end of the maturity spectrum — where the fund invests — tended to lag the broader market. Yields for shorter term bonds remain quite low, in part due to the Federal Reserve’s accommodative policies. The fund’s focus is first and foremost on protecting investor capital, which fund managers recognize as a top priority for most investors. At the close of the period, the largest concentrations in the portfolio included revenue bonds supporting hospital facilities (9.52%), airports (9.51%) and single-family housing (9.16%).
Tax-exempt yields vs. taxable yields
Find your estimated taxable income below to determine your federal tax rate,2 then look in the far right column to see what you would have had to earn from a taxable investment to equal the fund’s 1.01% tax-exempt distribution rate3 as of July 31, 2014.
| If your taxable income is ... | | ... then your federal | | The fund’s tax-exempt
distribution rate of 1.01% is |
| Single | | Joint | | tax rate is ... | | equivalent to a taxable rate of ... |
| $ | 0 – | 9,075 | | | $ | 0 – | 18,150 | | | | 10.0 | % | | | 1.12 | % |
| | 9,076 – | 36,900 | | | | 18,151 – | 73,800 | | | | 15.0 | | | | 1.19 | |
| | 36,901 – | 89,350 | | | | 73,801 – | 148,850 | | | | 25.0 | | | | 1.35 | |
| | 89,351 – | 186,350 | | | | 148,851 – | 226,850 | | | | 28.0 | | | | 1.40 | |
| | 186,351 – | 405,100 | | | | 226,851 – | 405,100 | | | | 36.8 | 1 | | | 1.60 | |
| | 405,101 – | 406,750 | | | | 405,101 – | 457,600 | | | | 38.8 | 1 | | | 1.65 | |
| | Over 406,750 | | | | Over 457,600 | | | | 43.4 | 1 | | | 1.78 | |
| 1 | For the year 2014, there will be an Unearned Income Medicare Contribution Tax of 3.8% that applies to net investment income for taxpayers whose modified adjusted gross income exceeds $200,000 (for single filers) and $250,000 (for married filing jointly). Thus taxpayers in the highest tax bracket will face a combined 43.4% marginal tax rate on their investment income. |
| 2 | Based on 2014 federal tax rates. The federal rates do not include an adjustment for the loss of personal exemptions and the phaseout of itemized deductions that are applicable to certain taxable income levels. |
| 3 | The distribution rate is based on dividends paid over the last 12 months divided by the maximum offering price as of July 31, 2014. Capital gain distributions, if any, are added back at the maximum offering price to determine the rate. |
Fund results shown on the following page are for Class A shares and, unless otherwise indicated, reflect deduction of the maximum sales charge of 2.50% on the $10,000 investment.1 Thus, the net amount invested was $9,750. Results are for past periods and are not predictive of results for future periods. Current and future results may be lower or higher than those shown. Share prices and returns will vary, so investors may lose money. For current information and month-end results, visit americanfunds.com.
| 4 | American Funds Tax-Exempt Funds |
How a $10,000 investment has grown

| 1 | As outlined in the prospectus, the sales charge is reduced for accounts (and aggregated investments) of $500,000 or more and is eliminated for purchases of $1 million or more. There is no sales charge on dividends or capital gain distributions that are reinvested in additional shares. |
| 2 | Consists of the Lipper Tax-Exempt Money Market Funds Index through July 31, 2009 (the period ended prior to the fund’s conversion from a tax-exempt money market fund to a short-term tax-exempt bond fund), and the Barclays Municipal Short 1–5 Years Index thereafter. Results of the Lipper Tax-Exempt Money Market Funds Index do not reflect any sales charges. The Barclays index is unmanaged and, therefore, has no expenses. Investors cannot invest directly in an index. |
| 3 | Prior to August 7, 2009, the fund was operated as a money market fund and did not have an initial sales charge. |
| 4 | In 2009, the fund changed its fiscal year-end from September 30 to July 31. |
The results shown are before taxes on fund distributions and sale of fund shares.
Average annual total returns based on a $1,000 investment
For periods ended July 31, 2014*
| | | 1 year | | 5 years | | 10 years |
| | | | | | | | | | | | | |
| Class A shares | | | -1.09 | % | | | 1.07 | % | | | 1.53 | % |
| * | Assumes reinvestment of all distributions and payment of the maximum 2.50% sales charge. |
The five- and 10-year investment results include the fund’s results as a money market fund through the date of its conversion (August 7, 2009) to a short-term tax-exempt bond fund, and therefore are not representative of the fund’s results had it operated as a short-term tax-exempt bond fund for the full term of those periods. Investment results assume all distributions are reinvested and reflect applicable fees and expenses. When applicable, investment results reflect expense reimbursements, without which results would have been lower. Visit americanfunds.com for more information.
Portfolio quality summary*
Percent of net assets

| * | Bond ratings, which typically range from AAA/Aaa (highest) to D (lowest), are assigned by credit rating agencies such as Standard & Poor’s, Moody’s and/or Fitch as an indication of an issuer’s creditworthiness. In assigning a credit rating to a security, the fund looks specifically to the ratings assigned to the issuer of the security by Standard & Poor’s, Moody’s and Fitch. If agency ratings differ, the security will be considered to have received the highest of those ratings, consistent with the fund’s investment policies. Securities in the “unrated” category (above) have not been rated by a rating agency; however, the investment adviser performs its own credit analysis and assigns comparable ratings that are used for compliance with the fund’s investment policies. The ratings are not covered by the Report of Independent Registered Public Accounting Firm. |
| American Funds Tax-Exempt Funds | 5 |
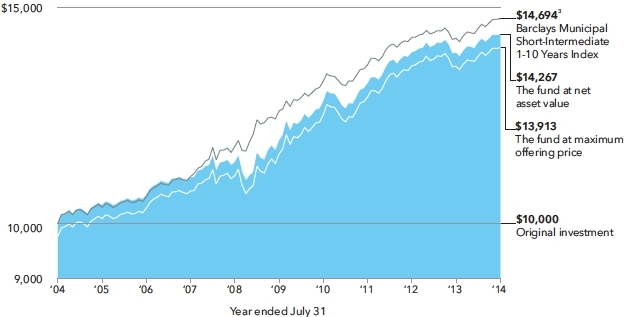
Limited Term Tax-Exempt Bond Fund of America
The fund produced a 3.56% gain, which slightly trailed the 3.75% total return of the Barclays Municipal Short-Intermediate 1–10 Years Index. The index is unmanaged and, therefore, has no expenses. Investors cannot invest directly in an index.
The fund’s total return also fell short of the 5.30% total return of the Lipper Intermediate Municipal Debt Funds Average, a peer group measure.
The fund paid monthly dividends totaling about 40 cents a share for the fiscal year, which represents a federally tax-exempt income return of 2.55% for those who reinvested dividends. This is equivalent to a taxable income return of 4.51% for investors in the 43.4%1 maximum federal tax bracket.
During the 12-month period, the fund’s returns were limited due in part to an unexpected decline in already low interest rates and tightening of credit spreads. These conditions proved to be somewhat challenging for the fund, which focuses chiefly on investment-grade bonds (those rated BBB/Baa and above) with maturities ranging from a few years to 10 years. Nevertheless, the fund delivered a solid gain while continuing to focus on preserving investor principal and generating reasonable income. The fund’s largest concentrations at the end of the fiscal year included revenue bonds supporting critical local enterprises, including airports (14.0%) and hospital facilities (11.3%).
Tax-exempt yields vs. taxable yields
Find your estimated taxable income below to determine your federal tax rate,2 then look in the far right column to see what you would have had to earn from a taxable investment to equal the fund’s 2.43% tax-exempt distribution rate3 as of July 31, 2014.
| If your taxable income is ... | | ... then your federal | | The fund’s tax-exempt
distribution rate of 2.43% is |
| Single | | Joint | | tax rate is ... | | equivalent to a taxable rate of ... |
| $ | 0 – | 9,075 | | | $ | 0 – | 18,150 | | | | 10.0 | % | | | 2.70 | % |
| | 9,076 – | 36,900 | | | | 18,151 – | 73,800 | | | | 15.0 | | | | 2.86 | |
| | 36,901 – | 89,350 | | | | 73,801 – | 148,850 | | | | 25.0 | | | | 3.24 | |
| | 89,351 – | 186,350 | | | | 148,851 – | 226,850 | | | | 28.0 | | | | 3.38 | |
| | 186,351 – | 405,100 | | | | 226,851 – | 405,100 | | | | 36.8 | 1 | | | 3.84 | |
| | 405,101 – | 406,750 | | | | 405,101 – | 457,600 | | | | 38.8 | 1 | | | 3.97 | |
| | Over 406,750 | | | | Over 457,600 | | | | 43.4 | 1 | | | 4.29 | |
| 1 | For the year 2014, there will be an Unearned Income Medicare Contribution Tax of 3.8% that applies to net investment income for taxpayers whose modified adjusted gross income exceeds $200,000 (for single filers) and $250,000 (for married filing jointly). Thus taxpayers in the highest tax bracket will face a combined 43.4% marginal tax rate on their investment income. |
| 2 | Based on 2014 federal tax rates. The federal rates do not include an adjustment for the loss of personal exemptions and the phaseout of itemized deductions that are applicable to certain taxable income levels. |
| 3 | The distribution rate is based on dividends paid over the last 12 months divided by the maximum offering price as of July 31, 2014. Capital gain distributions, if any, are added back at the maximum offering price to determine the rate. |
Fund results shown on the following page are for Class A shares and, unless otherwise indicated, reflect deduction of the maximum sales charge of 2.50% on the $10,000 investment.1 Thus, the net amount invested was $9,750.2 Results are for past periods and are not predictive of results for future periods. Current and future results may be lower or higher than those shown. Share prices and returns will vary, so investors may lose money. For current information and month-end results, visit americanfunds.com.
| 6 | American Funds Tax-Exempt Funds |
How a $10,000 investment has grown
| 1 | As outlined in the prospectus, the sales charge is reduced for accounts (and aggregated investments) of $500,000 or more and is eliminated for purchases of $1 million or more. There is no sales charge on dividends or capital gain distributions that are reinvested in additional shares. |
| 2 | The maximum initial sales charge was 3.75% until October 31, 2006. |
| 3 | The market index is unmanaged and, therefore, has no expenses. Investors cannot invest directly in an index. |
The results shown are before taxes on fund distributions and sale of fund shares.
Average annual total returns based on a $1,000 investment
For periods ended July 31, 2014*
| | | 1 year | | 5 years | | 10 years |
| | | | | | | | | | | | | |
| Class A shares | | | 0.97 | % | | | 3.56 | % | | | 3.36 | % |
| * | Assumes reinvestment of all distributions and payment of the maximum 2.50% sales charge. |
Investment results assume all distributions are reinvested and reflect applicable fees and expenses. When applicable, investment results reflect fee waivers, without which results would have been lower. Visit americanfunds.com for more information.
Portfolio quality summary*
Percent of net assets
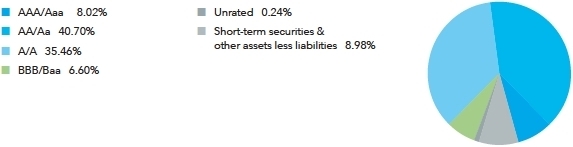
| * | Bond ratings, which typically range from AAA/Aaa (highest) to D (lowest), are assigned by credit rating agencies such as Standard & Poor’s, Moody’s and/or Fitch as an indication of an issuer’s creditworthiness. In assigning a credit rating to a security, the fund looks specifically to the ratings assigned to the issuer of the security by Standard & Poor’s, Moody’s and Fitch. If agency ratings differ, the security will be considered to have received the highest of those ratings, consistent with the fund’s investment policies. Securities in the “unrated” category (above) have not been rated by a rating agency; however, the investment adviser performs its own credit analysis and assigns comparable ratings that are used for compliance with the fund’s investment policies. The ratings are not covered by the Report of Independent Registered Public Accounting Firm. |
| American Funds Tax-Exempt Funds | 7 |
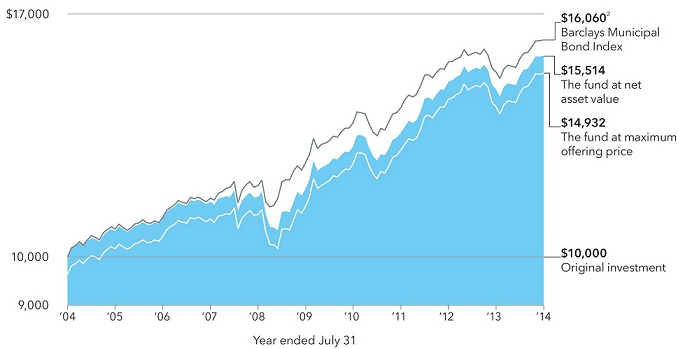
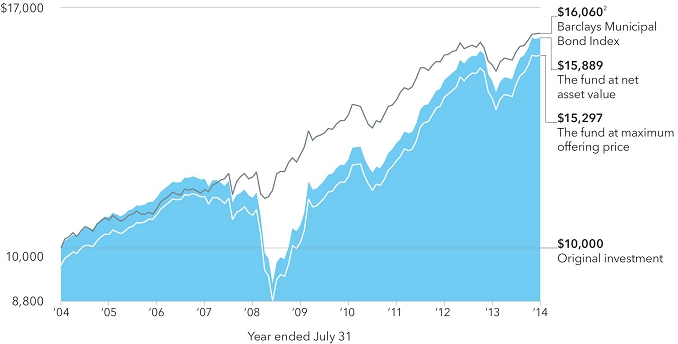
The Tax-Exempt Bond Fund of America
The fund advanced 7.60% for the fiscal year, outpacing the 7.27% total return of the Barclays Municipal Bond Index. The index is unmanaged and, therefore, has no expenses. Investors cannot invest directly in an index.
By way of comparison, the Lipper General & Insured Municipal Debt Funds Average, a measure of the fund’s peer group, recorded a 7.67% total return.
For the 12 months, the fund paid monthly dividends totaling nearly 45 cents a share, amounting to a federally tax-exempt income return of 3.65% for those who reinvested dividends. This is equivalent to a taxable income return of 6.45% for investors in the 43.4%1 maximum federal tax bracket. The fund does not invest in bonds subject to the Alternative Minimum Tax (AMT).
Continuing with a fairly conservative approach to the market that we have discussed in recent reports, the fund focused on relatively shorter duration securities throughout the year. This approach proved to be slightly unfavorable in a period when longer maturities and lower rated securities generally outgained shorter term securities. However, efforts by the fund’s managers to seek out yield opportunities through strong credit research proved rewarding and the fund outpaced the overall market. Holdings of revenue bonds supporting hospital facilities and toll roads — among the fund’s largest concentrations — generated some of the strongest gains for the fund.
Tax-exempt yields vs. taxable yields
Find your estimated taxable income below to determine your federal tax rate,2 then look in the far right column to see what you would have had to earn from a taxable investment to equal the fund’s 3.33% tax-exempt distribution rate3 as of July 31, 2014.
| If your taxable income is ... | | ... then your federal | | The fund’s tax-exempt
distribution rate of 3.33% is |
| Single | | Joint | | tax rate is ... | | equivalent to a taxable rate of ... |
| $ | 0 – | 9,075 | | | $ | 0 – | 18,150 | | | | 10.0 | % | | | 3.70 | % |
| | 9,076 – | 36,900 | | | | 18,151 – | 73,800 | | | | 15.0 | | | | 3.92 | |
| | 36,901 – | 89,350 | | | | 73,801 – | 148,850 | | | | 25.0 | | | | 4.44 | |
| | 89,351 – | 186,350 | | | | 148,851 – | 226,850 | | | | 28.0 | | | | 4.63 | |
| | 186,351 – | 405,100 | | | | 226,851 – | 405,100 | | | | 36.8 | 1 | | | 5.27 | |
| | 405,101 – | 406,750 | | | | 405,101 – | 457,600 | | | | 38.8 | 1 | | | 5.44 | |
| | Over 406,750 | | | | Over 457,600 | | | | 43.4 | 1 | | | 5.88 | |
| 1 | For the year 2014, there will be an Unearned Income Medicare Contribution Tax of 3.8% that applies to net investment income for taxpayers whose modified adjusted gross income exceeds $200,000 (for single filers) and $250,000 (for married filing jointly). Thus taxpayers in the highest tax bracket will face a combined 43.4% marginal tax rate on their investment income. |
| 2 | Based on 2014 federal tax rates. The federal rates do not include an adjustment for the loss of personal exemptions and the phaseout of itemized deductions that are applicable to certain taxable income levels. |
| 3 | The distribution rate is based on dividends paid over the last 12 months divided by the maximum offering price as of July 31, 2014. Capital gain distributions, if any, are added back at the maximum offering price to determine the rate. |
Fund results shown on the following page are for Class A shares and, unless otherwise indicated, reflect deduction of the maximum sales charge of 3.75% on the $10,000 investment.1 Thus, the net amount invested was $9,625. Results are for past periods and are not predictive of results for future periods. Current and future results may be lower or higher than those shown. Share prices and returns will vary, so investors may lose money. For current information and month-end results, visit americanfunds.com.
| 8 | American Funds Tax-Exempt Funds |
How a $10,000 investment has grown
| 1 | As outlined in the prospectus, the sales charge is reduced for accounts (and aggregated investments) of $100,000 or more and is eliminated for purchases of $1 million or more. There is no sales charge on dividends or capital gain distributions that are reinvested in additional shares. |
| 2 | The index is unmanaged and, therefore, has no expenses. Investors cannot invest directly in an index. |
The results shown are before taxes on fund distributions and sale of fund shares.
Average annual total returns based on a $1,000 investment
For periods ended July 31, 2014*
| | 1 year | 5 years | 10 years |
| | | | |
| Class A shares | 3.60% | 5.17% | 4.09% |
| * | Assumes reinvestment of all distributions and payment of the maximum 3.75% sales charge. |
Investment results assume all distributions are reinvested and reflect applicable fees and expenses. When applicable, investment results reflect fee waivers, without which results would have been lower. Visit americanfunds.com for more information.
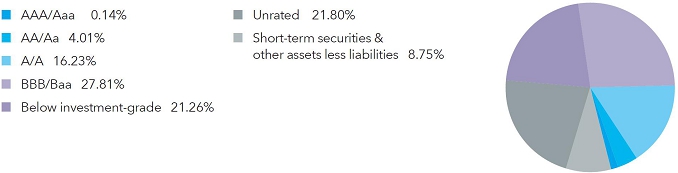
Portfolio quality summary*
Percent of net assets
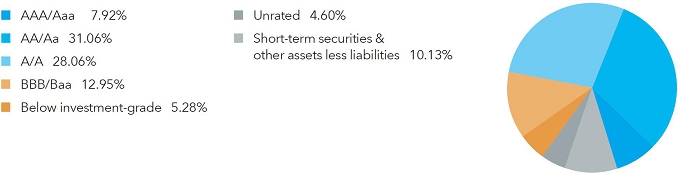
| * | Bond ratings, which typically range from AAA/Aaa (highest) to D (lowest), are assigned by credit rating agencies such as Standard & Poor’s, Moody’s and/or Fitch as an indication of an issuer’s creditworthiness. In assigning a credit rating to a security, the fund looks specifically to the ratings assigned to the issuer of the security by Standard & Poor’s, Moody’s and Fitch. If agency ratings differ, the security will be considered to have received the highest of those ratings, consistent with the fund’s investment policies. Securities in the “unrated” category (above) have not been rated by a rating agency; however, the investment adviser performs its own credit analysis and assigns comparable ratings that are used for compliance with the fund’s investment policies. The ratings are not covered by the Report of Independent Registered Public Accounting Firm. |
| American Funds Tax-Exempt Funds | 9 |
American High-Income Municipal Bond Fund
The fund produced an outstanding 9.99% total return for the fiscal year, exceeding both the 6.84% gain of the Barclays High Yield Municipal Bond Index and the 7.27% return of the Barclays Municipal Bond Index, a measure of the investment-grade market. The indexes are unmanaged and, therefore, have no expenses. Investors cannot invest directly in an index. The fund also bested the 9.10% total return of the Lipper High-Yield Municipal Debt Funds Average, a peer group measure.
While we are pleased with the fund’s return, we remind readers that we take a long-term view of investing. You can find results for longer time frames on page 16. That said, we are gratified that our research-driven approach has helped the fund produce favorable relative results in the recently concluded fiscal year — a strong period for lower rated bonds — and that it also outpaced the Barclays Municipal Bond Index for the 12-month period ended July 31, 2013, which was a particularly challenging period for high-yield municipal securities.
For the 12 months ended July 31, 2014, the fund paid monthly dividends totaling about 67 cents a share, amounting to a federally tax-exempt income return of 4.71% for investors who reinvested dividends. This is equivalent to a taxable income return of 8.32% for investors in the 43.4%1 maximum federal tax bracket. A portion of the fund’s return also may be exempt from some state and local taxes.
The fund received positive contributions from a number of bonds representing a variety of sectors and geographies. Investments in revenue bonds backing senior living facilities and tax-exempt corporate bonds produced some of the strongest gains of the period.
Tax-exempt yields vs. taxable yields
Find your estimated taxable income below to determine your federal tax rate,2 then look in the far right column to see what you would have had to earn from a taxable investment to equal the fund’s 4.22% tax-exempt distribution rate3 as of July 31, 2014.
| | | | | | The fund’s tax-exempt |
| If your taxable income is … | | | ... then your federal | | distribution rate of 4.22% is |
| Single | | | Joint | | | tax rate is … | | equivalent to a taxable rate of ... |
| $ | 0 – | 9,075 | | | $ | 0 – | 18,150 | | | | 10.0 | % | | | 4.69 | % |
| | 9,076 – | 36,900 | | | | 18,151 – | 73,800 | | | | 15.0 | | | | 4.96 | |
| | 36,901 – | 89,350 | | | | 73,801 – | 148,850 | | | | 25.0 | | | | 5.63 | |
| | 89,351 – | 186,350 | | | | 148,851 – | 226,850 | | | | 28.0 | | | | 5.86 | |
| | 186,351 – | 405,100 | | | | 226,851 – | 405,100 | | | | 36.8 | 1 | | | 6.68 | |
| | 405,101 – | 406,750 | | | | 405,101 – | 457,600 | | | | 38.8 | 1 | | | 6.90 | |
| | Over 406,750 | | | | Over 457,600 | | | | 43.4 | 1 | | | 7.46 | |
| 1 | For the year 2014, there will be an Unearned Income Medicare Contribution Tax of 3.8% that applies to net investment income for taxpayers whose modified adjusted gross income exceeds $200,000 (for single filers) and $250,000 (for married filing jointly). Thus taxpayers in the highest tax bracket will face a combined 43.4% marginal tax rate on their investment income. |
| 2 | Based on 2014 federal tax rates. The federal rates do not include an adjustment for the loss of personal exemptions and the phaseout of itemized deductions that are applicable to certain taxable income levels. |
| 3 | The distribution rate is based on dividends paid over the last 12 months divided by the maximum offering price as of July 31, 2014. Capital gain distributions, if any, are added back at the maximum offering price to determine the rate. |
Fund results shown on the following page are for Class A shares and, unless otherwise indicated, reflect deduction of the maximum sales charge of 3.75% on the $10,000 investment.1 Thus, the net amount invested was $9,625. Results are for past periods and are not predictive of results for future periods. Current and future results may be lower or higher than those shown. Share prices and returns will vary, so investors may lose money. For current information and month-end results, visit americanfunds.com.
| 10 | American Funds Tax-Exempt Funds |
How a $10,000 investment has grown
| 1 | As outlined in the prospectus, the sales charge is reduced for accounts (and aggregated investments) of $100,000 or more and is eliminated for purchases of $1 million or more. There is no sales charge on dividends or capital gain distributions that are reinvested in additional shares. |
| 2 | The index is unmanaged and, therefore, has no expenses. Investors cannot invest directly in an index. |
The results shown are before taxes on fund distributions and sale of fund shares.
Average annual total returns based on a $1,000 investment
| For periods ended July 31, 2014* | | | |
| | | | |
| | 1 year | 5 years | 10 years |
| | | | |
| Class A shares | 5.89% | 7.76% | 4.34% |
| * | Assumes reinvestment of all distributions and payment of the maximum 3.75% sales charge. |
Investment results assume all distributions are reinvested and reflect applicable fees and expenses. When applicable, investment results reflect fee waivers, without which results would have been lower. Visit americanfunds.com for more information.
Portfolio quality summary*
Percent of net assets
| * | Bond ratings, which typically range from AAA/Aaa (highest) to D (lowest), are assigned by credit rating agencies such as Standard & Poor’s, Moody’s and/or Fitch as an indication of an issuer’s creditworthiness. In assigning a credit rating to a security, the fund looks specifically to the ratings assigned to the issuer of the security by Standard & Poor’s, Moody’s and Fitch. If agency ratings differ, securities are placed in the lowest rated category. Securities in the “unrated” category (above) have not been rated by a rating agency; however, the investment adviser performs its own credit analysis and assigns comparable ratings that are used for compliance with the fund’s investment policies. The ratings are not covered by the Report of Independent Registered Public Accounting Firm. |
| American Funds Tax-Exempt Funds | 11 |
The Tax-Exempt Fund of California
The fund generated an 8.72% total return, a result that lagged the 9.04% gain of the Barclays California Municipal Index. The index is unmanaged and, therefore, has no expenses. Investors cannot invest directly in an index. The fund also trailed the 9.27% total return recorded by the Lipper California Municipal Debt Funds Average, a peer group measure.
The fund paid monthly dividends totaling about 63 cents a share for the 12-month period. Those investors who reinvested dividends received an income return of 3.83%. This is equivalent to a taxable income return of 7.81% for investors in the 50.93% effective combined federal and California tax bracket.
With the state economy improving and tax revenues rising, California is starting the current fiscal year in solid shape. The state’s planned budget for the current year features increases for education, pays down debt, and proposes a 32-year plan to fully fund the teachers’ pension system. These conditions have proved to be tailwinds for the state’s municipal bond market, which has seen spreads tighten across the credit spectrum. A reduced supply of bonds also has been supportive of returns.
The fund had a small concentration of holdings issued by Puerto Rico issuers (1.85%), which offer triple-tax-exempt status to investors. Select holdings in this area detracted from the fund’s overall positive result during the period.
Tax-exempt yields vs. taxable yields
Find your estimated 2014 taxable income below to determine your combined federal and California tax rate,* then look in the right-hand column to see what you would have had to earn from a taxable investment to equal the fund’s 3.46% tax-exempt distribution rate† at July 31, 2014.
| | | | ... then your combined | | The fund’s tax-exempt |
| If your taxable income is … | | | federal and California | | distribution rate of 3.46% is |
| Single | | | Joint | | | state tax rate is … | | equivalent to a taxable rate of ... |
| $ | 0 – | 7,749 | | | $ | 0 – | 15,498 | | | | 10.90 | % | | | 3.88 | % |
| | 7,750 – | 9,075 | | | | 15,499 – | 18,150 | | | | 11.80 | | | | 3.92 | |
| | 9,076 – | 18,371 | | | | 18,151 – | 36,742 | | | | 16.70 | | | | 4.15 | |
| | 18,372 – | 28,995 | | | | 36,743 – | 57,990 | | | | 18.40 | | | | 4.24 | |
| | 28,996 – | 36,900 | | | | 57,991 – | 73,800 | | | | 20.10 | | | | 4.33 | |
| | 36,901 – | 40,250 | | | | 73,801 – | 80,500 | | | | 29.50 | | | | 4.91 | |
| | 40,251 – | 50,869 | | | | 80,501 – | 101,738 | | | | 31.00 | | | | 5.01 | |
| | 50,870 – | 89,350 | | | | 101,739 – | 148,850 | | | | 31.98 | | | | 5.09 | |
| | 89,351 – | 186,350 | | | | 148,851 – | 226,850 | | | | 34.70 | | | | 5.30 | |
| | 186,351 – | 259,844 | | | | 226,851 – | 405,100 | | | | 42.68 | | | | 6.04 | |
| | 259,845 – | 311,812 | | | | – | | | | | 43.31 | | | | 6.10 | |
| | 311,813 – | 405,100 | | | | – | | | | | 43.94 | | | | 6.17 | |
| | – | | | | | 405,101 – | 457,600 | | | | 44.49 | | | | 6.23 | |
| | 405,101 – | 406,750 | | | | – | | | | | 45.72 | | | | 6.37 | |
| | – | | | | | 457,601 – | 519,688 | | | | 48.66 | | | | 6.74 | |
| | – | | | | | 519,689 – | 623,624 | | | | 49.23 | | | | 6.82 | |
| | 406,751 – | 519,687 | | | | 623,625 – | 1,000,000 | | | | 49.80 | | | | 6.89 | |
| | 519,688 – | 1,000,000 | | | | 1,000,001 – | 1,039,374 | | | | 50.36 | | | | 6.97 | |
| | Over 1,000,000 | | | | Over 1,039,374 | | | | 50.93 | | | | 7.05 | |
| * | Based on 2014 federal and 2014 California tax rates. (State rates from 1.0% to 13.3% are individually calculated for each bracket. The federal brackets are expanded to include additional state brackets.) The effective combined tax rates paid by California residents may be lower than those shown due to the availability of income tax deductions. |
| † | The distribution rate is based on dividends paid over the last 12 months divided by the maximum offering price as of July 31, 2014. Capital gains distributions, if any, are added back at the maximum offering price to determine the rate. |
Fund results shown on the following page are for Class A shares and, unless otherwise indicated, reflect deduction of the maximum sales charge of 3.75% on the $10,000 investment.1 Thus, the net amount invested was $9,625. Results are for past periods and are not predictive of results for future periods. Current and future results may be lower or higher than those shown. Share prices and returns will vary, so investors may lose money. For current information and month-end results, visit americanfunds.com.
| 12 | American Funds Tax-Exempt Funds |
How a $10,000 investment has grown

| 1 | As outlined in the prospectus, the sales charge is reduced for accounts (and aggregated investments) of $100,000 or more and is eliminated for purchases of $1 million or more. There is no sales charge on dividends or capital gain distributions that are reinvested in additional shares. |
| 2 | The index is unmanaged and, therefore, has no expenses. Investors cannot invest directly in an index. |
The results shown are before taxes on fund distributions and sale of fund shares.
Average annual total returns based on a $1,000 investment
| For periods ended July 31, 2014* | | | |
| | | | |
| | 1 year | 5 years | 10 years |
| | | | |
| Class A shares | 4.65% | 6.45% | 4.38% |
| * | Assumes reinvestment of all distributions and payment of the maximum 3.75% sales charge. |
Investment results assume all distributions are reinvested and reflect applicable fees and expenses. When applicable, investment results reflect fee waivers, without which results would have been lower. Visit americanfunds.com for more information.
Portfolio quality summary*
Percent of net assets
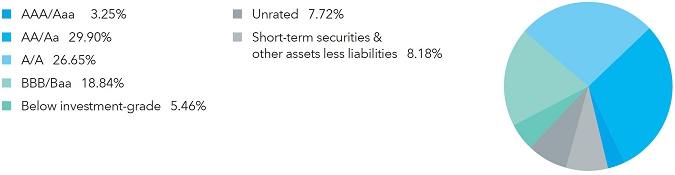
| * | Bond ratings, which typically range from AAA/Aaa (highest) to D (lowest), are assigned by credit rating agencies such as Standard & Poor’s, Moody’s and/or Fitch as an indication of an issuer’s creditworthiness. In assigning a credit rating to a security, the fund looks specifically to the ratings assigned to the issuer of the security by Standard & Poor’s, Moody’s and Fitch. If agency ratings differ, the security will be considered to have received the highest of those ratings, consistent with the fund’s investment policies. Securities in the “unrated” category (above) have not been rated by a rating agency; however, the investment adviser performs its own credit analysis and assigns comparable ratings that are used for compliance with the fund’s investment policies. The ratings are not covered by the Report of Independent Registered Public Accounting Firm. |
| American Funds Tax-Exempt Funds | 13 |
American Funds Tax-Exempt Fund of New York
The fund produced a 6.83% total return. That result lagged the 7.47% gain of the Barclays New York Municipal Index. The index is unmanaged and, therefore, has no expenses. Investors cannot invest directly in an index. The fund also trailed the 7.01% total return of the Lipper New York Municipal Debt Funds Average, a measure of its peer group. However, as you can see in the table on page 16, the fund has continued to outpace its benchmarks over its lifetime.
For the year, the fund paid monthly dividends totaling about 31 cents a share. This represents an income return of 3.12% for those who reinvested dividends. For investors in the 50.59% combined effective federal, New York state and New York City tax bracket, this is equivalent to a taxable income return of 6.31%.
Generally speaking, the New York municipal bond market — which tends to be relatively higher quality — trails the broad market during periods when lower rated and longer duration bonds excel. However, over the past 12 months, the New York municipal bond market outpaced the broader national tax-exempt bond market due in part to strong demand for New York state tax-exempt bonds and improved credit quality among the larger issuers in the state. A wide variety of revenue bonds — including securities backing higher education facilities and hospitals - contributed to the fund’s overall positive return.
Tax-exempt yields vs. taxable yields
Find your estimated 2014 taxable income below to determine your combined federal and New York state tax rate,1,2 then look in the right-hand column to see what you would have had to earn from a taxable investment to equal the fund’s 2.86% tax-exempt distribution rate3 at July 31, 2014.
| | | | ... then your combined | | The fund’s tax-exempt |
| If your taxable income is … | | | federal and New York | | distribution rate of 2.86% is |
| Single | | | Joint | | | state tax rate is … | | equivalent to a taxable rate of ... |
| $ | 0 – | 8,300 | | | $ | 0 – | 16,700 | | | | 13.60 | % | | | 3.31 | % |
| | 8,301 – | 9,075 | | | | 16,701 – | 18,150 | | | | 14.05 | | | | 3.33 | |
| | 9,076 – | 11,450 | | | | 18,151 – | 22,950 | | | | 18.83 | | | | 3.52 | |
| | 11,451 – | 13,550 | | | | 22,951 – | 27,150 | | | | 19.46 | | | | 3.55 | |
| | 13,551 – | 20,850 | | | | 27,151 – | 41,800 | | | | 20.02 | | | | 3.58 | |
| | 20,851 – | 36,900 | | | | 41,801 – | 73,800 | | | | 20.48 | | | | 3.60 | |
| | 36,901 – | 78,400 | | | | 73,801 – | 148,850 | | | | 29.84 | | | | 4.08 | |
| | 78,401 – | 89,350 | | | | – | | | | | 29.99 | | | | 4.09 | |
| | – | | | | | 148,851 – | 156,900 | | | | 32.64 | | | | 4.25 | |
| | 89,351 – | 186,350 | | | | 156,901 – | 226,850 | | | | 32.79 | | | | 4.26 | |
| | 186,351 – | 209,250 | | | | 226,851 – | 313,850 | | | | 41.00 | | | | 4.85 | |
| | 209,251 – | 405,100 | | | | 313,851 – | 405,100 | | | | 41.13 | | | | 4.86 | |
| | 405,101 – | 406,750 | | | | 405,101 – | 457,600 | | | | 42.99 | | | | 5.02 | |
| | 406,751 – | 1,046,350 | | | | 457,601 – | 2,092,800 | | | | 47.28 | | | | 5.42 | |
| | Over 1,046,350 | | | | Over 2,092,800 | | | | 48.39 | | | | 5.54 | |
| 1 | Income generated by the fund’s investments is also generally exempt from New York City taxes, offering additional tax advantages to New York City residents. |
| 2 | Based on 2014 federal and New York state tax rates. (State rates from 4.00% to 8.82% are individually calculated for each bracket. The federal brackets are expanded to include additional state brackets.) The effective combined tax rates assume full deductibility of state taxes. |
| 3 | The distribution rate is based on dividends paid over the last 12 months divided by the maximum offering price as of July 31, 2014. Capital gain distributions, if any, are added back at the maximum offering price to determine the rate. |
Fund results shown on the following page are for Class A shares and, unless otherwise indicated, reflect deduction of the maximum sales charge of 3.75% on the $10,000 investment.1 Thus, the net amount invested was $9,625. Results are for past periods and are not predictive of results for future periods. Current and future results may be lower or higher than those shown. Share prices and returns will vary, so investors may lose money. For current information and month-end results, visit americanfunds.com.
| 14 | American Funds Tax-Exempt Funds |
How a $10,000 investment has grown
(for the period November 1, 2010, to July 31, 2014, with dividends reinvested)

| 1 | As outlined in the prospectus, the sales charge is reduced for accounts (and aggregated investments) of $100,000 or more and is eliminated for purchases of $1 million or more. There is no sales charge on dividends or capital gain distributions that are reinvested in additional shares. |
| 2 | The index is unmanaged and, therefore, has no expenses. Investors cannot invest directly in an index. |
The results shown are before taxes on fund distributions and sale of fund shares.
Average annual total returns based on a $1,000 investment
For periods ended July 31, 2014*
| | Lifetime |
| | 1 year | (since 11/1/10) |
| | | |
| Class A shares | 2.80% | 3.48% |
| * | Assumes reinvestment of all distributions and payment of the maximum 3.75% sales charge. |
Investment results assume all distributions are reinvested and reflect applicable fees and expenses. When applicable, investment results reflect expense reimbursements, without which results would have been lower. The investment adviser is currently reimbursing a portion of other expenses. This reimbursement will be in effect through at least September 30, 2014, unless modified or terminated by the fund’s board. The adviser may elect at its discretion to extend, modify or terminate the reimbursement at that time. Visit americanfunds.com for more information.
Portfolio quality summary*
Percent of net assets
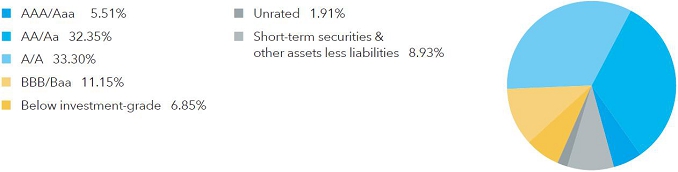
| * | Bond ratings, which typically range from AAA/Aaa (highest) to D (lowest), are assigned by credit rating agencies such as Standard & Poor’s, Moody’s and/or Fitch as an indication of an issuer’s creditworthiness. In assigning a credit rating to a security, the fund looks specifically to the ratings assigned to the issuer of the security by Standard & Poor’s, Moody’s and Fitch. If agency ratings differ, the security will be considered to have received the highest of those ratings, consistent with the fund’s investment policies. Securities in the “unrated” category (above) have not been rated by a rating agency; however, the investment adviser performs its own credit analysis and assigns comparable ratings that are used for compliance with the fund’s investment policies. The ratings are not covered by the Report of Independent Registered Public Accounting Firm. |
| American Funds Tax-Exempt Funds | 15 |
Results at a glance
For periods ended July 31, 2014, with distributions reinvested
| | | Cumulative total returns | | Average annual total returns |
| | | 1 year | | 5 years | | 10 years | | Lifetime1 |
| | | | | | | | | |
| American Funds Short-Term Tax-Exempt Bond Fund (Class A shares) | | | 1.43 | % | | | — | % | | | — | % | | | 1.67 | % |
| Barclays Municipal Short 1-5 Years Index2,3 | | | 1.98 | | | | — | | | | — | | | | 2.20 | |
| Lipper Short Municipal Debt Funds Average | | | 1.16 | | | | — | | | | — | | | | 1.56 | |
| | | | | | | | | | | | | | | | | |
| Limited Term Tax-Exempt Bond Fund of America (Class A shares) | | | 3.56 | | | | 4.09 | | | | 3.62 | | | | 4.32 | |
| Barclays Municipal Short-Intermediate 1-10 Years Index2,4 | | | 3.75 | | | | 3.53 | | | | 3.92 | | | | 4.52 | |
| Lipper Intermediate Municipal Debt Funds Average | | | 5.30 | | | | 4.38 | | | | 3.73 | | | | 4.51 | |
| | | | | | | | | | | | | | | | | |
| The Tax-Exempt Bond Fund of America (Class A shares) | | | 7.60 | | | | 5.97 | | | | 4.49 | | | | 6.76 | |
| Barclays Municipal Bond Index2 | | | 7.27 | | | | 5.50 | | | | 4.85 | | | | — | 5 |
| Lipper General & Insured Municipal Debt Funds Average | | | 7.67 | | | | 5.84 | | | | 4.12 | | | | 6.70 | |
| | | | | | | | | | | | | | | | | |
| American High-Income Municipal Bond Fund (Class A shares) | | | 9.99 | | | | 8.58 | | | | 4.74 | | | | 5.66 | |
| Barclays Municipal Bond Index2 | | | 7.27 | | | | 5.50 | | | | 4.85 | | | | 5.72 | |
| Barclays High Yield Municipal Bond Index2 | | | 6.84 | | | | 9.93 | | | | 5.63 | | | | — | 5 |
| Lipper High-Yield Municipal Debt Funds Average | | | 9.10 | | | | 8.24 | | | | 4.30 | | | | 5.09 | |
| | | | | | | | | | | | | | | | | |
| The Tax-Exempt Fund of California (Class A shares) | | | 8.72 | | | | 7.26 | | | | 4.78 | | | | 5.79 | |
| Barclays California Municipal Index2 | | | 9.04 | | | | 6.52 | | | | 5.20 | | | | — | 5 |
| Lipper California Municipal Debt Funds Average | | | 9.27 | | | | 6.80 | | | | 4.46 | | | | 5.74 | |
| | | | | | | | | | | | | | | | | |
| American Funds Tax-Exempt Fund of New York (Class A shares) | | | 6.83 | | | | — | | | | — | | | | 4.54 | |
| Barclays New York Municipal Index2 | | | 7.47 | | | | — | | | | — | | | | 4.18 | |
| Lipper New York Municipal Debt Funds Average | | | 7.01 | | | | — | | | | — | | | | 3.64 | |
| 1 | Since 8/7/09 (American Funds Short-Term Tax-Exempt Bond Fund), 10/6/93 (Limited Term Tax-Exempt Bond Fund of America), 10/3/79 (The Tax-Exempt Bond Fund of America), 9/26/94 (American High-Income Municipal Bond Fund), 10/28/86 (The Tax-Exempt Fund of California) and 11/1/10 (American Funds Tax-Exempt Fund of New York). |
| 2 | The index is unmanaged and, therefore, has no expenses. Investors cannot invest directly in an index. |
| 3 | Barclays Municipal Short 1–5 Years Index is a market value-weighted index that includes investment-grade tax-exempt bonds with maturities of one to five years. |
| 4 | Barclays Municipal Short-Intermediate 1-10 Years Index is a market value-weighted index that includes investment-grade tax-exempt bonds with maturities of one to 10 years. |
| 5 | This index did not exist at the fund’s inception. |
| 16 | American Funds Tax-Exempt Funds |
American Funds Short-Term Tax-Exempt Bond Fund
Summary investment portfolio July 31, 2014
Bonds, notes & other debt
instruments 85.15% | | Principal amount
(000) | | | Value
(000) | |
| California 7.81% | | | | | | | | |
Bay Area Toll Auth., San Francisco Bay Area Toll Bridge Rev. Ref. Bonds,
Series 2006-C-1, 0.96% 2045 (put 2023)1 | | $ | 6,600 | | | $ | 6,522 | |
Bay Area Toll Auth., San Francisco Bay Area Toll Bridge Rev. Ref. Bonds,
Series 2007-E-3, 0.76% 2047 (put 2019)1 | | | 3,000 | | | | 2,987 | |
| Various Purpose G.O. Ref. Bonds, 5.00% 2018 | | | 3,000 | | | | 3,453 | |
Health Facs. Fncg. Auth., Rev. Ref. Bonds (St. Joseph Health System),
Series 2009-B, 5.00% 2015 | | | 1,000 | | | | 1,044 | |
Health Facs. Fncg. Auth., Rev. Ref. Bonds (St. Joseph Health System),
Series 2009-C, 5.00% 2034 (put 2014) | | | 4,500 | | | | 4,546 | |
Health Facs. Fncg. Auth., Rev. Ref. Bonds (St. Joseph Health System),
Series 2013-B, 5.00% 2043 (put 2017) | | | 1,145 | | | | 1,299 | |
Health Facs. Fncg. Auth., Rev. Ref. Bonds (St. Joseph Health System),
Series 2013-D, 5.00% 2043 (put 2020) | | | 1,500 | | | | 1,769 | |
| Los Angeles County Metropolitan Transportation Auth., Proposition A, Sales Tax Rev. Ref. Bonds, Series 2013-A, 5.00% 2018 | | | 3,000 | | | | 3,494 | |
Oakland Redev. Successor Agcy., Tax Allocation Ref. Bonds (Central Dist. Redev. Project),
Series 2013, 4.00% 2018 | | | 2,500 | | | | 2,767 | |
Oakland Redev. Successor Agcy., Tax Allocation Ref. Bonds (Central Dist. Redev. Project),
Series 2013, 5.00% 2017 | | | 2,510 | | | | 2,821 | |
Oakland Redev. Successor Agcy., Tax Allocation Ref. Bonds (Central Dist. Redev. Project),
Series 2013, 5.00% 2018 | | | 1,085 | | | | 1,244 | |
Oakland Redev. Successor Agcy., Tax Allocation Ref. Bonds (Central Dist. Redev. Project),
Series 2013, 5.00% 2019 | | | 1,000 | | | | 1,163 | |
| Other securities | | | | | | | 29,180 | |
| | | | | | | | 62,289 | |
| | | | | | | | | |
| Colorado 1.14% | | | | | | | | |
| Dept. of Transportation, Transportation Rev. Ref. Anticipation Notes, 5.00% 2016 | | | 5,000 | | | | 5,545 | |
| Other securities | | | | | | | 3,516 | |
| | | | | | | | 9,061 | |
| | | | | | | | | |
| Florida 8.14% | | | | | | | | |
| Citizens Property Insurance Corp., Personal Lines Account/Commercial Lines Account Secured Bonds, Series 2012-A-1, 5.00% 2017 | | | 1,000 | | | | 1,119 | |
| Citizens Property Insurance Corp., Personal Lines Account/Commercial Lines Account Secured Bonds, Series 2012-A-1, 5.00% 2019 | | | 6,450 | | | | 7,482 | |
Hurricane Catastrophe Fund Fin. Corp., Rev. Bonds,
Series 2010-A, 5.00% 2015 (escrowed to maturity) | | | 4,000 | | | | 4,176 | |
| Hurricane Catastrophe Fund Fin. Corp., Rev. Bonds, Series 2010-A, 5.00% 2016 (escrowed to maturity) | | | 5,295 | | | | 5,768 | |
| City of Lakeland, Energy System Rev. Ref. Bonds, Series 2012, 0.81% 20171 | | | 3,800 | | | | 3,806 | |
| Miami-Dade County, Aviation Rev. Ref. Bonds, Series 2005-B, AMT, Assured Guaranty Municipal insured, 5.00% 2016 | | | 3,000 | | | | 3,162 | |
| State Board of Education, Public Education Capital Outlay Ref. Bonds, Series 2009-B, 5.00% 2015 | | | 3,000 | | | | 3,122 | |
| City of Tampa, Utility Tax Rev. Ref. Bonds, National insured, 5.00% 2015 | | | 3,615 | | | | 3,818 | |
| Other securities | | | | | | | 32,424 | |
| | | | | | | | 64,877 | |
| | | | | | | | | |
| Georgia 2.82% | | | | | | | | |
Metropolitan Atlanta Rapid Transit Auth., Sales Tax Rev. Ref. Bonds (Third Indenture Series),
Series 2014-A, 0.36% 2025 (put 2017)1 | | | 5,250 | | | | 5,248 | |
| Other securities | | | | | | | 17,224 | |
| | | | | | | | 22,472 | |
| American Funds Tax-Exempt Funds | 17 |
American Funds Short-Term Tax-Exempt Bond Fund
Bonds, notes & other debt
instruments (continued) | | Principal amount
(000) | | | Value
(000) | |
| Illinois 5.83% | | | | | | | | |
| Build Bonds (Sales Tax Rev. Bonds), Series June 2013, 5.00% 2020 | | $ | 3,500 | | | $ | 4,127 | |
| Educational Facs. Auth. Rev. Bonds (University of Chicago), Series 1998-B, 1.65% 2025 (put 2019) | | | 10,390 | | | | 10,433 | |
| Educational Facs. Auth., Rev. Bonds (University of Chicago), Series 2001-B-1, 1.10% 2036 (put 2018) | | | 1,250 | | | | 1,250 | |
| Unemployment Insurance Fund Building Receipts Rev. Bonds (Illinois Dept. of Employment Security), Series 2012-A, 5.00% 2016 | | | 4,000 | | | | 4,437 | |
| Other securities | | | | | | | 26,229 | |
| | | | | | | | 46,476 | |
| | | | | | | | | |
| Maryland 0.93% | | | | | | | | |
| Community Dev. Administration, Dept. of Housing and Community Dev., Residential Rev. Bonds, Series 2014-B, AMT, 3.25% 2044 | | | 3,595 | | | | 3,769 | |
| Other securities | | | | | | | 3,667 | |
| | | | | | | | 7,436 | |
| | | | | | | | | |
| Massachusetts 3.95% | | | | | | | | |
| Dev. Fin. Agcy., Rev. Bonds (Partners HealthCare System), Series 2014-M-3, 0.61% 2038 (put 2018)1 | | | 6,075 | | | | 6,070 | |
| Educational Fncg. Auth., Education Loan Rev. Bonds, Series 2014-I, AMT, 5.00% 2021 | | | 3,000 | | | | 3,384 | |
| Other securities | | | | | | | 22,033 | |
| | | | | | | | 31,487 | |
| | | | | | | | | |
| Michigan 4.24% | | | | | | | | |
| Kent Hospital Fin. Auth., Rev. Ref. Bonds (Spectrum Health System), Series 2008-A, 5.50% 2047 (put 2015) | | | 5,000 | | | | 5,120 | |
| Regents of the University of Michigan, General Rev. Ref. Bonds, Series 2012-F, 0.46% 2043 (put 2016)1 | | | 3,000 | | | | 3,004 | |
| Other securities | | | | | | | 25,699 | |
| | | | | | | | 33,823 | |
| | | | | | | | | |
| Missouri 1.17% | | | | | | | | |
| City of St. Louis, Airport Rev. Ref. Bonds (Lambert-St. Louis International Airport), Series 2007-B, AMT, Assured Guaranty Municipal insured, 5.00% 2016 | | | 5,000 | | | | 5,392 | |
| Other securities | | | | | | | 3,972 | |
| | | | | | | | 9,364 | |
| | | | | | | | | |
| Nebraska 0.99% | | | | | | | | |
| Investment Fin. Auth., Single-family Housing Rev. Bonds, Series 2014-A, 3.00% 2044 | | | 3,000 | | | | 3,161 | |
| Other securities | | | | | | | 4,763 | |
| | | | | | | | 7,924 | |
| 18 | American Funds Tax-Exempt Funds |
American Funds Short-Term Tax-Exempt Bond Fund
| | | Principal amount
(000) | | | Value
(000) | |
| New Jersey 4.10% | | | | | | | | |
| Econ. Dev. Auth., School Facs. Construction Bonds, Assured Guaranty Municipal insured, Subseries J-5, 5.00% 2029 (preref. 2015) | | $ | 2,000 | | | $ | 2,104 | |
| Econ. Dev. Auth., School Facs. Construction Rev. Ref. Bonds, Series 2010-DD-1, 5.00% 2016 | | | 1,500 | | | | 1,650 | |
| Econ. Dev. Auth., School Facs. Construction Rev. Ref. Bonds, Series 2014-PP, 5.00% 2019 | | | 4,000 | | | | 4,554 | |
| Higher Education Student Assistance Auth., Student Loan Rev. Bonds, Series 2010-2, 5.00% 2014 | | | 2,000 | | | | 2,032 | |
| Higher Education Student Assistance Auth., Student Loan Rev. Bonds, Series 2012-1A, AMT, 4.00% 2017 | | | 3,500 | | | | 3,815 | |
| Higher Education Student Assistance Auth., Student Loan Rev. Bonds, Series 2012-1A, AMT, 5.00% 2018 | | | 2,000 | | | | 2,276 | |
| Higher Education Student Assistance Auth., Student Loan Rev. Ref. Bonds, Series 2014-1A1, AMT, 4.00% 2017 | | | 1,750 | | | | 1,908 | |
| Higher Education Student Assistance Auth., Student Loan Rev. Ref. Bonds, Series 2014-1A1, AMT, 5.00% 2016 | | | 1,000 | | | | 1,097 | |
| Higher Education Student Assistance Auth., Student Loan Rev. Ref. Bonds, Series 2014-1A1, AMT, 5.00% 2018 | | | 2,250 | | | | 2,561 | |
| Other securities | | | | | | | 10,683 | |
| | | | | | | | 32,680 | |
| | | | | | | | | |
| New Mexico 0.76% | | | | | | | | |
| Educational Assistance Foundation, Education Loan Rev. Ref. Bonds, Series 2009-C, AMT, 3.90% 2014 | | | 3,000 | | | | 3,008 | |
| Other securities | | | | | | | 3,015 | |
| | | | | | | | 6,023 | |
| | | | | | | | | |
| New York 9.99% | | | | | | | | |
| City of New York, G.O. Bonds, Fiscal 2008 Series J-4, 0.61% 20251 | | | 5,000 | | | | 4,996 | |
| City of New York, G.O. Bonds, Fiscal 2010 Series C, 5.00% 2014 | | | 1,000 | | | | 1,000 | |
| City of New York, G.O. Bonds, Fiscal 2010 Series C, 5.00% 2015 | | | 1,000 | | | | 1,049 | |
| City of New York, G.O. Bonds, Fiscal 2011 Series B, 5.00% 2015 | | | 1,000 | | | | 1,049 | |
| City of New York, G.O. Bonds, Fiscal 2011 Series I-1, 5.00% 2015 | | | 1,000 | | | | 1,049 | |
| City of New York, G.O. Bonds, Fiscal 2011 Series I-1, 5.00% 2017 | | | 1,000 | | | | 1,129 | |
| City of New York, G.O. Bonds, Fiscal 2012 Series I, 5.00% 2018 | | | 1,000 | | | | 1,155 | |
| City of New York, G.O. Bonds, Fiscal 2014 Series A-6, 0.56% 20311 | | | 2,500 | | | | 2,471 | |
| New York City, Health and Hospitals Corp., Health System Rev. Ref. Bonds, Series 2010-A, 5.00% 2017 | | | 3,000 | | | | 3,320 | |
| Thruway Auth., General Rev. Junior Indebtedness Obligations Series 2013-A, 5.00% 2019 | | | 4,700 | | | | 5,450 | |
| Tobacco Settlement Fncg. Corp., Asset-Backed Rev. Bonds, Series 2013-B, 5.00% 2020 | | | 2,900 | | | | 3,140 | |
| Other securities | | | | | | | 53,862 | |
| | | | | | | | 79,670 | |
| | | | | | | | | |
| North Dakota 0.55% | | | | | | | | |
| Housing Fin. Agcy., Housing Fin. Program Bonds (Home Mortgage Fin. Program), Series 2012-A, 3.75% 2042 | | | 3,440 | | | | 3,740 | |
| Other securities | | | | | | | 678 | |
| | | | | | | | 4,418 | |
| American Funds Tax-Exempt Funds | 19 |
American Funds Short-Term Tax-Exempt Bond Fund
Bonds, notes & other debt
instruments (continued) | | Principal amount
(000) | | | Value
(000) | |
| Ohio 2.25% | | | | | | | | |
| City of Cleveland, Airport System Rev. Ref. Bonds, Series 2011-A, Assured Guaranty Municipal insured, 5.00% 2016 | | $ | 4,500 | | | $ | 4,784 | |
| Other securities | | | | | | | 13,129 | |
| | | | | | | | 17,913 | |
| | | | | | | | | |
| Oregon 1.40% | | | | | | | | |
| Facs. Auth., Rev. Ref. Bonds (Providence Health & Services), Series 2013-C, 1.06% 2022 (put 2018)1 | | | 3,000 | | | | 3,013 | |
| Other securities | | | | | | | 8,166 | |
| | | | | | | | 11,179 | |
| | | | | | | | | |
| Pennsylvania 1.86% | | | | | | | | |
| Econ. Dev. Fncg. Auth., Unemployment Compensation Rev. Bonds, Series 2012-B, 5.00% 2021 | | | 4,000 | | | | 4,528 | |
| Other securities | | | | | | | 10,292 | |
| | | | | | | | 14,820 | |
| | | | | | | | | |
| Rhode Island 0.61% | | | | | | | | |
| Health and Educational Building Corp., | | | | | | | | |
| Hospital Fncg. Rev. Ref. Bonds (Lifespan Obligated Group Issue), Series 2006-A, Assured Guaranty Municipal insured, 5.00% 2016 | | | 3,000 | | | | 3,210 | |
| Other securities | | | | | | | 1,633 | |
| | | | | | | | 4,843 | |
| | | | | | | | | |
| Tennessee 2.21% | | | | | | | | |
| Housing Dev. Agcy., Homeownership Program Bonds, Issue 2012-1-C, 4.50% 2037 | | | 1,255 | | | | 1,401 | |
| Housing Dev. Agcy., Homeownership Program Bonds, Issue 2012-2-C, 4.00% 2038 | | | 895 | | | | 983 | |
| Housing Dev. Agcy., Homeownership Program Rev. Ref. Bonds, Issue 2011-1-A, AMT, 4.50% 2031 | | | 2,215 | | | | 2,381 | |
| Housing Dev. Agcy., Homeownership Program Rev. Ref. Bonds, Issue 2012-1-A, AMT, 4.50% 2038 | | | 1,055 | | | | 1,135 | |
| Housing Dev. Agcy., Residential Fin. Program Bonds, Issue 2013-1-C, 3.00% 2038 | | | 1,845 | | | | 1,948 | |
| Housing Dev. Agcy., Residential Fin. Program Bonds, Series 2013-2-A, AMT, 4.00% 2043 | | | 970 | | | | 1,036 | |
| Housing Dev. Agcy., Residential Fin. Program Bonds, Series 2014-1-A, AMT, 4.00% 2039 | | | 2,000 | | | | 2,166 | |
| Memphis-Shelby County Airport Auth., Airport Rev. Ref. Bonds, Series 2011-A-1, AMT, 5.00% 2016 | | | 3,220 | | | | 3,485 | |
| Other securities | | | | | | | 3,078 | |
| | | | | | | | 17,613 | |
| | | | | | | | | |
| Texas 6.24% | | | | | | | | |
| Grand Parkway Transportation Corp., Grand Parkway System Toll Rev. Ref. Bond | | | | | | | | |
| Anticipation Notes, Series 2014-A, 3.00% 2016 | | | 8,150 | | | | 8,630 | |
| Houston Independent School Dist. (Harris County), Limited Tax Schoolhouse Bonds, Series 2013-B, 2.00% 2037 (put 2016) | | | 3,400 | | | | 3,497 | |
| Other securities | | | | | | | 37,615 | |
| | | | | | | | 49,742 | |
| 20 | American Funds Tax-Exempt Funds |
American Funds Short-Term Tax-Exempt Bond Fund
| | | Principal amount
(000) | | | Value
(000) | |
| Vermont 0.41% | | | | | | | | |
| Student Assistance Corp., Education Loan Rev. Notes, Series 2012-B, AMT, 1.732% 20221 | | $ | 3,271 | | | $ | 3,277 | |
| | | | | | | | | |
| Virginia 0.72% | | | | | | | | |
| Commonwealth Transportation Board, Federal Transportation Grant Anticipation Rev. Notes, Series 2013-A, 5.00% 2020 | | | 3,000 | | | | 3,553 | |
| Other securities | | | | | | | 2,224 | |
| | | | | | | | 5,777 | |
| | | | | | | | | |
| Washington 3.19% | | | | | | | | |
| Energy Northwest, Electric Rev. Ref. Bonds (Project 1), Series 2012-A, 5.00% 2017 | | | 5,000 | | | | 5,641 | |
| Other securities | | | | | | | 19,813 | |
| | | | | | | | 25,454 | |
| Other states & U.S. territories 13.84% | | | | | | | | |
| Other securities | | | | | | | 110,297 | |
| Total bonds, notes & other debt instruments (cost: $668,562,000) | | | | | | | 678,915 | |
| | | | | | | | | |
| Short-term securities 15.57% | | | | | | | | |
| | | | | | | | | |
| State of Arizona, Maricopa County, Pollution Control Corp., Pollution Control Rev. Ref. Bonds (Arizona Public Service Co. Palo Verde Project), Series 2009-B, JPMorgan Chase LOC, 0.07% 20291 | | | 7,500 | | | | 7,500 | |
| State of California, Infrastructure and Econ. Dev. Bank, Demand Rev. Bonds (Buck Institute for Age Research) Series 2001, U.S. Bank LOC, 0.05% 20371 | | | 12,000 | | | | 12,000 | |
| State of Colorado, General Fund Tax and Rev. Anticipation Notes, Series 2014-A, 1.50% 6/26/2015 | | | 19,000 | | | | 19,239 | |
| State of Louisiana, Industrial Dev. Board of the Parish of East Baton Rouge, Inc., Gulf Opportunity Zone Rev. Bonds (ExxonMobil Project), Series 2010-B, 0.05% 20401 | | | 3,350 | | | | 3,350 | |
| State of Texas, Gulf Coast Waste Disposal Auth., Environmental Facs. Rev. Bonds (ExxonMobil Project), Series 2000, AMT, 0.06% 20301 | | | 1,700 | | | | 1,700 | |
| State of Texas, Gulf Coast Waste Disposal Auth., Environmental Facs. Rev. Bonds (ExxonMobil Project), Series 2001-B, AMT, 0.06% 20251 | | | 4,200 | | | | 4,200 | |
| State of Texas, Lower Neches Valley Auth., Industrial Dev. Corp. Rev. Bonds (ExxonMobil Project), Series 2011, 0.04% 20381 | | | 8,000 | | | | 8,000 | |
| State of Mississippi, Business Fin. Corp., Gulf Opportunity Zone Industrial Dev. Rev. Bonds (Chevron U.S.A. Inc. Project), Series 2009-F, 0.05% 20301 | | | 2,100 | | | | 2,100 | |
| State of Mississippi, Business Fin. Corp., Gulf Opportunity Zone Industrial Dev. Rev. Bonds (Chevron U.S.A. Inc. Project), Series 2010-B, 0.05% 20301 | | | 1,000 | | | | 1,000 | |
| State of Mississippi, Business Fin. Corp., Gulf Opportunity Zone Industrial Dev. Rev. Bonds (Chevron U.S.A. Inc. Project), Series 2010-K, 0.05% 20351 | | | 2,700 | | | | 2,700 | |
| American Funds Tax-Exempt Funds | 21 |
American Funds Short-Term Tax-Exempt Bond Fund
| Short-term securities (continued) | | Principal amount
(000) | | | Value
(000) | |
| State of Mississippi, Business Fin. Corp., Gulf Opportunity Zone Industrial Dev. Rev. Bonds (Chevron U.S.A. Inc. Project), Series 2011-A, 0.04% 20351 | | $ | 6,445 | | | $ | 6,445 | |
| State of Missouri, Health and Educational Facs. Auth., Demand Educational Facs. Rev. Bonds (Washington University), Series 1996-D, 0.04% 20301 | | | 5,300 | | | | 5,300 | |
| State of Missouri, Health and Educational Facs. Auth., Demand Educational Facs. Rev. Bonds (Washington University), Series 2003-B, 0.05% 20331 | | | 3,550 | | | | 3,550 | |
| State of Missouri, Health and Educational Facs. Auth., Demand Educational Facs. Rev. Bonds (Washington University), Series 2004-A, 0.05% 20341 | | | 1,745 | | | | 1,745 | |
| State of New York, City of New York, G.O. Bonds, Fiscal 2008 Series L, Subseries L-4, 0.06% 20381 | | | 2,000 | | | | 2,000 | |
| State of New York, City of New York, G.O. Bonds, Fiscal 2012 Series G, Subseries G-5, 0.04% 20421 | | | 2,300 | | | | 2,300 | |
| State of Oregon, Full Faith and Credit Tax Anticipation Notes, Series 2014-A, 2.00% 6/15/2015 | | | 4,950 | | | | 5,031 | |
| State of Texas, Tax and Rev. Anticipation Notes, Series 2013, 2.00% 8/28/2014 | | | 20,000 | | | | 20,029 | |
| Other securities | | | | | | | 15,940 | |
| | | | | | | | | |
| Total short-term securities (cost: $124,125,000) | | | | | | | 124,129 | |
| Total investment securities 100.72% (cost: $792,687,000) | | | | | | | 803,044 | |
| Other assets less liabilities (0.72)% | | | | | | | (5,770 | ) |
| | | | | | | | | |
| Net assets 100.00% | | | | | | $ | 797,274 | |
This summary investment portfolio is designed to streamline the report and help investors better focus on the fund’s principal holdings. See page 88 for details on how to obtain a complete schedule of portfolio holdings.
“Other securities” includes all issues that are not disclosed separately in the summary investment portfolio.
| 1 | Coupon rate may change periodically. For short-term securities, the date of the next scheduled coupon rate change is considered to be the maturity date. |
Key to abbreviations
Agcy. = Agency
AMT = Alternative Minimum Tax
Auth. = Authority
Certs. of Part. = Certificates of Participation
Dept. = Department
Dev. = Development
Dist. = District
Econ. = Economic
Fac. = Facility
Facs. = Facilities
Fin. = Finance
Fncg. = Financing
G.O. = General Obligation
LOC = Letter of Credit
Preref. = Prerefunded
Redev. = Redevelopment
Ref. = Refunding
Rev. = Revenue
TECP = Tax-Exempt Commercial Paper
See Notes to Financial Statements
| 22 | American Funds Tax-Exempt Funds |
Limited Term Tax-Exempt Bond Fund of America
Summary investment portfolio July 31, 2014
Bonds, notes & other debt
instruments 91.02% | | Principal amount
(000) | | | Value
(000) | |
| California 11.91% | | | | | | | | |
Bay Area Toll Auth., San Francisco Bay Area Toll Bridge Rev. Ref. Bonds,
Series 2006-C-1, 0.96% 2045 (put 2023)1 | | $ | 20,500 | | | $ | 20,259 | |
| Econ. Recovery Bonds, Ref. Series 2009-A, 5.00% 2020 | | | 9,000 | | | | 10,645 | |
| Health Facs. Fncg. Auth., Rev. Ref. Bonds (St. Joseph Health System), Series 2009-D, 5.00% 2034 (put 2016) | | | 7,500 | | | | 8,231 | |
| City of Long Beach, Harbor Rev. Ref. Bonds, Series 1998-A, AMT, FGIC-National insured, 6.00% 2016 | | | 8,430 | | | | 9,267 | |
| Los Angeles Unified School Dist. (County of Los Angeles), G.O. Ref. Bonds, Series 2011-A-1, 5.00% 2018 | | | 7,010 | | | | 8,139 | |
| Port of Oakland, Rev. Ref. Bonds, Series 2012-P, AMT, 5.00% 2021 | | | 7,750 | | | | 9,109 | |
| Pollution Control Fncg. Auth., Solid Waste Disposal Rev. Ref. Bonds (Republic Services, Inc. Project), Series 2002-C, AMT, 5.25% 2023 (put 2017)2 | | | 8,250 | | | | 8,989 | |
| Public Facs. Fncg. Auth. of the City of San Diego, Sewer Rev. Bonds, Series 2009-A, 5.00% 2017 | | | 8,500 | | | | 9,585 | |
| City of San Jose, Airport Rev. Bonds, Series 2007-A, AMT, AMBAC insured, 5.50% 2020 | | | 7,820 | | | | 8,607 | |
| Other securities | | | | | | | 273,620 | |
| | | | | | | | 366,451 | |
| | | | | | | | | |
| Connecticut 0.46% | | | | | | | | |
| Special Tax Obligation Ref. Bonds, Transportation Infrastructure Purposes, Series 2009-1, 5.00% 2019 | | | 8,550 | | | | 9,936 | |
| Other securities | | | | | | | 4,344 | |
| | | | | | | | 14,280 | |
| | | | | | | | | |
| District of Columbia 1.22% | | | | | | | | |
| University Rev. Bonds (Georgetown University Issue), Series 2001-B, 4.70% 2031 (put 2018) | | | 8,500 | | | | 9,428 | |
| Other securities | | | | | | | 28,194 | |
| | | | | | | | 37,622 | |
| | | | | | | | | |
| Florida 9.74% | | | | | | | | |
| Citizens Property Insurance Corp., Coastal Account Secured Bonds, Series 2011-A-1, 5.00% 2018 | | | 2,000 | | | | 2,285 | |
| Citizens Property Insurance Corp., Coastal Account Secured Bonds, Series 2011-A-1, 5.00% 2019 | | | 5,000 | | | | 5,800 | |
| Citizens Property Insurance Corp., High-Risk Account Secured Bonds, Series 2009-A-1, 5.50% 2017 | | | 10,035 | | | | 11,371 | |
| Citizens Property Insurance Corp., High-Risk Account Secured Bonds, Series 2010-A-1, 5.00% 2015 | | | 5,500 | | | | 5,722 | |
| Citizens Property Insurance Corp., High-Risk Account Secured Bonds, Series 2010-A-1, 5.25% 2017 | | | 5,850 | | | | 6,588 | |
| Citizens Property Insurance Corp., Personal Lines Account/Commercial Lines Account Secured Bonds, Series 2012-A-1, 5.00% 2022 | | | 10,200 | | | | 12,027 | |
| Jacksonville Aviation Auth., Rev. Bonds, Series 2006, AMT, AMBAC insured, 5.00% 2018 | | | 7,585 | | | | 8,268 | |
| Miami-Dade County, Aviation Rev. Bonds, Series 2010-A, 5.00% 2021 | | | 2,250 | | | | 2,599 | |
| Miami-Dade County, Aviation Rev. Ref. Bonds, AMT, 5.00% 2023 | | | 945 | | | | 1,095 | |
| Miami-Dade County, Aviation Rev. Ref. Bonds, Series 2012-A, AMT, 5.00% 2020 | | | 5,750 | | | | 6,718 | |
| Miami-Dade County, Aviation Rev. Ref. Bonds, Series 2012-A, AMT, 5.00% 2021 | | | 11,600 | | | | 13,554 | |
| Miami-Dade County, Miami International Airport (Hub of the Americas), Aviation Rev. Ref. Bonds, Series 2003-E, AMT, National insured, 5.375% 2017 | | | 2,000 | | | | 2,277 | |
Miami-Dade County, Miami International Airport (Hub of the Americas),
Aviation Rev. Ref. Bonds, Series 2005-B, AMT, XLC Ainsured, 5.00% 2018 | | | 1,000 | | | | 1,052 | |
Miami-Dade County, Miami International Airport (Hub of the Americas),
Aviation Rev. Ref. Bonds, Series 2009-A, 5.75% 2022 | | | 1,500 | | | | 1,790 | |
| American Funds Tax-Exempt Funds | 23 |
Limited Term Tax-Exempt Bond Fund of America
Bonds, notes & other debt
instruments (continued) | | Principal amount
(000) | | | Value
(000) | |
| Florida (continued) | | | | | | | | |
| Miami-Dade County, Miami International Airport (Hub of the Americas), Aviation Rev. Ref. Bonds, Series 2009-B, 5.50% 2018 | | $ | 3,580 | | | $ | 4,206 | |
| Miami-Dade County, Miami International Airport (Hub of the Americas), Aviation Rev. Ref. Bonds, Series 2009-B, 5.75% 2021 | | | 2,000 | | | | 2,404 | |
| Putnam County Dev. Auth., Pollution Control Rev. Ref. Bonds (Seminole Electric Cooperative, Inc. Project), Series 2007-B, AMBAC insured, 5.35% 2042 (put 2018) | | | 10,370 | | | | 11,814 | |
| Other securities | | | | | | | 200,036 | |
| | | | | | | | 299,606 | |
| | | | | | | | | |
| Georgia 2.71% | | | | | | | | |
| DeKalb County Hospital Auth., Rev. Ref. Anticipation Certificates (DeKalb Medical Center, Inc. Project), Series 2010, 5.25% 2020 | | | 8,750 | | | | 9,766 | |
| Municipal Electric Auth., Project One Rev. Ref. Bonds, Series 2008-D, 5.75% 2019 | | | 16,000 | | | | 18,830 | |
| Public Gas Partners, Inc., Gas Project Rev. Ref. Bonds (Gas Supply Pool No.1), Series A, 5.00% 2018 | | | 10,930 | | | | 12,431 | |
| Other securities | | | | | | | 42,177 | |
| | | | | | | | 83,204 | |
| | | | | | | | | |
| Hawaii 0.82% | | | | | | | | |
| Airports System Rev. Bonds, Series 2010-B, AMT, 5.00% 2018 | | | 9,900 | | | | 11,329 | |
| Other securities | | | | | | | 13,783 | |
| | | | | | | | 25,112 | |
| | | | | | | | | |
| Illinois 7.98% | | | | | | | | |
| City of Chicago, O’Hare International Airport, General Airport Rev. Bonds, Series 2011-B, 5.00% 2017 | | | 1,500 | | | | 1,658 | |
| City of Chicago, O’Hare International Airport, General Airport Rev. Bonds, Series 2011-B, 5.00% 2019 | | | 2,785 | | | | 3,217 | |
| City of Chicago, O’Hare International Airport, General Airport Rev. Bonds, Series 2012-B, AMT, 5.00% 2024 | | | 2,000 | | | | 2,237 | |
| City of Chicago, O’Hare International Airport, General Airport Rev. Bonds, Series 2013-A, AMT, 5.00% 2022 | | | 3,055 | | | | 3,546 | |
| City of Chicago, O’Hare International Airport, General Airport Rev. Ref. Bonds, Series 2005-B, FGIC-National insured, 5.25% 2015 | | | 1,500 | | | | 1,532 | |
City of Chicago, O’Hare International Airport, General Airport Rev. Ref. Bonds,
Series 2005-B, National insured, 5.25% 2016 | | | 1,000 | | | | 1,069 | |
City of Chicago, O’Hare International Airport, General Airport Rev. Ref. Bonds,
Series 2008-A, Assured Guaranty Municipal insured, 5.00% 2019 | | | 2,000 | | | | 2,242 | |
City of Chicago, O’Hare International Airport, General Airport Rev. Ref. Bonds,
Series 2012-A, AMT, 5.00% 2025 | | | 6,170 | | | | 6,827 | |
| City of Chicago, O’Hare International Airport, General Airport Rev. Ref. Bonds, Series 2013-A, AMT, 5.00% 2021 | | | 10,000 | | | | 11,566 | |
| City of Chicago, O’Hare International Airport, General Airport Rev. Ref. Bonds, Series 2013-A, AMT, 5.00% 2023 | | | 5,000 | | | | 5,749 | |
| City of Chicago, O’Hare International Airport, Passenger Fac. Charge Rev. Ref. Bonds, Series 2012-B, AMT, 5.00% 2018 | | | 2,000 | | | | 2,260 | |
| City of Chicago, O’Hare International Airport, Passenger Fac. Charge Rev. Ref. Bonds, Series 2012-B, AMT, 5.00% 2019 | | | 2,000 | | | | 2,288 | |
| City of Chicago, O’Hare International Airport, Passenger Fac. Charge Rev. Ref. Bonds, Series 2013-B, AMT, 5.00% 2022 | | | 3,000 | | | | 3,482 | |
| Regional Transportation Auth. of Cook, DuPage, Kane, Lake, McHenry and Will Counties, G.O. Rev. Ref. Bonds, Series 2003-A, FGIC-National insured, 5.50% 2018 | | | 7,720 | | | | 9,023 | |
| Fin. Auth., Rev. Ref. Bonds (University of Chicago Medical Center), Series 2009-A, 5.00% 2018 | | | 7,500 | | | | 8,640 | |
| Railsplitter Tobacco Settlement Auth., Tobacco Settlement Rev. Bonds, Series 2010, 5.125% 2019 | | | 6,500 | | | | 7,514 | |
| Railsplitter Tobacco Settlement Auth., Tobacco Settlement Rev. Bonds, Series 2010, 5.25% 2020 | | | 6,500 | | | | 7,607 | |
| 24 | American Funds Tax-Exempt Funds |
Limited Term Tax-Exempt Bond Fund of America
| | | Principal amount | | | Value | |
| | | (000) | | | (000) | |
| Railsplitter Tobacco Settlement Auth., Tobacco Settlement Rev. Bonds, Series 2010, 5.375% 2021 | | $ | 1,000 | | | $ | 1,183 | |
| Railsplitter Tobacco Settlement Auth., Tobacco Settlement Rev. Bonds, Series 2010, 5.50% 2023 | | | 12,425 | | | | 14,475 | |
| State Toll Highway Auth., Toll Highway Priority Rev. Ref. Bonds, Series 1998-A, Assured Guaranty Municipal insured, 5.50% 2015 | | | 9,825 | | | | 10,045 | |
| Other securities | | | | | | | 139,200 | |
| | | | | | | | 245,360 | |
| | | | | | | | | |
| Indiana 3.16% | | | | | | | | |
| Fin. Auth., Private Activity Bonds (Ohio River Bridges East End Crossing Project), Series 2013-B, AMT, 5.00% 2019 | | | 10,440 | | | | 11,267 | |
| Indianapolis Airport Auth., Special Fac. Rev. Ref. Bonds (Federal Express Corp. Project), Series 2004, AMT, 5.10% 2017 | | | 20,545 | | | | 22,593 | |
| Indianapolis Local Public Improvement Bond Bank Bonds (Indianapolis Airport Auth. Project), Series 2006-F, AMT, AMBAC insured, 5.00% 2022 | | | 7,500 | | | | 8,055 | |
| Other securities | | | | | | | 55,247 | |
| | | | | | | | 97,162 | |
| | | | | | | | | |
| Kentucky 1.32% | | | | | | | | |
| Public Transportation Infrastructure Auth., Toll Rev. Bond Anticipation Notes (Downtown Crossing Project), Series 2013-A, 5.00% 2017 | | | 8,625 | | | | 9,600 | |
| Other securities | | | | | | | 31,067 | |
| | | | | | | | 40,667 | |
| | | | | | | | | |
| Louisiana 1.68% | | | | | | | | |
| Tobacco Settlement Fncg. Corp., Tobacco Settlement Asset-Backed Ref. Bonds, Series 2013-A, 5.00% 2022 | | | 8,235 | | | | 9,383 | |
| Other securities | | | | | | | 42,175 | |
| | | | | | | | 51,558 | |
| | | | | | | | | |
| Maryland 0.65% | | | | | | | | |
| Transportation Auth., Airport Parking Rev. Ref. Bonds (Baltimore/Washington International | | | | | | | | |
| Thurgood Marshall Airport Projects), Series 2012-B, AMT, 5.00% 2020 | | | 8,150 | | | | 9,378 | |
| Other securities | | | | | | | 10,458 | |
| | | | | | | | 19,836 | |
| | | | | | | | | |
| Michigan 4.27% | | | | | | | | |
| Wayne County Airport Auth., Airport Rev. Bonds (Detroit Metropolitan Wayne County Airport), Series 2005, AMT, National insured, 5.25% 2016 | | | 3,000 | | | | 3,175 | |
| Wayne County Airport Auth., Airport Rev. Bonds (Detroit Metropolitan Wayne County Airport), Series 2007, AMT, FGIC-National insured, 5.00% 2018 | | | 1,000 | | | | 1,112 | |
| Wayne County Airport Auth., Airport Rev. Ref. Bonds (Detroit Metropolitan Wayne County Airport), Series 2008-A, AMT, Assured Guaranty insured, 5.25% 2018 | | | 1,465 | | | | 1,587 | |
| Wayne County Airport Auth., Airport Rev. Ref. Bonds (Detroit Metropolitan Wayne County Airport), Series 2010-A, AMT, 5.00% 2017 | | | 1,615 | | | | 1,809 | |
| Wayne County Airport Auth., Airport Rev. Ref. Bonds (Detroit Metropolitan Wayne County Airport), Series 2010-A, AMT, 5.00% 2018 | | | 3,590 | | | | 4,070 | |
| Wayne County Airport Auth., Airport Rev. Ref. Bonds (Detroit Metropolitan Wayne County Airport), Series 2011-A, AMT, 5.00% 2019 | | | 1,000 | | | | 1,145 | |
| Wayne County Airport Auth., Airport Rev. Ref. Bonds (Detroit Metropolitan Wayne County Airport), Series 2011-A, AMT, 5.00% 2020 | | | 10,000 | | | | 11,507 | |
| Wayne County Airport Auth., Airport Rev. Ref. Bonds (Detroit Metropolitan Wayne County Airport), Series 2011-A, AMT, 5.00% 2021 | | | 8,240 | | | | 9,480 | |
| Wayne County Airport Auth., Airport Rev. Ref. Bonds (Detroit Metropolitan Wayne County Airport), Series 2011-B, 5.00% 2019 | | | 1,000 | | | | 1,148 | |
| Wayne County Airport Auth., Airport Rev. Ref. Bonds (Detroit Metropolitan Wayne County Airport), Series 2012-D, AMT, 5.00% 2019 | | | 3,560 | | | | 4,077 | |
| Other securities | | | | | | | 92,093 | |
| | | | | | | | 131,203 | |
| American Funds Tax-Exempt Funds | 25 |
Limited Term Tax-Exempt Bond Fund of America
Bonds, notes & other debt
instruments (continued) | | Principal amount
(000) | | | Value
(000) | |
| Nevada 2.12% | | | | | | | | |
| Clark County, Highway Rev. (Motor Vehicle Fuel Tax) Ref. Bonds, Series 2011, 5.00% 2020 | | $ | 12,320 | | | $ | 14,557 | |
| Las Vegas Valley Water Dist., G.O. (Limited Tax) Ref. Bonds, Series 2011-C, 5.00% 2019 | | | 7,760 | | | | 9,059 | |
| Other securities | | | | | | | 41,725 | |
| | | | | | | | 65,341 | |
| | | | | | | | | |
| New Jersey 2.60% | | | | | | | | |
| Transit Corp., Certs. of Part., Series 2003-A, AMBAC insured, 5.25% 2014 (escrowed to maturity) | | | 8,000 | | | | 8,050 | |
| Other securities | | | | | | | 71,856 | |
| | | | | | | | 79,906 | |
| | | | | | | | | |
| New York 8.85% | | | | | | | | |
| City of New York, G.O. Bonds, Fiscal 2008 Series J-4, 0.61% 20251 | | | 6,325 | | | | 6,320 | |
| City of New York, G.O. Bonds, Fiscal 2009 Series H-1, 5.00% 2016 | | | 2,000 | | | | 2,151 | |
| City of New York, G.O. Bonds, Fiscal 2011 Series B, 5.00% 2015 | | | 3,500 | | | | 3,671 | |
| City of New York, G.O. Bonds, Fiscal 2011 Series I-1, 5.00% 2017 | | | 5,000 | | | | 5,647 | |
| City of New York, G.O. Bonds, Fiscal 2012 Series I, 5.00% 2020 | | | 5,000 | | | | 5,914 | |
| City of New York, G.O. Bonds, Series 2013-E, 5.25% 2022 | | | 5,000 | | | | 6,063 | |
| City of New York, G.O. Bonds, Series 2014-G, 5.00% 2023 | | | 1,500 | | | | 1,802 | |
| Metropolitan Transportation Auth., Transportation Rev. Bonds, Series 2014-C, 5.00% 2024 | | | 5,000 | | | | 6,010 | |
| Metropolitan Transportation Auth., Transportation Rev. Bonds, Series 2003-B, FGIC-National insured, 5.25% 2020 | | | 5,500 | | | | 6,607 | |
| Metropolitan Transportation Auth., Transportation Rev. Bonds, Series 2008-C, 5.50% 2018 | | | 8,500 | | | | 9,298 | |
| Metropolitan Transportation Auth., Transportation Rev. Bonds, Series 2012-A2, 0.33% 2041 (put 2016)1 | | | 1,000 | | | | 1,000 | |
| Metropolitan Transportation Auth., Transportation Rev. Bonds, Series 2012-E, 5.00% 2020 | | | 3,250 | | | | 3,856 | |
| Metropolitan Transportation Auth., Transportation Rev. Bonds, Series 2014-A-1, 4.00% 2021 | | | 3,470 | | | | 3,888 | |
| Metropolitan Transportation Auth., Transportation Rev. Ref. Bonds, Series 2002-G-1H, 0.952% 2026 (put 2016)1 | | | 2,650 | | | | 2,681 | |
| Metropolitan Transportation Auth., Transportation Rev. Ref. Bonds, Series 2011-C, 5.00% 2018 | | | 1,105 | | | | 1,286 | |
| Metropolitan Transportation Auth., Transportation Rev. Ref. Bonds, Series 2012-D, 5.00% 2020 | | | 7,000 | | | | 8,306 | |
| Metropolitan Transportation Auth., Transportation Rev. Ref. Bonds, Series 2012-F, 5.00% 2021 | | | 1,000 | | | | 1,192 | |
| Metropolitan Transportation Auth., Transportation Rev. Ref. Bonds, Series 2014-A-2, 5.00% 2028 | | | 3,000 | | | | 3,453 | |
| Thruway Auth., Local Highway and Bridge Service Contract Rev. Ref. Bonds, Series 2009, 5.00% 2017 | | | 10,000 | | | | 11,171 | |
| Other securities | | | | | | | 181,904 | |
| | | | | | | | 272,220 | |
| | | | | | | | | |
| South Carolina 0.65% | | | | | | | | |
| Transportation Infrastructure Bank, Rev. Ref. Bonds, Series 2005-A, AMBAC insured, 5.25% 2018 | | | 8,000 | | | | 9,356 | |
| Other securities | | | | | | | 10,766 | |
| | | | | | | | 20,122 | |
| 26 | American Funds Tax-Exempt Funds |
Limited Term Tax-Exempt Bond Fund of America
| | | Principal amount
(000) | | | Value
(000) | |
| Texas 7.94% | | | | | | | | |
| G.O. Bonds, College Student Loan Bonds, Series 2011-A, AMT, 5.00% 2019 | | $ | 1,700 | | | $ | 1,996 | |
| G.O. Bonds, Water Financial Assistance Bonds (Water Infrastructure Fund), Series 2009-A, 5.00% 2019 | | | 1,000 | | | | 1,161 | |
| Transportation Commission, G.O. Mobility Fund Bonds, Series 2008, 5.00% 2020 | | | 3,640 | | | | 4,170 | |
| Transportation Commission, G.O. Mobility Fund Bonds, Series 2008, 5.00% 2020 (preref. 2018) | | | 360 | | | | 414 | |
| City of Houston, Airport System Rev. Ref. Bonds, Series 2011-A, AMT, 5.00% 2019 | | | 10,000 | | | | 11,594 | |
| North Texas Tollway Auth., System Rev. Ref. Bonds, Series 2008-E-3, 5.75% 2038 (put 2016) | | | 9,850 | | | | 10,523 | |
| Other securities | | | | | | | 214,522 | |
| | | | | | | | 244,380 | |
| | | | | | | | | |
| Wisconsin 1.31% | | | | | | | | |
| Health and Educational Facs. Auth., Rev. Ref. Bonds (Aurora Health Care, Inc.), Series 2012-A, 5.00% 2021 | | | 7,765 | | | | 8,775 | |
| Other securities | | | | | | | 31,625 | |
| | | | | | | | 40,400 | |
| | | | | | | | | |
| Other states & U.S. territories 21.63% | | | | | | | | |
| Other securities | | | | | | | 665,545 | |
| Total bonds, notes & other debt instruments (cost: $2,647,273,000) | | | | | | | 2,799,975 | |
| | | | | | | | | |
| Short-term securities 8.64% | | | | | | | | |
| State of Alaska, City of Valdez, Marine Terminal Rev. Ref. Bonds (Exxon Pipeline Co. Project), Series 1993-B, 0.05% 20331 | | | 3,600 | | | | 3,600 | |
| State of Alaska, City of Valdez, Marine Terminal Rev. Ref. Bonds (ExxonMobil Project), Series 2001, 0.05% 20291 | | | 5,300 | | | | 5,300 | |
| State of Louisiana, Industrial Dev. Board of the Parish of East Baton Rouge, Inc., Gulf Opportunity Zone Rev. Bonds (ExxonMobil Project), Series 2010-B, 0.05% 20401 | | | 5,000 | | | | 5,000 | |
| State of Louisiana, Parish of East Baton Rouge, Pollution Control Rev. Ref. Bonds (ExxonMobil Project), Series 2010-A, 0.05% 20351 | | | 3,700 | | | | 3,700 | |
| State of Texas, Gulf Coast Waste Disposal Auth., Environmental Facs. Rev. Bonds (ExxonMobil Project), Series 2000, AMT, 0.06% 20301 | | | 1,100 | | | | 1,100 | |
| State of Wyoming, Lincoln County, Pollution Control Rev. Bonds (Exxon Project), Series 1984-C, 0.05% 11/1/20141 | | | 4,800 | | | | 4,800 | |
| State of California, Pollution Control Fncg. Auth., Pollution Control Rev. Ref. Bonds (Pacific Gas and Electric Co.), Series 1996-C, JPMorgan Chase LOC, 0.04% 20261 | | | 9,900 | | | | 9,900 | |
State of California, Pollution Control Fncg. Auth.,
Pollution Control Rev. Ref. Bonds (Pacific Gas and Electric Co.),
Series 1996-E, JPMorgan Chase LOC, 0.04% 20261 | | | 16,300 | | | | 16,300 | |
| State of Colorado, General Fund Tax and Rev. Anticipation Notes, Series 2014-A, 1.50% 6/26/2015 | | | 25,000 | | | | 25,314 | |
| State of Mississippi, Business Fin. Corp., Gulf Opportunity Zone Industrial Dev. Rev. Bonds (Chevron U.S.A. Inc. Project), Series 2007-A, 0.05% 20301 | | | 4,000 | | | | 4,000 | |
| State of Mississippi, Business Fin. Corp., Gulf Opportunity Zone Industrial Dev. Rev. Bonds (Chevron U.S.A. Inc. Project), Series 2007-E, 0.05% 20301 | | | 1,700 | | | | 1,700 | |
| State of Mississippi, Business Fin. Corp., Gulf Opportunity Zone Industrial Dev. Rev. Bonds (Chevron U.S.A. Inc. Project), Series 2009-E, 0.05% 20301 | | | 3,000 | | | | 3,000 | |
| American Funds Tax-Exempt Funds | 27 |
Limited Term Tax-Exempt Bond Fund of America
| Short-term securities (continued) | | Principal amount
(000) | | | Value
(000) | |
| State of Mississippi, Business Fin. Corp., Gulf Opportunity Zone Industrial Dev. Rev. Bonds (Chevron U.S.A. Inc. Project), Series 2009-G, 0.04% 20301 | | $ | 1,200 | | | $ | 1,200 | |
| State of Mississippi, Business Fin. Corp., Gulf Opportunity Zone Industrial Dev. Rev. Bonds (Chevron U.S.A. Inc. Project), Series 2010-G, 0.04% 20351 | | | 6,840 | | | | 6,840 | |
| State of Mississippi, Business Fin. Corp., Gulf Opportunity Zone Industrial Dev. Rev. Bonds (Chevron U.S.A. Inc. Project), Series 2010-I, 0.04% 20351 | | | 1,300 | | | | 1,300 | |
| State of Mississippi, Business Fin. Corp., Gulf Opportunity Zone Industrial Dev. Rev. Bonds (Chevron U.S.A. Inc. Project), Series 2010-K, 0.05% 20351 | | | 3,000 | | | | 3,000 | |
| State of Mississippi, Business Fin. Corp., Gulf Opportunity Zone Industrial Dev. Rev. Bonds (Chevron U.S.A. Inc. Project), Series 2011-F, 0.05% 20351 | | | 2,745 | | | | 2,745 | |
| State of Mississippi, Jackson County, Port Fac. Rev. Ref. Bonds (Chevron U.S.A. Inc. Project), Series 1993, 0.04% 20231 | | | 3,900 | | | | 3,900 | |
| State of Wyoming, Uinta County, Pollution Control Rev. Ref. Bonds (Chevron U.S.A. Inc. Project), Series 1993, 0.04% 20201 | | | 3,300 | | | | 3,300 | |
| State of New York, City of New York, G.O. Bonds, Fiscal 1994 Series E-2, 0.06% 20201 | | | 3,000 | | | | 3,000 | |
| State of New York, City of New York, G.O. Bonds, Fiscal 2008 Series L, Subseries L-4, 0.06% 20381 | | | 10,800 | | | | 10,800 | |
| State of New York, City of New York, G.O. Bonds, Fiscal 2012 Series G, Subseries G-5, 0.04% 20421 | | | 1,800 | | | | 1,800 | |
| State of North Carolina, Charlotte-Mecklenburg Hospital Auth., Carolinas HealthCare System, Health Care Rev. Ref. Bonds, Series 2007-B, Wells Fargo Bank LOC, 0.04% 20451 | | | 13,695 | | | | 13,695 | |
| State of Texas, Tax and Rev. Anticipation Notes, Series 2013, 2.00% 8/28/2014 | | | 75,000 | | | | 75,111 | |
| Other securities | | | | | | | 55,301 | |
| | | | | | | | | |
| Total short-term securities (cost: $265,694,000) | | | | | | | 265,706 | |
| Total investment securities 99.66% (cost: $2,912,967,000) | | | | | | | 3,065,681 | |
| Other assets less liabilities 0.34% | | | | | | | 10,545 | |
| | | | | | | | | |
| Net assets 100.00% | | | | | | $ | 3,076,226 | |
This summary investment portfolio is designed to streamline the report and help investors better focus on the fund’s principal holdings. See page 88 for details on how to obtain a complete schedule of portfolio holdings.
“Other securities” includes all issues that are not disclosed separately in the summary investment portfolio.
| 1 | Coupon rate may change periodically. For short-term securities, the date of the next scheduled coupon rate change is considered to be the maturity date. |
| 2 | Acquired in a transaction exempt from registration under Rule 144A of the Securities Act of 1933. May be resold in the U.S. in transactions exempt from registration, normally to qualified institutional buyers. The total value of all such securities, including those in “Other securities,” was $12,242,000, which represented .40% of the net assets of the fund. |
Key to abbreviations
Agcy. = Agency
AMT = Alternative Minimum Tax
Auth. = Authority
Certs. of Part. = Certificates of Participation
Dept. = Department
Dev. = Development
Dist. = District
Econ. = Economic
Fac. = Facility
Facs. = Facilities
Fin. = Finance
Fncg. = Financing
G.O. = General Obligation
LOC = Letter of Credit
Preref. = Prerefunded
Redev. = Redevelopment
Ref. = Refunding
Rev. = Revenue
TECP = Tax-Exempt Commercial Paper
See Notes to Financial Statements
| 28 | American Funds Tax-Exempt Funds |
The Tax-Exempt Bond Fund of America
Summary investment portfolio July 31, 2014
Bonds, notes & other debt
instruments 89.87% | | Principal amount
(000) | | | Value
(000) | |
| Arizona 2.99% | | | | | | | | |
| Health Facs. Auth., Rev. Bonds (Banner Health), Series 2007-B, 0.967% 20371 | | $ | 22,200 | | | $ | 19,279 | |
| Other securities | | | | | | | 259,770 | |
| | | | | | | | 279,049 | |
| | | | | | | | | |
| California 11.57% | | | | | | | | |
| Econ. Recovery Bonds, Ref. Series 2009-A, 5.25% 2021 | | | 17,750 | | | | 21,116 | |
| Foothill/Eastern Transportation Corridor Agcy., Toll Road Rev. Ref. Bonds, Series 2013-A, 6.00% 2053 | | | 24,000 | | | | 27,483 | |
| City of San Buenaventura, Rev. Bonds (Community Memorial Health System), Series 2011, 7.50% 2041 | | | 19,600 | | | | 22,608 | |
| Airport Commission, City and County of San Francisco, San Francisco International Airport, Second Series Rev. Bonds, Series 2009-E, 5.25% 2032 | | | 16,500 | | | | 18,834 | |
| Tobacco Securitization Auth. of Southern California, Tobacco Settlement Asset-backed Rev. Ref. Bonds (San Diego County Tobacco Asset Securitization Corp.), Series 2006-A, 5.125% 2046 | | | 25,440 | | | | 19,205 | |
| Turlock Irrigation Dist., Rev. Ref. Bonds, Series 2011, 5.50% 2041 | | | 17,990 | | | | 20,152 | |
| Other securities | | | | | | | 949,490 | |
| | | | | | | | 1,078,888 | |
| | | | | | | | | |
| Colorado 2.68% | | | | | | | | |
| Health Facs. Auth., Health Facs. Rev. Ref. Bonds (Evangelical Lutheran Good Samaritan Society Project), Series 2012, 5.00% 2042 | | | 26,000 | | | | 26,988 | |
| Regional Transportation Dist., Private Activity Bonds (Denver Transit Partners Eagle P3 Project), Series 2010, 6.00% 2041 | | | 23,765 | | | | 26,348 | |
| Other securities | | | | | | | 196,668 | |
| | | | | | | | 250,004 | |
| | | | | | | | | |
| Florida 7.91% | | | | | | | | |
| Citizens Property Insurance Corp., High-Risk Account Secured Bonds, Series 2009-A-1, 6.00% 2017 | | | 20,000 | | | | 22,931 | |
| Orlando-Orange County Expressway Auth., Rev. Ref. Bonds, Series 2013-A, 5.00% 2035 | | | 27,350 | | | | 29,888 | |
| Other securities | | | | | | | 684,456 | |
| | | | | | | | 737,275 | |
| | | | | | | | | |
| Georgia 3.30% | | | | | | | | |
| City of Atlanta, Water and Wastewater Rev. Ref. Bonds, Series 1999-A, FGIC-National insured, 5.50% 2022 | | | 20,500 | | | | 24,182 | |
Dev. Auth. of Burke County,
Pollution Control Rev. Bonds (Oglethorpe Power Corp. Vogtle Project), Series 2008-E, 7.00% 2023 | | | 19,670 | | | | 22,927 | |
| Municipal Electric Auth., Project One Rev. Ref. Bonds, Series 2008-D, 5.75% 2019 | | | 23,000 | | | | 27,068 | |
| Other securities | | | | | | | 233,476 | |
| | | | | | | | 307,653 | |
| | | | | | | | | |
| Hawaii 0.27% | | | | | | | | |
| Pacific Health Obligated Group, Special Purpose Rev. Bonds (Dept. of Budget and Fin.), Series 2013-A, 5.50% 2043 | | | 17,000 | | | | 18,957 | |
| Other securities | | | | | | | 6,010 | |
| | | | | | | | 24,967 | |
| | | | | | | | | |
| Illinois 8.90% | | | | | | | | |
| Fin. Auth., Student Housing Rev. Ref. Bonds (CHF-DeKalb II, L.L.C. – Northern Illinois University Project), Series 2011, 6.875% 2043 | | | 27,500 | | | | 31,750 | |
| State Toll Highway Auth., Toll Highway Priority Rev. Bonds, Series 2006-A-1, Assured Guaranty Municipal insured, 5.00% 2024 | | | 5,000 | | | | 5,398 | |
| State Toll Highway Auth., Toll Highway Rev. Bonds, Series 2008-B, 5.50% 2033 | | | 18,210 | | | | 20,206 | |
| State Toll Highway Auth., Toll Highway Rev. Bonds, Series 2013-A, 5.00% 2027 | | | 1,305 | | | | 1,501 | |
| State Toll Highway Auth., Toll Highway Rev. Bonds, Series 2013-A, 5.00% 2028 | | | 1,000 | | | | 1,138 | |
| State Toll Highway Auth., Toll Highway Rev. Bonds, Series 2013-A, 5.00% 2029 | | | 3,000 | | | | 3,399 | |
| American Funds Tax-Exempt Funds | 29 |
The Tax-Exempt Bond Fund of America
Bonds, notes & other debt
instruments (continued) | | Principal amount
(000) | | | Value
(000) | |
| Illinois (continued) | | | | | | | | |
| State Toll Highway Auth., Toll Highway Rev. Bonds, Series 2013-A, 5.00% 2030 | | $ | 7,100 | | | $ | 7,989 | |
| State Toll Highway Auth., Toll Highway Rev. Bonds, Series 2013-A, 5.00% 2032 | | | 1,000 | | | | 1,111 | |
| State Toll Highway Auth., Toll Highway Rev. Bonds, Series 2013-A, 5.00% 2033 | | | 2,200 | | | | 2,429 | |
| State Toll Highway Auth., Toll Highway Rev. Bonds, Series 2013-A, 5.00% 2038 | | | 28,250 | | | | 30,767 | |
| State Toll Highway Auth., Toll Highway Rev. Bonds, Series 2014-B, 5.00% 2038 | | | 2,500 | | | | 2,745 | |
| State Toll Highway Auth., Toll Highway Rev. Bonds, Series 2014-B, 5.00% 2039 | | | 3,000 | | | | 3,289 | |
| State Toll Highway Auth., Toll Highway Rev. Ref. Bonds, Series 2010-A-1, 4.50% 2027 | | | 6,000 | | | | 6,479 | |
| State Toll Highway Auth., Toll Highway Rev. Ref. Bonds, Series 2010-A-1, 5.00% 2025 | | | 10,000 | | | | 11,289 | |
| State Toll Highway Auth., Toll Highway Rev. Ref. Bonds, Series 2010-A-1, 5.00% 2028 | | | 10,000 | | | | 11,098 | |
| State Toll Highway Auth., Toll Highway Rev. Ref. Bonds, Series 2010-A-1, 5.00% 2031 | | | 4,000 | | | | 4,417 | |
| Other securities | | | | | | | 684,873 | |
| | | | | | | | 829,878 | |
| | | | | | | | | |
| Indiana 2.25% | | | | | | | | |
| Fin. Auth., Midwestern Disaster Relief Rev. Bonds (Ohio Valley Electric Corp. Project), Series 2012-A, 5.00% 2039 | | | 18,415 | | | | 18,815 | |
| Other securities | | | | | | | 190,726 | |
| | | | | | | | 209,541 | |
| | | | | | | | | |
| Iowa 0.45% | | | | | | | | |
| Fin. Auth., Midwestern Disaster Area Rev. Ref. Bonds (Iowa Fertilizer Co. Project), Series 2013, 5.00% 2019 | | | 23,000 | | | | 24,235 | |
| Other securities | | | | | | | 17,958 | |
| | | | | | | | 42,193 | |
| | | | | | | | | |
| Kentucky 0.49% | | | | | | | | |
| Public Transportation Infrastructure Auth., Toll Rev. Bonds (Downtown Crossing Project), Series 2013-A, 6.00% 2053 | | | 18,020 | | | | 20,374 | |
| Other securities | | | | | | | 25,052 | |
| | | | | | | | 45,426 | |
| | | | | | | | | |
| Louisiana 2.04% | | | | | | | | |
| Local Government Environmental Facs. and Community Dev. Auth., Rev. Bonds (Westlake Chemical Corp. Projects), Series 2007, 6.75% 2032 | | | 24,360 | | | | 27,135 | |
| Other securities | | | | | | | 162,725 | |
| | | | | | | | 189,860 | |
| | | | | | | | | |
| Massachusetts 2.46% | | | | | | | | |
| Dev. Fin. Agcy., Rev. Bonds (Boston University Issue), Series 2013-X, 5.00% 2048 | | | 17,500 | | | | 18,926 | |
| Other securities | | | | | | | 210,268 | |
| | | | | | | | 229,194 | |
| | | | | | | | | |
| Michigan 3.38% | | | | | | | | |
| Tobacco Settlement Fin. Auth., Tobacco Settlement Asset-backed Bonds, Current Interest Bonds, Series 2007-A, 6.00% 2048 | | | 43,205 | | | | 34,108 | |
| Other securities | | | | | | | 280,674 | |
| | | | | | | | 314,782 | |
| | | | | | | | | |
| Nevada 2.00% | | | | | | | | |
| Clark County, Airport System Rev. Bonds, Series 2010-B, 5.125% 2036 | | | 18,000 | | | | 19,436 | |
| Other securities | | | | | | | 167,066 | |
| | | | | | | | 186,502 | |
| | | | | | | | | |
| New Hampshire 0.38% | | | | | | | | |
Business Fin. Auth., Rev. Bonds (Elliot Hospital Obligated Group Issue),
Series 2009-A, 6.125% 2039 | | | 18,115 | | | | 19,518 | |
| Other securities | | | | | | | 15,673 | |
| | | | | | | | 35,191 | |
| 30 | American Funds Tax-Exempt Funds |
The Tax-Exempt Bond Fund of America
| | | Principal amount
(000) | | | Value
(000) | |
| New Jersey 2.30% | | | | | | | | |
| Tobacco Settlement Fncg. Corp., Tobacco Settlement Asset-backed Rev. Ref. Bonds, Series 2007-1-A, 5.00% 2041 | | $ | 38,100 | | | $ | 28,343 | |
| Transit Corp., Certs. of Part., Series 2005-A, FGIC-National insured, 5.00% 2018 (preref. 2015) | | | 7,750 | | | | 8,166 | |
| Transit Corp., Certs. of Part., Series 2005-A, FGIC-National insured, 5.00% 2021 (preref. 2015) | | | 5,000 | | | | 5,269 | |
Transportation Trust Fund Auth., Transportation System Bonds (Capital Appreciation Bonds),
Series 2010-A, 0% 2030 | | | 10,000 | | | | 4,652 | |
Transportation Trust Fund Auth., Transportation System Bonds,
Series 2004-A, FGIC-National insured, 5.75% 2025 | | | 5,000 | | | | 6,075 | |
Transportation Trust Fund Auth., Transportation System Bonds,
Series 2005-D, 5.00% 2020 (preref. 2015) | | | 4,000 | | | | 4,170 | |
Transportation Trust Fund Auth., Transportation System Bonds,
Series 2008-A, 6.00% 2038 | | | 3,255 | | | | 3,796 | |
Transportation Trust Fund Auth., Transportation System Bonds,
Series 2008-A, 6.00% 2038 (preref. 2018) | | | 1,745 | | | | 2,124 | |
Transportation Trust Fund Auth., Transportation System Bonds,
Series 2011-B, 5.50% 2031 | | | 2,000 | | | | 2,285 | |
| Transportation Trust Fund Auth., Transportation System Rev. Ref. Bonds, Current Interest Bonds, Series 2006-A, 5.25% 2020 | | | 10,000 | | | | 11,684 | |
| Transportation Trust Fund Auth., Transportation System Rev. Ref. Bonds, Current Interest Bonds, Series 2006-A, 5.25% 2021 | | | 10,000 | | | | 11,568 | |
| Transportation Trust Fund Auth., Transportation System Rev. Ref. Bonds, Current Interest Bonds, Series 2006-A, 5.25% 2022 | | | 20,000 | | | | 23,216 | |
Transportation Trust Fund Auth., Transportation System Rev. Ref. Bonds,
Series 2005-B, AMBAC insured, 5.25% 2023 | | | 8,000 | | | | 9,297 | |
Transportation Trust Fund Auth., Transportation System Rev. Ref. Bonds,
Series 2013-A, 5.00% 2020 | | | 1,000 | | | | 1,149 | |
| Transportation Trust Fund Auth., Transportation System Rev. Ref. Bonds, Current Interest Bonds, Series 2012-A, 5.00% 2042 | | | 2,240 | | | | 2,364 | |
| Other securities | | | | | | | 90,602 | |
| | | | | | | | 214,760 | |
| | | | | | | | | |
| New York 5.57% | | | | | | | | |
| Liberty Dev. Corp., Liberty Rev. Ref. Bonds (Bank of America Tower at One Bryant Park Project), Series 2010, 6.375% 2049 | | | 21,000 | | | | 23,173 | |
| Seneca Nation of Indians, Rev. Bonds, Series A, 5.00% 20232 | | | 18,900 | | | | 19,814 | |
| Other securities | | | | | | | 476,192 | |
| | | | | | | | 519,179 | |
| | | | | | | | | |
| Ohio 4.00% | | | | | | | | |
| Air Quality Dev. Auth., Pollution Control Rev. Ref. Bonds (FirstEnergy Generation Corp. Project), Series 2009-C, 5.625% 2018 | | | 17,200 | | | | 19,223 | |
| Buckeye Tobacco Settlement Fncg. Auth., Tobacco Settlement Asset-backed Bonds, Convertible Capital Appreciation Bonds, Series 2007-A-3, 6.25% 2037 | | | 5,000 | | | | 4,160 | |
| Buckeye Tobacco Settlement Fncg. Auth., Tobacco Settlement Asset-backed Bonds, Current Interest Bonds, Series 2007-A-2, 5.875% 2030 | | | 38,990 | | | | 31,740 | |
| Buckeye Tobacco Settlement Fncg. Auth., Tobacco Settlement Asset-backed Bonds, Current Interest Bonds, Series 2007-A-2, 5.875% 2047 | | | 35,790 | | | | 27,999 | |
| Buckeye Tobacco Settlement Fncg. Auth., Tobacco Settlement Asset-backed Bonds, Current Interest Bonds, Series 2007-A-2, 6.50% 2047 | | | 51,125 | | | | 43,131 | |
| Other securities | | | | | | | 247,107 | |
| | | | | | | | 373,360 | |
| | | | | | | | | |
| South Carolina 1.35% | | | | | | | | |
| Building Equity Sooner for Tomorrow (BEST), Installment Purchase Rev. Ref. Bonds (School Dist. of Greenville County, South Carolina Project), Series 2006, 5.00% 2023 | | | 19,845 | | | | 21,707 | |
| Public Service Auth., Rev. Ref. Obligations (Santee Cooper), Series 2008-A, 5.50% 2038 | | | 20,000 | | | | 22,570 | |
| Other securities | | | | | | | 81,925 | |
| | | | | | | | 126,202 | |
| American Funds Tax-Exempt Funds | 31 |
The Tax-Exempt Bond Fund of America
Bonds, notes & other debt
instruments (continued) | | Principal amount
(000) | | | Value
(000) | |
| Texas 9.32% | | | | | | | | |
| Bexar County Hospital Dist., Combination Tax and Rev. Certificates of Obligation, Series 2008, 5.00% 2032 | | $ | 20,500 | | | $ | 22,590 | |
G.O. Bonds, Water Financial Assistance Bonds (Water Infrastructure Fund),
Series 2009-A, 5.00% 2028 | | | 1,500 | | | | 1,702 | |
G.O. Bonds, Water Financial Assistance Bonds (Water Infrastructure Fund),
Series 2011-A, 5.00% 2021 | | | 1,400 | | | | 1,696 | |
G.O. Bonds, Water Financial Assistance Bonds (Water Infrastructure Fund),
Series 2013-B, 5.00% 2026 | | | 1,600 | | | | 1,918 | |
| Public Fin. Auth., G.O. Bonds, Series 2007, 5.00% 2024 | | | 1,525 | | | | 1,718 | |
| Transportation Commission, G.O. Mobility Fund Bonds, Series 2008, 5.00% 2017 | | | 2,050 | | | | 2,297 | |
| Transportation Commission, G.O. Mobility Fund Bonds, Series 2008, 5.00% 2017 (escrowed to maturity) | | | 200 | | | | 224 | |
| Transportation Commission, G.O. Mobility Fund Bonds, Series 2008, 5.00% 2021 | | | 11,420 | | | | 13,059 | |
| Transportation Commission, G.O. Mobility Fund Bonds, Series 2008, 5.00% 2021 (preref. 2018) | | | 1,125 | | | | 1,295 | |
| Transportation Commission, G.O. Mobility Fund Bonds, Series 2008, 5.00% 2028 | | | 6,375 | | | | 7,134 | |
| Transportation Commission, G.O. Mobility Fund Bonds, Series 2008, 5.00% 2028 (preref. 2018) | | | 625 | | | | 720 | |
Grand Parkway Transportation Corp., Grand Parkway System Toll Rev. Bonds,
Series 2013-B, 5.00% 2053 | | | 24,800 | | | | 26,519 | |
North Texas Tollway Auth., System Rev. Ref. Bonds, Current Interest Bonds,
Series 2008-A, 5.50% 2018 | | | 1,000 | | | | 1,136 | |
North Texas Tollway Auth., System Rev. Ref. Bonds, Current Interest Bonds,
Series 2008-A, 5.625% 2033 | | | 15,100 | | | | 16,811 | |
North Texas Tollway Auth., System Rev. Ref. Bonds, Current Interest Bonds,
Series 2008-A, 6.00% 2021 | | | 3,760 | | | | 4,287 | |
North Texas Tollway Auth., System Rev. Ref. Bonds, Current Interest Bonds,
Series 2008-A, 6.00% 2023 | | | 12,570 | | | | 14,332 | |
North Texas Tollway Auth., System Rev. Ref. Bonds, Current Interest Bonds,
Series 2008-A, 6.00% 2025 | | | 5,000 | | | | 5,662 | |
| North Texas Tollway Auth., System Rev. Ref. Bonds, Series 2008-E-3, 5.75% 2038 (put 2016) | | | 2,150 | | | | 2,297 | |
| North Texas Tollway Auth., System Rev. Ref. Bonds, Series 2008-F, 5.75% 2033 | | | 11,000 | | | | 12,269 | |
| North Texas Tollway Auth., System Rev. Ref. Bonds, Series 2008-F, 5.75% 2038 | | | 8,500 | | | | 9,454 | |
| North Texas Tollway Auth., System Rev. Ref. Bonds, Series 2009-A, 6.00% 2028 | | | 16,000 | | | | 18,763 | |
| North Texas Tollway Auth., System Rev. Ref. Bonds, Series 2009-A, 6.10% 2028 | | | 5,000 | | | | 5,857 | |
| North Texas Tollway Auth., System Rev. Ref. Bonds, Series 2009-A, 6.25% 2039 | | | 5,000 | | | | 5,794 | |
| North Texas Tollway Auth., System Rev. Ref. Bonds, Series 2010, 6.00% 2034 | | | 1,500 | | | | 1,752 | |
| North Texas Tollway Auth., System Rev. Ref. Bonds, Series 2010, 6.00% 2038 | | | 5,000 | | | | 5,780 | |
| North Texas Tollway Auth., System Rev. Ref. Bonds, Series 2011-A, 0.86% 2050 (put 2019)1 | | | 3,600 | | | | 3,595 | |
| North Texas Tollway Auth., System Rev. Ref. Bonds, Series 2011-B, 5.00% 2038 | | | 8,000 | | | | 8,502 | |
| North Texas Tollway Auth., System Rev. Ref. Bonds, Series 2012-C, 1.95% 2038 (put 2019) | | | 8,600 | | | | 8,644 | |
| Other securities | | | | | | | 663,623 | |
| | | | | | | | 869,430 | |
| | | | | | | | | |
| Washington 3.04% | | | | | | | | |
| Energy Northwest, Electric Rev. Ref. Bonds (Project 1), Series 2012-A, 5.00% 2017 | | | 17,000 | | | | 19,178 | |
Health Care Facs. Auth., Rev. Ref. Bonds (Virginia Mason Medical Center),
Series 2007-A, 6.125% 2037 | | | 18,500 | | | | 19,436 | |
| Other securities | | | | | | | 245,257 | |
| | | | | | | | 283,871 | |
| | | | | | | | | |
| Wisconsin 1.95% | | | | | | | | |
| General Fund Annual Appropriation Rev. Ref. Bonds, Series 2009-A, 6.00% 2036 | | | 52,960 | | | | 62,553 | |
| Other securities | | | | | | | 119,737 | |
| | | | | | | | 182,290 | |
| Other states & U.S. territories 11.27% | | | | | | | | |
| Other securities | | | | | | | 1,051,976 | |
| | | | | | | | | |
Total bonds, notes & other debt instruments
(cost: $7,869,514,000) | | | | | | | 8,381,471 | |
| 32 | American Funds Tax-Exempt Funds |
The Tax-Exempt Bond Fund of America
| Short-term securities 9.47% | | Principal amount
(000) | | | Value
(000) | |
| State of Alaska, City of Valdez, Marine Terminal Rev. Ref. Bonds (Exxon Pipeline Co. Project), Series 1993-A, 0.05% 20331 | | $ | 3,500 | | | $ | 3,500 | |
| State of Alaska, City of Valdez, Marine Terminal Rev. Ref. Bonds (Exxon Pipeline Co. Project), Series 1993-B, 0.05% 20331 | | | 9,000 | | | | 9,000 | |
| State of Alaska, City of Valdez, Marine Terminal Rev. Ref. Bonds (Exxon Pipeline Co. Project), Series 1993-C, 0.05% 20331 | | | 13,100 | | | | 13,100 | |
| State of Alaska, City of Valdez, Marine Terminal Rev. Ref. Bonds (ExxonMobil Project), Series 2001, 0.05% 20291 | | | 7,600 | | | | 7,600 | |
| State of Louisiana, Industrial Dev. Board of the Parish of East Baton Rouge, Inc., Gulf Opportunity Zone Rev. Bonds (ExxonMobil Project), Series 2010-B, 0.05% 20401 | | | 4,550 | | | | 4,550 | |
| State of Louisiana, Parish of East Baton Rouge, Pollution Control Rev. Ref. Bonds (Exxon Project), Series 1989, 0.04% 20191 | | | 7,020 | | | | 7,020 | |
| State of Louisiana, Parish of East Baton Rouge, Pollution Control Rev. Ref. Bonds (ExxonMobil Project), Series 2010-A, 0.05% 20351 | | | 5,200 | | | | 5,200 | |
| State of Texas, Lower Neches Valley Auth., Industrial Dev. Corp. Rev. Bonds (ExxonMobil Project), Series 2011, 0.04% 20381 | | | 21,800 | | | | 21,800 | |
| State of Wyoming, Sublette County, Pollution Control Rev. Bonds (Exxon Project), Series 1984, 0.04% 11/1/20141 | | | 9,500 | | | | 9,500 | |
| State of California, County of Ventura, 2014-15 Tax and Rev. Anticipation Notes 1.50% 2015 | | | 20,000 | | | | 20,252 | |
| State of California, County of Los Angeles, 2014-15 Tax and Rev. Anticipation Notes, 1.50% 2015 | | | 22,670 | | | | 22,961 | |
| State of Colorado, General Fund Tax and Rev. Anticipation Notes, Series 2014-A, 1.50% 6/26/2015 | | | 56,000 | | | | 56,704 | |
| State of Massachusetts, Health and Educational Facs. Auth., Demand Rev. Bonds (Dana Farber Cancer Institute Issue), Series 2008-L1, JPMorgan Chase LOC, 0.04% 20461 | | | 20,000 | | | | 20,000 | |
| State of Mississippi, Business Fin. Corp., Gulf Opportunity Zone Industrial Dev. Rev. Bonds (Chevron U.S.A. Inc. Project), Series 2007-A, 0.05% 20301 | | | 18,800 | | | | 18,800 | |
| State of Mississippi, Business Fin. Corp., Gulf Opportunity Zone Industrial Dev. Rev. Bonds (Chevron U.S.A. Inc. Project), Series 2007-B, 0.05% 20301 | | | 20,200 | | | | 20,200 | |
| State of Mississippi, Business Fin. Corp., Gulf Opportunity Zone Industrial Dev. Rev. Bonds (Chevron U.S.A. Inc. Project), Series 2007-E, 0.05% 20301 | | | 22,100 | | | | 22,100 | |
| State of Mississippi, Business Fin. Corp., Gulf Opportunity Zone Industrial Dev. Rev. Bonds (Chevron U.S.A. Inc. Project), Series 2009-A, 0.05% 20301 | | | 12,400 | | | | 12,400 | |
| State of Mississippi, Business Fin. Corp., Gulf Opportunity Zone Industrial Dev. Rev. Bonds (Chevron U.S.A. Inc. Project), Series 2009-F, 0.05% 20301 | | | 4,000 | | | | 4,000 | |
| State of Mississippi, Business Fin. Corp., Gulf Opportunity Zone Industrial Dev. Rev. Bonds (Chevron U.S.A. Inc. Project), Series 2009-G, 0.04% 20301 | | | 2,300 | | | | 2,300 | |
| State of Mississippi, Business Fin. Corp., Gulf Opportunity Zone Industrial Dev. Rev. Bonds (Chevron U.S.A. Inc. Project), Series 2010-G, 0.04% 20351 | | | 2,400 | | | | 2,400 | |
| State of Mississippi, Business Fin. Corp., Gulf Opportunity Zone Industrial Dev. Rev. Bonds (Chevron U.S.A. Inc. Project), Series 2010-H, 0.05% 20351 | | | 1,100 | | | | 1,100 | |
| American Funds Tax-Exempt Funds | 33 |
The Tax-Exempt Bond Fund of America
| Short-term securities (continued) | | Principal
amount
(000) | | | Value
(000) | |
| State of Mississippi, Business Fin. Corp., Gulf Opportunity Zone Industrial Dev. Rev. Bonds (Chevron U.S.A. Inc. Project), Series 2010-K, 0.05% 20351 | | $ | 14,100 | | | $ | 14,100 | |
| State of Mississippi, Business Fin. Corp., Gulf Opportunity Zone Industrial Dev. Rev. Bonds (Chevron U.S.A. Inc. Project), Series 2010-L, 0.04% 20351 | | | 1,275 | | | | 1,275 | |
| State of Mississippi, Business Fin. Corp., Gulf Opportunity Zone Industrial Dev. Rev. Bonds (Chevron U.S.A. Inc. Project), Series 2010-L, 0.05% 20351 | | | 1,780 | | | | 1,780 | |
| State of Mississippi, Jackson County, Pollution Control Rev. Ref. Bonds (Chevron U.S.A. Inc. Project), Series 1992, 0.05% 20161 | | | 1,200 | | | | 1,200 | |
| State of Mississippi, Jackson County, Port Fac.Rev. Ref. Bonds (Chevron U.S.A. Inc. Project), Series 1993, 0.04% 20231 | | | 5,430 | | | | 5,430 | |
| State of Wyoming, Uinta County, Pollution Control Rev. Ref. Bonds (Chevron U.S.A. Inc. Project), Series 1993, 0.04% 20201 | | | 19,520 | | | | 19,520 | |
| State of New Jersey, Transportation Trust Fund Auth., Transportation System Bonds, Series 2009-C, 0.06% 20321 | | | 6,250 | | | | 6,250 | |
| State of New York, City of New York, G.O. Bonds, Fiscal 1993 Series A-7, JPMorgan Chase LOC, 0.06% 20201 | | | 5,500 | | | | 5,500 | |
| State of New York, City of New York, G.O. Bonds, Fiscal 1999 Series B-2, JPMorgan Chase LOC, 0.05% 20231 | | | 1,550 | | | | 1,550 | |
| State of New York, City of New York, G.O. Bonds, Fiscal 2008 Series L, Subseries L-4, 0.06% 20381 | | | 12,000 | | | | 12,000 | |
| State of New York, City of New York, G.O. Bonds, Fiscal 2012 Series G, Subseries G-5, 0.04% 20421 | | | 3,000 | | | | 3,000 | |
| State of Texas, Tax and Rev. Anticipation Notes, Series 2013, 2.00% 8/28/2014 | | | 225,000 | | | | 225,333 | |
| Other securities | | | | | | | 301,254 | |
| | | | | | | | | |
| Total short-term securities (cost: $882,640,000) | | | | | | | 882,679 | |
| Total investment securities 99.34% (cost: $8,752,154,000) | | | | | | | 9,264,150 | |
| Other assets less liabilities 0.66% | | | | | | | 61,625 | |
| | | | | | | | | |
| Net assets 100.00% | | | | | | $ | 9,325,775 | |
This summary investment portfolio is designed to streamline the report and help investors better focus on the fund’s principal holdings. See page 88 for details on how to obtain a complete schedule of portfolio holdings.
“Other securities” includes all issues that are not disclosed separately in the summary investment portfolio.
| 1 | Coupon rate may change periodically. For short-term securities, the date of the next scheduled coupon rate change is considered to be the maturity date. |
| 2 | Acquired in a transaction exempt from registration under Rule 144A of the Securities Act of 1933. May be resold in the U.S. in transactions exempt from registration, normally to qualified institutional buyers. The total value of all such securities, including those in “Other securities,” was $113,731,000, which represented 1.22% of the net assets of the fund. |
Key to abbreviations
Agcy. = Agency
Auth. = Authority
Certs. of Part. = Certificates of Participation
Dept. = Department
Dev. = Development
Dist. = District
Econ. = Economic
Fac. = Facility
Facs. = Facilities
Fin. = Finance
Fncg. = Financing
G.O. = General Obligation
LOC = Letter of Credit
Preref. = Prerefunded
Redev. = Redevelopment
Ref. = Refunding
Rev. = Revenue
TECP = Tax-Exempt Commercial Paper
See Notes to Financial Statements
| 34 | American Funds Tax-Exempt Funds |
American High-Income Municipal Bond Fund
Summary investment portfolio July 31, 2014
| Bonds, notes & other debt instruments 91.25% | | Principal amount
(000) | | Value
(000) | |
| Arizona 2.62% | | | | | | | | |
| Industrial Dev. Auth. of the County of Pima, Water and Wastewater Rev. Bonds (Global Water Resources, LLC Project), Series 2007, AMT, 6.55% 2037 | | $ | 17,000 | | | $ | 17,244 | |
| Industrial Dev. Auth. of the County of Pima, Water and Wastewater Rev. Bonds (Global Water Resources, LLC Project), Series 2008, AMT, 7.50% 2038 | | | 10,000 | | | | 10,485 | |
| Other securities | | | | | | | 51,846 | |
| | | | | | | | 79,575 | |
| | | | | | | | | |
| California 14.00% | | | | | | | | |
| Morongo Band of Mission Indians, Enterprise Rev. Ref. Bonds, Series 2008-B, 6.50% 2028 | | | 9,750 | | | | 10,602 | |
| City of San Buenaventura, Rev. Bonds (Community Memorial Health System), Series 2011, 7.50% 2041 | | | 12,750 | | | | 14,707 | |
| Redev. Agcy. of the City of San Jose, Tax Allocation Ref. Bonds (Merged Area Redev. Project), Series 2006-C, National insured, 3.75% 2028 | | | 11,545 | | | | 11,182 | |
| Tobacco Securitization Auth. of Southern California, Tobacco Settlement Asset-backed Rev. Ref. Bonds (San Diego County Tobacco Asset Securitization Corp.), Series 2006-A, 5.125% 2046 | | | 14,375 | | | | 10,852 | |
| Other securities | | | | | | | 377,318 | |
| | | | | | | | 424,661 | |
| | | | | | | | | |
| Colorado 4.93% | | | | | | | | |
| City and County of Denver, Dept. of Aviation, Special Facs. Airport Rev. Ref. Bonds (United Air Lines Project), Series 2007-A, AMT, 5.25% 2032 | | | 18,000 | | | | 18,385 | |
| City and County of Denver, Dept. of Aviation, Special Facs. Airport Rev. Ref. Bonds (United Air Lines Project), Series 2007-A, AMT, 5.75% 2032 | | | 2,905 | | | | 3,010 | |
| Health Facs. Auth., Health Care Facs. Rev. Bonds (American Baptist Homes of the Midwest Obligated Group), Series 2013, 8.00% 2043 | | | 11,000 | | | | 12,766 | |
| Health Facs. Auth., Rev. Bonds (Covenant Retirement Communities, Inc.), Series 2005, 5.00% 2035 | | | 17,050 | | | | 17,163 | |
| Regional Transportation Dist., Private Activity Bonds (Denver Transit Partners Eagle P3 Project), Series 2010, 6.00% 2041 | | | 14,800 | | | | 16,408 | |
| Other securities | | | | | | | 81,900 | |
| | | | | | | | 149,632 | |
| | | | | | | | | |
| Florida 7.35% | | | | | | | | |
| Lee County Industrial Dev. Auth., Healthcare Facs. Rev. Ref. Bonds (Shell Point/Alliance Obligated Group, Shell Point Village/Alliance Community Project), Series 2007, 5.00% 2029 | | | 13,425 | | | | 13,567 | |
| Lee County, Airport Rev. Ref. Bonds, Series 2011-A, AMT, 5.375% 2032 | | | 9,935 | | | | 10,836 | |
| Seminole Tribe of Florida, Series A, 5.25% 20271 | | | 10,000 | | | | 10,674 | |
| Other securities | | | | | | | 187,974 | |
| | | | | | | | 223,051 | |
| | | | | | | | | |
| Illinois 6.20% | | | | | | | | |
| Fin. Auth., Rev. Ref. Bonds (OSF Healthcare System), Series 2010-A, 6.00% 2039 | | | 8,935 | | | | 10,021 | |
| Fin. Auth., Rev. Ref. Bonds (Provena Health), Series 2009-A, 7.75% 2034 | | | 9,800 | | | | 12,119 | |
| Fin. Auth., Student Housing Rev. Ref. Bonds (CHF-DeKalb II, L.L.C. – Northern Illinois University Project), Series 2011, 6.875% 2043 | | | 11,500 | | | | 13,277 | |
| Southwestern Illinois Dev. Auth., Health Fac. Rev. Bonds (Memorial Group, Inc.), Series 2013, 7.625% 2048 | | | 11,000 | | | | 12,229 | |
| Other securities | | | | | | | 140,379 | |
| | | | | | | | 188,025 | |
| | | | | | | | | |
| Iowa 1.02% | | | | | | | | |
| Fin. Auth., Midwestern Disaster Area Rev. Ref. Bonds (Iowa Fertilizer Co. Project), Series 2013, 5.25% 2025 | | | 12,750 | | | | 13,488 | |
| Other securities | | | | | | | 17,330 | |
| | | | | | | | 30,818 | |
| American Funds Tax-Exempt Funds | 35 |
American High-Income Municipal Bond Fund
| Bonds, notes & other debt instruments (continued) | | Principal amount
(000) | | Value
(000) | |
| Louisiana 1.58% | | | | | | | | |
| Local Government Environmental Facs. and Community Dev. Auth., Rev. Bonds (Westlake Chemical Corp. Projects), Series 2007, 6.75% 2032 | | $ | 9,500 | | | $ | 10,582 | |
| Other securities | | | | | | | 37,195 | |
| | | | | | | | 47,777 | |
| | | | | | | | | |
| Massachusetts 1.38% | | | | | | | | |
| Dev. Fin. Agcy., Resource Recovery Rev. Ref. Bonds (Covanta Energy Project), Series 2012-C, AMT, 5.25% 2042 | | | 9,250 | | | | 9,368 | |
| Other securities | | | | | | | 32,612 | |
| | | | | | | | 41,980 | |
| | | | | | | | | |
| Michigan 5.25% | | | | | | | | |
| Tobacco Settlement Fin. Auth., Tobacco Settlement Asset-backed Bonds, Current Interest Bonds, Series 2007-A, 6.00% 2048 | | | 36,850 | | | | 29,091 | |
| Tobacco Settlement Fin. Auth., Tobacco Settlement Asset-backed Rev. Ref. Bonds, Current Interest Bonds, Series 2008-A, 6.875% 2042 | | | 5,440 | | | | 5,036 | |
| Wayne County Airport Auth., Airport Rev. Bonds (Detroit Metropolitan Wayne County Airport), Series 2005, AMT, National insured, 5.00% 2034 | | | 11,000 | | | | 11,403 | |
| Wayne County Airport Auth., Airport Rev. Bonds (Detroit Metropolitan Wayne County Airport), Series 2012-B, AMT, 5.00% 2037 | | | 2,000 | | | | 2,054 | |
| Wayne County Airport Auth., Airport Rev. Ref. Bonds (Detroit Metropolitan Wayne County Airport), Series 2011-A, AMT, 5.00% 2020 | | | 5,000 | | | | 5,754 | |
| Wayne County Airport Auth., Airport Rev. Ref. Bonds (Detroit Metropolitan Wayne County Airport), Series 2011-A, AMT, 5.00% 2022 | | | 2,000 | | | | 2,264 | |
| Wayne County Airport Auth., Airport Rev. Ref. Bonds (Detroit Metropolitan Wayne County Airport), Series 2012-D, AMT, 5.00% 2028 | | | 12,000 | | | | 12,847 | |
| Other securities | | | | | | | 90,841 | |
| | | | | | | | 159,290 | |
| | | | | | | | | |
| Missouri 1.76% | | | | | | | | |
| Industrial Dev. Auth. of the City of Lee’s Summit, Senior Living Facs. Rev. Ref. Bonds (John Knox Village Obligated Group), Series 2014-A, 5.25% 2039 | | | 9,500 | | | | 9,369 | |
| Other securities | | | | | | | 43,870 | |
| | | | | | | | 53,239 | |
| | | | | | | | | |
| New Jersey 3.77% | | | | | | | | |
| Econ. Dev. Auth., Energy Fac. Rev. Bonds (ACR Energy Partners, LLC Project), Series 2011-A, AMT, 10.50% 20321 | | | 13,000 | | | | 9,587 | |
| Econ. Dev. Auth., Private Activity Bonds (Goethals Bridge Replacement Project), Series 2013, AMT, 5.375% 2043 | | | 9,225 | | | | 9,823 | |
| Econ. Dev. Auth., Special Fac. Rev. Bonds (Continental Airlines, Inc. Project), Series 1999, AMT, 5.125% 2023 | | | 4,500 | | | | 4,719 | |
| Econ. Dev. Auth., Special Fac. Rev. Bonds (Continental Airlines, Inc. Project), Series 1999, AMT, 5.25% 2029 | | | 17,000 | | | | 17,583 | |
| Econ. Dev. Auth., Special Fac. Rev. Bonds (Continental Airlines, Inc. Project), Series 2000-B, AMT, 5.625% 2030 | | | 1,750 | | | | 1,866 | |
| Econ. Dev. Auth., Special Fac. Rev. Bonds (Continental Airlines, Inc. Project), Series 2003, AMT, 5.50% 2033 | | | 3,500 | | | | 3,684 | |
| Econ. Dev. Auth., Special Fac. Rev. Ref. Bonds (Continental Airlines, Inc. Project), Series 2012, AMT, 5.75% 2027 | | | 4,500 | | | | 4,780 | |
| Tobacco Settlement Fncg. Corp., Tobacco Settlement Asset-backed Rev. Ref. Bonds, Series 2007-1-A, 5.00% 2041 | | | 23,355 | | | | 17,374 | |
| Other securities | | | | | | | 44,922 | |
| | | | | | | | 114,338 | |
| 36 | American Funds Tax-Exempt Funds |
American High-Income Municipal Bond Fund
| | | Principal amount
(000) | | | Value
(000) | |
| New York 3.44% | | | | | | | | |
| Liberty Dev. Corp., Liberty Rev. Ref. Bonds (Bank of America Tower at One Bryant Park Project), Series 2010, 6.375% 2049 | | $ | 13,360 | | | $ | 14,743 | |
| New York City Industrial Dev. Agcy., Special Fac. Rev. Bonds (American Airlines, Inc. John F. Kennedy International Airport Project), Series 2005, AMT, 7.625% 2025 | | | 15,200 | | | | 16,700 | |
| New York City Industrial Dev. Agcy., Special Fac. Rev. Bonds (American Airlines, Inc. John F. Kennedy International Airport Project), Series 2005, AMT, 7.75% 2031 | | | 3,130 | | | | 3,458 | |
| New York City Industrial Dev. Agcy., Special Fac. Rev. Bonds (American Airlines, Inc. John F. Kennedy International Airport Project), Series 2005, AMT, 8.00% 2028 | | | 2,000 | | | | 2,212 | |
| Other securities | | | | | | | 67,128 | |
| | | | | | | | 104,241 | |
| | | | | | | | | |
| Ohio 4.27% | | | | | | | | |
| Air Quality Dev. Auth., Pollution Control Rev. Ref. Bonds (FirstEnergy Generation Corp. Project), Series 2009-C, 5.625% 2018 | | | 8,580 | | | | 9,589 | |
| Buckeye Tobacco Settlement Fncg. Auth., Tobacco Settlement Asset-backed Bonds, Current Interest Bonds, Series 2007-A-2, 5.875% 2030 | | | 13,000 | | | | 10,583 | |
| Buckeye Tobacco Settlement Fncg. Auth., Tobacco Settlement Asset-backed Bonds, Current Interest Bonds, Series 2007-A-2, 5.875% 2047 | | | 18,405 | | | | 14,398 | |
| Buckeye Tobacco Settlement Fncg. Auth., Tobacco Settlement Asset-backed Bonds, Current Interest Bonds, Series 2007-A-2, 6.50% 2047 | | | 23,500 | | | | 19,826 | |
| County of Gallia, Hospital Facs. Rev. Ref. and Improvement Bonds (Holzer Health System Obligated Group Project), Series 2012-A, 8.00% 2042 | | | 11,000 | | | | 12,086 | |
| Other securities | | | | | | | 62,961 | |
| | | | | | | | 129,443 | |
| | | | | | | | | |
| Oklahoma 0.88% | | | | | | | | |
| Trustees of the Tulsa Municipal Airport Trust, American Airlines Inc. Rev. Ref. Bonds, Series 2001-B, AMT, 5.50% 2035 | | | 16,250 | | | | 16,841 | |
| Trustees of the Tulsa Municipal Airport Trust, American Airlines Inc. Rev. Ref. Bonds, Series 2013-B, AMT, 5.50% 2035 | | | 120 | | | | 124 | |
| Other securities | | | | | | | 9,739 | |
| | | | | | | | 26,704 | |
| | | | | | | | | |
| Oregon 0.51% | | | | | | | | |
| Cow Creek Band of Umpqua Tribe of Indians, Tax Rev. Bonds, Series 2006-C, 5.625% 2026 | | | 9,915 | | | | 9,833 | |
| Other securities | | | | | | | 5,726 | |
| | | | | | | | 15,559 | |
| | | | | | | | | |
| Pennsylvania 2.97% | | | | | | | | |
| Hospitals and Higher Education Facs. Auth. of Philadelphia, Hospital Rev. Bonds (Temple University Health System Obligated Group), Series 2012-A, 5.625% 2042 | | | 13,045 | | | | 13,240 | |
| Other securities | | | | | | | 76,699 | |
| | | | | | | | 89,939 | |
| | | | | | | | | |
| Puerto Rico 3.29% | | | | | | | | |
| Aqueduct and Sewer Auth., Rev. Ref. Bonds, Series 2012-A, 5.25% 2042 | | | 25,565 | | | | 17,490 | |
| Public Improvement Ref. Bonds (G.O. Bonds), Series 2006-A, 5.00% 2023 | | | 2,000 | | | | 1,538 | |
| Public Improvement Ref. Bonds (G.O. Bonds), Series 2012-A, 5.00% 2041 | | | 17,895 | | | | 12,693 | |
| Public Improvement Ref. Bonds (G.O. Bonds), Series 2012-A, 5.50% 2039 | | | 4,070 | | | | 3,014 | |
| Public Improvement Ref. Bonds (G.O. Bonds), Series 2014-A, 8.00% 2035 | | | 14,850 | | | | 13,391 | |
| Other securities | | | | | | | 51,581 | |
| | | | | | | | 99,707 | |
| American Funds Tax-Exempt Funds | 37 |
American High-Income Municipal Bond Fund
| Bonds, notes & other debt instruments (continued) | | Principal amount
(000) | | | Value
(000) | |
| Texas 6.46% | | | | | | | | |
| Brazos River Harbor Navigation Dist. of Brazoria County, Environmental Facs. Rev. Ref. Bonds (Dow Chemical Co. Project), Series 2002-A-4, AMT, 5.95% 2033 | | $ | 13,545 | | | $ | 14,814 | |
| Cities of Dallas and Fort Worth, Dallas/Fort Worth International Airport, Joint Rev. Improvement Bonds, Series 2012-D, AMT, 5.00% 2042 | | | 9,000 | | | | 9,397 | |
| City of Houston, Airport System Special Facs. Rev. Bonds (Continental Airlines, Inc. Airport Improvement Projects), Series 1997-C, AMT, 6.125% 2027 | | | 1,000 | | | | 1,003 | |
| City of Houston, Airport System Special Facs. Rev. Bonds (Continental Airlines, Inc. Terminal Improvement Projects), Series 2011, AMT, 6.50% 2030 | | | 9,300 | | | | 10,405 | |
| City of Houston, Airport System Special Facs. Rev. Bonds (Continental Airlines, Inc. Terminal Improvement Projects), Series 2011, AMT, 6.625% 2038 | | | 3,000 | | | | 3,348 | |
| City of Houston, Airport System Special Facs. Rev. Ref. Bonds (United Airlines, Inc. Terminal E Project), Series 2014, AMT, 4.75% 2024 | | | 3,000 | | | | 3,098 | |
| City of Houston, Airport System Special Facs. Rev. Ref. Bonds (United Airlines, Inc. Terminal E Project), Series 2014, AMT, 5.00% 2029 | | | 5,000 | | | | 5,066 | |
| Sanger Texas Industrial Dev. Corp., Industrial Dev. Rev. Ref. Bonds (Texas Pellets Project), Series 2012-B, AMT, 8.00% 2038 | | | 14,250 | | | | 15,375 | |
| Other securities | | | | | | | 133,483 | |
| | | | | | | | 195,989 | |
| | | | | | | | | |
| Washington 1.27% | | | | | | | | |
| Housing Fin. Commission, Nonprofit Housing Rev. Ref. Bonds (Rockwood Retirement Project), Series 2014-A, 7.50% 20491 | | | 9,090 | | | | 9,890 | |
| Other securities | | | | | | | 28,669 | |
| | | | | | | | 38,559 | |
| | | | | | | | | |
| Other states & U.S. territories 18.30% | | | | | | | | |
| Other securities | | | | | | | 554,800 | |
| | | | | | | | | |
| Total bonds, notes & other debt instruments (cost: $2,644,997,000) | | | | | | | 2,767,327 | |
| | | | | | | | | |
| Short-term securities 7.96% | | | | | | | | |
| State of Alaska, City of Valdez, Marine Terminal Rev. Ref. Bonds (Exxon Pipeline Co. Project), Series 1993-A, 0.05% 20332 | | | 7,740 | | | | 7,740 | |
| State of Alaska, City of Valdez, Marine Terminal Rev. Ref. Bonds (ExxonMobil Project), Series 2001, 0.05% 20292 | | | 1,200 | | | | 1,200 | |
| State of Illinois, Will County, Environmental Facs. Rev. Bonds (ExxonMobil Project), Series 2001, AMT, 0.06% 20262 | | | 1,400 | | | | 1,400 | |
| State of Illinois, Will County, Exempt Facs. Rev. Ref. Bonds (Exxon Project), Series 2001, AMT, 0.06% 20262 | | | 6,500 | | | | 6,500 | |
| State of Louisiana, Industrial Dev. Board of the Parish of East Baton Rouge, Inc., Gulf Opportunity Zone Rev. Bonds (ExxonMobil Project), Series 2010-B, 0.05% 20402 | | | 5,100 | | | | 5,100 | |
| State of Louisiana, Parish of East Baton Rouge, Pollution Control Rev. Ref. Bonds (Exxon Project), Series 1989, 0.04% 20192 | | | 1,750 | | | | 1,750 | |
| State of Louisiana, Parish of East Baton Rouge, Pollution Control Rev. Ref. Bonds (ExxonMobil Project), Series 2010-A, 0.05% 20352 | | | 1,800 | | | | 1,800 | |
| State of Louisiana, Parish of St. Bernard, Exempt Fac. Rev. Bonds (Mobil Oil Corp. Project), Series 1996, AMT, 0.06% 20262 | | | 3,800 | | | | 3,800 | |
| State of Texas, Gulf Coast Waste Disposal Auth., Environmental Facs. Rev. Bonds (ExxonMobil Project), Series 2000, AMT, 0.06% 20302 | | | 2,000 | | | | 2,000 | |
| State of Texas, Gulf Coast Waste Disposal Auth., Environmental Facs. Rev. Bonds (ExxonMobil Project), Series 2001-B, AMT, 0.06% 20252 | | | 2,000 | | | | 2,000 | |
| 38 | American Funds Tax-Exempt Funds |
American High-Income Municipal Bond Fund
| | | Principal amount
(000) | | Value
(000) | |
| State of Texas, Lower Neches Valley Auth., Industrial Dev. Corp. Rev. Bonds (ExxonMobil Project), Series 2011, 0.04% 20382 | | $ | 5,000 | | | $ | 5,000 | |
| State of Texas, Lower Neches Valley Auth., Industrial Dev. Corp. Rev. Bonds (ExxonMobil Project), Series 2011, 0.04% 20512 | | | 7,950 | | | | 7,950 | |
| State of Wyoming, Lincoln County, Pollution Control Rev. Bonds (Exxon Project), Series 1987-A, AMT, 0.04% 20172 | | | 2,000 | | | | 2,000 | |
| State of Wyoming, Lincoln County, Pollution Control Rev. Bonds (Exxon Project), Series 1987-B, AMT, 0.04% 20172 | | | 3,900 | | | | 3,900 | |
| State of Wyoming, Lincoln County, Pollution Control Rev. Bonds (Exxon Project), Series 1987-C, AMT, 0.04% 20172 | | | 3,400 | | | | 3,400 | |
| State of Colorado, General Fund Tax and Rev. Anticipation Notes, Series 2014-A, 1.50% 6/26/2015 | | | 25,000 | | | | 25,315 | |
| State of Mississippi, Business Fin. Corp., Gulf Opportunity Zone Industrial Dev. Rev. Bonds (Chevron U.S.A. Inc. Project), Series 2007-A, 0.05% 20302 | | | 1,000 | | | | 1,000 | |
| State of Mississippi, Business Fin. Corp., Gulf Opportunity Zone Industrial Dev. Rev. Bonds (Chevron U.S.A. Inc. Project), Series 2009-E, 0.05% 20302 | | | 9,000 | | | | 9,000 | |
| State of Mississippi, Business Fin. Corp., Gulf Opportunity Zone Industrial Dev. Rev. Bonds (Chevron U.S.A. Inc. Project), Series 2009-F, 0.05% 20302 | | | 2,780 | | | | 2,780 | |
| State of Mississippi, Business Fin. Corp., Gulf Opportunity Zone Industrial Dev. Rev. Bonds (Chevron U.S.A. Inc. Project), Series 2009-G, 0.04% 20302 | | | 1,200 | | | | 1,200 | |
| State of Mississippi, Business Fin. Corp., Gulf Opportunity Zone Industrial Dev. Rev. Bonds (Chevron U.S.A. Inc. Project), Series 2010-I, 0.04% 20352 | | | 5,580 | | | | 5,580 | |
| State of Mississippi, Business Fin. Corp., Gulf Opportunity Zone Industrial Dev. Rev. Bonds (Chevron U.S.A. Inc. Project), Series 2014-B, 0.05% 20352 | | | 5,870 | | | | 5,870 | |
| State of Mississippi, Jackson County, Pollution Control Rev. Ref. Bonds (Chevron U.S.A. Inc. Project), Series 1992, 0.05% 20162 | | | 3,105 | | | | 3,105 | |
| State of Wyoming, Uinta County, Pollution Control Rev. Ref. Bonds (Chevron U.S.A. Inc. Project), Series 1993, 0.04% 20202 | | | 5,600 | | | | 5,600 | |
| State of Texas, Tax and Rev. Anticipation Notes, Series 2013, 2.00% 8/28/2014 | | | 30,000 | | | | 30,044 | |
| Other securities | | | | | | | 96,249 | |
| | | | | | | | | |
| Total short-term securities (cost: $241,277,000) | | | | | | | 241,283 | |
| Total investment securities 99.21% (cost: $2,886,274,000) | | | | | | | 3,008,610 | |
| Other assets less liabilities 0.79% | | | | | | | 24,020 | |
| | | | | | | | | |
| Net assets 100.00% | | | | | | $ | 3,032,630 | |
This summary investment portfolio is designed to streamline the report and help investors better focus on the fund’s principal holdings. See page 88 for details on how to obtain a complete schedule of portfolio holdings.
“Other securities” includes all issues that are not disclosed separately in the summary investment portfolio.
| 1 | Acquired in a transaction exempt from registration under Rule 144A of the Securities Act of 1933. May be resold in the U.S. in transactions exempt from registration, normally to qualified institutional buyers. The total value of all such securities, including those in “Other securities,” was $138,978,000, which represented 4.58% of the net assets of the fund. |
| 2 | Coupon rate may change periodically. For short-term securities, the date of the next scheduled coupon rate change is considered to be the maturity date. |
Key to abbreviations
Agcy. = Agency
AMT = Alternative Minimum Tax
Auth. = Authority
Certs. of Part. = Certificates of Participation
Dept. = Department
Dev. = Development
Dist. = District
Econ. = Economic
Fac. = Facility
Facs. = Facilities
Fin. = Finance
Fncg. = Financing
G.O. = General Obligation
LOC = Letter of Credit
Preref. = Prerefunded
Redev. = Redevelopment
Ref. = Refunding
Rev. = Revenue
TECP = Tax-Exempt Commercial Paper
See Notes to Financial Statements
| American Funds Tax-Exempt Funds | 39 |
The Tax-Exempt Fund of California
Summary investment portfolio July 31, 2014
| Bonds, notes & other debt instruments 91.82% | | Principal amount
(000) | | | Value
(000) | |
| California 88.09% | | | | | | | | |
| State issuers 33.99% | | | | | | | | |
Educational Facs. Auth., Rev. Ref. Bonds (California Lutheran University),
Series 2008, 5.75% 2038 | | $ | 6,000 | | | $ | 6,766 | |
Educational Facs. Auth., Rev. Ref. Bonds (Chapman University),
Series 2011,5.00% 2031 | | | 8,615 | | | | 9,396 | |
| G.O. Bonds, Series 2013-E, 0.939% 20291 | | | 1,500 | | | | 1,515 | |
| Various Purpose G.O. Bonds, 5.00% 2038 | | | 3,000 | | | | 3,306 | |
| Various Purpose G.O. Bonds, 5.25% 2028 | | | 2,000 | | | | 2,341 | |
| Various Purpose G.O. Bonds, 5.25% 2028 | | | 5,000 | | | | 5,860 | |
| Various Purpose G.O. Bonds, 6.00% 2038 | | | 7,000 | | | | 8,247 | |
| Various Purpose G.O. Bonds, 6.00% 2039 | | | 2,000 | | | | 2,402 | |
| Various Purpose G.O. Bonds, 6.50% 2033 | | | 5,000 | | | | 6,089 | |
| Various Purpose G.O. Ref. Bonds, 5.25% 2030 | | | 2,000 | | | | 2,311 | |
Golden State Tobacco Securitization Corp., Tobacco Settlement Asset-backed Rev. Ref. Bonds,
Series 2007-A-1, 5.75% 2047 | | | 11,725 | | | | 9,434 | |
Health Facs. Fncg. Auth., Rev. Bonds (Catholic Healthcare West),
Series 2008-G, 5.50% 2025 | | | 3,500 | | | | 3,980 | |
Health Facs. Fncg. Auth., Rev. Bonds (Catholic Healthcare West),
Series 2009-A, 6.00% 2029 | | | 1,500 | | | | 1,724 | |
Health Facs. Fncg. Auth., Rev. Ref. Bonds (Catholic Healthcare West),
Series 2011-A, 5.25% 2041 | | | 2,000 | | | | 2,136 | |
| Statewide Communities Dev. Auth., Rev. Ref. Bonds (Catholic Healthcare West), Series 2008-B, 5.50% 2030 | | | 970 | | | | 1,061 | |
| Statewide Communities Dev. Auth., Rev. Ref. Bonds (Catholic Healthcare West), Series 2008-D, 5.50% 2031 | | | 6,090 | | | | 6,656 | |
Health Facs. Fncg. Auth., Rev. Bonds (Rady Children’s Hospital - San Diego),
Series 2011, 5.25% 2041 | | | 5,000 | | | | 5,535 | |
Health Facs. Fncg. Auth., Rev. Ref. Bonds (Cedars-Sinai Medical Center),
Series 2005, 5.00% 2027 | | | 12,750 | | | | 13,383 | |
Health Facs. Fncg. Auth., Rev. Ref. Bonds (St. Joseph Health System),
Series 2009-D, 5.00% 2034 (put 2016) | | | 5,000 | | | | 5,487 | |
Health Facs. Fncg. Auth., Rev. Ref. Bonds (St. Joseph Health System),
Series 2013-C, 5.00% 2043 (put 2019) | | | 2,000 | | | | 2,355 | |
Health Facs. Fncg. Auth., Rev. Ref. Bonds (Stanford Hospital and Clinics),
Series 2010-B, 5.25% 2031 | | | 8,000 | | | | 9,036 | |
Imperial Irrigation Dist., Electric System Rev. Ref. Bonds,
Series 2008-A, 5.00% 2033 | | | 11,500 | | | | 12,558 | |
Imperial Irrigation Dist., Electric System Rev. Ref. Bonds,
Series 2008-A, 5.25% 2024 | | | 2,000 | | | | 2,285 | |
Imperial Irrigation Dist., Electric System Rev. Ref. Bonds,
Series 2008-A, 5.25% 2025 | | | 2,000 | | | | 2,276 | |
Municipal Fin. Auth., Certs. of Part. (Community Hospitals of Central California
Obligated Group), 5.25% 2037 | | | 5,500 | | | | 5,600 | |
Municipal Fin. Auth., Rev. Ref. Bonds (Azusa Pacific University Project),
Series 2011-B, 8.00% 20412 | | | 8,550 | | | | 10,089 | |
Northern California Power Agcy., Geothermal Project Number 3 Rev. Bonds,
Series 2009-A, 5.50% 2022 | | | 1,000 | | | | 1,190 | |
| Northern California Power Agcy., Hydroelectric Project Number One Rev. Ref. Bonds, Series 2010-A, 5.00% 2023 | | | 3,680 | | | | 4,129 | |
| Northern California Power Agcy., Hydroelectric Project Number One Rev. Ref. Bonds, Series 2012-A, 5.00% 2029 | | | 1,570 | | | | 1,774 | |
| Northern California Power Agcy., Hydroelectric Project Number One Rev. Ref. Bonds, Series 2012-A, 5.00% 2030 | | | 1,000 | | | | 1,123 | |
Northern California Power Agcy., Lodi Energy Center Rev. Bonds, Issue One,
Series 2010-A, 5.00% 2020 | | | 2,010 | | | | 2,391 | |
Northern California Power Agcy., Lodi Energy Center Rev. Bonds, Issue One,
Series 2010-A, 5.00% 2025 | | | 6,000 | | | | 6,760 | |
| Pollution Control Fncg. Auth., Pollution Control Rev. Ref. Bonds (Pacific Gas and Electric Co.), Series 2004-C, AMT, AMBAC-FGIC insured, 4.75% 2023 | | | 5,000 | | | | 5,377 | |
| Pollution Control Fncg. Auth., Pollution Control Rev. Ref. Bonds (Pacific Gas and Electric Co.), Series 2004-D, AMT, FGIC insured, 4.75% 2023 | | | 1,000 | | | | 1,075 | |
| Pollution Control Fncg. Auth., Water Furnishing Rev. Bonds (Poseidon Resources (Channelside) LP Desalination Project), Series 2012 Plant Bonds, AMT, 5.00% 20452 | | | 7,000 | | | | 7,198 | |
| 40 | American Funds Tax-Exempt Funds |
The Tax-Exempt Fund of California
| | | Principal amount
(000) | | | Value
(000) | |
Public Works Board, Lease Rev. Bonds (Regents of the University of California,
Various University of California Projects), Series 2009-E, 5.00% 2024 (preref. 2019) | | $ | 2,500 | | | $ | 2,940 | |
Public Works Board, Lease Rev. Bonds (Regents of the University of California,
Various University of California Projects), Series 2009-E, 5.00% 2034 (preref.2019) | | | 1,500 | | | | 1,764 | |
Regents of the University of California, Limited Project Rev. Bonds,
Series 2007-D, FGIC-National insured, 5.00% 2037 | | | 5,000 | | | | 5,379 | |
| Regents of the University of California, Medical Center Pooled Rev. Ref. Bonds, Series 2007-C-2, National insured, 0.82% 20371 | | | 5,000 | | | | 3,937 | |
Regents of the University of California, Medical Center Pooled Rev. Ref. Bonds,
Series 2007-C-2, National insured, 0.89% 20431 | | | 8,000 | | | | 5,958 | |
Southern California Public Power Auth., Transmission Project Rev. Ref. Bonds
(Southern Transmission Project), Series 2008-A, 5.00% 2022 | | | 4,960 | | | | 5,739 | |
| Statewide Communities Dev. Auth., Rev. Bonds (Front Porch Communities and Services Project), Series 2007-A, 5.125% 20372 | | | 9,500 | | | | 9,614 | |
Statewide Communities Dev. Auth., Rev. Bonds (Inland Regional Center Project),
Series 2007, 5.375% 2037 | | | 6,500 | | | | 6,742 | |
Statewide Communities Dev. Auth., Rev. Bonds (Kaiser Permanente),
Series 2012-A, 5.00% 2042 | | | 6,500 | | | | 7,050 | |
Statewide Communities Dev. Auth., Rev. Ref. Bonds (American Baptist Homes of the West),
Series 2010, 6.25% 2039 | | | 5,300 | | | | 5,690 | |
Statewide Communities Dev. Auth., Senior Living Rev. Ref. Bonds
(Southern California Presbyterian Homes), Series 2006-A, 4.875% 2036 | | | 6,500 | | | | 6,460 | |
Statewide Communities Dev. Auth., Student Housing Rev. Bonds
(CHF-Irvine, LLC-UCI East Campus Apartments, Phase II), Series 2008, 5.50% 2026 | | | 3,500 | | | | 3,816 | |
Statewide Communities Dev. Auth., Student Housing Rev. Bonds
(CHF-Irvine, LLC-UCI East Campus Apartments, Phase II), Series 2008, 6.00% 2040 | | | 4,750 | | | | 5,106 | |
Statewide Communities Dev. Auth., Student Housing Rev. Ref. Bonds
(CHF-Irvine, LLC-UCI East Campus Apartments, Phase I), Series 2011, 5.375% 2038 | | | 1,260 | | | | 1,345 | |
Statewide Communities Dev. Auth., Student Housing Rev. Ref. Bonds
(CHF-Irvine, LLC-UCI East Campus Apartments, Phase II), Series 2006, 5.00% 2017 | | | 2,565 | | | | 2,751 | |
Statewide Communities Dev. Auth., Student Housing Rev. Ref. Bonds
(CHF-Irvine, LLC-UCI East Campus Apartments, Phase II), Series 2006, 5.00% 2020 | | | 1,000 | | | | 1,051 | |
Statewide Communities Dev. Auth., Student Housing Rev. Ref. Bonds
(CHF-Irvine, LLC-UCI East Campus Apartments, Phase II), Series 2006, 5.00% 2026 | | | 2,980 | | | | 3,059 | |
Statewide Communities Dev. Auth., Student Housing Rev. Ref. Bonds
(CHF-Irvine, LLC-UCI East Campus Apartments, Phase II), Series 2006, 5.00% 2038 | | | 2,000 | | | | 2,026 | |
| Other securities | | | | | | | 262,638 | |
| | | | | | | | 515,910 | |
| | | | | | | | | |
| City & county issuers 54.10% | | | | | | | | |
| Alameda Corridor Transportation Auth., Rev. Ref. Bonds, Series 2013-A, 5.00% 2026 | | | 6,375 | | | | 7,340 | |
Assn. of Bay Area Governments, Fin. Auth. for Nonprofit Corps., Insured Rev. Ref. Bonds
(Casa de las Campanas, Inc.), Series 2010, 6.00% 2037 | | | 6,000 | | | | 6,680 | |
Assn. of Bay Area Governments, Fin. Auth. for Nonprofit Corps.,
Insured Senior Living Rev. Ref. Bonds (Odd Fellows Home of California),
Series 2012-A, 5.00% 2032 | | | 5,000 | | | | 5,560 | |
Bay Area Toll Auth., San Francisco Bay Area Toll Bridge Rev. Ref. Bonds,
Series 2006-C-1, 0.96% 2045 (put 2023)1 | | | 2,000 | | | | 1,977 | |
Bay Area Toll Auth., San Francisco Bay Area Toll Bridge Rev. Ref. Bonds,
Series 2008-F-1, 5.00% 2039 (preref. 2018) | | | 2,000 | | | | 2,308 | |
| American Funds Tax-Exempt Funds | 41 |
The Tax-Exempt Fund of California
| Bonds, notes & other debt instruments (continued) | | Principal amount
(000) | | | Value
(000) | |
| California (continued) | | | | | | | | |
| City & county issuers (continued) | | | | | | | | |
Bay Area Toll Auth., San Francisco Bay Area Toll Bridge Rev. Ref. Bonds,
Series 2008-F-1, 5.125% 2047 (preref.2018) | | $ | 6,000 | | | $ | 6,951 | |
Bay Area Toll Auth., San Francisco Bay Area Toll Bridge Rev. Ref. Bonds,
Series 2009-F-1, 5.125% 2039 (preref. 2019) | | | 2,000 | | | | 2,366 | |
Bay Area Toll Auth., San Francisco Bay Area Toll Bridge Rev. Ref. Bonds,
Series 2009-F-1, 5.625% 2044 (preref. 2019) | | | 1,670 | | | | 2,014 | |
County of Contra Costa Public Fncg. Auth., Lease Rev. Ref. Bonds (Medical Center Ref.),
Series 2007-B, National insured, 5.00% 2017 | | | 5,000 | | | | 5,533 | |
Foothill/Eastern Transportation Corridor Agcy., Toll Road Rev. Ref. Bonds,
Series 2013-A, 6.00% 2053 | | | 7,500 | | | | 8,589 | |
Successor Agcy. to the Inland Valley Dev. Agcy., Tax Allocation Ref. Bonds,
Series 2014-A 5.00% 2044 | | | 7,500 | | | | 8,015 | |
City of Los Angeles Harbor Dept., Rev. Ref. Bonds,
Series 2006-A, AMT, National insured, 5.00% 2020 | | | 6,000 | | | | 6,626 | |
City of Los Angeles, Dept. of Water and Power, Power System Rev. Bonds,
Series 2008-A-2, 5.25% 2032 | | | 2,000 | | | | 2,265 | |
City of Los Angeles, Dept. of Water and Power, Power System Rev. Ref. Bonds,
Series 2009-A, 5.00% 2027 | | | 1,500 | | | | 1,729 | |
City of Los Angeles, Dept. of Water and Power, Power System Rev. Ref. Bonds,
Series 2009-A, 5.00% 2028 | | | 1,835 | | | | 2,106 | |
City of Los Angeles, Dept. of Water and Power, Power System Rev. Ref. Bonds,
Series 2009-B, 5.25% 2023 | | | 1,500 | | | | 1,785 | |
Dept. of Airports of the City of Los Angeles, Los Angeles International Airport, Rev. Ref. Bonds,
Series 2008-A, AMT, 5.50% 2022 | | | 5,000 | | | | 5,728 | |
Roseville Natural Gas Fncg. Auth., Gas Rev. Bonds,
Series 2007, 5.00% 2022 | | | 4,920 | | | | 5,548 | |
| Sacramento Cogeneration Auth., Cogeneration Project Rev. Ref. Bonds (Procter & Gamble Project), Series 2009, 5.25% 2020 | | | 995 | | | | 1,191 | |
| Sacramento Cogeneration Auth., Cogeneration Project Rev. Ref. Bonds (Procter & Gamble Project), Series 2009, 5.25% 2021 | | | 900 | | | | 1,082 | |
Sacramento Municipal Utility Dist., Electric Rev. Bonds,
Series 1997-K, AMBAC insured, 5.25% 2024 | | | 2,000 | | | | 2,383 | |
Sacramento Municipal Utility Dist., Electric Rev. Bonds,
Series 1997-K, AMBAC insured, 5.70% 2017 | | | 2,500 | | | | 2,882 | |
Sacramento Municipal Utility Dist., Electric Rev. Bonds,
Series 1997-K, AMBAC insured, 5.80% 2019 | | | 3,000 | | | | 3,661 | |
Sacramento Municipal Utility Dist., Electric Rev. Bonds,
Series 2013-A, 5.00% 2041 | | | 4,500 | | | | 4,959 | |
Sacramento County Sanitation Districts Fncg. Auth., Rev. Ref. Bonds
(Sacramento Regional County Sanitation Dist.),
Series 2007-B, FGIC-National insured, 0.682% 20351 | | | 13,500 | | | | 11,805 | |
| Sacramento Municipal Utility Dist. Fncg. Auth., Cosumnes Project Rev. Bonds, Series 2006, National insured, 5.125% 2029 | | | 10,000 | | | | 10,655 | |
City of San Buenaventura, Rev. Bonds (Community Memorial Health System),
Series 2011, 7.50% 2041 | | | 10,825 | | | | 12,486 | |
Public Facs. Fncg. Auth. of the City of San Diego, Water Rev. Ref. Bonds,
Series 2012-A, 5.00% 2028 | | | 5,000 | | | | 5,799 | |
| 42 | American Funds Tax-Exempt Funds |
The Tax-Exempt Fund of California
| | | Principal amount
(000) | | | Value
(000) | |
Airport Commission, City and County of San Francisco, San Francisco International Airport,
Second Series Rev. Bonds, Series 2009-E, 6.00% 2039 | | $ | 3,000 | | | $ | 3,560 | |
Airport Commission, City and County of San Francisco, San Francisco International Airport,
Second Series Rev. Ref. Bonds, Issue 34-E, AMT, 5.75% 2019 | | | 3,500 | | | | 4,062 | |
Airport Commission, City and County of San Francisco, San Francisco International Airport,
Second Series Rev. Ref. Bonds, Series 2009-A, 4.90% 2029 | | | 5,000 | | | | 5,648 | |
Airport Commission, City and County of San Francisco, San Francisco International Airport,
Second Series Rev. Ref. Bonds, Series 2010-F, 5.00% 2040 | | | 3,000 | | | | 3,187 | |
Airport Commission, City and County of San Francisco, San Francisco International Airport,
Second Series Rev. Ref. Bonds, Series 2011-F, AMT, 5.00% 2028 | | | 2,630 | | | | 2,914 | |
Airport Commission, City and County of San Francisco, San Francisco International Airport,
Second Series Rev. Ref. Bonds, Series 2012-A, AMT, 5.00% 2028 | | | 1,000 | | | | 1,116 | |
Airport Commission, City and County of San Francisco, San Francisco International Airport,
Second Series Rev. Ref. Bonds, Series 2012-A, AMT, 5.00% 2030 | | | 1,000 | | | | 1,103 | |
| San Francisco Municipal Transportation Agcy., Rev. Bonds, Series 2012-B, 5.00% 2042 | | | 5,000 | | | | 5,504 | |
| City of San Jose, Airport Rev. Ref. Bonds, Series 2011-A-1, AMT, 5.50% 2030 | | | 8,000 | | | | 8,891 | |
Tobacco Securitization Auth. of Southern California, Tobacco Settlement Asset-backed
Rev. Ref. Bonds (San Diego County Tobacco Asset Securitization Corp.),
Series 2006-A, 5.125% 2046 | | | 7,800 | | | | 5,888 | |
City of Torrance, Rev. Bonds (Torrance Memorial Medical Center),
Series 2010-A, 5.00% 2040 | | | 5,185 | | | | 5,442 | |
| Other securities | | | | | | | 633,695 | |
| | | | | | | | 821,033 | |
| | | | | | | | | |
| Puerto Rico 1.85% | | | | | | | | |
Industrial, Tourist, Educational, Medical and Environmental Control Facs. Fncg. Auth.,
Hospital Rev. and Rev. Ref. Bonds (Hospital Auxilio Mutuo Obligated Group Project),
Series 2011-A, 6.00% 2033 | | | 7,150 | | | | 7,363 | |
| Other securities | | | | | | | 20,635 | |
| | | | | | | | 27,998 | |
| | | | | | | | | |
| Other U.S. territories 1.88% | | | | | | | | |
| Other securities | | | | | | | 28,635 | |
| | | | | | | | | |
| Total bonds, notes & other debt instruments (cost: $1,310,498,000) | | | | | | | 1,393,576 | |
| American Funds Tax-Exempt Funds | 43 |
The Tax-Exempt Fund of California
| Short-term securities 7.51% | | Principal amount
(000) | | | Value
(000) | |
Statewide Communities Dev. Auth., Rev. Ref. Bonds (John Muir Health),
Series 2008-C, Wells Fargo Bank LOC, 0.05% 20271 | | $ | 5,595 | | | $ | 5,595 | |
Dept. of Water and Power of the City of Los Angeles, Power System Demand Rev. Bonds,
Series 2001-B, Subseries B-6, 0.04% 20341 | | | 8,900 | | | | 8,900 | |
| County of Ventura, 2014-15 Tax and Rev. Anticipation Notes 1.50% 2015 | | | 15,000 | | | | 15,189 | |
| County of Los Angeles, 2014-15 Tax and Rev. Anticipation Notes, 1.50% 2015 | | | 11,335 | | | | 11,480 | |
Fin. Auth., Recovery Zone Fac. Bonds (Chevron U.S.A. Inc. Project),
Series 2010-A, 0.03% 20351 | | | 3,600 | | | | 3,600 | |
Fin. Auth., Recovery Zone Fac. Bonds (Chevron U.S.A. Inc. Project),
Series 2010-B, 0.03% 20351 | | | 3,650 | | | | 3,650 | |
Statewide Communities Dev. Auth., Pollution Control Rev. Ref. Bonds
(Chevron U.S.A. Inc. Project),
Series 2002, 0.03% 20241 | | | 2,265 | | | | 2,265 | |
Health Facs. Fncg. Auth., Rev. Bonds (St. Joseph Health System),
Series 2011-B, 0.05% 20411 | | | 7,900 | | | | 7,900 | |
Infrastructure and Econ. Dev. Bank, Ref. Rev. Bonds (Pacific Gas and Electric Company),
Series 2009-D, 0.03% 20161 | | | 1,600 | | | | 1,600 | |
Infrastructure and Econ. Dev. Bank, Rev. Ref. Bonds (Pacific Gas and Electric Company),
Series 2009-C, 0.03% 20161 | | | 1,000 | | | | 1,000 | |
Pollution Control Fncg. Auth., Pollution Control Rev. Ref. Bonds (Pacific Gas and Electric Co.),
Series 1996-C, JPMorgan Chase LOC, 0.04% 20261 | | | 4,800 | | | | 4,800 | |
Pollution Control Fncg. Auth., Pollution Control Rev. Ref. Bonds (Pacific Gas and Electric Co.),
Series 1996-E, JPMorgan Chase LOC, 0.04% 20261 | | | 2,900 | | | | 2,900 | |
Pollution Control Fncg. Auth., Pollution Control Rev. Ref. Bonds (Pacific Gas and Electric Co.),
Series 1996-F, JPMorgan Chase LOC, 0.04% 20261 | | | 9,900 | | | | 9,900 | |
Pollution Control Fncg. Auth., Pollution Control Rev. Ref. Bonds (Pacific Gas and Electric Co.),
Series 1997-B, AMT, JPMorgan Chase LOC, 0.06% 20261 | | | 18,900 | | | | 18,900 | |
| Other securities | | | | | | | 16,210 | |
| | | | | | | | | |
| Total short-term securities (cost: $113,887,000) | | | | | | | 113,889 | |
| Total investment securities 99.33% (cost: $1,424,385,000) | | | | | | | 1,507,465 | |
| Other assets less liabilities 0.67% | | | | | | | 10,207 | |
| | | | | | | | | |
| Net assets 100.00% | | | | | | $ | 1,517,672 | |
This summary investment portfolio is designed to streamline the report and help investors better focus on the fund’s principal holdings. See page 88 for details on how to obtain a complete schedule of portfolio holdings.
“Other securities” includes all issues that are not disclosed separately in the summary investment portfolio.
| 1 | Coupon rate may change periodically. For short-term securities, the date of the next scheduled coupon rate change is considered to be the maturity date. |
| 2 | Acquired in a transaction exempt from registration under Rule 144A of the Securities Act of 1933. May be resold in the U.S. in transactions exempt from registration, normally to qualified institutional buyers. The total value of all such securities, including those in “Other securities,” was $30,240,000, which represented 1.99% of the net assets of the fund. |
Key to abbreviations
Agcy. = Agency
AMT = Alternative Minimum Tax
Auth. = Authority
Certs. of Part. = Certificates of Participation
Dept. = Department
Dev. = Development
Dist. = District
Econ. = Economic
Fac. = Facility
Facs. = Facilities
Fin. = Finance
Fncg. = Financing
G.O. = General Obligation
LOC = Letter of Credit
Preref. = Prerefunded
Redev. = Redevelopment
Ref. = Refunding
Rev. = Revenue
TECP = Tax-Exempt Commercial Paper
See Notes to Financial Statements
| 44 | American Funds Tax-Exempt Funds |
American Funds Tax-Exempt Fund of New York
Investment portfolio July 31, 2014
| Bonds, notes & other debt instruments 91.07% | | Principal amount
(000) | | | Value
(000) | |
| New York 82.34% | | | | | | | | |
| State issuers 44.97% | | | | | | | | |
| Build NYC Resource Corp., Rev. Bonds (Bronx Charter School for Excellence Project), Series 2013-A, 5.50% 2043 | | $ | 1,000 | | | $ | 1,037 | |
| Metropolitan Transportation Auth., Dedicated Tax Fund Rev. Ref. Bonds, Series 2008-A-2A, 0.44% 2026 (put 2017)1 | | | 500 | | | | 500 | |
| Metropolitan Transportation Auth., Dedicated Tax Fund Bonds, Series 2004-C, AMBAC insured, 5.50% 2017 | | | 1,000 | | | | 1,156 | |
| Metropolitan Transportation Auth., Dedicated Tax Fund Rev. Ref. Bonds, Series 2002-B-3D, 1.06% 20201 | | | 2,000 | | | | 2,005 | |
| Dormitory Auth., Touro College and University System Obligated Group Rev. Bonds, Series 2014-A, 5.50% 2039 | | | 500 | | | | 547 | |
| Dormitory Auth., Consolidated Service Contract Rev. Ref. Bonds, Series 2010, 5.00% 2020 | | | 500 | | | | 593 | |
| Dormitory Auth., Culinary Institute of America Rev. Bonds, Series 2013, 5.50% 2033 | | | 500 | | | | 547 | |
| Dormitory Auth., Fordham University Rev. Bonds, Series 2011-A, 5.50% 2036 | | | 1,000 | | | | 1,118 | |
| Dormitory Auth., Lease Rev. Bonds (State University Dormitory Facs. Issue), Series 2010-A, 5.00% 2035 | | | 1,000 | | | | 1,111 | |
| Dormitory Auth., Third General Resolution Rev. Ref. Bonds (State University Educational Facs. Issue), Series 2012-A, 5.00% 2020 | | | 1,000 | | | | 1,184 | |
| Dormitory Auth., Miriam Osborn Memorial Home Association Rev. Ref. Bonds, Series 2012, 5.00% 2042 | | | 970 | | | | 1,015 | |
| Dormitory Auth., Mount Sinai School of Medicine of New York University, Rev. Ref. Bonds, Series 2010-A, 5.00% 2021 | | | 1,000 | | | | 1,146 | |
| Dormitory Auth., New School Rev. Bonds, Series 2010, 5.25% 2021 | | | 500 | | | | 580 | |
| Dormitory Auth., New School Rev. Bonds, Series 2010, 5.50% 2040 | | | 500 | | | | 545 | |
| Dormitory Auth., North Shore-Long Island Jewish Obligated Group, Rev. Ref. Bonds, Series 2011-A, 5.00% 2032 | | | 1,500 | | | | 1,622 | |
| Dormitory Auth., NYU Hospitals Center Rev. Bonds, Series 2011-A, 6.00% 2040 | | | 1,000 | | | | 1,116 | |
| Dormitory Auth., Orange Regional Medical Center Obligated Group Rev. Bonds, Series 2008,6.25% 2037 | | | 1,000 | | | | 1,043 | |
| Dormitory Auth., Rochester General Hospital Insured Rev. Bonds, Series 2005, RADIAN insured, 5.00% 2015 (escrowed to maturity) | | | 720 | | | | 766 | |
| Dormitory Auth., School Districts Rev. Bond Fncg. Program Rev. Ref. Bonds, Series 2011-A, 5.00% 2024 | | | 1,000 | | | | 1,165 | |
| Dormitory Auth. of the State of New York, School Districts Rev. Bond Fncg. Program Rev. Bonds, Series 2013-E, Assured Guaranty Municipal insured, 5.00% 2022 | | | 1,000 | | | | 1,202 | |
| Dormitory Auth., Skidmore College Rev. Bonds, Series 2011-A, 5.50% 2041 | | | 1,420 | | | | 1,581 | |
| Dormitory Auth., State Personal Income Tax Rev. Bonds (Education), Series 2014-C, 5.00% 2038 | | | 500 | | | | 562 | |
| Environmental Facs. Corp., Solid Waste Disposal Rev. Ref. Bonds (Waste Management, Inc. Project), Series 2013-A, 2.75% 2017 | | | 1,000 | | | | 1,051 | |
| Environmental Facs. Corp., Solid Waste Disposal Rev. Ref. Bonds (Waste Management, Inc. Project), Series 2012, AMT, 0.45% 2030 (put 2014)1 | | | 500 | | | | 500 | |
| Hudson Yards Infrastructure Corp., Rev. Bonds, Fiscal 2012 Series A, 5.25% 2047 | | | 1,000 | | | | 1,090 | |
| Hudson Yards Infrastructure Corp., Rev. Bonds, Fiscal 2012 Series A, 5.75% 2047 | | | 1,000 | | | | 1,139 | |
| Liberty Dev. Corp., Liberty Rev. Ref. Bonds (4 World Trade Center Project), Series 2011, 5.00% 2031 | | | 1,500 | | | | 1,639 | |
| Liberty Dev. Corp., Liberty Rev. Ref. Bonds (Bank of America Tower at One Bryant Park Project), Series 2010, 6.375% 2049 | | | 1,500 | | | | 1,655 | |
| Liberty Dev. Corp., Rev. Bonds (Goldman Sachs Headquarters Issue), Series 2005, 5.25% 2035 | | | 2,000 | | | | 2,319 | |
| Dobbs Ferry Local Dev. Corp., Rev. Bonds, Series 2014, 5.00% 2039 | | | 1,000 | | | | 1,090 | |
| Dobbs Ferry Local Dev. Corp., Rev. Bonds, Series 2014,5.00% 2044 | | | 750 | | | | 814 | |
| American Funds Tax-Exempt Funds | 45 |
American Funds Tax-Exempt Fund of New York
| Bonds, notes & other debt instruments (continued) | | Principal amount
(000) | | | Value
(000) | |
| New York (continued) | | | | | | | | |
| State issuers (continued) | | | | | | | | |
| Metropolitan Transportation Auth., Transportation Rev. Bonds, Series 2012-A2, 0.33% 2041 (put 2016)1 | | $ | 905 | | | $ | 905 | |
| Metropolitan Transportation Auth., Transportation Rev. Bonds, Series 2012-E, 5.00% 2031 | | | 1,000 | | | | 1,115 | |
| Metropolitan Transportation Auth., Transportation Rev. Bonds, Series 2014-B, 5.00% 2044 | | | 1,000 | | | | 1,093 | |
| Metropolitan Transportation Auth., Transportation Rev. Ref. Bonds, Series 2002-G-1H, 0.952% 2026 (put 2016)1 | | | 715 | | | | 723 | |
| Mortgage Agcy., Homeowner Mortgage Rev. Bonds, Series 178,3.50% 2043 | | | 575 | | | | 619 | |
| Mortgage Agcy., Mortgage Rev. Bonds, Series 46, 5.00% 2029 | | | 310 | | | | 334 | |
| Mortgage Agcy., Mortgage Rev. Ref. Bonds, Series 45,4.50% 2029 | | | 630 | | | | 648 | |
| Mortgage Agcy., Mortgage Rev. Ref. Bonds, Series 48,2.625% 2041 | | | 820 | | | | 850 | |
| Port Auth., Consolidated Bonds, Series 147, AMT, FGIC-National insured, 5.00% 2021 | | | 1,000 | | | | 1,101 | |
| Port Auth., Consolidated Bonds, Series 166, 5.00% 2031 | | | 1,000 | | | | 1,113 | |
| Port Auth., Consolidated Rev. Ref. Bonds, Series 136, AMT, National insured, 5.00% 2021 | | | 500 | | | | 507 | |
| Port Auth., Consolidated Rev. Ref. Bonds, Series 167, AMT, 5.00% 2025 | | | 1,000 | | | | 1,132 | |
| Port Auth., Consolidated Rev. Ref. Bonds, Series 172, AMT, 5.00% 2034 | | | 1,000 | | | | 1,090 | |
| Port Auth., Special Project Bonds (JFK International Air Terminal LLC Project), Series 8, 5.00% 2020 | | | 1,000 | | | | 1,159 | |
| Power Auth. of the State of New York, Rev. Ref. Bonds, Series 2011-A, 5.00% 2038 | | | 1,500 | | | | 1,668 | |
| Thruway Auth., General Rev. Bonds, Series 2014-J, 5.00% 2027 | | | 1,000 | | | | 1,165 | |
| Thruway Auth., General Rev. Junior Indebtedness Obligations Series 2013-A, 5.00% 2019 | | | 500 | | | | 580 | |
| Thruway Auth., Local Highway and Bridge Service Contract Rev. Ref. Bonds, Series 2009, 5.00% 2020 | | | 1,000 | | | | 1,172 | |
| Thruway Auth., Second General Highway and Bridge Trust Fund Bonds, Series 2010-A, 5.00% 2015 | | | 750 | | | | 774 | |
| Tobacco Settlement Fncg. Corp., Asset-Backed Rev. Bonds, Series 2013-B, 5.00% 2020 | | | 400 | | | | 433 | |
| Tobacco Settlement Fncg. Corp., Asset-Backed Rev. Bonds, Series 2013-B, 5.00% 2021 | | | 200 | | | | 216 | |
| Tobacco Settlement Fncg. Corp., Rev. Ref. Bonds (State Contingency Contract Secured), Series 2011-B, 5.00% 2018 | | | 1,000 | | | | 1,154 | |
| Triborough Bridge and Tunnel Auth. (MTA Bridges and Tunnels), General Rev. Bonds, Series 2010-A-1,5.00% 2019 | | | 1,000 | | | | 1,180 | |
| Troy Industrial Dev. Auth., Civic Fac. Rev. Bonds (Rensselaer Polytechnic Institute Project), Series 2011-E, 5.00% 2031 | | | 500 | | | | 543 | |
| Urban Dev. Corp., Service Contract Rev. Ref. Bonds, Series 2010-A-2, 5.00% 2020 | | | 1,000 | | | | 1,174 | |
| Urban Dev. Corp., State Personal Income Tax Rev. Bonds (State Facs. and Equipment), Series 2009-B-1,5.25% 2038 | | | 1,000 | | | | 1,121 | |
| | | | | | | | 57,007 | |
| | | | | | | | | |
| City & county issuers 37.37% | | | | | | | | |
| City of Albany Capital Resource Corp., Rev. Bonds (St. Peter’s Hospital of the City of Albany Project), Series 2011,6.25% 2038 | | | 1,000 | | | | 1,131 | |
| City of Albany Industrial Dev. Agcy., Civic Fac. Rev. Ref. Bonds (St. Peter’s Hospital of the City of Albany Project), Series 2008-A, 5.25% 2027 | | | 500 | | | | 549 | |
| Buffalo and Erie County Industrial Land Dev. Corp., Rev. Bonds (Buffalo State College Foundation Housing Corp. Project), Series 2011-A, 5.375% 2041 | | | 1,400 | | | | 1,525 | |
| Build NYC Resource Corp., Parking Fac. Rev. Ref. Bonds (Royal Charter Properties, Inc.- New York and Presbyterian Hospital Leasehold Project), Series 2012, Assured Guaranty Municipal insured, 4.75% 2032 | | | 1,000 | | | | 1,050 | |
| County of Chautauqua Industrial Dev. Agcy., Exempt Fac. Rev. Bonds (NRG Dunkirk Power Project), Series 2009,5.875% 2042 | | | 1,000 | | | | 1,088 | |
| 46 | American Funds Tax-Exempt Funds |
American Funds Tax-Exempt Fund of New York
| | | Principal amount | | | Value | |
| | | | (000) | | | | (000) | |
| Dutchess County Local Dev. Corp., Rev. Ref. Bonds (Health Quest Systems, Inc. Project), Series 2010, 5.75% 2030 | | $ | 500 | | | $ | 560 | |
| Dutchess County Local Dev. Corp., Rev. Ref. Bonds (Health Quest Systems, Inc. Project), Series 2010, 5.75% 2040 | | | 1,000 | | | | 1,102 | |
| Erie County Industrial Dev. Agcy., School Fac. Rev. Bonds (City School Dist. of the City of Buffalo Project), Series 2011-A, 5.25% 2025 | | | 1,000 | | | | 1,176 | |
| Erie County Industrial Dev. Agcy., School Fac. Rev. Ref. Bonds (City School Dist. of the City of Buffalo Project), Series 2012-A, 5.00% 2021 | | | 1,000 | | | | 1,183 | |
| Erie County Industrial Dev. Agcy., School Fac. Rev. Ref. Bonds (City School Dist. of the City of Buffalo Project), Series 2013-A, 5.00% 2027 | | | 790 | | | | 917 | |
| Essex County Industrial Dev. Agcy., Solid Waste Disposal Rev. Ref. Bonds, Series 2005-A, AMT, 5.20% 2023 | | | 750 | | | | 776 | |
| Various Purpose G.O. Bonds, Series 2007-B, 5.00% 2017 | | | 1,215 | | | | 1,375 | |
| Town of Hempstead Local Dev. Corp., Rev. Bonds (Hofstra University Project), Series 2011, 5.00% 2027 | | | 1,300 | | | | 1,452 | |
| Town of Hempstead Local Dev. Corp., Rev. Bonds (Hofstra University Project), Series 2011, 5.00% 2041 | | | 1,600 | | | | 1,720 | |
| Long Island Power Auth., Electric System General Rev. Bonds, Series 2011-A, 5.00% 2038 | | | 1,000 | | | | 1,066 | |
| Long Island Power Auth., Electric System General Rev. Ref. Bonds, Series 2003-B, 5.25% 2014 | | | 1,000 | | | | 1,017 | |
| County of Monroe Industrial Dev. Agcy., School Fac. Rev. Bonds (Rochester Schools Modernization Project), Series 2012-A, 5.00% 2021 | | | 1,000 | | | | 1,186 | |
| Nassau County Local Econ. Assistance Corp., Rev. Ref. Bonds (Winthrop-University Hospital Association Project), Series 2012, 5.00% 2037 | | | 1,000 | | | | 1,041 | |
| City of New York, G.O. Bonds, Fiscal 2008 Series J-4, 0.61% 20251 | | | 1,500 | | | | 1,499 | |
| City of New York, G.O. Bonds, Fiscal 2008 Series L-1, 5.00% 2023 | | | 1,000 | | | | 1,133 | |
| City of New York, G.O. Bonds, Fiscal 2011 Series B, 5.00% 2019 | | | 925 | | | | 1,088 | |
| New York City Industrial Dev. Agcy., Special Fac. Rev. Bonds (1998 British Airways Plc Project), Series 1998, AMT, 5.25% 2032 | | | 500 | | | | 500 | |
| New York City Industrial Dev. Agcy., Special Fac. Rev. Bonds (American Airlines, Inc. John F. Kennedy International Airport Project), Series 2005, AMT, 7.625% 2025 | | | 1,500 | | | | 1,648 | |
| New York City Municipal Water Fin. Auth., Water and Sewer System Second General Resolution Rev. Ref. Bonds, Fiscal 2011 Series EE, 5.375% 2043 | | | 1,000 | | | | 1,171 | |
| New York City Transitional Fin. Auth., Building Aid Rev. Bonds, Fiscal 2007 Series S-2, Assured Guaranty Municipal insured, 5.00% 2017 | | | 570 | | | | 631 | |
| New York City Transitional Fin. Auth., Future Tax Secured Bonds, Fiscal 2011 Series C, 5.25% 2025 | | | 1,000 | | | | 1,184 | |
| New York City Transitional Fin. Auth., Future Tax Secured Rev. Ref. Bonds, Fiscal 2010 Series D, 5.00% 2023 | | | 1,000 | | | | 1,167 | |
| New York City Transitional Fin. Auth., Future Tax Secured Rev. Ref. Bonds, Series 2014-A1, 5.00% 2037 | | | 500 | | | | 563 | |
| New York City Transitional Fin. Auth., Future Tax Secured Rev. Ref. Bonds, Series 2014-A1, 5.00% 2038 | | | 500 | | | | 562 | |
| New York City, Health and Hospitals Corp., Health System Rev. Ref. Bonds, Series 2010-A, 5.00% 2021 | | | 540 | | | | 619 | |
| New York City, Health and Hospitals Corp., Health System Rev. Ref. Bonds, Series 2010-A, 5.00% 2025 | | | 500 | | | | 566 | |
| Trust for Cultural Resources of the City of New York, Rev. Bonds (Juilliard School), Series 2009-B, 1.35% 2036 (put 2017) | | | 1,500 | | | | 1,521 | |
| American Funds Tax-Exempt Funds | 47 |
American Funds Tax-Exempt Fund of New York
| Bonds, notes & other debt instruments (continued) | | Principal amount
(000) | | | Value
(000) | |
| New York (continued) | | | | | | | | |
| City & county issuers (continued) | | | | | | | | |
| Niagara Area Dev. Corp. (New York), Solid Waste Disposal Fac. Rev. Ref. Bonds (Covanta Energy Project), Series 2012-A, AMT, 5.25% 2042 | | $ | 750 | | | $ | 759 | |
| Onondaga Civic Dev. Corp., Rev. Bonds (St. Joseph’s Hospital Health Center Project), Series 2014-A, 5.125% 2031 | | | 1,000 | | | | 1,037 | |
| County of Rockland G.O. Bonds, Series 2014-A, Assured Guaranty Municipal insured, 5.00% 2024 | | | 1,000 | | | | 1,184 | |
| Suffolk County Econ. Dev. Corp., Rev. Ref. Bonds (Catholic Health Services of Long Island Obligated Group Project), Series 2011, 5.00% 2028 | | | 1,000 | | | | 1,081 | |
| Suffolk County Econ. Dev. Corp., Rev. Ref. Bonds (Peconic Landing at Southold, Inc. Project), Series 2010, 5.875% 2030 | | | 1,000 | | | | 1,095 | |
| Suffolk County Industrial Dev. Agcy., Continuing Care Retirement Community Rev. Ref. Bonds (Jefferson’s Ferry Project), Series 2006, 5.00% 2028 | | | 1,000 | | | | 1,033 | |
Suffolk County Industrial Dev. Agcy., Industrial Dev. Rev. Bonds
(KeySpan-Port Jefferson Energy Center, LLC Project), Series 2003-A, AMT, 5.25% 2027 | | | 1,000 | | | | 1,005 | |
| Suffolk Tobacco Asset Securitization Corp., Tobacco Settlement Asset-Backed Rev. Ref. Bonds, Series 2012-B, 5.00% 2032 | | | 750 | | | | 784 | |
| TSASC, Inc., Tobacco Settlement Asset-Backed Rev. Ref. Bonds, Series 2006-1, 5.00% 2034 | | | 1,230 | | | | 1,012 | |
| TSASC, Inc., Tobacco Settlement Asset-Backed Rev. Ref. Bonds, Series 2006-1, 5.125% 2042 | | | 2,250 | | | | 1,798 | |
| Westchester County Health Care Corp., Rev. Bonds, Series 2010-B, 6.00% 2030 | | | 1,000 | | | | 1,136 | |
| Westchester County Local Dev. Corp., Rev. Ref. Bonds (Pace University), Series 2014-A, 5.50% 2042 | | | 500 | | | | 539 | |
| City of Yonkers, G.O. Bonds, Series 2011-A, 5.00% 2019 | | | 1,000 | | | | 1,137 | |
| | | | | | | | 47,366 | |
| | | | | | | | | |
| Guam 2.94% | | | | | | | | |
| A.B. Won Pat International Airport Auth., General Rev. Bonds, Series 2013-C, AMT, 6.375% 2043 | | | 500 | | | | 558 | |
| Government of Guam, Business Privilege Tax Bonds, Series 2011-A, 5.00% 2031 | | | 1,200 | | | | 1,267 | |
| Government of Guam, Hotel Occupancy Tax Rev. Ref. Bonds, Series 2011-A, 6.125% 2031 | | | 500 | | | | 557 | |
| Waterworks Auth., Water and Wastewater System Rev. Bonds, Series 2013, 5.00% 2028 | | | 500 | | | | 539 | |
| Waterworks Auth., Water and Wastewater System Rev. Bonds, Series 2014-A, 5.00% 2029 | | | 750 | | | | 808 | |
| | | | | | | | 3,729 | |
| | | | | | | | | |
| Puerto Rico 3.63% | | | | | | | | |
| Aqueduct and Sewer Auth., Rev. Ref. Bonds, Series 2012-A, 5.25% 2042 | | | 250 | | | | 171 | |
| Industrial, Tourist, Educational, Medical and Environmental Control Facs. Fncg. Auth., Higher Education Rev. and Rev. Ref. Bonds (Inter American University of Puerto Rico Project), Series 2012, 5.00% 2031 | | | 750 | | | | 697 | |
| Industrial, Tourist, Educational, Medical and Environmental Control Facs. Fncg. Auth., Higher Education Rev. and Rev. Ref. Bonds (University of the Sacred Heart Project), Series 2012, 5.00% 2020 | | | 500 | | | | 495 | |
| Industrial, Tourist, Educational, Medical and Environmental Control Facs. Fncg. Auth., Higher Education Rev. and Rev. Ref. Bonds (University of the Sacred Heart Project), Series 2012, 5.00% 2042 | | | 500 | | | | 391 | |
| Industrial, Tourist, Educational, Medical and Environmental Control Facs. Fncg. Auth., Hospital Rev. and Rev. Ref. Bonds (Hospital Auxilio Mutuo Obligated Group Project), Series 2011-A, 6.00% 2033 | | | 1,000 | | | | 1,030 | |
| Public Improvement Ref. Bonds (G.O. Bonds), Series 2012-A, 5.00% 2041 | | | 750 | | | | 532 | |
| Public Improvement Ref. Bonds (G.O. Bonds), Series 2014-A, 8.00% 2035 | | | 1,200 | | | | 1,082 | |
| University of Puerto Rico, University System Rev. Ref. Bonds, Series 2006-Q, 5.00% 2020 | | | 350 | | | | 207 | |
| | | | | | | | 4,605 | |
| 48 | American Funds Tax-Exempt Funds |
American Funds Tax-Exempt Fund of New York
| | | Principal amount | | | Value | |
| | | | (000) | | | | (000) | |
| Virgin Islands 2.16% | | | | | | | | |
| Public Fin. Auth., Rev. Bonds (Matching Fund Loan Note - Diageo Project), Series 2009-A, 6.625% 2029 | | $ | 500 | | | $ | 550 | |
| Public Fin. Auth., Rev. Ref. Bonds (Matching Fund Loan Note), Series 2013-B, 5.00% 2024 | | | 500 | | | | 567 | |
| Public Fin. Auth., Rev. Ref. Bonds (Matching Fund Loan Notes), Series 2012-A, 5.00% 2032 | | | 1,500 | | | | 1,612 | |
| | | | | | | | 2,729 | |
| | | | | | | | | |
| Total bonds, notes & other debt instruments (cost: $109,374,000) | | | | | | | 115,436 | |
| | | | | | | | | |
| Short-term securities 10.75% | | | | | | | | |
| Trust for Cultural Resources of the City of New York, Rev. Ref. Bonds (Lincoln Center for the Performing Arts, Inc.), Series 2008-A-1, JPMorgan Chase LOC, 0.05% 20351 | | | 4,050 | | | | 4,050 | |
| City of New York, G.O. Bonds, Fiscal 1993 Series A-7, JPMorgan Chase LOC, 0.06% 20201 | | | 3,100 | | | | 3,100 | |
| City of New York, G.O. Bonds, Fiscal 1993 Series A-7, JPMorgan Chase LOC, 0.06% 20211 | | | 1,100 | | | | 1,100 | |
| City of New York, G.O. Bonds, Fiscal 1994 Series E-2, 0.06% 20201 | | | 1,400 | | | | 1,400 | |
| New York City, Transitional Fin. Auth., New York City Recovery Bonds, Fiscal Series 2003-1, Subseries 1-C, 0.06% 20221 | | | 1,400 | | | | 1,400 | |
| Triborough Bridge and Tunnel Auth. (MTA Bridges and Tunnels), General Rev. Bonds, Series 2003-B-3, U.S. Bank LOC, 0.06% 20331 | | | 1,800 | | | | 1,800 | |
| Dormitory Auth., University of Rochester Rev. Bonds, Series 2003-A, | | | | | | | | |
| JPMorgan Chase LOC, 0.06% 20311 | | | 780 | | | | 780 | |
| | | | | | | | | |
| Total short-term securities (cost: $13,630,000) | | | | | | | 13,630 | |
| Total investment securities 101.82% (cost: $123,004,000) | | | | | | | 129,066 | |
| Other assets less liabilities (1.82)% | | | | | | | (2,301 | ) |
| | | | | | | | | |
| Net assets 100.00% | | | | | | $ | 126,765 | |
| 1 | Coupon rate may change periodically. For short-term securities, the date of the next scheduled coupon rate change is considered to be the maturity date. |
| Key to abbreviations | |
| Agcy. = Agency | |
| AMT = Alternative Minimum Tax | |
| Auth. = Authority | |
| Certs. of Part. = Certificates of Participation | |
| Dept. = Department | |
| Dev. = Development | |
| Dist. = District | |
| Econ. = Economic | |
| Fac. = Facility | |
| Facs. = Facilities | |
| Fin. = Finance | |
| Fncg. = Financing | |
| G.O. = General Obligation | |
| LOC = Letter of Credit | |
| Preref. = Prerefunded | |
| Redev. = Redevelopment | |
| Ref. = Refunding | |
| Rev. = Revenue | |
| TECP = Tax-Exempt Commercial Paper | |
See Notes to Financial Statements
| American Funds Tax-Exempt Funds | 49 |
Financial statements
Statements of assets and liabilities
at July 31, 2014
| | | American Funds
Short-Term
Tax-Exempt Bond Fund | | | Limited Term
Tax-Exempt Bond
Fund of America | |
| | | | | | | |
| Assets: | | | | | | | | |
| Investment securities, at value | | $ | 803,044 | | | $ | 3,065,681 | |
| Cash | | | 171 | | | | 129 | |
| Receivables for: | | | | | | | | |
| Sales of fund’s shares | | | 3,387 | | | | 5,028 | |
| Interest | | | 5,705 | | | | 28,842 | |
| | | | 812,307 | | | | 3,099,680 | |
| | | | | | | | | |
| Liabilities: | | | | | | | | |
| Payables for: | | | | | | | | |
| Purchases of investments | | | 12,119 | | | | 16,995 | |
| Repurchases of fund’s shares | | | 2,439 | | | | 4,149 | |
| Dividends on fund’s shares | | | 93 | | | | 716 | |
| Investment advisory services | | | 247 | | | | 630 | |
| Services provided by related parties | | | 95 | | | | 819 | |
| Trustees’ deferred compensation | | | 32 | | | | 134 | |
| Other | | | 8 | | | | 11 | |
| | | | 15,033 | | | | 23,454 | |
| Net assets at July 31, 2014 | | $ | 797,274 | | | $ | 3,076,226 | |
| | | | | | | | | |
| Net assets consist of: | | | | | | | | |
| Capital paid in on shares of beneficial interest | | $ | 787,344 | | | $ | 2,923,933 | |
| (Distributions in excess of) undistributed net investment income | | | (30 | ) | | | 323 | |
| Accumulated net realized loss | | | (397 | ) | | | (744 | ) |
| Net unrealized appreciation | | | 10,357 | | | | 152,714 | |
| Net assets at July 31, 2014 | | $ | 797,274 | | | $ | 3,076,226 | |
| Investment securities, at cost | | $ | 792,687 | | | $ | 2,912,967 | |
| | | | | | | | | |
| Shares of beneficial interest issued and outstanding (no stated par value) — unlimited shares authorized | | | | | | | | |
| Class A | | | | | | | | |
| Net assets | | $ | 736,824 | | | $ | 2,615,153 | |
| Shares outstanding | | | 71,891 | | | | 162,454 | |
| Net asset value per share | | $ | 10.25 | | | $ | 16.10 | |
| Class B | | | | | | | | |
| Net assets | | | | | | $ | 1,943 | |
| Shares outstanding | | | | | | | 121 | |
| Net asset value per share | | | | | | $ | 16.10 | |
| Class C | | | | | | | | |
| Net assets | | | | | | $ | 37,950 | |
| Shares outstanding | | | | | | | 2,358 | |
| Net asset value per share | | | | | | $ | 16.10 | |
| Class F-1 | | | | | | | | |
| Net assets | | $ | 13,973 | | | $ | 105,156 | |
| Shares outstanding | | | 1,363 | | | | 6,532 | |
| Net asset value per share | | $ | 10.25 | | | $ | 16.10 | |
| Class F-2 | | | | | | | | |
| Net assets | | $ | 46,477 | | | $ | 183,068 | |
| Shares outstanding | | | 4,535 | | | | 11,372 | |
| Net asset value per share | | $ | 10.25 | | | $ | 16.10 | |
| Class R-6 | | | | | | | | |
| Net assets | | | | | | $ | 132,956 | |
| Shares outstanding | | | | | | | 8,259 | |
| Net asset value per share | | | | | | $ | 16.10 | |
| * | Amount less than one thousand. |
See Notes to Financial Statements
| 50 | American Funds Tax-Exempt Funds |
(dollars and shares in thousands, except per-share amounts)
The Tax-Exempt
Bond Fund
of America | | | American
High-Income
Municipal Bond Fund | | | The Tax-Exempt
Fund of California | | | American Funds
Tax-Exempt Fund
of New York | |
| | | | | | | | | | | | | | | |
| $ | 9,264,150 | | | $ | 3,008,610 | | | $ | 1,507,465 | | | $ | 129,066 | |
| | 748 | | | | 128 | | | | 88 | | | | 51 | |
| | | | | | | | | | | | | | | |
| | 16,030 | | | | 8,869 | | | | 2,427 | | | | 158 | |
| | 94,173 | | | | 34,422 | | | | 18,451 | | | | 1,089 | |
| | 9,375,101 | | | | 3,052,029 | | | | 1,528,431 | | | | 130,364 | |
| | | | | | | | | | | | | | | |
| | 26,621 | | | | 11,580 | | | | 7,357 | | | | 2,598 | |
| | 15,142 | | | | 5,099 | | | | 1,666 | | | | 815 | |
| | 2,541 | | | | 946 | | | | 729 | | | | 116 | |
| | 1,916 | | | | 820 | | | | 407 | | | | 38 | |
| | 2,823 | | | | 840 | | | | 459 | | | | 25 | |
| | 274 | | | | 106 | | | | 133 | | | | — | * |
| | 9 | | | | 8 | | | | 8 | | | | 7 | |
| | 49,326 | | | | 19,399 | | | | 10,759 | | | | 3,599 | |
| $ | 9,325,775 | | | $ | 3,032,630 | | | $ | 1,517,672 | | | $ | 126,765 | |
| | | | | | | | | | | | | | | |
| $ | 8,832,788 | | | $ | 3,026,331 | | | $ | 1,468,587 | | | $ | 121,298 | |
| | 6,073 | | | | 2,680 | | | | 925 | | | | 36 | |
| | (25,082 | ) | | | (118,717 | ) | | | (34,920 | ) | | | (631 | ) |
| | 511,996 | | | | 122,336 | | | | 83,080 | | | | 6,062 | |
| $ | 9,325,775 | | | $ | 3,032,630 | | | $ | 1,517,672 | | | $ | 126,765 | |
| $ | 8,752,154 | | | $ | 2,886,274 | | | $ | 1,424,385 | | | $ | 123,004 | |
| | | | | | | | | | | | | | | |
| $ | 6,771,633 | | | $ | 2,357,300 | | | $ | 1,265,017 | | | $ | 101,874 | |
| | 524,281 | | | | 154,863 | | | | 72,211 | | | | 9,628 | |
| $ | 12.92 | | | $ | 15.22 | | | $ | 17.52 | | | $ | 10.58 | |
| | | | | | | | | | | | | | | |
| $ | 12,583 | | | $ | 6,072 | | | $ | 2,263 | | | $ | 51 | |
| | 974 | | | | 399 | | | | 129 | | | | 5 | |
| $ | 12.92 | | | $ | 15.22 | | | $ | 17.52 | | | $ | 10.58 | |
| | | | | | | | | | | | | | | |
| $ | 324,944 | | | $ | 160,323 | | | $ | 75,612 | | | $ | 7,809 | |
| | 25,158 | | | | 10,532 | | | | 4,316 | | | | 738 | |
| $ | 12.92 | | | $ | 15.22 | | | $ | 17.52 | | | $ | 10.58 | |
| | | | | | | | | | | | | | | |
| $ | 1,389,508 | | | $ | 177,912 | | | $ | 64,695 | | | $ | 1,072 | |
| | 107,580 | | | | 11,688 | | | | 3,693 | | | | 101 | |
| $ | 12.92 | | | $ | 15.22 | | | $ | 17.52 | | | $ | 10.58 | |
| | | | | | | | | | | | | | | |
| $ | 662,219 | | | $ | 223,050 | | | $ | 110,085 | | | $ | 15,959 | |
| | 51,271 | | | | 14,653 | | | | 6,284 | | | | 1,508 | |
| $ | 12.92 | | | $ | 15.22 | | | $ | 17.52 | | | $ | 10.58 | |
| | | | | | | | | | | | | | | |
| $ | 164,888 | | | $ | 107,973 | | | | | | | | | |
| | 12,766 | | | | 7,093 | | | | | | | | | |
| $ | 12.92 | | | $ | 15.22 | | | | | | | | | |
| American Funds Tax-Exempt Funds | 51 |
Statements of operations
for the year ended July 31, 2014
| | | American Funds
Short-Term
Tax-Exempt Bond Fund | | | Limited Term
Tax-Exempt Bond
Fund of America | |
| | | | | | | |
| Investment income: | | | | | | | | |
| Income: | | | | | | | | |
| Interest | | $ | 12,839 | | | $ | 94,085 | |
| | | | | | | | | |
| Fees and expenses*: | | | | | | | | |
| Investment advisory services | | | 2,903 | | | | 7,459 | |
| Distribution services | | | 1,161 | | | | 8,489 | |
| Transfer agent services | | | 262 | | | | 1,060 | |
| Administrative services | | | 105 | | | | 479 | |
| Reports to shareholders | | | 31 | | | | 96 | |
| Registration statement and prospectus | | | 96 | | | | 171 | |
| Trustees’ compensation | | | 10 | | | | 45 | |
| Auditing and legal | | | 50 | | | | 63 | |
| Custodian | | | 2 | | | | 7 | |
| Federal and state income taxes | | | — | | | | — | |
| Other state and local taxes | | | — | | | | — | † |
| Other | | | 10 | | | | 31 | |
| Total fees and expenses before reimbursement | | | 4,630 | | | | 17,900 | |
| Less reimbursement of fees and expenses | | | — | | | | — | |
| Total fees and expenses after reimbursement | | | 4,630 | | | | 17,900 | |
| Net investment income | | | 8,209 | | | | 76,185 | |
| | | | | | | | | |
| Net realized (loss) gain and unrealized appreciation on investments | | | | | | | | |
| Net realized (loss) gain on investments | | | (57 | ) | | | (37 | ) |
| Net unrealized appreciation on investments | | | 2,982 | | | | 28,487 | |
| Net realized (loss) gain and unrealized appreciation on investments | | | 2,925 | | | | 28,450 | |
| | | | | | | | | |
| Net increase in net assets resulting from operations | | $ | 11,134 | | | $ | 104,635 | |
| * | Additional information related to class-specific fees and expenses is included in the Notes to Financial Statements. |
| † | Amount less than one thousand. |
See Notes to Financial Statements
| 52 | American Funds Tax-Exempt Funds |
(dollars in thousands)
The Tax-Exempt
Bond Fund
of America | | | American
High-Income
Municipal Bond Fund | | | The Tax-Exempt
Fund of
California | | | American Funds
Tax-Exempt Fund
of New York | |
| | | | | | | | | | | |
| $ | 375,746 | | | $ | 145,830 | | | $ | 63,843 | | | $ | 4,521 | |
| | | | | | | | | | | | | | | |
| | 22,494 | | | | 9,178 | | | | 4,787 | | | | 446 | |
| | 23,920 | | | | 7,404 | | | | 4,032 | | | | 236 | |
| | 4,540 | | | | 1,620 | | | | 480 | | | | 53 | |
| | 1,883 | | | | 503 | | | | 241 | | | | 22 | |
| | 324 | | | | 151 | | | | 43 | | | | 20 | |
| | 257 | | | | 159 | | | | 85 | | | | 82 | |
| | 116 | | | | 39 | | | | 34 | | | | 1 | |
| | 111 | | | | 67 | | | | 105 | | | | 69 | |
| | 21 | | | | 7 | | | | 3 | | | | — | † |
| | 608 | | | | 742 | | | | 54 | | | | — | |
| | 8 | | | | — | | | | — | † | | | — | |
| | 63 | | | | 26 | | | | 26 | | | | 15 | |
| | 54,345 | | | | 19,896 | | | | 9,890 | | | | 944 | |
| | — | | | | — | | | | — | | | | 114 | |
| | 54,345 | | | | 19,896 | | | | 9,890 | | | | 830 | |
| | 321,401 | | | | 125,934 | | | | 53,953 | | | | 3,691 | |
| | | | | | | | | | | | | | | |
| | 25,638 | | | | 4,737 | | | | 4,720 | | | | (544 | ) |
| | 302,705 | | | | 131,013 | | | | 62,704 | | | | 4,902 | |
| | 328,343 | | | | 135,750 | | | | 67,424 | | | | 4,358 | |
| $ | 649,744 | | | $ | 261,684 | | | $ | 121,377 | | | $ | 8,049 | |
| American Funds Tax-Exempt Funds | 53 |
Statements of changes in net assets
| | | American Funds
Short-Term Tax-Exempt | | | Limited Term
Tax-Exempt Bond | | | The Tax-Exempt Bond Fund of America | |
| | | Bond Fund | | | Fund of America | | | Year ended | | | 11 months | | | Year ended | |
| | | Year ended July 31, | | | Year ended July 31, | | | July 31, | | | ended July 31, | | | August 31, | |
| | | 2014 | | | 2013 | | | 2014 | | | 2013 | | | 2014 | | | 2013* | | | 2012 | |
| Operations: | | | | | | | | | | | | | | | | | | | | | | | | | | | | |
| Net investment income | | $ | 8,209 | | | $ | 8,529 | | | $ | 76,185 | | | $ | 77,334 | | | $ | 321,401 | | | $ | 304,084 | | | $ | 331,210 | |
| Net realized (loss) gain on investments | | | (57 | ) | | | (257 | ) | | | (37 | ) | | | (316 | ) | | | 25,638 | | | | 53,350 | | | | (1,791 | ) |
| Net unrealized appreciation (depreciation) on investments | | | 2,982 | | | | (7,365 | ) | | | 28,487 | | | | (84,021 | ) | | | 302,705 | | | | (559,829 | ) | | | 583,007 | |
| Net increase (decrease) in net assets resulting from operations |
|
|
11,134 |
|
|
|
907 |
|
|
|
104,635 |
|
|
|
(7,003 |
) |
|
|
649,744 |
|
|
|
(202,395 |
) |
|
|
912,426 |
|
| | | | | | | | | | | | | | | | | | | | | | | | | | | | | |
| Dividends and distributions paid or accrued to shareholders: | | | | | | | | | | | | | | | | | | | | | | | | | | | | |
| Dividends from net investment income | | | (8,160 | ) | | | (8,537 | ) | | | (76,058 | ) | | | (77,251 | ) | | | (319,217 | ) | | | (303,706 | ) | | | (330,173 | ) |
| Distributions from net realized gain on investments | | | — | | | | (134 | ) | | | — | | | | (579 | ) | | | — | | | | — | | | | — | |
| Total dividends and distributions paid or accrued to shareholders | | | (8,160 | ) | | | (8,671 | ) | | | (76,058 | ) | | | (77,830 | ) | | | (319,217 | ) | | | (303,706 | ) | | | (330,173 | ) |
| | | | | | | | | | | | | | | | | | | | | | | | | | | | | |
| Net capital share transactions | | | 26,291 | | | | 137,112 | | | | (31,816 | ) | | | 197,263 | | | | (484,830 | ) | | | 283,770 | | | | 600,697 | |
| | | | | | | | | | | | | | | | | | | | | | | | | | | | | |
| Total increase (decrease) in net assets | | | 29,265 | | | | 129,348 | | | | (3,239 | ) | | | 112,430 | | | | (154,303 | ) | | | (222,331 | ) | | | 1,182,950 | |
| | | | | | | | | | | | | | | | | | | | | | | | | | | | | |
| Net assets: | | | | | | | | | | | | | | | | | | | | | | | | | | | | |
| Beginning of period | | | 768,009 | | | | 638,661 | | | | 3,079,465 | | | | 2,967,035 | | | | 9,480,078 | | | | 9,702,409 | | | | 8,519,459 | |
| End of period | | $ | 797,274 | | | $ | 768,009 | | | $ | 3,076,226 | | | $ | 3,079,465 | | | $ | 9,325,775 | | | $ | 9,480,078 | | | $ | 9,702,409 | |
| (Distribution in excess of) undistributed net investment income | | $ | (30 | ) | | $ | (77 | ) | | $ | 323 | | | $ | 249 | | | $ | 6,073 | | | $ | 4,757 | | | $ | 5,428 | |
| * | In 2013, the fund changed its fiscal year-end from August to July. |
See Notes to Financial Statements
| 54 | American Funds Tax-Exempt Funds |
(dollars in thousands)
| American | | | | | | | | | | | | American Funds | |
| High-Income | | | The Tax-Exempt Fund of California | | | Tax-Exempt Fund | |
| Municipal Bond Fund | | | Year ended | | | 11 months | | | Year ended | | | of New York | |
| Year ended July 31, | | | July 31, | | | ended July 31, | | | August 31, | | | Year ended July 31, | |
| 2014 | | | 2013 | | | 2014 | | | 2013* | | | 2012 | | | 2014 | | | 2013 | |
| | | | | | | | | | | | | | | | | | | | |
| $ | 125,934 | | | $ | 122,093 | | | $ | 53,953 | | | $ | 53,151 | | | $ | 57,947 | | | $ | 3,691 | | | $ | 3,748 | |
| | 4,737 | | | | 36,678 | | | | 4,720 | | | | 6,856 | | | | 2,731 | | | | (544 | ) | | | 173 | |
| | 131,013 | | | | (172,207 | ) | | | 62,704 | | | | (83,071 | ) | | | 105,471 | | | | 4,902 | | | | (8,186 | ) |
| | 261,684 | | | | (13,436 | ) | | | 121,377 | | | | (23,064 | ) | | | 166,149 | | | | 8,049 | | | | (4,265 | ) |
| | | | | | | | | | | | | | | | | | | | | | | | | | | |
| | | | | | | | | | | | | | | | | | | | | | | | | | | |
| | (124,778 | ) | | | (121,785 | ) | | | (53,648 | ) | | | (52,987 | ) | | | (57,712 | ) | | | (3,671 | ) | | | (3,737 | ) |
| | — | | | | — | | | | — | | | | — | | | | — | | | | — | | | | — | |
| | (124,778 | ) | | | (121,785 | ) | | | (53,648 | ) | | | (52,987 | ) | | | (57,712 | ) | | | (3,671 | ) | | | (3,737 | ) |
| | | | | | | | | | | | | | | | | | | | | | | | | | | |
| | 122,647 | | | | 145,477 | | | | (54,918 | ) | | | (15,232 | ) | | | 48,701 | | | | (1,111 | ) | | | 2,834 | |
| | | | | | | | | | | | | | | | | | | | | | | | | | | |
| | 259,553 | | | | 10,256 | | | | 12,811 | | | | (91,283 | ) | | | 157,138 | | | | 3,267 | | | | (5,168 | ) |
| | | | | | | | | | | | | | | | | | | | | | | | | | | |
| | 2,773,077 | | | | 2,762,821 | | | | 1,504,861 | | | | 1,596,144 | | | | 1,439,006 | | | | 123,498 | | | | 128,666 | |
| $ | 3,032,630 | | | $ | 2,773,077 | | | $ | 1,517,672 | | | $ | 1,504,861 | | | $ | 1,596,144 | | | $ | 126,765 | | | $ | 123,498 | |
| $ | 2,680 | | | $ | 1,564 | | | $ | 925 | | | $ | 728 | | | $ | 729 | | | $ | 36 | | | $ | 25 | |
| American Funds Tax-Exempt Funds | 55 |
Notes to financial statements
1. Organization
American Funds Short-Term Tax-Exempt Bond Fund, Limited Term Tax-Exempt Bond Fund of America, The Tax-Exempt Bond Fund of America, American High-Income Municipal Bond Fund, The Tax-Exempt Fund of California, which is presently the only series of The American Funds Tax-Exempt Series II, and American Funds Tax-Exempt Fund of New York (each a “fund” or collectively, the “funds”), are registered under the Investment Company Act of 1940 as open-end, diversified management investment companies.
Each fund’s investment objectives and the principal strategies each fund uses to achieve these objectives are as follows:
American Funds Short-Term Tax-Exempt Bond Fund — Seeks to provide current income exempt from regular federal income tax, consistent with the maturity and quality standards described in the prospectus, and to preserve capital.
Limited Term Tax-Exempt Bond Fund of America — Seeks to provide current income exempt from regular federal income tax, consistent with the maturity and quality standards described in the prospectus, and to preserve capital.
The Tax-Exempt Bond Fund of America — Seeks to provide a high level of current income exempt from federal income tax, consistent with the preservation of capital.
American High-Income Municipal Bond Fund — Seeks to provide a high level of current income exempt from regular federal income tax.
The Tax-Exempt Fund of California — Seeks a high level of current income exempt from regular federal and California state income taxes, with a secondary objective of preservation of capital.
American Funds Tax-Exempt Fund of New York — Seeks to provide a high level of current income exempt from regular federal, New York state and New York City income taxes, with a secondary objective of preservation of capital.
American Funds Short-Term Tax-Exempt Bond Fund has three share classes (Class A, as well as two F share classes, F-1 and F-2). Limited Term Tax-Exempt Bond Fund of America, The Tax-Exempt Bond Fund of America and American High-Income Municipal Bond Fund each have six share classes consisting of five retail share classes (Classes A, B and C, as well as two F share classes, F-1 and F-2) and one share class that is only available to the American Funds Portfolio Series (Class R-6). The Tax-Exempt Fund of California and American Funds Tax-Exempt Fund of New York each have five retail share classes (Classes A, B and C, as well as two F share classes, F-1 and F-2). Some share classes are only available to limited categories of investors. The funds’ share classes are described further in the following table:
| Share class | | Initial sales charge | | Contingent deferred sales
charge upon redemption | | Conversion feature | |
| Class A | | Up to 2.50% for American Funds Short-Term Tax-Exempt Bond Fund and Limited Term Tax-Exempt Bond Fund of America; up to 3.75% for all other funds | | None (except 1% for certain redemptions within one year of purchase without an initial sales charge) | | None | |
| Class B* | | None | | Declines from 5% to 0% for redemptions within six years of purchase | | Class B converts to Class A after eight years | |
| Class C† | | None | | 1% for redemptions within one year of purchase | | Class C converts to Class F-1 after 10 years | |
| Classes F-1 and F-2 | | None | | None | | None | |
| Class R-6 | | None | | None | | None | |
| * | Class B shares are not available for purchase in Limited Term Tax-Exempt Bond Fund of America, The Tax-Exempt Bond Fund of America, American High-Income Municipal Bond Fund, The Tax-Exempt Fund of California and American Funds Tax-Exempt Fund of New York. |
| † | Class C shares are not available for purchase in Limited Term Tax-Exempt Bond Fund of America. |
Holders of all share classes of each fund have equal pro rata rights to the assets, dividends and liquidation proceeds of each fund held. Each share class of each fund has identical voting rights, except for the exclusive right to vote on matters affecting only its class. Share classes have different fees and expenses (“class-specific fees and expenses”), primarily due to different arrangements for distribution, transfer agent and administrative services. Differences in class-specific fees and expenses will result in differences in net investment income and, therefore, the payment of different per-share dividends by each share class of each fund.
| 56 | American Funds Tax-Exempt Funds |
2. Significant accounting policies
Each fund is an investment company that applies the accounting and reporting guidance issued in Topic 946 by the U.S. Financial Accounting Standards Board. Each fund’s financial statements have been prepared to comply with U.S. generally accepted accounting principles (“U.S. GAAP”). These principles require the funds’ investment adviser to make estimates and assumptions that affect reported amounts and disclosures. Actual results could differ from those estimates. The funds follow the significant accounting policies described in this section, as well as the valuation policies described in the next section on valuation.
Security transactions and related investment income — Security transactions are recorded by the funds as of the date the trades are executed with brokers. Realized gains and losses from security transactions are determined based on the specific identified cost of the securities in each fund. In the event a security is purchased with a delayed payment date, each impacted fund will segregate liquid assets sufficient to meet its payment obligations. Interest income is recognized on an accrual basis. Market discounts, premiums and original issue discounts on fixed-income securities are amortized daily over the expected life of the security.
Class allocations — Income, fees and expenses (other than class-specific fees and expenses) are allocated daily among the various share classes of each fund based on the relative value of their settled shares. Realized and unrealized gains and losses are allocated daily among the various share classes of each fund based on their relative net assets. Class-specific fees and expenses, such as distribution, transfer agent and administrative services, are charged directly to the respective share class of each fund.
Dividends and distributions to shareholders — Dividends to shareholders are declared daily after the determination of each fund’s net investment income and are paid to shareholders monthly. Distributions to shareholders are recorded on each fund’s ex-dividend date.
3. Valuation
Capital Research and Management Company (“CRMC”), the funds’ investment adviser, values each fund’s investments at fair value as defined by U.S. GAAP. The net asset value of each share class of each fund is generally determined as of approximately 4:00 p.m. New York time each day the New York Stock Exchange is open.
Methods and inputs — The funds’ investment adviser uses the following methods and inputs to establish the fair value of each fund’s assets and liabilities. Use of particular methods and inputs may vary over time based on availability and relevance as market and economic conditions evolve.
Fixed-income securities, including short-term securities, are generally valued at prices obtained from one or more pricing vendors. Vendors value such securities based on one or more of the following inputs: benchmark yields, transactions, bids, offers, quotations from dealers and trading systems, new issues, spreads and other relationships observed in the markets among comparable securities; and proprietary pricing models such as yield measures calculated using factors such as cash flows, financial or collateral performance and other reference data. For certain distressed securities, valuations may include cash flows or liquidation values using a net present value calculation based on inputs that include, but are not limited to, financial statements and debt contracts.
When the funds’ investment adviser deems it appropriate to do so (such as when vendor prices are unavailable or deemed to be not representative), fixed-income securities will be valued in good faith at the mean quoted bid and ask prices that are reasonably and timely available (or bid prices, if ask prices are not available) or at prices for securities of comparable maturity, quality and type. Some securities may be valued based on their effective maturity or average life, which may be shorter than the stated maturity.
Securities and other assets for which representative market quotations are not readily available or are considered unreliable by the funds’ investment adviser are fair valued as determined in good faith under fair valuation guidelines adopted by authority of each fund’s board of trustees as further described. The investment adviser follows fair valuation guidelines, consistent with U.S. Securities and Exchange Commission rules and guidance, to consider relevant principles and factors when making fair value determinations. The investment adviser considers relevant indications of value that are reasonably and timely available to it in determining the fair value to be assigned to a particular security, such as the type and cost of the security; contractual or legal restrictions on resale of the security; relevant financial or business developments of the issuer; actively traded similar or related securities; conversion or exchange rights on the security; related corporate actions; significant events occurring after the close of trading in the security; and changes in overall market conditions. Fair valuations and valuations of investments that are not actively trading involve judgment and may differ materially from valuations that would have been used had greater market activity occurred.
| American Funds Tax-Exempt Funds | 57 |
Processes and structure — Each fund’s board of trustees has delegated authority to the funds’ investment adviser to make fair value determinations, subject to board oversight. The investment adviser has established a Joint Fair Valuation Committee (the “Fair Valuation Committee”) to administer, implement and oversee the fair valuation process, and to make fair value decisions. The Fair Valuation Committee regularly reviews its own fair value decisions, as well as decisions made under its standing instructions to the investment adviser’s valuation teams. The Fair Valuation Committee reviews changes in fair value measurements from period to period and may, as deemed appropriate, update the fair valuation guidelines to better reflect the results of back testing and address new or evolving issues. The Fair Valuation Committee reports any changes to the fair valuation guidelines to the boards of trustees with supplemental information to support the changes. Each fund’s board and audit committee also regularly review reports that describe fair value determinations and methods.
The funds’ investment adviser has also established a Fixed-Income Pricing Review Group to administer and oversee the fixed-income valuation process, including the use of fixed-income pricing vendors. This group regularly reviews pricing vendor information and market data. Pricing decisions, processes and controls over security valuation are also subject to additional internal reviews, including an annual control self-evaluation program facilitated by the investment adviser’s compliance group.
Classifications — The funds’ investment adviser classifies each fund’s assets and liabilities into three levels based on the inputs used to value the assets or liabilities. Level 1 values are based on quoted prices in active markets for identical securities. Level 2 values are based on significant observable market inputs, such as quoted prices for similar securities and quoted prices in inactive markets. Level 3 values are based on significant unobservable inputs that reflect the investment adviser’s determination of assumptions that market participants might reasonably use in valuing the securities. The valuation levels are not necessarily an indication of the risk or liquidity associated with the underlying investment. For example, U.S. government securities are reflected as Level 2 because the inputs used to determine fair value may not always be quoted prices in an active market. At July 31, 2014, all of the investment securities held by each fund were classified as Level 2.
4. Risk factors
Investing in each fund may involve certain risks including, but not limited to, those described below.
Market conditions — The prices of, and the income generated by, the securities held by the funds may decline — sometimes rapidly or unpredictably — due to various factors, including events or conditions affecting the general economy or particular industries; overall market changes; local, regional or global political, social or economic instability; governmental or governmental agency responses to economic conditions; and currency, interest rate and commodity price fluctuations.
Issuer risks — The values of, and the income generated by, securities held by the funds may also decline in response to various factors directly related to the issuers of such securities, including reduced demand for an issuer’s goods or services, poor management performance and strategic initiatives such as mergers, acquisitions or dispositions and the market response to any such initiative.
Investing in municipal securities — The yield and/or value of the fund’s investments in municipal securities may be adversely affected by events tied to the municipal securities markets, which can be very volatile and significantly impacted by unfavorable legislative or political developments and negative changes in the financial conditions of municipal securities issuers and the economy. To the extent the fund invests in obligations of a municipal issuer, the volatility, credit quality and performance of the fund may be adversely impacted by local political and economic conditions of the issuer. For example, a credit rating downgrade, bond default or bankruptcy involving an issuer within a particular state or territory could affect the market values and marketability of many or all municipal obligations of that state or territory. Income from municipal securities held by the fund could also be declared taxable because of changes in tax laws or interpretations by taxing authorities or as a result of noncompliant conduct of a municipal issuer. Additionally, the relative amount of publicly available information about municipal securities is generally less than that for corporate securities.
Investing in debt instruments — The prices of, and the income generated by, bonds and other debt securities held by the funds may be affected by changing interest rates and by changes in the effective maturities and credit ratings of these securities.
Rising interest rates will generally cause the prices of bonds and other debt securities to fall. Falling interest rates may cause an issuer to redeem, call or refinance a debt security before its stated maturity, which may result in a fund having to reinvest the proceeds in lower yielding securities. Longer maturity debt securities generally have higher rates of interest and may be subject to greater price fluctuations than shorter maturity debt securities.
| 58 | American Funds Tax-Exempt Funds |
Bonds and other debt securities are also subject to credit risk, which is the possibility that the credit strength of an issuer will weaken and/or an issuer of a debt security will fail to make timely payments of principal or interest and the security will go into default. Lower quality debt securities generally have higher rates of interest and may be subject to greater price fluctuations than higher quality debt securities. Credit risk is gauged, in part, by the credit ratings of the debt securities in which a fund invests. However, ratings are only the opinions of the rating agencies issuing them and are not guarantees as to credit quality or an evaluation of market risk. The funds’ investment adviser relies on its own credit analysts to research issuers and issues in seeking to mitigate various credit and default risks.
Thinly traded securities — There may be little trading in the secondary market for particular bonds or other debt securities, which may make them more difficult to value, acquire or sell.
Credit and liquidity support — Changes in the credit quality of banks and financial institutions providing credit and liquidity support features with respect to securities held by the funds could cause the values of these securities to decline.
Investing in lower rated bonds — Certain funds may invest in lower rated bonds and other lower rated debt securities. Lower rated bonds and other lower rated debt securities generally have higher rates of interest and involve greater risk of default or price declines due to changes in the issuer’s creditworthiness than those of higher quality debt securities. The market prices of these securities may fluctuate more than the prices of higher quality debt securities and may decline significantly in periods of general economic difficulty.
Investing in similar municipal bonds — Investing significantly in municipal obligations of issuers in the same state or backed by revenues of similar types of projects or industries may make the funds more susceptible to certain economic, political or regulatory occurrences. As a result, the potential for fluctuations in the funds’ share prices may increase.
Risks of investing in municipal bonds of issuers within the state of California — Because The Tax-Exempt Fund of California invests primarily in securities of issuers within the state of California, the fund is more susceptible to factors adversely affecting issuers of California securities than a comparable municipal bond mutual fund that does not concentrate its investments in a single state. For example, in the past, California voters have passed amendments to the state’s constitution and other measures that limit the taxing and spending authority of California governmental entities, and future voter initiatives may adversely affect California municipal bonds. More detailed information about the risks of investing in California municipal securities is contained in the fund’s statement of additional information.
Risks of investing in municipal bonds of issuers within the state of New York — Because American Funds Tax-Exempt Fund of New York invests primarily in securities of issuers within the state of New York, the fund is more susceptible to factors adversely affecting issuers of New York securities than a comparable municipal bond mutual fund that does not concentrate its investments in a single state. For example, such factors may include political policy changes, tax base erosion, state constitutional limits on tax increases, budget deficits and other financial or economic difficulties, and changes in the credit ratings assigned to New York’s municipal issuers. New York’s economy and finances may be especially vulnerable to changes in the performance of the financial services sector, which historically has been volatile. More detailed information about the risks of investing in New York municipal securities is contained in the fund’s statement of additional information.
Management — The investment adviser to the funds actively manages the funds’ investments. Consequently, the funds are subject to the risk that the methods and analyses employed by the investment adviser in this process may not produce the desired results. This could cause the funds to lose value or their investment results to lag relevant benchmarks or other funds with similar objectives.
5. Taxation and distributions
Federal income taxation — Each fund complies with the requirements under Subchapter M of the Internal Revenue Code applicable to mutual funds and intends to distribute substantially all of its net income and net capital gains each year. The funds are not subject to income taxes to the extent taxable income and net capital gains are distributed. Generally, income earned by each fund is exempt from federal income taxes; however, each fund may earn taxable income from certain investments.
As of and during the period ended July 31, 2014, none of the funds had a liability for any unrecognized tax benefits. The funds recognize interest and penalties, if any, related to unrecognized tax benefits as income tax expense in their respective statement of operations. During the period, none of the funds incurred any significant interest or penalties.
| American Funds Tax-Exempt Funds | 59 |
The funds are not subject to examination by U.S. federal tax authorities or state tax authorities for tax years before the dates shown in the following table:
| | | U.S. federal | | State |
| Fund | | tax authority | | tax authority |
| American Funds Short-Term Tax-Exempt Bond Fund | | | 2010 | | | | 2009 | |
| Limited Term Tax-Exempt Bond Fund of America | | | 2010 | | | | 2009 | |
| The Tax-Exempt Bond Fund of America | | | 2010 | | | | 2009 | |
| American High-Income Municipal Bond Fund | | | 2010 | | | | 2009 | |
| The Tax-Exempt Fund of California | | | 2010 | | | | 2009 | |
| American Funds Tax-Exempt Fund of New York | | | 2010 | * | | | 2010 | * |
| * | The year the fund commenced operations. |
Distributions — Distributions paid to shareholders are based on each fund’s net investment income and net realized gains determined on a tax basis, which may differ from net investment income and net realized gains for financial reporting purposes. These differences are due primarily to different treatment for items such as short-term capital gains and losses; capital losses related to sales of certain securities within 30 days of purchase; deferred expenses; cost of investments sold; net capital losses; amortization of discounts; and income on certain investments. The fiscal year in which amounts are distributed may differ from the year in which the net investment income and net realized gains are recorded by the funds for financial reporting purposes. Each fund may also designate a portion of the amount paid to redeeming shareholders as a distribution for tax purposes.
As indicated in the following tables, all of the funds had capital loss carryforwards available at July 31, 2014. These will be used to offset any capital gains realized by these funds in future years through the expiration dates. Funds with a capital loss carryforward will not make distributions from capital gains while a capital loss carryforward remains.
Under the Regulated Investment Company Modernization Act of 2010 (the “Act”), net capital losses recognized after July 31, 2011, (August 31, 2011, for The Tax-Exempt Bond Fund of America and The Tax-Exempt Fund of California) may be carried forward indefinitely, and their character is retained as short-term and/or long-term losses. Previously, net capital losses were carried forward for eight years and treated as short-term losses. As a transition rule, the Act requires that post-enactment net capital losses be used before pre-enactment net capital losses.
Additional tax basis disclosures for each fund are as follows (dollars in thousands):
| | | American | | | | | | | | | | | | | | | American | |
| | | Funds | | | Limited Term | | | The | | | American | | | The | | | Funds | |
| | | Short-Term | | | Tax-Exempt | | | Tax-Exempt | | | High-Income | | | Tax-Exempt | | | Tax-Exempt | |
| | | Tax-Exempt | | | Bond Fund | | | Bond Fund | | | Municipal | | | Fund of | | | Fund of | |
| | | Bond Fund | | | of America | | | of America | | | Bond Fund | | | California | | | New York | |
| As of July 31, 2014: | | | | | | | | | | | | | | | | | | | | | | | | |
| Undistributed tax-exempt income | | $ | 93 | | | $ | 716 | | | $ | 2,547 | | | $ | 1,288 | | | $ | 736 | | | $ | 117 | |
| Post-October capital loss deferral* | | | — | | | | — | | | | (6,530 | ) | | | — | | | | (703 | ) | | | — | |
| Capital loss carryforward: | | | | | | | | | | | | | | | | | | | | | | | | |
| No expiration | | | (397 | ) | | | (744 | ) | | | — | | | | (6,756 | ) | | | — | | | | (628 | ) |
| Expiring 2017 | | | — | | | | — | | | | — | | | | (14,384 | ) | | | (3,872 | ) | | | — | |
| Expiring 2018 | | | — | | | | — | | | | (17,090 | ) | | | (69,969 | ) | | | (30,345 | ) | | | — | |
| Expiring 2019 | | | — | | | | — | | | | — | | | | (24,408 | ) | | | — | | | | — | |
| | | $ | (397 | ) | | $ | (744 | ) | | $ | (17,090 | ) | | $ | (115,517 | ) | | $ | (34,217 | ) | | $ | (628 | ) |
| Capital loss carryforwards utilized | | $ | — | | | $ | — | | | $ | 31,127 | | | $ | 5,927 | | | $ | 5,444 | | | $ | — | |
| Reclassification (from) to distributions in excess of/undistributed net investment income (to) from accumulated net realized loss | | $ | (1 | ) | | $ | (34 | ) | | $ | (881 | ) | | $ | 126 | | | $ | (21 | ) | | $ | (3 | ) |
| Reclassification (from) to distributions in excess of/undistributed net investment income (to) from capital paid in on shares of beneficial interest | | | (1 | ) | | | (19 | ) | | | 13 | | | | (166 | ) | | | (87 | ) | | | (6 | ) |
| Gross unrealized appreciation on investment securities | | $ | 10,759 | | | $ | 154,740 | | | $ | 573,613 | | | $ | 179,571 | | | $ | 97,090 | | | $ | 6,487 | |
| Gross unrealized depreciation on investment securities | | | (399 | ) | | | (1,569 | ) | | | (55,616 | ) | | | (54,234 | ) | | | (12,958 | ) | | | (393 | ) |
| Net unrealized appreciation on investment securities | | $ | 10,360 | | | $ | 153,171 | | | $ | 517,997 | | | $ | 125,337 | | | $ | 84,132 | | | $ | 6,094 | |
| Cost of investment securities | | $ | 792,684 | | | $ | 2,912,510 | | | $ | 8,746,153 | | | $ | 2,883,273 | | | $ | 1,423,333 | | | $ | 122,972 | |
| * | This deferral is considered incurred in the subsequent year. |
| 60 | American Funds Tax-Exempt Funds |
The tax character of distributions paid or accrued to shareholders of each fund was as follows (dollars in thousands):
American Funds Short-Term Tax-Exempt Bond Fund
| | | | Year ended July 31, 2014 | | | Year ended July 31, 2013 | |
| | | | Distributions | | | Distributions | | | Total | | | Distributions | | | Distributions | | | Total | |
| | | | from tax-exempt | | | from long-term | | | distributions | | | from tax-exempt | | | from long-term | | | distributions | |
| | Share class | | income | | | capital gains | | | paid or accrued | | | income | | | capital gains | | | paid or accrued | |
| | Class A | | $ | 7,558 | | | $ | — | | | $ | 7,558 | | | $ | 7,907 | | | $ | 123 | | | $ | 8,030 | |
| | Class F-1 | | | 198 | | | | — | | | | 198 | | | | 208 | | | | 4 | | | | 212 | |
| | Class F-2 | | | 404 | | | | — | | | | 404 | | | | 422 | | | | 7 | | | | 429 | |
| | Total | | $ | 8,160 | | | $ | — | | | $ | 8,160 | | | $ | 8,537 | | | $ | 134 | | | $ | 8,671 | |
Limited Term Tax-Exempt Bond Fund of America
| | | | Year ended July 31, 2014 | | | Year ended July 31, 2013 | |
| | | | Distributions | | | Distributions | | | Total | | | Distributions | | | Distributions | | | Total | |
| | | | from tax-exempt | | | from long-term | | | distributions | | | from tax-exempt | | | from long-term | | | distributions | |
| | Share class | | income | | | capital gains | | | paid or accrued | | | income | | | capital gains | | | paid or accrued | |
| | Class A | | $ | 64,709 | | | $ | — | | | $ | 64,709 | | | $ | 65,825 | | | $ | 492 | | | $ | 66,317 | |
| | Class B | | | 46 | | | | — | | | | 46 | | | | 79 | | | | 1 | | | | 80 | |
| | Class C | | | 767 | | | | — | | | | 767 | | | | 1,081 | | | | 12 | | | | 1,093 | |
| | Class F-1 | | | 2,895 | | | | — | | | | 2,895 | | | | 3,150 | | | | 25 | | | | 3,175 | |
| | Class F-2 | | | 4,223 | | | | — | | | | 4,223 | | | | 4,116 | | | | 31 | | | | 4,147 | |
| | Class R-6 | | | 3,418 | | | | — | | | | 3,418 | | | | 3,000 | | | | 18 | | | | 3,018 | |
| | Total | | $ | 76,058 | | | $ | — | | | $ | 76,058 | | | $ | 77,251 | | | $ | 579 | | | $ | 77,830 | |
The Tax-Exempt Bond Fund of America
| | | | Year ended July 31, 2014 | | | Period ended July 31, 2013* | |
| | | | Distributions | | | Distributions | | | Total | | | Distributions | | | Distributions | | | Total | |
| | | | from tax-exempt | | | from long-term | | | distributions | | | from tax-exempt | | | from long-term | | | distributions | |
| | Share class | | income | | | capital gains | | | paid or accrued | | | income | | | capital gains | | | paid or accrued | |
| | Class A | | $ | 235,838 | | | $ | — | | | $ | 235,838 | | | $ | 232,946 | | | $ | — | | | $ | 232,946 | |
| | Class B | | | 437 | | | | — | | | | 437 | | | | 609 | | | | — | | | | 609 | |
| | Class C | | | 9,228 | | | | — | | | | 9,228 | | | | 9,871 | | | | — | | | | 9,871 | |
| | Class F-1 | | | 52,597 | | | | — | | | | 52,597 | | | | 47,608 | | | | — | | | | 47,608 | |
| | Class F-2 | | | 16,175 | | | | — | | | | 16,175 | | | | 9,865 | | | | — | | | | 9,865 | |
| | Class R-6 | | | 4,942 | | | | — | | | | 4,942 | | | | 2,807 | | | | — | | | | 2,807 | |
| | Total | | $ | 319,217 | | | $ | — | | | $ | 319,217 | | | $ | 303,706 | | | $ | — | | | $ | 303,706 | |
| | | | Year ended August 31, 2012 | |
| | | | Distributions | | | Distributions | | | Total | |
| | | | from tax-exempt | | | from long-term | | | distributions | |
| | Share class | | income | | | capital gains | | | paid or accrued | |
| | Class A | | $ | 258,693 | | | $ | — | | | $ | 258,693 | |
| | Class B | | | 1,043 | | | | — | | | | 1,043 | |
| | Class C | | | 11,462 | | | | — | | | | 11,462 | |
| | Class F-1 | | | 50,382 | | | | — | | | | 50,382 | |
| | Class F-2 | | | 8,330 | | | | — | | | | 8,330 | |
| | Class R-6† | | | 263 | | | | — | | | | 263 | |
| | Total | | $ | 330,173 | | | $ | — | | | $ | 330,173 | |
See end of distributions tables for footnotes.
| American Funds Tax-Exempt Funds | 61 |
American High-Income Municipal Bond Fund
| | | | Year ended July 31, 2014 | | | Year ended July 31, 2013 | |
| | | | Distributions | | | Distributions | | | Total | | | Distributions | | | Distributions | | | Total | |
| | | | from tax-exempt | | | from long-term | | | distributions | | | from tax-exempt | | | from long-term | | | distributions | |
| | Share class | | income | | | capital gains | | | paid or accrued | | | income | | | capital gains | | | paid or accrued | |
| | Class A | | $ | 99,609 | | | $ | — | | | $ | 99,609 | | | $ | 100,902 | | | $ | — | | | $ | 100,902 | |
| | Class B | | | 283 | | | | — | | | | 283 | | | | 450 | | | | — | | | | 450 | |
| | Class C | | | 5,699 | | | | — | | | | 5,699 | | | | 6,057 | | | | — | | | | 6,057 | |
| | Class F-1 | | | 7,824 | | | | — | | | | 7,824 | | | | 7,852 | | | | — | | | | 7,852 | |
| | Class F-2 | | | 7,621 | | | | — | | | | 7,621 | | | | 5,011 | | | | — | | | | 5,011 | |
| | Class R-6 | | | 3,742 | | | | — | | | | 3,742 | | | | 1,513 | | | | — | | | | 1,513 | |
| | Total | | $ | 124,778 | | | $ | — | | | $ | 124,778 | | | $ | 121,785 | | | $ | — | | | $ | 121,785 | |
The Tax-Exempt Fund of California
| | | | Year ended July 31, 2014 | | | Period ended July 31, 2013* | |
| | | | Distributions | | | Distributions | | | Total | | | Distributions | | | Distributions | | | Total | |
| | | | from tax-exempt | | | from long-term | | | distributions | | | from tax-exempt | | | from long-term | | | distributions | |
| | Share class | | income | | | capital gains | | | paid or accrued | | | income | | | capital gains | | | paid or accrued | |
| | Class A | | $ | 45,341 | | | $ | — | | | $ | 45,341 | | | $ | 44,754 | | | $ | — | | | $ | 44,754 | |
| | Class B | | | 81 | | | | — | | | | 81 | | | | 113 | | | | — | | | | 113 | |
| | Class C | | | 2,261 | | | | — | | | | 2,261 | | | | 2,534 | | | | — | | | | 2,534 | |
| | Class F-1 | | | 2,450 | | | | — | | | | 2,450 | | | | 2,537 | | | | — | | | | 2,537 | |
| | Class F-2 | | | 3,515 | | | | — | | | | 3,515 | | | | 3,049 | | | | — | | | | 3,049 | |
| | Total | | $ | 53,648 | | | $ | — | | | $ | 53,648 | | | $ | 52,987 | | | $ | — | | | $ | 52,987 | |
| | | | Year ended August 31, 2012 | |
| | | | Distributions | | | Distributions | | | Total | |
| | | | from tax-exempt | | | from long-term | | | distributions | |
| | Share class | | income | | | capital gains | | | paid or accrued | |
| | Class A | | $ | 49,306 | | | $ | — | | | $ | 49,306 | |
| | Class B | | | 185 | | | | — | | | | 185 | |
| | Class C | | | 2,959 | | | | — | | | | 2,959 | |
| | Class F-1 | | | 2,963 | | | | — | | | | 2,963 | |
| | Class F-2 | | | 2,299 | | | | — | | | | 2,299 | |
| | Total | | $ | 57,712 | | | $ | — | | | $ | 57,712 | |
American Funds Tax-Exempt Fund of New York
| | | | Year ended July 31, 2014 | | | Year ended July 31, 2013 | |
| | | | Distributions | | | Distributions | | | Total | | | Distributions | | | Distributions | | | Total | |
| | | | from tax-exempt | | | from long-term | | | distributions | | | from tax-exempt | | | from long-term | | | distributions | |
| | Share class | | income | | | capital gains | | | paid or accrued | | | income | | | capital gains | | | paid or accrued | |
| | Class A | | $ | 3,002 | | | $ | — | | | $ | 3,002 | | | $ | 3,102 | | | $ | — | | | $ | 3,102 | |
| | Class B | | | 2 | | | | — | | | | 2 | | | | 6 | | | | — | | | | 6 | |
| | Class C | | | 163 | | | | — | | | | 163 | | | | 160 | | | | — | | | | 160 | |
| | Class F-1 | | | 34 | | | | — | | | | 34 | | | | 54 | | | | — | | | | 54 | |
| | Class F-2 | | | 470 | | | | — | | | | 470 | | | | 415 | | | | — | | | | 415 | |
| | Total | | $ | 3,671 | | | $ | — | | | $ | 3,671 | | | $ | 3,737 | | | $ | — | | | $ | 3,737 | |
* In 2013, the fund changed its fiscal year-end from August to July.
† Class R-6 shares were offered beginning May 11, 2012.
6. Fees and transactions with related parties
CRMC, the funds’ investment adviser, is the parent company of American Funds Distributors,® Inc. (“AFD”), the principal underwriter of the funds’ shares, and American Funds Service Company® (“AFS”), the funds’ transfer agent. CRMC, AFD and AFS are considered related parties to each fund.
| 62 | American Funds Tax-Exempt Funds |
Investment advisory services — Each fund has an investment advisory and service agreement with CRMC that provides for monthly fees accrued daily. These fees are based on annual rates that generally decrease as average net asset levels increase. The agreements also provide for monthly fees accrued daily based on a series of decreasing rates on each fund’s monthly gross income.
The ranges of rates, net asset levels, gross income levels and annualized rates of average net assets for each fund are as follows:
| | | Rates | | Net asset level
(in billions) | | Rates | | Monthly
gross income | | For
the year |
| Fund | | Beginning
with | | Ending
with | | Up to | | In excess
of | | Beginning
with | | Ending
with | | Up to | | In excess
of | | ended
July 31, 2014 |
| American Funds Short-Term Tax-Exempt Bond Fund | | | .390 | % | | | .290 | % | | $ | .20 | | | $ | 1.2 | | | | None | | | | None | | | | None | | | | None | | | | .365 | % |
| Limited Term Tax-Exempt Bond Fund of America | | | .300 | | | | .150 | | | | .06 | | | | 1.0 | | | | 3.00 | % | | | 2.50 | % | | $ | 3,333,333 | | | $ | 3,333,333 | | | | .247 | |
| The Tax-Exempt Bond Fund of America | | | .300 | | | | .120 | | | | .06 | | | | 10.0 | | | | 3.00 | | | | 2.00 | | | | 3,333,333 | | | | 8,333,333 | | | | .247 | |
| American High-Income Municipal Bond Fund | | | .300 | | | | .150 | | | | .06 | | | | 3.0 | | | | 3.00 | | | | 2.50 | | | | 3,333,333 | | | | 3,333,333 | | | | .332 | |
| The Tax-Exempt Fund of California | | | .300 | | | | .180 | | | | .06 | | | | 1.0 | | | | 3.00 | | | | 2.50 | | | | 3,333,333 | | | | 3,333,333 | | | | .327 | |
| American Funds Tax-Exempt Fund of New York | | | .300 | | | | .180 | | | | .06 | | | | 1.0 | | | | 3.00 | | | | 2.50 | | | | 3,333,333 | | | | 3,333,333 | | | | .365 | |
CRMC has agreed to reimburse a portion of the fees and expenses of American Funds Tax-Exempt Fund of New York during its startup period. This reimbursement may be adjusted or discontinued by CRMC, subject to any restrictions in the fund’s prospectus. For the year ended July 31, 2014, total fees and expenses reimbursed by CRMC were $114,000. Fees and expenses in the statement of operations are presented gross of any reimbursements from CRMC.
Class-specific fees and expenses — Expenses that are specific to individual share classes are accrued directly to the respective share class of each fund. The principal class-specific fees and expenses are further described below:
Distribution services — Each fund has plans of distribution for all share classes, except Class F-2 and Class R-6 shares, if applicable. Under the plans, each fund’s board of trustees approves certain categories of expenses that are used to finance activities primarily intended to sell fund shares and service existing accounts. The plans provide for payments based on an annualized percentage of average daily net assets. In some cases, the boards of trustees have limited the amounts that may be paid to less than the maximum allowed by the plans. All share classes with a plan may use the allotted percentage of average daily net assets to pay service fees, or to compensate AFD for paying service fees, to firms that have entered into agreements with AFD to provide certain shareholder services. The remaining amounts available to be paid under each plan are paid to dealers to compensate them for their sales activities.
| | | American Funds Short-Term
Tax-Exempt Bond Fund | | Limited Term Tax-Exempt
Bond Fund of America | | The Tax-Exempt Bond Fund
of America |
| Share class | | Currently
approved limits | | Plan limits | | Currently
approved limits | | Plan limits | | Currently
approved limits | | Plan limits |
| Class A | | 0.15% | | 0.15% | | | 0.30 | % | | | 0.30 | % | | | 0.25 | % | | | 0.25 | % |
| Class B | | Not applicable | | Not applicable | | | 1.00 | | | | 1.00 | | | | 1.00 | | | | 1.00 | |
| Class C | | Not applicable | | Not applicable | | | 1.00 | | | | 1.00 | | | | 1.00 | | | | 1.00 | |
| Class F-1 | | 0.25 | | 0.50 | | | 0.25 | | | | 0.50 | | | | 0.25 | | | | 0.50 | |
| | | | | | | | | | | | | | | | | | | | | |
| | | American High-Income
Municipal Bond Fund | | The Tax-Exempt Fund
of California | | American Funds Tax-Exempt
Fund of New York |
| Share class | | Currently
approved limits | | Plan limits | | Currently
approved limits | | Plan limits | | Currently
approved limits | | Plan limits |
| Class A | | | 0.30 | % | | | 0.30 | % | | | 0.25 | % | | | 0.25 | % | | | 0.25 | % | | | 0.30 | % |
| Class B | | | 1.00 | | | | 1.00 | | | | 1.00 | | | | 1.00 | | | | 1.00 | | | | 1.00 | |
| Class C | | | 1.00 | | | | 1.00 | | | | 1.00 | | | | 1.00 | | | | 1.00 | | | | 1.00 | |
| Class F-1 | | | 0.25 | | | | 0.50 | | | | 0.25 | | | | 0.50 | | | | 0.25 | | | | 0.50 | |
| American Funds Tax-Exempt Funds | 63 |
For Class A shares, distribution-related expenses include the reimbursement of dealer and wholesaler commissions paid by AFD for certain shares sold without a sales charge. This share class of each fund reimburses AFD for amounts billed within the prior 15 months but only to the extent that the overall annual expense limit is not exceeded. As of July 31, 2014, unreimbursed expenses subject to reimbursement for Class A shares of each fund were as follows (dollars in thousands):
| Fund | | Class A | |
| American Funds Short-Term Tax-Exempt Bond Fund | | $ | 875 | |
| Limited Term Tax-Exempt Bond Fund of America | | | — | |
| The Tax-Exempt Bond Fund of America | | | 2,802 | |
| American High-Income Municipal Bond Fund | | | — | |
| The Tax-Exempt Fund of California | | | 426 | |
| American Funds Tax-Exempt Fund of New York | | | — | |
Transfer agent services — Each fund has a shareholder services agreement with AFS under which each fund compensates AFS for providing transfer agent services to each of the funds’ share classes. These services include recordkeeping, shareholder communications and transaction processing. In addition, each fund reimburses AFS for amounts paid to third parties for performing transfer agent services on behalf of its respective fund shareholders.
Administrative services — Each fund has an administrative services agreement with CRMC under which each fund compensates CRMC for providing administrative services to each of the funds’ Class A, C, F and R shares, if applicable. These services include, but are not limited to, coordinating, monitoring, assisting and overseeing third parties that provide services to each fund’s shareholders. Under the agreements, Class A shares of each fund pay an annual fee of 0.01% and Class C, F and R shares of each fund, if applicable, pay an annual fee of 0.05% of their respective average daily net assets.
For the year ended July 31, 2014, class-specific expenses under the agreements for each fund were as follows (dollars in thousands):
American Funds Short-Term Tax-Exempt Bond Fund
| Share class | | Distribution
services | | Transfer agent
services | | Administrative
services | |
| Class A | | | $1,098 | | | | $192 | | | | $73 | |
| Class F-1 | | | 63 | | | | 31 | | | | 13 | |
| Class F-2 | | | Not applicable | | | | 39 | | | | 19 | |
| Total class-specific expenses | | | $1,161 | | | | $262 | | | | $105 | |
Limited Term Tax-Exempt Bond Fund of America
| Share class | | Distribution
services | | Transfer agent
services | | Administrative
services | |
| Class A | | | $7,738 | | | | $738 | | | | $258 | |
| Class B | | | 25 | | | | 1 | | | | Not applicable | |
| Class C | | | 433 | | | | 13 | | | | 22 | |
| Class F-1 | | | 293 | | | | 134 | | | | 59 | |
| Class F-2 | | | Not applicable | | | | 174 | | | | 79 | |
| Class R-6 | | | Not applicable | | | | — | * | | | 61 | |
| Total class-specific expenses | | | $8,489 | | | | $1,060 | | | | $479 | |
The Tax-Exempt Bond Fund of America
| Share class | | Distribution
services | | | Transfer agent
services | | | Administrative
services | |
| Class A | | | $16,611 | | | | $2,175 | | | | $665 | |
| Class B | | | 155 | | | | 6 | | | | Not applicable | |
| Class C | | | 3,333 | | | | 115 | | | | 167 | |
| Class F-1 | | | 3,821 | | | | 1,788 | | | | 766 | |
| Class F-2 | | | Not applicable | | | | 456 | | | | 220 | |
| Class R-6 | | | Not applicable | | | | — | * | | | 65 | |
| Total class-specific expenses | | | $23,920 | | | | $4,540 | | | | $1,883 | |
| 64 | American Funds Tax-Exempt Funds |
American High-Income Municipal Bond Fund
| Share class | | Distribution
services | | Transfer agent
services | | Administrative
services | |
| Class A | | | $5,373 | | | | $1,151 | | | | $219 | |
| Class B | | | 74 | | | | 4 | | | | Not applicable | |
| Class C | | | 1,517 | | | | 83 | | | | 76 | |
| Class F-1 | | | 440 | | | | 203 | | | | 88 | |
| Class F-2 | | | Not applicable | | | | 179 | | | | 81 | |
| Class R-6 | | | Not applicable | | | | — | * | | | 39 | |
| Total class-specific expenses | | | $7,404 | | | | $1,620 | | | | $503 | |
The Tax-Exempt Fund of California
| Share class | | Distribution
services | | Transfer agent
services | | Administrative
services | |
| Class A | | | $3,061 | | | | $282 | | | | $122 | |
| Class B | | | 27 | | | | 1 | | | | Not applicable | |
| Class C | | | 773 | | | | 19 | | | | 39 | |
| Class F-1 | | | 171 | | | | 75 | | | | 34 | |
| Class F-2 | | | Not applicable | | | | 103 | | | | 46 | |
| Total class-specific expenses | | | $4,032 | | | | $480 | | | | $241 | |
American Funds Tax-Exempt Fund of New York
| Share class | | Distribution
services | | Transfer agent
services | | Administrative
services | |
| Class A | | | $158 | | | | $35 | | | | $10 | |
| Class B | | | 1 | | | | — | * | | | Not applicable | |
| Class C | | | 75 | | | | 3 | | | | 4 | |
| Class F-1 | | | 2 | | | | 1 | | | | 1 | |
| Class F-2 | | | Not applicable | | | | 14 | | | | 7 | |
| Total class-specific expenses | | | $236 | | | | $53 | | | | $22 | |
*Amount less than one thousand.
Trustees’ deferred compensation — Trustees who are unaffiliated with CRMC may elect to defer the cash payment of part or all of their compensation. These deferred amounts, which remain as liabilities of each fund, are treated as if invested in shares of the funds or other American Funds. These amounts represent general, unsecured liabilities of each fund and vary according to the total returns of the selected funds. Trustees’ compensation in the funds’ statement of operations includes the current fees (either paid in cash or deferred) and a net increase in the value of the following deferred amounts (dollars in thousands):
| Fund | | Current fees | | Increase in value of
deferred amounts | | Total trustees’
compensation |
| American Funds Short-Term Tax-Exempt Bond Fund | | $ | 5 | | | $ | 5 | | | $ | 10 | |
| Limited Term Tax-Exempt Bond Fund of America | | | 21 | | | | 24 | | | | 45 | |
| The Tax-Exempt Bond Fund of America | | | 67 | | | | 49 | | | | 116 | |
| American High-Income Municipal Bond Fund | | | 20 | | | | 19 | | | | 39 | |
| The Tax-Exempt Fund of California | | | 11 | | | | 23 | | | | 34 | |
| American Funds Tax-Exempt Fund of New York | | | 1 | | | | — | * | | | 1 | |
*Amount less than one thousand.
Affiliated officers and trustees — Officers and certain trustees of the funds are or may be considered to be affiliated with CRMC, AFD and AFS. No affiliated officers or trustees received any compensation directly from the funds.
| American Funds Tax-Exempt Funds | 65 |
7. Capital share transactions
Capital share transactions in the funds were as follows (dollars and shares in thousands):
American Funds Short-Term Tax-Exempt Bond Fund
| | | | | | Reinvestments of dividends | | | | | | | |
| | | Sales1 | | | and distributions | | | Repurchases1 | | | Net increase (decrease) | |
| Share class | | Amount | | | Shares | | | Amount | | | Shares | | | Amount | | | Shares | | | Amount | | | Shares | |
| | | | | | | | | | | | | | | | | | | | | | | | | | | | | | |
| Year ended July 31, 2014 | | | | | | | | | | | | | | | | | | | | | | | | | | | | | |
| | | | | | | | | | | | | | | | | | | | | | | | | | | | | | |
| Class A | | $ | 266,682 | | | | 26,075 | | | $ | 6,625 | | | | 647 | | | $ | (240,284 | ) | | | (23,484 | ) | | $ | 33,023 | | | | 3,238 | |
| Class F-1 | | | 12,729 | | | | 1,244 | | | | 198 | | | | 19 | | | | (28,743 | ) | | | (2,807 | ) | | | (15,816 | ) | | | (1,544 | ) |
| Class F-2 | | | 47,396 | | | | 4,630 | | | | 342 | | | | 34 | | | | (38,654 | ) | | | (3,781 | ) | | | 9,084 | | | | 883 | |
| Total net increase (decrease) | | $ | 326,807 | | | | 31,949 | | | $ | 7,165 | | | | 700 | | | $ | (307,681 | ) | | | (30,072 | ) | | $ | 26,291 | | | | 2,577 | |
| | | | | | | | | | | | | | | | | | | | | | | | | | | | | | | | | |
| Year ended July 31, 2013 | | | | | | | | | | | | | | | | | | | | | | | | | | | | | |
| Class A | | $ | 332,155 | | | | 32,286 | | | $ | 6,918 | | | | 672 | | | $ | (236,422 | ) | | | (22,971 | ) | | $ | 102,651 | | | | 9,987 | |
| Class F-1 | | | 21,838 | | | | 2,125 | | | | 211 | | | | 20 | | | | (10,150 | ) | | | (986 | ) | | | 11,899 | | | | 1,159 | |
| Class F-2 | | | 45,810 | | | | 4,443 | | | | 324 | | | | 32 | | | | (23,572 | ) | | | (2,288 | ) | | | 22,562 | | | | 2,187 | |
| Total net increase (decrease) | | $ | 399,803 | | | | 38,854 | | | $ | 7,453 | | | | 724 | | | $ | (270,144 | ) | | | (26,245 | ) | | $ | 137,112 | | | | 13,333 | |
Limited Term Tax-Exempt Bond Fund of America
| | | | | | Reinvestments of dividends | | | | | | | |
| | | Sales1 | | | and distributions | | | Repurchases1 | | | Net (decrease) increase | |
| Share class | | Amount | | | Shares | | | Amount | | | Shares | | | Amount | | | Shares | | | Amount | | | Shares | |
| | | | | | | | | | | | | | | | | | | | | | | | | | | | | | |
| Year ended July 31, 2014 | | | | | | | | | | | | | | | | | | | | | | | | | | | | | |
| | | | | | | | | | | | | | | | | | | | | | | | | | | | | | |
| Class A | | $ | 487,274 | | | | 30,443 | | | $ | 59,752 | | | | 3,729 | | | $ | (581,043 | ) | | | (36,342 | ) | | $ | (34,017 | ) | | | (2,170 | ) |
| Class B | | | 349 | | | | 22 | | | | 44 | | | | 3 | | | | (1,603 | ) | | | (100 | ) | | | (1,210 | ) | | | (75 | ) |
| Class C | | | 9,024 | | | | 564 | | | | 733 | | | | 46 | | | | (21,570 | ) | | | (1,348 | ) | | | (11,813 | ) | | | (738 | ) |
| Class F-1 | | | 37,856 | | | | 2,365 | | | | 2,807 | | | | 175 | | | | (59,138 | ) | | | (3,688 | ) | | | (18,475 | ) | | | (1,148 | ) |
| Class F-2 | | | 97,188 | | | | 6,064 | | | | 3,351 | | | | 209 | | | | (67,054 | ) | | | (4,197 | ) | | | 33,485 | | | | 2,076 | |
| Class R-6 | | | 26,715 | | | | 1,665 | | | | 3,419 | | | | 213 | | | | (29,920 | ) | | | (1,877 | ) | | | 214 | | | | 1 | |
| Total net increase (decrease) | | $ | 658,406 | | | | 41,123 | | | $ | 70,106 | | | | 4,375 | | | $ | (760,328 | ) | | | (47,552 | ) | | $ | (31,816 | ) | | | (2,054 | ) |
| | | | | | | | | | | | | | | | | | | | | | | | | | | | | | | | | |
| Year ended July 31, 2013 | | | | | | | | | | | | | | | | | | | | | | | | | | | | | |
| Class A | | $ | 707,744 | | | | 43,319 | | | $ | 61,484 | | | | 3,769 | | | $ | (621,149 | ) | | | (38,195 | ) | | $ | 148,079 | | | | 8,893 | |
| Class B | | | 738 | | | | 45 | | | | 75 | | | | 4 | | | | (3,419 | ) | | | (209 | ) | | | (2,606 | ) | | | (160 | ) |
| Class C | | | 15,073 | | | | 924 | | | | 1,011 | | | | 62 | | | | (40,512 | ) | | | (2,484 | ) | | | (24,428 | ) | | | (1,498 | ) |
| Class F-1 | | | 57,039 | | | | 3,490 | | | | 3,091 | | | | 190 | | | | (66,099 | ) | | | (4,051 | ) | | | (5,969 | ) | | | (371 | ) |
| Class F-2 | | | 67,131 | | | | 4,101 | | | | 3,098 | | | | 190 | | | | (80,177 | ) | | | (4,915 | ) | | | (9,948 | ) | | | (624 | ) |
| Class R-6 | | | 126,421 | | | | 7,718 | | | | 3,016 | | | | 185 | | | | (37,302 | ) | | | (2,299 | ) | | | 92,135 | | | | 5,604 | |
| Total net increase (decrease) | | $ | 974,146 | | | | 59,597 | | | $ | 71,775 | | | | 4,400 | | | $ | (848,658 | ) | | | (52,153 | ) | | $ | 197,263 | | | | 11,844 | |
| 66 | American Funds Tax-Exempt Funds |
The Tax-Exempt Bond Fund of America
| | | Sales1 | | | Reinvestments of dividends | | | Repurchases1 | | | Net (decrease) increase | |
| Share class | | Amount | | | Shares | | | Amount | | | Shares | | | Amount | | | Shares | | | Amount | | | Shares | |
| | | | | | | | | | | | | | | | | | | | | | | | | | | | | | | | | |
| Year ended July 31, 2014 | | | | | | | | | | | | | | | | | | | | | | | | | | | |
| | | | | | | | | | | | | | | | | | | | | | | | | | | | | | | | | |
| Class A | | $ | 675,556 | | | | 53,456 | | | $ | 213,622 | | | | 16,921 | | | $ | (1,341,982 | ) | | | (107,292 | ) | | $ | (452,804 | ) | | | (36,915 | ) |
| Class B | | | 650 | | | | 52 | | | | 418 | | | | 33 | | | | (8,667 | ) | | | (691 | ) | | | (7,599 | ) | | | (606 | ) |
| Class C | | | 39,872 | | | | 3,153 | | | | 8,663 | | | | 687 | | | | (110,759 | ) | | | (8,853 | ) | | | (62,224 | ) | | | (5,013 | ) |
| Class F-1 | | | 527,089 | | | | 41,931 | | | | 51,868 | | | | 4,115 | | | | (905,891 | ) | | | (71,801 | ) | | | (326,934 | ) | | | (25,755 | ) |
| Class F-2 | | | 442,389 | | | | 34,817 | | | | 13,572 | | | | 1,071 | | | | (136,652 | ) | | | (10,912 | ) | | | 319,309 | | | | 24,976 | |
| Class R-6 | | | 55,842 | | | | 4,409 | | | | 4,942 | | | | 391 | | | | (15,362 | ) | | | (1,236 | ) | | | 45,422 | | | | 3,564 | |
| Total net increase (decrease) | | $ | 1,741,398 | | | | 137,818 | | | $ | 293,085 | | | | 23,218 | | | $ | (2,519,313 | ) | | | (200,785 | ) | | $ | (484,830 | ) | | | (39,749 | ) |
| | | | | | | | | | | | | | | | | | | | | | | | | | | | | | | | | |
| Period ended July 31, 20132 | | | | | | | | | | | | | | | | | | | | | | | | | | | |
| Class A | | $ | 1,131,755 | | | | 86,059 | | | $ | 211,228 | | | | 16,170 | | | $ | (1,429,360 | ) | | | (110,055 | ) | | $ | (86,377 | ) | | | (7,826 | ) |
| Class B | | | 1,532 | | | | 117 | | | | 579 | | | | 44 | | | | (11,683 | ) | | | (894 | ) | | | (9,572 | ) | | | (733 | ) |
| Class C | | | 89,902 | | | | 6,840 | | | | 9,169 | | | | 702 | | | | (123,504 | ) | | | (9,497 | ) | | | (24,433 | ) | | | (1,955 | ) |
| Class F-1 | | | 559,486 | | | | 42,780 | | | | 47,063 | | | | 3,606 | | | | (388,334 | ) | | | (29,698 | ) | | | 218,215 | | | | 16,688 | |
| Class F-2 | | | 200,255 | | | | 15,202 | | | | 7,871 | | | | 603 | | | | (101,698 | ) | | | (7,795 | ) | | | 106,428 | | | | 8,010 | |
| Class R-6 | | | 95,101 | | | | 7,236 | | | | 2,806 | | | | 215 | | | | (18,398 | ) | | | (1,417 | ) | | | 79,509 | | | | 6,034 | |
| Total net increase (decrease) | | $ | 2,078,031 | | | | 158,234 | | | $ | 278,716 | | | | 21,340 | | | $ | (2,072,977 | ) | | | (159,356 | ) | | $ | 283,770 | | | | 20,218 | |
| | | | | | | | | | | | | | | | | | | | | | | | | | | | | | | | | |
| Year ended August 31, 2012 | | | | | | | | | | | | | | | | | | | | | | | | | | | |
| Class A | | $ | 1,110,952 | | | | 87,424 | | | $ | 230,874 | | | | 18,149 | | | $ | (903,292 | ) | | | (71,308 | ) | | $ | 438,534 | | | | 34,265 | |
| Class B | | | 3,157 | | | | 248 | | | | 965 | | | | 76 | | | | (16,810 | ) | | | (1,328 | ) | | | (12,688 | ) | | | (1,004 | ) |
| Class C | | | 97,430 | | | | 7,659 | | | | 10,365 | | | | 815 | | | | (82,627 | ) | | | (6,515 | ) | | | 25,168 | | | | 1,959 | |
| Class F-1 | | | 415,779 | | | | 32,717 | | | | 49,821 | | | | 3,915 | | | | (386,444 | ) | | | (30,571 | ) | | | 79,156 | | | | 6,061 | |
| Class F-2 | | | 77,435 | | | | 6,086 | | | | 6,382 | | | | 502 | | | | (54,378 | ) | | | (4,280 | ) | | | 29,439 | | | | 2,308 | |
| Class R-63 | | | 43,416 | | | | 3,346 | | | | 265 | | | | 20 | | | | (2,593 | ) | | | (198 | ) | | | 41,088 | | | | 3,168 | |
| Total net increase (decrease) | | $ | 1,748,169 | | | | 137,480 | | | $ | 298,672 | | | | 23,477 | | | $ | (1,446,144 | ) | | | (114,200 | ) | | $ | 600,697 | | | | 46,757 | |
American High-Income Municipal Bond Fund
| | | Sales1 | | | Reinvestments of dividends | | | Repurchases1 | | | Net increase (decrease) | |
| Share class | | Amount | | | Shares | | | Amount | | | Shares | | | Amount | | | Shares | | | Amount | | | Shares | |
| | | | | | | | | | | | | | | | | | | | | | | | | | | | | | |
| Year ended July 31, 2014 | | | | | | | | | | | | | | | | | | | | | | | | | | | | | |
| | | | | | | | | | | | | | | | | | | | | | | | | | | | | | |
| Class A | | $ | 438,553 | | | | 29,734 | | | $ | 92,218 | | | | 6,274 | | | $ | (526,377 | ) | | | (36,264 | ) | | $ | 4,394 | | | | (256 | ) |
| Class B | | | 548 | | | | 37 | | | | 263 | | | | 18 | | | | (4,620 | ) | | | (318 | ) | | | (3,809 | ) | | | (263 | ) |
| Class C | | | 40,695 | | | | 2,756 | | | | 5,263 | | | | 358 | | | | (53,623 | ) | | | (3,683 | ) | | | (7,665 | ) | | | (569 | ) |
| Class F-1 | | | 80,187 | | | | 5,464 | | | | 7,646 | | | | 520 | | | | (91,186 | ) | | | (6,184 | ) | | | (3,353 | ) | | | (200 | ) |
| Class F-2 | | | 195,919 | | | | 13,224 | | | | 6,484 | | | | 439 | | | | (114,860 | ) | | | (7,734 | ) | | | 87,543 | | | | 5,929 | |
| Class R-6 | | | 43,501 | | | | 2,949 | | | | 3,742 | | | | 253 | | | | (1,706 | ) | | | (119 | ) | | | 45,537 | | | | 3,083 | |
| Total net increase (decrease) | | $ | 799,403 | | | | 54,164 | | | $ | 115,616 | | | | 7,862 | | | $ | (792,372 | ) | | | (54,302 | ) | | $ | 122,647 | | | | 7,724 | |
| | | | | | | | | | | | | | | | | | | | | | | | | | | | | | | | | |
| Year ended July 31, 2013 | | | | | | | | | | | | | | | | | | | | | | | | | | | | | |
| Class A | | $ | 618,787 | | | | 40,219 | | | $ | 92,473 | | | | 6,043 | | | $ | (642,382 | ) | | | (42,211 | ) | | $ | 68,878 | | | | 4,051 | |
| Class B | | | 1,288 | | | | 84 | | | | 418 | | | | 28 | | | | (7,512 | ) | | | (491 | ) | | | (5,806 | ) | | | (379 | ) |
| Class C | | | 52,691 | | | | 3,422 | | | | 5,564 | | | | 364 | | | | (59,620 | ) | | | (3,918 | ) | | | (1,365 | ) | | | (132 | ) |
| Class F-1 | | | 64,636 | | | | 4,209 | | | | 7,685 | | | | 502 | | | | (83,288 | ) | | | (5,444 | ) | | | (10,967 | ) | | | (733 | ) |
| Class F-2 | | | 77,180 | | | | 5,011 | | | | 4,334 | | | | 283 | | | | (34,989 | ) | | | (2,296 | ) | | | 46,525 | | | | 2,998 | |
| Class R-6 | | | 52,876 | | | | 3,445 | | | | 1,513 | | | | 99 | | | | (6,177 | ) | | | (406 | ) | | | 48,212 | | | | 3,138 | |
| Total net increase (decrease) | | $ | 867,458 | | | | 56,390 | | | $ | 111,987 | | | | 7,319 | | | $ | (833,968 | ) | | | (54,766 | ) | | $ | 145,477 | | | | 8,943 | |
See end of capital share transactions tables for footnotes.
| American Funds Tax-Exempt Funds | 67 |
The Tax-Exempt Fund of California
| | | Sales1 | | | Reinvestments of dividends | | | Repurchases1 | | | Net (decrease) increase | |
| Share class | | Amount | | | Shares | | | Amount | | | Shares | | | Amount | | | Shares | | | Amount | | | Shares | |
| | | | | | | | | | | | | | | | | | | | | | | | | | | | | | |
| Year ended July 31, 2014 | | | | | | | | | | | | | | | | | | | | | | | | | | | | | |
| | | | | | | | | | | | | | | | | | | | | | | | | | | | | | |
| Class A | | $ | 135,776 | | | | 7,971 | | | $ | 39,000 | | | | 2,290 | | | $ | (216,325 | ) | | | (12,820 | ) | | $ | (41,549 | ) | | | (2,559 | ) |
| Class B | | | 16 | | | | 1 | | | | 77 | | | | 4 | | | | (1,265 | ) | | | (75 | ) | | | (1,172 | ) | | | (70 | ) |
| Class C | | | 8,353 | | | | 488 | | | | 2,086 | | | | 123 | | | | (24,821 | ) | | | (1,472 | ) | | | (14,382 | ) | | | (861 | ) |
| Class F-1 | | | 13,404 | | | | 790 | | | | 2,324 | | | | 137 | | | | (28,125 | ) | | | (1,657 | ) | | | (12,397 | ) | | | (730 | ) |
| Class F-2 | | | 39,559 | | | | 2,309 | | | | 2,868 | | | | 168 | | | | (27,845 | ) | | | (1,652 | ) | | | 14,582 | | | | 825 | |
| Total net increase (decrease) | | $ | 197,108 | | | | 11,559 | | | $ | 46,355 | | | | 2,722 | | | $ | (298,381 | ) | | | (17,676 | ) | | $ | (54,918 | ) | | | (3,395 | ) |
| | | | | | | | | | | | | | | | | | | | | | | | | | | | | | | | | |
| Period ended July 31, 20132 | | | | | | | | | | | | | | | | | | | | | | | | | | | | | |
| Class A | | $ | 193,455 | | | | 10,951 | | | $ | 38,106 | | | | 2,170 | | | $ | (252,947 | ) | | | (14,437 | ) | | $ | (21,386 | ) | | | (1,316 | ) |
| Class B | | | 152 | | | | 9 | | | | 107 | | | | 6 | | | | (1,770 | ) | | | (100 | ) | | | (1,511 | ) | | | (85 | ) |
| Class C | | | 13,276 | | | | 752 | | | | 2,279 | | | | 130 | | | | (25,286 | ) | | | (1,445 | ) | | | (9,731 | ) | | | (563 | ) |
| Class F-1 | | | 21,002 | | | | 1,190 | | | | 2,406 | | | | 137 | | | | (27,933 | ) | | | (1,583 | ) | | | (4,525 | ) | | | (256 | ) |
| Class F-2 | | | 41,142 | | | | 2,325 | | | | 2,545 | | | | 145 | | | | (21,766 | ) | | | (1,234 | ) | | | 21,921 | | | | 1,236 | |
| Total net increase (decrease) | | $ | 269,027 | | | | 15,227 | | | $ | 45,443 | | | | 2,588 | | | $ | (329,702 | ) | | | (18,799 | ) | | $ | (15,232 | ) | | | (984 | ) |
| | | | | | | | | | | | | | | | | | | | | | | | | | | | | | | | | |
| Year ended August 31, 2012 | | | | | | | | | | | | | | | | | | | | | | | | | | | | | |
| Class A | | $ | 182,575 | | | | 10,756 | | | $ | 41,258 | | | | 2,425 | | | $ | (198,977 | ) | | | (11,739 | ) | | $ | 24,856 | | | | 1,442 | |
| Class B | | | 671 | | | | 40 | | | | 172 | | | | 10 | | | | (3,225 | ) | | | (191 | ) | | | (2,382 | ) | | | (141 | ) |
| Class C | | | 18,778 | | | | 1,108 | | | | 2,526 | | | | 149 | | | | (18,309 | ) | | | (1,080 | ) | | | 2,995 | | | | 177 | |
| Class F-1 | | | 18,220 | | | | 1,071 | | | | 2,836 | | | | 166 | | | | (26,762 | ) | | | (1,588 | ) | | | (5,706 | ) | | | (351 | ) |
| Class F-2 | | | 36,372 | | | | 2,135 | | | | 1,813 | | | | 106 | | | | (9,247 | ) | | | (544 | ) | | | 28,938 | | | | 1,697 | |
| Total net increase (decrease) | | $ | 256,616 | | | | 15,110 | | | $ | 48,605 | | | | 2,856 | | | $ | (256,520 | ) | | | (15,142 | ) | | $ | 48,701 | | | | 2,824 | |
American Funds Tax-Exempt Fund of New York
| | | Sales1 | | | Reinvestments of dividends | | | Repurchases1 | | | Net (decrease) increase | |
| Share class | | Amount | | | Shares | | | Amount | | | Shares | | | Amount | | | Shares | | | Amount | | | Shares | |
| | | | | | | | | | | | | | | | | | | | | | | | | | | | | | | | | |
| Year ended July 31, 2014 | | | | | | | | | | | | | | | | | | | | | | | | | | | | | |
| | | | | | | | | | | | | | | | | | | | | | | | | | | | | | | | | |
| Class A | | $ | 20,842 | | | | 2,022 | | | $ | 1,772 | | | | 172 | | | $ | (24,070 | ) | | | (2,345 | ) | | $ | (1,456 | ) | | | (151 | ) |
| Class B | | | 13 | | | | 2 | | | | 2 | | | | — | 4 | | | (138 | ) | | | (14 | ) | | | (123 | ) | | | (12 | ) |
| Class C | | | 2,012 | | | | 196 | | | | 153 | | | | 15 | | | | (2,385 | ) | | | (233 | ) | | | (220 | ) | | | (22 | ) |
| Class F-1 | | | 263 | | | | 26 | | | | 15 | | | | 1 | | | | (614 | ) | | | (60 | ) | | | (336 | ) | | | (33 | ) |
| Class F-2 | | | 6,340 | | | | 614 | | | | 406 | | | | 39 | | | | (5,722 | ) | | | (554 | ) | | | 1,024 | | | | 99 | |
| Total net increase (decrease) | | $ | 29,470 | | | | 2,860 | | | $ | 2,348 | | | | 227 | | | $ | (32,929 | ) | | | (3,206 | ) | | $ | (1,111 | ) | | | (119 | ) |
| | | | | | | | | | | | | | | | | | | | | | | | | | | | | | | | | |
| Year ended July 31, 2013 | | | | | | | | | | | | | | | | | | | | | | | | | | | | | |
| Class A | | $ | 28,904 | | | | 2,656 | | | $ | 1,752 | | | | 163 | | | $ | (30,561 | ) | | | (2,824 | ) | | $ | 95 | | | | (5 | ) |
| Class B | | | 132 | | | | 12 | | | | 5 | | | | — | 4 | | | (220 | ) | | | (20 | ) | | | (83 | ) | | | (8 | ) |
| Class C | | | 3,039 | | | | 279 | | | | 152 | | | | 13 | | | | (1,779 | ) | | | (166 | ) | | | 1,412 | | | | 126 | |
| Class F-1 | | | 686 | | | | 63 | | | | 38 | | | | 4 | | | | (1,649 | ) | | | (153 | ) | | | (925 | ) | | | (86 | ) |
| Class F-2 | | | 3,639 | | | | 333 | | | | 389 | | | | 36 | | | | (1,693 | ) | | | (157 | ) | | | 2,335 | | | | 212 | |
| Total net increase (decrease) | | $ | 36,400 | | | | 3,343 | | | $ | 2,336 | | | | 216 | | | $ | (35,902 | ) | | | (3,320 | ) | | $ | 2,834 | | | | 239 | |
| 1 | Includes exchanges between share classes of the fund. |
| 2 | In 2013, the fund changed its fiscal year-end from August to July. |
| 3 | Class R-6 shares were offered beginning May 11, 2012. |
| 4 | Amount less than one thousand. |
| 68 | American Funds Tax-Exempt Funds |
8. Investment transactions
Each fund made purchases and sales of investment securities, excluding short-term securities and U.S. government obligations, if any, during the year ended July 31, 2014, as follows (dollars in thousands):
| Fund | | Purchases | | | Sales | |
| American Funds Short-Term Tax-Exempt Bond Fund | | $ | 199,213 | | | $ | 130,298 | |
| Limited Term Tax-Exempt Bond Fund of America | | | 252,553 | | | | 304,784 | |
| The Tax-Exempt Bond Fund of America | | | 828,522 | | | | 1,539,958 | |
| American High-Income Municipal Bond Fund | | | 618,593 | | | | 622,348 | |
| The Tax-Exempt Fund of California | | | 112,919 | | | | 212,426 | |
| American Funds Tax-Exempt Fund of New York | | | 28,192 | | | | 29,338 | |
9. Ownership concentration
At July 31, 2014, CRMC held aggregate ownership of 31% of the outstanding shares of American Funds Tax-Exempt Fund of New York. The ownership represents the seed money invested in the fund when it began operations on November 1, 2010.
| American Funds Tax-Exempt Funds | 69 |
Financial highlights
American Funds Short-Term Tax-Exempt Bond Fund
| | | | | Income (loss) from investment operations1 | | Dividends and distributions | | | | | | | | | | | | | | | | | | | |
| Period ended | | Net asset
value,
beginning
of period | | Net
investment
income | | Net gains
(losses) on
securities
(both
realized and
unrealized) | | | Total from
investment
operations | | | Dividends
(from net
investment
income) | | | Distributions
(from capital
gains) | | | Total
dividends
and
distributions | | | Net asset
value, end
of period | | | Total
return2,3 | | | Net assets,
end of
period
(in millions) | | | Ratio of
expenses to
average net
assets before
reimbursements | | | Ratio of
expenses to
average net
assets after
reimbursements3 | | | Ratio
of net
income to
average
net assets3 | |
| Class A: | | | | | | | | | | | | | | | | | | | | | | | | | | | | | | | | | | | | | | | | | | | | | | | | | | |
| 7/31/2014 | | $ | 10.21 | | $ | .11 | | $ | .04 | | | $ | .15 | | | $ | (.11 | ) | | $ | — | | | $ | (.11 | ) | | $ | 10.25 | | | | 1.43 | % | | $ | 737 | | | | .58 | % | | | .58 | % | | | 1.04 | % |
| 7/31/2013 | | | 10.32 | | | .13 | | | (.11 | ) | | | .02 | | | | (.13 | ) | | | — | 4 | | | (.13 | ) | | | 10.21 | | | | .16 | | | | 701 | | | | .59 | | | | .59 | | | | 1.21 | |
| 7/31/2012 | | | 10.23 | | | .13 | | | .09 | | | | .22 | | | | (.13 | ) | | | — | | | | (.13 | ) | | | 10.32 | | | | 2.17 | | | | 606 | | | | .59 | | | | .59 | | | | 1.27 | |
| 7/31/2011 | | | 10.20 | | | .12 | | | .03 | | | | .15 | | | | (.12 | ) | | | — | | | | (.12 | ) | | | 10.23 | | | | 1.53 | | | | 520 | | | | .60 | | | | .60 | | | | 1.24 | |
| 7/31/2010 | | | 10.00 | | | .10 | | | .20 | | | | .30 | | | | (.10 | ) | | | — | | | | (.10 | ) | | | 10.20 | | | | 3.06 | | | | 412 | | | | .65 | | | | .53 | | | | 1.00 | |
| Class F-1: | | | | | | | | | | | | | | | | | | | | | | | | | | | | | | | | | | | | | | | | | | | | | | | | | | |
| 7/31/2014 | | | 10.21 | | | .08 | | | .04 | | | | .12 | | | | (.08 | ) | | | — | | | | (.08 | ) | | | 10.25 | | | | 1.19 | | | | 14 | | | | .82 | | | | .82 | | | | .80 | |
| 7/31/2013 | | | 10.32 | | | .10 | | | (.11 | ) | | | (.01 | ) | | | (.10 | ) | | | — | 4 | | | (.10 | ) | | | 10.21 | | | | (.08 | ) | | | 30 | | | | .84 | | | | .84 | | | | .96 | |
| 7/31/2012 | | | 10.23 | | | .11 | | | .09 | | | | .20 | | | | (.11 | ) | | | — | | | | (.11 | ) | | | 10.32 | | | | 1.98 | | | | 18 | | | | .78 | | | | .78 | | | | 1.09 | |
| 7/31/2011 | | | 10.20 | | | .11 | | | .03 | | | | .14 | | | | (.11 | ) | | | — | | | | (.11 | ) | | | 10.23 | | | | 1.34 | | | | 14 | | | | .79 | | | | .79 | | | | 1.04 | |
| 7/31/20105,6 | | | 10.00 | | | .10 | | | .19 | | | | .29 | | | | (.09 | ) | | | — | | | | (.09 | ) | | | 10.20 | | | | 2.93 | | | | 5 | | | | .79 | 7 | | | .64 | 7 | | | 1.06 | 7 |
| Class F-2: | | | | | | | | | | | | | | | | | | | | | | | | | | | | | | | | | | | | | | | | | | | | | | | | | | |
| 7/31/2014 | | | 10.21 | | | .11 | | | .04 | | | | .15 | | | | (.11 | ) | | | — | | | | (.11 | ) | | | 10.25 | | | | 1.47 | | | | 46 | | | | .54 | | | | .54 | | | | 1.07 | |
| 7/31/2013 | | | 10.32 | | | .13 | | | (.11 | ) | | | .02 | | | | (.13 | ) | | | — | 4 | | | (.13 | ) | | | 10.21 | | | | .19 | | | | 37 | | | | .56 | | | | .56 | | | | 1.23 | |
| 7/31/2012 | | | 10.23 | | | .14 | | | .09 | | | | .23 | | | | (.14 | ) | | | — | | | | (.14 | ) | | | 10.32 | | | | 2.24 | | | | 15 | | | | .52 | | | | .52 | | | | 1.33 | |
| 7/31/2011 | | | 10.20 | | | .13 | | | .03 | | | | .16 | | | | (.13 | ) | | | — | | | | (.13 | ) | | | 10.23 | | | | 1.58 | | | | 17 | | | | .55 | | | | .55 | | | | 1.28 | |
| 7/31/20105,8 | | | 10.00 | | | .13 | | | .18 | | | | .31 | | | | (.11 | ) | | | — | | | | (.11 | ) | | | 10.20 | | | | 3.16 | | | | 8 | | | | .51 | 7 | | | .45 | 7 | | | 1.39 | 7 |
| | Year ended July 31 |
| | | 2014 | | 2013 | | 2012 | | 2011 | | 2010 |
| Portfolio turnover rate for all share classes | | 20% | | 22% | | 14% | | 12% | | 5% |
| 1 | Based on average shares outstanding. |
| 2 | Total returns exclude any applicable sales charges, including contingent deferred sales charges. |
| 3 | This column reflects the impact, if any, of certain reimbursements from CRMC. During one of the periods shown, CRMC reduced fees for investment advisory services. In addition, during some of the periods shown, CRMC agreed to pay a portion of fees and expenses due to lower short-term interest rates. |
| 4 | Amount less than $.01. |
| 5 | Based on operations for the period shown and, accordingly, is not representative of a full year. |
| 6 | Class F-1 shares were offered beginning August 27, 2009. |
| 7 | Annualized. |
| 8 | Class F-2 shares were offered beginning August 12, 2009. |
See Notes to Financial Statements
| 70 | American Funds Tax-Exempt Funds |
Limited Term Tax-Exempt Bond Fund of America
| | | | | Income (loss) from investment operations1 | | | Dividends and distributions | | | | | | | | | | | | | | | | |
| Period ended | | Net asset
value,
beginning
of period | | Net
investment
income | | Net gains
(losses) on
securities
(both
realized and
unrealized) | | | Total from
investment
operations | | | Dividends
(from net
investment
income) | | | Distributions
(from capital
gains) | | | Total
dividends
and
distributions | | | Net asset
value, end
of period | | | Total
return2 | | | Net assets,
end of
period
(in millions) | | | Ratio of
expenses
to average
net assets | | | Ratio of
net income
to average
net assets | |
| Class A: | | | | | | | | | | | | | | | | | | | | | | | | | | | | | | | | | | | | | | | | | | | | | | |
| 7/31/2014 | | $ | 15.94 | | $ | .40 | | $ | .16 | | | $ | .56 | | | $ | (.40 | ) | | $ | — | | | $ | (.40 | ) | | $ | 16.10 | | | | 3.56 | % | | $ | 2,615 | | | | .60 | % | | | 2.51 | % |
| 7/31/2013 | | | 16.36 | | | .40 | | | (.42 | ) | | | (.02 | ) | | | (.40 | ) | | | — | 3 | | | (.40 | ) | | | 15.94 | | | | (.13 | ) | | | 2,625 | | | | .60 | | | | 2.45 | |
| 7/31/2012 | | | 15.85 | | | .44 | | | .51 | | | | .95 | | | | (.44 | ) | | | — | | | | (.44 | ) | | | 16.36 | | | | 6.06 | | | | 2,549 | | | | .60 | | | | 2.72 | |
| 7/31/2011 | | | 15.78 | | | .46 | | | .07 | | | | .53 | | | | (.46 | ) | | | — | | | | (.46 | ) | | | 15.85 | | | | 3.41 | | | | 2,232 | | | | .60 | | | | 2.93 | |
| 7/31/2010 | | | 15.11 | | | .48 | | | .67 | | | | 1.15 | | | | (.48 | ) | | | — | | | | (.48 | ) | | | 15.78 | | | | 7.71 | | | | 2,316 | | | | .61 | | | | 3.08 | |
| Class B: | | | | | | | | | | | | | | | | | | | | | | | | | | | | | | | | | | | | | | | | | | | | | | |
| 7/31/2014 | | | 15.94 | | | .29 | | | .16 | | | | .45 | | | | (.29 | ) | | | — | | | | (.29 | ) | | | 16.10 | | | | 2.85 | | | | 2 | | | | 1.29 | | | | 1.83 | |
| 7/31/2013 | | | 16.36 | | | .29 | | | (.42 | ) | | | (.13 | ) | | | (.29 | ) | | | — | 3 | | | (.29 | ) | | | 15.94 | | | | (.82 | ) | | | 3 | | | | 1.29 | | | | 1.78 | |
| 7/31/2012 | | | 15.85 | | | .33 | | | .51 | | | | .84 | | | | (.33 | ) | | | — | | | | (.33 | ) | | | 16.36 | | | | 5.33 | | | | 6 | | | | 1.30 | | | | 2.04 | |
| 7/31/2011 | | | 15.78 | | | .35 | | | .07 | | | | .42 | | | | (.35 | ) | | | — | | | | (.35 | ) | | | 15.85 | | | | 2.69 | | | | 10 | | | | 1.31 | | | | 2.24 | |
| 7/31/2010 | | | 15.11 | | | .37 | | | .67 | | | | 1.04 | | | | (.37 | ) | | | — | | | | (.37 | ) | | | 15.78 | | | | 6.96 | | | | 21 | | | | 1.31 | | | | 2.40 | |
| Class C: | | | | | | | | | | | | | | | | | | | | | | | | | | | | | | | | | | | | | | | | | | | | | | |
| 7/31/2014 | | | 15.94 | | | .28 | | | .16 | | | | .44 | | | | (.28 | ) | | | — | | | | (.28 | ) | | | 16.10 | | | | 2.80 | | | | 38 | | | | 1.34 | | | | 1.78 | |
| 7/31/2013 | | | 16.36 | | | .28 | | | (.42 | ) | | | (.14 | ) | | | (.28 | ) | | | — | 3 | | | (.28 | ) | | | 15.94 | | | | (.87 | ) | | | 49 | | | | 1.34 | | | | 1.72 | |
| 7/31/2012 | | | 15.85 | | | .32 | | | .51 | | | | .83 | | | | (.32 | ) | | | — | | | | (.32 | ) | | | 16.36 | | | | 5.27 | | | | 75 | | | | 1.34 | | | | 1.99 | |
| 7/31/2011 | | | 15.78 | | | .34 | | | .07 | | | | .41 | | | | (.34 | ) | | | — | | | | (.34 | ) | | | 15.85 | | | | 2.64 | | | | 69 | | | | 1.36 | | | | 2.19 | |
| 7/31/2010 | | | 15.11 | | | .36 | | | .67 | | | | 1.03 | | | | (.36 | ) | | | — | | | | (.36 | ) | | | 15.78 | | | | 6.91 | | | | 91 | | | | 1.36 | | | | 2.34 | |
| Class F-1: | | | | | | | | | | | | | | | | | | | | | | | | | | | | | | | | | | | | | | | | | | | | | | |
| 7/31/2014 | | | 15.94 | | | .39 | | | .16 | | | | .55 | | | | (.39 | ) | | | — | | | | (.39 | ) | | | 16.10 | | | | 3.49 | | | | 105 | | | | .67 | | | | 2.45 | |
| 7/31/2013 | | | 16.36 | | | .39 | | | (.42 | ) | | | (.03 | ) | | | (.39 | ) | | | — | 3 | | | (.39 | ) | | | 15.94 | | | | (.22 | ) | | | 122 | | | | .69 | | | | 2.37 | |
| 7/31/2012 | | | 15.85 | | | .43 | | | .51 | | | | .94 | | | | (.43 | ) | | | — | | | | (.43 | ) | | | 16.36 | | | | 6.00 | | | | 132 | | | | .65 | | | | 2.67 | |
| 7/31/2011 | | | 15.78 | | | .45 | | | .07 | | | | .52 | | | | (.45 | ) | | | — | | | | (.45 | ) | | | 15.85 | | | | 3.37 | | | | 104 | | | | .65 | | | | 2.89 | |
| 7/31/2010 | | | 15.11 | | | .47 | | | .67 | | | | 1.14 | | | | (.47 | ) | | | — | | | | (.47 | ) | | | 15.78 | | | | 7.68 | | | | 112 | | | | .63 | | | | 3.06 | |
| Class F-2: | | | | | | | | | | | | | | | | | | | | | | | | | | | | | | | | | | | | | | | | | | | | | | |
| 7/31/2014 | | | 15.94 | | | .43 | | | .16 | | | | .59 | | | | (.43 | ) | | | — | | | | (.43 | ) | | | 16.10 | | | | 3.75 | | | | 183 | | | | .42 | | | | 2.69 | |
| 7/31/2013 | | | 16.36 | | | .43 | | | (.42 | ) | | | .01 | | | | (.43 | ) | | | — | 3 | | | (.43 | ) | | | 15.94 | | | | .05 | | | | 148 | | | | .42 | | | | 2.64 | |
| 7/31/2012 | | | 15.85 | | | .47 | | | .51 | | | | .98 | | | | (.47 | ) | | | — | | | | (.47 | ) | | | 16.36 | | | | 6.28 | | | | 162 | | | | .38 | | | | 2.94 | |
| 7/31/2011 | | | 15.78 | | | .49 | | | .07 | | | | .56 | | | | (.49 | ) | | | — | | | | (.49 | ) | | | 15.85 | | | | 3.65 | | | | 132 | | | | .38 | | | | 3.15 | |
| 7/31/2010 | | | 15.11 | | | .52 | | | .67 | | | | 1.19 | | | | (.52 | ) | | | — | | | | (.52 | ) | | | 15.78 | | | | 7.97 | | | | 125 | | | | .36 | | | | 3.35 | |
| Class R-6: | | | | | | | | | | | | | | | | | | | | | | | | | | | | | | | | | | | | | | | | | | | | | | |
| 7/31/2014 | | | 15.94 | | | .45 | | | .16 | | | | .61 | | | | (.45 | ) | | | — | | | | (.45 | ) | | | 16.10 | | | | 3.86 | | | | 133 | | | | .31 | | | | 2.80 | |
| 7/31/2013 | | | 16.36 | | | .45 | | | (.42 | ) | | | .03 | | | | (.45 | ) | | | — | 3 | | | (.45 | ) | | | 15.94 | | | | .16 | | | | 132 | | | | .31 | | | | 2.72 | |
| 7/31/20124,5 | | | 16.32 | | | .10 | | | .05 | | | | .15 | | | | (.11 | ) | | | — | | | | (.11 | ) | | | 16.36 | | | | .90 | | | | 43 | | | | .07 | | | | .64 | |
| | Year ended July 31 |
| | | 2014 | | 2013 | | 2012 | | 2011 | | 2010 |
| Portfolio turnover rate for all share classes | | 9% | | 13% | | 9% | | 14% | | 13% |
| 1 | Based on average shares outstanding. |
| 2 | Total returns exclude any applicable sales charges, including contingent deferred sales charges. |
| 3 | Amount less than $.01. |
| 4 | Based on operations for the period shown and, accordingly, is not representative of a full year. |
| 5 | Class R-6 shares were offered beginning May 11, 2012. |
See Notes to Financial Statements
| American Funds Tax-Exempt Funds | 71 |
Financial highlights (continued)
The Tax-Exempt Bond Fund of America
| | | | Income (loss) from investment operations1 | | | | | | | | | | | | | | | | | | | | | | |
| Period ended | | Net asset
value,
beginning
of period | | Net
investment
income | | Net gains
(losses) on
securities
(both
realized and
unrealized) | | | Total from
investment
operations | | | Dividends
(from net
investment
income) | | | Net asset
value, end
of period | | | Total
return2,3 | | | Net assets,
end of
period
(in millions) | | | Ratio of
expenses to
average net
assets before
waivers | | | Ratio of
expenses to
average net
assets after
waivers3 | | | Ratio
of net
income to
average
net assets3 | |
| Class A: | | | | | | | | | | | | | | | | | | | | | | | | | | | | | | | | | | | | | | | | | | |
| 7/31/2014 | | $ | 12.44 | | $ | .45 | | $ | .48 | | | $ | .93 | | | $ | (.45 | ) | | $ | 12.92 | | | | 7.60 | % | | $ | 6,772 | | | | .56 | % | | | .56 | % | | | 3.57 | % |
| 7/31/20134,5 | | | 13.08 | | | .40 | | | (.64 | ) | | | (.24 | ) | | | (.40 | ) | | | 12.44 | | | | (1.93 | ) | | | 6,984 | | | | .55 | 6 | | | .55 | 6 | | | 3.35 | 6 |
| 8/31/2012 | | | 12.26 | | | .47 | | | .82 | | | | 1.29 | | | | (.47 | ) | | | 13.08 | | | | 10.71 | | | | 7,445 | | | | .55 | | | | .55 | | | | 3.73 | |
| 8/31/2011 | | | 12.53 | | | .48 | | | (.27 | ) | | | .21 | | | | (.48 | ) | | | 12.26 | | | | 1.85 | | | | 6,557 | | | | .55 | | | | .55 | | | | 4.01 | |
| 8/31/2010 | | | 11.82 | | | .48 | | | .71 | | | | 1.19 | | | | (.48 | ) | | | 12.53 | | | | 10.23 | | | | 7,740 | | | | .54 | | | | .54 | | | | 3.92 | |
| 8/31/2009 | | | 12.03 | | | .50 | | | (.21 | ) | | | .29 | | | | (.50 | ) | | | 11.82 | | | | 2.65 | | | | 7,130 | | | | .56 | | | | .56 | | | | 4.39 | |
| Class B: | | | | | | | | | | | | | | | | | | | | | | | | | | | | | | | | | | | | | | | | | | |
| 7/31/2014 | | | 12.44 | | | .35 | | | .48 | | | | .83 | | | | (.35 | ) | | | 12.92 | | | | 6.81 | | | | 13 | | | | 1.30 | | | | 1.30 | | | | 2.84 | |
| 7/31/20134,5 | | | 13.08 | | | .31 | | | (.64 | ) | | | (.33 | ) | | | (.31 | ) | | | 12.44 | | | | (2.59 | ) | | | 20 | | | | 1.30 | 6 | | | 1.30 | 6 | | | 2.61 | 6 |
| 8/31/2012 | | | 12.26 | | | .38 | | | .82 | | | | 1.20 | | | | (.38 | ) | | | 13.08 | | | | 9.90 | | | | 30 | | | | 1.29 | | | | 1.29 | | | | 3.01 | |
| 8/31/2011 | | | 12.53 | | | .39 | | | (.27 | ) | | | .12 | | | | (.39 | ) | | | 12.26 | | | | 1.08 | | | | 40 | | | | 1.30 | | | | 1.30 | | | | 3.26 | |
| 8/31/2010 | | | 11.82 | | | .38 | | | .71 | | | | 1.09 | | | | (.38 | ) | | | 12.53 | | | | 9.41 | | | | 78 | | | | 1.30 | | | | 1.30 | | | | 3.18 | |
| 8/31/2009 | | | 12.03 | | | .41 | | | (.21 | ) | | | .20 | | | | (.41 | ) | | | 11.82 | | | | 1.88 | | | | 107 | | | | 1.32 | | | | 1.31 | | | | 3.65 | |
| Class C: | | | | | | | | | | | | | | | | | | | | | | | | | | | | | | | | | | | | | | | | | | |
| 7/31/2014 | | | 12.44 | | | .35 | | | .48 | | | | .83 | | | | (.35 | ) | | | 12.92 | | | | 6.75 | | | | 325 | | | | 1.35 | | | | 1.35 | | | | 2.79 | |
| 7/31/20134,5 | | | 13.08 | | | .31 | | | (.64 | ) | | | (.33 | ) | | | (.31 | ) | | | 12.44 | | | | (2.64 | ) | | | 375 | | | | 1.34 | 6 | | | 1.34 | 6 | | | 2.56 | 6 |
| 8/31/2012 | | | 12.26 | | | .37 | | | .82 | | | | 1.19 | | | | (.37 | ) | | | 13.08 | | | | 9.85 | | | | 420 | | | | 1.34 | | | | 1.34 | | | | 2.94 | |
| 8/31/2011 | | | 12.53 | | | .39 | | | (.27 | ) | | | .12 | | | | (.39 | ) | | | 12.26 | | | | 1.03 | | | | 370 | | | | 1.35 | | | | 1.35 | | | | 3.21 | |
| 8/31/2010 | | | 11.82 | | | .38 | | | .71 | | | | 1.09 | | | | (.38 | ) | | | 12.53 | | | | 9.35 | | | | 475 | | | | 1.34 | | | | 1.34 | | | | 3.11 | |
| 8/31/2009 | | | 12.03 | | | .41 | | | (.21 | ) | | | .20 | | | | (.41 | ) | | | 11.82 | | | | 1.83 | | | | 399 | | | | 1.36 | | | | 1.36 | | | | 3.58 | |
| Class F-1: | | | | | | | | | | | | | | | | | | | | | | | | | | | | | | | | | | | | | | | | | | |
| 7/31/2014 | | | 12.44 | | | .43 | | | .48 | | | | .91 | | | | (.43 | ) | | | 12.92 | | | | 7.46 | | | | 1,389 | | | | .68 | | | | .68 | | | | 3.46 | |
| 7/31/20134,5 | | | 13.08 | | | .39 | | | (.64 | ) | | | (.25 | ) | | | (.39 | ) | | | 12.44 | | | | (2.05 | ) | | | 1,659 | | | | .68 | 6 | | | .68 | 6 | | | 3.21 | 6 |
| 8/31/2012 | | | 12.26 | | | .46 | | | .82 | | | | 1.28 | | | | (.46 | ) | | | 13.08 | | | | 10.59 | | | | 1,526 | | | | .66 | | | | .66 | | | | 3.62 | |
| 8/31/2011 | | | 12.53 | | | .47 | | | (.27 | ) | | | .20 | | | | (.47 | ) | | | 12.26 | | | | 1.73 | | | | 1,356 | | | | .66 | | | | .66 | | | | 3.90 | |
| 8/31/2010 | | | 11.82 | | | .46 | | | .71 | | | | 1.17 | | | | (.46 | ) | | | 12.53 | | | | 10.12 | | | | 1,380 | | | | .64 | | | | .64 | | | | 3.80 | |
| 8/31/2009 | | | 12.03 | | | .49 | | | (.21 | ) | | | .28 | | | | (.49 | ) | | | 11.82 | | | | 2.56 | | | | 976 | | | | .65 | | | | .64 | | | | 4.31 | |
| Class F-2: | | | | | | | | | | | | | | | | | | | | | | | | | | | | | | | | | | | | | | | | | | |
| 7/31/2014 | | | 12.44 | | | .46 | | | .48 | | | | .94 | | | | (.46 | ) | | | 12.92 | | | | 7.74 | | | | 662 | | | | .42 | | | | .42 | | | | 3.70 | |
| 7/31/20134,5 | | | 13.08 | | | .42 | | | (.64 | ) | | | (.22 | ) | | | (.42 | ) | | | 12.44 | | | | (1.81 | ) | | | 327 | | | | .42 | 6 | | | .42 | 6 | | | 3.49 | 6 |
| 8/31/2012 | | | 12.26 | | | .49 | | | .82 | | | | 1.31 | | | | (.49 | ) | | | 13.08 | | | | 10.88 | | | | 239 | | | | .40 | | | | .40 | | | | 3.87 | |
| 8/31/2011 | | | 12.53 | | | .50 | | | (.27 | ) | | | .23 | | | | (.50 | ) | | | 12.26 | | | | 1.99 | | | | 196 | | | | .41 | | | | .41 | | | | 4.15 | |
| 8/31/2010 | | | 11.82 | | | .50 | | | .71 | | | | 1.21 | | | | (.50 | ) | | | 12.53 | | | | 10.41 | | | | 216 | | | | .37 | | | | .37 | | | | 4.09 | |
| 8/31/2009 | | | 12.03 | | | .51 | | | (.21 | ) | | | .30 | | | | (.51 | ) | | | 11.82 | | | | 2.80 | | | | 253 | | | | .39 | | | | .39 | | | | 4.36 | |
| Class R-6: | | | | | | | | | | | | | | | | | | | | | | | | | | | | | | | | | | | | | | | | | | |
| 7/31/2014 | | | 12.44 | | | .48 | | | .48 | | | | .96 | | | | (.48 | ) | | | 12.92 | | | | 7.86 | | | | 165 | | | | .31 | | | | .31 | | | | 3.81 | |
| 7/31/20134,5 | | | 13.08 | | | .43 | | | (.64 | ) | | | (.21 | ) | | | (.43 | ) | | | 12.44 | | | | (1.71 | ) | | | 115 | | | | .31 | 6 | | | .31 | 6 | | | 3.58 | 6 |
| 8/31/20124,7 | | | 12.94 | | | .14 | | | .15 | | | | .29 | | | | (.15 | ) | | | 13.08 | | | | 2.25 | | | | 42 | | | | .09 | | | | .09 | | | | 1.15 | |
| | | Year ended
July 31 | | For the period
9/1/2012 to | | Year ended August 31 |
| | | 2014 | | 7/31/20134,5 | | 2012 | | 2011 | | 2010 |
| Portfolio turnover rate for all share classes | | 10% | | 16% | | 14% | | 12% | | 16% |
| | |
| 1 | Based on average shares outstanding. |
| 2 | Total returns exclude any applicable sales charges, including contingent deferred sales charges. |
| 3 | This column reflects the impact, if any, of certain waivers from CRMC. During one of the periods shown, CRMC reduced fees for investment advisory services. |
| 4 | Based on operations for the period shown and, accordingly, is not representative of a full year. |
| 5 | In 2013, the fund changed its fiscal year-end from August to July. |
| 6 | Annualized. |
| 7 | Class R-6 shares were offered beginning May 11, 2012. |
See Notes to Financial Statements
| 72 | American Funds Tax-Exempt Funds |
American High-Income Municipal Bond Fund
| | | | | Income (loss) from investment operations1 | | | | | | | | | | | | | | | | | | | |
| Period ended | | Net asset
value,
beginning
of period | | Net
investment
income | | Net gains
(losses) on
securities
(both realized and unrealized) | | | Total from
investment
operations | | | Dividends
(from net
investment
income | | | Net asset
value, end
of period | | | Total
return2 | | | Net assets,
end of
period
(in millions) | | | Ratio of
expenses
to average
net assets | | | Ratio of
net income
to average
net assets | |
| Class A: | | | | | | | | | | | | | | | | | | | | | | | | | | | | | | | | | | | | | | |
| 7/31/2014 | | $ | 14.48 | | $ | .68 | | $ | .73 | | | $ | 1.41 | | | $ | (.67 | ) | | $ | 15.22 | | | | 9.99 | % | | $ | 2,357 | | | | .68 | % | | | 4.59 | % |
| 7/31/2013 | | | 15.13 | | | .63 | | | (.65 | ) | | | (.02 | ) | | | (.63 | ) | | | 14.48 | | | | (.25 | ) | | | 2,246 | | | | .69 | | | | 4.14 | |
| 7/31/2012 | | | 13.78 | | | .66 | | | 1.35 | | | | 2.01 | | | | (.66 | ) | | | 15.13 | | | | 14.98 | | | | 2,286 | | | | .68 | | | | 4.64 | |
| 7/31/2011 | | | 13.97 | | | .67 | | | (.19 | ) | | | .48 | | | | (.67 | ) | | | 13.78 | | | | 3.57 | | | | 1,849 | | | | .64 | | | | 4.86 | |
| 7/31/2010 | | | 12.69 | | | .66 | | | 1.28 | | | | 1.94 | | | | (.66 | ) | | | 13.97 | | | | 15.50 | | | | 2,109 | | | | .68 | | | | 4.82 | |
| Class B: | | | | | | | | | | | | | | | | | | | | | | | | | | | | | | | | | | | | | | |
| 7/31/2014 | | | 14.48 | | | .57 | | | .73 | | | | 1.30 | | | | (.56 | ) | | | 15.22 | | | | 9.17 | | | | 6 | | | | 1.44 | | | | 3.87 | |
| 7/31/2013 | | | 15.13 | | | .52 | | | (.65 | ) | | | (.13 | ) | | | (.52 | ) | | | 14.48 | | | | (.97 | ) | | | 10 | | | | 1.42 | | | | 3.42 | |
| 7/31/2012 | | | 13.78 | | | .56 | | | 1.35 | | | | 1.91 | | | | (.56 | ) | | | 15.13 | | | | 14.14 | | | | 16 | | | | 1.42 | | | | 3.96 | |
| 7/31/2011 | | | 13.97 | | | .56 | | | (.19 | ) | | | .37 | | | | (.56 | ) | | | 13.78 | | | | 2.78 | | | | 21 | | | | 1.41 | | | | 4.07 | |
| 7/31/2010 | | | 12.69 | | | .56 | | | 1.28 | | | | 1.84 | | | | (.56 | ) | | | 13.97 | | | | 14.67 | | | | 36 | | | | 1.42 | | | | 4.11 | |
| Class C: | | | | | | | | | | | | | | | | | | | | | | | | | | | | | | | | | | | | | | |
| 7/31/2014 | | | 14.48 | | | .56 | | | .73 | | | | 1.29 | | | | (.55 | ) | | | 15.22 | | | | 9.12 | | | | 161 | | | | 1.48 | | | | 3.80 | |
| 7/31/2013 | | | 15.13 | | | .52 | | | (.65 | ) | | | (.13 | ) | | | (.52 | ) | | | 14.48 | | | | (1.02 | ) | | | 161 | | | | 1.46 | | | | 3.37 | |
| 7/31/2012 | | | 13.78 | | | .55 | | | 1.35 | | | | 1.90 | | | | (.55 | ) | | | 15.13 | | | | 14.09 | | | | 170 | | | | 1.46 | | | | 3.86 | |
| 7/31/2011 | | | 13.97 | | | .56 | | | (.19 | ) | | | .37 | | | | (.56 | ) | | | 13.78 | | | | 2.73 | | | | 137 | | | | 1.46 | | | | 4.03 | |
| 7/31/2010 | | | 12.69 | | | .55 | | | 1.28 | | | | 1.83 | | | | (.55 | ) | | | 13.97 | | | | 14.60 | | | | 163 | | | | 1.46 | | | | 4.03 | |
| Class F-1: | | | | | | | | | | | | | | | | | | | | | | | | | | | | | | | | | | | | | | |
| 7/31/2014 | | | 14.48 | | | .66 | | | .73 | | | | 1.39 | | | | (.65 | ) | | | 15.22 | | | | 9.87 | | | | 178 | | | | .79 | | | | 4.49 | |
| 7/31/2013 | | | 15.13 | | | .62 | | | (.65 | ) | | | (.03 | ) | | | (.62 | ) | | | 14.48 | | | | (.35 | ) | | | 172 | | | | .79 | | | | 4.04 | |
| 7/31/2012 | | | 13.78 | | | .65 | | | 1.35 | | | | 2.00 | | | | (.65 | ) | | | 15.13 | | | | 14.89 | | | | 191 | | | | .76 | | | | 4.56 | |
| 7/31/2011 | | | 13.97 | | | .65 | | | (.19 | ) | | | .46 | | | | (.65 | ) | | | 13.78 | | | | 3.45 | | | | 146 | | | | .76 | | | | 4.73 | |
| 7/31/2010 | | | 12.69 | | | .65 | | | 1.28 | | | | 1.93 | | | | (.65 | ) | | | 13.97 | | | | 15.42 | | | | 181 | | | | .75 | | | | 4.75 | |
| Class F-2: | | | | | | | | | | | | | | | | | | | | | | | | | | | | | | | | | | | | | | |
| 7/31/2014 | | | 14.48 | | | .70 | | | .73 | | | | 1.43 | | | | (.69 | ) | | | 15.22 | | | | 10.15 | | | | 223 | | | | .53 | | | | 4.71 | |
| 7/31/2013 | | | 15.13 | | | .66 | | | (.65 | ) | | | .01 | | | | (.66 | ) | | | 14.48 | | | | (.09 | ) | | | 126 | | | | .52 | | | | 4.31 | |
| 7/31/2012 | | | 13.78 | | | .69 | | | 1.35 | | | | 2.04 | | | | (.69 | ) | | | 15.13 | | | | 15.20 | | | | 87 | | | | .49 | | | | 4.81 | |
| 7/31/2011 | | | 13.97 | | | .69 | | | (.19 | ) | | | .50 | | | | (.69 | ) | | | 13.78 | | | | 3.74 | | | | 58 | | | | .48 | | | | 5.03 | |
| 7/31/2010 | | | 12.69 | | | .68 | | | 1.28 | | | | 1.96 | | | | (.68 | ) | | | 13.97 | | | | 15.72 | | | | 50 | | | | .48 | | | | 5.00 | |
| Class R-6: | | | | | | | | | | | | | | | | | | | | | | | | | | | | | | | | | | | | | | |
| 7/31/2014 | | | 14.48 | | | .72 | | | .73 | | | | 1.45 | | | | (.71 | ) | | | 15.22 | | | | 10.27 | | | | 108 | | | | .42 | | | | 4.82 | |
| 7/31/2013 | | | 15.13 | | | .68 | | | (.65 | ) | | | .03 | | | | (.68 | ) | | | 14.48 | | | | .02 | | | | 58 | | | | .40 | | | | 4.44 | |
| 7/31/20123,4 | | | 14.86 | | | .14 | | | .28 | | | | .42 | | | | (.15 | ) | | | 15.13 | | | | 2.85 | | | | 13 | | | | .08 | | | | 1.00 | |
| | Year ended July 31 |
| | | 2014 | | 2013 | | 2012 | | 2011 | | 2010 |
| Portfolio turnover rate for all share classes | | 24% | | 25% | | 20% | | 18% | | 15% |
| 1 | Based on average shares outstanding. |
| 2 | Total returns exclude any applicable sales charges, including contingent deferred sales charges. |
| 3 | Based on operations for the period shown and, accordingly, is not representative of a full year. |
| 4 | Class R-6 shares were offered beginning May 11, 2012. |
See Notes to Financial Statements
| American Funds Tax-Exempt Funds | 73 |
Financial highlights (continued)
The Tax-Exempt Fund of California
| | | | | Income (loss) from investment operations1 | | | | | | | | | | | | | | | | | | | | |
| Period ended | | Net asset
value,
beginning
of period | | Net
investment
income | | Net gains
(losses) on
securities
(both realized and
unrealized) | | | Total from
investment
operations | | | Dividends
(from net
investment
income) | | | Net asset
value, end
of period | | Total
return2,3 | | | Net assets,
end of
period
(in millions) | | Ratio of
expenses to
average net
assets before
waivers | | | Ratio of
expenses to
average net
assets after
waivers3 | | | Ratio
of net
income to
average
net assets3 | |
| Class A: | | | | | | | | | | | | | | | | | | | | | | | | | | | | | | | | | | | | | | | | |
| 7/31/2014 | | $ | 16.72 | | $ | .63 | | $ | .80 | | | $ | 1.43 | | | $ | (.63 | ) | | $ | 17.52 | | | 8.72 | % | | $ | 1,265 | | | .63 | % | | | .63 | % | | | 3.72 | % |
| 7/31/20134,5 | | | 17.54 | | | .59 | | | (.82 | ) | | | (.23 | ) | | | (.59 | ) | | | 16.72 | | | (1.45 | ) | | | 1,250 | | | .63 | 6 | | | .63 | 6 | | | 3.64 | 6 |
| 8/31/2012 | | | 16.32 | | | .66 | | | 1.22 | | | | 1.88 | | | | (.66 | ) | | | 17.54 | | | 11.70 | | | | 1,334 | | | .63 | | | | .63 | | | | 3.89 | |
| 8/31/2011 | | | 16.63 | | | .65 | | | (.31 | ) | | | .34 | | | | (.65 | ) | | | 16.32 | | | 2.24 | | | | 1,218 | | | .64 | | | | .64 | | | | 4.08 | |
| 8/31/2010 | | | 15.31 | | | .64 | | | 1.32 | | | | 1.96 | | | | (.64 | ) | | | 16.63 | | | 13.07 | | | | 1,442 | | | .62 | | | | .62 | | | | 4.04 | |
| 8/31/2009 | | | 15.79 | | | .67 | | | (.48 | ) | | | .19 | | | | (.67 | ) | | | 15.31 | | | 1.49 | | | | 1,311 | | | .63 | | | | .62 | | | | 4.59 | |
| Class B: | | | | | | | | | | | | | | | | | | | | | | | | | | | | | | | | | | | | | | | | |
| 7/31/2014 | | | 16.72 | | | .51 | | | .79 | | | | 1.30 | | | | (.50 | ) | | | 17.52 | | | 7.93 | | | | 2 | | | 1.38 | | | | 1.38 | | | | 3.00 | |
| 7/31/20134,5 | | | 17.54 | | | .47 | | | (.82 | ) | | | (.35 | ) | | | (.47 | ) | | | 16.72 | | | (2.12 | ) | | | 3 | | | 1.37 | 6 | | | 1.37 | 6 | | | 2.90 | 6 |
| 8/31/2012 | | | 16.32 | | | .53 | | | 1.22 | | | | 1.75 | | | | (.53 | ) | | | 17.54 | | | 10.89 | | | | 5 | | | 1.37 | | | | 1.37 | | | | 3.17 | |
| 8/31/2011 | | | 16.63 | | | .53 | | | (.31 | ) | | | .22 | | | | (.53 | ) | | | 16.32 | | | 1.48 | | | | 7 | | | 1.39 | | | | 1.39 | | | | 3.33 | |
| 8/31/2010 | | | 15.31 | | | .52 | | | 1.32 | | | | 1.84 | | | | (.52 | ) | | | 16.63 | | | 12.22 | | | | 11 | | | 1.37 | | | | 1.37 | | | | 3.31 | |
| 8/31/2009 | | | 15.79 | | | .56 | | | (.48 | ) | | | .08 | | | | (.56 | ) | | | 15.31 | | | .73 | | | | 16 | | | 1.39 | | | | 1.37 | | | | 3.85 | |
| Class C: | | | | | | | | | | | | | | | | | | | | | | | | | | | | | | | | | | | | | | | | |
| 7/31/2014 | | | 16.72 | | | .50 | | | .80 | | | | 1.30 | | | | (.50 | ) | | | 17.52 | | | 7.87 | | | | 76 | | | 1.42 | | | | 1.42 | | | | 2.94 | |
| 7/31/20134,5 | | | 17.54 | | | .46 | | | (.82 | ) | | | (.36 | ) | | | (.46 | ) | | | 16.72 | | | (2.16 | ) | | | 87 | | | 1.42 | 6 | | | 1.42 | 6 | | | 2.85 | 6 |
| 8/31/2012 | | | 16.32 | | | .52 | | | 1.22 | | | | 1.74 | | | | (.52 | ) | | | 17.54 | | | 10.83 | | | | 101 | | | 1.42 | | | | 1.42 | | | | 3.10 | |
| 8/31/2011 | | | 16.63 | | | .52 | | | (.31 | ) | | | .21 | | | | (.52 | ) | | | 16.32 | | | 1.42 | | | | 91 | | | 1.44 | | | | 1.44 | | | | 3.28 | |
| 8/31/2010 | | | 15.31 | | | .51 | | | 1.32 | | | | 1.83 | | | | (.51 | ) | | | 16.63 | | | 12.17 | | | | 116 | | | 1.42 | | | | 1.42 | | | | 3.24 | |
| 8/31/2009 | | | 15.79 | | | .55 | | | (.48 | ) | | | .07 | | | | (.55 | ) | | | 15.31 | | | .68 | | | | 105 | | | 1.43 | | | | 1.42 | | | | 3.79 | |
| Class F-1: | | | | | | | | | | | | | | | | | | | | | | | | | | | | | | | | | | | | | | | | |
| 7/31/2014 | | | 16.72 | | | .61 | | | .80 | | | | 1.41 | | | | (.61 | ) | | | 17.52 | | | 8.59 | | | | 65 | | | .76 | | | | .76 | | | | 3.60 | |
| 7/31/20134,5 | | | 17.54 | | | .56 | | | (.82 | ) | | | (.26 | ) | | | (.56 | ) | | | 16.72 | | | (1.58 | ) | | | 74 | | | .77 | 6 | | | .77 | 6 | | | 3.50 | 6 |
| 8/31/2012 | | | 16.32 | | | .64 | | | 1.22 | | | | 1.86 | | | | (.64 | ) | | | 17.54 | | | 11.59 | | | | 82 | | | .73 | | | | .73 | | | | 3.79 | |
| 8/31/2011 | | | 16.63 | | | .64 | | | (.31 | ) | | | .33 | | | | (.64 | ) | | | 16.32 | | | 2.13 | | | | 82 | | | .74 | | | | .74 | | | | 3.98 | |
| 8/31/2010 | | | 15.31 | | | .63 | | | 1.32 | | | | 1.95 | | | | (.63 | ) | | | 16.63 | | | 12.97 | | | | 108 | | | .70 | | | | .70 | | | | 3.97 | |
| 8/31/2009 | | | 15.79 | | | .65 | | | (.48 | ) | | | .17 | | | | (.65 | ) | | | 15.31 | | | 1.41 | | | | 113 | | | .71 | | | | .70 | | | | 4.52 | |
| Class F-2: | | | | | | | | | | | | | | | | | | | | | | | | | | | | | | | | | | | | | | | | |
| 7/31/2014 | | | 16.72 | | | .65 | | | .80 | | | | 1.45 | | | | (.65 | ) | | | 17.52 | | | 8.85 | | | | 110 | | | .51 | | | | .51 | | | | 3.84 | |
| 7/31/20134,5 | | | 17.54 | | | .60 | | | (.82 | ) | | | (.22 | ) | | | (.60 | ) | | | 16.72 | | | (1.35 | ) | | | 91 | | | .51 | 6 | | | .51 | 6 | | | 3.77 | 6 |
| 8/31/2012 | | | 16.32 | | | .68 | | | 1.22 | | | | 1.90 | | | | (.68 | ) | | | 17.54 | | | 11.87 | | | | 74 | | | .48 | | | | .48 | | | | 4.02 | |
| 8/31/2011 | | | 16.63 | | | .67 | | | (.31 | ) | | | .36 | | | | (.67 | ) | | | 16.32 | | | 2.38 | | | | 41 | | | .50 | | | | .50 | | | | 4.22 | |
| 8/31/2010 | | | 15.31 | | | .67 | | | 1.32 | | | | 1.99 | | | | (.67 | ) | | | 16.63 | | | 13.27 | | | | 46 | | | .43 | | | | .43 | | | | 4.27 | |
| 8/31/2009 | | | 15.79 | | | .69 | | | (.48 | ) | | | .21 | | | | (.69 | ) | | | 15.31 | | | 1.67 | | | | 99 | | | .45 | | | | .45 | | | | 4.61 | |
| | Year ended
July 31 | | For the period
9/1/2012 to | | | | Year ended August 31 | |
| | | | 2014 | | | 7/31/20134,5 | | 2012 | | 2011 | | 2010 | | 2009 | |
| Portfolio turnover rate for all share classes | | | 8% | | | | 12% | | | | 15% | | | | 10% | | | | 18% | | | | 17% | |
| 1 | Based on average shares outstanding. |
| 2 | Total returns exclude any applicable sales charges, including contingent deferred sales charges. |
| 3 | This column reflects the impact, if any, of certain waivers from CRMC. During one of the periods shown, CRMC reduced fees for investment advisory services. |
| 4 | Based on operations for the period shown and, accordingly, is not representative of a full year. |
| 5 | In 2013, the fund changed its fiscal year-end from August to July. |
| 6 | Annualized. |
See Notes to Financial Statements
| 74 | American Funds Tax-Exempt Funds |
American Funds Tax-Exempt Fund of New York
| | | | | Income (loss) from investment operations1 | | | | | | | | | | | | | | | | | | | | | |
| Period ended | | Net asset
value,
beginning
of period | | Net
investment
income | | Net gains
(losses) on
securities
(both
realized and
unrealized) | | | Total from
investment
operations | | | Dividends
(from net
investment
income) | | | Net asset
value, end
of period | | | Total
return2,3 | | | Net assets,
end of
period
(in thousands) | | Ratio of
expenses to
average net
assets before
reimbursements | | | Ratio of
expenses to
average net
assets after
reimbursements3 | | | Ratio
of net
income to
average
net assets3 | |
| Class A: | | | | | | | | | | | | | | | | | | | | | | | | | | | | | | | | | | | | | | | | | |
| 7/31/2014 | | $ | 10.21 | | $ | .31 | | $ | .37 | | | $ | .68 | | | $ | (.31 | ) | | $ | 10.58 | | | | 6.83 | % | | $ | 101,874 | | | .73 | % | | | .63 | % | | | 3.07 | % |
| 7/31/2013 | | | 10.85 | | | .31 | | | (.64 | ) | | | (.33 | ) | | | (.31 | ) | | | 10.21 | | | | (3.16 | ) | | | 99,811 | | | .66 | | | | .59 | | | | 2.88 | |
| 7/31/2012 | | | 9.98 | | | .32 | | | .87 | | | | 1.19 | | | | (.32 | ) | | | 10.85 | | | | 12.11 | | | | 106,145 | | | .76 | | | | .63 | | | | 3.06 | |
| 7/31/20114,5 | | | 10.00 | | | .21 | | | (.03 | ) | | | .18 | | | | (.20 | ) | | | 9.98 | | | | 1.83 | | | | 62,229 | | | .97 | 6 | | | .67 | 6 | | | 2.82 | 6 |
| Class B: | | | | | | | | | | | | | | | | | | | | | | | | | | | | | | | | | | | | | | | | | |
| 7/31/2014 | | | 10.21 | | | .23 | | | .37 | | | | .60 | | | | (.23 | ) | | | 10.58 | | | | 5.98 | | | | 51 | | | 1.51 | | | | 1.44 | | | | 2.29 | |
| 7/31/2013 | | | 10.85 | | | .22 | | | (.64 | ) | | | (.42 | ) | | | (.22 | ) | | | 10.21 | | | | (4.00 | ) | | | 174 | | | 1.53 | | | | 1.46 | | | | 1.99 | |
| 7/31/2012 | | | 9.98 | | | .23 | | | .87 | | | | 1.10 | | | | (.23 | ) | | | 10.85 | | | | 11.18 | | | | 271 | | | 1.59 | | | | 1.45 | | | | 2.24 | |
| 7/31/20114,5 | | | 10.00 | | | .15 | | | (.03 | ) | | | .12 | | | | (.14 | ) | | | 9.98 | | | | 1.24 | | | | 120 | | | 1.76 | 6 | | | 1.48 | 6 | | | 2.21 | 6 |
| Class C: | | | | | | | | | | | | | | | | | | | | | | | | | | | | | | | | | | | | | | | | | |
| 7/31/2014 | | | 10.21 | | | .22 | | | .37 | | | | .59 | | | | (.22 | ) | | | 10.58 | | | | 5.89 | | | | 7,809 | | | 1.60 | | | | 1.51 | | | | 2.19 | |
| 7/31/2013 | | | 10.85 | | | .21 | | | (.64 | ) | | | (.43 | ) | | | (.21 | ) | | | 10.21 | | | | (4.04 | ) | | | 7,763 | | | 1.58 | | | | 1.50 | | | | 1.96 | |
| 7/31/2012 | | | 9.98 | | | .23 | | | .87 | | | | 1.10 | | | | (.23 | ) | | | 10.85 | | | | 11.12 | | | | 6,875 | | | 1.62 | | | | 1.50 | | | | 2.17 | |
| 7/31/20114,5 | | | 10.00 | | | .15 | | | (.03 | ) | | | .12 | | | | (.14 | ) | | | 9.98 | | | | 1.26 | | | | 2,103 | | | 1.75 | 6 | | | 1.55 | 6 | | | 2.27 | 6 |
| Class F-1: | | | | | | | | | | | | | | | | | | | | | | | | | | | | | | | | | | | | | | | | | |
| 7/31/2014 | | | 10.21 | | | .31 | | | .37 | | | | .68 | | | | (.31 | ) | | | 10.58 | | | | 6.77 | | | | 1,072 | | | .77 | | | | .68 | | | | 3.03 | |
| 7/31/2013 | | | 10.85 | | | .29 | | | (.64 | ) | | | (.35 | ) | | | (.29 | ) | | | 10.21 | | | | (3.36 | ) | | | 1,372 | | | .86 | | | | .79 | | | | 2.67 | |
| 7/31/2012 | | | 9.98 | | | .31 | | | .87 | | | | 1.18 | | | | (.31 | ) | | | 10.85 | | | | 11.95 | | | | 2,392 | | | .86 | | | | .74 | | | | 2.94 | |
| 7/31/20114,5 | | | 10.00 | | | .20 | | | (.03 | ) | | | .17 | | | | (.19 | ) | | | 9.98 | | | | 1.76 | | | | 872 | | | 1.03 | 6 | | | .78 | 6 | | | 2.71 | 6 |
| Class F-2: | | | | | | | | | | | | | | | | | | | | | | | | | | | | | | | | | | | | | | | | | |
| 7/31/2014 | | | 10.21 | | | .32 | | | .37 | | | | .69 | | | | (.32 | ) | | | 10.58 | | | | 6.89 | | | | 15,959 | | | .66 | | | | .57 | | | | 3.13 | |
| 7/31/2013 | | | 10.85 | | | .31 | | | (.64 | ) | | | (.33 | ) | | | (.31 | ) | | | 10.21 | | | | (3.14 | ) | | | 14,378 | | | .64 | | | | .57 | | | | 2.90 | |
| 7/31/2012 | | | 9.98 | | | .33 | | | .87 | | | | 1.20 | | | | (.33 | ) | | | 10.85 | | | | 12.21 | | | | 12,983 | | | .63 | | | | .53 | | | | 3.13 | |
| 7/31/20114,5 | | | 10.00 | | | .22 | | | (.03 | ) | | | .19 | | | | (.21 | ) | | | 9.98 | | | | 1.92 | | | | 3,162 | | | .70 | 6 | | | .55 | 6 | | | 3.08 | 6 |
| | | | Year ended July 31 | | For the period 11/1/2010 to | |
| | | | 2014 | | | | 2013 | | | | 2012 | | | 7/31/20114,5 | |
| Portfolio turnover rate for all share classes | | | 25% | | | | 23% | | | | 15% | | | | 16% | |
| 1 | Based on average shares outstanding. |
| 2 | Total returns exclude any applicable sales charges, including contingent deferred sales charges. |
| 3 | This column reflects the impact, if any, of certain reimbursements from CRMC. During the periods shown, CRMC reimbursed other fees and expenses. |
| 4 | Based on operations for the period shown and, accordingly, is not representative of a full year. |
| 5 | For the period November 1, 2010, commencement of operations, through July 31, 2011. |
| 6 | Annualized. |
See Notes to Financial Statements
| American Funds Tax-Exempt Funds | 75 |
Report of Independent Registered Public Accounting Firm
To the Board of Trustees and Shareholders of American Funds Short-Term Tax-Exempt Bond Fund, Limited Term Tax-Exempt Bond Fund of America, The Tax-Exempt Bond Fund of America, American High-Income Municipal Bond Fund, The Tax-Exempt Fund of California and American Funds Tax-Exempt Fund of New York
In our opinion, the accompanying statements of assets and liabilities, including the summary investment portfolios (investment portfolio for American Funds Tax-Exempt Fund of New York), and the related statements of operations and of changes in net assets and the financial highlights present fairly, in all material respects, the financial position of American Funds Short-Term Tax-Exempt Bond Fund, Limited Term Tax-Exempt Bond Fund of America, The Tax-Exempt Bond Fund of America, American High-Income Municipal Bond Fund, The Tax-Exempt Fund of California and American Funds Tax-Exempt Fund of New York (the “Funds”) at July 31, 2014, the results of each of their operations for the year then ended, the changes in each of their net assets and the financial highlights for each of the periods presented (other than as noted below for The Tax-Exempt Fund of California), in conformity with accounting principles generally accepted in the United States of America. These financial statements and financial highlights (hereafter referred to as “financial statements”) are the responsibility of the Funds’ management. Our responsibility is to express an opinion on these financial statements based on our audits. We conducted our audits of these financial statements in accordance with the standards of the Public Company Accounting Oversight Board (United States). Those standards require that we plan and perform the audit to obtain reasonable assurance about whether the financial statements are free of material misstatement. An audit includes examining, on a test basis, evidence supporting the amounts and disclosures in the financial statements, assessing the accounting principles used and significant estimates made by management, and evaluating the overall financial statement presentation. We believe that our audits, which included confirmation of securities at July 31, 2014 by correspondence with the custodians and brokers, provide a reasonable basis for our opinion. The financial statements of The Tax-Exempt Fund of California as of July 31, 2013, and for the fiscal years ended through July 31, 2013 as appearing herein, were audited by other auditors whose report dated September 9, 2013, expressed an unqualified opinion on those statements.
PricewaterhouseCoopers LLP
Los Angeles, California
September 9, 2014
| 76 | American Funds Tax-Exempt Funds |
| Expense examples | unaudited |
As a fund shareholder, you incur two types of costs: (1) transaction costs, such as initial sales charges on purchase payments and contingent deferred sales charges on redemptions (loads), and (2) ongoing costs, including management fees, distribution and service (12b-1) fees, and other expenses. The examples shown on the following pages are intended to help shareholders understand the ongoing costs (in dollars) of investing in the funds so they can compare these costs with the ongoing costs of investing in other mutual funds. The examples are based on an investment of $1,000 invested at the beginning of the period and held for the entire six-month period (February 1, 2014, through July 31, 2014).
Actual expenses:
The first line of each share class of each fund in the tables on the following pages provides information about actual account values and actual expenses. You may use the information in this line, together with the amount you invested, to estimate the expenses that you paid over the period. Simply divide your account value by $1,000 (for example, an $8,600 account value divided by $1,000 = 8.6), then multiply the result by the number in the first line under the heading entitled “Expenses paid during period” to estimate the expenses you paid on your account during this period.
Hypothetical example for comparison purposes:
The second line of each share class of each fund in the tables on the following pages provides information about hypothetical account values and hypothetical expenses based on the actual expense ratio for the share class and an assumed rate of return of 5.00% per year before expenses, which is not the actual return of the share class. The hypothetical account values and expenses may not be used to estimate the actual ending account balance or expenses you paid for the period. You may use this information to compare the ongoing costs of investing in the fund and other funds. To do so, compare this 5.00% hypothetical example with the 5.00% hypothetical examples that appear in the shareholder reports of the other funds.
Notes:
Class F-1 and F-2 shareholders may be subject to fees charged by financial intermediaries, typically ranging from 0.75% to 1.50% of assets annually depending on services offered. You can estimate the impact of these fees by adding the amount of the fees to the total estimated expenses you paid on your account during the period as calculated above. In addition, your ending account value would be lower by the amount of these fees.
Note that the expenses shown in the tables on the following pages are meant to highlight your ongoing costs only and do not reflect any transactional costs, such as sales charges (loads), if any. Therefore, the second line of each share class in the tables is useful in comparing ongoing costs only and will not help you determine the relative total costs of owning different funds. In addition, if these transactional costs were included, your costs would have been higher.
| American Funds Tax-Exempt Funds | 77 |
Expense examples (continued)
American Funds Short-Term Tax-Exempt Bond Fund
| | | Beginning
account value
2/1/2014 | | Ending
account value
7/31/2014 | | Expenses paid
during period* | | Annualized
expense ratio | |
| Class A – actual return | | $ | 1,000.00 | | | $ | 1,005.39 | | | $ | 2.88 | | | | .58 | % | |
| Class A – assumed 5% return | | | 1,000.00 | | | | 1,021.92 | | | | 2.91 | | | | .58 | | |
| Class F-1 – actual return | | | 1,000.00 | | | | 1,004.12 | | | | 4.07 | | | | .82 | | |
| Class F-1 – assumed 5% return | | | 1,000.00 | | | | 1,020.73 | | | | 4.11 | | | | .82 | | |
| Class F-2 – actual return | | | 1,000.00 | | | | 1,005.57 | | | | 2.69 | | | | .54 | | |
| Class F-2 – assumed 5% return | | | 1,000.00 | | | | 1,022.12 | | | | 2.71 | | | | .54 | | |
Limited Term Tax-Exempt Bond Fund of America
| | | Beginning
account value
2/1/2014 | | Ending
account value
7/31/2014 | | Expenses paid
during period* | | Annualized
expense ratio | |
| Class A – actual return | | $ | 1,000.00 | | | $ | 1,015.67 | | | $ | 3.00 | | | | .60 | % | |
| Class A – assumed 5% return | | | 1,000.00 | | | | 1,021.82 | | | | 3.01 | | | | .60 | | |
| Class B – actual return | | | 1,000.00 | | | | 1,012.22 | | | | 6.44 | | | | 1.29 | | |
| Class B – assumed 5% return | | | 1,000.00 | | | | 1,018.40 | | | | 6.46 | | | | 1.29 | | |
| Class C – actual return | | | 1,000.00 | | | | 1,011.97 | | | | 6.68 | | | | 1.34 | | |
| Class C – assumed 5% return | | | 1,000.00 | | | | 1,018.15 | | | | 6.71 | | | | 1.34 | | |
| Class F-1 – actual return | | | 1,000.00 | | | | 1,015.28 | | | | 3.35 | | | | .67 | | |
| Class F-1 – assumed 5% return | | | 1,000.00 | | | | 1,021.47 | | | | 3.36 | | | | .67 | | |
| Class F-2 – actual return | | | 1,000.00 | | | | 1,016.57 | | | | 2.10 | | | | .42 | | |
| Class F-2 – assumed 5% return | | | 1,000.00 | | | | 1,022.71 | | | | 2.11 | | | | .42 | | |
| Class R-6 – actual return | | | 1,000.00 | | | | 1,017.12 | | | | 1.55 | | | | .31 | | |
| Class R-6 – assumed 5% return | | | 1,000.00 | | | | 1,023.26 | | | | 1.56 | | | | .31 | | |
The Tax-Exempt Bond Fund of America
| | | Beginning
account value
2/1/2014 | | Ending
account value
7/31/2014 | | Expenses paid
during period* | | Annualized
expense ratio | |
| Class A – actual return | | $ | 1,000.00 | | | $ | 1,044.31 | | | $ | 2.79 | | | | .55 | % | |
| Class A – assumed 5% return | | | 1,000.00 | | | | 1,022.07 | | | | 2.76 | | | | .55 | | |
| Class B – actual return | | | 1,000.00 | | | | 1,040.53 | | | | 6.53 | | | | 1.29 | | |
| Class B – assumed 5% return | | | 1,000.00 | | | | 1,018.40 | | | | 6.46 | | | | 1.29 | | |
| Class C – actual return | | | 1,000.00 | | | | 1,040.27 | | | | 6.78 | | | | 1.34 | | |
| Class C – assumed 5% return | | | 1,000.00 | | | | 1,018.15 | | | | 6.71 | | | | 1.34 | | |
| Class F-1 – actual return | | | 1,000.00 | | | | 1,043.68 | | | | 3.40 | | | | .67 | | |
| Class F-1 – assumed 5% return | | | 1,000.00 | | | | 1,021.47 | | | | 3.36 | | | | .67 | | |
| Class F-2 – actual return | | | 1,000.00 | | | | 1,045.05 | | | | 2.08 | | | | .41 | | |
| Class F-2 – assumed 5% return | | | 1,000.00 | | | | 1,022.76 | | | | 2.06 | | | | .41 | | |
| Class R-6 – actual return | | | 1,000.00 | | | | 1,045.55 | | | | 1.57 | | | | .31 | | |
| Class R-6 – assumed 5% return | | | 1,000.00 | | | | 1,023.26 | | | | 1.56 | | | | .31 | | |
See end of expense examples tables for footnote.
| 78 | American Funds Tax-Exempt Funds |
American High-Income Municipal Bond Fund
| | | Beginning
account value
2/1/2014 | | Ending
account value
7/31/2014 | | Expenses paid
during period* | | Annualized
expense ratio | |
| Class A – actual return | | $ | 1,000.00 | | | $ | 1,065.55 | | | $ | 3.43 | | | | .67 | % | |
| Class A – assumed 5% return | | | 1,000.00 | | | | 1,021.47 | | | | 3.36 | | | | .67 | | |
| Class B – actual return | | | 1,000.00 | | | | 1,061.81 | | | | 7.11 | | | | 1.39 | | |
| Class B – assumed 5% return | | | 1,000.00 | | | | 1,017.90 | | | | 6.95 | | | | 1.39 | | |
| Class C – actual return | | | 1,000.00 | | | | 1,061.50 | | | | 7.36 | | | | 1.44 | | |
| Class C – assumed 5% return | | | 1,000.00 | | | | 1,017.65 | | | | 7.20 | | | | 1.44 | | |
| Class F-1 – actual return | | | 1,000.00 | | | | 1,065.11 | | | | 3.84 | | | | .75 | | |
| Class F-1 – assumed 5% return | | | 1,000.00 | | | | 1,021.08 | | | | 3.76 | | | | .75 | | |
| Class F-2 – actual return | | | 1,000.00 | | | | 1,066.48 | | | | 2.51 | | | | .49 | | |
| Class F-2 – assumed 5% return | | | 1,000.00 | | | | 1,022.36 | | | | 2.46 | | | | .49 | | |
| Class R-6 – actual return | | | 1,000.00 | | | | 1,067.03 | | | | 2.00 | | | | .39 | | |
| Class R-6 – assumed 5% return | | | 1,000.00 | | | | 1,022.86 | | | | 1.96 | | | | .39 | | |
The Tax-Exempt Fund of California
| | | Beginning
account value
2/1/2014 | | Ending
account value
7/31/2014 | | Expenses paid
during period* | | Annualized
expense ratio | |
| Class A – actual return | | $ | 1,000.00 | | | $ | 1,048.41 | | | $ | 3.20 | | | | .63 | % | |
| Class A – assumed 5% return | | | 1,000.00 | | | | 1,021.67 | | | | 3.16 | | | | .63 | | |
| Class B – actual return | | | 1,000.00 | | | | 1,044.63 | | | | 6.89 | | | | 1.36 | | |
| Class B – assumed 5% return | | | 1,000.00 | | | | 1,018.05 | | | | 6.80 | | | | 1.36 | | |
| Class C – actual return | | | 1,000.00 | | | | 1,044.38 | | | | 7.20 | | | | 1.42 | | |
| Class C – assumed 5% return | | | 1,000.00 | | | | 1,017.75 | | | | 7.10 | | | | 1.42 | | |
| Class F-1 – actual return | | | 1,000.00 | | | | 1,047.78 | | | | 3.81 | | | | .75 | | |
| Class F-1 – assumed 5% return | | | 1,000.00 | | | | 1,021.08 | | | | 3.76 | | | | .75 | | |
| Class F-2 – actual return | | | 1,000.00 | | | | 1,049.08 | | | | 2.54 | | | | .50 | | |
| Class F-2 – assumed 5% return | | | 1,000.00 | | | | 1,022.32 | | | | 2.51 | | | | .50 | | |
American Funds Tax-Exempt Fund of New York
| | | Beginning
account value
2/1/2014 | | Ending
account value
7/31/2014 | | Expenses paid
during period* | | Annualized
expense ratio | |
| Class A – actual return | | $ | 1,000.00 | | | $ | 1,044.67 | | | $ | 3.19 | | | | .63 | % | |
| Class A – assumed 5% return | | | 1,000.00 | | | | 1,021.67 | | | | 3.16 | | | | .63 | | |
| Class B – actual return | | | 1,000.00 | | | | 1,040.49 | | | | 7.29 | | | | 1.44 | | |
| Class B – assumed 5% return | | | 1,000.00 | | | | 1,017.65 | | | | 7.20 | | | | 1.44 | | |
| Class C – actual return | | | 1,000.00 | | | | 1,040.15 | | | | 7.64 | | | | 1.51 | | |
| Class C – assumed 5% return | | | 1,000.00 | | | | 1,017.31 | | | | 7.55 | | | | 1.51 | | |
| Class F-1 – actual return | | | 1,000.00 | | | | 1,044.40 | | | | 3.45 | | | | .68 | | |
| Class F-1 – assumed 5% return | | | 1,000.00 | | | | 1,021.42 | | | | 3.41 | | | | .68 | | |
| Class F-2 – actual return | | | 1,000.00 | | | | 1,045.00 | | | | 2.89 | | | | .57 | | |
| Class F-2 – assumed 5% return | | | 1,000.00 | | | | 1,021.97 | | | | 2.86 | | | | .57 | | |
| * | The “expenses paid during period” are equal to the “annualized expense ratio,” multiplied by the average account value over the period, multiplied by the number of days in the period, and divided by 365 (to reflect the one-half year period). |
| American Funds Tax-Exempt Funds | 79 |
We are required to advise you of the federal tax status of certain distributions received by shareholders during the fiscal year. We hereby designate the following amounts for the year ended July 31, 2014:
| Fund | Exempt interest dividends |
| American Funds Short-Term Tax-Exempt Bond Fund | 100 | % | |
| Limited Term Tax-Exempt Bond Fund of America | 100 | | |
| The Tax-Exempt Bond Fund of America | 100 | | |
| American High-Income Municipal Bond Fund | 100 | | |
| The Tax-Exempt Fund of California | 100 | | |
| American Funds Tax-Exempt Fund of New York | 100 | | |
Individual shareholders should refer to their Form 1099 or other tax information, which will be mailed in January 2015, to determine the calendar year amounts to be included on their 2014 tax returns. Shareholders should consult their tax advisors.
| 80 | American Funds Tax-Exempt Funds |
Approval of Investment Advisory and Service Agreement
American Funds Short-Term Tax-Exempt Bond Fund, Limited Term Tax-Exempt Bond Fund of America, The Tax-Exempt Bond Fund of America, American High-Income Municipal Bond Fund, The Tax-Exempt Fund of California, American Funds Tax-Exempt Fund of New York
The boards of American Funds Short-Term Tax-Exempt Bond Fund, Limited Term Tax-Exempt Bond Fund of America, The Tax-Exempt Bond Fund of America, American High-Income Municipal Bond Fund, The Tax-Exempt Fund of California and American Funds Tax-Exempt Fund of New York (the “board”) have approved each fund’s Investment Advisory and Service Agreement (the “agreement”) with Capital Research and Management Company (“CRMC”) for an additional one-year term through March 31, 2015. The board approved the agreement following the recommendation of each fund’s Contracts Committee (the “committee”), which is composed of each fund’s independent board members. The board and the committee determined that each fund’s advisory fee structure was fair and reasonable in relation to the services provided and that approving the agreement was in the best interests of each fund and its shareholders.
In reaching this decision, the board and the committee took into account information furnished to them throughout the year and otherwise provided to them, as well as information prepared specifically in connection with their review of the agreements, and were advised by their independent counsel. They considered the following factors, among others, but did not identify any single issue or particular piece of information that, in isolation, was the controlling factor, and each board and committee member did not necessarily attribute the same weight to each factor.
1. Nature, extent and quality of services
The board and the committee considered the depth and quality of CRMC’s investment management process, including its global research capabilities; the experience, capability and integrity of its senior management and other personnel; the low turnover rates of its key personnel; the overall financial strength and stability of its organization; and the ongoing evolution of CRMC’s organizational structure designed to maintain and strengthen these qualities. The board and the committee also considered the nature, extent and quality of administrative, compliance and shareholder services provided by CRMC to the funds under each fund’s agreement and other agreements, as well as the benefits to each fund’s shareholders from investing in a fund that is part of a large family of funds. The board and the committee concluded that the nature, extent and quality of the services provided by CRMC have benefited and should continue to benefit each fund and its shareholders.
2. Investment results
The board and the committee considered the investment results of each fund in light of its objective. They compared each fund’s investment results with those of other relevant funds (including funds that form the basis of the Lipper index for the category in which the fund is included), and data such as relevant market and fund indexes, over various periods through September 30, 2013. This report, including the letter to shareholders and related disclosures, contains certain information about each fund’s investment results.
American Funds Short-Term Tax-Exempt Bond Fund seeks to provide current income that is exempt from regular federal income tax, consistent with the maturity and quality standards described in the prospectus, and to preserve capital. The board and the committee reviewed the fund’s investment results measured against the Lipper Short Municipal Debt Funds Average and the Barclays Municipal Short 1-5 Years Index. They noted that the investment results for the fund were above the results of the Lipper average over the 9-month, one-year, three-year and lifetime periods, while below those of the Barclays index for those periods.
Limited Term Tax-Exempt Bond Fund of America seeks to provide current income that is exempt from regular federal income tax, consistent with the maturity and quality standards described in the prospectus, and to preserve capital. The board and the committee reviewed the fund’s investment results measured against the Lipper Intermediate Municipal Debt Funds Average and the Barclays Municipal Short-Intermediate 1-10 Years Index. They noted that the investment results for the fund were equal to or above the results of the Lipper average for the 9-month, one-, three- and 10-year periods (although below the results of the average for the five-year and lifetime periods), and were below the results of the Barclays index for all periods shown other than the three-year and five-year periods.
| American Funds Tax-Exempt Funds | 81 |
Approval of Investment Advisory and Service Agreement (continued)
The Tax-Exempt Bond Fund of America seeks to provide a high level of current income exempt from federal income tax, consistent with the preservation of capital. The board and the committee reviewed the fund’s investment results measured against the Lipper General & Insured Municipal Debt Funds Average and the Barclays Municipal Bond Index. They noted that the investment results for the fund were above the results of the Lipper average for all periods considered, and were above the results of the Barclays index for the one-year and three-year periods (although below the results of the index for the 9-month, five-year and 10-year periods).
American High-Income Municipal Bond Fund seeks to provide a high level of current income exempt from regular federal income tax. The board and the committee reviewed the fund’s investment results measured against the Lipper High-Yield Municipal Debt Funds Average and the Barclays High Yield Municipal Bond Index. They noted that the investment results for the fund were above the results of the Lipper average for all periods shown, while below those of the Barclays index for all periods other than the 9-month period.
The Tax-Exempt Fund of California seeks to provide a high level of current income exempt from regular federal and California income taxes, with a secondary objective of preservation of capital. The board and the committee reviewed the fund’s investment results measured against the Lipper California Municipal Debt Funds Average and the Barclays California Municipal Bond Index. They noted that the investment results for the fund were above the results of the Lipper average for all periods considered, and were above the results of the Barclays index for the three- and five-year periods (although below the results of the Barclays index for the 9-month, one-year and 10-year periods).
American Funds Tax-Exempt Fund of New York seeks to provide a high level of current income exempt from regular federal, New York state and New York City income taxes, with a secondary objective of preservation of capital. The board and the committee reviewed the fund’s investment results measured against the Lipper New York Municipal Debt Funds Average and the Barclays New York Municipal Bond Index. They noted that the investment results for the fund were above the results of the Lipper average for all periods considered, while below those of the Barclays index for all periods other than the lifetime period.
The board and the committee concluded that each fund’s investment results have been satisfactory and that CRMC’s record in managing the funds indicated that its continued management should benefit the funds and their shareholders.
| 82 | American Funds Tax-Exempt Funds |
3. Advisory fees and total expenses
The board and the committee compared the advisory fees and total expense levels of each fund to those of other relevant funds. They observed that each fund’s advisory fees and expenses were below the median fees and expenses of the other funds included in its Lipper category described above. The board and the committee also considered the breakpoint discounts in each fund’s advisory fee structure that reduce the level of fees charged by CRMC to the fund as fund assets increase. In addition, they reviewed information regarding the effective advisory fees charged to non-mutual fund clients by CRMC and its affiliates. They noted that, to the extent there were differences between the advisory fees paid by each fund and the advisory fees paid by those clients, the differences appropriately reflected the investment, operational and regulatory differences between advising the fund and the other clients. The board and the committee concluded that each fund’s cost structure was fair and reasonable in relation to the services provided, and that each fund’s shareholders receive reasonable value in return for the advisory fees and other amounts paid to CRMC by the funds.
4. Ancillary benefits
The board and the committee considered a variety of other benefits that CRMC and its affiliates receive as a result of CRMC’s relationship with each fund and the other American Funds, including fees for administrative services provided to certain share classes; fees paid to CRMC’s affiliated transfer agent; sales charges and distribution fees received and retained by the fund’s principal underwriter, an affiliate of CRMC; and possible ancillary benefits to CRMC and its institutional management affiliates in managing other investment vehicles. The board and the committee reviewed CRMC’s portfolio trading practices, noting that while CRMC receives the benefit of research provided by broker-dealers executing portfolio transactions on behalf of each fund, it does not obtain third-party research or other services in return for allocating brokerage to such broker-dealers. The board and the committee took these ancillary benefits into account in evaluating the reasonableness of the advisory fees and other amounts paid to CRMC by each fund.
| American Funds Tax-Exempt Funds | 83 |
Approval of Investment Advisory and Service Agreement (continued)
5. Adviser financial information
The board and the committee reviewed information regarding CRMC’s costs of providing services to the American Funds, including personnel, systems and resources of investment, compliance, trading, accounting and other administrative operations. They considered CRMC’s costs and willingness to invest in technology, infrastructure and staff to maintain and expand services and capabilities, respond to industry and regulatory developments, and attract and retain qualified personnel. They noted information regarding the compensation structure for CRMC’s investment professionals. The board and the committee also compared CRMC’s profitability and compensation data to the reported results and data of several large, publicly held investment management companies. The board and the committee noted the competitiveness and cyclicality of both the mutual fund industry and the capital markets, and the importance in that environment of CRMC’s long-term profitability for maintaining its independence, company culture and management continuity. They further considered the breakpoint discounts in each fund’s advisory fee structure. The board and the committee concluded that each fund’s advisory fee structure reflected a reasonable sharing of benefits between CRMC and each fund’s shareholders.
| 84 | American Funds Tax-Exempt Funds |
Boards of trustees and other officers
“Independent” trustees1
| Name and age | Year first
elected
a trustee
of the fund2 | | Principal occupation(s) during past five years | | Number of
portfolios in fund
complex overseen
by trustee | | Other directorships3
held by trustee |
| William H. Baribault, 69 | | STEX | | 2010 | | CEO and President, Richard Nixon Foundation; | | 70 | | None |
| | | LTEX | | 2010 | | former Chairman of the Board and CEO, | | | | |
| | | TEBF | | 2010 | | Oakwood Enterprises (private investment | | | | |
| | | AHIM | | 2010 | | and consulting) | | | | |
| | | TEFCA | | 2010 | | | | | | |
| | | TEFNY | | 2010 | | | | | | |
| James G. Ellis, 67 | | STEX | | 2009 | | Dean and Professor of Marketing, Marshall | | 70 | | Mercury General Corp. |
| | | LTEX | | 2006 | | School of Business, University of Southern | | | | |
| | | TEBF | | 2006 | | California | | | | |
| | | AHIM | | 2006 | | | | | | |
| | | TEFCA | | 2006 | | | | | | |
| | | TEFNY | | 2010 | | | | | | |
| Leonard R. Fuller, 68 | | STEX | | 1995 | | President and CEO, Fuller Consulting (financial | | 70 | | None |
| | | LTEX | | 1994 | | management consulting firm) | | | | |
| | | TEBF | | 1994 | | | | | | |
| | | AHIM | | 1994 | | | | | | |
| | | TEFCA | | 1994 | | | | | | |
| | | TEFNY | | 2010 | | | | | | |
| R. Clark Hooper, 68 | | STEX | | 2005 | | Private investor | | 72 | | The Swiss Helvetia |
| Chairman of the Boards | | LTEX | | 2005 | | | | | | Fund, Inc. |
| (Independent and Non- | | TEBF | | 2005 | | | | | | |
| Executive) | | AHIM | | 2005 | | | | | | |
| | | TEFCA | | 2005 | | | | | | |
| | | TEFNY | | 2010 | | | | | | |
| Merit E. Janow, 56 | | STEX | | 2010 | | Dean and Professor, Columbia University, | | 69 | | MasterCard |
| | | LTEX | | 2010 | | School of International and Public Affairs | | | | Incorporated; |
| | | TEBF | | 2010 | | | | | | The NASDAQ Stock |
| | | AHIM | | 2010 | | | | | | Market LLC; |
| | | TEFCA | | 2009 | | | | | | Trimble Navigation |
| | | TEFNY | | 2010 | | | | | | Limited |
| Laurel B. Mitchell, Ph.D., 59 | | STEX | | 2009 | | Clinical Professor and Director, Accounting | | 66 | | None |
| | | LTEX | | 2010 | | Program, University of Redlands | | | | |
| | | TEBF | | 2010 | | | | | | |
| | | AHIM | | 2010 | | | | | | |
| | | TEFCA | | 2010 | | | | | | |
| | | TEFNY | | 2010 | | | | | | |
| Frank M. Sanchez, 70 | | STEX | | 1999 | | Principal, The Sanchez Family Corporation dba | | 66 | | None |
| | | LTEX | | 1999 | | McDonald’s Restaurants (McDonald’s licensee) | | | | |
| | | TEBF | | 1999 | | | | | | |
| | | AHIM | | 1999 | | | | | | |
| | | TEFCA | | 1999 | | | | | | |
| | | TEFNY | | 2010 | | | | | | |
| Margaret Spellings, 56 | | STEX | | 2009 | | President, George W. Bush Foundation; former | | 70 | | None |
| | | LTEX | | 2010 | | President and CEO, Margaret Spellings & | | | | |
| | | TEBF | | 2010 | | Company (public policy and strategic consulting); | | | | |
| | | AHIM | | 2010 | | former President, U.S. Chamber Foundation and | | | | |
| | | TEFCA | | 2010 | | Senior Advisor to the President and CEO, U.S. | | | | |
| | | TEFNY | | 2010 | | Chamber of Commerce; former U.S. Secretary | | | | |
| | | | | of Education, U.S. Department of Education | | | | |
See page 87 for footnotes.
| American Funds Tax-Exempt Funds | 85 |
“Independent” trustees1 (continued)
| Name and age | Year first
elected
a trustee
of the fund2 | | Principal occupation(s) during past five years | | Number of
portfolios in fund
complex overseen
by trustee | | Other directorships3
held by trustee |
| Steadman Upham, Ph.D., 65 | | STEX | | 2009 | | President and University Professor, The | | 69 | | None |
| | | LTEX | | 2007 | | University of Tulsa | | | | |
| | | TEBF | | 2007 | | | | | | |
| | | AHIM | | 2007 | | | | | | |
| | | TEFCA | | 2007 | | | | | | |
| | | TEFNY | | 2010 | | | | | | |
We are saddened by the loss of W. Scott Hedrick who passed away on November 3, 2013. Mr. Hedrick served as an independent board member on the boards of various American Funds since 2007. His wise counsel and friendship will be missed.
“Interested” trustee4
Name, age and
position with fund | Year first
elected
a trustee
or officer
of the fund2 | | Principal occupation(s) during past five years
and positions held with affiliated entities or
the principal underwriter of the fund | | Number of
portfolios in fund
complex overseen
by trustee | | Other directorships3
held by trustee |
| Karl J. Zeile, 47 | | STEX | | 2011 | | Director, Capital Research and Management | | 6 | | None |
| Vice Chairman of the Board: | | LTEX | | 2004 | | Company; Senior Vice President – Capital | | | | |
| STEX | | TEBF | | 2009 | | Fixed Income Investors, Capital Research | | | | |
| Vice Chairman of the Board | | AHIM | | 2008 | | and Management Company | | | | |
| and President: AHIM, TEFNY | | TEFCA | | 2009 | | | | | | |
| Vice Chairman of the Board | | TEFNY | | 2010 | | | | | | |
| and Vice President: LTEX, TEBF, TEFCA | | | | | | | | | | |
| | | | | | | | | | |
| Other officers5 |
| | | | | | | | | | | |
Name, age and
position with fund | Year first
elected
an officer
of the fund2 | | Principal occupation(s) during past five years and positions held with affiliated entities
or the principal underwriter of the fund |
| Brenda S. Ellerin, 51 | | STEX | | 2009 | | Senior Vice President – Capital Fixed Income Investors, Capital Research and Management |
| President: STEX, LTEX | | LTEX | | 1997 | | Company |
| Senior Vice President: TEBF | | TEBF | | 1999 | | |
| Neil L. Langberg, 61 | | STEX | | 1989 | | Senior Vice President – Capital Fixed Income Investors, Capital Research and Management Company; Senior Vice President – Capital Fixed Income Investors, Capital Guardian Trust Company6 |
| President: TEBF, TEFCA | | LTEX | | 1993 | |
| Senior Vice President: STEX, | | TEBF | | 1985 | |
| LTEX, AHIM | | AHIM | | 1994 | | | | | | |
| | | TEFCA | | 1986 | | |
| Kristine M. Nishiyama, 44 | | STEX | | 2003 | | Senior Vice President and Senior Counsel – Fund Business Management Group, Capital Research and Management Company; Senior Vice President and General Counsel, Capital Bank and Trust Company6 |
| Senior Vice President | | LTEX | | 2003 | |
| | | TEBF | | 2003 | |
| | | AHIM | | 2003 | |
| | | TEFCA | | 2003 | | |
| | | TEFNY | | 2010 | | |
| Jerome H. Solomon, 51 | | TEFNY | | 2011 | | Vice President – Capital Fixed Income Investors, Capital Research Company6 |
| Vice President | | | | | | |
| 86 | American Funds Tax-Exempt Funds |
Name, age and
position with fund | Year first
elected
an officer
of the fund2 | | Principal occupation(s) during past five years and positions held with affiliated entities
or the principal underwriter of the fund |
| Courtney R. Taylor, 39 | | STEX | | 2006 | | Assistant Vice President – Fund Business Management Group, Capital Research and Management Company |
| Secretary | | LTEX | | 2006 | |
| | | TEBF | | 2006 | | |
| | | AHIM | | 2006 | | |
| | | TEFCA | | 2006 | | |
| | | TEFNY | | 2010 | | |
| Karl C. Grauman, 46 | | STEX | | 2010 | | Vice President – Investment Operations, Capital Research and Management Company |
| Treasurer: TEBF, TEFCA, | | LTEX | | 2012 | | |
| TEFNY | | TEBF | | 2010 | | |
| Assistant Treasurer: STEX, | | AHIM | | 2012 | | |
| LTEX, AHIM | | TEFCA | | 2010 | | |
| | | TEFNY | | 2010 | | |
| Dori Laskin, 63 | | STEX | | 2010 | | Vice President – Investment Operations, Capital Research and Management Company |
| Treasurer: STEX, LTEX, | | LTEX | | 2010 | |
| AHIM | | TEBF | | 2010 | | |
| Assistant Treasurer: TEBF, | | AHIM | | 2010 | | |
| TEFCA, TEFNY | | TEFCA | | 2010 | | |
| | | TEFNY | | 2010 | | |
| Steven I. Koszalka, 50 | | STEX | | 2010 | | Vice President – Fund Business Management Group, Capital Research and Management Company |
| Assistant Secretary | | LTEX | | 2010 | |
| | | TEBF | | 2010 | | |
| | | AHIM | | 2010 | | |
| | | TEFCA | | 2010 | | |
| | | TEFNY | | 2010 | | |
| Brian C. Janssen, 42 | | TEBF | | 2012 | | Vice President – Investment Operations, Capital Research and Management Company |
| Assistant Treasurer | | TEFCA | | 2012 | |
| | | TEFNY | | 2012 | | |
| STEX | American Funds Short-Term Tax-Exempt Bond Fund |
| LTEX | Limited Term Tax-Exempt Bond Fund of America |
| TEBF | The Tax-Exempt Bond Fund of America |
| AHIM | American High-Income Municipal Bond Fund |
| TEFCA | The Tax-Exempt Fund of California |
| TEFNY | American Funds Tax-Exempt Fund of New York |
The funds’ statement of additional information includes further details about fund trustees and is available without charge upon request by calling American Funds Service Company at (800) 421-4225 or by visiting the American Funds website at americanfunds.com. The address for all trustees and officers of the funds is 333 South Hope Street, Los Angeles, CA 90071, Attention: Secretary.
| 1 | The term “independent” trustee refers to a trustee who is not an “interested person” of the funds within the meaning of the Investment Company Act of 1940. |
| 2 | Includes service as a director/trustee or officer of the fund’s predecessor, The Tax-Exempt Bond Fund of America, Inc. or American High-Income Municipal Bond Fund, Inc., each a Maryland corporation, or Limited Term Tax-Exempt Bond Fund of America or The Tax-Exempt Fund of California, each a Massachusetts business trust. Trustees and officers of the funds serve until their resignation, removal or retirement. |
| 3 | This includes all directorships (other than those in the American Funds or other funds managed by Capital Research and Management Company or its affiliates) that are held by each trustee as a trustee or director of a public company or a registered investment company. |
| 4 | The term “interested” trustee refers to a trustee who is an “interested person” within the meaning of the Investment Company Act of 1940, on the basis of their current or former affiliation with the funds’ investment adviser, Capital Research and Management Company, or affiliated entities (including the funds’ principal underwriter). |
| 5 | All of the officers listed are officers and/or directors/trustees of one or more of the other funds for which Capital Research and Management Company serves as investment adviser. |
| 6 | Company affiliated with Capital Research and Management Company. |
| American Funds Tax-Exempt Funds | 87 |
| Offices of the funds and of the investment adviser |
|
| Capital Research and Management Company |
| 333 South Hope Street |
| Los Angeles, CA 90071-1406 |
| |
| 6455 Irvine Center Drive |
| Irvine, CA 92618-4518 |
| |
| One Market |
| Steuart Tower, Suite 2000 |
| San Francisco, CA 94105-1409 |
| |
| Transfer agent for shareholder accounts |
| American Funds Service Company |
| (Write to the address near you.) |
| |
| P.O. Box 6007 |
| Indianapolis, IN 46206-6007 |
| |
| P.O. Box 2280 |
| Norfolk, VA 23501-2280 |
| |
| Counsel |
| Bingham McCutchen LLP |
| 355 South Grand Avenue, Suite 4400 |
| Los Angeles, CA 90071-3106 |
| |
| Custodians of assets |
| Bank of New York Mellon |
| One Wall Street |
| New York, NY 10286 |
| |
| JPMorgan Chase Bank |
| 270 Park Avenue |
| New York, NY 10017-2070 |
| |
| Independent registered public accounting firm |
| PricewaterhouseCoopers LLP |
| 601 South Figueroa Street |
| Los Angeles, CA 90017-3874 |
| |
| Principal underwriter |
| American Funds Distributors, Inc. |
| 333 South Hope Street |
| Los Angeles, CA 90071-1406 |
Investors should carefully consider investment objectives, risks, charges and expenses. This and other important information is contained in the funds’ prospectus and summary prospectus, which can be obtained from your financial professional and should be read carefully before investing. You may also call American Funds Service Company (AFS) at (800) 421-4225 or visit the American Funds website at americanfunds.com.
“American Funds Proxy Voting Procedures and Principles” – which describes how we vote proxies relating to portfolio securities – is available on the American Funds website or upon request by calling AFS. Each fund files its proxy voting record with the U.S. Securities and Exchange Commission (SEC) for the 12 months ended June 30 by August 31. The proxy voting record is available free of charge on the SEC website at sec. gov and on the American Funds website.
Complete July 31, 2014, portfolios of American Funds Short-Term Tax-Exempt Bond Fund, Limited Term Tax-Exempt Bond Fund of America, The Tax-Exempt Bond Fund of America, American High-Income Municipal Bond Fund and The Tax-Exempt Fund of California’s investments are available free of charge by calling AFS or visiting the SEC website (where they are part of Form N-CSR).
American Funds Short-Term Tax-Exempt Bond Fund, Limited Term Tax-Exempt Bond Fund of America, The Tax-Exempt Bond Fund of America, American High-Income Municipal Bond Fund, The Tax-Exempt Fund of California and American Funds Tax-Exempt Fund of New York file a complete list of their portfolio holdings with the SEC for the first and third quarters of each fiscal year on Form N-Q. This filing is available free of charge on the SEC website. You may also review or, for a fee, copy this filing at the SEC’s Public Reference Room in Washington, D.C. Additional information regarding the operation of the Public Reference Room may be obtained by calling the SEC’s Office of Investor Education and Advocacy at (800) SEC-0330. Additionally, the list of portfolio holdings is available by calling AFS.
This report is for the information of shareholders of American Funds Short-Term Tax-Exempt Bond Fund, Limited Term Tax-Exempt Bond Fund of America, The Tax-Exempt Bond Fund of America, American High-Income Municipal Bond Fund, The Tax-Exempt Fund of California and American Funds Tax-Exempt Fund of New York, but it also may be used as sales literature when preceded or accompanied by the current prospectus or summary prospectus, which gives details about charges, expenses, investment objectives and operating policies of the funds. If used as sales material after September 30, 2014, this report must be accompanied by an American Funds statistical update for the most recently completed calendar quarter.
| 88 | American Funds Tax-Exempt Funds |
The American Funds Advantage
Since 1931, American Funds, part of Capital Group, has helped investors pursue long-term investment success. Our consistent approach – in combination with The Capital SystemSM – has resulted in a superior long-term track record.
Aligned with investor success
We base our decisions on a long-term perspective, which we believe aligns our goals with the interests of our clients. Our portfolio managers average 26 years of investment experience, including 21 years at our company, reflecting a career commitment to our long-term approach.1
The Capital SystemSM
Our investment process, The Capital System, combines individual accountability with teamwork. Each fund is divided into portions that are managed independently by investment professionals with diverse backgrounds, ages and investment approaches. An extensive global research effort is the backbone of our system.
Superior long-term track record
Our equity funds have beaten their Lipper peer indexes in 90% of 10-year periods and 96% of 20-year periods. Our fixed-income funds have beaten their Lipper indexes in 56% of 10-year periods and 57% of 20-year periods.2 Our fund management fees have been among the lowest in the industry.3
| 1 | Portfolio manager experience as of December 31, 2013. |
| 2 | Based on Class A share results for rolling periods through December 31, 2013. Periods covered are the shorter of the fund’s lifetime or since the comparable Lipper index inception date (except SMALLCAP World Fund, for which the Lipper average was used). |
| 3 | Based on management fees for the 20-year period ended December 31, 2013, versus comparable Lipper categories, excluding funds of funds. |

ITEM 2 – Code of Ethics
The Registrant has adopted a Code of Ethics that applies to its Principal Executive Officer and Principal Financial Officer. The Registrant undertakes to provide to any person without charge, upon request, a copy of the Code of Ethics. Such request can be made to American Funds Service Company at 800/421-9225 or to the Secretary of the Registrant, 333 South Hope Street, Los Angeles, California 90071.
ITEM 3 – Audit Committee Financial Expert
The Registrant’s board has determined that Laurel B. Mitchell, a member of the Registrant’s audit committee, is an “audit committee financial expert” and "independent," as such terms are defined in this Item. This designation will not increase the designee’s duties, obligations or liability as compared to his or her duties, obligations and liability as a member of the audit committee and of the board, nor will it reduce the responsibility of the other audit committee members. There may be other individuals who, through education or experience, would qualify as "audit committee financial experts" if the board had designated them as such. Most importantly, the board believes each member of the audit committee contributes significantly to the effective oversight of the Registrant’s financial statements and condition.
ITEM 4 – Principal Accountant Fees and Services
| | Registrant: |
| | | a) Audit Fees: |
| | | | 2013 | $86,000 |
| | | | 2014 | $88,000 |
| | | | |
| | | b) Audit-Related Fees: |
| | | | 2013 | None |
| | | | 2014 | None |
| | | | |
| | | c) Tax Fees: |
| | | | 2013 | $0 |
| | | | 2014 | $15,000 |
| | | | The tax fees consist of professional services relating to the preparation of the Registrant’s tax returns. |
| | | | |
| | | d) All Other Fees: |
| | | | 2013 | None |
| | | | 2014 | None |
| | | | |
| | Adviser and affiliates (includes only fees for non-audit services billed to the adviser and affiliates for engagements that relate directly to the operations and financial reporting of the Registrant and were subject to the pre-approval policies described below): |
| | | a) Audit Fees: |
| | | | Not Applicable |
| | | | |
| | | b) Audit-Related Fees: |
| | | | 2013 | None |
| | | | 2014 | None |
| | | | |
| | | c) Tax Fees: |
| | | | 2013 | $24,000 |
| | | | 2014 | $52,000 |
| | | | The tax fees consist of consulting services relating to the Registrant’s investments. |
| | | | |
| | | d) All Other Fees: |
| | | | 2013 | $2,000 |
| | | | 2014 | $2,000 |
| | | | The other fees consist of subscription services related to an accounting research tool. |
| | | | |
All audit and permissible non-audit services that the Registrant’s audit committee considers compatible with maintaining the independent registered public accounting firm’s independence are required to be pre-approved by the committee. The pre-approval requirement will extend to all non-audit services provided to the Registrant, the investment adviser, and any entity controlling, controlled by, or under common control with the investment adviser that provides ongoing services to the Registrant, if the engagement relates directly to the operations and financial reporting of the Registrant. The committee will not delegate its responsibility to pre-approve these services to the investment adviser. The committee may delegate to one or more committee members the authority to review and pre-approve audit and permissible non-audit services. Actions taken under any such delegation will be reported to the full committee at its next meeting. The pre-approval requirement is waived with respect to non-audit services if certain conditions are met. The pre-approval requirement was not waived for any of the non-audit services listed above provided to the Registrant, adviser and affiliates.
Aggregate non-audit fees paid to the Registrant’s auditors, including fees for all services billed to the Registrant, adviser and affiliates that provide ongoing services to the Registrant, were $26,000 for fiscal year 2013 and $69,000 for fiscal year 2014. The non-audit services represented by these amounts were brought to the attention of the committee and considered to be compatible with maintaining the auditors’ independence.
ITEM 5 – Audit Committee of Listed Registrants
Not applicable to this Registrant, insofar as the Registrant is not a listed issuer as defined in Rule 10A-3 under the Securities Exchange Act of 1934.
ITEM 6 – Schedule of Investments
The Tax-Exempt Bond Fund of America®
Investment portfolio
July 31, 2014
Bonds, notes & other debt instruments 89.87%
Alabama 0.99% | Principal amount
(000) | Value
(000) |
| Federal Aid Highway Fin. Auth., Federal Highway Grant Anticipation Bonds, Series 2012, 5.00% 2021 | $10,000 | $11,826 |
| Federal Aid Highway Fin. Auth., Federal Highway Grant Anticipation Bonds, Series 2012, 5.00% 2025 | 12,000 | 13,849 |
| Federal Aid Highway Fin. Auth., Federal Highway Grant Anticipation Bonds, Series 2012, 5.00% 2026 | 10,470 | 11,937 |
| Incentives Fncg. Auth., Special Obligation Bonds, Series 2009-C, 5.00% 2024 | 2,375 | 2,660 |
| Incentives Fncg. Auth., Special Obligation Bonds, Series 2009-C, 5.00% 2029 | 1,250 | 1,391 |
| Jefferson County, Sewer Rev. Warrants, Series 2013-A, Assured Guaranty Municipal insured, 5.00% 2044 | 11,355 | 11,884 |
| Jefferson County, Sewer Rev. Warrants, Series 2013-A, Assured Guaranty Municipal insured, 5.25% 2048 | 4,500 | 4,787 |
| Jefferson County, Sewer Rev. Warrants, Series 2013-D, 6.00% 2042 | 4,750 | 5,182 |
| Jefferson County, Sewer Rev. Warrants, Series 2013-D, 6.50% 2053 | 13,000 | 14,717 |
| Jefferson County, Sewer Rev. Warrants, Series 2013-D, 7.00% 2051 | 1,500 | 1,760 |
| City of Mobile Industrial Dev. Board, Pollution Control Rev. Bonds (Alabama Power Co. Barry Plant Project), Series 2007-C, 5.00% 2034 (put 2015) | 3,000 | 3,082 |
| Industrial Dev. Board. of the City of Selma, Gulf Opportunity Zone Bonds (International Paper Co. Project), Series 2011-A, 5.375% 2035 | 4,000 | 4,385 |
Special Care Facs. Fncg. Auth. of the City of Pell City, Rev. Ref. Bonds (Noland Health Services, Inc.),
Series 2012-A, 5.00% 2039 | 3,200 | 3,345 |
Board of Trustees of the University of Alabama, Birmingham Hospital Rev. Ref. Bonds,
Series 2008-A, 5.25% 2025 | 1,000 | 1,085 |
| | | 91,890 |
| Alaska 0.08% | | |
| City of Anchorage, Lease Rev. Ref. Bonds, Correctional Fac., Assured Guaranty Municipal insured, 5.00% 2016 | 870 | 891 |
| City of Anchorage, Lease Rev. Ref. Bonds, Correctional Fac., Assured Guaranty Municipal insured, 5.00% 2016 (preref. 2015) | 1,165 | 1,193 |
| Municipality of Anchorage, Municipal Light & Power Electric Rev. Ref. Bonds, Series 1996, National insured, 6.50% 2014 | 5,000 | 5,102 |
| | | 7,186 |
| Arizona 2.99% | | |
| Board of Regents, University of Arizona SPEED Rev. Bonds (Stimulus Plan for Econ. and Educational Dev.), Series 2014, 5.00% 2033 | 1,000 | 1,123 |
| Health Facs. Auth., Rev. Ref. Bonds (Phoenix Children’s Hospital), Series 2013-A-1, 1.91% 2048 (put 2020)1 | 4,000 | 3,981 |
| Certs. of Part., Series 2010-A, Assured Guaranty Municipal insured, 5.00% 2015 | 5,365 | 5,667 |
| Certs. of Part., Series 2010-A, Assured Guaranty Municipal insured, 5.25% 2025 | 2,500 | 2,805 |
Estrella Mountain Ranch Community Facs. Dist. (City of Goodyear), Dist. G.O. Bonds,
Series 2007, 6.125% 2027 | 660 | 696 |
Estrella Mountain Ranch Community Facs. Dist. (City of Goodyear), Dist. G.O. Bonds,
Series 2007, 6.20% 2032 | 1,000 | 1,049 |
| City of Glendale, Water and Sewer Rev. Ref. Obligations, Series 2012, 5.00% 2027 | 1,500 | 1,696 |
| Industrial Dev. Auth. of the City of Glendale, Rev. Bonds (Midwestern University), Series 2010, 5.00% 2025 | 1,000 | 1,081 |
| Industrial Dev. Auth. of the City of Glendale, Rev. Bonds (Midwestern University), Series 2010, 5.00% 2035 | 3,130 | 3,303 |
| Industrial Dev. Auth. of the City of Glendale, Rev. Bonds (Midwestern University), Series 2010, 5.125% 2040 | 6,215 | 6,561 |
Industrial Dev. Auth. of the City of Glendale, Rev. Ref. Bonds (Midwestern University),
Series 2007, 5.00% 2023 | 3,725 | 4,210 |
Industrial Dev. Auth. of the City of Glendale, Rev. Ref. Bonds (Midwestern University),
Series 2007, 5.00% 2024 | 2,910 | 3,250 |
The Tax-Exempt Bond Fund of America — Page 1 of 60
Bonds, notes & other debt instruments
Arizona (continued) | Principal amount
(000) | Value
(000) |
Industrial Dev. Auth. of the City of Glendale, Rev. Ref. Bonds (Midwestern University),
Series 2007, 5.00% 2025 | $2,610 | $2,884 |
Industrial Dev. Auth. of the City of Glendale, Rev. Ref. Bonds (Midwestern University),
Series 2007, 5.00% 2026 | 1,630 | 1,786 |
Industrial Dev. Auth. of the City of Glendale, Rev. Ref. Bonds (Midwestern University),
Series 2007, 5.00% 2031 | 3,510 | 3,766 |
Industrial Dev. Auth. of the City of Glendale, Rev. Ref. Bonds (Midwestern University),
Series 2007, 5.25% 2020 | 1,795 | 2,060 |
Industrial Dev. Auth. of the City of Glendale, Rev. Ref. Bonds (Midwestern University),
Series 2007, 5.25% 2021 | 1,000 | 1,152 |
Industrial Dev. Auth. of the City of Glendale, Rev. Ref. Bonds (Midwestern University),
Series 2007, 5.25% 2022 | 2,185 | 2,533 |
| Health Facs. Auth., Health Care Facs. Rev. Ref. Bonds (Beatitudes Campus Project), Series 2006, 5.20% 20372 | 5,645 | 5,059 |
| Health Facs. Auth., Rev. Bonds (Banner Health), Series 2007-A, 5.00% 2020 | 2,000 | 2,196 |
| Health Facs. Auth., Rev. Bonds (Banner Health), Series 2007-B, 0.967% 20371 | 22,200 | 19,279 |
| Health Facs. Auth., Rev. Ref. Bonds (Banner Health), Series 2007-A, 5.25% 2022 | 1,500 | 1,696 |
| McAllister Academic Village LLC, Rev. Ref. Bonds (Arizona State University Hassayampa Academic Village Project), Series 2008, 5.00% 2027 | 5,035 | 5,605 |
| McAllister Academic Village LLC, Rev. Ref. Bonds (Arizona State University Hassayampa Academic Village Project), Series 2008, 5.00% 2028 | 4,000 | 4,405 |
| McAllister Academic Village LLC, Rev. Ref. Bonds (Arizona State University Hassayampa Academic Village Project), Series 2008, 5.00% 2038 | 10,000 | 10,799 |
| McAllister Academic Village LLC, Rev. Ref. Bonds (Arizona State University Hassayampa Academic Village Project), Series 2008, 5.25% 2026 | 3,500 | 3,943 |
| City of Phoenix Civic Improvement Corp., Airport Rev. Bonds, Series 2008-A, 5.00% 2028 | 2,970 | 3,317 |
| City of Phoenix Civic Improvement Corp., Airport Rev. Bonds, Series 2008-A, 5.00% 2038 | 3,000 | 3,286 |
| City of Phoenix Civic Improvement Corp., Airport Rev. Bonds, Series 2010-A, 5.00% 2029 | 5,400 | 5,952 |
| City of Phoenix Civic Improvement Corp., Airport Rev. Bonds, Series 2010-A, 5.00% 2040 | 12,000 | 12,597 |
| City of Phoenix Civic Improvement Corp., Wastewater System Rev. Ref. Bonds, Series 2008, 5.50% 2024 | 1,000 | 1,163 |
| City of Phoenix Civic Improvement Corp., Water System Rev. Bonds, Series 2009-A, 5.00% 2024 | 4,895 | 5,671 |
| Industrial Dev. Auth. of the City of Phoenix, Education Fac. Rev. Bonds (Legacy Traditional Schools Project), Series 2014-A, 6.75% 20442 | 1,500 | 1,657 |
| Industrial Dev. of the City of Phoenix, Lease Rev. Bonds (Rowan University Project), Series 2012, 5.00% 2042 | 12,000 | 12,565 |
| Industrial Dev. of the City of Phoenix, Lease Rev. Bonds (Rowan University Project), Series 2012, 5.25% 2034 | 15,000 | 15,974 |
| Industrial Dev. Auth. of the County of Pima, Industrial Dev. Rev. Bonds (Tucson Electric Power Co. Project), 4.00% 2029 | 1,140 | 1,144 |
| Pima County, Sewer System Rev. Obligations, Series 2012-A, 5.00% 2026 | 1,500 | 1,731 |
| Quail Creek Community Facs. Dist. (Sahuarita), G.O. Bonds, Series 2006, 5.55% 2030 | 1,000 | 1,000 |
| Town of Queen Creek, Improvement Dist. No. 001, Improvement Bonds, 5.00% 2026 | 4,075 | 4,095 |
| Town of Queen Creek, Improvement Dist. No. 001, Improvement Bonds, 5.00% 2032 | 4,000 | 4,011 |
| Salt River Project Agricultural Improvement and Power Dist., Salt River Project Electric System Rev. Bonds, Series 2008-A, 5.00% 2024 | 3,000 | 3,380 |
| Salt River Project Agricultural Improvement and Power Dist., Salt River Project Electric System Rev. Bonds, Series 2008-A, 5.00% 2028 | 8,500 | 9,453 |
| School Facs. Board, Certs. of Part., Series 2008, 5.125% 2021 | 13,000 | 14,690 |
| City of Scottsdale Municipal Property Corp., Excise Tax Rev. Ref. Bonds, Series 2006, 5.00% 2030 | 8,000 | 9,665 |
| State Lottery Rev. Bonds, Series 2010-A, Assured Guaranty Municipal insured, 5.00% 2021 | 8,250 | 9,471 |
| State Lottery Rev. Bonds, Series 2010-A, Assured Guaranty Municipal insured, 5.00% 2025 | 5,000 | 5,557 |
| State Lottery Rev. Bonds, Series 2010-A, Assured Guaranty Municipal insured, 5.00% 2026 | 2,500 | 2,759 |
Industrial Dev. Auth. of the City of Tempe, Rev. Ref. Bonds (Friendship Village of Tempe),
Series 2012-A, 6.25% 2042 | 2,500 | 2,632 |
| Transportation Board Highway Rev. Bonds, Series 2008-A, 5.00% 2032 | 5,000 | 5,578 |
| Transportation Board Highway Rev. Ref. Bonds, Series 2011-A, 5.25% 2030 | 5,000 | 5,823 |
| Transportation Board Highway Rev. Ref. Bonds, Series 2013-A, 5.00% 2023 | 2,000 | 2,402 |
| Transportation Board Highway Rev. Ref. Bonds, Series 2013-A, 5.00% 2036 | 6,585 | 7,357 |
The Tax-Exempt Bond Fund of America — Page 2 of 60
Bonds, notes & other debt instruments
Arizona (continued) | Principal amount
(000) | Value
(000) |
| Board of Regents, University of Arizona SPEED Rev. Bonds (Stimulus Plan for Econ. and Educational Dev.), Series 2013, 5.00% 2043 | $3,000 | $3,274 |
| Verrado Dist. 1 Community Facs. Dist. (Town of Buckeye), Dist. G.O. Ref. Bonds, Series 2013-A, 6.00% 2027 | 2,000 | 2,229 |
| Verrado Dist. 1 Community Facs. Dist. (Town of Buckeye), Dist. G.O. Ref. Bonds, Series 2013-A, 5.00% 2023 | 825 | 895 |
| Vistancia Community Facs. Dist. (Peoria), G.O. Bonds, Series 2005, 5.50% 2020 | 1,000 | 1,026 |
| Vistancia Community Facs. Dist. (Peoria), G.O. Bonds, Series 2006, 4.55% 2026 | 11,350 | 11,515 |
| Water Infrastructure Fin. Auth., Water Quality Rev. Bonds, Series 2008-A, 5.00% 2023 | 4,000 | 4,595 |
| | | 279,049 |
| California 11.57% | | |
| City of Whittier, Health Fac. Rev. Bonds (PIH Health), Series 2014, 5.00% 2044 | 3,000 | 3,209 |
| Jurupa Public Fncg. Auth., Special Tax Rev. Bonds, Series 2014-A, 5.00% 2025 | 500 | 575 |
| Jurupa Public Fncg. Auth., Special Tax Rev. Bonds, Series 2014-A, 5.00% 2032 | 1,260 | 1,382 |
| Alameda Corridor Transportation Auth., Rev. Ref. Bonds, Series 2013-A, 5.00% 2024 | 5,000 | 5,886 |
| Alameda Corridor Transportation Auth., Rev. Ref. Bonds, Series 2013-A, 5.00% 2025 | 11,600 | 13,538 |
Community Facs. Dist. of the City of Aliso Viejo, 2014 Special Tax Bonds (Glenwood at Aliso Viejo),
5.00% 2032 | 1,235 | 1,339 |
Community Facs. Dist. of the City of Aliso Viejo, 2014 Special Tax Bonds (Glenwood at Aliso Viejo),
5.00% 2033 | 1,330 | 1,438 |
Community Facs. Dist. of the City of Aliso Viejo, 2014 Special Tax Bonds (Glenwood at Aliso Viejo),
5.00% 2034 | 1,620 | 1,742 |
Community Facs. Dist. of the City of Aliso Viejo, 2014 Special Tax Bonds (Glenwood at Aliso Viejo),
5.00% 20383 | 2,900 | 3,095 |
| City of Azusa, Community Facs. Dist. No. 2005-1 (Rosedale), Improvement Area No. 1, Special Tax Bonds, Series 2007, 5.00% 2037 | 2,050 | 2,097 |
| Assn. of Bay Area Governments, Fin. Auth. for Nonprofit Corps., Insured Health Fac. Rev. Bonds (Institute on Aging), Series 2008-A, 5.65% 2038 | 1,000 | 1,078 |
| Assn. of Bay Area Governments, Fin. Auth. for Nonprofit Corps., Insured Rev. Ref. Bonds (Casa de las Campanas, Inc.), Series 2010, 6.00% 2037 | 4,025 | 4,481 |
| Assn. of Bay Area Governments, Fin. Auth. for Nonprofit Corps., Insured Rev. Ref. Bonds (Channing House), Series 2010, 6.00% 2030 | 2,000 | 2,279 |
| Assn. of Bay Area Governments, Fin. Auth. for Nonprofit Corps., Insured Senior Living Rev. Ref. Bonds (Odd Fellows Home of California), Series 2012-A, 5.00% 2032 | 4,250 | 4,726 |
| Assn. of Bay Area Governments, Fin. Auth. for Nonprofit Corps., Insured Senior Living Rev. Ref. Bonds (Odd Fellows Home of California), Series 2012-A, 5.00% 2042 | 1,000 | 1,076 |
| Assn. of Bay Area Governments, Fin. Auth. for Nonprofit Corps., Rev. Bonds (Windemere Ranch Infrastructure Fncg. Program), Series 2007-A, CIFG insured, 5.00% 2021 | 1,005 | 1,074 |
| Assn. of Bay Area Governments, Fin. Auth. for Nonprofit Corps., Rev. Bonds (Windemere Ranch Infrastructure Fncg. Program), Series 2007-A, CIFG insured, 5.00% 2024 | 1,150 | 1,202 |
| Assn. of Bay Area Governments, Fin. Auth. for Nonprofit Corps., Rev. Ref. Bonds (Episcopal Senior Communities), Series 2011, 6.125% 2041 | 1,715 | 1,898 |
| Assn. of Bay Area Governments, Fin. Auth. for Nonprofit Corps., Rev. Ref. Bonds (Episcopal Senior Communities), Series 2012-A, 5.00% 2042 | 2,000 | 2,070 |
| Assn. of Bay Area Governments, Fin. Auth. for Nonprofit Corps., Rev. Ref. Bonds (Episcopal Senior Communities), Series 2012-A, 5.00% 2047 | 7,315 | 7,564 |
| Assn. of Bay Area Governments, Fin. Auth. for Nonprofit Corps., Rev. Ref. Bonds (Episcopal Senior Communities), Series 2012-C-3, 2.15% 2019 | 3,875 | 3,814 |
| Assn. of Bay Area Governments, Fin. Auth. for Nonprofit Corps., Rev. Ref. Bonds (Eskaton Properties Inc. Obligated Group), Series 2013, 5.00% 2035 | 1,740 | 1,792 |
Assn. of Bay Area Governments, Fin. Auth. for Nonprofit Corps., Rev. Ref. Bonds (Sharp HealthCare),
Series 2009-B, 6.00% 2024 | 1,000 | 1,172 |
Assn. of Bay Area Governments, Fin. Auth. for Nonprofit Corps., Rev. Ref. Bonds (Sharp HealthCare),
Series 2009-B, 6.125% 2029 | 1,000 | 1,164 |
Assn. of Bay Area Governments, Fin. Auth. for Nonprofit Corps., Rev. Ref. Bonds (Sharp HealthCare),
Series 2012-A, 5.00% 2023 | 1,640 | 1,898 |
The Tax-Exempt Bond Fund of America — Page 3 of 60
Bonds, notes & other debt instruments
California (continued) | Principal amount
(000) | Value
(000) |
Assn. of Bay Area Governments, Fin. Auth. for Nonprofit Corps., Rev. Ref. Bonds (Sharp HealthCare),
Series 2014-A, 5.00% 2043 | $2,000 | $2,163 |
| Assn. of Bay Area Governments, Fin. Auth. for Nonprofit Corps., Rev. Ref. Bonds (Windemere Ranch Infrastructure Fncg. Program), Series 2007-B, 5.00% 2034 | 1,630 | 1,680 |
Bay Area Toll Auth., San Francisco Bay Area Toll Bridge Rev. Ref. Bonds,
Series 2006-C-1, 0.96% 2045 (put 2023)1 | 5,000 | 4,941 |
Bay Area Toll Auth., San Francisco Bay Area Toll Bridge Rev. Ref. Bonds,
Series 2007-C-1, 0.96% 2047 (put 2023)1 | 4,000 | 3,953 |
Bay Area Toll Auth., San Francisco Bay Area Toll Bridge Rev. Ref. Bonds, Series 2008-B-1,
1.16% 2045 (put 2024)1 | 10,000 | 10,033 |
Bay Area Toll Auth., San Francisco Bay Area Toll Bridge Rev. Ref. Bonds, Series 2008-F-1,
5.00% 2034 (preref. 2018) | 3,980 | 4,593 |
Bay Area Toll Auth., San Francisco Bay Area Toll Bridge Rev. Ref. Bonds, Series 2009-F-1,
5.125% 2039 (preref. 2019) | 10,000 | 11,831 |
| Bay Area Toll Auth., San Francisco Bay Area Toll Bridge Rev. Ref. Bonds, Series 2012-F-1, 5.00% 2030 | 2,500 | 2,863 |
| Bay Area Toll Auth., San Francisco Bay Area Toll Bridge Rev. Ref. Bonds, Series 2012-F-1, 5.00% 2031 | 2,000 | 2,277 |
| Bay Area Toll Auth., San Francisco Bay Area Toll Bridge Rev. Ref. Bonds, Series 2014-B, 1.50% 2047 | 1,000 | 1,010 |
| Bay Area Toll Auth., San Francisco Bay Area Toll Bridge Rev. Ref. Bonds, Series 2014-C, 1.875% 2047 | 1,780 | 1,803 |
| Bay Area Toll Auth., San Francisco Bay Area Toll Bridge Rev. Ref. Bonds, Series 2014-F1, 5.00% 2054 | 2,000 | 2,188 |
| Successor Agcy. to the Brea Redev. Agcy. (Redev. Project AB), 2013 Tax Allocation Ref. Bonds, 5.00% 2026 | 1,200 | 1,393 |
| Trustees of the California State University, Systemwide Rev. Ref. Bonds, Series 2011-A, 5.00% 2037 | 4,000 | 4,356 |
| City of Carlsbad, Reassessment Dist. No. 2012-1, Limited Obligation Ref. Bonds, 4.125% 2030 | 1,450 | 1,444 |
| City of Carlsbad, Reassessment Dist. No. 2012-1, Limited Obligation Ref. Bonds, 4.125% 2031 | 800 | 791 |
| City of Carlsbad, Reassessment Dist. No. 2012-1, Limited Obligation Ref. Bonds, 5.00% 2035 | 1,000 | 1,052 |
| Successor Agcy. to the Carson Redev. Agcy., Tax Allocation Ref. Bonds (Redev. Project Area No.1), Series 2014-A, Assured Guaranty Municipal insured, 4.25% 2033 | 750 | 765 |
Castaic Lake Water Agcy., Rev. Ref. Certs. of Part. (1999 Ref. Project), Series 2006-A,
AMBAC insured, 5.00% 2020 | 2,015 | 2,188 |
Cerritos Public Fin. Auth., Tax Allocation Rev. Bonds (Cerritos Redev. Projects), Series 2002-A,
AMBAC insured, 5.00% 2020 | 5,000 | 5,535 |
Cerritos Public Fncg. Auth., 2002 Tax Allocation Rev. Bonds (Cerritos Redev. Projects), Series A,
AMBAC insured, 5.00% 2017 | 2,880 | 3,234 |
Cerritos Public Fncg. Auth., 2002 Tax Allocation Rev. Bonds (Cerritos Redev. Projects), Series A,
AMBAC insured, 5.00% 2019 | 1,000 | 1,119 |
Cerritos Public Fncg. Auth., 2002 Tax Allocation Rev. Ref. Bonds (Cerritos Redev. Projects), Series A,
AMBAC insured, 5.00% 2024 | 1,640 | 1,765 |
| Certs. of Part., Palomar Pomerado Health, 6.00% 2030 | 7,500 | 7,820 |
Successor Agcy. to the Redev. Agcy. of the City of Chino, Tax Allocation Ref. Bonds,
Series 2014-A, 5.00% 2028 | 1,370 | 1,556 |
Successor Agcy. to the Redev. Agcy. of the City of Chino, Tax Allocation Ref. Bonds,
Series 2014-A, 5.00% 2029 | 1,325 | 1,494 |
| Chula Vista Municipal Fncg. Auth., Special Tax Rev. Ref. Bonds, Series 2013, 5.00% 2034 | 2,495 | 2,661 |
| Coast Community College Dist., Election of 2002 G.O. Bonds, Series 2006-B, Assured Guaranty Municipal insured, 5.00% 2024 (preref. 2016) | 4,990 | 5,459 |
| Community Facs. Dist. No. 2002-1, City of Corona (Dos Lagos), Special Tax Bonds (Improvement Area No. 1), Series 2007, 4.875% 2037 | 315 | 316 |
| Community Facs. Dist. No. 2002-1, City of Corona (Dos Lagos), Special Tax Bonds, Series 2005-A, 4.90% 2025 | 3,015 | 3,048 |
| Econ. Recovery Bonds, Ref. Series 2009-A, 5.25% 2021 | 17,750 | 21,116 |
| Educational Facs. Auth., Rev. Bonds (Loyola Marymount University), Series 2010-A, 5.125% 2040 | 1,750 | 1,880 |
| Educational Facs. Auth., Rev. Bonds (Mills College), Series 2005-A, 5.00% 2020 | 1,115 | 1,160 |
| Educational Facs. Auth., Rev. Bonds (Mills College), Series 2005-A, 5.00% 2034 | 2,720 | 2,736 |
| Educational Facs. Auth., Rev. Bonds (Pitzer College), Series 2005-A, 5.00% 2030 | 1,000 | 1,024 |
| Educational Facs. Auth., Rev. Bonds (Pitzer College), Series 2009, 5.25% 2024 | 400 | 459 |
| Educational Facs. Auth., Rev. Bonds (Pitzer College), Series 2009, 5.50% 2029 | 1,850 | 2,116 |
| Educational Facs. Auth., Rev. Bonds (Pitzer College), Series 2009, 6.00% 2040 | 2,840 | 3,333 |
The Tax-Exempt Bond Fund of America — Page 4 of 60
Bonds, notes & other debt instruments
California (continued) | Principal amount
(000) | Value
(000) |
| Educational Facs. Auth., Rev. Bonds (Stanford University), Series U-1, 5.25% 2040 | $2,000 | $2,608 |
| Educational Facs. Auth., Rev. Bonds (University of San Francisco), Series 2011, 6.125% 2036 | 3,450 | 4,110 |
| Educational Facs. Auth., Rev. Bonds (University of the Pacific), 5.50% 2039 (preref. 2019) | 85 | 102 |
| Educational Facs. Auth., Rev. Bonds (University of the Pacific), Series 2006, 5.00% 2021 | 850 | 895 |
| Educational Facs. Auth., Rev. Ref. Bonds (Chapman University), Series 2011, 5.00% 2026 | 3,070 | 3,454 |
| Educational Facs. Auth., Rev. Ref. Bonds (Chapman University), Series 2011, 5.00% 2031 | 6,015 | 6,560 |
| Educational Facs. Auth., Rev. Ref. Bonds (Loyola Marymount University), Series 2010-B, 0.86% 20151 | 2,300 | 2,302 |
| Educational Facs. Auth., Rev. Ref. Bonds (Loyola Marymount University), Series 2011, 5.00% 2020 | 250 | 294 |
| Educational Facs. Auth., Rev. Ref. Bonds (Loyola Marymount University), Series 2011, 5.00% 2021 | 750 | 882 |
| Educational Facs. Auth., Rev. Ref. Bonds (Mills College), Series 2005-B, 5.00% 2020 | 680 | 739 |
| Educational Facs. Auth., Rev. Ref. Bonds (University of La Verne), Series 2005-A, 5.00% 2026 | 965 | 981 |
| Educational Facs. Auth., Rev. Ref. Bonds (University of San Diego), Series 2011, 5.00% 2021 | 100 | 118 |
| Educational Facs. Auth., Rev. Ref. Bonds (University of San Diego), Series 2011, 5.00% 2022 | 600 | 708 |
| Educational Facs. Auth., Rev. Ref. Bonds (University of the Pacific), 5.50% 2039 | 910 | 989 |
| Educational Facs. Auth., Rev. Ref. Bonds (University of the Pacific), 5.50% 2039 (preref. 2019) | 55 | 67 |
| Educational Facs. Auth., Rev. Ref. Bonds (University of the Pacific), Series 2012-A, 5.00% 2026 | 895 | 1,012 |
| Educational Facs. Auth., Rev. Ref. Bonds (University of the Pacific), Series 2012-A, 5.00% 2030 | 750 | 827 |
Community Facs. Dist. No. 1, Elk Grove Unified School Dist. (Sacramento County),
2012 Special Tax Ref. Bonds, 4.00% 2033 | 5,000 | 4,916 |
Community Facs. Dist. No. 1, Elk Grove Unified School Dist. (Sacramento County),
Special Tax Ref. Bonds, Series 2012, Assured Guaranty Municipal insured, 3.375% 2030 | 1,500 | 1,407 |
Successor Agcy. to the Emeryville Redev. Agcy., Tax Allocation Rev. Ref. Bonds, Series 2014-A,
Assured Guaranty Municipal insured, 5.00% 2025 | 1,000 | 1,185 |
| Successor Agcy. to the Emeryville Redev. Agcy., Tax Allocation Rev. Ref. Bonds, Series 2014-A, Assured Guaranty Municipal insured, 5.00% 2026 | 2,000 | 2,342 |
| Successor Agcy. to the Emeryville Redev. Agcy., Tax Allocation Rev. Ref. Bonds, Series 2014-A, Assured Guaranty Municipal insured, 5.00% 2032 | 890 | 1,004 |
| Successor Agcy. to the Emeryville Redev. Agcy., Tax Allocation Rev. Ref. Bonds, Series 2014-A, Assured Guaranty Municipal insured, 5.00% 2033 | 775 | 869 |
| City of Fontana, Community Facs. Dist. No. 22 (Sierra Hills South), Special Tax Bonds, Series 2014, 5.00% 2031 | 880 | 947 |
| City of Fontana, Community Facs. Dist. No. 22 (Sierra Hills South), Special Tax Bonds, Series 2014, 5.00% 2034 | 1,250 | 1,334 |
| Foothill/Eastern Transportation Corridor Agcy., Toll Road Rev. Ref. Bonds, Series 2013-A, 5.75% 2046 | 10,260 | 11,593 |
| Foothill/Eastern Transportation Corridor Agcy., Toll Road Rev. Ref. Bonds, Series 2013-A, 6.00% 2053 | 24,000 | 27,483 |
Foothill/Eastern Transportation Corridor Agcy., Toll Road Rev. Ref. Bonds, Series 2013-B-1,
5.00% 2053 (put 2018) | 2,500 | 2,743 |
| Various Purpose G.O. Bonds, 5.25% 2018 | 5,000 | 5,773 |
| Various Purpose G.O. Bonds, 5.25% 2028 | 10,185 | 11,919 |
| Various Purpose G.O. Bonds, 5.25% 2028 | 3,000 | 3,516 |
| Various Purpose G.O. Bonds, 6.00% 2038 | 8,000 | 9,425 |
| Various Purpose G.O. Bonds, 6.00% 2039 | 10,000 | 12,009 |
| Various Purpose G.O. Bonds, 6.50% 2033 | 7,000 | 8,524 |
| Various Purpose G.O. Ref. Bonds, 5.00% 2032 | 4,000 | 4,489 |
Golden State Tobacco Securitization Corp., Enhanced Tobacco Settlement Asset-backed Bonds,
Series 2007-A-1, 5.125% 2047 | 15,000 | 11,088 |
| Golden State Tobacco Securitization Corp., Enhanced Tobacco Settlement Asset-backed Bonds, Series 2013-A, 5.00% 2021 | 1,800 | 2,140 |
| Golden State Tobacco Securitization Corp., Enhanced Tobacco Settlement Asset-backed Bonds, Series 2013-A, 5.00% 2029 | 1,000 | 1,111 |
Golden State Tobacco Securitization Corp., Tobacco Settlement Asset-backed Rev. Ref. Bonds,
Series 2007-A-1, 5.75% 2047 | 4,000 | 3,218 |
| Health Facs. Fncg. Auth. Rev. Bonds (Scripps Health), Series 2012-A, 5.00% 2029 | 1,215 | 1,357 |
| Health Facs. Fncg. Auth., Insured Rev. Ref. Bonds (NCROC - Paradise Valley Estates Project), Series 2013, 5.00% 2024 | 1,295 | 1,510 |
| Health Facs. Fncg. Auth., Rev. Bonds (Catholic Healthcare West), Series 2008-I, 5.125% 2022 | 725 | 754 |
| Health Facs. Fncg. Auth., Rev. Bonds (Catholic Healthcare West), Series 2008-K, 5.125% 2022 | 2,750 | 2,860 |
The Tax-Exempt Bond Fund of America — Page 5 of 60
Bonds, notes & other debt instruments
California (continued) | Principal amount
(000) | Value
(000) |
| Health Facs. Fncg. Auth., Rev. Bonds (Episcopal Home), Series 2002-B, 5.10% 2019 (escrowed to maturity) | $610 | $676 |
| Health Facs. Fncg. Auth., Rev. Bonds (Episcopal Home), Series 2002-B, 6.00% 2032 (preref. 2020) | 3,800 | 4,701 |
| Health Facs. Fncg. Auth., Rev. Bonds (Kaiser Permanente), Series 2006-A, 5.00% 2037 | 5,480 | 5,620 |
| Health Facs. Fncg. Auth., Rev. Bonds (Sutter Health), Series 2011-D, 5.25% 2031 | 2,000 | 2,260 |
| Health Facs. Fncg. Auth., Rev. Ref. Bonds (Catholic Healthcare West), Series 2011-A, 5.25% 2041 | 4,230 | 4,518 |
| Health Facs. Fncg. Auth., Rev. Ref. Bonds (Cedars-Sinai Medical Center), Series 2005, 5.00% 2020 | 2,500 | 2,641 |
| Health Facs. Fncg. Auth., Rev. Ref. Bonds (City of Hope), Series 2012-A, 5.00% 2032 | 4,250 | 4,625 |
Health Facs. Fncg. Auth., Rev. Ref. Bonds (Providence Health & Services), Series 2008-C,
6.50% 2038 (preref. 2018) | 980 | 1,205 |
Health Facs. Fncg. Auth., Rev. Ref. Bonds (Providence Health & Services), Series 2008-C,
6.50% 2038 (preref. 2018) | 20 | 25 |
| Health Facs. Fncg. Auth., Rev. Ref. Bonds (St. Joseph Health System), Series 2009-D, 5.00% 2034 (put 2016) | 4,000 | 4,390 |
| Health Facs. Fncg. Auth., Rev. Ref. Bonds (St. Joseph Health System), Series 2013-A, 5.00% 2033 | 1,300 | 1,430 |
Independent Cities Lease Fin. Auth., Mobile Home Park Rev. Ref. Bonds (Westlake Mobilehome Park),
Series 2007-A, 4.50% 2037 | 1,000 | 1,008 |
Infrastructure and Econ. Dev. Bank, Rev. Ref. Bonds (J. Paul Getty Trust),
Series 2011-A-2, 0.34% 2038 (put 2017)1 | 4,000 | 3,998 |
Infrastructure and Econ. Dev. Bank, Rev. Ref. Bonds (J. Paul Getty Trust),
Series 2013-A-2, 0.34% 2047 (put 2016)1 | 3,500 | 3,500 |
Successor Agcy. to the Inland Valley Dev. Agcy., Tax Allocation Ref. Bonds,
Series 2014-A 5.00% 2044 | 16,500 | 17,633 |
| City of Irvine, Limited Obligation Improvement Bonds, Reassessment Dist. No. 12-1, 4.00% 2028 | 675 | 687 |
| City of Irvine, Limited Obligation Improvement Bonds, Reassessment Dist. No. 12-1, 5.00% 2023 | 1,235 | 1,420 |
| City of Irvine, Limited Obligation Improvement Bonds, Reassessment Dist. No. 13-1, 5.00% 2023 | 1,100 | 1,272 |
| City of Irvine, Limited Obligation Improvement Bonds, Reassessment Dist. No. 13-1, 5.00% 2027 | 325 | 355 |
| City of Irvine, Limited Obligation Improvement Bonds, Reassessment Dist. No. 13-1, 5.00% 2030 | 700 | 752 |
| Jurupa Public Fncg. Auth., Special Tax Rev. Bonds, Series 2013-A, 5.25% 2024 | 1,145 | 1,332 |
| Jurupa Public Fncg. Auth., Special Tax Rev. Bonds, Series 2014-A, 5.00% 2042 | 1,250 | 1,340 |
| Successor Agcy. to the La Quinta Redev. Agcy., Tax Allocation Ref. Bonds (La Quinta Redev. Project Areas No. 1 and 2), Series 2013-A, 5.00% 2029 | 1,435 | 1,578 |
| Successor Agcy. to the La Quinta Redev. Agcy., Tax Allocation Ref. Bonds (La Quinta Redev. Project Areas No. 1 and 2), Series 2013-A, 5.00% 2030 | 1,500 | 1,638 |
| Successor Agcy. to the La Quinta Redev. Agcy., Tax Allocation Ref. Bonds (La Quinta Redev. Project Areas No. 1 and 2), Series 2014-A, 5.00% 2024 | 1,200 | 1,437 |
| Successor Agcy. to the La Quinta Redev. Agcy., Tax Allocation Ref. Bonds (La Quinta Redev. Project Areas No. 1 and 2), Series 2014-A, 5.00% 2033 | 1,890 | 2,104 |
| City of La Verne, Rev. Certs. of Part. (Brethren Hillcrest Homes), Series 2014, 5.00% 2029 | 500 | 526 |
| Lee Lake Public Fncg. Auth., Special Tax Rev. Ref. Bonds, Series 2013-A, 5.00% 2032 | 3,750 | 4,038 |
| Lee Lake Public Fncg. Auth., Special Tax Rev. Ref. Bonds, Series 2013-A, 5.125% 2035 | 1,250 | 1,342 |
| Lee Lake Public Fncg. Auth., Special Tax Rev. Ref. Bonds, Series 2013-A, 5.25% 2024 | 1,000 | 1,163 |
| Lee Lake Public Fncg. Auth., Special Tax Rev. Ref. Bonds, Series 2013-A, 5.25% 2025 | 1,385 | 1,593 |
| Lincoln Public Fin. Auth., Special Tax Rev. Bonds, Series 2007-A, AMBAC insured, 4.50% 2034 | 5,000 | 5,018 |
| City of Long Beach, Harbor Rev. Bonds, Series 2010-A, 5.00% 2025 | 3,000 | 3,413 |
| Long Beach Bond Fin. Auth., Rev. Ref. Bonds (Aquarium of the Pacific Project), Series 2012, 5.00% 2027 | 1,000 | 1,114 |
| Long Beach Bond Fin. Auth., Rev. Ref. Bonds (Aquarium of the Pacific Project), Series 2012, 5.00% 2028 | 1,000 | 1,106 |
| City of Los Angeles Harbor Dept., Rev. Bonds, Series 2009-A, 5.00% 2026 | 6,555 | 7,630 |
| City of Los Angeles, Dept. of Water and Power, Power System Rev. Ref. Bonds, Series 2014-B, 5.00% 2043 | 750 | 837 |
| City of Los Angeles, Wastewater System Rev. Ref. Bonds, Series 2002-A, FGIC-National insured, 6.00% 2022 | 5,000 | 6,509 |
| Community Redev. Agcy. of the City of Los Angeles, Lease Rev. Bonds (Vermont Manchester Social Services Project), Series 2005, AMBAC insured, 5.00% 2020 | 2,675 | 2,798 |
| Community Redev. Agcy. of the City of Los Angeles, Lease Rev. Bonds (Vermont Manchester Social Services Project), Series 2005, AMBAC insured, 5.00% 2022 | 1,500 | 1,569 |
| Community Redev. Agcy. of the City of Los Angeles, Lease Rev. Bonds (Vermont Manchester Social Services Project), Series 2005, AMBAC insured, 5.00% 2023 | 1,500 | 1,569 |
The Tax-Exempt Bond Fund of America — Page 6 of 60
Bonds, notes & other debt instruments
California (continued) | Principal amount
(000) | Value
(000) |
| County of Los Angeles Redev. Ref. Auth., Tax Allocation Rev. Ref. Bonds (Various Redev. Project Areas), Series 2013-D, Assured Guaranty Municipal insured, 5.00% 2027 | $1,950 | $2,207 |
| Dept. of Airports of the City of Los Angeles, Los Angeles International Airport, Rev. Bonds, Series 2013-B, 5.00% 2038 | 1,500 | 1,635 |
| Dept. of Airports of the City of Los Angeles, Los Angeles International Airport, Rev. Ref. Bonds, Series 2009-A, 5.25% 2029 | 7,000 | 8,135 |
| Dept. of Airports of the City of Los Angeles, Los Angeles International Airport, Rev. Ref. Bonds, Series 2010-A, 5.00% 2035 | 5,000 | 5,543 |
| Housing Auth. of the City of Los Angeles, Mortgage Rev. Ref. Bonds (Property Acquisition Refundings), Series 2009-A, 6.00% 2029 | 1,000 | 1,044 |
Housing Auth. of the City of Los Angeles, Mortgage Rev. Ref. Bonds (Property Acquisition Refundings),
Series 2009-A, 6.375% 2039 | 3,000 | 3,149 |
| Los Angeles Community College Dist. (County of Los Angeles), G.O. Bonds, 2008 Election, Series 2010-C, 5.25% 2039 | 2,000 | 2,299 |
| Los Angeles Convention and Exhibition Center Auth., Lease Rev. Ref. Bonds, Series 2008-A, 5.00% 2020 | 3,000 | 3,465 |
| Los Angeles County, Regional Fncg. Auth., Insured Rev. Bonds (MonteCedro Inc. Project), Series 2014-B3, 2.50% 2020 | 2,335 | 2,377 |
Los Angeles Unified School Dist. (County of Los Angeles), Election of 2004 G.O. Bonds, Series 2009-I,
5.00% 2024 | 2,580 | 2,998 |
| Los Rios Community College Dist. (Sacramento County), 2012 G.O. Ref. Bonds, 5.00% 2028 | 3,000 | 3,448 |
| M-S-R Energy Auth., Gas Rev. Bonds, Series 2009-B, 6.50% 2039 | 2,000 | 2,611 |
Mobilehome Park Fncg. Auth., Mobile Home Park Rev. Ref. Bonds (Union City Tropics),
Series 2006-A, 4.50% 2027 | 1,125 | 1,135 |
Mobilehome Park Fncg. Auth., Mobile Home Park Rev. Ref. Bonds (Union City Tropics),
Series 2006-A, 4.50% 2036 | 3,260 | 3,235 |
| Modesto Irrigation Dist., Electric System Rev. Ref. Bonds, Series 2012-A, Assured Guaranty Municipal insured, 5.00% 2026 | 2,500 | 2,936 |
Community Facs. Dist. No. 2004-6, Moreno Valley Unified School Dist., Special Tax Bonds,
Series 2005, 5.10% 2028 | 2,410 | 2,436 |
| Successor Agcy. to Morgan Hill Redev. Agcy., Rev. Ref. Bonds, Series 2013-A, 5.00% 2026 | 2,000 | 2,329 |
| Morongo Band of Mission Indians, Enterprise Rev. Ref. Bonds, Series 2008-B, 5.50% 2018 | 2,755 | 2,923 |
| Morongo Band of Mission Indians, Enterprise Rev. Ref. Bonds, Series 2008-B, 6.50% 2028 | 5,400 | 5,872 |
| Municipal Fin. Auth., Certs. of Part. (Community Hospitals of Central California Obligated Group), 5.25% 2024 | 3,785 | 4,081 |
| Municipal Fin. Auth., Certs. of Part. (Community Hospitals of Central California Obligated Group), 5.25% 2037 | 2,770 | 2,821 |
| Municipal Fin. Auth., Rev. Bonds (Biola University), Series 2013, 5.00% 2038 | 1,000 | 1,058 |
| Municipal Fin. Auth., Rev. Bonds (Biola University), Series 2013, 5.00% 2042 | 1,000 | 1,055 |
| Municipal Fin. Auth., Rev. Bonds (Loma Linda University), Series 2007, 5.00% 2037 | 1,000 | 1,032 |
| Municipal Fin. Auth., Rev. Bonds (University Students’ Cooperative Assn.), Series 2007, 5.00% 2037 | 1,000 | 1,005 |
| Municipal Fin. Auth., Rev. Ref. Bonds (Azusa Pacific University Project), Series 2011-B, 8.00% 20412 | 3,400 | 4,012 |
| Municipal Fin. Auth., Rev. Ref. Bonds (Biola University), Series 2008-A, 5.00% 2018 | 2,130 | 2,396 |
| Municipal Fin. Auth., Rev. Ref. Bonds (Biola University), Series 2008-A, 5.80% 2028 | 500 | 554 |
| Municipal Fin. Auth., Rev. Ref. Bonds (University of San Diego), Series 2011-B, 5.00% 2035 | 1,200 | 1,296 |
| Municipal Fin. Auth., Rev. Ref. Bonds (University of San Diego), Series 2012-A, 5.00% 2030 | 2,330 | 2,577 |
| Murrieta Public Fncg. Auth., Special Tax Rev. Ref. Bonds, Series 2012, 5.00% 2031 | 2,810 | 2,952 |
| City of Norco, Community Facs. Dist. No. 2001-1 (Norco Ridge Ranch), Special Tax Ref. Bonds, Issue of 2006, AMBAC insured, 4.875% 2033 | 3,000 | 3,020 |
Northern California Power Agcy., Hydroelectric Project Number One Rev. Ref. Bonds, Series 2010-A,
5.00% 2023 | 5,000 | 5,611 |
Northern California Power Agcy., Hydroelectric Project Number One Rev. Ref. Bonds,
Series 2012-A, 5.00% 2032 | 1,400 | 1,558 |
| Northern California Power Agcy., Lodi Energy Center Rev. Bonds, Issue One, Series 2010-A, 5.00% 2025 | 5,000 | 5,633 |
Oakland Redev. Successor Agcy., Tax Allocation Ref. Bonds (Central Dist. Redev. Project),
Series 2013, 5.00% 2021 | 4,590 | 5,393 |
| City of Orange, Community Facs. Dist. No. 91-2, Special Tax Ref. Bonds (Serrano Heights Public Improvements), Series 2013, 5.00% 2026 | 1,070 | 1,205 |
The Tax-Exempt Bond Fund of America — Page 7 of 60
Bonds, notes & other debt instruments
California (continued) | Principal amount
(000) | Value
(000) |
| City of Orange, Community Facs. Dist. No. 91-2, Special Tax Ref. Bonds (Serrano Heights Public Improvements), Series 2013, 5.00% 2027 | $1,300 | $1,456 |
| City of Orange, Community Facs. Dist. No. 91-2, Special Tax Ref. Bonds (Serrano Heights Public Improvements), Series 2013, 5.00% 2028 | 750 | 835 |
Orange County Sanitation Dist., Certs. of Part., Series 2007-B, Assured Guaranty Municipal insured,
5.00% 2037 | 15,000 | 16,285 |
| Orange County Sanitation Dist., Certs. of Part., Series 2009-A, 5.00% 2027 | 2,925 | 3,337 |
| City of Palm Desert, Section 29 Assessment Dist. (No. 2004-02), Limited Obligation Improvement Bonds, Series 2007, 5.10% 2037 | 1,820 | 1,844 |
| Perris Union High School Dist., Fncg. Auth., Rev. Bonds, Series 2011, 6.00% 2033 | 1,000 | 1,031 |
| Pollution Control Fncg. Auth., Water Furnishing Rev. Bonds (San Diego County Water Auth. Desalination Project Pipeline), Series 2012, 5.00% 20452 | 14,920 | 15,119 |
| Poway Unified School Dist., Community Facs. Dist. No. 14 (Del Sur), Improvement Area A Special Tax Bonds, Series 2006, 4.90% 2018 | 1,790 | 1,829 |
| Poway Unified School Dist., Community Facs. Dist. No. 14 (Del Sur), Improvement Area A Special Tax Bonds, Series 2006, 5.10% 2021 | 1,290 | 1,321 |
| Poway Unified School Dist., Community Facs. Dist. No. 14 (Del Sur), Improvement Area A Special Tax Bonds, Series 2006, 5.125% 2026 | 1,770 | 1,811 |
| Poway Unified School Dist., Public Fncg. Auth., Special Tax Rev. Bonds, Series 2013, 4.00% 2021 | 325 | 355 |
| Poway Unified School Dist., Public Fncg. Auth., Special Tax Rev. Bonds, Series 2013, 4.00% 2023 | 715 | 777 |
| Poway Unified School Dist., Public Fncg. Auth., Special Tax Rev. Ref. Bonds, Series 2011, 5.375% 2030 | 2,305 | 2,378 |
| Public Works Board, Lease Rev. Bonds (Judicial Council of California), Series 2014-B, 5.00% 2039 | 1,000 | 1,105 |
| Public Works Board, Lease Rev. Bonds (Trustees of the California State University), Series 2013-H, 5.00% 2038 | 7,450 | 8,122 |
| Public Works Board, Lease Rev. Bonds (Trustees of the California State University, J. Paul Leonard & Sutro Library), Series 2009-J, 6.00% 2034 | 3,000 | 3,550 |
| Public Works Board, Lease Rev. Bonds (Various Capital Projects), Series 2009-I-1, 5.50% 2023 | 10,000 | 11,928 |
| Public Works Board, Lease Rev. Bonds (Various Capital Projects), Series 2009-I-1, 6.125% 2029 | 3,000 | 3,603 |
| Public Works Board, Lease Rev. Bonds (Various Capital Projects), Series 2009-I-1, 6.625% 2034 | 1,005 | 1,010 |
| Public Works Board, Lease Rev. Bonds (Various Capital Projects), Series 2012-A, 5.00% 2033 | 2,000 | 2,204 |
| Public Works Board, Lease Rev. Bonds (Various Capital Projects), Series 2012-A, 5.00% 2037 | 3,000 | 3,261 |
| Public Works Board, Lease Rev. Bonds (Various Capital Projects), Series 2013-I, 5.00% 2038 | 3,500 | 3,846 |
| Public Works Board, Lease Rev. Bonds (Various Capital Projects), Series 2013-I, 5.25% 2032 | 2,500 | 2,885 |
| Public Works Board, Lease Rev. Ref. Bonds (Dept. of Corrections, Various State Prisons), Series 1993-A, AMBAC insured, 5.00% 2019 | 4,240 | 4,700 |
City of Rancho Cordova, Sunridge Anatolia Community Facs. Dist. No. 2003-1, Special Tax Bonds,
Series 2007, 5.375% 2037 | 2,000 | 2,041 |
| Successor Agcy. to the Rancho Cucamonga Redev. Agcy., Rancho Redev. Project Area, Tax Allocation Ref. Bonds, Series 2014, Assured Guaranty Municipal insured, 5.00% 2026 | 1,450 | 1,694 |
| Successor Agcy. to the Rancho Cucamonga Redev. Agcy., Rancho Redev. Project Area, Tax Allocation Ref. Bonds, Series 2014, Assured Guaranty Municipal insured, 5.00% 2028 | 1,830 | 2,099 |
| Successor Agcy. to the Rancho Cucamonga Redev. Agcy., Rancho Redev. Project Area, Tax Allocation Ref. Bonds, Series 2014, Assured Guaranty Municipal insured, 5.00% 2031 | 755 | 848 |
Successor Agcy. to the Rancho Mirage Redev. Agcy., Tax Allocation Housing Ref. Bonds,
Series 2013-A, 5.00% 2021 | 1,000 | 1,165 |
Successor Agcy. to the Rancho Mirage Redev. Agcy., Tax Allocation Housing Ref. Bonds,
Series 2013-A, 5.00% 2023 | 1,835 | 2,149 |
Successor Agcy. to the Rancho Mirage Redev. Agcy., Tax Allocation Housing Ref. Bonds,
Series 2013-A, 5.00% 2024 | 1,930 | 2,247 |
Successor Agcy. to the Rancho Mirage Redev. Agcy., Tax Allocation Housing Ref. Bonds,
Series 2013-A, 5.00% 2033 | 2,540 | 2,774 |
| Regents of the University of California, Limited Project Rev. Bonds, Series 2012-G, 5.00% 2042 | 5,000 | 5,470 |
| Successor Agcy. Richmond Community Redev. Agcy. Rev. Ref. Tax Allocation., Series 2014-A, 4.50% 2025 | 160 | 177 |
| Successor Agcy. to the Richmond Community Redev. Agcy., Ref. Bonds, Series 2014-A, 5.00% 2024 | 425 | 495 |
| Rio Elementary School Dist., Community Facs. Dist. #1, Special Tax Bonds, Series 2013, 5.50% 2039 | 1,500 | 1,639 |
The Tax-Exempt Bond Fund of America — Page 8 of 60
Bonds, notes & other debt instruments
California (continued) | Principal amount
(000) | Value
(000) |
| Community Facs. Dist. No. 15 (Mission Ranch) of Riverside Unified School Dist., Special Tax Bonds (Improvement Area No. 2), Series 2005-A, 5.15% 2025 | $1,250 | $1,264 |
City of Sacramento, North Natomas Community Facs. Dist. No. 4, Special Tax Bonds,
Series 2013-E, 5.25% 2024 | 1,160 | 1,349 |
City of Sacramento, North Natomas Community Facs. Dist. No. 4, Special Tax Bonds,
Series 2013-E, 5.25% 2033 | 1,500 | 1,640 |
| Sacramento City Fncg. Auth., Rev. Ref. Bonds (Master Lease Program Facs.), Series 2006-E, AMBAC insured, 5.25% 2025 | 7,500 | 9,145 |
| Sacramento County Water Fncg. Auth., Rev. Ref. Bonds (Sacramento County Water Agcy. Zones 40 and 41 2007 Water System Project), Series 2007-B, FGIC-National insured, 0.702% 20341 | 5,000 | 4,410 |
| Sacramento Municipal Utility Dist. Fncg. Auth., Cosumnes Project Rev. Bonds, Series 2006, National insured, 5.125% 2029 | 15,500 | 16,515 |
| Sacramento Municipal Utility Dist., Electric Rev. Bonds, Series 2013-A, 5.00% 2037 | 3,000 | 3,335 |
| Sacramento Municipal Utility Dist., Electric Rev. Bonds, Series 2013-A, 5.00% 2041 | 2,500 | 2,755 |
| Sacramento Municipal Utility Dist., Electric Rev. Ref. Bonds, Series 2012-Y, 5.00% 2032 | 1,675 | 1,898 |
| Sacramento Regional Transit Dist., Farebox Rev. Bonds, Series 2012, 5.00% 2020 | 825 | 951 |
| City of San Bernardino, Unified School Dist. G.O. Ref. Bonds, Series 2013-A, Assured Guaranty Municipal insured, 5.00% 2026 | 1,000 | 1,149 |
| City of San Bernardino, Unified School Dist. G.O. Ref. Bonds, Series 2013-A, Assured Guaranty Municipal insured, 5.00% 2027 | 1,000 | 1,144 |
| County of San Bernardino, Certs. of Part. (Arrowhead Ref. Project), Series 2009-A, 5.00% 2022 | 4,000 | 4,459 |
| County of San Bernardino, Certs. of Part. (Arrowhead Ref. Project), Series 2009-A, 5.125% 2024 | 7,000 | 7,643 |
| City of San Buenaventura, Rev. Bonds (Community Memorial Health System), Series 2011, 7.50% 2041 | 19,600 | 22,608 |
| Public Facs. Fncg. Auth. of the City of San Diego, Sewer Rev. Bonds, Series 2009-A, 5.25% 2034 | 2,000 | 2,285 |
| Public Facs. Fncg. Auth. of the City of San Diego, Sewer Rev. Bonds, Series 2009-A, 5.375% 2034 | 1,000 | 1,149 |
| Public Facs. Fncg. Auth. of the City of San Diego, Water Rev. Bonds, Series 2009-B, 5.00% 2026 | 4,015 | 4,574 |
| Public Facs. Fncg. Auth. of the City of San Diego, Water Rev. Ref. Bonds, Series 2009-A, 5.00% 2021 | 1,000 | 1,155 |
| San Diego County Regional Airport Auth., Airport Rev. Bonds, Series 2010-A, 5.00% 2029 | 2,000 | 2,233 |
| San Diego County Regional Airport Auth., Airport Rev. Bonds, Series 2010-A, 5.00% 2034 | 1,355 | 1,475 |
| San Diego Unified School Dist., G.O. Bonds (Election of 2008), Series 2012-E, 0% 2036 | 2,500 | 927 |
| Airport Commission, City and County of San Francisco, San Francisco International Airport, Second Series Rev. Bonds, Series 2009-E, 5.25% 2032 | 16,500 | 18,834 |
| Airport Commission, City and County of San Francisco, San Francisco International Airport, Second Series Rev. Ref. Bonds, Series 2009-A, 4.90% 2029 | 5,000 | 5,648 |
| City and County of San Francisco Redev. Fin. Auth., Tax Allocation Rev. Bonds (Mission Bay South Redev. Project), Series 2014-A, 5.00% 2031 | 400 | 438 |
| City and County of San Francisco, Ref. Certs. of Part., Series 2010-A, 5.00% 2026 | 3,020 | 3,479 |
Public Utilities Commission of the City and County of San Francisco, San Francisco Water Rev. Bonds,
Series 2009-A, 5.00% 2024 | 7,500 | 8,795 |
Public Utilities Commission of the City and County of San Francisco, San Francisco Water Rev. Bonds,
Series 2009-A, 5.00% 2029 | 5,665 | 6,489 |
San Francisco State Building Auth., Lease Rev. Ref. Bonds (San Francisco Civic Center Complex),
Series 2005-A, FGIC-National insured, 5.00% 2019 | 4,000 | 4,240 |
| San Francisco State Building Auth., Lease Rev. Ref. Bonds (San Francisco Civic Center Complex), Series 2005-A, FGIC-National insured, 5.00% 2020 | 4,000 | 4,238 |
| City of San Jose, Airport Rev. Ref. Bonds, Series 2011-A-2, 5.25% 2034 | 3,000 | 3,259 |
| Redev. Agcy. of the City of San Jose, Housing Set-Aside Tax Allocation Bonds (Merged Area Redev. Project), Series 2010-A-1, 5.00% 2018 | 400 | 455 |
| Redev. Agcy. of the City of San Jose, Housing Set-Aside Tax Allocation Bonds (Merged Area Redev. Project), Series 2010-A-1, 5.00% 2024 | 800 | 868 |
| Redev. Agcy. of the City of San Jose, Housing Set-Aside Tax Allocation Bonds (Merged Area Redev. Project), Series 2010-A-1, 5.125% 2025 | 840 | 907 |
| Redev. Agcy. of the City of San Jose, Housing Set-Aside Tax Allocation Bonds (Merged Area Redev. Project), Series 2010-A-1, 5.50% 2035 | 1,500 | 1,596 |
The Tax-Exempt Bond Fund of America — Page 9 of 60
Bonds, notes & other debt instruments
California (continued) | Principal amount
(000) | Value
(000) |
| Redev. Agcy. of the City of San Jose, Tax Allocation Ref. Bonds (Merged Area Redev. Project), Series 2006-C, National insured, 3.75% 2028 | $2,000 | $1,937 |
| Redev. Agcy. of the City of San Jose, Tax Allocation Ref. Bonds (Merged Area Redev. Project), Series 2006-D, AMBAC insured, 5.00% 2021 | 5,000 | 5,381 |
San Mateo County Joint Powers Fncg. Auth., Lease Rev. Ref. Bonds (Capital Projects),
Series 2009-A, 5.25% 2023 | 2,000 | 2,305 |
San Mateo County Joint Powers Fncg. Auth., Lease Rev. Ref. Bonds (Capital Projects),
Series 2009-A, 5.25% 2024 | 1,000 | 1,149 |
| Community Redev. Agcy. of the City of Santa Ana, Tax Allocation Bonds, Series 2011-A, 6.00% 2022 | 3,350 | 3,990 |
| City of Santa Clara, Electric Rev. Ref. Bonds, Series 2011-A, 6.00% 2031 | 1,250 | 1,470 |
| Redev. Agcy. of the City of Santa Monica, 2011 Tax Allocation Bonds (Earthquake Recovery Redev. Project), 5.875% 2042 | 4,250 | 4,836 |
| Santa Rosa Rancheria Tachi Yokut Tribe, Enterprise Rev. Bonds, Series 2006, 4.875% 20162 | 1,040 | 1,046 |
| Santa Rosa Rancheria Tachi Yokut Tribe, Enterprise Rev. Bonds, Series 2006, 5.00% 20202 | 2,600 | 2,579 |
| School Fin. Auth., Charter School Rev. Bonds (Classical Academies Project), Series 2013-A-1, 7.375% 2043 | 1,000 | 1,104 |
| South Orange County Public Fncg. Auth., Special Tax Rev. Bonds (Ladera Ranch), Series 2005-A, AMBAC insured, 5.00% 2023 | 4,080 | 4,171 |
| Southern California Public Power Auth., Gas Project Rev. Bonds (Project No. 1), Series 2007-A, 5.00% 2029 | 2,000 | 2,186 |
Southern California Public Power Auth., Rev. Bonds (Milford Wind Corridor Phase I Project),
Series 2010-1, 5.00% 2030 | 7,165 | 8,194 |
| Statewide Communities Dev. Auth., Certs. of Part. (Internext Group), 5.375% 2017 | 555 | 557 |
| Statewide Communities Dev. Auth., Insured Health Fac. Rev. Bonds (Catholic Healthcare West), Series 2007-F, Assured Guaranty Municipal insured, 0.23% 20401 | 12,775 | 12,775 |
| Statewide Communities Dev. Auth., Rev. Bonds (California Baptist University), Series 2014-A, 6.125% 2033 | 1,565 | 1,711 |
| Statewide Communities Dev. Auth., Rev. Bonds (California Baptist University), Series 2014-A, 6.375% 2043 | 1,335 | 1,471 |
Statewide Communities Dev. Auth., Rev. Bonds (Front Porch Communities and Services Project),
Series 2007-A, 5.125% 20372 | 8,900 | 9,007 |
| Statewide Communities Dev. Auth., Rev. Bonds (Henry Mayo Newhall Memorial Hospital), Series 2014-A, Assured Guaranty Municipal insured, 5.25% 2043 | 2,100 | 2,268 |
| Statewide Communities Dev. Auth., Rev. Bonds (Inland Regional Center Project), Series 2007, 5.375% 2037 | 1,500 | 1,556 |
| Statewide Communities Dev. Auth., Rev. Bonds (Kaiser Permanente), Series 2009-A, 5.00% 2019 | 2,000 | 2,339 |
| Statewide Communities Dev. Auth., Rev. Bonds (Kaiser Permanente), Series 2012-A, 5.00% 2042 | 6,000 | 6,508 |
| Statewide Communities Dev. Auth., Rev. Bonds (Lancer Plaza Project), Series 2013, 5.125% 2023 | 1,000 | 1,046 |
Statewide Communities Dev. Auth., Rev. Bonds (Redwoods, a Community of Seniors),
Series 2013, 5.375% 2044 | 2,000 | 2,218 |
| Statewide Communities Dev. Auth., Rev. Bonds (Sutter Health), Series 2011-A, 6.00% 2042 | 9,000 | 10,786 |
Statewide Communities Dev. Auth., Rev. Ref. Bonds (American Baptist Homes of the West),
Series 2010, 5.375% 2020 | 2,000 | 2,225 |
Statewide Communities Dev. Auth., Rev. Ref. Bonds (American Baptist Homes of the West),
Series 2010, 6.00% 2029 | 2,625 | 2,837 |
Statewide Communities Dev. Auth., Rev. Ref. Bonds (American Baptist Homes of the West),
Series 2010, 6.25% 2039 | 4,200 | 4,509 |
Statewide Communities Dev. Auth., Rev. Ref. Bonds (American Baptist Homes of the West),
Series 2013-B-3, 2.10% 2019 | 1,250 | 1,250 |
| Statewide Communities Dev. Auth., Rev. Ref. Bonds (Catholic Healthcare West), Series 2008-B, 5.50% 2030 | 1,955 | 2,139 |
| Statewide Communities Dev. Auth., Rev. Ref. Bonds (Catholic Healthcare West), Series 2008-D, 5.50% 2031 | 5,860 | 6,404 |
| Statewide Communities Dev. Auth., Rev. Ref. Bonds (Cottage Health System Obligated Group), Series 2010, 5.25% 2030 | 4,850 | 5,280 |
| Statewide Communities Dev. Auth., Senior Living Rev. Ref. Bonds (Southern California Presbyterian Homes), Series 2006-A, 4.875% 2036 | 2,000 | 1,988 |
| Statewide Communities Dev. Auth., Senior Living Rev. Ref. Bonds (Southern California Presbyterian Homes), Series 2009, 6.625% 2024 | 1,680 | 1,921 |
| Statewide Communities Dev. Auth., Senior Living Rev. Ref. Bonds (Southern California Presbyterian Homes), Series 2009, 7.25% 2041 | 2,750 | 3,157 |
The Tax-Exempt Bond Fund of America — Page 10 of 60
Bonds, notes & other debt instruments
California (continued) | Principal amount
(000) | Value
(000) |
| Statewide Communities Dev. Auth., Student Housing Rev. Bonds (CHF-Irvine, LLC-UCI East Campus Apartments, Phase II), Series 2008, 6.00% 2040 | $5,500 | $5,912 |
| Statewide Communities Dev. Auth., Student Housing Rev. Ref. Bonds (CHF-Irvine, LLC-UCI East Campus Apartments, Phase I), Series 2011, 5.125% 2031 | 5,310 | 5,676 |
| Statewide Communities Dev. Auth., Student Housing Rev. Ref. Bonds (CHF-Irvine, LLC-UCI East Campus Apartments, Phase II), Series 2006, 5.00% 2018 | 2,695 | 2,872 |
| Statewide Communities Dev. Auth., Student Housing Rev. Ref. Bonds (CHF-Irvine, LLC-UCI East Campus Apartments, Phase II), Series 2006, 5.00% 2027 | 4,180 | 4,285 |
| Stockton Public Fncg. Auth., Rev. Bonds (Redev. Projects), Series 2006-A, RADIAN insured, 5.00% 2019 | 2,515 | 2,480 |
| Stockton Unified School Dist., G.O. Bonds, Series 2014-A, Assured Guaranty Municipal insured, 5.00% 2042 | 1,000 | 1,067 |
| City of Thousand Oaks Community Facs. Dist. No. 1994-1, Special Tax Ref. Bonds (Marketplace Public Pedestrian, Traffic Circulation and Parking Facs.), Series 2012, 5.375% 2031 | 1,000 | 1,074 |
Tobacco Securitization Auth. of Southern California, Tobacco Settlement Asset-backed Rev. Ref. Bonds
(San Diego County Tobacco Asset Securitization Corp.), Series 2006-A, 5.00% 2037 | 9,525 | 7,581 |
Tobacco Securitization Auth. of Southern California, Tobacco Settlement Asset-backed Rev. Ref. Bonds
(San Diego County Tobacco Asset Securitization Corp.), Series 2006-A, 5.125% 2046 | 25,440 | 19,205 |
| City of Torrance, Rev. Bonds (Torrance Memorial Medical Center), Series 2010-A, 5.00% 2040 | 3,000 | 3,149 |
| Tuolumne Wind Project Auth., Rev. Bonds (Tuolumne Co. Project), Series 2009-A, 5.25% 2023 | 3,000 | 3,407 |
| Tuolumne Wind Project Auth., Rev. Bonds (Tuolumne Co. Project), Series 2009-A, 5.625% 2029 | 2,120 | 2,481 |
| Turlock Irrigation Dist., Rev. Ref. Bonds, Series 2011, 5.50% 2041 | 17,990 | 20,152 |
Tustin Community Redev. Agcy., Tax Allocation Bonds (MCAS-Tustin Redev. Project Area), Series 2010,
4.50% 2023 | 1,160 | 1,256 |
Tustin Community Redev. Agcy., Tax Allocation Bonds (MCAS-Tustin Redev. Project Area), Series 2010,
5.00% 2028 | 705 | 754 |
Tustin Community Redev. Agcy., Tax Allocation Bonds (MCAS-Tustin Redev. Project Area), Series 2010,
5.00% 2032 | 1,000 | 1,052 |
| Regents of the University of California, Limited Project Rev. Ref. Bonds, Series 2012-G, 5.00% 2031 | 5,000 | 5,647 |
| Regents of the University of California, Limited Project Rev. Ref. Bonds, Series 2012-G, 5.00% 2037 | 3,000 | 3,305 |
| Ventura County Public Fncg. Auth., Lease Rev. Bonds, Series 2013-A, 5.00% 2029 | 3,000 | 3,451 |
| Washington Township Health Care Dist., Rev. Bonds, Series 2009-A, 5.75% 2024 | 1,020 | 1,128 |
| Washington Township Health Care Dist., Rev. Ref. Bonds, Series 2007-A, 5.00% 2022 | 1,435 | 1,519 |
| Dept. of Water Resources, Water System Rev. Ref. Bonds (Central Valley Project), Series AF, 5.00% 2029 | 3,590 | 4,122 |
| | | 1,078,888 |
| Colorado 2.68% | | |
Central Platte Valley Metropolitan Dist., City and County of Denver, G.O. Ref. Bonds, Series 2013-A,
5.375% 2033 | 1,750 | 1,952 |
Central Platte Valley Metropolitan Dist., City and County of Denver, G.O. Ref. Bonds, Series 2013-A,
5.625% 2038 | 1,000 | 1,129 |
| Compark Business Campus Metropolitan Dist., Douglas County, G.O. Ref. and Improvement Bonds, Series 2007-A, RADIAN insured, 5.25% 2021 | 2,650 | 2,778 |
Compark Business Campus Metropolitan Dist., Douglas County, G.O. Ref. and Improvement Bonds,
Series 2007-A, RADIAN insured, 5.60% 2034 | 3,610 | 3,672 |
| Cross Creek Metropolitan Dist. No. 2 (City of Aurora), Limited Tax G.O. Ref. Bonds, Series 2006, 5.00% 20371 | 1,000 | 848 |
| City and County of Denver, Airport System Rev. Ref. Bonds, Series 2005-A, XLCA insured, 5.00% 2020 | 2,215 | 2,348 |
City and County of Denver, Airport System Rev. Ref. Bonds, Series 2005-A, XLCA insured,
5.00% 2020 (preref. 2015) | 1,285 | 1,365 |
| City and County of Denver, Airport System Rev. Ref. Bonds, Series 2005-A, XLCA insured, 5.00% 2023 | 7,400 | 7,841 |
| City and County of Denver, Airport System Rev. Ref. Bonds, Series 2009-A, 5.00% 2031 | 3,000 | 3,304 |
| City and County of Denver, Airport System Rev. Ref. Bonds, Series 2009-A, 5.25% 2036 | 7,000 | 7,764 |
| City and County of Denver, Airport System Rev. Ref. Bonds, Series 2012-B, 5.00% 2025 | 3,000 | 3,444 |
| Denver Convention Center Hotel Auth., Rev. Ref. Bonds, Series 2006, XLCA insured, 5.00% 2035 | 1,500 | 1,521 |
| Denver Convention Center Hotel Auth., Rev. Ref. Bonds, Series 2006, XLCA insured, 5.25% 2019 | 4,155 | 4,409 |
| Denver Health and Hospital Auth., Healthcare Rev. Bonds, Series 2014-A, 5.00% 2039 | 1,000 | 1,053 |
| Denver Health and Hospital Auth., Healthcare Rev. Ref. Bonds, Series 2007-B, 1.252% 20331 | 9,450 | 7,806 |
The Tax-Exempt Bond Fund of America — Page 11 of 60
Bonds, notes & other debt instruments
Colorado (continued) | Principal amount
(000) | Value
(000) |
| Denver Urban Renewal Auth., Stapleton Tax Increment Rev. Bonds, Series 2013-A-1, 5.00% 2024 | $1,045 | $1,197 |
| Denver Urban Renewal Auth., Stapleton Tax Increment Rev. Bonds, Series 2013-A-1, 5.00% 2025 | 3,500 | 3,975 |
| E-470 Public Highway Auth., Rev. Bonds, Series 2007-CD-2, National insured, 1.81% 2039 (put 2017)1 | 6,400 | 6,446 |
Educational and Cultural Facs Auth., Rev. Bonds (Johnson & Wales University Project), Series 2013-A,
5.25% 2043 | 2,000 | 2,199 |
Educational and Cultural Facs. Auth., Rev. Ref. Bonds (Johnson & Wales Univ. Project), Series 2013-B,
5.00% 2027 | 1,500 | 1,692 |
| Educational and Cultural Facs. Auth., Student Housing Rev. Ref. Bonds (Campus Village Apartments Project), Series 2008, 5.375% 2028 | 2,000 | 2,235 |
| Educational and Cultural Facs. Auth., Student Housing Rev. Ref. Bonds (Campus Village Apartments Project), Series 2008, 5.50% 2038 | 3,000 | 3,308 |
| Health Facs. Auth., Health Care Facs. Rev. Bonds (American Baptist Homes of the Midwest Obligated Group), Series 2013, 8.00% 2043 | 6,300 | 7,312 |
Health Facs. Auth., Health Facs. Rev. Ref. Bonds (Evangelical Lutheran Good Samaritan Society Project),
Series 2004-A, 5.25% 2034 | 1,300 | 1,301 |
Health Facs. Auth., Health Facs. Rev. Ref. Bonds (Evangelical Lutheran Good Samaritan Society Project),
Series 2005, 5.00% 2016 | 420 | 436 |
Health Facs. Auth., Health Facs. Rev. Ref. Bonds (Evangelical Lutheran Good Samaritan Society Project),
Series 2005, 5.00% 2035 | 1,500 | 1,523 |
Health Facs. Auth., Health Facs. Rev. Ref. Bonds (Evangelical Lutheran Good Samaritan Society Project),
Series 2005, 5.25% 2023 | 1,725 | 1,795 |
Health Facs. Auth., Health Facs. Rev. Ref. Bonds (Evangelical Lutheran Good Samaritan Society Project),
Series 2006, 5.25% 2017 | 1,000 | 1,066 |
Health Facs. Auth., Health Facs. Rev. Ref. Bonds (Evangelical Lutheran Good Samaritan Society Project),
Series 2006, 5.25% 2018 | 2,250 | 2,384 |
Health Facs. Auth., Health Facs. Rev. Ref. Bonds (Evangelical Lutheran Good Samaritan Society Project),
Series 2006, 5.25% 2020 | 1,100 | 1,157 |
Health Facs. Auth., Health Facs. Rev. Ref. Bonds (Evangelical Lutheran Good Samaritan Society Project),
Series 2006, 5.25% 2025 | 4,215 | 4,495 |
Health Facs. Auth., Health Facs. Rev. Ref. Bonds (Evangelical Lutheran Good Samaritan Society Project),
Series 2006, 5.25% 2031 | 3,970 | 4,053 |
Health Facs. Auth., Health Facs. Rev. Ref. Bonds (Evangelical Lutheran Good Samaritan Society Project),
Series 2012, 5.00% 2033 | 5,490 | 5,780 |
Health Facs. Auth., Health Facs. Rev. Ref. Bonds (Evangelical Lutheran Good Samaritan Society Project),
Series 2012, 5.00% 2042 | 26,000 | 26,988 |
Health Facs. Auth., Health Facs. Rev. Ref. Bonds (Evangelical Lutheran Good Samaritan Society Project),
Series 2013, 5.625% 2043 | 1,000 | 1,097 |
Health Facs. Auth., Hospital Rev. Ref. Bonds (Adventist Health System/Sunbelt Obligated Group),
Series 2006-E, 5.00% 2015 (escrowed to maturity) | 135 | 143 |
Health Facs. Auth., Hospital Rev. Ref. Bonds (Adventist Health System/Sunbelt Obligated Group),
Series 2006-E, 5.125% 2017 (preref. 2016) | 175 | 194 |
Health Facs. Auth., Hospital Rev. Ref. Bonds (Longmont United Hospital Project), Series 2006-B,
RADIAN insured, 5.00% 2017 | 2,065 | 2,177 |
Health Facs. Auth., Hospital Rev. Ref. Bonds (Longmont United Hospital Project), Series 2006-B,
RADIAN insured, 5.00% 2018 | 2,000 | 2,092 |
Health Facs. Auth., Hospital Rev. Ref. Bonds (Longmont United Hospital Project), Series 2006-B,
RADIAN insured, 5.00% 2019 | 2,310 | 2,397 |
| Health Facs. Auth., Rev. Bonds (Catholic Health Initiatives), Series 2008-D-1, 6.25% 2033 | 1,000 | 1,150 |
| Health Facs. Auth., Rev. Bonds (Covenant Retirement Communities, Inc.), Series 2005, 5.00% 2035 | 18,310 | 18,431 |
| Health Facs. Auth., Rev. Bonds (Covenant Retirement Communities, Inc.), Series 2005, 5.25% 2025 | 3,510 | 3,573 |
| Health Facs. Auth., Rev. Bonds (Senior Residences Project), Series 2012, 7.00% 2042 | 2,500 | 2,632 |
| Health Facs. Auth., Rev. Bonds (Senior Residences Project), Series 2012, 7.125% 2047 | 2,665 | 2,823 |
Health Facs. Auth., Rev. Bonds (Total Longterm Care National Obligated Group Project),
Series 2011, 5.00% 2021 | 830 | 870 |
The Tax-Exempt Bond Fund of America — Page 12 of 60
Bonds, notes & other debt instruments
Colorado (continued) | Principal amount
(000) | Value
(000) |
Health Facs. Auth., Rev. Bonds (Total Longterm Care National Obligated Group Project),
Series 2011, 5.75% 2031 | $1,235 | $1,329 |
Health Facs. Auth., Rev. Bonds (Total Longterm Care National Obligated Group Project),
Series 2011, 6.00% 2040 | 1,000 | 1,077 |
| Health Facs. Auth., Rev. Ref. Bonds (Covenant Retirement Communities, Inc.), Series 2012-A, 5.00% 2033 | 5,000 | 5,189 |
| Health Facs. Auth., Rev. Ref. Bonds (Covenant Retirement Communities, Inc.), Series 2013-A, 5.75% 2036 | 4,000 | 4,255 |
| Health Facs. Auth., Rev. Ref. Bonds (Total Longterm Care National Obligated Group Project), Series 2010-A, 6.00% 2030 | 350 | 381 |
| Health Facs. Auth., Rev. Ref. Bonds (Total Longterm Care National Obligated Group Project), Series 2010-A, 6.25% 2040 | 975 | 1,056 |
| City of Lakewood, Plaza Metropolitan Dist. No. 1, Rev. Ref. Bonds, Series 2013, 5.00% 2021 | 1,000 | 1,077 |
| Maher Ranch Metropolitan Dist. No. 4 (Town of Castle Rock), G.O. Limited Tax Ref. Bonds, Series 2007, RADIAN insured, 5.00% 2022 | 2,560 | 2,684 |
North Range Metropolitan Dist. No. 1 (Adams County), Limited Tax G.O. Ref. Bonds, Series 2007,
ACA insured, 5.00% 2021 | 1,000 | 1,014 |
| Park Meadows Business Improvement Dist. in the City of Lone Tree, Shared Sales Tax Rev. Bonds, Series 2007, 5.00% 2017 | 1,030 | 1,105 |
| Prairie Center Metropolitan Dist. No. 3 (City of Brighton, Adams County), Limited Property Tax Supported Primary Improvements Rev. Bonds, Series 2006-A, 5.25% 2021 | 1,070 | 1,114 |
| Public Auth. for Colorado Energy, Natural Gas Purchase Rev. Bonds, Series 2008, 6.25% 2028 | 4,000 | 4,987 |
| Public Auth. for Colorado Energy, Natural Gas Purchase Rev. Bonds, Series 2008, 6.50% 2038 | 4,500 | 5,853 |
| Regional Transportation Dist., Certs. of Part., Series 2010-A, 5.375% 2031 | 3,000 | 3,289 |
| Regional Transportation Dist., Private Activity Bonds (Denver Transit Partners Eagle P3 Project), Series 2010, 6.00% 2034 | 1,600 | 1,783 |
| Regional Transportation Dist., Private Activity Bonds (Denver Transit Partners Eagle P3 Project), Series 2010, 6.00% 2041 | 23,765 | 26,348 |
| Regional Transportation Dist., Certs. of Part., Series 2014-A, 5.00% 2044 | 9,500 | 10,168 |
Southlands Metropolitan Dist. No. 1 (City of Aurora), G.O. Ref. and Improvement Bonds, Series 2007,
RADIAN insured, 5.00% 2017 | 1,115 | 1,168 |
| Tallgrass Metropolitan Dist., Arapahoe County, G.O. (Limited Tax Convertible to Unlimited Tax) Ref. and Improvement Bonds, Series 2007, 5.25% 2037 | 1,250 | 1,206 |
| Tallyn’s Reach Metropolitan Dist. No. 3 (City of Aurora), Limited Tax G.O. Bonds (Convertible to Unlimited Tax), Series 2007, 5.20% 2036 | 1,500 | 1,507 |
| Regents of the University of Colorado, University Enterprise Rev. Bonds, Series 2009-A, 5.375% 2032 | 1,500 | 1,734 |
| Vista Ridge Metropolitan Dist. (Weld County), Limited Tax G.O. Improvement and Ref. Bonds, Series 2006-A, RADIAN insured, 5.00% 2026 | 1,500 | 1,522 |
| Vista Ridge Metropolitan Dist. (Weld County), Limited Tax G.O. Improvement and Ref. Bonds, Series 2006-A, RADIAN insured, 5.00% 2036 | 2,000 | 2,003 |
| | | 250,004 |
| Connecticut 0.17% | | |
| Town of Hamden, Rev. Bonds (Whitney Center Project), Series 2009-A, 7.75% 2043 | 1,000 | 1,046 |
| Housing Fin. Auth., Housing Mortgage Fin. Program Rev. Ref. Bonds, Series 2013-B-2, 4.00% 2032 | 4,865 | 5,342 |
Mohegan Tribe of Indians, Gaming Auth. Priority Distribution Payment, Public Improvement Bonds,
Series 2003, 5.125% 2023 | 2,720 | 2,726 |
| Mohegan Tribe of Indians, Gaming Auth. Priority Distribution Payment, Public Improvement Rev. Ref. Bonds, Series 2001, 6.00% 2016 | 435 | 436 |
| Mohegan Tribe of Indians, Gaming Auth. Priority Distribution Payment, Public Improvement Rev. Ref. Bonds, Series 2001, 6.25% 2021 | 4,500 | 4,507 |
| Mohegan Tribe of Indians, Gaming Auth. Priority Distribution Payment, Public Improvement Rev. Ref. Bonds, Series 2001, 6.25% 2031 | 1,500 | 1,501 |
| | | 15,558 |
The Tax-Exempt Bond Fund of America — Page 13 of 60
Bonds, notes & other debt instruments
Delaware 0.04% | Principal amount
(000) | Value
(000) |
| Housing Auth., Single-family Mortgage Rev. Ref. Bonds, Series 2009-A-1, 5.45% 2040 | $495 | $514 |
| New Castle County, G.O. Bonds, Series 2009-A, 5.00% 2026 | 1,715 | 1,957 |
| New Castle County, G.O. Bonds, Series 2009-A, 5.00% 2027 | 1,395 | 1,583 |
| | | 4,054 |
| District of Columbia 0.73% | | |
| Ballpark Rev. Bonds, Series 2006-B-1, FGIC-National insured, 5.00% 2017 | 2,370 | 2,490 |
| Ballpark Rev. Bonds, Series 2006-B-1, FGIC-National insured, 5.25% 2016 | 1,000 | 1,060 |
| Dist. of Columbia, Rev. Bonds (Brookings Institution Issue), Series 2009, 5.75% 2039 | 8,000 | 8,738 |
Dist. of Columbia, Rev. Ref. Bonds (Catholic University of America Issue), Series 2007, National insured,
5.00% 2029 | 4,000 | 4,316 |
| Certs. of Part., Lease Rev. Bonds, Series 2006, FGIC-National insured, 5.00% 2019 | 2,000 | 2,116 |
| Certs. of Part., Lease Rev. Bonds, Series 2006, FGIC-National insured, 5.00% 2020 | 2,780 | 2,939 |
| Certs. of Part., Lease Rev. Bonds, Series 2006, FGIC-National insured, 5.00% 2023 | 1,575 | 1,665 |
| Certs. of Part., Lease Rev. Bonds, Series 2006, FGIC-National insured, 5.00% 2024 | 7,000 | 7,362 |
| University Rev. Bonds (Georgetown University Issue), Series 2001-C, 5.25% 2034 (put 2023) | 12,000 | 13,634 |
| Dist. of Columbia, Income Tax Secured Rev. Ref. Bonds, Series 2009-B, 5.25% 2034 | 5,000 | 5,754 |
| Dist. of Columbia, Tax Increment Rev. Bonds (City Market at O Street Project), Series 2011, 5.125% 2041 | 5,700 | 5,984 |
| Water and Sewer Auth., Public Utility Rev. Bonds, Series 2012-A, 5.00% 2037 | 3,000 | 3,339 |
| Water and Sewer Auth., Public Utility Rev. Bonds, Series 2012-B, 0.64% 2040 (put 2016)1 | 7,500 | 7,519 |
| Water and Sewer Auth., Public Utility Rev. Ref. Bonds, Series 2009-A, 6.00% 2035 | 1,000 | 1,151 |
| | | 68,067 |
| Florida 7.91% | | |
| Meadow Pointe IV, Community Dev. Dist. (Pasco County), Capital Improvement Rev. Bonds, Series 2014-B, 0%/7.25% 20224 | 385 | 329 |
| Meadow Pointe IV, Community Dev. Dist. (Pasco County), Capital Improvement Rev. Bonds, Series 2014-A, 0%/7.25% 20353,4 | 430 | 368 |
Alachua County Health Facs. Auth., Health Facs. Rev. Ref. Bonds (Shands HealthCare Project),
Series 2008-D-2, 6.75% 2030 | 9,000 | 9,956 |
Alachua County, Industrial Dev. Rev. Ref. Bonds (North Florida Retirement Village, Inc. Project),
Series 2007-A, 5.75% 2026 | 2,000 | 2,013 |
| City of Atlantic Beach, Health Care Facs. Rev. Bonds (Fleet Landing Project), Series 2013-B, 5.625% 2043 | 3,250 | 3,456 |
| Bartram Park Community Dev. Dist. (Jacksonville), Special Assessment Bonds, Series 2005, 5.30% 2035 | 1,715 | 1,723 |
| Dept. of Children and Family Services, Certs. of Part. (Florida Civil Commitment Center Project), Series 2006, National insured, 5.00% 2017 | 1,300 | 1,423 |
| Dept. of Children and Family Services, Certs. of Part. (Florida Civil Commitment Center Project), Series 2006, National insured, 5.00% 2019 | 2,900 | 3,170 |
| Dept. of Children and Family Services, Certs. of Part. (Florida Civil Commitment Center Project), Series 2006, National insured, 5.00% 2021 | 3,210 | 3,503 |
| Dept. of Children and Family Services, Certs. of Part. (Florida Civil Commitment Center Project), Series 2006, National insured, 5.00% 2023 | 3,545 | 3,860 |
| Dept. of Children and Family Services, Certs. of Part. (Florida Civil Commitment Center Project), Series 2006, National insured, 5.00% 2024 | 3,725 | 4,052 |
| Dept. of Children and Family Services, Certs. of Part. (Florida Civil Commitment Center Project), Series 2006, National insured, 5.00% 2025 | 3,920 | 4,258 |
| Dept. of Children and Family Services, Certs. of Part. (Florida Civil Commitment Center Project), Series 2006, National insured, 5.00% 2026 | 3,120 | 3,378 |
| Citizens Property Insurance Corp., Coastal Account Secured Bonds, Series 2011-A-1, 5.00% 2018 | 2,000 | 2,285 |
| Citizens Property Insurance Corp., Coastal Account Secured Bonds, Series 2011-A-1, 5.00% 2019 | 12,000 | 13,919 |
| Citizens Property Insurance Corp., High-Risk Account Secured Bonds, Series 2009-A-1, 6.00% 2017 | 20,000 | 22,931 |
| Citizens Property Insurance Corp., High-Risk Account Secured Bonds, Series 2010-A-1, 5.25% 2017 | 5,500 | 6,194 |
Citizens Property Insurance Corp., Personal Lines Account/Commercial Lines Account Secured Bonds,
Series 2012-A-1, 5.00% 2019 | 5,000 | 5,800 |
The Tax-Exempt Bond Fund of America — Page 14 of 60
Bonds, notes & other debt instruments
Florida (continued) | Principal amount
(000) | Value
(000) |
Citizens Property Insurance Corp., Personal Lines Account/Commercial Lines Account Secured Bonds,
Series 2012-A-1, 5.00% 2020 | $5,000 | $5,817 |
Citizens Property Insurance Corp., Personal Lines Account/Commercial Lines Account Secured Bonds,
Series 2012-A-1, 5.00% 2021 | 10,500 | 12,286 |
| School Board of Collier County, Certs. of Part. (Master Lease Program), Series 2007, Assured Guaranty Municipal insured, 5.00% 2024 | 4,080 | 4,483 |
| Dept. of Environmental Protection, Forever Rev. Bonds, Series 2007-B, National insured, 5.00% 2018 | 3,920 | 4,436 |
| Dept. of Environmental Protection, Forever Rev. Bonds, Series 2007-B, National insured, 5.00% 2020 | 5,780 | 6,499 |
Escambia County Health Facs. Auth., Health Care Facs. Rev. Bonds (Baptist Hospital, Inc. Project),
Series 2010-A, 5.75% 2029 | 14,755 | 16,591 |
Crossings at Fleming Island Community Dev. Dist. (Clay County), Special Assessment Ref. Bonds,
Series 2000-C, 7.10% 20305 | 8,145 | 6,492 |
Crossings at Fleming Island Community Dev. Dist. (Clay County), Special Assessment Ref. Bonds,
Series 2014-A2, 7.00% 2030 | 775 | 758 |
| Gramercy Farms Community Dev. Dist. (St. Cloud), Special Assessment Bonds, Series 2007-B, 5.10% 20145 | 10,125 | — |
| Gramercy Farms Community Dev. Dist. (St. Cloud), Special Assessment Ref. Bonds, Series 2011, 0% 2039 | 39,660 | 5,254 |
| Greater Orlando Aviation Auth., Airport Facs. Rev. Bonds, Series 2010-A, 5.00% 2024 | 1,000 | 1,125 |
| Greater Orlando Aviation Auth., Airport Facs. Rev. Ref. Bonds, Series 2009-C, 5.00% 2022 | 2,350 | 2,705 |
| Greater Orlando Aviation Auth., Airport Facs. Rev. Ref. Bonds, Series 2009-C, 5.00% 2023 | 2,465 | 2,827 |
| Greater Orlando Aviation Auth., Airport Facs. Rev. Ref. Bonds, Series 2009-C, 5.00% 2024 | 2,110 | 2,411 |
| Greater Orlando Aviation Auth., Airport Facs. Rev. Ref. Bonds, Series 2009-C, 5.00% 2025 | 2,715 | 3,079 |
| Greater Orlando Aviation Auth., Airport Facs. Rev. Ref. Bonds, Series 2009-C, 5.00% 2026 | 2,855 | 3,232 |
| Harbor Bay Community Dev. Dist. (Hillsborough County), Capital Improvement Rev. Bonds, Series 2002, 6.75% 2034 | 2,960 | 2,971 |
| Heritage Harbour Market Place Community Dev. Dist. (Manatee County), Capital Improvement Rev. Bonds, Series 2005, 5.60% 2036 | 2,720 | 2,526 |
| Higher Educational Facs. Fin. Auth., Educational Facs. Rev. Ref. Bonds (Nova Southeastern University Project), Series 2012-A, 5.00% 2027 | 2,000 | 2,144 |
| Higher Educational Facs. Fin. Auth., Educational Facs. Rev. Ref. Bonds (Nova Southeastern University Project), Series 2012-A, 5.00% 2032 | 1,000 | 1,042 |
| Highlands County Health Facs. Auth., Hospital Rev. Ref. Bonds (Adventist Health System/Sunbelt Obligated Group), Series 2005-B, 5.00% 2014 | 875 | 887 |
| Highlands County Health Facs. Auth., Hospital Rev. Ref. Bonds (Adventist Health System/Sunbelt Obligated Group), Series 2005-B, 5.00% 2014 (escrowed to maturity) | 125 | 127 |
| Highlands County Health Facs. Auth., Hospital Rev. Ref. Bonds (Adventist Health System/Sunbelt Obligated Group), Series 2005-B, 5.00% 2015 | 1,160 | 1,231 |
| Highlands County Health Facs. Auth., Hospital Rev. Ref. Bonds (Adventist Health System/Sunbelt Obligated Group), Series 2005-B, 5.00% 2015 (escrowed to maturity) | 165 | 175 |
| Highlands County Health Facs. Auth., Hospital Rev. Ref. Bonds (Adventist Health System/Sunbelt Obligated Group), Series 2005-B, 5.00% 2017 (preref. 2015) | 150 | 159 |
| Highlands County Health Facs. Auth., Hospital Rev. Ref. Bonds (Adventist Health System/Sunbelt Obligated Group), Series 2005-B, 5.00% 2020 (preref. 2015) | 140 | 149 |
| Highlands County Health Facs. Auth., Hospital Rev. Ref. Bonds (Adventist Health System/Sunbelt Obligated Group), Series 2006-G, 5.00% 2016 | 1,360 | 1,499 |
| Highlands County Health Facs. Auth., Hospital Rev. Ref. Bonds (Adventist Health System/Sunbelt Obligated Group), Series 2006-G, 5.00% 2016 (escrowed to maturity) | 50 | 55 |
| Highlands County Health Facs. Auth., Hospital Rev. Ref. Bonds (Adventist Health System/Sunbelt Obligated Group), Series 2006-G, 5.125% 2017 (preref. 2016) | 85 | 94 |
| Highlands County Health Facs. Auth., Hospital Rev. Ref. Bonds (Adventist Health System/Sunbelt Obligated Group), Series 2006-G, 5.125% 2019 | 2,165 | 2,381 |
| Highlands County Health Facs. Auth., Hospital Rev. Ref. Bonds (Adventist Health System/Sunbelt Obligated Group), Series 2006-G, 5.125% 2019 (preref. 2016) | 75 | 83 |
| Highlands County Health Facs. Auth., Hospital Rev. Ref. Bonds (Adventist Health System/Sunbelt Obligated Group), Series 2006-G, 5.125% 2022 | 1,930 | 2,116 |
The Tax-Exempt Bond Fund of America — Page 15 of 60
Bonds, notes & other debt instruments
Florida (continued) | Principal amount
(000) | Value
(000) |
| Highlands County Health Facs. Auth., Hospital Rev. Ref. Bonds (Adventist Health System/Sunbelt Obligated Group), Series 2006-G, 5.125% 2022 (preref. 2016) | $70 | $78 |
| Highlands County Health Facs. Auth., Hospital Rev. Ref. Bonds (Adventist Health System/Sunbelt Obligated Group), Series 2006-G, 5.125% 2023 | 1,780 | 1,949 |
| Highlands County Health Facs. Auth., Hospital Rev. Ref. Bonds (Adventist Health System/Sunbelt Obligated Group), Series 2006-G, 5.125% 2023 (preref. 2016) | 145 | 161 |
Hillsborough County Industrial Dev. Auth., Hospital Rev. Bonds (H. Lee Moffitt Cancer Center Project),
Series 2007-A, 5.25% 2022 | 3,945 | 4,240 |
| Hillsborough County Industrial Dev. Auth., Pollution Control Rev. Ref. Bonds (Tampa Electric Co. Project), Series 2007-A, 5.65% 2018 | 2,000 | 2,306 |
| Housing Fin. Corp., Homeowner Mortgage Rev. Bonds (Special Program), Series 2009-A-1, 5.00% 2028 | 2,265 | 2,436 |
| Housing Fin. Corp., Homeowner Mortgage Rev. Bonds (Special Program), Series 2010-A, 5.00% 2028 | 775 | 829 |
| Housing Fin. Corp., Homeowner Mortgage Rev. Bonds (Special Program), Series 2011-B, 4.50% 2029 | 740 | 800 |
| Housing Fin. Corp., Homeowner Mortgage Rev. Bonds, Series 2011-C, 4.50% 2030 | 1,000 | 1,092 |
| Hurricane Catastrophe Fund Fin. Corp., Rev. Bonds, Series 2010-A, 5.00% 2016 (escrowed to maturity) | 5,000 | 5,446 |
| City of Jacksonville, Better Jacksonville Sales Tax Rev. Ref. Bonds, Series 2011, 5.00% 2023 | 5,000 | 5,783 |
| City of Jacksonville, Better Jacksonville Sales Tax Rev. Ref. Bonds, Series 2012-A, 5.00% 2028 | 5,000 | 5,579 |
| City of Jacksonville, Better Jacksonville Sales Tax Rev. Ref. Bonds, Series 2012-A, 5.00% 2030 | 5,000 | 5,515 |
| Jacksonville Econ. Dev. Commission, Health Care Facs. Rev. Ref. Bonds (Proton Therapy Institute Project), Series 2007-A, 6.25% 20272 | 3,435 | 3,732 |
Jacksonville Health Facs. Auth., Hospital Rev. Bonds (Baptist Medical Center Project),
Series 2007-A, 5.00% 2023 | 2,130 | 2,356 |
Jacksonville Health Facs. Auth., Hospital Rev. Bonds (Baptist Medical Center Project),
Series 2007-A, 5.00% 2024 | 1,205 | 1,329 |
| JEA, Electric System Rev. Ref. Bonds, Series 2012-A, 4.00% 2033 | 3,000 | 3,059 |
| JEA, St. Johns River Power Park System Rev. Bonds, Issue Three, Series 2, 5.00% 2037 | 11,325 | 12,415 |
Lake Ashton Community Dev. Dist. (City of Lake Wales, Polk County), Capital Improvement Rev. Bonds,
Series 2001-A, 7.40% 2032 | 595 | 579 |
Lake Ashton Community Dev. Dist. (City of Lake Wales, Polk County), Capital Improvement Rev. Bonds,
Series 2003-A, 6.50% 2032 | 1,300 | 1,260 |
Lake Ashton II Community Dev. Dist. (Polk County), Capital Improvement Rev. Bonds,
Series 2006-A, 5.30% 20385 | 2,985 | 985 |
Lake Ashton II Community Dev. Dist. (Polk County), Capital Improvement Rev. Bonds,
Series 2006-B, 5.00% 20115 | 4,750 | 1,568 |
| City of Lakeland, Energy System Rev. Ref. Bonds, Series 2012, 0.81% 20171 | 11,880 | 11,899 |
| City of Lakeland, Hospital Rev. Ref. Bonds (Lakeland Regional Health Systems), Series 2006, 5.00% 2020 | 2,030 | 2,135 |
| City of Lakeland, Hospital Rev. Ref. Bonds (Lakeland Regional Health Systems), Series 2006, 5.00% 2024 | 2,000 | 2,067 |
| City of Lakeland, Retirement Community First Mortgage Rev. Ref. Bonds (Carpenter’s Home Estates, Inc. Project), Series 2008, 5.875% 2019 | 1,170 | 1,308 |
Lakewood Ranch Stewardship Dist., Special Assessment Rev. Bonds (Country Club East Project),
Series 2006, 5.40% 2037 | 2,700 | 2,322 |
Lakewood Ranch Stewardship Dist., Special Assessment Rev. Bonds (Lake Club Project),
Series 2006, 5.50% 2036 | 850 | 665 |
| Lee County Industrial Dev. Auth., Healthcare Facs. Rev. Bonds (Shell Point/Alliance Obligated Group, Shell Point Village Project), Series 2006, 5.00% 2032 | 9,050 | 9,082 |
| Lee County Industrial Dev. Auth., Healthcare Facs. Rev. Bonds (Shell Point/Alliance Obligated Group, Shell Point Village Project), Series 2006, 5.125% 2036 | 2,750 | 2,758 |
| Lee County Industrial Dev. Auth., Healthcare Facs. Rev. Ref. Bonds (Shell Point/Alliance Obligated Group, Shell Point Project), Series 2011-B, 6.125% 2026 | 500 | 554 |
| Lee County Industrial Dev. Auth., Healthcare Facs. Rev. Ref. Bonds (Shell Point/Alliance Obligated Group, Shell Point Village/Alliance Community Project), Series 2007, 5.00% 2014 | 4,040 | 4,078 |
| Lee County Industrial Dev. Auth., Healthcare Facs. Rev. Ref. Bonds (Shell Point/Alliance Obligated Group, Shell Point Village/Alliance Community Project), Series 2007, 5.00% 2015 | 2,000 | 2,080 |
| Lee County Industrial Dev. Auth., Healthcare Facs. Rev. Ref. Bonds (Shell Point/Alliance Obligated Group, Shell Point Village/Alliance Community Project), Series 2007, 5.00% 2016 | 1,000 | 1,064 |
The Tax-Exempt Bond Fund of America — Page 16 of 60
Bonds, notes & other debt instruments
Florida (continued) | Principal amount
(000) | Value
(000) |
| Lee County Industrial Dev. Auth., Healthcare Facs. Rev. Ref. Bonds (Shell Point/Alliance Obligated Group, Shell Point Village/Alliance Community Project), Series 2007, 5.00% 2017 | $4,680 | $5,010 |
| Lee County Industrial Dev. Auth., Healthcare Facs. Rev. Ref. Bonds (Shell Point/Alliance Obligated Group, Shell Point Village/Alliance Community Project), Series 2007, 5.00% 2022 | 8,150 | 8,408 |
| Lee County Industrial Dev. Auth., Healthcare Facs. Rev. Ref. Bonds (Shell Point/Alliance Obligated Group, Shell Point Village/Alliance Community Project), Series 2007, 5.00% 2029 | 12,295 | 12,425 |
| Dept. of Management Services, Certs. of Part., Series 2009-A, 5.00% 2023 | 5,000 | 5,677 |
| Dept. of Management Services, Certs. of Part., Series 2009-A, 5.00% 2024 | 3,000 | 3,394 |
| Marion County Hospital Dist., Health System Rev. Ref. and Improvement Bonds (Munroe Regional Health System), Series 2007, 5.00% 2022 (preref. 2017) | 1,460 | 1,659 |
Marshall Creek Community Dev. Dist. (St. Johns County), Special Assessment Bonds,
Series 2000-A, 7.65% 2032 | 3,300 | 3,302 |
Marshall Creek Community Dev. Dist. (St. Johns County), Special Assessment Bonds,
Series 2002, 6.625% 2032 | 2,850 | 2,501 |
Martin County Health Facs. Auth., Hospital Rev. Bonds (Martin Memorial Medical Center),
Series 2012, 5.50% 2042 | 2,000 | 2,127 |
| Meadow Pointe II, Community Dev. Dist. (Pasco County), Capital Improvement Rev. Ref. Bonds, Series 2004, 4.60% 2018 | 2,620 | 2,625 |
| Meadow Pointe III, Community Dev. Dist. (Pasco County), Capital Improvement Rev. Bonds, Series 2004-A, 6.00% 2035 | 1,370 | 1,375 |
| Meadow Pointe IV, Community Dev. Dist. (Pasco County), Capital Improvement Rev. Bonds, Series 2004-A, 6.00% 20365 | 2,085 | — |
| Meadow Pointe IV, Community Dev. Dist. (Pasco County), Capital Improvement Rev. Bonds, Series 2005, 5.25% 20155 | 725 | — |
| Meadow Pointe IV, Community Dev. Dist. (Pasco County), Capital Improvement Rev. Bonds, Series 2007-A, 6.25% 20385 | 3,005 | — |
| Meadow Pointe IV, Community Dev. Dist. (Pasco County), Capital Improvement Rev. Bonds, Series 2007-B, 6.15% 20145 | 1,385 | — |
| Meadow Pointe IV, Community Dev. Dist. (Pasco County), Capital Improvement Rev. Bonds, Series 2012, 5.25% 20155 | 590 | — |
| Meadow Pointe IV, Community Dev. Dist. (Pasco County), Capital Improvement Rev. Bonds, Series 2012-A-1, 6.00% 2036 | 1,210 | 1,144 |
| Meadow Pointe IV, Community Dev. Dist. (Pasco County), Capital Improvement Rev. Bonds, Series 2012-A-2, 6.25% 2038 | 2,305 | 2,113 |
| Meadow Pointe IV, Community Dev. Dist. (Pasco County), Capital Improvement Rev. Bonds, Series 2012-B, 6.81% 2020 | 2,630 | 2,616 |
| Midtown Miami Community Dev. Dist., Special Assessment and Rev. Ref. Bonds (Parking Garage Project), Series 2014-A, 4.25% 2024 | 2,480 | 2,528 |
| Midtown Miami Community Dev. Dist., Special Assessment and Rev. Ref. Bonds (Parking Garage Project), Series 2014-A, 5.00% 2029 | 1,000 | 1,029 |
| City of Miami Beach Health Facs. Auth., Hospital Rev. Ref. Bonds (Mount Sinai Medical Center of Florida), Series 2012, 4.00% 2018 | 2,000 | 2,148 |
| City of Miami Beach Health Facs. Auth., Hospital Rev. Ref. Bonds (Mount Sinai Medical Center of Florida), Series 2012, 5.00% 2020 | 1,000 | 1,136 |
Miami-Dade County Educational Facs. Auth., Rev. Bonds (University of Miami Issue), Series 2012-A,
4.00% 2037 | 1,000 | 998 |
| Miami-Dade County Educational Facs. Auth., Rev. Ref. Bonds (University of Miami Issue), Series 2007-B, AMBAC insured, 5.25% 2024 | 5,000 | 5,975 |
| Miami-Dade County Expressway Auth., Toll System Rev. Ref. Bonds, Series 2010-A, 5.00% 2040 | 3,050 | 3,222 |
| Miami-Dade County Expressway Auth., Toll System Rev. Ref. Bonds, Series 2013-A, 5.00% 2022 | 2,500 | 2,950 |
| Miami-Dade County Expressway Auth., Toll System Rev. Ref. Bonds, Series 2013-A, 5.00% 2023 | 2,350 | 2,737 |
| Miami-Dade County Expressway Auth., Toll System Rev. Ref. Bonds, Series 2013-A, 5.00% 2024 | 5,000 | 5,747 |
| Miami-Dade County Expressway Auth., Toll System Rev. Ref. Bonds, Series 2013-A, 5.00% 2025 | 4,140 | 4,712 |
| Miami-Dade County Expressway Auth., Toll System Rev. Ref. Bonds, Series 2013-A, 5.00% 2026 | 4,335 | 4,898 |
| Miami-Dade County Expressway Auth., Toll System Rev. Ref. Bonds, Series 2013-A, 5.00% 2033 | 2,600 | 2,837 |
The Tax-Exempt Bond Fund of America — Page 17 of 60
Bonds, notes & other debt instruments
Florida (continued) | Principal amount
(000) | Value
(000) |
| Miami-Dade County Expressway Auth., Toll System Rev. Ref. Bonds, Series 2014-A, 5.00% 2039 | $4,800 | $5,224 |
| Miami-Dade County Expressway Auth., Toll System Rev. Ref. Bonds, Series 2014-A, 5.00% 2044 | 4,000 | 4,326 |
| Miami-Dade County, Aviation Rev. Bonds, Series 2010-A, 5.00% 2029 | 3,555 | 3,974 |
| Miami-Dade County, Aviation Rev. Bonds, Series 2010-A, 5.375% 2035 | 1,000 | 1,138 |
| Miami-Dade County, Aviation Rev. Bonds, Series 2010-A, 5.375% 2041 | 4,000 | 4,464 |
| Miami-Dade County, Aviation Rev. Bonds, Series 2010-A, 5.50% 2041 | 2,800 | 3,218 |
| Miami-Dade County, Aviation Rev. Bonds, Series 2010-B, 5.00% 2041 | 5,000 | 5,351 |
| Miami-Dade County, G.O. Bonds (Building Better Communities Program), Series 2008-B-1, 5.75% 2033 | 5,000 | 5,693 |
Miami-Dade County, Miami International Airport (Hub of the Americas), Aviation Rev. Ref. Bonds,
Series 2009-A, 5.50% 2036 | 8,000 | 8,968 |
Miami-Dade County, Miami International Airport (Hub of the Americas), Aviation Rev. Ref. Bonds,
Series 2009-A, 5.75% 2023 | 5,480 | 6,515 |
Miami-Dade County, Miami International Airport (Hub of the Americas), Aviation Rev. Ref. Bonds,
Series 2009-B, 5.75% 2021 | 2,390 | 2,873 |
| Miami-Dade County, Water and Sewer System Rev. Bonds, Series 2010, 5.00% 2028 | 8,000 | 9,037 |
| Miami-Dade County, Water and Sewer System Rev. Ref. Bonds, Series 2008-B, Assured Guaranty Municipal insured, 5.25% 2022 | 5,000 | 6,064 |
| Miami-Dade County, Water and Sewer System Rev. Ref. Bonds, Series 2008-C, 5.375% 2024 | 7,500 | 8,620 |
| School Board of Miami-Dade County, Certs. of Part., Series 2006-C, AMBAC insured, 5.00% 2021 | 4,900 | 5,695 |
| School Board of Miami-Dade County, Certs. of Part., Series 2007-A, FGIC-National insured, 5.00% 2020 | 5,155 | 5,688 |
| Mid-Bay Bridge Auth., Rev. Ref. Bonds, Series 1993-D, 6.10% 2022 (escrowed to maturity) | 105 | 133 |
| Municipal Power Agcy., All-Requirements Power Supply Project Rev. Bonds, Series 2008-A, 5.00% 2027 | 1,000 | 1,123 |
| Municipal Power Agcy., All-Requirements Power Supply Project Rev. Bonds, Series 2008-A, 5.00% 2028 | 5,000 | 5,597 |
| Municipal Power Agcy., All-Requirements Power Supply Project Rev. Bonds, Series 2008-A, 5.00% 2031 | 6,500 | 7,155 |
| Municipal Power Agcy., All-Requirements Power Supply Project Rev. Bonds, Series 2008-A, 5.25% 2020 | 2,740 | 3,109 |
| Municipal Power Agcy., All-Requirements Power Supply Project Rev. Bonds, Series 2009-A, 5.25% 2023 | 3,000 | 3,504 |
| Municipal Power Agcy., All-Requirements Power Supply Project Rev. Bonds, Series 2009-A, 5.25% 2026 | 1,500 | 1,739 |
| Municipal Power Agcy., All-Requirements Power Supply Project Rev. Bonds, Series 2009-A, 5.50% 2024 | 3,255 | 3,830 |
| Municipal Power Agcy., Rev. Ref. Bonds (St. Lucie Project), Series 2012-A, 5.00% 2026 | 2,345 | 2,682 |
| North Springs Improvement Dist. (Broward County), Special Assessment Bonds (Parkland Golf and Country Club Assessment Area), Series 2005-A-1, 5.45% 2026 | 690 | 692 |
| Orange County Health Facs. Auth., Hospital Rev. Bonds (Orlando Health, Inc.), Series 2009, 5.00% 2014 | 1,000 | 1,008 |
| Orlando Utilities Commission, Utility System Rev. Bonds, Series 2005-B, 5.00% 2025 (preref. 2015) | 5,030 | 5,311 |
| Orlando Utilities Commission, Utility System Rev. Ref. Bonds, Series 2012-A, 5.00% 2024 | 1,000 | 1,232 |
| Orlando Utilities Commission, Utility System Rev. Ref. Bonds, Series 2013-A, 5.00% 2020 | 2,000 | 2,387 |
| Orlando Utilities Commission, Utility System Rev. Ref. Bonds, Series 2013-A, 5.00% 2021 | 3,000 | 3,614 |
| Orlando-Orange County Expressway Auth., Rev. Bonds, Series 2010-A, 5.00% 2029 | 5,505 | 6,021 |
| Orlando-Orange County Expressway Auth., Rev. Bonds, Series 2010-A, 5.00% 2035 | 5,000 | 5,366 |
| Orlando-Orange County Expressway Auth., Rev. Bonds, Series 2010-A, 5.00% 2040 | 3,000 | 3,195 |
| Orlando-Orange County Expressway Auth., Rev. Bonds, Series 2010-C, 5.00% 2040 | 7,500 | 7,987 |
| Orlando-Orange County Expressway Auth., Rev. Ref. Bonds, Series 2012-B, 5.00% 2024 | 2,000 | 2,374 |
| Orlando-Orange County Expressway Auth., Rev. Ref. Bonds, Series 2013-A, 5.00% 2035 | 27,350 | 29,888 |
| Palm Beach County Health Facs. Auth., Retirement Communities Rev. Bonds (ACTS Retirement-Life Communities, Inc. Obligated Group), Series 2010, 5.50% 2033 | 3,500 | 3,703 |
| Palm Beach County Health Facs. Auth., Retirement Communities Rev. Ref. Bonds (ACTS Retirement-Life Communities, Inc. Obligated Group), Series 2006-B, 5.00% 2020 | 9,295 | 9,703 |
| Palm Beach County Health Facs. Auth., Rev. Bonds (Harbour’s Edge Project), Series 2004-B, 2.75% 2034 | 1,200 | 1,158 |
| Solid Waste Auth. of Palm Beach County, Improvement Rev. Bonds, Series 2008-B, 5.50% 2028 | 5,000 | 5,797 |
| Solid Waste Auth. of Palm Beach County, Improvement Rev. Bonds, Series 2009, 5.25% 2021 | 4,000 | 4,749 |
| Paseo Community Dev. Dist., Fort Myers, Capital Improvement Rev. Bonds, Series 2005-B, 4.875% 20105 | 1,210 | — |
| Paseo Community Dev. Dist., Fort Myers, Capital Improvement Rev. Bonds, Series 2006, 5.00% 20115 | 575 | — |
| Paseo Community Dev. Dist., Fort Myers, Capital Improvement Rev. Bonds, Series 2011-A-1, 5.40% 2036 | 295 | 304 |
| Paseo Community Dev. Dist., Fort Myers, Capital Improvement Rev. Bonds, Series 2011-A-2, 0% 2036 | 3,310 | 1,354 |
| Pine Air Lakes Community Dev. Dist. (Collier County), Special Assessment Bonds, Series 2008, 6.75% 2039 | 3,290 | 3,351 |
The Tax-Exempt Bond Fund of America — Page 18 of 60
Bonds, notes & other debt instruments
Florida (continued) | Principal amount
(000) | Value
(000) |
| Ports Fncg. Commission, Rev. Ref. Bonds (State Transportation Trust Fund - Intermodal Program), Series 2011-A, 5.00% 2029 | $1,240 | $1,397 |
| Putnam County Dev. Auth., Pollution Control Rev. Ref. Bonds (Seminole Electric Cooperative, Inc. Project), Series 2007-B, AMBAC insured, 5.35% 2042 (put 2018) | 1,000 | 1,139 |
| City of St. Cloud, Stevens Plantation Community Dev. Dist., Special Assessment Rev. Bonds, Series 2003-B, 6.375% 20135 | 1,775 | 1,243 |
| St. Johns County Industrial Dev. Auth., First Mortgage Rev. Bonds (Presbyterian Retirement Communities Project), Series 2004-A, 5.625% 2034 | 1,000 | 1,010 |
| St. Johns County Industrial Dev. Auth., Health Care Rev. Ref. Bonds (Vicar’s Landing Project), Series 2007, 5.00% 2017 | 1,485 | 1,542 |
| St. Johns County Industrial Dev. Auth., Health Care Rev. Ref. Bonds (Vicar’s Landing Project), Series 2007, 5.00% 2027 | 4,130 | 4,204 |
St. Johns County Industrial Dev. Auth., Rev. Ref. Bonds (Presbyterian Retirement Communities Project),
Series 2010-A, 5.75% 2030 | 1,000 | 1,080 |
St. Johns County Industrial Dev. Auth., Rev. Ref. Bonds (Presbyterian Retirement Communities Project),
Series 2010-A, 5.875% 2040 | 5,625 | 6,031 |
St. Johns County Industrial Dev. Auth., Rev. Ref. Bonds (Presbyterian Retirement Communities Project),
Series 2010-A, 6.00% 2045 | 3,500 | 3,760 |
| Sampson Creek Community Dev. Dist. (St. Johns County), Capital Improvement Rev. Ref. Bonds, Series 2006, RADIAN insured, 4.50% 2026 | 1,000 | 986 |
| Sarasota County, G.O. Bonds, 5.00% 2020 | 2,410 | 2,659 |
| Sarasota County, G.O. Bonds, 5.00% 2020 (preref. 2018) | 285 | 332 |
| Sarasota County, G.O. Bonds, 5.00% 2021 | 2,555 | 2,792 |
| Sarasota County, G.O. Bonds, 5.00% 2021 (preref. 2018) | 300 | 350 |
| Seminole Tribe of Florida, Series A, 5.25% 20272 | 8,500 | 9,073 |
| Seminole Tribe of Florida, Series A, 5.50% 20242 | 8,000 | 8,709 |
| Seminole Tribe of Florida, Series A, 5.75% 20222 | 2,125 | 2,317 |
| South Broward Hospital Dist., Hospital Rev. Ref. Bonds (South Broward Hospital Dist. Obligated Group), Series 2008, 5.00% 2028 | 13,000 | 14,337 |
| South Lake County Hospital Dist., Rev. Ref. Bonds (South Lake Hospital, Inc.), Series 2010, 5.25% 2034 | 1,000 | 1,066 |
| City of South Miami Health Facs. Auth., Hospital Rev. Ref. Bonds (Baptist Health South Florida Obligated Group), Series 2007, 5.00% 2022 | 5,000 | 5,593 |
| State Board of Education, Lottery Rev. Bonds, Series 2008-A, 5.00% 2022 | 10,425 | 11,755 |
| State Board of Education, Lottery Rev. Bonds, Series 2008-A, 5.00% 2023 | 3,045 | 3,429 |
| State Board of Education, Lottery Rev. Bonds, Series 2008-B, 5.00% 2023 | 4,000 | 4,598 |
| City of Tallahassee, Energy System Rev. Ref. Bonds, Series 2010, 5.00% 2026 | 2,000 | 2,288 |
| City of Tallahassee, Energy System Rev. Ref. Bonds, Series 2010, 5.00% 2027 | 2,000 | 2,276 |
| City of Tallahassee, Energy System Rev. Ref. Bonds, Series 2010, 5.00% 2028 | 5,000 | 5,672 |
| City of Tampa, Health System Rev. Ref. Bonds (Baycare Health System Issue), Series 2010, 5.00% 2023 | 1,000 | 1,123 |
| City of Tampa, Rev. Ref. and Capital Improvement Cigarette Tax Allocation Bonds (H. Lee Moffitt Cancer Center Project), Series 2012-A, 4.00% 2033 | 3,000 | 3,001 |
| City of Tampa, Rev. Ref. and Capital Improvement Cigarette Tax Allocation Bonds (H. Lee Moffitt Cancer Center Project), Series 2012-A, 5.00% 2029 | 1,430 | 1,581 |
| Tampa-Hillsborough County Expressway Auth., Rev. Ref. Bonds, Series 2012-A, 5.00% 2027 | 1,000 | 1,125 |
| Tampa-Hillsborough County Expressway Auth., Rev. Ref. Bonds, Series 2012-A, 5.00% 2028 | 1,250 | 1,395 |
| Tampa-Hillsborough County Expressway Auth., Rev. Ref. Bonds, Series 2012-A, 5.00% 2032 | 4,000 | 4,367 |
| Tampa-Hillsborough County Expressway Auth., Rev. Ref. Bonds, Series 2012-B, 5.00% 2042 | 3,000 | 3,201 |
| Tolomato Community Dev. Dist. (St. Johns County), Special Assessment Bonds, Series 2006, 5.40% 2037 | 1,230 | 1,236 |
| Dept. of Transportation, Turnpike Rev. Ref. Bonds, Series 2008-A, 5.00% 2035 | 5,000 | 5,493 |
Urban Orlando Community Dev. Dist. (City of Orlando), Capital Improvement Rev. Bonds,
Series 2004, 6.00% 2020 | 560 | 564 |
Urban Orlando Community Dev. Dist. (City of Orlando), Capital Improvement Rev. Bonds,
Series 2004, 6.25% 2034 | 5,700 | 5,724 |
The Tax-Exempt Bond Fund of America — Page 19 of 60
Bonds, notes & other debt instruments
Florida (continued) | Principal amount
(000) | Value
(000) |
| Water Pollution Control Fncg. Corp., Water Pollution Control Rev. Bonds, Series 2008-A, 5.10% 2029 | $5,055 | $5,733 |
| Waterset North Community Dev. Dist. (Hillsborough County), Special Assessment Rev. Bonds, Series 2007-A, 6.60% 2039 | 1,175 | 1,126 |
| | | 737,275 |
| Georgia 3.30% | | |
| Atlanta Dev. Auth., Student Housing Facs. Rev. Bonds (Piedmont/Ellis, LLC Project Located on the Campus of Georgia State University), Series 2005-A, XLCA insured, 5.00% 2022 (preref. 2015) | 3,000 | 3,157 |
| Atlanta Dev. Auth., Student Housing Facs. Rev. Ref. Bonds (Piedmont/Ellis, LLC University Commons Project), Series 2013, 5.00% 2024 | 2,000 | 2,348 |
| Atlanta Dev. Auth., Student Housing Facs. Rev. Ref. Bonds (Piedmont/Ellis, LLC University Commons Project), Series 2013, 5.00% 2025 | 1,000 | 1,163 |
| Atlanta Dev. Auth., Student Housing Facs. Rev. Ref. Bonds (Piedmont/Ellis, LLC University Commons Project), Series 2013, 5.00% 2026 | 4,000 | 4,597 |
| Atlanta Dev. Auth., Student Housing Facs. Rev. Ref. Bonds (Piedmont/Ellis, LLC University Commons Project), Series 2013, 5.00% 2027 | 7,165 | 8,175 |
| Atlanta Dev. Auth., Student Housing Facs. Rev. Ref. Bonds (Piedmont/Ellis, LLC University Commons Project), Series 2013, 5.00% 2032 | 1,500 | 1,653 |
| Atlanta Dev. Auth., Student Housing Rev. Bonds (ADA/CAU Partners, Inc. Project at Clark Atlanta University), Series 2004-A, ACA insured, 6.25% 2024 | 1,500 | 1,314 |
| City of Atlanta, Airport General Rev. Bonds, Series 2012-B, 5.00% 2037 | 2,000 | 2,172 |
| City of Atlanta, Airport General Rev. Ref. Bonds, Series 2010-C, 5.00% 2025 | 10,000 | 11,381 |
| City of Atlanta, Airport Passenger Fac. Charge and General Rev. Bonds, Series 2010-B, 5.00% 2024 | 7,000 | 8,005 |
| City of Atlanta, Water and Wastewater Rev. Bonds, Series 2001-A, National insured, 5.50% 2027 | 5,000 | 6,065 |
| City of Atlanta, Water and Wastewater Rev. Ref. Bonds, Series 1999-A, FGIC-National insured, 5.50% 2022 | 20,500 | 24,182 |
Dev. Auth. of Burke County, Pollution Control Rev. Bonds (Oglethorpe Power Corp. Vogtle Project),
Series 2008-E, 7.00% 2023 | 19,670 | 22,927 |
Dev. Auth. of Burke County, Pollution Control Rev. Ref. Bonds (Oglethorpe Power Corp. Vogtle Project),
Series 2008-C, 5.70% 2043 | 8,000 | 8,602 |
| Dev. Auth. of Cobb County, Student Recreation and Activities Center Rev. Bonds (KSU SRAC Real Estate Foundation, LLC Project), Series 2013, 5.00% 2035 | 1,000 | 1,076 |
| Dev. Auth. of Cobb County, Student Recreation and Activities Center Rev. Bonds (KSU SRAC Real Estate Foundation, LLC Project), Series 2013, 5.00% 2038 | 1,500 | 1,602 |
DeKalb County Hospital Auth., Rev. Ref. Anticipation Certificates (DeKalb Medical Center, Inc. Project),
Series 2010, 6.00% 2030 | 5,950 | 6,397 |
DeKalb County Hospital Auth., Rev. Ref. Anticipation Certificates (DeKalb Medical Center, Inc. Project),
Series 2010, 6.125% 2040 | 10,625 | 11,270 |
| DeKalb County, Water and Sewerage Rev. Bonds (Second Resolution), Series 2011-A, 5.25% 2030 | 2,500 | 2,861 |
| DeKalb County, Water and Sewerage Rev. Bonds (Second Resolution), Series 2011-A, 5.25% 2031 | 1,500 | 1,708 |
| DeKalb County, Water and Sewerage Rev. Bonds (Second Resolution), Series 2011-A, 5.25% 2036 | 2,500 | 2,811 |
| Joint Dev. Auth. of DeKalb County, Newton County and Gwinnett County, Rev. Bonds (GGC Foundation, LLC Project), Series 2009, 6.00% 2029 | 5,000 | 5,624 |
| Joint Dev. Auth. of DeKalb County, Newton County and Gwinnett County, Rev. Bonds (GGC Foundation, LLC Project), Series 2009, 6.125% 2040 | 5,000 | 5,566 |
| Dev. Auth. of Fulton County, Rev. Bonds (TUFF CAUB LLC Project), Series 2007-A, 5.25% 2028 | 5,185 | 4,798 |
| Gainesville Redev. Auth., Educational Facs. Rev. Ref. Bonds (Riverside Military Academy Project), Series 2007, 5.00% 2018 | 3,455 | 3,501 |
| Gainesville Redev. Auth., Educational Facs. Rev. Ref. Bonds (Riverside Military Academy Project), Series 2007, 5.125% 2027 | 4,000 | 3,816 |
Dev. Auth. of Gwinnett County, Certs. of Part. (Gwinnett County Public Schools Project), Series 2006,
National insured, 5.25% 2021 | 5,000 | 5,949 |
Dev. Auth. of Gwinnett County, Certs. of Part. (Gwinnett County Public Schools Project), Series 2006,
National insured, 5.25% 2024 | 2,500 | 3,049 |
Dev. Auth. of Gwinnett County, Certs. of Part. (Gwinnett County Public Schools Project), Series 2006,
National insured, 5.25% 2025 | 2,500 | 3,064 |
The Tax-Exempt Bond Fund of America — Page 20 of 60
Bonds, notes & other debt instruments
Georgia (continued) | Principal amount
(000) | Value
(000) |
| Hospital Auth. of Hall County and City of Gainesville, Rev. Anticipation Certificates (Northeast Georgia Health System, Inc. Project), Series 2010-A, 5.00% 2030 | $12,345 | $13,060 |
Higher Education Facs. Auth., Rev. Bonds (USG Real Estate Foundation I, LLC Project),
Series 2008, 6.00% 2034 | 9,500 | 10,831 |
Higher Education Facs. Auth., Rev. Bonds (USG Real Estate Foundation II, LLC Project),
Series 2009-A, 5.375% 2029 | 2,500 | 2,733 |
Higher Education Facs. Auth., Rev. Bonds (USG Real Estate Foundation II, LLC Project),
Series 2009-A, 5.50% 2039 | 2,135 | 2,278 |
Higher Education Facs. Auth., Rev. Bonds (USG Real Estate Foundation III, LLC Project),
Series 2010-A, Assured Guaranty insured, 5.00% 2022 | 1,940 | 2,200 |
| Housing and Fin. Auth., Single-family Mortgage Bonds, Series 2013-A, 3.00% 2043 | 1,500 | 1,551 |
| Main Street Natural Gas, Inc., Gas Project Rev. Bonds, Series 2006-A, 5.00% 2017 | 2,000 | 2,174 |
| Main Street Natural Gas, Inc., Gas Project Rev. Bonds, Series 2006-A, 5.00% 2018 | 1,165 | 1,287 |
| Main Street Natural Gas, Inc., Gas Project Rev. Bonds, Series 2006-A, 5.00% 2022 | 2,000 | 2,278 |
| Main Street Natural Gas, Inc., Gas Project Rev. Bonds, Series 2006-B, 5.00% 2017 | 4,500 | 4,879 |
| Main Street Natural Gas, Inc., Gas Project Rev. Bonds, Series 2006-B, 5.00% 2019 | 9,000 | 10,043 |
| Main Street Natural Gas, Inc., Gas Project Rev. Bonds, Series 2006-B, 5.00% 2021 | 5,000 | 5,638 |
Medical Center Hospital Auth., Rev. Ref. Bonds (Spring Harbor at Green Island Project),
Series 2007, 4.625% 2015 | 875 | 894 |
Medical Center Hospital Auth., Rev. Ref. Bonds (Spring Harbor at Green Island Project),
Series 2007, 4.75% 2017 | 1,945 | 2,036 |
Medical Center Hospital Auth., Rev. Ref. Bonds (Spring Harbor at Green Island Project),
Series 2007, 5.25% 2027 | 3,625 | 3,675 |
Medical Center Hospital Auth., Rev. Ref. Bonds (Spring Harbor at Green Island Project),
Series 2007, 5.25% 2037 | 3,025 | 3,025 |
| Dev. Auth. of the City of Milledgeville and Baldwin County, Rev. Bonds (Georgia College & State University Foundation Property III, LLC Student Housing System Project), Series 2004, 5.00% 2014 (escrowed to maturity) | 2,000 | 2,008 |
| Dev. Auth. of the City of Milledgeville and Baldwin County, Rev. Bonds (Georgia College & State University Foundation Property III, LLC Student Housing System Project), Series 2004, 5.00% 2015 (preref. 2014) | 1,000 | 1,014 |
| Dev. Auth. of the City of Milledgeville and Baldwin County, Rev. Bonds (Georgia College & State University Foundation Property III, LLC Student Housing System Project), Series 2004, 5.625% 2030 (preref. 2014) | 3,000 | 3,044 |
Dev. Auth. of the City of Milledgeville and Baldwin County, Student Housing Rev. Ref. Bonds (Georgia College & State University Foundation Property V, LLC Project), Series 2007,
AMBAC insured, 0.807% 20331 | 7,000 | 5,581 |
| Municipal Electric Auth., Project One Bonds, Series 2011-A, 5.00% 2021 | 3,250 | 3,866 |
| Municipal Electric Auth., Project One Rev. Ref. Bonds, Series 2008-D, 5.50% 2026 | 6,000 | 6,932 |
| Municipal Electric Auth., Project One Rev. Ref. Bonds, Series 2008-D, 5.75% 2019 | 23,000 | 27,068 |
| Municipal Electric Auth., Project One Rev. Ref. Bonds, Series 2008-D, 6.00% 2023 | 11,100 | 13,104 |
| Public Gas Partners, Inc., Gas Project Rev. Ref. Bonds (Gas Supply Pool No. 1), Series A, 5.00% 2016 | 7,000 | 7,621 |
| | | 307,653 |
| Guam 0.21% | | |
| Education Fncg. Foundation, Certs. of Part. (Public School Facs. Project), Series 2006-A, 5.00% 2023 | 2,000 | 2,067 |
| Government of Guam, Business Privilege Tax Bonds, Series 2011-A, 5.00% 2031 | 1,100 | 1,161 |
| Government of Guam, Hotel Occupancy Tax Rev. Ref. Bonds, Series 2011-A, 6.125% 2031 | 1,000 | 1,115 |
| Power Auth., Rev. Ref. Bonds, Series 2010-A, 5.50% 2030 | 2,500 | 2,767 |
| Waterworks Auth., Water and Wastewater System Rev. Bonds, Series 2010, 5.625% 2040 | 3,810 | 4,101 |
| Waterworks Auth., Water and Wastewater System Rev. Bonds, Series 2013, 5.00% 2028 | 1,500 | 1,617 |
| Waterworks Auth., Water and Wastewater System Rev. Bonds, Series 2013, 5.50% 2043 | 6,350 | 6,971 |
| | | 19,799 |
The Tax-Exempt Bond Fund of America — Page 21 of 60
Bonds, notes & other debt instruments
Hawaii 0.27% | Principal amount
(000) | Value
(000) |
Pacific Health Obligated Group, Special Purpose Rev. Bonds (Dept. of Budget and Fin.),
Series 2010-B, 5.625% 2030 | $1,000 | $1,099 |
Pacific Health Obligated Group, Special Purpose Rev. Bonds (Dept. of Budget and Fin.),
Series 2013-A, 5.50% 2043 | 17,000 | 18,957 |
| Board of Regents of the University of Hawaii, University Rev. Bonds, Series 2009-A, 5.25% 2034 | 1,575 | 1,786 |
| Board of Regents of the University of Hawaii, University Rev. Bonds, Series 2009-A, 6.00% 2038 | 2,645 | 3,125 |
| | | 24,967 |
| Idaho 0.12% | | |
Housing and Fin. Assn., Grant and Rev. Anticipation Bonds (Federal Highway Trust Fund),
Series 2009-A, 5.00% 2027 | 2,260 | 2,519 |
Housing and Fin. Assn., Grant and Rev. Anticipation Bonds (Federal Highway Trust Fund),
Series 2009-A, 5.25% 2025 | 3,260 | 3,698 |
| Housing and Fin. Auth., Rev Bonds (Terraces of Boise Project), Series 2014-A, 8.00% 2044 | 5,000 | 5,150 |
| | | 11,367 |
| Illinois 8.90% | | |
| Village of Bartlett, Cook, DuPage and Kane Counties, Tax Increment Rev. Ref. Bonds (Bartlett Quarry Redev. Project), Series 2007, 5.35% 2017 | 1,495 | 1,576 |
| Village of Bolingbrook, Will and DuPage Counties, Special Service Area No. 2005-1, Special Tax Bonds (Forest City Project), Series 2005, 5.90% 2027 | 2,000 | 1,946 |
| Build Bonds (Sales Tax Rev. Bonds), Series 2009-A, 5.00% 2027 | 6,450 | 7,263 |
| Build Bonds (Sales Tax Rev. Bonds), Series 2009-B, 5.00% 2024 | 5,510 | 6,270 |
| Build Bonds (Sales Tax Rev. Bonds), Series 2009-B, 5.25% 2034 | 2,500 | 2,768 |
| Build Bonds (Sales Tax Rev. Bonds), Series April 2002, FGIC-National insured, 6.00% 2023 | 1,000 | 1,266 |
| Build Bonds (Sales Tax Rev. Bonds), Series October 2011, 5.00% 2029 | 4,000 | 4,440 |
| Build Bonds (Sales Tax Rev. Ref. Bonds), Second Series May 2002, FGIC-National insured, 5.75% 2019 | 6,250 | 7,457 |
| Build Bonds (Sales Tax Rev. Ref. Bonds), Series June 2010, 5.00% 2020 | 5,000 | 5,895 |
| Village of Cary, McHenry County, Special Service Area Number One, Special Tax Ref. Bonds, Series 2006, RADIAN insured, 5.00% 2030 | 1,925 | 1,937 |
| Chicago Housing Auth., Capital Program Rev. Ref. Bonds, Series 2006, Assured Guaranty Municipal insured, 5.00% 2019 (preref. 2016) | 3,000 | 3,259 |
| Chicago Transit Auth., Sales Tax Receipts Rev. Bonds, Series 2011, 5.00% 2022 | 2,250 | 2,584 |
| Chicago Transit Auth., Sales Tax Receipts Rev. Bonds, Series 2011, 5.25% 2036 | 3,000 | 3,269 |
| Chicago Transit Auth., Sales Tax Receipts Rev. Bonds, Series 2014, 5.25% 2049 | 12,500 | 13,499 |
| City of Chicago, Chicago Midway Airport, Rev. Ref. Bonds, Series 2010-B, 5.00% 2034 (preref. 2015) | 3,100 | 3,162 |
| City of Chicago, Chicago Midway Airport, Rev. Ref. Bonds, Series 2013-B, 5.25% 2034 | 3,000 | 3,307 |
| City of Chicago, Chicago Midway Airport, Rev. Ref. Bonds, Series 2014-B, 5.00% 2026 | 1,000 | 1,147 |
| City of Chicago, Chicago Midway Airport, Rev. Ref. Bonds, Series 2014-B, 5.00% 2034 | 5,000 | 5,440 |
City of Chicago, G.O. Bonds (Emergency Telephone System), Ref. Series 1999,
FGIC-National insured, 5.25% 2020 | 2,000 | 2,238 |
| City of Chicago, G.O. Bonds, Ref. Series 2009-A, 5.00% 2026 | 5,000 | 5,205 |
| City of Chicago, G.O. Bonds, Ref. Series 2009-A, Assured Guaranty Municipal insured, 5.00% 2026 | 5,000 | 5,290 |
| City of Chicago, O’Hare International Airport, Customer Fac. Charge Rev. Bonds, Series 2013, 5.25% 2024 | 1,000 | 1,150 |
| City of Chicago, O’Hare International Airport, Customer Fac. Charge Rev. Bonds, Series 2013, 5.50% 2027 | 2,000 | 2,292 |
| City of Chicago, O’Hare International Airport, Customer Fac. Charge Rev. Bonds, Series 2013, 5.75% 2038 | 4,000 | 4,357 |
City of Chicago, O’Hare International Airport, General Airport Rev. Bonds, Series 2005-A,
AMBAC insured, 5.00% 2020 | 1,000 | 1,060 |
City of Chicago, O’Hare International Airport, General Airport Rev. Bonds, Series 2005-A,
FGIC-National insured, 5.00% 2033 | 5,000 | 5,203 |
| City of Chicago, O’Hare International Airport, General Airport Rev. Bonds, Series 2010-F, 5.00% 2035 | 8,515 | 8,949 |
| City of Chicago, O’Hare International Airport, General Airport Rev. Bonds, Series 2010-F, 5.00% 2040 | 1,500 | 1,570 |
| City of Chicago, O’Hare International Airport, General Airport Rev. Bonds, Series 2011-A, 5.75% 2039 | 13,000 | 14,648 |
| City of Chicago, O’Hare International Airport, General Airport Rev. Bonds, Series 2011-C, 5.50% 2031 | 3,000 | 3,369 |
| City of Chicago, O’Hare International Airport, General Airport Rev. Bonds, Series 2013-D, 5.00% 2039 | 10,000 | 10,544 |
The Tax-Exempt Bond Fund of America — Page 22 of 60
Bonds, notes & other debt instruments
Illinois (continued) | Principal amount
(000) | Value
(000) |
City of Chicago, O’Hare International Airport, General Airport Rev. Ref. Bonds, Series 2005-B,
FGIC-National insured, 5.25% 2015 | $1,500 | $1,532 |
City of Chicago, O’Hare International Airport, General Airport Rev. Ref. Bonds, Series 2005-B,
National insured, 5.25% 2016 | 5,000 | 5,346 |
City of Chicago, O’Hare International Airport, General Airport Rev. Ref. Bonds, Series 2005-B,
National insured, 5.25% 2017 | 4,000 | 4,444 |
City of Chicago, O’Hare International Airport, General Airport Rev. Ref. Bonds, Series 2008-A,
Assured Guaranty Municipal insured, 5.00% 2023 | 4,000 | 4,450 |
| City of Chicago, Sales Tax Rev. Ref. Bonds, Series 2009-A, 5.00% 2029 | 5,000 | 5,343 |
| City of Chicago, Sales Tax Rev. Ref. Bonds, Series 2011-A, 5.00% 2041 | 1,500 | 1,561 |
| City of Chicago, School Reform Board of Trustees of the Board of Education, Unlimited Tax G.O. Bonds (Dedicated Tax Rev.), Series 1997-A, AMBAC insured, 0% 2015 | 3,245 | 3,207 |
| City of Chicago, Wastewater Transmission Rev. Project Bonds, Series 2012, 5.00% 2042 | 5,000 | 5,225 |
City of Chicago, Wastewater Transmission Rev. Project Bonds, Series 2012,
Assured Guaranty Municipal insured, 5.00% 2037 | 400 | 426 |
| Metropolitan Water Reclamation Dist. of Greater Chicago, G.O. Ref. Bonds, Unlimited Tax Series A of March 2007, 5.00% 2020 | 6,000 | 7,114 |
| Public Building Commission of Chicago, Building Rev. Ref. Bonds (Chicago Transit Auth.), Series 2006, AMBAC insured, 5.25% 2023 | 2,000 | 2,295 |
| Public Building Commission of Chicago, Building Rev. Ref. Bonds (Chicago Transit Auth.), Series 2006, AMBAC insured, 5.25% 2025 | 1,000 | 1,133 |
| Public Building Commission of Chicago, Building Rev. Ref. Bonds (Chicago Transit Auth.), Series 2006, AMBAC insured, 5.25% 2026 | 4,175 | 4,709 |
| Public Building Commission of Chicago, Building Rev. Ref. Bonds (Chicago Transit Auth.), Series 2006, AMBAC insured, 5.25% 2027 | 1,000 | 1,129 |
| Civic Center Bonds, Special State Obligation Bonds, Series 1991, AMBAC insured, 6.25% 2020 | 5,355 | 5,958 |
| Community College Dist. No. 508, County of Cook (City Colleges of Chicago), Unlimited Tax G. O. Bonds, Series 2013, 5.25% 2043 | 3,650 | 3,950 |
| County of Cook, Sales Tax Rev. Bonds, Series 2012, 5.00% 2037 | 3,500 | 3,826 |
Regional Transportation Auth. of Cook, DuPage, Kane, Lake, McHenry and Will Counties, G.O. Bonds,
Series 1994-D, FGIC-National insured, 7.75% 2019 | 4,500 | 5,314 |
Regional Transportation Auth. of Cook, DuPage, Kane, Lake, McHenry and Will Counties, G.O. Bonds,
Series 2003-B, National insured, 5.75% 2033 | 9,630 | 11,968 |
Regional Transportation Auth. of Cook, DuPage, Kane, Lake, McHenry and Will Counties, G.O. Bonds,
Series 2004-A, Assured Guaranty Municipal insured, 5.50% 2021 | 8,540 | 10,325 |
Regional Transportation Auth. of Cook, DuPage, Kane, Lake, McHenry and Will Counties, G.O. Bonds,
Series 2004-A, Assured Guaranty Municipal insured, 5.50% 2022 | 6,500 | 7,915 |
| Regional Transportation Auth. of Cook, DuPage, Kane, Lake, McHenry and Will Counties, G.O. Rev. Ref. Bonds, Series 1997, FGIC-National insured, 6.00% 2020 | 3,820 | 4,598 |
| Regional Transportation Auth. of Cook, DuPage, Kane, Lake, McHenry and Will Counties, G.O. Rev. Ref. Bonds, Series 1999, Assured Guaranty Municipal insured, 5.75% 2023 | 2,000 | 2,475 |
| Regional Transportation Auth. of Cook, DuPage, Kane, Lake, McHenry and Will Counties, G.O. Rev. Ref. Bonds, Series 1999, Assured Guaranty Municipal insured, 6.00% 2025 | 2,150 | 2,713 |
| Build Bonds (Sales Tax Rev. Bonds), Series 2009-B, 5.00% 2024 (preref. 2019) | 2,810 | 3,300 |
| Educational Facs. Auth., Rev. Bonds (Field Museum of Natural History), Series 2002, 4.45% 2036 (put 2014) | 1,000 | 1,010 |
| Educational Facs. Auth., Rev. Bonds (Field Museum of Natural History), Series 2002, 4.60% 2036 (put 2015) | 6,000 | 6,269 |
| Educational Facs. Auth., Rev. Bonds (Field Museum of Natural History), Series 2002, 4.75% 2036 (put 2016) | 2,000 | 2,174 |
| Fin. Auth., Rev. Bonds (University of Chicago), Series 2012-A, 5.00% 2051 | 5,000 | 5,286 |
| Fin. Auth. Rev. Bonds (Silver Cross Hospital and Medical Centers), Series 2009, 7.00% 2044 | 3,000 | 3,438 |
Fin. Auth., Charter School Project and Rev. Ref. Bonds (Chicago Charter School Foundation Project),
Series 2007-A, 5.00% 2021 | 1,975 | 2,065 |
Fin. Auth., Charter School Project and Rev. Ref. Bonds (Chicago Charter School Foundation Project),
Series 2007-A, 5.00% 2026 | 1,475 | 1,496 |
| Fin. Auth., Rev. Bonds (Advocate Health Care Network), Series 2008-D, 6.50% 2038 | 3,000 | 3,472 |
| Fin. Auth., Rev. Bonds (Advocate Health Care Network), Series 2012, 5.00% 2042 | 4,000 | 4,227 |
The Tax-Exempt Bond Fund of America — Page 23 of 60
Bonds, notes & other debt instruments
Illinois (continued) | Principal amount
(000) | Value
(000) |
| Fin. Auth., Rev. Bonds (DePaul University), Series 2008, 4.75% 2028 | $500 | $524 |
| Fin. Auth., Rev. Bonds (DePaul University), Series 2008, 5.00% 2024 | 2,650 | 2,860 |
| Fin. Auth., Rev. Bonds (DePaul University), Series 2011-A, 6.125% 2040 | 16,020 | 18,395 |
| Fin. Auth., Rev. Bonds (Elmhurst Memorial Healthcare), Series 2008-A, 5.625% 2037 | 9,500 | 10,200 |
| Fin. Auth., Rev. Bonds (Hospital Sisters Services, Inc. - Obligated Group), Series 2007-A, 5.00% 2026 | 11,050 | 12,106 |
| Fin. Auth., Rev. Bonds (Lutheran Home and Services Obligated Group), Series 2012, 5.50% 2030 | 1,500 | 1,537 |
| Fin. Auth., Rev. Bonds (Northwest Community Hospital), Series 2008-A, 5.25% 2028 | 3,000 | 3,256 |
| Fin. Auth., Rev. Bonds (Rehab Institute of Chicago), Series 2013-A, 6.00% 2043 | 2,700 | 2,993 |
| Fin. Auth., Rev. Bonds (SwedishAmerican Hospital), Series 2004, AMBAC insured, 5.00% 2014 | 1,740 | 1,758 |
| Fin. Auth., Rev. Bonds (Three Crowns Park Project), Series 2006-A, 5.625% 2018 | 2,320 | 2,404 |
| Fin. Auth., Rev. Bonds (Three Crowns Park Project), Series 2006-A, 5.875% 2038 | 1,250 | 1,254 |
| Fin. Auth., Rev. Bonds (University of Chicago), Series 2007, 5.00% 2020 | 1,340 | 1,484 |
| Fin. Auth., Rev. Bonds (University of Chicago), Series 2007, 5.00% 2021 | 2,455 | 2,719 |
| Fin. Auth., Rev. Bonds (University of Chicago), Series 2008-B, 5.50% 2028 | 4,630 | 5,283 |
| Fin. Auth., Rev. Bonds (University of Chicago), Series 2008-B, 5.75% 2033 | 2,250 | 2,594 |
| Fin. Auth., Rev. Bonds (University of Chicago), Series 2008-B, 6.25% 2038 | 12,000 | 13,811 |
| Fin. Auth., Rev. Ref. Bonds (Advocate Health Care Network), Series 2008-A-3, 5.00% 2030 (put 2019) | 1,000 | 1,156 |
| Fin. Auth., Rev. Ref. Bonds (Advocate Health Care Network), Series 2010-B, 5.375% 2044 | 1,000 | 1,086 |
| Fin. Auth., Rev. Ref. Bonds (Art Institute of Chicago), Series 2010-A, 5.00% 2015 | 4,250 | 4,368 |
| Fin. Auth., Rev. Ref. Bonds (Art Institute of Chicago), Series 2010-A, 5.25% 2040 | 5,350 | 5,735 |
| Fin. Auth., Rev. Ref. Bonds (Art Institute of Chicago), Series 2012-A, 5.00% 2034 | 4,950 | 5,350 |
| Fin. Auth., Rev. Ref. Bonds (Ascension Health Alliance Credit Group), Series 2012-A, 5.00% 2042 | 7,500 | 8,046 |
| Fin. Auth., Rev. Ref. Bonds (Clare at Water Tower), Series 2010-A-6, 6.00% 20285 | 700 | — |
| Fin. Auth., Rev. Ref. Bonds (Clare at Water Tower), Series 2010-A-7, 6.125% 20415 | 8,750 | — |
| Fin. Auth., Rev. Ref. Bonds (Clare at Water Tower), Series 2010-B, 0% 2050 | 4,050 | — |
| Fin. Auth., Rev. Ref. Bonds (DePaul University), Series 2004-A, 5.375% 2016 | 2,035 | 2,243 |
| Fin. Auth., Rev. Ref. Bonds (DePaul University), Series 2004-A, 5.375% 2018 | 1,010 | 1,177 |
| Fin. Auth., Rev. Ref. Bonds (DePaul University), Series 2013, 5.00% 2024 | 600 | 692 |
| Fin. Auth., Rev. Ref. Bonds (Franciscan Communities, Inc.), Series 2004-B, 6.50% 2034 | 1,250 | 1,289 |
| Fin. Auth., Rev. Ref. Bonds (Franciscan Communities, Inc.), Series 2004-B, 6.50% 2034 (preref. 2017) | 1,200 | 1,395 |
| Fin. Auth., Rev. Ref. Bonds (Loyola University of Chicago), 5.00% 2022 | 3,095 | 3,417 |
| Fin. Auth., Rev. Ref. Bonds (Loyola University of Chicago), 5.00% 2022 (preref. 2017) | 345 | 389 |
| Fin. Auth., Rev. Ref. Bonds (Loyola University of Chicago), 5.00% 2023 | 5,850 | 6,459 |
| Fin. Auth., Rev. Ref. Bonds (Loyola University of Chicago), 5.00% 2023 (preref. 2017) | 650 | 732 |
| Fin. Auth., Rev. Ref. Bonds (Loyola University of Chicago), Series 2012-B, 5.00% 2025 | 3,000 | 3,346 |
| Fin. Auth., Rev. Ref. Bonds (Loyola University of Chicago), Series 2012-B, 5.00% 2026 | 1,500 | 1,661 |
| Fin. Auth., Rev. Ref. Bonds (Loyola University of Chicago), Series 2012-B, 5.00% 2042 | 9,385 | 9,889 |
| Fin. Auth., Rev. Ref. Bonds (Lutheran Hillside Village), Series 2006, 5.00% 2018 | 1,070 | 1,133 |
| Fin. Auth., Rev. Ref. Bonds (Lutheran Hillside Village), Series 2006, 5.125% 2026 | 7,800 | 7,969 |
| Fin. Auth., Rev. Ref. Bonds (Lutheran Hillside Village), Series 2006, 5.25% 2037 | 9,530 | 9,661 |
| Fin. Auth., Rev. Ref. Bonds (Northwestern Memorial HealthCare), Series 2013, 5.00% 2037 | 1,000 | 1,083 |
| Fin. Auth., Rev. Ref. Bonds (Northwestern Memorial Hospital), Series 2009-A, 6.00% 2039 | 14,000 | 16,181 |
| Fin. Auth., Rev. Ref. Bonds (OSF Healthcare System), Series 2007-A, 5.25% 2022 | 2,500 | 2,747 |
| Fin. Auth., Rev. Ref. Bonds (OSF Healthcare System), Series 2007-A, 5.75% 2033 | 2,000 | 2,124 |
| Fin. Auth., Rev. Ref. Bonds (OSF Healthcare System), Series 2007-A, 5.75% 2037 | 4,500 | 4,764 |
| Fin. Auth., Rev. Ref. Bonds (OSF Healthcare System), Series 2010-A, 6.00% 2039 | 15,335 | 17,199 |
| Fin. Auth., Rev. Ref. Bonds (Palos Community Hospital), Series 2007-A, National insured, 5.00% 2021 | 2,300 | 2,461 |
| Fin. Auth., Rev. Ref. Bonds (Palos Community Hospital), Series 2007-A, National insured, 5.00% 2022 | 4,520 | 4,764 |
| Fin. Auth., Rev. Ref. Bonds (Palos Community Hospital), Series 2007-A, National insured, 5.00% 2023 | 4,755 | 4,979 |
| Fin. Auth., Rev. Ref. Bonds (Provena Health), Series 2009-A, 7.75% 2034 | 8,000 | 9,893 |
| Fin. Auth., Rev. Ref. Bonds (Provena Health), Series 2010-A, 6.00% 2028 | 14,000 | 15,297 |
| Fin. Auth., Rev. Ref. Bonds (Riverside Health System), Series 2006-C, 4.50% 2026 | 5,360 | 5,464 |
| Fin. Auth., Rev. Ref. Bonds (Riverside Health System), Series 2006-C, 5.00% 2018 | 1,910 | 2,036 |
| Fin. Auth., Rev. Ref. Bonds (Riverside Health System), Series 2006-C, 5.00% 2019 | 2,005 | 2,117 |
| Fin. Auth., Rev. Ref. Bonds (Riverside Health System), Series 2006-C, 5.00% 2020 | 2,105 | 2,212 |
The Tax-Exempt Bond Fund of America — Page 24 of 60
Bonds, notes & other debt instruments
Illinois (continued) | Principal amount
(000) | Value
(000) |
| Fin. Auth., Rev. Ref. Bonds (Sherman Health Systems), Series 2007-A, 5.50% 2037 | $3,000 | $3,261 |
| Fin. Auth., Rev. Ref. Bonds (University of Chicago Medical Center), Series 2009-B, 5.00% 2025 | 10,500 | 11,740 |
| Fin. Auth., Rev. Ref. Bonds (University of Chicago Medical Center), Series 2009-B, 5.00% 2026 | 4,000 | 4,437 |
| Fin. Auth., Student Housing Rev. Bonds (CHF-Normal, L.L.C. - Illinois State University Project), Series 2011, 6.75% 2031 | 1,000 | 1,144 |
| Fin. Auth., Student Housing Rev. Bonds (CHF-Normal, L.L.C. - Illinois State University Project), Series 2011, 7.00% 2043 | 10,000 | 11,525 |
Fin. Auth., Student Housing Rev. Ref. Bonds (CHF-DeKalb II, L.L.C. - Northern Illinois University Project),
Series 2011, 6.875% 2043 | 27,500 | 31,750 |
Fin. Auth., Student Housing Rev. Ref. Bonds, Educational Advancement Fund, Inc. (University Center),
Series 2006-A, 5.25% 2034 | 7,890 | 8,008 |
Fin. Auth., Student Housing Rev. Ref. Bonds, Educational Advancement Fund, Inc. (University Center),
Series 2006-B, 5.00% 2025 | 10,000 | 10,189 |
Fin. Auth., Student Housing Rev. Ref. Bonds, Educational Advancement Fund, Inc. (University Center),
Series 2006-B, 5.25% 2019 | 4,000 | 4,223 |
| G.O. Bonds, Series 2014, 5.00% 2039 | 5,000 | 5,047 |
| G.O. Bonds, Series of March 2012, 5.00% 2023 | 2,000 | 2,159 |
| G.O. Bonds, Series of March 2012, 5.00% 2035 | 1,000 | 1,017 |
| G.O. Bonds, Series of May 2014, 5.00% 2026 | 2,000 | 2,130 |
| G.O. Bonds, Series of May 2014, 5.00% 2039 | 4,400 | 4,442 |
Health Facs. Auth., Rev. Bonds (Evangelical Hospitals Corp.), Series 1992-C,
6.25% 2022 (escrowed to maturity) | 4,000 | 4,987 |
| Health Facs. Auth., Rev. Ref. Bonds (Lutheran General Health), Series 1993-C, 6.00% 2018 | 2,705 | 2,995 |
| Housing Dev. Auth., Housing Rev. Bonds, Series 2013-A, 2.45% 20433 | 1,536 | 1,481 |
| Housing Dev. Auth., Housing Rev. Ref. Bonds, Series G, 4.55% 2021 | 405 | 414 |
| Housing Dev. Auth., Housing Rev. Ref. Bonds, Series G, 4.65% 2026 | 1,445 | 1,465 |
| Village of Lakemoor, McHenry and Lake Counties, Special Service Area Number 97-1, Special Tax Ref. Bonds, Series 2006, RADIAN insured, 4.55% 2016 | 357 | 362 |
| Village of Manhattan (Will County), Special Service Area Number 2007-5, Special Tax Bonds (Lakeside Towns at Liberty Center Project), Series 2007, 6.125% 20405 | 2,300 | 667 |
| Village of Manhattan (Will County), Special Service Area Number 2007-6, Special Tax Bonds (Groebe Farm-Stonegate Project), Series 2007, 5.75% 20225 | 1,900 | 323 |
Metropolitan Pier and Exposition Auth., McCormick Place Expansion Project Bonds, Series 2012-A,
5.00% 2042 | 3,100 | 3,272 |
| Village of Montgomery, Kane and Kendall Counties, Special Assessment Improvement Ref. Bonds (Lakewood Creek Project), Series 2006, RADIAN insured, 4.70% 2030 | 822 | 797 |
| City of Quincy, Adams County, Rev. Ref. Bonds (Blessing Hospital), Series 2007, 5.00% 2017 | 1,000 | 1,104 |
| Railsplitter Tobacco Settlement Auth., Tobacco Settlement Rev. Bonds, Series 2010, 5.125% 2019 | 3,500 | 4,046 |
| Railsplitter Tobacco Settlement Auth., Tobacco Settlement Rev. Bonds, Series 2010, 5.25% 2020 | 7,500 | 8,778 |
| Southwestern Illinois Dev. Auth., Health Fac. Rev. Bonds (Memorial Group, Inc.), Series 2013, 7.625% 2048 | 7,790 | 8,660 |
Sports Facs. Auth., Sports Facs. Ref. Bonds (State Tax Supported), Series 2014,
Assured Guaranty Municipal insured, 5.25% 2032 | 1,000 | 1,086 |
| City of Springfield, Electric Rev. Bonds, Series 2008, 5.00% 2036 | 5,500 | 5,692 |
| State Toll Highway Auth., Toll Highway Priority Rev. Bonds, Series 2006-A-1, Assured Guaranty Municipal insured, 5.00% 2024 | 5,000 | 5,398 |
| State Toll Highway Auth., Toll Highway Rev. Bonds, Series 2008-B, 5.50% 2033 | 18,210 | 20,206 |
| State Toll Highway Auth., Toll Highway Rev. Bonds, Series 2013-A, 5.00% 2027 | 1,305 | 1,501 |
| State Toll Highway Auth., Toll Highway Rev. Bonds, Series 2013-A, 5.00% 2028 | 1,000 | 1,138 |
| State Toll Highway Auth., Toll Highway Rev. Bonds, Series 2013-A, 5.00% 2029 | 3,000 | 3,399 |
| State Toll Highway Auth., Toll Highway Rev. Bonds, Series 2013-A, 5.00% 2030 | 7,100 | 7,989 |
| State Toll Highway Auth., Toll Highway Rev. Bonds, Series 2013-A, 5.00% 2032 | 1,000 | 1,111 |
| State Toll Highway Auth., Toll Highway Rev. Bonds, Series 2013-A, 5.00% 2033 | 2,200 | 2,429 |
| State Toll Highway Auth., Toll Highway Rev. Bonds, Series 2013-A, 5.00% 2038 | 28,250 | 30,767 |
| State Toll Highway Auth., Toll Highway Rev. Bonds, Series 2014-B, 5.00% 2038 | 2,500 | 2,745 |
| State Toll Highway Auth., Toll Highway Rev. Bonds, Series 2014-B, 5.00% 2039 | 3,000 | 3,289 |
The Tax-Exempt Bond Fund of America — Page 25 of 60
Bonds, notes & other debt instruments
Illinois (continued) | Principal amount
(000) | Value
(000) |
| State Toll Highway Auth., Toll Highway Rev. Ref. Bonds, Series 2010-A-1, 4.50% 2027 | $6,000 | $6,479 |
| State Toll Highway Auth., Toll Highway Rev. Ref. Bonds, Series 2010-A-1, 5.00% 2025 | 10,000 | 11,289 |
| State Toll Highway Auth., Toll Highway Rev. Ref. Bonds, Series 2010-A-1, 5.00% 2028 | 10,000 | 11,098 |
| State Toll Highway Auth., Toll Highway Rev. Ref. Bonds, Series 2010-A-1, 5.00% 2031 | 4,000 | 4,417 |
| Board of Trustees of the University of Illinois, Auxiliary Facs. System Rev. Ref. Bonds, Series 2001-A, AMBAC insured, 5.50% 2021 | 2,670 | 3,221 |
Board of Trustees of the University of Illinois, Auxiliary Facs. System Rev. Ref. Bonds, Series 2013-A,
5.00% 2025 | 10,000 | 11,574 |
| Board of Trustees of the University of Illinois, Certs. of Part. (Ref. and Projects), Series 2007-A, Assured Guaranty Municipal insured, 5.00% 2025 | 7,145 | 7,963 |
| Board of Trustees of the University of Illinois, Ref. Certs. of Part., Series 2009-A, 5.00% 2019 | 1,000 | 1,116 |
Board of Trustees of The University of Illinois, University of Illinois Auxiliary Facs. System Rev. Bonds,
Series 2011-A, 5.25% 2041 | 1,750 | 1,896 |
Board of Trustees of The University of Illinois, University of Illinois Auxiliary Facs. System Rev. Bonds,
Series 2011-A, 5.50% 2031 | 2,000 | 2,221 |
Board of Trustees of the University of Illinois, University of Illinois Auxiliary Facs. System Rev. Bonds,
Series 2014-A, 5.00% 2039 | 2,000 | 2,171 |
| Community Unit School Dist. No. 365-U, Will County (Valley View), G.O. Capital Appreciation School Bonds, Series 2002, Assured Guaranty Municipal insured, 0% 2017 | 2,000 | 1,917 |
| Forest Preserve Dist. of Will County, G.O. Bonds, Series 2005-A, National insured, 5.00% 2017 (preref. 2015) | 1,500 | 1,598 |
| | | 829,878 |
| Indiana 2.25% | | |
| Bond Bank, Special Program Gas Rev. Bonds, Series 2007-A, 5.25% 2020 | 985 | 1,136 |
| Fin. Auth., Educational Facs. Rev. Bonds (Valparaiso University Project), Series 2007, 5.00% 2027 | 1,800 | 1,985 |
| Fin. Auth., Environmental Rev. Ref. Bonds (Duke Energy Indiana, Inc. Project), Series 2009-B, 6.00% 2039 | 3,000 | 3,365 |
Fin. Auth., Health System Rev. Bonds (Sisters of St. Francis Health Services, Inc. Obligated Group),
Series 2009-A, 5.25% 2039 | 1,000 | 1,065 |
| Fin. Auth., Hospital Rev. Ref. Bonds (Community Health Network Project), Series 2012-A, 5.00% 2042 | 1,350 | 1,437 |
| Fin. Auth., Hospital Rev. Ref. Bonds (Indiana University Health Obligated Group), Series 2011-N, 5.00% 2031 | 7,000 | 7,514 |
| Fin. Auth., Hospital Rev. Ref. Bonds (Parkview Health System Obligated Group), Series 2012-A, 5.00% 2029 | 1,450 | 1,602 |
Fin. Auth., Midwestern Disaster Relief Rev. Bonds (Ohio Valley Electric Corp. Project),
Series 2012-A, 5.00% 2032 | 6,500 | 6,706 |
Fin. Auth., Midwestern Disaster Relief Rev. Bonds (Ohio Valley Electric Corp. Project),
Series 2012-A, 5.00% 2039 | 18,415 | 18,815 |
| Fin. Auth., Rev. Ref. Bonds (Trinity Health Credit Group), Series 2010-B, 5.00% 2028 | 2,000 | 2,219 |
| Fin. Auth., State Revolving Fund Program Bonds, Series 2007-B, 5.00% 2024 | 5,535 | 6,281 |
| Fin. Auth., State Revolving Fund Program Rev. Ref. Bonds, Series 2005-A, 5.25% 2017 | 1,500 | 1,678 |
| Fin. Auth., Wastewater Utility Rev. Bonds (CWA Auth. Project), Series 2011-A, 5.25% 2031 | 5,000 | 5,660 |
| Fin. Auth., Rev. Bonds (Greencroft Obligated Group), Series 2013-A, 7.00% 2043 | 1,000 | 1,131 |
Health and Educational Fac. Fncg. Auth., Hospital Rev. Bonds (Clarian Health Obligated Group),
Series 2006-A, 5.00% 2039 | 17,750 | 18,049 |
| Health and Educational Fac. Fncg. Auth., Hospital Rev. Bonds (Community Foundation of Northwest Indiana Obilgated Group), Series 2007, 5.25% 2017 | 1,400 | 1,552 |
| Health and Educational Fac. Fncg. Auth., Hospital Rev. Bonds (Community Foundation of Northwest Indiana Obilgated Group), Series 2007, 5.50% 2022 | 5,000 | 5,441 |
| Health and Educational Fac. Fncg. Auth., Hospital Rev. Bonds (Community Foundation of Northwest Indiana Obligated Group), Series 2007, 5.50% 2027 | 3,700 | 4,026 |
| Health and Educational Fac. Fncg. Auth., Hospital Rev. Bonds (Community Foundation of Northwest Indiana Obligated Group), Series 2007, 5.50% 2037 | 7,000 | 7,359 |
Health and Educational Fac. Fncg. Auth., Hospital Rev. Ref. Bonds (Clarian Health Obligated Group),
Series 2006-B, 5.00% 2018 | 1,125 | 1,200 |
Health and Educational Fac. Fncg. Auth., Hospital Rev. Ref. Bonds (Clarian Health Obligated Group),
Series 2006-B, 5.00% 2023 | 7,500 | 7,973 |
The Tax-Exempt Bond Fund of America — Page 26 of 60
Bonds, notes & other debt instruments
Indiana (continued) | Principal amount
(000) | Value
(000) |
Health and Educational Fac. Fncg. Auth., Hospital Rev. Ref. Bonds (Clarian Health Obligated Group),
Series 2006-B, 5.00% 2033 | $5,000 | $5,098 |
| Health and Educational Fac. Fncg. Auth., Rev. Ref. Bonds (Ascension Health Credit Group), Series 2006-B-5, 5.00% 2036 | 10,000 | 10,499 |
| Health Fac. Fncg. Auth., Hospital Rev. Bonds (Community Health Network Project), Series 2005-A, AMBAC insured, 5.00% 2019 (preref. 2015) | 4,195 | 4,347 |
| Trustees of Indiana University, Consolidated Rev. Bonds, Series 2009-A, 5.00% 2028 | 2,000 | 2,295 |
| Trustees of Indiana University, Consolidated Rev. Ref. Bonds, Series 2012-A, 5.00% 2037 | 1,500 | 1,670 |
| Trustees of Indiana University, Student Fee Rev. Ref. Bonds, Series O, FGIC-National insured, 5.375% 2016 | 4,690 | 5,165 |
| Indianapolis Local Public Improvement Bond Bank Rev. Ref. Bonds (Waterworks Project), Series 2007-B, National insured, 5.25% 2023 | 10,420 | 12,326 |
| Indianapolis Local Public Improvement Bond Bank Rev. Ref. Bonds (Waterworks Project), Series 2007-B, National insured, 5.25% 2023 | 6,055 | 7,192 |
| Indianapolis Local Public Improvement Bond Bank Rev. Ref. Bonds, Series 2011-K, 5.00% 2024 | 2,000 | 2,310 |
| Jasper County, Pollution Control Rev. Ref. Bonds (Northern Indiana Public Service Co. Project), Series 1988-A, National insured, 5.60% 2016 | 1,000 | 1,088 |
| Jasper County, Pollution Control Rev. Ref. Bonds (Northern Indiana Public Service Co. Project), Series 1988-C, National insured, 5.60% 2016 | 1,000 | 1,088 |
| Jasper County, Pollution Control Rev. Ref. Bonds (Northern Indiana Public Service Co. Project), Series 1988-C, National insured, 5.85% 2019 | 3,000 | 3,433 |
| Jasper County, Pollution Control Rev. Ref. Bonds (Northern Indiana Public Service Co. Project), Series 2003, AMBAC insured, 5.70% 2017 | 3,000 | 3,318 |
| Municipal Power Agcy., Power Supply System Rev. Bonds, Series 2009-B, 5.50% 2026 | 2,000 | 2,301 |
| Municipal Power Agcy., Power Supply System Rev. Bonds, Series 2013-A, 5.00% 2042 | 2,750 | 2,943 |
| Municipal Power Agcy., Power Supply System Rev. Bonds, Series 2013-A, 5.25% 2030 | 1,500 | 1,703 |
| Municipal Power Agcy., Power Supply System Rev. Bonds, Series 2013-A, 5.25% 2032 | 2,000 | 2,246 |
| Municipal Power Agcy., Power Supply System Rev. Bonds, Series 2013-A, 5.25% 2038 | 2,000 | 2,207 |
| Municipal Power Agcy., Power Supply System Rev. Ref. Bonds, Series 2011-A, 5.00% 2031 | 2,000 | 2,189 |
| North Side High School Building Corp. (Fort Wayne), First Mortgage Rev. Ref. Bonds, Series 2007, Assured Guaranty Municipal insured, 5.00% 2018 | 1,650 | 1,873 |
| City of Petersburg, Pollution Control Rev. Ref. Bonds (Indianapolis Power & Light Co. Project), Series 1993-B, AMBAC insured, 5.40% 2017 | 5,000 | 5,625 |
| Trustees of Purdue University, Certs. of Part., Series 2006, 5.25% 2018 | 1,130 | 1,308 |
| Trustees of Purdue University, Certs. of Part., Series 2006, 5.25% 2019 | 1,430 | 1,679 |
| Trustees of Purdue University, Certs. of Part., Series 2006, 5.25% 2025 | 1,980 | 2,462 |
Trustees of Purdue University, Purdue University Student Fee Bonds, Rev. Ref. Bonds,
Series 2012-AA, 5.00% 2030 | 1,500 | 1,708 |
| Trustees of Purdue University, Purdue University Student Fee Bonds, Series X, 5.25% 2021 | 1,620 | 1,927 |
| Trustees of Purdue University, Purdue University Student Fee Bonds, Series X, 5.25% 2022 | 1,825 | 2,165 |
| Trustees of Purdue University, Purdue University Student Fee Bonds, Series X, 5.25% 2027 | 1,000 | 1,174 |
| City of Rockport, Pollution Control Rev. Ref. Bonds (Indiana Michigan Power Co. Project), Series 2014-A, 1.75% 2025 (put 2018) | 1,000 | 1,002 |
| Vanderburgh County Redev. Dist., Tax Increment Rev. Bonds of 2006, 5.00% 2018 (preref. 2016) | 1,185 | 1,295 |
| Vanderburgh County Redev. Dist., Tax Increment Rev. Bonds of 2006, 5.00% 2019 (preref. 2016) | 1,245 | 1,361 |
| Vanderburgh County Redev. Dist., Tax Increment Rev. Bonds of 2006, 5.00% 2026 (preref. 2016) | 4,000 | 4,371 |
| Hospital Auth. of Vigo County, Hospital Rev. Bonds (Union Hospital, Inc.), Series 2007, 5.75% 2042 | 2,000 | 1,979 |
| | | 209,541 |
The Tax-Exempt Bond Fund of America — Page 27 of 60
Bonds, notes & other debt instruments
Iowa 0.45% | Principal amount
(000) | Value
(000) |
| Fin. Auth., Single-family Mortgage Bonds (Mortgage-backed Securities Program), Series 2009-A, 5.00% 2038 | $405 | $428 |
| Fin. Auth., Single-family Mortgage Bonds (Mortgage-backed Securities Program), Series 2013-1, 2.15% 20433 | 932 | 863 |
| Fin. Auth., Midwestern Disaster Area Rev. Ref. Bonds (Iowa Fertilizer Co. Project), Series 2013, 5.00% 2019 | 23,000 | 24,235 |
| Fin. Auth., Midwestern Disaster Area Rev. Ref. Bonds (Iowa Fertilizer Co. Project), Series 2013, 5.25% 2025 | 5,000 | 5,289 |
| Fin. Auth., Midwestern Disaster Area Rev. Ref. Bonds (Iowa Fertilizer Co. Project), Series 2013, 5.50% 2022 | 2,000 | 2,089 |
| IJOBS Program Special Obligation Bonds, Series 2009-A, 5.00% 2027 | 3,500 | 4,027 |
| IJOBS Program Special Obligation Bonds, Series 2010-A, 5.00% 2029 | 4,590 | 5,262 |
| | | 42,193 |
| Kansas 0.54% | | |
| Dev. Fin. Auth., Hospital Rev. Ref. Bonds (Adventist Health System/Sunbelt Obligated Group), Series 2012-A, 5.00% 2032 | 1,500 | 1,659 |
| Dev. Fin. Auth., Rev. Ref. Bonds (Lifespace Communities, Inc.), Series 2010-S, 5.00% 2030 | 5,625 | 5,886 |
| City of Lawrence, Hospital Rev. Ref. Bonds (Lawrence Memorial Hospital), Series 2006, 5.25% 2018 | 890 | 947 |
| City of Lawrence, Hospital Rev. Ref. Bonds (Lawrence Memorial Hospital), Series 2006, 5.25% 2020 | 530 | 557 |
| City of Lenexa, Health Care Fac. Rev. Bonds (Lakeview Village, Inc. Project), Series 2009, 7.125% 2029 | 250 | 278 |
| City of Lenexa, Health Care Fac. Rev. Bonds (Lakeview Village, Inc. Project), Series 2009, 7.25% 2039 | 750 | 826 |
City of Lenexa, Health Care Fac. Rev. Ref. and Improvement Bonds (Lakeview Village, Inc. Project),
Series 2007, 5.25% 2022 | 2,500 | 2,580 |
City of Lenexa, Health Care Fac. Rev. Ref. and Improvement Bonds (Lakeview Village, Inc. Project),
Series 2007, 5.50% 2039 | 14,500 | 14,610 |
City of Overland Park, Transportation Dev. Dist. Special Assessment Bonds (Tallgrass Creek Project),
Series 2006, 4.85% 2016 | 621 | 637 |
City of Overland Park, Transportation Dev. Dist. Special Assessment Bonds (Tallgrass Creek Project),
Series 2006, 5.125% 2028 | 1,894 | 1,895 |
| City of Salina, Hospital Rev. Ref. and Improvement Bonds (Salina Regional Health Center, Inc.), Series 2006, 4.625% 2031 | 1,825 | 1,849 |
| Dept. of Transportation, Highway Rev. Ref. Bonds, Series 2012-B, 5.00% 2019 | 15,000 | 17,771 |
| Unified Government of Wyandotte County/Kansas City, Transportation Dev. Dist. Sales Tax Rev. Bonds (Legends at Village West Project), Series 2006, 4.60% 2016 | 610 | 640 |
| | | 50,135 |
| Kentucky 0.49% | | |
| Asset/Liability Commission, Project Notes, Federal Highway Trust Fund, Series 2013-A, 5.25% 2024 | 5,000 | 6,023 |
Econ. Dev. Fin. Auth., Hospital Rev. Ref. Bonds (Baptist Healthcare System Obligated Group),
Series 2009-A, 5.00% 2017 | 1,500 | 1,678 |
| Econ. Dev. Fin. Auth., Hospital Rev. Ref. Bonds (Baptist Healthcare System Obligated Group), Series 2009-A, 5.375% 2024 | 1,000 | 1,121 |
| Econ. Dev. Fin. Auth., Louisville Arena Project Rev. Bonds (Louisville Arena Auth., Inc.), Series 2008-A-1, Assured Guaranty insured, 6.00% 2033 | 1,000 | 1,058 |
| Econ. Dev. Fin. Auth., Louisville Arena Project Rev. Bonds (Louisville Arena Auth., Inc.), Series 2008-A-1, Assured Guaranty insured, 6.00% 2042 | 3,000 | 3,157 |
| Housing Corp., Housing Rev. Bonds, Series 2013-D, 3.50% 2033 | 1,310 | 1,409 |
| Public Transportation Infrastructure Auth., Toll Rev. Bond Anticipation Notes (Downtown Crossing Project), Series 2013-A, 5.00% 2017 | 4,500 | 5,009 |
Public Transportation Infrastructure Auth., Toll Rev. Bonds (Downtown Crossing Project),
Series 2013-A, 5.75% 2049 | 5,000 | 5,597 |
Public Transportation Infrastructure Auth., Toll Rev. Bonds (Downtown Crossing Project),
Series 2013-A, 6.00% 2053 | 18,020 | 20,374 |
| | | 45,426 |
The Tax-Exempt Bond Fund of America — Page 28 of 60
Bonds, notes & other debt instruments
Louisiana 2.04% | Principal amount
(000) | Value
(000) |
| Citizens Property Insurance Corp., Assessment Rev. Bonds, Series 2006-B, AMBAC insured, 5.00% 2019 | $10,000 | $10,764 |
| Citizens Property Insurance Corp., Assessment Rev. Bonds, Series 2006-B, AMBAC insured, 5.00% 2020 | 4,000 | 4,290 |
| Citizens Property Insurance Corp., Assessment Rev. Ref. Bonds, Series 2012, 5.00% 2024 | 1,750 | 1,996 |
| East Baton Rouge Mortgage Fin. Auth., Single-family Mortgage Rev. Bonds (Mortgage-backed Securities Program), Series 2007-A, 5.40% 2038 | 235 | 245 |
| East Baton Rouge Mortgage Fin. Auth., Single-family Mortgage Rev. Ref. Bonds (Mortgage-backed Securities Program), Series 2009-A-2, 5.25% 2039 | 700 | 717 |
| G.O. Bonds, Series 2011-A, 5.00% 2022 | 10,000 | 11,816 |
Housing Fin. Agcy., Single-family Mortgage Rev. Bonds (Home Ownership Program),
Series 2007-A-1, 5.85% 2038 | 2,055 | 2,181 |
Housing Fin. Agcy., Single-family Mortgage Rev. Bonds (Home Ownership Program),
Series 2008-A, 6.55% 2040 | 190 | 202 |
| Jefferson Parish Fin. Auth., Single-family Mortgage Rev. Bonds, Series 2007-C, 5.70% 2039 | 885 | 927 |
| Jefferson Parish Hospital Dist. No. 1, Parish of Jefferson, Hospital Rev. Ref. Bonds (West Jefferson Medical Center), Series 2011-A, 6.00% 2039 | 6,500 | 7,363 |
| Lafayette Public Trust Fncg. Auth., Single-family Mortgage Rev. Bonds (Mortgage-backed Securities Program), Series 2007 (Go Zone), 5.35% 2041 | 1,854 | 1,901 |
| Local Government Environmental Facs. and Community Dev. Auth., Rev. Bonds (Capital Project and Equipment Acquisition Program), Series 2000-A, AMBAC insured, 6.30% 2030 | 10,270 | 10,987 |
| Local Government Environmental Facs. and Community Dev. Auth., Rev. Bonds (Westlake Chemical Corp. Projects), Series 2007, 6.75% 2032 | 24,360 | 27,135 |
| Local Government Environmental Facs. and Community Dev. Auth., Rev. Bonds (Westlake Chemical Corp. Projects), Series 2009-A, 6.50% 2029 | 3,100 | 3,561 |
| Local Government Environmental Facs. and Community Dev. Auth., Rev. Bonds (Westlake Chemical Corp. Projects), Series 2010-A-1, 6.50% 2035 | 11,275 | 12,977 |
| Local Government Environmental Facs. and Community Dev. Auth., Rev. Bonds (Westlake Chemical Corp. Projects), Series 2010-A-2, 6.50% 2035 | 3,500 | 4,028 |
| Louisiana Stadium and Exposition Dist., Rev. Ref. Bonds, Series 2013-A, 5.00% 2024 | 2,000 | 2,302 |
| Louisiana Stadium and Exposition Dist., Rev. Ref. Bonds, Series 2013-A, 5.00% 2025 | 5,000 | 5,693 |
| Louisiana Stadium and Exposition Dist., Rev. Ref. Bonds, Series 2013-A, 5.00% 2032 | 2,500 | 2,736 |
| Military Dept., Custodial Receipts, 5.00% 2021 | 10,435 | 10,903 |
| City of New Orleans, Water Rev. and Ref. Bonds, Series 2014, 5.00% 2044 | 4,000 | 4,257 |
| Public Facs. Auth., Rev. Bonds (Ochsner Clinic Foundation Project), Series 2007-A, 5.25% 2038 | 6,695 | 6,987 |
| Public Facs. Auth., Rev. Bonds (Ochsner Clinic Foundation Project), Series 2007-A, 5.375% 2043 | 1,740 | 1,815 |
| Public Facs. Auth., Rev. Bonds (Ochsner Clinic Foundation Project), Series 2011, 6.25% 2031 | 2,500 | 2,907 |
| Public Facs. Auth., Rev. Bonds (Ochsner Clinic Foundation Project), Series 2011, 6.50% 2037 | 2,420 | 2,804 |
| Public Facs. Auth., Rev. Bonds (Ochsner Clinic Foundation Project), Series 2011, 6.75% 2041 | 2,000 | 2,342 |
| Public Facs. Auth., Rev. Ref. Bonds (CHRISTUS Health), Series 2009-A, 6.00% 2029 | 3,000 | 3,317 |
| Public Facs. Auth., Rev. Ref. Bonds (Ochsner Community Hospitals Project), Series 2007-B, 5.25% 2027 | 1,500 | 1,574 |
| Regional Transit Auth. (New Orleans), Sales Tax Rev. Bonds, Series 2010, Assured Guaranty Municipal insured, 5.00% 2030 | 1,000 | 1,088 |
| Parish of St. Charles, Gulf Opportunity Zone Rev. Bonds (Valero Project), Series 2010, 4.00% 2040 (put 2022) | 1,100 | 1,168 |
| Parish of St. John the Baptist, Rev. Bonds (Marathon Oil Corp. Project), Series 2007-A, 5.125% 2037 | 9,325 | 9,796 |
Fin. Auth. of St. Tammany Parish, Single-family Mortgage Rev. Bonds (Home Ownership Program),
Series 2007-A, 4.85% 2039 | 323 | 324 |
| Tobacco Settlement Fncg. Corp., Tobacco Settlement Asset-Backed Ref. Bonds, Series 2013-A, 5.00% 2024 | 12,000 | 12,297 |
| Tobacco Settlement Fncg. Corp., Tobacco Settlement Asset-Backed Ref. Bonds, Series 2013-A, 5.00% 2025 | 3,420 | 3,586 |
| Tobacco Settlement Fncg. Corp., Tobacco Settlement Asset-Backed Ref. Bonds, Series 2013-A, 5.00% 2026 | 7,500 | 7,977 |
| Tobacco Settlement Fncg. Corp., Tobacco Settlement Asset-Backed Ref. Bonds, Series 2013-A, 5.50% 2028 | 4,500 | 4,897 |
| | | 189,860 |
The Tax-Exempt Bond Fund of America — Page 29 of 60
Bonds, notes & other debt instruments
Maine 0.13% | Principal amount
(000) | Value
(000) |
| Health and Higher Educational Facs. Auth., Rev. Bonds (MaineGeneral Medical Center Issue), 6.75% 2036 | $8,000 | $8,829 |
| Health and Higher Educational Facs. Auth., Rev. Bonds (MaineGeneral Medical Center Issue), 6.75% 2041 | 2,000 | 2,191 |
| Health and Higher Educational Facs. Auth., Rev. Bonds (MaineGeneral Medical Center Issue), 7.00% 2041 | 500 | 556 |
| Housing Auth., Mortgage Purchase Rev. Ref. Bonds, Series 2013-B, 4.00% 2043 | 635 | 694 |
| | | 12,270 |
| Maryland 0.65% | | |
| City of Annapolis, Special Obligation Bonds (Park Place Project), Series 2005-B, 4.75% 2034 (preref. 2015) | 632 | 650 |
| Baltimore County, Rev. Ref. Bonds (Oak Crest Village, Inc. Fac.), Series 2007-A, 5.00% 2022 | 2,050 | 2,141 |
| Baltimore County, Rev. Ref. Bonds (Oak Crest Village, Inc. Fac.), Series 2007-A, 5.00% 2027 | 2,000 | 2,059 |
| Baltimore County, Rev. Ref. Bonds (Oak Crest Village, Inc. Fac.), Series 2007-A, 5.00% 2037 | 17,000 | 17,332 |
| Econ. Dev. Corp., Student Housing Rev. Bonds (Towson University Project), Series 2007-A, 5.25% 2024 | 2,000 | 2,101 |
| Econ. Dev. Corp., Student Housing Rev. Bonds (University of Maryland, College Park Projects), Series 2008, 5.25% 2023 | 1,300 | 1,404 |
Econ. Dev. Corp., Student Housing Rev. Ref. Bonds (University of Maryland, College Park Projects),
Series 2006, Assured Guaranty insured, 5.00% 2020 | 1,000 | 1,066 |
| Frederick County, Special Obligation Bonds (Urbana Community Dev. Auth.), Series 2010-A, 5.00% 2023 | 1,295 | 1,446 |
City of Gaithersburg, Econ. Dev. Rev. Ref. Bonds (Asbury Maryland Obligated Group),
Series 2006-A, 5.125% 2026 | 2,265 | 2,318 |
Health and Higher Educational Facs. Auth., Rev. Bonds (Washington County Hospital Issue),
Series 2008, 5.75% 2033 | 1,500 | 1,552 |
| Health and Higher Educational Facs. Auth., Rev. Ref. Bonds (Charlestown Community Issue), Series 2010, 6.25% 2045 | 1,000 | 1,100 |
Health and Higher Educational Facs. Auth., Rev. Ref. Bonds (Howard County General Hospital Issue),
Series 1993, 5.50% 2021 (escrowed to maturity) | 1,100 | 1,168 |
| Health and Higher Educational Facs. Auth., Rev. Ref. Bonds (LifeBridge Health Issue), Series 2008, Assured Guaranty insured, 5.00% 2019 | 1,500 | 1,626 |
| Howard County Housing Commission Rev. Bonds (Oakland Mills Project), Series 2013, 5.00% 2028 | 3,000 | 3,256 |
Montgomery County Housing Opportunities Commission, Single-family Housing Rev. Bonds,
Series 2013-A, 4.00% 2031 | 1,315 | 1,437 |
| Montgomery County, G.O. Consolidated Public Improvement Bonds, Series 2012-A, 5.00% 2019 | 10,000 | 11,882 |
Montgomery County, Special Obligation Bonds (West Germantown Dev. Dist.),
Series 2002-A, RADIAN insured, 5.375% 2020 | 815 | 818 |
| Prince George’s County, Special Obligation Bonds (National Harbor Project), Series 2004, 5.20% 2034 | 2,300 | 2,314 |
Prince George’s County, Special Obligation Bonds (Woodview Village Infrastructure Improvements),
Series 1997-A, 4.70% 2026 | 1,000 | 1,048 |
| Prince George’s County, Special Tax Dist. Bonds (Victoria Falls Project), Series 2005, 5.25% 2035 | 1,199 | 1,203 |
| Mayor and Common Council of Westminster, Project and Rev. Ref. Bonds (Carroll Lutheran Village, Inc.), Series 2014, 5.125% 2040 | 750 | 755 |
| Mayor and Common Council of Westminster, Project and Rev. Ref. Bonds (Carroll Lutheran Village, Inc.), Series 2014, 5.50% 2044 | 2,000 | 2,071 |
| | | 60,747 |
| Massachusetts 2.46% | | |
| Bay Transportation Auth., Sales Tax Rev. Ref. Bonds, Series 2004-C, 5.50% 2017 | 2,905 | 3,321 |
| Bay Transportation Auth., Sales Tax Rev. Ref. Bonds, Series 2004-C, 5.50% 2017 (escrowed to maturity) | 95 | 109 |
| Berkshire Wind Power Cooperative Corp. (Massachusetts Municipal Lighting Plant Cooperative), Wind Project Rev. Bonds, Berkshire Series 1, 5.25% 2026 | 3,000 | 3,269 |
| Catholic Health East, Health System Rev. Ref. Bonds, Series 2009, 6.25% 2032 | 1,090 | 1,248 |
| Dev. Fin. Agcy., Higher Education Rev. Bonds (Emerson College Issue), Series 2006-A, 5.00% 2019 | 1,000 | 1,088 |
| Dev. Fin. Agcy., Higher Education Rev. Bonds (Emerson College Issue), Series 2006-A, 5.00% 2021 | 3,000 | 3,257 |
| Dev. Fin. Agcy., Higher Education Rev. Bonds (Emerson College Issue), Series 2006-A, 5.00% 2022 | 1,495 | 1,619 |
| Dev. Fin. Agcy., Hospital Rev. Bonds (Healthcare Obligated Group Issue), Series 2013, 5.25% 2041 | 4,500 | 4,896 |
| Dev. Fin. Agcy., Resource Recovery Rev. Ref. Bonds (Covanta Energy Project), Series 2012-B, 4.875% 2042 | 16,920 | 16,987 |
| Dev. Fin. Agcy., Rev. Bonds (Boston University Issue), Series 2013-U-1, 0.64% 2040 (put 2017)1 | 1,000 | 1,000 |
The Tax-Exempt Bond Fund of America — Page 30 of 60
Bonds, notes & other debt instruments
Massachusetts (continued) | Principal amount
(000) | Value
(000) |
| Dev. Fin. Agcy., Rev. Bonds (Boston University Issue), Series 2013-X, 5.00% 2048 | $17,500 | $18,926 |
| Dev. Fin. Agcy., Rev. Bonds (Boston University Issue), Series U-4, 5.60% 2035 | 5,000 | 5,850 |
| Dev. Fin. Agcy., Rev. Bonds (Curry College Issue), Series 2006-A, ACA insured, 5.00% 2036 | 1,000 | 1,011 |
| Dev. Fin. Agcy., Rev. Bonds (Curry College Issue), Series 2006-A, ACA insured, 5.25% 2026 | 1,490 | 1,577 |
| Dev. Fin. Agcy., Rev. Bonds (Linden Ponds, Inc. Fac.), Series 2011-A-1, 6.25% 2019 | 1,040 | 1,005 |
| Dev. Fin. Agcy., Rev. Bonds (Linden Ponds, Inc. Fac.), Series 2011-A-1, 6.25% 2020 | 1,089 | 1,039 |
| Dev. Fin. Agcy., Rev. Bonds (Linden Ponds, Inc. Fac.), Series 2011-A-1, 6.25% 2026 | 1,412 | 1,254 |
| Dev. Fin. Agcy., Rev. Bonds (Linden Ponds, Inc. Fac.), Series 2011-A-1, 6.25% 2031 | 1,056 | 904 |
| Dev. Fin. Agcy., Rev. Bonds (Linden Ponds, Inc. Fac.), Series 2011-A-1, 6.25% 2039 | 705 | 574 |
| Dev. Fin. Agcy., Rev. Bonds (Linden Ponds, Inc. Fac.), Series 2011-A-1, 6.25% 2046 | 1,773 | 1,404 |
| Dev. Fin. Agcy., Rev. Bonds (Linden Ponds, Inc. Fac.), Series 2011-A-2, 5.50% 2046 | 376 | 262 |
| Dev. Fin. Agcy., Rev. Bonds (Linden Ponds, Inc. Fac.), Series 2011-B, 0% 2056 | 1,868 | 8 |
| Dev. Fin. Agcy., Rev. Bonds (Partners HealthCare System Issue), Series 2011-K-6, 5.375% 2041 | 1,000 | 1,101 |
| Dev. Fin. Agcy., Rev. Bonds (Partners HealthCare System Issue), Series 2012-L, 5.00% 2031 | 1,000 | 1,108 |
| Dev. Fin. Agcy., Rev. Bonds (Partners HealthCare System Issue), Series 2014-M-4, 5.00% 2044 | 1,000 | 1,088 |
| Dev. Fin. Agcy., Rev. Ref. Bonds (Boston University Issue), Series V-1, 5.00% 2029 | 9,800 | 11,171 |
| Dev. Fin. Agcy., Rev. Ref. Bonds (Emerson College Issue), Series 2010-A, 5.00% 2040 | 8,375 | 8,731 |
| Dev. Fin. Agcy., Rev. Ref. Bonds (Harvard University Issue), Series 2010-B-2, 5.25% 2034 | 7,185 | 8,370 |
| Dev. Fin. Agcy., Rev. Ref. Bonds (Tufts Medical Center Issue), Series 2011-I, 6.75% 2036 | 2,000 | 2,343 |
| Dev. Fin. Agcy., Rev. Ref. Bonds (Tufts Medical Center Issue), Series 2011-I, 6.875% 2041 | 3,000 | 3,515 |
| Dev. Fin. Agcy., Rev. Ref. Bonds, UMass Memorial Issue, Series 2011-H, 5.50% 2031 | 1,500 | 1,583 |
| Dev. Fin. Agcy., Rev. Bonds (Williams College), Series 2011-N, 0.34% 2041 (put 2017)1 | 2,000 | 1,995 |
| G.O. Bonds, Consolidated Loan of 2008, Series A, 5.00% 2033 | 8,070 | 9,009 |
| G.O. Ref. Bonds, Series 2013-B, 5.00% 2023 | 1,000 | 1,223 |
Health and Educational Facs. Auth., Rev. Bonds (Baystate Medical Center Issue),
Series 2009-K-2, 5.00% 2039 (put 2015) | 1,200 | 1,249 |
| Health and Educational Facs. Auth., Rev. Bonds (Massachusetts Institute of Technology Issue), Series 2008-O, 6.00% 2036 | 7,000 | 8,261 |
| Health and Educational Facs. Auth., Rev. Bonds (Partners HealthCare System Issue), Series 2007-G-2, Assured Guaranty Municipal insured, 0.40% 20421 | 5,000 | 5,000 |
| Health and Educational Facs. Auth., Rev. Ref. Bonds (CareGroup Issue), Series 2008-E-1, 5.125% 2033 | 2,500 | 2,623 |
| Health and Educational Facs. Auth., Rev. Ref. Bonds (CareGroup Issue), Series 2008-E-2, 5.375% 2025 | 2,500 | 2,806 |
| Health and Educational Facs. Auth., Rev. Ref. Bonds (Harvard University Issue), Series 2009-A, 5.50% 2036 | 12,320 | 14,388 |
Health and Educational Facs. Auth., Rev. Ref. Bonds (Northeastern University Issue), Series 2008-T-1,
5.00% 2032 | 1,050 | 1,157 |
Health and Educational Facs. Auth., Rev. Ref. Bonds (Suffolk University Issue), Series 2009-A,
5.75% 2039 (preref. 2019) | 8,380 | 9,065 |
| Health and Educational Facs. Auth., Rev. Ref. Bonds (Suffolk University Issue), Series 2009-A, 6.00% 2024 | 5,500 | 6,432 |
| Housing Fin. Agcy., Housing Bonds, Series 2009-C, 5.35% 2049 | 4,000 | 4,206 |
| Housing Fin. Agcy., Housing Rev. Ref. Bonds, Series 2010-A, 3.375% 2016 | 2,710 | 2,836 |
| Housing Fin. Agcy., Single-family Housing Rev. Bonds, Series 167, 4.00% 2043 | 1,340 | 1,471 |
| Housing Fin. Agcy., Single-family Housing Rev. Ref. Bonds, Series 162, 2.75% 2041 | 2,840 | 2,939 |
| Housing Fin. Agcy., Single-family Housing Rev. Ref. Bonds, Series 165, 2.65% 2041 | 4,230 | 4,403 |
| Massachusetts Bay Transportation Auth., Sales Tax Rev. Ref. Bonds, Series 2007-A-1, 5.25% 2032 | 10,000 | 12,552 |
| Port Auth., Rev. Ref. Bonds, Series 2012-B, 5.00% 2023 | 1,090 | 1,293 |
| Port Auth., Special Facs. Rev. Bonds (ConRAC Project), Series 2011-A, 5.125% 2041 | 9,250 | 9,836 |
| Special Obligation Dedicated Tax Rev. Ref. Bonds, Series 2005, FGIC-National insured, 5.00% 2020 | 5,000 | 5,793 |
| State College Building Auth., Project and Rev. Ref. Bonds, Series 2003-B, XLCA insured, 5.375% 2017 | 3,550 | 4,018 |
| State College Building Auth., Project and Rev. Ref. Bonds, Series 2003-B, XLCA insured, 5.375% 2018 | 5,045 | 5,879 |
| State College Building Auth., Rev. Ref. Bonds, Series 2012-B, 5.00% 2030 | 1,000 | 1,142 |
| | | 229,194 |
The Tax-Exempt Bond Fund of America — Page 31 of 60
Bonds, notes & other debt instruments
Michigan 3.38% | Principal amount
(000) | Value
(000) |
| City of Royal Oak Hospital Fin. Auth., Hospital Rev. Ref. Bonds (William Beaumont Hospital Obligated Group), Series 2014-D, 5.00% 2025 | $500 | $576 |
| City of Royal Oak Hospital Fin. Auth., Hospital Rev. Ref. Bonds (William Beaumont Hospital Obligated Group), Series 2014-D, 5.00% 2030 | 1,160 | 1,285 |
| Econ. Dev. Corp. of the City of Dearborn, Limited Obligation Rev. Ref. Bonds (Henry Ford Village, Inc. Project), Series 2008, 7.00% 2038 | 5,800 | 5,906 |
| City of Detroit, Distributable State Aid G.O. (Limited Tax) Bonds, Series 2010, 5.25% 2035 | 10,665 | 11,099 |
| City of Detroit, G.O. Bonds, Series 2001-A-1, National insured, 5.375% 2018 | 3,600 | 3,548 |
| City of Detroit, Sewage Disposal System Rev. Ref. Bonds, Series 2006-D, Assured Guaranty Municipal insured, 0.757% 20321 | 4,850 | 3,873 |
| City of Detroit, Water and Sewerage Dept., Sewage Disposal System Rev. Ref. Bonds, Series 2001-C-1, Assured Guaranty Municipal Insured, 7.00% 2027 | 4,000 | 4,346 |
City of Detroit, Water and Sewerage Dept., Sewage Disposal System Rev. Ref. Bonds, Series 2012-A,
5.25% 2039 | 5,900 | 5,799 |
| City of Detroit, Water Supply System Rev. Bonds, Series 2011-A, 5.25% 2041 | 16,000 | 15,716 |
| School Dist. of the City of Detroit (Wayne County), School Building and Site Improvement Ref. Bonds (Unlimited Tax G.O.), Series 1998-C, FGIC insured, 5.25% 2025 | 1,955 | 2,164 |
| School Dist. of the City of Detroit (Wayne County), School Building and Site Improvement Ref. Bonds (Unlimited Tax G.O.), Series 2005-A, Assured Guaranty Municipal insured, 5.00% 2016 | 4,000 | 4,129 |
| School Dist. of the City of Detroit (Wayne County), School Building and Site Improvement Ref. Bonds (Unlimited Tax G.O.), Series 2005-A, Assured Guaranty Municipal insured, 5.00% 2018 | 4,920 | 5,078 |
| School Dist. of the City of Detroit (Wayne County), School Building and Site Improvement Ref. Bonds (Unlimited Tax G.O.), Series 2012-A, 5.00% 2026 | 2,000 | 2,190 |
| School Dist. of the City of Detroit (Wayne County), School Building and Site Improvement Ref. Bonds (Unlimited Tax G.O.), Series 2012-A, 5.00% 2027 | 3,500 | 3,813 |
| School Dist. of the City of Detroit (Wayne County), School Building and Site Improvement Ref. Bonds (Unlimited Tax G.O.), Series 2012-A, 5.00% 2028 | 3,610 | 3,910 |
| School Dist. of the City of Detroit (Wayne County), School Building and Site Improvement Ref. Bonds (Unlimited Tax G.O.), Series 2012-A, 5.00% 2030 | 4,000 | 4,296 |
| Fin. Auth., Hospital Rev. Ref. Bonds (Oakwood Obligated Group), Series 2012, 5.00% 2024 | 9,145 | 10,422 |
| Fin. Auth., Hospital Rev. Ref. Bonds (Oakwood Obligated Group), Series 2012, 5.00% 2027 | 3,000 | 3,340 |
| Fin. Auth., Hospital Rev. Ref. Bonds (Trinity Health Credit Group), Series 2011, 5.00% 2039 | 1,250 | 1,336 |
| Fin. Auth., Rev. Bonds (School Dist. of the City of Detroit), Series 2011, 5.50% 2021 | 6,865 | 7,986 |
| Fin. Auth., Rev. Ref. Bonds (School Dist. of the City of Detroit), Series 2012, 5.00% 2019 | 900 | 1,019 |
| City of Flint, Hospital Building Auth., Rev. Rental Bonds (Hurley Medical Center), Series 2013-A, 5.25% 2028 | 3,000 | 2,832 |
| City of Flint, Hospital Building Auth., Rev. Rental Bonds (Hurley Medical Center), Series 2013-A, 5.25% 2039 | 500 | 443 |
| G.O. Bonds (Environmental Program and Ref.), Series 2008-A, 5.00% 2018 | 5,000 | 5,750 |
| Hospital Fin. Auth., Hospital Rev. Bonds (MidMichigan Obligated Group), Series 2006-A, 4.75% 2031 | 3,360 | 3,393 |
| Hospital Fin. Auth., Hospital Rev. Bonds (MidMichigan Obligated Group), Series 2006-A, 5.00% 2026 | 6,665 | 6,813 |
| Hospital Fin. Auth., Hospital Rev. Bonds (MidMichigan Obligated Group), Series 2006-A, 5.00% 2036 | 12,705 | 12,853 |
| Hospital Fin. Auth., Hospital Rev. Ref. Bonds (Henry Ford Health System), Series 2006-A, 5.00% 2020 | 1,115 | 1,205 |
| Hospital Fin. Auth., Hospital Rev. Ref. Bonds (Henry Ford Health System), Series 2006-A, 5.00% 2021 | 2,165 | 2,290 |
| Hospital Fin. Auth., Hospital Rev. Ref. Bonds (Henry Ford Health System), Series 2006-A, 5.00% 2038 | 10,000 | 10,339 |
| Hospital Fin. Auth., Hospital Rev. Ref. Bonds (Henry Ford Health System), Series 2009, 5.625% 2029 | 1,500 | 1,667 |
| Hospital Fin. Auth., Hospital Rev. Ref. Bonds (McLaren Health Care), Series 2012-A, 5.00% 2035 | 1,000 | 1,073 |
| Hospital Fin. Auth., Rev. Bonds (McLaren Health Care), Series 2005-C, 5.00% 2020 | 2,310 | 2,408 |
| Hospital Fin. Auth., Rev. Bonds (Trinity Health Credit Group), Series 2009-B, 5.00% 2048 | 3,705 | 3,905 |
| Hospital Fin. Auth., Rev. Ref. Bonds (Trinity Health Credit Group), Series 2008-A, 6.00% 2034 (put 2017) | 2,500 | 2,913 |
| Hospital Fin. Auth., Rev. Ref. Bonds (Trinity Health Credit Group), Series 2008-A, 6.50% 2033 | 5,000 | 5,872 |
| Kent Hospital Fin. Auth., Rev. Ref. Bonds (Spectrum Health System), Series 2008-A, 5.50% 2047 (put 2015) | 6,000 | 6,144 |
| Kent Hospital Fin. Auth., Rev. Ref. Bonds (Spectrum Health System), Series 2011-A, 5.00% 2029 | 2,000 | 2,210 |
| County of Wayne, Livonia Public Schools School Dist., School Building and Site G.O bonds, Series 2013-I, Assured Guaranty Municipal insured, 5.00% 2038 | 2,000 | 2,139 |
| County of Monroe Hospital Fin. Auth., Hospital Rev. Ref. Bonds (Mercy Memorial Hospital Corp. Obligated Group), Series 2006, 5.50% 2019 | 1,405 | 1,488 |
The Tax-Exempt Bond Fund of America — Page 32 of 60
Bonds, notes & other debt instruments
Michigan (continued) | Principal amount
(000) | Value
(000) |
| County of Monroe Hospital Fin. Auth., Hospital Rev. Ref. Bonds (Mercy Memorial Hospital Corp. Obligated Group), Series 2006, 5.50% 2035 | $1,500 | $1,517 |
Fin. Auth., Local Government Loan Program Rev. Bonds (Public Lighting Auth. Local Project Bonds),
Series 2014-B, 5.00% 2030 | 1,000 | 1,057 |
Fin. Auth., Local Government Loan Program Rev. Bonds (Public Lighting Auth. Local Project Bonds),
Series 2014-B, 5.00% 2039 | 5,600 | 5,694 |
| Public Power Agcy., Rev. Ref. Bonds (Belle River Project), Series 2002-A, National insured, 5.25% 2018 | 2,000 | 2,266 |
| City of Royal Oak Hospital Fin. Auth., Hospital Rev. Ref. Bonds (William Beaumont Hospital Obligated Group), Series 2009-V, 8.00% 2029 (preref. 2018) | 2,000 | 2,562 |
| City of Royal Oak Hospital Fin. Auth., Hospital Rev. Ref. Bonds (William Beaumont Hospital Obligated Group), Series 2009-V, 8.25% 2039 (preref. 2018) | 3,000 | 3,873 |
| City of Royal Oak Hospital Fin. Auth., Hospital Rev. Ref. Bonds (William Beaumont Hospital Obligated Group), Series 2014-D, 5.00% 2039 | 2,750 | 2,944 |
| City of Saginaw Hospital Fin. Auth., Hospital Rev. Ref. Bonds (Covenant Medical Center, Inc.), Series 2010-H, 5.00% 2030 | 5,300 | 5,585 |
| State Trunk Line Fund Bonds, Series 2011, 5.00% 2036 | 2,000 | 2,206 |
| State Building Auth., Rev. Ref. Bonds (Facs. Program), Series 2008-I, 6.00% 2038 | 8,000 | 9,191 |
State Hospital Fin. Auth., Rev. Bonds (Ascension Health Credit Group), Series 1999-B-3,
2.00% 2033 (put 2014) | 5,400 | 5,400 |
Strategic Fund, Limited Obligation Rev. Ref. Bonds (Detroit Edison Co. Exempt Facs. Project),
Series 2008-ET-1, 5.25% 2029 (put 2014) | 4,750 | 4,750 |
Strategic Fund, Limited Obligation Rev. Ref. Bonds (Detroit Edison Co. Exempt Facs. Project),
Series 2008-ET-2, 5.50% 2029 (put 2016) | 2,000 | 2,164 |
Strategic Fund, Limited Obligation Rev. Ref. Bonds (Detroit Edison Co. Exempt Facs. Project),
Series 2008-KT, 5.625% 2020 | 1,500 | 1,781 |
| Tobacco Settlement Fin. Auth., Tobacco Settlement Asset-backed Bonds, Current Interest Bonds, Series 2007-A, 6.00% 2034 | 1,000 | 836 |
Tobacco Settlement Fin. Auth., Tobacco Settlement Asset-backed Bonds, Current Interest Bonds,
Series 2007-A, 6.00% 2048 | 43,205 | 34,108 |
| Tobacco Settlement Fin. Auth., Tobacco Settlement Asset-backed Rev. Ref. Bonds, Current Interest Bonds, Series 2008-A, 6.875% 2042 | 10,010 | 9,267 |
Wayne County Airport Auth., Airport Rev. Bonds (Detroit Metropolitan Wayne County Airport),
Series 2012-A, 5.00% 2032 | 2,500 | 2,653 |
Wayne County Airport Auth., Airport Rev. Bonds (Detroit Metropolitan Wayne County Airport),
Series 2012-A, 5.00% 2037 | 7,400 | 7,799 |
Wayne County Airport Auth., Airport Rev. Ref. Bonds (Detroit Metropolitan Wayne County Airport),
Series 2010-C, 5.00% 2021 | 12,190 | 13,542 |
Wayne County Airport Auth., Airport Rev. Ref. Bonds (Detroit Metropolitan Wayne County Airport),
Series 2010-C, 5.00% 2022 | 2,140 | 2,362 |
Wayne County Airport Auth., Airport Rev. Ref. Bonds (Detroit Metropolitan Wayne County Airport),
Series 2010-C, 5.50% 2020 | 9,000 | 10,557 |
Wayne County Airport Auth., Airport Rev. Ref. Bonds (Detroit Metropolitan Wayne County Airport),
Series 2010-D, 5.00% 2016 | 1,400 | 1,534 |
Wayne County Airport Auth., Airport Rev. Ref. Bonds (Detroit Metropolitan Wayne County Airport),
Series 2011-B, 5.00% 2019 | 1,290 | 1,481 |
Wayne County Airport Auth., Airport Rev. Ref. Bonds (Detroit Metropolitan Wayne County Airport),
Series 2012-A, Assured Guaranty Municipal insured, 5.00% 2042 | 2,000 | 2,085 |
| | | 314,782 |
The Tax-Exempt Bond Fund of America — Page 33 of 60
Bonds, notes & other debt instruments
Minnesota 0.16% | Principal amount
(000) | Value
(000) |
Housing Fin. Agcy., Homeownership Fin. Bonds (GNMA and FNMA Pass-Through Program),
Series 2012-B, 2.25% 20423 | $8,797 | $8,361 |
Housing Fin. Agcy., Homeownership Fin. Bonds (Mortgage-Backed Securities Program),
Series 2010-A, 4.25% 2028 | 1,410 | 1,497 |
Housing Fin. Agcy., Homeownership Fin. Bonds (Mortgage-Backed Securities Program),
Series 2011-B, 4.50% 2031 | 675 | 722 |
Housing Fin. Agcy., Homeownership Fin. Bonds (Mortgage-Backed Securities Program),
Series 2011-D, 4.50% 2034 | 725 | 776 |
Housing Fin. Agcy., Homeownership Fin. Bonds (Mortgage-Backed Securities Program),
Series 2011-G, 4.25% 2035 | 1,040 | 1,133 |
| Housing Fin. Agcy., Residential Housing Fin. Bonds, Series 2012-D, 4.00% 2040 | 765 | 831 |
| Housing Fin. Agcy., Residential Housing Fin. Bonds, Series 2014-B, 4.00% 2038 | 1,000 | 1,097 |
| Minneapolis/St. Paul Housing Fin. Board, Single-family Mortgage Rev. Bonds (Mortgage-backed Securities Program - City Living Home Programs), Series 2006-A-3, 5.70% 2027 | 304 | 317 |
| | | 14,734 |
| Mississippi 0.32% | | |
Dev. Bank, Special Obligation Bonds (Municipal Energy Agcy. of Mississippi Power Supply Project),
Series 2006-A, XLCA insured, 5.00% 2026 | 5,065 | 5,202 |
Dev. Bank, Special Obligation Rev. Ref. Bonds (Harrison County, Mississippi Highway Ref. Project),
Series 2013-A, 5.00% 2025 | 3,000 | 3,624 |
Dev. Bank, Special Obligation Rev. Ref. Bonds (Madison County, Mississippi Highway Ref. Project),
Series 2013-C, 5.00% 2026 | 4,000 | 4,831 |
| Home Corp., Homeownership Mortgage Rev. Bonds, Series 2010-A, 4.50% 2031 | 780 | 831 |
| Home Corp., Single-family Mortgage Rev. Bonds, Series 2007-A-1, 5.50% 2038 | 2,530 | 2,702 |
| Home Corp., Single-family Mortgage Rev. Bonds, Series 2009-A-2, 5.00% 2039 | 1,265 | 1,368 |
| Hospital Equipment and Facs. Auth., Rev. Ref. Bonds (Mississippi Baptist Health Systems, Inc.), Series 2007-A, 5.00% 2017 | 3,000 | 3,316 |
| Hospital Equipment and Facs. Auth., Rev. Ref. Bonds (Mississippi Baptist Health Systems, Inc.), Series 2007-A, 5.00% 2026 | 2,000 | 2,064 |
Jackson State University Educational Building Corp., Rev. Bonds (Campus Facs. Project), Series 2007,
Assured Guaranty Municipal insured, 5.00% 2034 (put 2015) | 3,635 | 3,727 |
| Warren County, Gulf Opportunity Zone Bonds, Series 2010-A, 5.80% 2034 | 2,000 | 2,214 |
| | | 29,879 |
| Missouri 0.78% | | |
| Industrial Dev. Auth. of the County of Cape Girardeau, Health Facs. Rev. Bonds (Southeast Missouri Hospital Assn.), Series 2007, 5.00% 2017 | 1,000 | 1,073 |
| Industrial Dev. Auth. of the County of Cape Girardeau, Health Facs. Rev. Bonds (Southeast Missouri Hospital Assn.), Series 2007, 5.00% 2018 | 1,500 | 1,595 |
| Industrial Dev. Auth. of the County of Cape Girardeau, Health Facs. Rev. Bonds (Southeast Missouri Hospital Assn.), Series 2007, 5.00% 2036 | 5,000 | 5,047 |
| Chesterfield Valley Transportation Dev. Dist. (Chesterfield), Transportation Sales Tax Rev. Bonds, Series 2006, Assured Guaranty insured, 4.00% 2026 | 1,250 | 1,250 |
| Health and Educational Facs. Auth., Health Facs. Rev. Bonds (SSM Health Care), Series 2010-B, 5.00% 2030 | 2,835 | 3,068 |
| Health and Educational Facs. Auth., Health Facs. Rev. Bonds, Series 2014-A, 5.00% 2027 | 1,000 | 1,149 |
| Health and Educational Facs. Auth., Health Facs. Rev. Ref. Bonds (St. Luke’s Episcopal-Presbyterian Hospitals), Series 2006, 5.00% 2019 | 2,830 | 3,007 |
Health and Educational Facs. Auth., Senior Living Facs. Rev. Bonds (Lutheran Senior Services Projects),
Series 2010, 5.50% 2042 | 2,250 | 2,365 |
Health and Educational Facs. Auth., Senior Living Facs. Rev. Ref. Bonds (Lutheran Senior Services),
Series 2007-A, 4.875% 2027 | 2,930 | 3,009 |
Health and Educational Facs. Auth., Senior Living Facs. Rev. Ref. Bonds (Lutheran Senior Services),
Series 2007-A, 4.875% 2037 | 2,065 | 2,087 |
The Tax-Exempt Bond Fund of America — Page 34 of 60
Bonds, notes & other debt instruments
Missouri (continued) | Principal amount
(000) | Value
(000) |
Health and Educational Facs. Auth., Senior Living Facs. Rev. Ref. Bonds (Lutheran Senior Services),
Series 2007-B, 4.875% 2038 | $4,215 | $4,258 |
Housing Dev. Commission, Single-family Mortgage Rev. Bonds (Homeownership Loan Program),
Series 2009-C, 4.90% 2036 | 745 | 760 |
Housing Dev. Commission, Single-family Mortgage Rev. Bonds (Homeownership Loan Program),
Series 2009-D, 4.80% 2040 | 1,000 | 1,061 |
| Housing Dev. Commission, Single-family Mortgage Rev. Bonds (Special Homeownership Loan Program), Series 2014-A, 4.00% 2041 | 645 | 708 |
| I-470 and 350 Transportation Dev. Dist. (Lee’s Summit), Transportation Sales Tax Rev. Ref. and Improvement Bonds, Series 2007, RADIAN insured, 4.60% 2029 | 1,485 | 1,500 |
| Joint Municipal Electric Utility Commission, Power Project Rev. Bonds (Plum Point Project), Series 2006, National insured, 5.00% 2020 | 1,620 | 1,704 |
| Industrial Dev. Auth. of the City of Lee’s Summit, Senior Living Facs. Rev. Ref. Bonds (John Knox Village Obligated Group), Series 2007-A, 5.125% 2026 | 7,500 | 7,712 |
| Industrial Dev. Auth. of the City of Lee’s Summit, Senior Living Facs. Rev. Ref. Bonds (John Knox Village Obligated Group), Series 2007-A, 5.125% 2032 | 7,300 | 7,396 |
| Industrial Dev. Auth. of the City of Lee’s Summit, Senior Living Facs. Rev. Ref. Bonds (John Knox Village Obligated Group), Series 2014-A, 5.25% 2039 | 1,310 | 1,292 |
| City of St. Louis, Airport Rev. Bonds (Lambert-St. Louis International Airport), Series 2009-A-1, 6.25% 2029 | 2,025 | 2,302 |
| City of St. Louis, Airport Rev. Bonds (Lambert-St. Louis International Airport), Series 2009-A-1, 6.625% 2034 | 3,000 | 3,442 |
City of St. Louis, Airport Rev. Ref. Bonds (Lambert-St. Louis International Airport), Series 2005,
National insured, 5.50% 2027 | 6,270 | 7,375 |
City of St. Louis, Airport Rev. Ref. Bonds (Lambert-St. Louis International Airport), Series 2005,
National insured, 5.50% 2029 | 3,125 | 3,665 |
| Transportation Dev. Dist. (Hazelwood, St. Louis County), Transportation Rev. Bonds (Missouri Bottom Road/Taussig Road), Series 2002, 7.20% 2033 | 5,500 | 5,507 |
| | | 72,332 |
| Nebraska 0.42% | | |
| Central Plains Energy Project, Gas Project Rev. Bonds (Project No. 1), Series 2007-A, 5.25% 2018 | 2,100 | 2,372 |
| Central Plains Energy Project, Gas Project Rev. Bonds (Project No. 3), Series 2012, 5.00% 2027 | 3,985 | 4,403 |
| Central Plains Energy Project, Gas Project Rev. Bonds (Project No. 3), Series 2012, 5.00% 2042 | 1,000 | 1,048 |
| Central Plains Energy Project, Gas Project Rev. Bonds (Project No. 3), Series 2012, 5.25% 2037 | 6,275 | 6,727 |
| Hospital Auth. No. 3 of Douglas County, Health Facs. Rev. Ref. Bonds (Methodist Health System), Series 2008, 5.75% 2028 | 10,795 | 11,508 |
| Investment Fin. Auth., Single-family Housing Rev. Bonds, Series 2013-A, 3.00% 2043 | 1,105 | 1,166 |
| Investment Fin. Auth., Single-family Housing Rev. Bonds, Series 2013-C, 2.50% 2035 | 3,390 | 3,498 |
| Investment Fin. Auth., Single-family Housing Rev. Bonds, Series 2014-A, 4.00% 2044 | 1,000 | 1,100 |
| Investment Fin. Auth., Single-family Housing Rev. Bonds, Series 2014-A, 3.00% 2044 | 1,500 | 1,580 |
| Omaha Public Power Dist., Electric System Rev. Bonds, Series 2008-A, 5.50% 2033 | 1,000 | 1,120 |
| Public Power Dist., General Rev. Bonds, Series 2008-B, 5.00% 2028 | 4,490 | 4,977 |
| | | 39,499 |
| Nevada 2.00% | | |
| Clark County School Dist., G.O. (Limited Tax) Building Bonds, Series 2008-A, 5.00% 2021 | 2,420 | 2,750 |
| Clark County School Dist., G.O. (Limited Tax) Building Bonds, Series 2008-A, 5.00% 2022 | 8,000 | 9,067 |
| Clark County School Dist., G.O. (Limited Tax) Building Bonds, Series 2008-A, 5.00% 2023 | 7,000 | 7,914 |
Clark County Water Reclamation Dist., G.O. (Limited Tax) Water Reclamation Bonds,
Series 2008, 5.625% 2032 | 1,000 | 1,147 |
| Clark County, Airport System Rev. Bonds, Series 2010-B, 5.125% 2036 | 18,000 | 19,436 |
| Clark County, Airport System Rev. Bonds, Series 2010-D, 5.00% 2023 | 7,025 | 8,127 |
| Clark County, G.O. (Limited Tax) Bond Bank Bonds, Series 2008, 5.00% 2021 | 11,155 | 12,753 |
| Clark County, Highway Rev. (Motor Vehicle Fuel Tax) Ref. Bonds, Series 2011, 5.00% 2022 | 10,580 | 12,607 |
Clark County, Las Vegas-McCarran International Airport, Passenger Fac. Charge Rev. Bonds,
Series 2010-A, 5.00% 2030 | 2,000 | 2,178 |
The Tax-Exempt Bond Fund of America — Page 35 of 60
Bonds, notes & other debt instruments
Nevada (continued) | Principal amount
(000) | Value
(000) |
Clark County, Las Vegas-McCarran International Airport, Passenger Fac. Charge Rev. Bonds,
Series 2010-A, 5.125% 2034 | $10,980 | $11,890 |
Clark County, Las Vegas-McCarran International Airport, Passenger Fac. Charge Rev. Ref. Bonds,
Series 2012-B, 5.00% 2028 | 5,780 | 6,492 |
Clark County, Las Vegas-McCarran International Airport, Passenger Fac. Charge Rev. Ref. Bonds,
Series 2012-B, 5.00% 2033 | 1,885 | 2,063 |
Clark County, Sales and Excise Tax Rev. (Streets and Highway Projects) Improvement and Ref. Bonds,
Series 2010-B, 5.00% 2019 | 3,000 | 3,494 |
| Clark County, Special Improvement Dist. No. 121 (Southern Highlands Area), Local Improvement Ref. Bonds, Series 2006-B, 5.30% 2029 | 3,780 | 3,607 |
Clark County, Special Improvement Dist. No. 128 (Summerlin Centre), Local Improvement Bonds,
Series 2001-B, 6.75% 2021 | 1,255 | 1,276 |
Clark County, Special Improvement Dist. No. 142 (Mountain’s Edge), Local Improvement Ref. Bonds,
Series 2012, 5.00% 2019 | 4,250 | 4,567 |
| G.O. (Limited Tax) Capital Improvement and Cultural Affairs Bonds, Series 2007-B, FGIC-National insured, 5.00% 2026 | 9,640 | 10,865 |
| City of Henderson, Health Fac. Rev. Ref. Bonds (Catholic Healthcare West), Series 2007-B, 5.00% 2015 | 2,000 | 2,086 |
| City of Henderson, Local Improvement Dist. No. T-17 (Madeira Canyon), Limited Obligation Improvement Bonds, 5.00% 2018 | 355 | 366 |
| City of Henderson, Local Improvement Dist. No. T-17 (Madeira Canyon), Limited Obligation Improvement Bonds, 5.00% 2025 | 3,865 | 3,983 |
| City of Henderson, Local Improvement Dist. No. T-18 (Inspirada), Limited Obligation Improvement Bonds, 5.25% 2026 | 4,990 | 4,433 |
| City of Henderson, Local Improvement Dist. No. T-18 (Inspirada), Limited Obligation Improvement Bonds, 5.30% 2035 | 8,495 | 6,955 |
City of Henderson, Local Improvement Dist. No. T-4C (Green Valley Properties), Limited Obligation
Ref. Bonds, Series 1999-A, 5.90% 2018 | 2,815 | 2,836 |
| Highway Improvement Rev. Bonds (Motor Vehicle Fuel Tax), Series 2008, 5.00% 2024 | 4,850 | 5,508 |
| Las Vegas Valley Water Dist., G.O. (Limited Tax) Ref. Bonds, Series 2011-C, 5.00% 2030 | 8,000 | 8,979 |
| Las Vegas Valley Water Dist., G.O. (Limited Tax) Water and Ref. Bonds, Series 2009-D, 5.00% 2025 | 2,360 | 2,678 |
| Las Vegas Valley Water Dist., G.O. (Limited Tax) Water and Ref. Bonds, Series 2009-D, 5.00% 2026 | 4,330 | 4,913 |
| Las Vegas Valley Water Dist., G.O. (Limited Tax) Water Bonds, Series 2012-B, 5.00% 2032 | 2,000 | 2,257 |
| Las Vegas Valley Water Dist., G.O. (Limited Tax) Water Bonds, Series 2012-B, 5.00% 2037 | 3,500 | 3,820 |
| Las Vegas Valley Water Dist., G.O. (Limited Tax) Water Bonds, Series 2012-B, 5.00% 2042 | 1,000 | 1,082 |
| City of Reno, Hospital Rev. Bonds (Renown Regional Medical Center Project), Series 2007-A, 5.00% 2022 | 3,295 | 3,456 |
| City of Reno, Hospital Rev. Bonds (Renown Regional Medical Center Project), Series 2007-A, 5.00% 2027 | 9,385 | 9,687 |
City of Reno, Hospital Rev. Bonds (Washoe Medical Center Project), Series 2004-A, AMBAC insured,
5.50% 2028 | 1,625 | 1,708 |
| Redev. Agcy. of the City of Reno, Tax Increment Bonds, Series 2007-B, 5.00% 2027 | 2,000 | 1,522 |
| | | 186,502 |
| New Hampshire 0.38% | | |
| Business Fin. Auth., Rev. Bonds (Elliot Hospital Obligated Group Issue), Series 2009-A, 6.00% 2027 | 3,000 | 3,267 |
| Business Fin. Auth., Rev. Bonds (Elliot Hospital Obligated Group Issue), Series 2009-A, 6.125% 2039 | 18,115 | 19,518 |
| Health and Education Facs. Auth., Rev. Ref. Bonds (Southern New Hampshire Medical Center Issue), Series 2007-A, 5.00% 2037 | 8,500 | 8,765 |
| Health and Education Facs. Auth., Rev. Ref. Bonds (Southern New Hampshire Medical Center Issue), Series 2007-A, 5.25% 2028 | 1,500 | 1,591 |
| Health and Educational Facs. Auth., Healthcare System Rev. Bonds (Covenant Health Systems Obligated Group Issue), Series 2007-A, 5.25% 2024 | 1,910 | 2,050 |
| | | 35,191 |
The Tax-Exempt Bond Fund of America — Page 36 of 60
Bonds, notes & other debt instruments
New Jersey 2.30% | Principal amount
(000) | Value
(000) |
Transportation Trust Fund Auth., Transportation System Rev. Ref. Bonds, Current Interest Bonds,
Series 2012-A, 5.00% 2042 | $2,240 | $2,364 |
| Camden County Improvement Auth., Health Care Redev. Project Rev. Bonds (Cooper Health System Obligated Group Issue), Series 2013-A, 5.75% 2042 | 1,335 | 1,448 |
| Certs. of Part., Series 2008-A, 5.00% 2023 | 1,000 | 1,085 |
Econ. Dev. Auth., Cigarette Tax Rev. Bonds, Series 2004, RADIAN insured,
5.375% 2015 (escrowed to maturity) | 1,500 | 1,568 |
Econ. Dev. Auth., Retirement Community Rev. Ref. Bonds (Seabrook Village, Inc. Fac.),
Series 2006, 5.00% 2016 | 1,000 | 1,065 |
Econ. Dev. Auth., Retirement Community Rev. Ref. Bonds (Seabrook Village, Inc. Fac.),
Series 2006, 5.25% 2026 | 1,925 | 1,976 |
Econ. Dev. Auth., Retirement Community Rev. Ref. Bonds (Seabrook Village, Inc. Fac.),
Series 2006, 5.25% 2036 | 5,250 | 5,320 |
| Econ. Dev. Auth., Rev. Bonds (Provident Group - Montclair Properties LLC - Montclair State University Student Housing Project), Series 2010-A, 5.375% 2025 | 4,160 | 4,529 |
| Econ. Dev. Auth., Rev. Bonds (Provident Group - Montclair Properties LLC - Montclair State University Student Housing Project), Series 2010-A, 5.875% 2042 | 5,000 | 5,463 |
| Econ. Dev. Auth., Rev. Ref. Bonds (Crane’s Mill Project), Series 2005-A, 5.00% 2015 | 165 | 168 |
| Econ. Dev. Auth., Rev. Ref. Bonds (Crane’s Mill Project), Series 2005-A, 5.50% 2018 | 615 | 658 |
| Econ. Dev. Auth., School Facs. Construction Bonds, Series 2005-O, 5.00% 2018 (preref. 2015) | 2,000 | 2,056 |
| Econ. Dev. Auth., School Facs. Construction Bonds, Series 2005-P, 5.25% 2018 (preref. 2015) | 1,500 | 1,582 |
| Econ. Dev. Auth., School Facs. Construction Notes, Series 2012-H, 0.96% 20171 | 4,250 | 4,258 |
| Econ. Dev. Auth., School Facs. Construction Rev. Ref. Bonds, Series 2014-PP, 5.00% 2027 | 3,000 | 3,360 |
| Educational Facs. Auth., Rev. Ref. Bonds (Kean University Issue), Series 2009-A, 5.50% 2036 | 2,500 | 2,839 |
| Health Care Facs. Fncg. Auth., Rev. Bonds (AHS Hospital Corp. Issue), Series 2011, 6.00% 2041 | 1,500 | 1,739 |
| Health Care Facs. Fncg. Auth., Rev. Ref. Bonds (Barnabas Health Issue), Series 2011-A, 5.625% 2032 | 3,500 | 3,838 |
| Health Care Facs. Fncg. Auth., Rev. Ref. Bonds (Barnabas Health Issue), Series 2011-A, 5.625% 2037 | 3,500 | 3,808 |
| Health Care Facs. Fncg. Auth., Rev. Ref. Bonds (Barnabas Health Issue), Series 2012-A, 5.00% 2025 | 1,000 | 1,119 |
| Health Care Facs. Fncg. Auth., Rev. Ref. Bonds (St. Clare’s Hospital, Inc. Issue), Series 2004-A, RADIAN insured, 5.25% 2016 (escrowed to maturity) | 4,740 | 5,166 |
| Health Care Facs. Fncg. Auth., Rev. Ref. Bonds (St. Clare’s Hospital, Inc. Issue), Series 2004-B, National insured, 5.25% 2015 (escrowed to maturity) | 2,150 | 2,245 |
Health Care Facs. Fncg. Auth., Rev. Ref. Bonds (St. Peter’s University Hospital Obligated Group Issue),
Series 2011, 6.00% 2026 | 1,000 | 1,096 |
| Higher Education Student Assistance Auth., Student Loan Rev. Bonds, Series 2009-A, 5.00% 2017 | 8,000 | 8,786 |
| Higher Education Student Assistance Auth., Student Loan Rev. Ref. Bonds, Series 2010-1A, 5.00% 2015 | 3,000 | 3,183 |
| Rutgers State University, G.O. Bonds (State University of New Jersey), Series 2013-J, 5.00% 2028 | 7,000 | 8,153 |
Tobacco Settlement Fncg. Corp., Tobacco Settlement Asset-backed Rev. Ref. Bonds,
Series 2007-1-A, 4.625% 2026 | 1,000 | 868 |
Tobacco Settlement Fncg. Corp., Tobacco Settlement Asset-backed Rev. Ref. Bonds,
Series 2007-1-A, 5.00% 2041 | 38,100 | 28,343 |
| Transit Corp., Certs. of Part., Series 2005-A, FGIC-National insured, 5.00% 2018 | 7,750 | 8,166 |
| Transit Corp., Certs. of Part., Series 2005-A, FGIC-National insured, 5.00% 2021 | 5,000 | 5,269 |
| Transit Corp., Grant Anticipation Notes (Federal Transit Administration Section 5307 Urbanized Area Formula Funds) Series 2014-A, 5.00% 2021 | 2,125 | 2,462 |
| Transportation Trust Fund Auth., Transportation System Bonds (Capital Appreciation Bonds), Series 2010-A, 0% 2030 | 10,000 | 4,652 |
Transportation Trust Fund Auth., Transportation System Bonds, Series 2004-A, FGIC-National insured,
5.75% 2025 | 5,000 | 6,075 |
| Transportation Trust Fund Auth., Transportation System Bonds, Series 2005-D, 5.00% 2020 (preref. 2015) | 4,000 | 4,170 |
| Transportation Trust Fund Auth., Transportation System Bonds, Series 2008-A, 6.00% 2038 | 3,255 | 3,796 |
| Transportation Trust Fund Auth., Transportation System Bonds, Series 2008-A, 6.00% 2038 (preref. 2018) | 1,745 | 2,124 |
| Transportation Trust Fund Auth., Transportation System Bonds, Series 2011-B, 5.50% 2031 | 2,000 | 2,285 |
Transportation Trust Fund Auth., Transportation System Rev. Ref. Bonds, Current Interest Bonds,
Series 2006-A, 5.25% 2020 | 10,000 | 11,684 |
The Tax-Exempt Bond Fund of America — Page 37 of 60
Bonds, notes & other debt instruments
New Jersey (continued) | Principal amount
(000) | Value
(000) |
Transportation Trust Fund Auth., Transportation System Rev. Ref. Bonds, Current Interest Bonds,
Series 2006-A, 5.25% 2021 | $10,000 | $11,568 |
Transportation Trust Fund Auth., Transportation System Rev. Ref. Bonds, Current Interest Bonds,
Series 2006-A, 5.25% 2022 | 20,000 | 23,216 |
| Transportation Trust Fund Auth., Transportation System Rev. Ref. Bonds, Series 2005-B, AMBAC insured, 5.25% 2023 | 8,000 | 9,297 |
| Transportation Trust Fund Auth., Transportation System Rev. Ref. Bonds, Series 2013-A, 5.00% 2020 | 1,000 | 1,149 |
| Turnpike Auth., Turnpike Rev. Ref. Bonds, Series 2013-D, 0.74% 2024 (put 2018)1 | 3,100 | 3,109 |
| Turnpike Auth., Turnpike Rev. Ref. Bonds, Series 2013-E, 0.68% 2023 (put 2017)1 | 4,015 | 4,020 |
| Turnpike Auth., Turnpike Rev. Ref. Bonds, Series 2013-E, 0.74% 2024 (put 2018)1 | 3,625 | 3,635 |
| | | 214,760 |
| New Mexico 0.14% | | |
| Bernalillo County, Gross Receipts Tax Rev. Ref. Bonds, Series 1998, 5.20% 2021 | 6,040 | 7,032 |
| Educational Assistance Foundation, Education Loan Rev. Ref. Bonds, Series 2010-A-2, 0.877% 20281 | 790 | 786 |
Hospital Equipment Loan Council, Rev. Ref. Bonds (Haverland Charter Lifestyle Group), Series 2012,
5.00% 2032 | 1,415 | 1,417 |
| Mortgage Fin. Auth., Single-family Mortgage Program Bonds, Series 2009-C-2, Class I, 5.70% 2040 | 570 | 594 |
| Mortgage Fin. Auth., Single-family Mortgage Program Bonds, Series 2009-D, Class I, 5.35% 2040 | 325 | 348 |
| Mortgage Fin. Auth., Single-family Mortgage Program Class I Bonds, Series 2010-A, 4.50% 2028 | 760 | 802 |
| Mortgage Fin. Auth., Single-family Mortgage Program Class I Bonds, Series 2010-A, 4.625% 2025 | 385 | 400 |
| Mortgage Fin. Auth., Single-family Mortgage Program Rev. Ref. Bonds, Series 2009-B-2, Class I, 5.65% 2039 | 795 | 864 |
| Mortgage Fin. Auth., Single-family Mortgage Program Rev. Ref. Bonds, Series 2009-E, Class I, 5.30% 2040 | 1,120 | 1,161 |
| | | 13,404 |
| New York 5.57% | | |
| City of Albany Industrial Dev. Agcy., Civic Fac. Rev. Ref. Bonds (St. Peter’s Hospital of the City of Albany Project), Series 2008-A, 5.25% 2027 | 1,000 | 1,098 |
| Buffalo and Erie County Industrial Land Dev. Corp., Rev. Bonds (Buffalo State College Foundation Housing Corp. Project), Series 2011-A, 6.00% 2031 | 1,000 | 1,152 |
County of Chautauqua Industrial Dev. Agcy., Exempt Fac. Rev. Bonds (NRG Dunkirk Power Project),
Series 2009, 5.875% 2042 | 2,000 | 2,175 |
Metropolitan Transportation Auth., Dedicated Tax Fund Rev. Ref. Bonds, Series 2008-A-2A,
0.44% 2026 (put 2017)1 | 500 | 500 |
Dormitory Auth., North Shore-Long Island Jewish Obligated Group, Rev. Ref. Bonds, Series 2011-A,
5.00% 2032 | 11,000 | 11,894 |
| Dormitory Auth., FHA insured Mortgage Hospital Rev. Bonds (Kaleida Health), Series 2006, 4.60% 2027 | 6,720 | 7,156 |
| Dormitory Auth., Fordham University Rev. Bonds, Series 2011-A, 5.50% 2036 | 500 | 559 |
| Dormitory Auth., Mental Health Services Facs. Improvement Rev. Ref. Bonds, Series 2010-A, 5.00% 2021 | 5,000 | 5,844 |
| Dormitory Auth., Mount Sinai Hospital Obligated Group Rev. Ref. Bonds, Series 2010-A, 5.00% 2026 | 1,250 | 1,386 |
Dormitory Auth., Municipal Health Facs. Improvement Program Lease Rev. Bonds, Series 2001-2,
Subseries 2-2, 5.00% 2023 | 10,000 | 11,217 |
Dormitory Auth., Municipal Health Facs. Improvement Program Lease Rev. Bonds, Series 2001-2,
Subseries 2-3, 5.00% 2023 | 7,150 | 8,020 |
Dormitory Auth., Municipal Health Facs. Improvement Program Lease Rev. Bonds, Series 2001-2,
Subseries 2-3, 5.00% 2026 | 3,535 | 3,939 |
Dormitory Auth., Rochester General Hospital Insured Rev. Bonds, Series 2005, RADIAN insured,
5.00% 2015 (escrowed to maturity) | 1,495 | 1,591 |
Dormitory Auth., School Districts Rev. Bond Fncg. Program Rev. Bonds, Series 2012-F,
Assured Guaranty Municipal insured, 5.00% 2020 | 1,100 | 1,307 |
| Dormitory Auth., Secured Hospital Rev. Ref. Bonds (Interfaith Medical Center), Series 2007, 5.00% 2019 | 2,100 | 2,223 |
| Dormitory Auth., Secured Hospital Rev. Ref. Bonds (Interfaith Medical Center), Series 2007, 5.00% 2020 | 3,400 | 3,634 |
| Dormitory Auth., State Personal Income Tax Rev. Bonds (Education), Series 2008-B, 5.00% 2023 | 10,000 | 11,538 |
| Dormitory Auth., State Personal Income Tax Rev. Bonds (Education), Series 2009-A, 5.00% 2028 | 8,000 | 9,121 |
| Dormitory Auth., State Personal Income Tax Rev. Bonds (General Purpose), Series 2011-A, 5.00% 2033 | 8,760 | 9,830 |
The Tax-Exempt Bond Fund of America — Page 38 of 60
Bonds, notes & other debt instruments
New York (continued) | Principal amount
(000) | Value
(000) |
| Dormitory Auth., State Personal Income Tax Rev. Bonds (General Purpose), Series 2011-C, 5.00% 2041 | $1,890 | $2,070 |
| Dormitory Auth., State Personal Income Tax Rev. Bonds (General Purpose), Series 2014-A, 5.00% 2030 | 2,500 | 2,888 |
| Dormitory Auth., State Sales Tax Rev. Bonds, Series 2013-A, 5.00% 2038 | 1,600 | 1,788 |
| Environmental Facs. Corp., State Clean Water and Drinking Water Rev. Ref. Second Resolution Bonds (New York City Municipal Water Fin. Auth. Projects), Series 2002-K, 5.50% 2017 | 5,000 | 5,719 |
| Environmental Facs. Corp., State Clean Water and Drinking Water Revolving Funds Rev. Bonds (New York City Municipal Water Fin. Auth. Projects - Second Resolution Bonds), Series 2011-B, 5.00% 2036 | 2,500 | 2,800 |
| Erie County Industrial Dev. Agcy., School Fac. Rev. Bonds (City School Dist. of the City of Buffalo Project), Series 2011-A, 5.25% 2025 | 500 | 588 |
| Erie County Industrial Dev. Agcy., School Fac. Rev. Ref. Bonds (City School Dist. of the City of Buffalo Project), Series 2011-B, 5.00% 2024 | 1,000 | 1,168 |
| Erie County Industrial Dev. Agcy., School Fac. Rev. Ref. Bonds (City School Dist. of the City of Buffalo Project), Series 2012-A, 5.00% 2025 | 1,000 | 1,166 |
| Erie County Industrial Dev. Agcy., School Fac. Rev. Ref. Bonds (City School Dist. of the City of Buffalo Project), Series 2013-A, 5.00% 2026 | 6,000 | 7,014 |
| Erie County Industrial Dev. Agcy., School Fac. Rev. Ref. Bonds (City School Dist. of the City of Buffalo Project), Series 2013-A, 5.00% 2027 | 3,000 | 3,481 |
| City of New York, G.O. Bonds, Series 2014-J, 5.00% 2030 | 2,000 | 2,307 |
| Hudson Yards Infrastructure Corp., Rev. Bonds, Fiscal 2012 Series A, 5.25% 2047 | 6,000 | 6,543 |
| Hudson Yards Infrastructure Corp., Rev. Bonds, Fiscal 2012 Series A, 5.75% 2047 | 9,500 | 10,822 |
| Liberty Dev. Corp., Liberty Rev. Ref. Bonds (4 World Trade Center Project), Series 2011, 5.00% 2031 | 3,500 | 3,824 |
| Liberty Dev. Corp., Liberty Rev. Ref. Bonds (4 World Trade Center Project), Series 2011, 5.00% 2044 | 4,000 | 4,302 |
| Liberty Dev. Corp., Liberty Rev. Ref. Bonds (7 World Trade Center Project), Series 2012, 5.00% 2043 | 4,000 | 4,316 |
| Liberty Dev. Corp., Liberty Rev. Ref. Bonds (Bank of America Tower at One Bryant Park Project), Series 2010, 6.375% 2049 | 21,000 | 23,173 |
| Liberty Dev. Corp., Rev. Bonds (Goldman Sachs Headquarters Issue), Series 2005, 5.25% 2035 | 1,000 | 1,159 |
| Long Island Power Auth., Electric System General Rev. Bonds, Series 2003-C, CIFG insured, 5.25% 2029 | 4,000 | 4,771 |
| Long Island Power Auth., Electric System General Rev. Bonds, Series 2012-A, 5.00% 2042 | 8,600 | 9,204 |
| Dobbs Ferry Local Dev. Corp., Rev. Bonds, Series 2014, 5.00% 2044 | 1,250 | 1,357 |
| Metropolitan Transportation Auth., Dedicated Tax Fund Bonds, Series 2009-B, 5.00% 2034 | 1,000 | 1,113 |
| Metropolitan Transportation Auth., Dedicated Tax Fund Bonds, Series 2009-B, 5.25% 2022 | 5,000 | 5,981 |
| Metropolitan Transportation Auth., Dedicated Tax Fund Bonds, Series 2009-B, 5.25% 2030 | 2,000 | 2,280 |
| Metropolitan Transportation Auth., Dedicated Tax Fund Rev. Ref. Bonds, Series 2002-B-3C, 1.01% 20191 | 8,900 | 8,921 |
| Metropolitan Transportation Auth., Dedicated Tax Fund Rev. Ref. Bonds, Series 2002-B-3D, 1.06% 20201 | 11,100 | 11,128 |
| Metropolitan Transportation Auth., Dedicated Tax Fund Rev. Ref. Bonds, Series 2012-A, 5.00% 2022 | 1,680 | 2,035 |
Metropolitan Transportation Auth., Transportation Rev. Bonds, Series 2003-B, FGIC-National insured,
5.25% 2021 | 5,000 | 6,043 |
| Metropolitan Transportation Auth., Transportation Rev. Bonds, Series 2005-C, 5.00% 2016 | 1,000 | 1,104 |
| Metropolitan Transportation Auth., Transportation Rev. Bonds, Series 2008-C, 5.50% 2018 | 6,500 | 7,110 |
| Metropolitan Transportation Auth., Transportation Rev. Bonds, Series 2011-D, 5.00% 2036 | 6,000 | 6,500 |
| Metropolitan Transportation Auth., Transportation Rev. Bonds, Series 2012-E, 5.00% 2024 | 2,000 | 2,355 |
| Metropolitan Transportation Auth., Transportation Rev. Bonds, Series 2014-A-1, 5.00% 2044 | 4,250 | 4,627 |
| Metropolitan Transportation Auth., Transportation Rev. Bonds, Series 2014-B, 5.00% 2044 | 13,000 | 14,203 |
Metropolitan Transportation Auth., Transportation Rev. Ref. Bonds, Series 2002-G-1G,
0.752% 2026 (put 2015)1 | 5,000 | 5,023 |
| Metropolitan Transportation Auth., Transportation Rev. Ref. Bonds, Series 2011-C, 5.00% 2023 | 5,000 | 5,873 |
| Metropolitan Transportation Auth., Transportation Rev. Ref. Bonds, Series 2012-D, 5.00% 2024 | 10,000 | 11,775 |
| Metropolitan Transportation Auth., Transportation Rev. Ref. Bonds, Series 2012-D, 5.00% 2029 | 7,000 | 7,892 |
| Metropolitan Transportation Auth., Transportation Rev. Ref. Bonds, Series 2012-D, 5.00% 2032 | 3,105 | 3,448 |
| Metropolitan Transportation Auth., Transportation Rev. Ref. Bonds, Series 2012-F, 5.00% 2030 | 10,000 | 11,212 |
| Metropolitan Transportation Auth., Transportation Rev. Ref. Bonds, Series 2014-A-2, 5.00% 2028 | 3,000 | 3,453 |
| Monroe County Industrial Dev. Corp., FHA insured Mortgage Rev. Bonds (Unity Hospital of Rochester Project), Series 2010, 5.50% 2040 | 1,000 | 1,146 |
| Mortgage Agcy., Mortgage Rev. Ref. Bonds, Series 48, 2.625% 2041 | 410 | 425 |
The Tax-Exempt Bond Fund of America — Page 39 of 60
Bonds, notes & other debt instruments
New York (continued) | Principal amount
(000) | Value
(000) |
| Municipal Bond Bank Agcy., Special School Purpose Rev. Ref. Bonds (Prior Year Claims - City of New York), Series 2012-A, 5.00% 2021 | $2,000 | $2,377 |
| Nassau County Local Econ. Assistance Corp., Rev. Ref. Bonds (Winthrop-University Hospital Association Project), Series 2012, 5.00% 2037 | 1,000 | 1,041 |
| City of New York, G.O. Bonds Series H, 5.00% 2015 (preref. 2014) | 940 | 940 |
| City of New York, G.O. Bonds, Fiscal 2004 Series H, 5.00% 2016 | 1,585 | 1,591 |
| City of New York, G.O. Bonds, Fiscal 2004 Series H, 5.00% 2016 (preref. 2014) | 1,415 | 1,415 |
| City of New York, G.O. Bonds, Fiscal 2005 Series N, 5.00% 2020 | 590 | 618 |
| City of New York, G.O. Bonds, Fiscal 2005 Series N, 5.00% 2020 (preref. 2015) | 1,910 | 2,003 |
| City of New York, G.O. Bonds, Fiscal 2006 Series J, 5.00% 2021 | 10 | 11 |
| City of New York, G.O. Bonds, Fiscal 2006 Series J, 5.00% 2021 (preref. 2016) | 3,740 | 4,065 |
| City of New York, G.O. Bonds, Fiscal 2008 Series J-4, 0.61% 20251 | 2,350 | 2,348 |
| City of New York, G.O. Bonds, Fiscal 2013 Series F-1, 5.00% 2037 | 3,000 | 3,311 |
| City of New York, G.O. Bonds, Fiscal 2013 Series H, 5.00% 2023 | 3,855 | 4,630 |
| City of New York, G.O. Bonds, Fiscal 2013 Series J, 5.00% 2023 | 500 | 601 |
| City of New York, G.O. Bonds, Series 2014-G, 5.00% 2023 | 2,500 | 3,003 |
| City of New York, G.O. Bonds, Series H, 5.00% 2015 | 1,060 | 1,064 |
| New York City Housing Dev. Corp., Multi-family Housing Rev. Bonds, Series 2009-C-1, 5.50% 2034 | 1,000 | 1,067 |
| New York City Housing Dev. Corp., Multi-family Housing Rev. Bonds, Series 2009-K, 4.90% 2034 | 3,000 | 3,137 |
| New York City Municipal Water Fin. Auth., Water and Sewer System Rev. Ref. Bonds, Fiscal 2006 Series C, 4.75% 2033 | 5,000 | 5,279 |
| New York City Municipal Water Fin. Auth., Water and Sewer System Second General Resolution Rev. Bonds, Fiscal 2009 Series EE, 5.00% 2018 (escrowed to maturity) | 5,000 | 5,788 |
| New York City Municipal Water Fin. Auth., Water and Sewer System Second General Resolution Rev. Bonds, Fiscal 2012 Series BB, 5.25% 2044 | 3,000 | 3,337 |
| New York City Municipal Water Fin. Auth., Water and Sewer System Second General Resolution Rev. Ref. Bonds, Fiscal 2007 Series DD, 4.75% 2035 | 7,500 | 8,021 |
| New York City Municipal Water Fin. Auth., Water and Sewer System Second General Resolution Rev. Ref. Bonds, Fiscal 2010 Series FF, 5.00% 2025 | 2,255 | 2,630 |
| New York City Municipal Water Fin. Auth., Water and Sewer System Second General Resolution Rev. Ref. Bonds, Fiscal 2011 Series GG, 5.00% 2026 | 2,000 | 2,337 |
| New York City Municipal Water Fin. Auth., Water and Sewer System Second General Resolution Rev. Ref. Bonds, Fiscal 2011 Series GG, 5.00% 2043 | 2,000 | 2,166 |
| New York City Transitional Fin. Auth., Building Aid Rev. Bonds, Fiscal 2009 Series S-5, 5.25% 2022 | 5,000 | 5,857 |
| New York City Transitional Fin. Auth., Building Aid Rev. Bonds, Fiscal 2012 Series S-1-A, 5.00% 2032 | 12,730 | 14,305 |
| New York City Transitional Fin. Auth., Building Aid Rev. Bonds, Fiscal 2013 Series S-1, 5.00% 2033 | 1,825 | 2,044 |
| New York City Transitional Fin. Auth., Future Tax Secured Bonds, Fiscal 2011 Series D, 5.00% 2024 | 1,000 | 1,177 |
| New York City Transitional Fin. Auth., Future Tax Secured Bonds, Fiscal 2012 Series E-1, 5.00% 2037 | 2,000 | 2,231 |
| New York City Transitional Fin. Auth., Future Tax Secured Bonds, Fiscal 2012 Series F-1, 5.00% 2039 | 1,000 | 1,102 |
| New York City Transitional Fin. Auth., Future Tax Secured Bonds, Fiscal 2013 Series F-1, 5.00% 2028 | 1,500 | 1,734 |
| New York City Transitional Fin. Auth., Future Tax Secured Bonds, Fiscal 2013 Series F-1, 5.00% 2036 | 1,000 | 1,114 |
| New York City Transitional Fin. Auth., Future Tax Secured Bonds, Series 2014-D-1, 5.00% 2036 | 500 | 562 |
| New York City Transitional Fin. Auth., Future Tax Secured Bonds, Series A-1, 5.00% 2021 (preref. 2016) | 3,500 | 3,831 |
| New York City Transitional Fin. Auth., Future Tax Secured Rev. Ref. Bonds, Series 2014-A1, 5.00% 2037 | 2,500 | 2,813 |
| New York City Transitional Fin. Auth., Multi-Modal Rev. Ref. Bonds, Series 2011-B, 5.00% 2020 | 1,500 | 1,783 |
| New York City, Health and Hospitals Corp., Health System Rev. Ref. Bonds, Series 2010-A, 5.00% 2021 | 1,500 | 1,719 |
| New York City, Health and Hospitals Corp., Health System Rev. Ref. Bonds, Series 2010-A, 5.00% 2024 | 5,000 | 5,696 |
| Port Auth., Special Project Bonds (JFK International Air Terminal LLC Project), Series 8, 5.00% 2020 | 1,000 | 1,159 |
| Port Auth., Special Project Bonds (JFK International Air Terminal LLC Project), Series 8, 6.00% 2036 | 7,000 | 8,096 |
| Port Auth., Special Project Bonds (JFK International Air Terminal LLC Project), Series 8, 6.00% 2042 | 13,000 | 14,955 |
| County of Rockland G.O. Bonds, Series 2014-A, Assured Guaranty Municipal insured, 5.00% 2022 | 1,750 | 2,058 |
| Seneca Nation of Indians, Rev. Bonds, Series A, 5.00% 20232 | 18,900 | 19,814 |
| Seneca Nation of Indians, Rev. Bonds, Series A, 5.25% 20162 | 2,000 | 2,117 |
| Suffolk County Econ. Dev. Corp., Rev. Ref. Bonds (Catholic Health Services of Long Island Obligated Group Project), Series 2011, 5.00% 2028 | 2,500 | 2,703 |
The Tax-Exempt Bond Fund of America — Page 40 of 60
Bonds, notes & other debt instruments
New York (continued) | Principal amount
(000) | Value
(000) |
| Suffolk County Industrial Dev. Agcy., Continuing Care Retirement Community Rev. Ref. Bonds (Jefferson’s Ferry Project), Series 2006, 5.00% 2028 | $3,000 | $3,098 |
| Thruway Auth., General Rev. Bonds, Series I, 5.00% 2042 | 2,500 | 2,718 |
| Thruway Auth., General Rev. Junior Indebtedness Obligations Series 2013-A, 5.00% 2019 | 2,800 | 3,247 |
| Thruway Auth., Second General Highway and Bridge Trust Fund Bonds, Series 2008-A, 5.00% 2022 | 1,500 | 1,714 |
| Thruway Auth., Second General Highway and Bridge Trust Fund Rev. Ref. Bonds, Series 2012-A, 5.00% 2030 | 1,000 | 1,127 |
| Tobacco Settlement Fncg. Corp., Asset-Backed Rev. Bonds, Series 2013-B, 5.00% 2020 | 2,000 | 2,166 |
| Tobacco Settlement Fncg. Corp., Asset-Backed Rev. Bonds, Series 2013-B, 5.00% 2021 | 800 | 865 |
Tobacco Settlement Fncg. Corp., Rev. Ref. Bonds (State Contingency Contract Secured),
Series 2011-B, 5.00% 2018 | 500 | 577 |
| Triborough Bridge and Tunnel Auth. (MTA Bridges and Tunnels), General Rev. Ref. Bonds, Series 2005-B-4E, 11.035% 2032 (put 2017)1 | 4,000 | 4,009 |
| Triborough Bridge and Tunnel Auth. (MTA Bridges and Tunnels), Rev. Ref. Bonds, Series 2013-A, 5.00% 2023 | 2,500 | 3,015 |
| Urban Dev. Corp., Service Contract Rev. Ref. Bonds, Series 2008-D, 5.25% 2021 | 8,500 | 9,796 |
| Urban Dev. Corp., State Personal Income Tax Rev. Bonds (General Purpose), Series 2013-D, 5.00% 2021 | 5,000 | 5,979 |
| Utility Debt Securitization Auth., Restructuring Bonds, Series 2013-TE, 5.00% 2030 | 2,500 | 2,927 |
| | | 519,179 |
| North Carolina 0.99% | | |
| Broad River Water Auth., Water System Rev. Ref. Bonds, Series 2005, XLCA insured, 5.00% 2016 | 1,220 | 1,264 |
| Broad River Water Auth., Water System Rev. Ref. Bonds, Series 2005, XLCA insured, 5.00% 2017 | 1,390 | 1,437 |
| Capital Improvement Limited Obligation Bonds, Series 2009-A, 5.00% 2027 | 2,500 | 2,882 |
| Capital Facs. Fin. Agcy., Rev. Ref. Bonds (Johnson & Wales University), Series 2013-A, 5.00% 2022 | 740 | 869 |
| Eastern Municipal Power Agcy., Power System Rev. Ref. Bonds, Series 1993-B, 6.00% 2022 | 2,815 | 3,499 |
| Eastern Municipal Power Agcy., Power System Rev. Ref. Bonds, Series 1993-B, 6.00% 2026 | 1,990 | 2,538 |
Eastern Municipal Power Agcy., Power System Rev. Ref. Bonds, Series 1993-B, FGIC-National insured,
6.00% 2025 | 11,225 | 14,282 |
| Eastern Municipal Power Agcy., Power System Rev. Ref. Bonds, Series 1993-B, National insured, 6.00% 2026 | 2,500 | 3,188 |
| Eastern Municipal Power Agcy., Power System Rev. Ref. Bonds, Series 2005-A, AMBAC insured, 5.00% 2020 | 11,000 | 11,703 |
| Eastern Municipal Power Agcy., Power System Rev. Ref. Bonds, Series 2008-A, 5.00% 2023 | 1,400 | 1,543 |
| Eastern Municipal Power Agcy., Power System Rev. Ref. Bonds, Series 2008-A, 5.00% 2024 | 9,855 | 10,777 |
| Eastern Municipal Power Agcy., Power System Rev. Ref. Bonds, Series 2009-B, 5.00% 2026 | 2,000 | 2,221 |
| Medical Care Commission, Health Care Facs. First Mortgage Rev. Ref. Bonds (Lutheran Services for the Aging), Series 2012-A, 5.00% 2037 | 1,000 | 1,006 |
| Medical Care Commission, Health Care Facs. First Mortgage Rev. Ref. Bonds (Lutheran Services for the Aging), Series 2012-A, 5.00% 2042 | 3,360 | 3,368 |
Medical Care Commission, Health Care Facs. Rev. Ref. Bonds (Wake Forest Baptist Obligated Group),
Series 2012-C, 0.80% 2033 (put 2017)1 | 1,935 | 1,928 |
Medical Care Commission, Retirement Facs. First Mortgage Rev. Bonds (Carolina Village Project),
Series 2008-A, 6.00% 2038 | 5,000 | 5,144 |
| Municipal Power Agcy. No. 1, Catawba Electric Rev. Ref. Bonds, Series 2009-A, 5.00% 2030 | 2,000 | 2,221 |
| Municipal Power Agcy. No. 1, Catawba Electric Rev. Ref. Bonds, Series 2010-B, 5.00% 2020 | 3,350 | 3,924 |
| Municipal Power Agcy. No. 1, Catawba Electric Rev. Ref. Bonds, Series 2012-A, 4.00% 2019 | 2,500 | 2,784 |
| Municipal Power Agcy. No. 1, Catawba Electric Rev. Ref. Bonds, Series 2012-A, 4.00% 2020 | 1,000 | 1,120 |
| Municipal Power Agcy. No. 1, Catawba Electric Rev. Ref. Bonds, Series 2012-A, 5.00% 2019 | 5,000 | 5,781 |
| Municipal Power Agcy. No. 1, Catawba Electric Rev. Ref. Bonds, Series 2012-A, 5.00% 2020 | 1,250 | 1,464 |
| Onslow County Hospital Auth., FHA insured Mortgage Rev. Ref. Bonds (Onslow Memorial Hospital Project), Series 2006, National insured, 5.00% 2023 | 1,125 | 1,178 |
| Onslow County Hospital Auth., FHA insured Mortgage Rev. Ref. Bonds (Onslow Memorial Hospital Project), Series 2006, National insured, 5.00% 2024 | 1,155 | 1,203 |
| Onslow County Hospital Auth., FHA insured Mortgage Rev. Ref. Bonds (Onslow Memorial Hospital Project), Series 2006, National insured, 5.00% 2024 | 1,185 | 1,234 |
| Onslow County Hospital Auth., FHA insured Mortgage Rev. Ref. Bonds (Onslow Memorial Hospital Project), Series 2006, National insured, 5.125% 2021 | 500 | 528 |
The Tax-Exempt Bond Fund of America — Page 41 of 60
Bonds, notes & other debt instruments
North Carolina (continued) | Principal amount
(000) | Value
(000) |
| Onslow County Hospital Auth., FHA insured Mortgage Rev. Ref. Bonds (Onslow Memorial Hospital Project), Series 2006, National insured, 5.125% 2022 | $1,040 | $1,094 |
| Dept. of State Treasurer, Grant Anticipation Rev. Vehicle Bonds, Series 2009, 5.00% 2018 | 2,000 | 2,286 |
| | | 92,466 |
| North Dakota 0.05% | | |
| Burleigh County, Health Care Rev. Bonds (St. Alexius Medical Center Project), Series 2014-A, 5.00% 2024 | 1,210 | 1,315 |
| Burleigh County, Health Care Rev. Bonds (St. Alexius Medical Center Project), Series 2014-A, 5.00% 2035 | 700 | 736 |
| Housing Fin. Agcy., Housing Fin. Program Bonds (Home Mortgage Fin. Program), Series 2012-A, 3.75% 2042 | 1,440 | 1,565 |
| Housing Fin. Agcy., Housing Fin. Program Bonds (Home Mortgage Fin. Program), Series 2014-A, 4.00% 2034 | 1,000 | 1,094 |
| | | 4,710 |
| Ohio 4.00% | | |
| Air Quality Dev. Auth., Air Quality Dev. Rev. Bonds (FirstEnergy Generation Corp. Project), Series 2009-A, 5.70% 2020 | 14,215 | 16,359 |
Air Quality Dev. Auth., Pollution Control Rev. Ref. Bonds (FirstEnergy Generation Corp. Project),
Series 2009-C, 5.625% 2018 | 17,200 | 19,223 |
| Air Quality Dev. Auth., Pollution Control Rev. Ref. Bonds (FirstEnergy Nuclear Generation Corp. Project), Series 2009-A, 5.75% 2033 (put 2016) | 1,000 | 1,074 |
| Akron, Bath and Copley Joint Township Hospital Dist., Hospital Facs. Rev. Bonds (Akron General Health System), Series 2012, 5.00% 2031 | 3,000 | 3,157 |
| County of Allen, Hospital Facs. Rev. Ref. and Improvement Bonds (Catholic Health Partners), Series 2012-A, 5.00% 2033 | 16,000 | 17,305 |
| County of Allen, Hospital Facs. Rev. Ref. Bonds (Catholic Healthcare Partners), Series 2010-A, 5.00% 2038 | 5,850 | 6,190 |
| American Municipal Power, Inc., AMP Fremont Energy Center Project Rev. Bonds, Series 2012-B, 5.00% 2037 | 2,000 | 2,147 |
| Buckeye Tobacco Settlement Fncg. Auth., Tobacco Settlement Asset-backed Bonds, Convertible Capital Appreciation Bonds, Series 2007-A-3, 6.25% 2037 | 5,000 | 4,160 |
| Buckeye Tobacco Settlement Fncg. Auth., Tobacco Settlement Asset-backed Bonds, Current Interest Bonds, Series 2007-A-2, 5.875% 2030 | 38,990 | 31,740 |
| Buckeye Tobacco Settlement Fncg. Auth., Tobacco Settlement Asset-backed Bonds, Current Interest Bonds, Series 2007-A-2, 5.875% 2047 | 35,790 | 27,999 |
| Buckeye Tobacco Settlement Fncg. Auth., Tobacco Settlement Asset-backed Bonds, Current Interest Bonds, Series 2007-A-2, 6.50% 2047 | 51,125 | 43,131 |
| Building Auth., State Facs. Rev. Ref. Bonds (Adult Correctional Building Fund Projects), Series 2004-C, National insured, 5.25% 2017 | 10,000 | 11,461 |
County of Butler, Hospital Facs. Rev. Bonds (Cincinnati Children’s Hospital Medical Center Project),
Series 2006-K, FGIC-National insured, 4.25% 2030 | 4,000 | 4,009 |
| County of Butler, Hospital Facs. Rev. Bonds (UC Health), Series 2010, 5.50% 2040 | 6,000 | 6,538 |
| County of Butler, Hospital Facs. Rev. Bonds (UC Health), Series 2010, 5.75% 2040 | 11,000 | 12,157 |
| City of Centerville, Health Care Rev. Ref. Bonds (Bethany Lutheran Village Continuing Care Fac. Expansion Project), Series 2007-A, 6.00% 2027 | 3,080 | 3,198 |
| City of Centerville, Health Care Rev. Ref. Bonds (Bethany Lutheran Village Continuing Care Fac. Expansion Project), Series 2007-A, 6.00% 2038 | 2,000 | 2,046 |
City of Cleveland, Airport System Rev. Ref. Bonds, Series 2000-C, Assured Guaranty Municipal insured,
5.00% 2031 | 8,000 | 8,280 |
| City of Cleveland, Airport System Rev. Ref. Bonds, Series 2006-A, AMBAC insured, 5.25% 2021 | 8,000 | 9,315 |
| City of Cleveland, Airport System Rev. Ref. Bonds, Series 2011-A, 5.00% 2022 | 3,000 | 3,403 |
City of Cleveland, Airport System Rev. Ref. Bonds, Series 2011-A, Assured Guaranty Municipal insured,
5.00% 2021 | 2,000 | 2,299 |
| City of Cleveland, Airport System Rev. Ref. Bonds, Series 2012-A, 5.00% 2026 | 3,000 | 3,334 |
| City of Cleveland, Airport System Rev. Ref. Bonds, Series 2012-A, 5.00% 2028 | 3,000 | 3,244 |
| City of Cleveland, Airport System Rev. Ref. Bonds, Series 2012-A, 5.00% 2029 | 3,000 | 3,226 |
| City of Cleveland, Airport System Rev. Ref. Bonds, Series 2012-A, 5.00% 2030 | 3,655 | 3,906 |
| City of Cleveland, Airport System Rev. Ref. Bonds, Series 2012-A, 5.00% 2031 | 2,000 | 2,124 |
The Tax-Exempt Bond Fund of America — Page 42 of 60
Bonds, notes & other debt instruments
Ohio (continued) | Principal amount
(000) | Value
(000) |
City of Cleveland, Airport System Rev. Ref. Bonds, Series 2012-A, Assured Guaranty Municipal insured,
5.00% 2028 | $4,000 | $4,379 |
County of Franklin, Health Care Facs. Improvement Rev. Bonds (OPRS Communities), Series 2013-A,
6.00% 2035 | 2,700 | 2,926 |
County of Franklin, Health Care Facs. Improvement Rev. Bonds (OPRS Communities), Series 2013-A,
6.125% 2040 | 4,000 | 4,278 |
| County of Franklin, Health Care Facs. Improvement Rev. Bonds (Presbyterian Retirement Services Project), Series 2010-A, 5.625% 2026 | 1,600 | 1,724 |
| County of Gallia, Hospital Facs. Rev. Ref. and Improvement Bonds (Holzer Health System Obligated Group Project), Series 2012-A, 8.00% 2042 | 5,000 | 5,494 |
| County of Hamilton, Healthcare Facs. Rev. Bonds (Christ Hospital Project), Series 2012, 5.00% 2042 | 3,500 | 3,661 |
| County of Hamilton, Healthcare Facs. Rev. Bonds (Christ Hospital Project), Series 2012, 5.25% 2032 | 4,075 | 4,414 |
County of Hamilton, Healthcare Rev. Ref. Bonds (Life Enriching Communities Project), Series 2006-A,
5.00% 2037 | 9,955 | 10,131 |
| Higher Education G.O. Ref. Bonds, Series 2009-A, 5.00% 2019 | 5,000 | 5,878 |
| Hospital Rev. Bonds (Cleveland Clinic Health System Obligated Group), Series 2008-A, 5.25% 2029 | 2,000 | 2,204 |
| Hospital Rev. Bonds (Cleveland Clinic Health System Obligated Group), Series 2008-A, 5.25% 2033 | 3,000 | 3,294 |
| Hospital Rev. Bonds (University Hospitals Health System, Inc. Project), Series 2007-A, 4.50% 2031 | 2,750 | 2,799 |
| Hospital Rev. Bonds (University Hospitals Health System, Inc.), Series 2009-C-2, 4.875% 2039 (put 2015) | 1,000 | 1,044 |
| Hospital Rev. Ref. Bonds (Cleveland Clinic Health System Obligated Group), Series 2012-A, 5.00% 2038 | 5,000 | 5,467 |
Housing Fin. Agcy., Capital Fund Rev. Bonds, Series 2007-A, Assured Guaranty Municipal insured,
5.00% 2022 | 5,565 | 6,135 |
Housing Fin. Agcy., Residential Mortgage Rev. Ref. Bonds (Mortgage-backed Securities Program),
Series 2009-E, 5.00% 2039 | 540 | 579 |
| Housing Fin. Agcy., Residential Mortgage Rev. Ref. Bonds, Series 2009-C, 4.50% 2039 | 805 | 843 |
| Housing Fin. Agcy., Single-family Mortgage Rev. Bonds, Series 2010-1, 5.00% 2028 | 4,940 | 5,310 |
| Housing Fin. Agcy., Single-family Mortgage Rev. Bonds, Series 2011-1, 4.80% 2028 | 625 | 675 |
| Housing Fin. Agcy., Single-family Mortgage Rev. Bonds, Series 2011-2, 4.50% 2028 | 360 | 390 |
| Housing Fin. Agcy., Single-family Mortgage Rev. Bonds, Series 2011-3, 4.50% 2029 | 1,020 | 1,121 |
| Infrastructure Improvement G.O. Bonds, Series 2008-A, 5.375% 2028 | 1,575 | 1,791 |
| County of Lake, Hospital Facs. Rev. Ref. Bonds (Lake Hospital System, Inc.), Series 2008-C, 5.625% 2029 | 3,000 | 3,221 |
County of Lucas, Hospital Rev. Ref. Bonds (ProMedica Healthcare Obligated Group), Series 2005-B,
AMBAC insured, 5.00% 2020 | 5,000 | 5,289 |
| Major New State Infrastructure Project Rev. Bonds, Series 2012-1, 5.00% 2020 | 1,000 | 1,187 |
| Major New State Infrastructure Project Rev. Bonds, Series 2012-1, 5.00% 2021 | 1,750 | 2,090 |
County of Miami, Hospital Facs. Rev. Ref. and Improvement Bonds (Upper Valley Medical Center),
Series 2006, 5.25% 2021 | 1,660 | 1,773 |
County of Miami, Hospital Facs. Rev. Ref. and Improvement Bonds (Upper Valley Medical Center),
Series 2006, 5.25% 2026 | 3,250 | 3,441 |
| County of Muskingum, Hospital Facs. Rev. Ref. Bonds (Genesis HealthCare System Obligated Group Project), Series 2013, 5.00% 2033 | 6,500 | 6,522 |
| County of Muskingum, Hospital Facs. Rev. Ref. Bonds (Genesis HealthCare System Obligated Group Project), Series 2013, 5.00% 2044 | 1,500 | 1,466 |
| Public Housing Capital Fund Rev. Trust II, Trust Certificates, 4.50% 20222 | 2,391 | 2,399 |
| Public Housing Capital Fund Rev. Trust II, Trust Certificates, 5.00% 20222 | 3,291 | 3,409 |
County of Richland, Hospital Facs. Rev. Ref. Bonds (MedCentral Health System Obligated Group),
Series 2006, 5.125% 2021 | 1,000 | 1,054 |
| Turnpike Rev. Ref. Bonds, Series 2010-A, 5.25% 2027 | 2,500 | 3,108 |
University of Cincinnati, General Receipts Rev. Ref. Bonds, Series 2009-C, Assured Guaranty insured,
5.00% 2016 | 3,520 | 3,822 |
University of Cincinnati, General Receipts Rev. Ref. Bonds, Series 2009-C, Assured Guaranty insured,
5.00% 2017 | 2,335 | 2,626 |
The Tax-Exempt Bond Fund of America — Page 43 of 60
Bonds, notes & other debt instruments
Ohio (continued) | Principal amount
(000) | Value
(000) |
| Warren County, Health Care Facs., Rev. Ref. Bonds (Otterbein Homes Obligated Group), Series 2013-A, 5.75% 2033 | $1,000 | $1,103 |
| Water Quality Dev. Auth., Pollution Control Rev. Ref. Bonds (FirstEnergy Nuclear Generation Corp. Project), Series 2014-B, 4.00% 2033 (put 2019) | 5,000 | 5,288 |
| | | 373,360 |
| Oklahoma 0.34% | | |
Dev. Fin. Auth., Health System Rev. Ref. Bonds (Obligated Group Consisting of INTEGRIS Baptist Medical Center, Inc., INTEGRIS South Oklahoma City Hospital Corp. and INTEGRIS Rural Health, Inc.),
Series 2008-B, 5.25% 2038 | 5,000 | 5,326 |
| Housing Fin. Agcy., Single-family Mortgage Rev. Bonds (Homeownership Loan Program), Series 2009-A, 5.25% 2029 | 325 | 342 |
| Housing Fin. Agcy., Single-family Mortgage Rev. Bonds (Homeownership Loan Program), Series 2009-B, 4.90% 2036 | 2,130 | 2,143 |
| Housing Fin. Agcy., Single-family Mortgage Rev. Bonds (Homeownership Loan Program), Series 2012-A, 5.00% 2043 | 920 | 1,036 |
Langston Econ. Dev. Auth., Rev. Ref. Bonds (Langston University Student Housing/LDF Student Housing,
LLC Project), Series 2006-A, ACA insured, 4.75% 2021 | 950 | 969 |
Langston Econ. Dev. Auth., Rev. Ref. Bonds (Langston University Student Housing/LDF Student Housing,
LLC Project), Series 2006-A, ACA insured, 4.75% 2023 | 2,035 | 2,060 |
Langston Econ. Dev. Auth., Rev. Ref. Bonds (Langston University Student Housing/LDF Student Housing,
LLC Project), Series 2006-A, ACA insured, 4.875% 2030 | 3,000 | 3,014 |
| Municipal Power Auth., Power Supply System Rev. Ref. Bonds, Series 2005-A, 0.86% 2023 (put 2018)1 | 8,290 | 8,306 |
Tulsa County Industrial Auth., Health Care Rev. Bonds (St. Francis Health System, Inc.), Series 2006,
5.00% 2020 | 1,250 | 1,374 |
Tulsa County Industrial Auth., Health Care Rev. Bonds (St. Francis Health System, Inc.), Series 2006,
5.00% 2023 | 2,045 | 2,242 |
| Tulsa Industrial Auth., Rev. Ref. Bonds (University of Tulsa), Series 2009, 6.00% 2027 | 3,000 | 3,473 |
| Turnpike Auth., Turnpike System Rev. Bonds, Series 2011-B, 5.00% 2029 | 1,650 | 1,887 |
| | | 32,172 |
| Oregon 0.11% | | |
| Cow Creek Band of Umpqua Tribe of Indians, Tax Rev. Bonds, Series 2006-C, 5.625% 2026 | 7,080 | 7,021 |
| Port of Portland, Portland International Airport Passenger Fac. Charge Rev. Bonds, Series 2011-A, 5.50% 2031 | 3,000 | 3,365 |
| | | 10,386 |
| Pennsylvania 1.79% | | |
Allegheny County Hospital Dev. Auth., University of Pittsburgh Medical Center Rev. Bonds,
Series 2008-B, 5.00% 2018 | 9,250 | 10,585 |
| Beaver County Industrial Dev. Auth., Pollution Control Rev. Ref. Bonds (FirstEnergy Nuclear Generation Project), Series 2008-A, 2.70% 2035 (put 2018) | 3,000 | 3,034 |
| Chester County Health and Education Facs. Auth., Health System Rev. Ref. Bonds (Jefferson Health System), Series 2010-A, 5.00% 2031 | 5,000 | 5,383 |
| Commonwealth Fncg. Auth., Rev. Bonds, Series 2013-B, 5.00% 2036 | 1,500 | 1,609 |
Cumberland County Municipal Auth., Rev. Ref. Bonds (Presbyterian Homes Obligated Group Project),
Series 2008-A, 5.00% 2017 | 1,070 | 1,097 |
| Delaware River Port Auth., Port Dist. Project Rev. Ref. Bonds, Series 2012, 5.00% 2021 | 3,100 | 3,546 |
| Delaware River Port Auth., Port Dist. Project Rev. Ref. Bonds, Series 2012, 5.00% 2022 | 1,275 | 1,452 |
| East Hempfield Township Industrial Dev. Auth. Rev. Bonds (Student Services, Inc. Student Housing Project at Millersville University of Pennsylvania), Series 2013, 5.00% 2030 | 1,000 | 1,049 |
| East Hempfield Township Industrial Dev. Auth., Rev. Bonds (Student Services, Inc. Student Housing Project at Millersville University of Pennsylvania), Series 2013, 5.00% 2045 | 200 | 204 |
| East Hempfield Township Industrial Dev. Auth., Rev. Bonds (Student Services, Inc. Student Housing Project at Millersville University of Pennsylvania), Series 2014, 5.00% 2039 | 435 | 446 |
The Tax-Exempt Bond Fund of America — Page 44 of 60
Bonds, notes & other debt instruments
Pennsylvania (continued) | Principal amount
(000) | Value
(000) |
| East Hempfield Township Industrial Dev. Auth. Rev. Bonds (Student Services, Inc. Student Housing Project at Millersville University of Pennsylvania), Series 2014, 5.00% 2046 | $750 | $766 |
Econ. Dev. Fncg. Auth., Solid Waste Disposal Rev. Bonds (Waste Management, Inc. Project),
Series 2009, 1.75% 2033 (put 2015) | 500 | 508 |
Higher Educational Facs. Auth., Rev. Bonds (Edinboro University Foundation Student Housing Project),
Series 2008, 5.00% 2018 | 1,500 | 1,598 |
Higher Educational Facs. Auth., Rev. Bonds (Edinboro University Foundation Student Housing Project),
Series 2008, 6.00% 2042 | 2,500 | 2,589 |
Higher Educational Facs. Auth., Rev. Bonds (Edinboro University Foundation Student Housing Project),
Series 2010, 6.00% 2043 | 2,600 | 2,733 |
| Higher Educational Facs. Auth., Rev. Bonds (Shippensburg University Student Services, Inc. Student Housing Project at Shippensburg University of Pennsylvania), Series 2011, 6.25% 2043 | 690 | 757 |
| Higher Educational Facs. Auth., Rev. Bonds (Shippensburg University Student Services, Inc. Student Housing Project at Shippensburg University of Pennsylvania), Series 2012, 5.00% 2030 | 1,000 | 1,033 |
| Higher Educational Facs. Auth., Rev. Bonds (Shippensburg University Student Services, Inc. Student Housing Project at Shippensburg University of Pennsylvania), Series 2012, 5.00% 2044 | 1,350 | 1,364 |
| Higher Educational Facs. Auth., Student Housing Rev. Bonds (University Properties, Inc. Student Housing Project at East Stroudsburg University of Pennsylvania), Series 2010, 5.00% 2031 | 6,170 | 6,355 |
| Higher Educational Facs. Auth., Student Housing Rev. Bonds (University Properties, Inc. Student Housing Project at East Stroudsburg University of Pennsylvania), Series 2010, 5.00% 2042 | 3,000 | 3,052 |
Higher Educational Facs. Auth., University of Pennsylvania Health System, Rev. Bonds, Series 2011-A,
5.75% 2041 | 1,000 | 1,128 |
| Intergovernmental Cooperation Auth., Special Tax Rev. Ref. Bonds (City of Philadelphia Funding Program), Series 2009, 5.00% 2020 | 6,285 | 7,320 |
| Lancaster Industrial Dev. Auth., Rev. Bonds (Garden Spot Village Project), Series 2013, 5.00% 2023 | 1,100 | 1,160 |
| Lancaster Industrial Dev. Auth., Rev. Bonds (Garden Spot Village Project), Series 2013, 5.375% 2028 | 1,250 | 1,320 |
| Lancaster Industrial Dev. Auth., Rev. Bonds (Garden Spot Village Project), Series 2013, 5.75% 2035 | 1,150 | 1,229 |
| Lycoming County Auth., Health System Rev. Bonds (Susquehanna Health System Project), Series 2009-A, 5.75% 2039 | 2,000 | 2,114 |
| Montgomery County Industrial Dev. Auth., Mortgage Rev. Bonds (Whitemarsh Continuing Care Retirement Community Project), Series 2005, 6.00% 2021 | 4,500 | 4,571 |
| Montgomery County Industrial Dev. Auth., Retirement Communities Rev. Bonds (ACTS Retirement-Life Communities, Inc. Obligated Group), Series 2006-A, 4.50% 2036 | 7,500 | 7,468 |
| Montgomery County Industrial Dev. Auth., Retirement Communities Rev. Ref. Bonds (ACTS Retirement-Life Communities, Inc. Obligated Group), Series 2012, 5.00% 2024 | 2,500 | 2,721 |
| Montgomery County Industrial Dev. Auth., Retirement Communities Rev. Ref. Bonds (ACTS Retirement-Life Communities, Inc. Obligated Group), Series 2012, 5.00% 2025 | 1,500 | 1,621 |
| Montgomery County Industrial Dev. Auth., Retirement Communities Rev. Ref. Bonds (ACTS Retirement-Life Communities, Inc. Obligated Group), Series 2012, 5.00% 2026 | 3,000 | 3,223 |
| Montgomery County Industrial Dev. Auth., Retirement Communities Rev. Ref. Bonds (ACTS Retirement-Life Communities, Inc. Obligated Group), Series 2012, 5.00% 2028 | 500 | 531 |
| Pennsylvania State University Bonds, Series 2009-A, 5.00% 2024 | 1,000 | 1,132 |
| Pennsylvania State University Bonds, Series 2009-A, 5.00% 2027 | 1,000 | 1,132 |
| City of Philadelphia, G.O. Bonds, Series 2013-A, 5.25% 2027 | 3,000 | 3,373 |
| City of Philadelphia, G.O. Bonds, Series 2013-A, 5.25% 2028 | 2,000 | 2,239 |
| City of Philadelphia, Water and Wastewater Rev. Bonds, Series 2009-A, 5.25% 2025 | 2,000 | 2,200 |
| Hospitals and Higher Education Facs. Auth. of Philadelphia, Hospital Rev. Bonds (Children’s Hospital of Philadelphia Project), Series 2007-A, 4.50% 2026 | 2,395 | 2,494 |
| Hospitals and Higher Education Facs. Auth. of Philadelphia, Hospital Rev. Bonds (Children’s Hospital of Philadelphia Project), Series 2007-A, 4.50% 2027 | 2,505 | 2,603 |
| Hospitals and Higher Education Facs. Auth. of Philadelphia, Hospital Rev. Bonds (Temple University Health System Obligated Group), Series 2012-A, 5.625% 2042 | 12,100 | 12,281 |
State Public School Building Auth., School Lease Rev. Bonds (School Dist. of Philadelphia Project),
Series 2012, 5.00% 2023 | 1,180 | 1,336 |
The Tax-Exempt Bond Fund of America — Page 45 of 60
Bonds, notes & other debt instruments
Pennsylvania (continued) | Principal amount
(000) | Value
(000) |
State Public School Building Auth., School Lease Rev. Bonds (School Dist. of Philadelphia Project),
Series 2012, 5.00% 2025 | $2,000 | $2,215 |
State Public School Building Auth., School Lease Rev. Bonds (School Dist. of Philadelphia Project),
Series 2012, 5.00% 2026 | 1,000 | 1,099 |
State Public School Building Auth., School Lease Rev. Bonds (School Dist. of Philadelphia Project),
Series 2012, 5.00% 2027 | 1,000 | 1,094 |
| Health Care Facs. Auth. of Sayre, Rev. Ref. Bonds (Guthrie Health Issue), Series 2007, 0.932% 20241 | 14,525 | 13,413 |
State Public School Building Auth., School Lease Rev. Ref. Bonds (School Dist. of Philadelphia Project),
Series 2006-B, Assured Guaranty Municipal insured, 5.00% 2027 | 9,820 | 11,050 |
| Susquehanna Area Regional Airport Auth., Airport System Rev. Bonds, Series 2012-B, 4.00% 2033 | 11,600 | 11,268 |
Susquehanna Area Regional Airport Auth., Subordinate Airport System Rev. Bonds, Series 2012-C,
3.00% 2017 | 2,490 | 2,551 |
| Turnpike Commission, Turnpike Rev. Bonds, Series 2013-A, 0.66% 20171 | 2,000 | 2,004 |
| University of Pittsburgh of the Commonwealth System of Higher Education, University Capital Project Bonds, Series 2009-B, 5.00% 2028 | 4,000 | 4,562 |
Redev. Auth. of the County of Washington, Redev. Bonds (Victory Centre Project - Tanger Outlet Dev.),
Series 2006-A, 5.45% 2035 | 2,575 | 2,616 |
| Westmoreland County Industrial Dev. Auth., Retirement Community Rev. Ref. Bonds (Redstone Presbyterian SeniorCare Obligated Group), Series 2005-A, 5.75% 2026 (preref. 2016) | 2,800 | 3,011 |
| | | 167,239 |
| Puerto Rico 0.53% | | |
| Aqueduct and Sewer Auth., Rev. Ref. Bonds, Series 2008-A, 6.125% 2024 | 5,255 | 3,922 |
| Aqueduct and Sewer Auth., Rev. Ref. Bonds, Series 2012-A, 5.75% 2037 | 6,140 | 4,331 |
| Electric Power Auth., Power Rev. Bonds, Series 2013-A, 7.00% 2033 | 2,000 | 986 |
| Industrial, Tourist, Educational, Medical and Environmental Control Facs. Fncg. Auth., Higher Education Rev. and Rev. Ref. Bonds (Inter American University of Puerto Rico Project), Series 2012, 5.00% 2017 | 1,600 | 1,663 |
Industrial, Tourist, Educational, Medical and Environmental Control Facs. Fncg. Auth., Higher Education
Rev. and Rev. Ref. Bonds (Inter American University of Puerto Rico Project), Series 2012, 5.00% 2020 | 1,510 | 1,564 |
| Industrial, Tourist, Educational, Medical and Environmental Control Facs. Fncg. Auth., Higher Education Rev. and Rev. Ref. Bonds (Inter American University of Puerto Rico Project), Series 2012, 5.00% 2031 | 1,120 | 1,041 |
| Industrial, Tourist, Educational, Medical and Environmental Control Facs. Fncg. Auth., Higher Education Rev. and Rev. Ref. Bonds (University of the Sacred Heart Project), Series 2012, 3.25% 2019 | 880 | 817 |
| Industrial, Tourist, Educational, Medical and Environmental Control Facs. Fncg. Auth., Higher Education Rev. and Rev. Ref. Bonds (University of the Sacred Heart Project), Series 2012, 4.00% 2017 | 830 | 824 |
| Industrial, Tourist, Educational, Medical and Environmental Control Facs. Fncg. Auth., Higher Education Rev. and Rev. Ref. Bonds (University of the Sacred Heart Project), Series 2012, 4.00% 2025 | 955 | 793 |
| Public Buildings Auth., Government Facs. Rev. Ref. Bonds, Series M-1, 6.25% 2021 | 3,000 | 2,329 |
| Public Improvement Ref. Bonds (G.O. Bonds), Series 2007-A, FGIC insured, 5.50% 2021 | 1,500 | 1,221 |
| Public Improvement Ref. Bonds (G.O. Bonds), Series 2008-A, 5.00% 2023 | 4,040 | 3,106 |
| Public Improvement Ref. Bonds (G.O. Bonds), Series 2012-A, 5.00% 2020 | 2,500 | 2,033 |
| Public Improvement Ref. Bonds (G.O. Bonds), Series 2012-A, 5.00% 2041 | 490 | 348 |
| Public Improvement Ref. Bonds (G.O. Bonds), Series 2012-A, 5.50% 2039 | 6,000 | 4,443 |
| Public Improvement Ref. Bonds (G.O. Bonds), Series 2014-A, 8.00% 2035 | 2,000 | 1,804 |
| Sales Tax Fncg. Corp., Sales Tax Rev. Bonds, Series 2009-A, 6.00% 2042 | 500 | 380 |
| Sales Tax Fncg. Corp., Sales Tax Rev. Bonds, Series 2010-A, 5.375% 2039 | 3,270 | 2,345 |
| Sales Tax Fncg. Corp., Sales Tax Rev. Bonds, Series 2011-A-1, 5.25% 2043 | 4,000 | 2,800 |
| Sales Tax Fncg. Corp., Sales Tax Rev. Bonds, Series 2011-C, 5.00% 2046 | 1,500 | 1,137 |
| Sales Tax Fncg. Corp., Sales Tax Rev. Bonds, Series 2011-C, 5.25% 2040 | 11,055 | 8,867 |
| Sales Tax Fncg. Corp., Sales Tax Rev. Ref. Bonds, Series 2011-C, 5.00% 2040 | 4,000 | 3,103 |
| | | 49,857 |
The Tax-Exempt Bond Fund of America — Page 46 of 60
Bonds, notes & other debt instruments
Rhode Island 0.20% | Principal amount
(000) | Value
(000) |
Depositors Econ. Protection Corp., Special Obligation Rev. Ref. Bonds, Series 1993-A, 5.75% 2021
(escrowed to maturity) | $2,715 | $3,393 |
Depositors Econ. Protection Corp., Special Obligation Rev. Ref. Bonds, Series 1993-A, 5.75% 2021
(escrowed to maturity) | 1,210 | 1,512 |
| Econ. Dev. Corp., Airport Rev. Ref. Bonds, Series 2013-B, 5.00% 2023 | 2,990 | 3,396 |
| Health and Educational Building Corp., Hospital Fncg. Rev. Ref. Bonds (Lifespan Obligated Group Issue), Series 2006-A, Assured Guaranty Municipal insured, 5.00% 2016 | 6,030 | 6,452 |
| Health and Educational Building Corp., Hospital Fncg. Rev. Ref. Bonds (Lifespan Obligated Group Issue), Series 2006-A, Assured Guaranty Municipal insured, 5.00% 2018 | 1,060 | 1,128 |
| Health and Educational Building Corp., Hospital Fncg. Rev. Bonds (Bryant University), Series 2014, 5.00% 2032 | 1,000 | 1,106 |
| City of Providence, Special Obligation Tax Increment Ref. Bonds, Series E, RADIAN insured, 5.00% 2015 | 1,250 | 1,264 |
| | | 18,251 |
| South Carolina 1.35% | | |
| Building Equity Sooner for Tomorrow (BEST), Installment Purchase Rev. Ref. Bonds (School Dist. of Greenville County, South Carolina Project), Series 2006, 5.00% 2023 | 19,845 | 21,707 |
| Building Equity Sooner for Tomorrow (BEST), Installment Purchase Rev. Ref. Bonds (School Dist. of Greenville County, South Carolina Project), Series 2006, Assured Guaranty insured, 5.00% 2025 | 5,000 | 5,461 |
| Charleston Educational Excellence Fncg. Corp., Installment Purchase Rev. Bonds (Charleston County School Dist., South Carolina Project), Series 2005, 5.25% 2020 (preref. 2015) | 4,500 | 4,804 |
| Charleston Educational Excellence Fncg. Corp., Installment Purchase Rev. Bonds (Charleston County School Dist., South Carolina Project), Series 2006, 5.00% 2021 | 8,190 | 9,049 |
| SCAGO Educational Facs. Corp. for Colleton School Dist., Installment Purchase Rev. Bonds (School Dist. of Colleton County Project), Series 2006, Assured Guaranty insured, 5.00% 2017 | 1,000 | 1,097 |
| SCAGO Educational Facs. Corp. for Colleton School Dist., Installment Purchase Rev. Bonds (School Dist. of Colleton County Project), Series 2006, Assured Guaranty insured, 5.00% 2018 | 2,000 | 2,193 |
| Jobs-Econ. Dev. Auth., First Mortgage Health Facs. Rev. Ref. Bonds (Wesley Commons Project), Series 2006, 5.00% 2016 | 1,170 | 1,219 |
| Jobs-Econ. Dev. Auth., First Mortgage Health Facs. Rev. Ref. Bonds (Wesley Commons Project), Series 2006, 5.125% 2026 | 1,515 | 1,515 |
| Jobs-Econ. Dev. Auth., First Mortgage Health Facs. Rev. Ref. Bonds (Wesley Commons Project), Series 2006, 5.30% 2036 | 1,190 | 1,146 |
Jobs-Econ. Dev. Auth., Student Housing Rev. Bonds (Coastal Housing Foundation, LLC Project),
Series 2009-A, 6.50% 2042 | 4,000 | 4,591 |
Lancaster County, Sun City Carolina Lakes Improvement Dist., Assessment Rev. Bonds, Series 2006,
5.45% 2037 | 4,420 | 4,445 |
Lexington County Health Services Dist., Inc., Hospital Rev. Ref. Bonds (Lexington Medical Center),
Series 2007, 5.00% 2019 | 1,000 | 1,122 |
Lexington County Health Services Dist., Inc., Hospital Rev. Ref. Bonds (Lexington Medical Center),
Series 2007, 5.00% 2020 | 1,265 | 1,414 |
Lexington County Health Services Dist., Inc., Hospital Rev. Ref. Bonds (Lexington Medical Center),
Series 2007, 5.00% 2032 | 2,000 | 2,130 |
| Lexington One School Facs. Corp., Installment Purchase Rev. Bonds (Lexington County School Dist. No. 1, South Carolina Project), Series 2006, 5.00% 2018 | 1,000 | 1,096 |
| City of Myrtle Beach, Tax Increment Bonds (Myrtle Beach Air Force Base Redev. Project Area), Series 2006-A, 5.25% 2026 | 1,700 | 1,675 |
| SCAGO Educational Facs. Corp. for Pickens School Dist., Installment Purchase Rev. Bonds (School Dist. of Pickens County Project), Series 2006, Assured Guaranty Municipal insured, 5.00% 2017 | 5,000 | 5,497 |
| SCAGO Educational Facs. Corp. for Pickens School Dist., Installment Purchase Rev. Bonds (School Dist. of Pickens County Project), Series 2006, Assured Guaranty Municipal insured, 5.00% 2018 | 4,000 | 4,394 |
| Piedmont Municipal Power Agcy., Electric Rev. Ref. Bonds, Series 1991, FGIC-National insured, 6.25% 2021 | 4,640 | 5,794 |
| Public Service Auth., Rev. Obligations (Santee Cooper), Series 2013-E, 5.00% 2048 | 1,000 | 1,075 |
| Public Service Auth., Rev. Obligations (Santee Cooper), Series 2014-A, 5.00% 2049 | 4,400 | 4,713 |
| Public Service Auth., Rev. Obligations (Santee Cooper), Series 2014-A, 5.50% 2054 | 10,500 | 11,648 |
The Tax-Exempt Bond Fund of America — Page 47 of 60
Bonds, notes & other debt instruments
South Carolina (continued) | Principal amount
(000) | Value
(000) |
| Public Service Auth., Rev. Ref. Obligations (Santee Cooper), Series 2008-A, 5.50% 2038 | $20,000 | $22,570 |
| Transportation Infrastructure Bank, Rev. Ref. Bonds, Series 2005-A, AMBAC insured, 5.25% 2018 | 5,000 | 5,847 |
| | | 126,202 |
| South Dakota 0.06% | | |
| Building Auth., Rev. Ref. Capital Appreciation Bonds, Series 1996-A, AMBAC insured, 0% 2014 | 3,780 | 3,776 |
| Educational Enhancement Funding Corp, Tobacco Settlement Rev. Bonds, Series 2013-B, 5.00% 2026 | 1,400 | 1,535 |
| | | 5,311 |
| Tennessee 0.82% | | |
City of Chattanooga, Electric System Rev. Bonds (Electric Power Board of Chattanooga), Series 2008-A,
5.00% 2028 | 4,500 | 4,999 |
| Natural Gas Acquisition Corp. of the City of Clarksville, Gas Rev. Bonds, Series 2006, 5.00% 2018 | 6,500 | 7,301 |
Health and Educational Facs. Board of the Metropolitan Government of Nashville and Davidson County,
Rev. Ref. and Improvement Bonds (Blakeford at Green Hills), Series 2012, 5.00% 2037 | 1,200 | 1,249 |
| Housing Dev. Agcy., Homeownership Program Bonds, Issue 2012-1-C, 4.50% 2037 | 2,100 | 2,344 |
| Housing Dev. Agcy., Homeownership Program Bonds, Issue 2012-2-C, 4.00% 2038 | 3,150 | 3,461 |
| Housing Dev. Agcy., Housing Fin. Program Bonds, Issue 2010-A-1, 5.00% 2027 | 580 | 620 |
| Housing Dev. Agcy., Residential Fin. Program Bonds, Issue 2013-1-C, 3.00% 2038 | 6,090 | 6,429 |
Health, Educational and Housing Fac. Board of the County of Knox, Hospital Rev. Ref. Bonds
(Covenant Health), Series 2012-A, 5.00% 2021 | 1,325 | 1,545 |
Health, Educational and Housing Fac. Board of the County of Knox, Hospital Rev. Ref. Bonds
(Covenant Health), Series 2012-A, 5.00% 2024 | 4,055 | 4,664 |
Health, Educational and Housing Facs. Board of the County of Sullivan, Hospital Rev. Bonds
(Wellmont Health System Project), Series 2006-C, 5.25% 2036 | 540 | 563 |
| Tennessee Energy Acquisition Corp., Gas Project Rev. Bonds, Series 2006-A, 5.25% 2017 | 3,000 | 3,318 |
| Tennessee Energy Acquisition Corp., Gas Project Rev. Bonds, Series 2006-A, 5.25% 2019 | 10,000 | 11,351 |
| Tennessee Energy Acquisition Corp., Gas Project Rev. Bonds, Series 2006-A, 5.25% 2020 | 10,000 | 11,415 |
| Tennessee Energy Acquisition Corp., Gas Project Rev. Bonds, Series 2006-C, 5.00% 2018 | 4,000 | 4,388 |
| Tennessee Energy Acquisition Corp., Gas Project Rev. Bonds, Series 2006-C, 5.00% 2020 | 10,000 | 11,163 |
| Tennessee Energy Acquisition Corp., Gas Project Rev. Bonds, Series 2006-C, 5.00% 2027 | 1,885 | 2,096 |
| | | 76,906 |
| Texas 9.32% | | |
Amarillo Health Facs. Corp., Hospital Rev. Ref. Bonds (Baptist St. Anthony’s Hospital Corp. Project),
Series 1998, Assured Guaranty Municipal insured, 5.50% 2015 (escrowed to maturity) | 1,500 | 1,527 |
| Arlington Independent School Dist.,Ref. Bonds, Series 2006, 5.00% 2020 | 160 | 171 |
| Arlington Independent School Dist.,Ref. Bonds, Series 2006, 5.00% 2020 (preref. 2016) | 1,840 | 1,975 |
| Austin Community College Dist. Public Fac. Corp., Lease Rev. Bonds (Educational Fac. Project - Round Rock Campus), Series 2008, 5.50% 2024 | 2,770 | 3,190 |
| Austin Independent School Dist., (Travis County), Ref. Bonds, Series 2013-A, 5.00% 2027 | 1,000 | 1,185 |
| City of Austin (Travis and Williamson Counties), Water and Wastewater System Rev. Ref. Bonds, Series 2009, 5.125% 2029 | 1,500 | 1,723 |
City of Austin (Travis, Williamson and Hays Counties), Water and Wastewater System Rev. Ref. Bonds,
Series 2011, 5.00% 2036 | 3,000 | 3,315 |
| Bexar County Hospital Dist., Combination Tax and Rev. Certificates of Obligation, Series 2008, 5.00% 2032 | 20,500 | 22,590 |
| Brownsville Independent School Dist. (Cameron County), Unlimited Tax School Building Bonds, Series 2006, 5.00% 2018 (preref. 2016) | 1,000 | 1,074 |
| Brownsville Independent School Dist. (Cameron County), Unlimited Tax School Building Bonds, Series 2006, 5.00% 2019 (preref. 2016) | 5,000 | 5,371 |
Central Texas Regional Mobility Auth., Rev. Bonds, Series 2005, FGIC-National insured, 5.00% 2035
(preref. 2015) | 2,500 | 2,550 |
| Central Texas Regional Mobility Auth., Rev. Bonds, Series 2011, 6.00% 2041 | 5,300 | 5,921 |
| Central Texas Regional Mobility Auth., Rev. Bonds, Series 2011, 6.25% 2046 | 10,300 | 11,591 |
| Central Texas Regional Mobility Auth., Rev. Ref. Bonds, Series 2010, 5.75% 2025 | 11,945 | 13,213 |
The Tax-Exempt Bond Fund of America — Page 48 of 60
Bonds, notes & other debt instruments
Texas (continued) | Principal amount
(000) | Value
(000) |
| Central Texas Regional Mobility Auth., Rev. Ref. Bonds, Series 2013-A, 5.00% 2033 | $2,000 | $2,125 |
| HFDC of Central Texas, Inc., Retirement Fac. Rev. Bonds (Legacy at Willow Bend Project), Series 2006-A, 5.625% 2026 | 1,000 | 1,019 |
| HFDC of Central Texas, Inc., Retirement Fac. Rev. Bonds (Legacy at Willow Bend Project), Series 2006-A, 5.75% 2036 | 3,000 | 3,030 |
HFDC of Central Texas, Inc., Retirement Fac. Rev. Bonds (Village at Gleannloch Farms, Inc. Project),
Series 2006-A, 5.50% 2027 | 2,300 | 2,304 |
| Colorado River Municipal Water Dist. Water System Rev. Bonds, Series 2011, 5.00% 2028 | 9,175 | 10,106 |
| Cypress-Fairbanks Independent School Dist. (Harris County), Unlimited Tax Schoolhouse and Ref. Bonds, Series 2007, 5.00% 2020 | 2,205 | 2,452 |
| Cypress-Fairbanks Independent School Dist. (Harris County), Unlimited Tax Schoolhouse and Ref. Bonds, Series 2007, 5.00% 2021 | 2,000 | 2,222 |
Cypress-Fairbanks Independent School Dist. (Harris County), Unlimited Tax Schoolhouse Bonds,
Series 2009-A, 5.00% 2025 | 2,760 | 3,175 |
| City of Dallas (Dallas, Denton, Collin and Rockwall Counties), G.O. Bonds, Series 2007, 5.00% 2018 | 385 | 426 |
City of Dallas (Dallas, Denton, Collin and Rockwall Counties), G.O. Bonds, Series 2007, 5.00% 2018
(preref. 2017) | 5 | 6 |
| Dallas Area Rapid Transit, Sales Tax Rev. Bonds, Series 2008, 5.00% 2025 | 2,535 | 2,918 |
Dallas Independent School Dist. (Dallas County), Unlimited Tax School Building Bonds, Series 2006,
5.00% 2017 | 2,000 | 2,190 |
Cities of Dallas and Fort Worth, Dallas/Fort Worth International Airport, Joint Rev. Improvement Bonds,
Series 2013-B, 5.00% 2028 | 8,565 | 9,638 |
Cities of Dallas and Fort Worth, Dallas/Fort Worth International Airport, Joint Rev. Improvement Bonds,
Series 2013-B, 5.00% 2029 | 5,000 | 5,584 |
Cities of Dallas and Fort Worth, Dallas/Fort Worth International Airport, Joint Rev. Improvement Bonds,
Series 2013-B, 5.00% 2031 | 6,540 | 7,200 |
| Cities of Dallas and Fort Worth, Dallas/Fort Worth International Airport, Joint Rev. Ref. Bonds, Series 2012-B, 5.00% 2035 | 2,250 | 2,424 |
| Cities of Dallas and Fort Worth, Dallas/Fort Worth International Airport, Joint Rev. Ref. Bonds, Series 2012-G, 5.00% 2025 | 2,000 | 2,317 |
| Cities of Dallas and Fort Worth, Dallas/Fort Worth International Airport, Joint Rev. Ref. Bonds, Series 2012-G, 5.00% 2035 | 1,000 | 1,077 |
| Cities of Dallas and Fort Worth, Dallas/Fort Worth International Airport, Joint Rev. Ref. Bonds, Series 2013-D, 5.25% 2024 | 5,000 | 5,965 |
| Decatur Hospital Auth., Hospital Rev. Bonds (Wise Regional Health System), Series 2014-A, 5.25% 2044 | 1,500 | 1,519 |
Elgin Independent School Dist. (Bastrop County), Unlimited Tax School Building Bonds, Series 2007,
5.00% 2022 (preref. 2017) | 1,895 | 2,143 |
| Fort Bend County Industrial Dev. Corp., Industrial Dev. Rev. Bonds (NRG Energy, Inc. Project), Series 2012-A, 4.75% 2038 | 5,500 | 5,582 |
| Fort Bend County Industrial Dev. Corp., Industrial Dev. Rev. Bonds (NRG Energy, Inc. Project), Series 2012-B, 4.75% 2042 | 8,340 | 8,522 |
| Fort Worth Independent School Dist. (Tarrant County), Unlimited Tax Ref. Bonds, Series 2005, 5.00% 2015 | 10,945 | 11,235 |
| Friendswood Independent School Dist. (Galveston County), Unlimited Tax Schoolhouse Bonds, Series 2008, 5.00% 2029 | 3,360 | 3,733 |
| G.O. Bonds, Water Financial Assistance Bonds (Water Infrastructure Fund), Series 2009-A, 5.00% 2028 | 1,500 | 1,702 |
| G.O. Bonds, Water Financial Assistance Bonds (Water Infrastructure Fund), Series 2011-A, 5.00% 2021 | 1,400 | 1,696 |
| G.O. Bonds, Water Financial Assistance Bonds (Water Infrastructure Fund), Series 2013-B, 5.00% 2026 | 1,600 | 1,918 |
| Grand Parkway Transportation Corp., Grand Parkway System Toll Rev. Bonds, Series 2013-B, 5.00% 2053 | 24,800 | 26,519 |
| Grand Parkway Transportation Corp., Grand Parkway System Toll Rev. Bonds, Series 2013-B, 5.25% 2051 | 4,000 | 4,363 |
| Harris County Cultural Education Facs. Fin. Corp., First Mortgage Rev. Bonds (Brazos Presbyterian Homes, Inc. Project), Series 2013-A, 4.00% 2023 | 1,325 | 1,341 |
| Harris County Cultural Education Facs. Fin. Corp., First Mortgage Rev. Bonds (Brazos Presbyterian Homes, Inc. Project), Series 2013-A, 5.00% 2033 | 1,090 | 1,075 |
| Harris County Cultural Education Facs. Fin. Corp., First Mortgage Rev. Bonds (Brazos Presbyterian Homes, Inc. Project), Series 2013-B, 7.00% 2043 | 3,000 | 3,362 |
The Tax-Exempt Bond Fund of America — Page 49 of 60
Bonds, notes & other debt instruments
Texas (continued) | Principal amount
(000) | Value
(000) |
Harris County Cultural Education Facs. Fin. Corp., Rev. Ref. Bonds (Methodist Hospital System),
Series 2008-B, 5.25% 2017 | $3,000 | $3,415 |
| Harris County Cultural Education Facs. Fin. Corp., Rev. Ref. Bonds (Methodist Hospital System), Series 2008-B, 5.50% 2018 | 3,500 | 4,104 |
| Harris County Cultural Education, Facs. Fin. Corp., Thermal Utility Rev. Bonds (Teco Project), Series 2009-A, 5.25% 2035 | 2,000 | 2,184 |
| Harris County Cultural Education, Facs. Fin. Corp., Thermal Utility Rev. Bonds (Teco Project), Series 2010, 5.00% 2031 | 1,000 | 1,080 |
Harris County Health Facs. Dev. Corp., Hospital Rev. Bonds (Memorial Hermann Healthcare System),
Series 2004-A, 5.25% 2015 (preref. 2014) | 3,120 | 3,173 |
Harris County Health Facs. Dev. Corp., Hospital Rev. Bonds (Memorial Hermann Healthcare System),
Series 2004-A, 5.25% 2016 (preref. 2014) | 3,000 | 3,051 |
| Harris County Health Facs. Dev. Corp., Hospital Rev. Ref. Bonds (Memorial Hermann Healthcare System), Series 2008-B, 7.25% 2035 (preref. 2018) | 1,500 | 1,895 |
| Harris County Health Facs. Dev. Corp., Hospital Rev. Ref. Bonds (Memorial Hermann Healthcare System), Series 2014-A, 5.00% 2027 | 2,500 | 2,888 |
| Harris County Health Facs. Dev. Corp., Rev. Ref. Bonds (CHRISTUS Health), Series 2005-A-4, Assured Guaranty Municipal insured, 0.44% 20311 | 11,800 | 11,800 |
| Harris County Industrial Dev. Corp., Solid Waste Disposal Rev. Bonds (Deer Park Refining Limited Partnership Project), Series 2006, 5.00% 2023 | 2,500 | 2,714 |
| Harris County, Metropolitan Transit Auth., Sales and Use Tax Bonds, Series 2011-A, 5.00% 2036 | 11,350 | 12,658 |
| Harris County, Toll Road Rev. Bonds, Series 2009-A, 5.00% 2026 | 4,000 | 4,676 |
| Harris County, Toll Road Rev. Bonds, Series 2009-C, 5.00% 2033 | 1,000 | 1,122 |
| Harris County, Toll Road Rev. Ref. Bonds, Series 2008-B, 5.00% 2033 | 7,000 | 7,792 |
| Harris County, Toll Road Rev. Ref. Bonds, Series 2012-C, 4.00% 2033 | 3,150 | 3,201 |
Hidalgo County Health Services Corp., Hospital Rev. Bonds (Mission Hospital, Inc. Project), Series 2005,
5.00% 2014 | 505 | 506 |
| City of Houston, Higher Education Fin. Corp., Higher Education Rev. Ref. Bonds (Rice University Project), Series 2013-B, 0.59% 2048 (put 2017)1 | 2,000 | 2,007 |
| Dept. of Housing and Community Affairs, Residential Mortgage Rev. Bonds, Series 2009-A, 5.375% 2039 | 2,570 | 2,802 |
| Dept. of Housing and Community Affairs, Residential Mortgage Rev. Bonds, Series 2011-B, 4.25% 2034 | 1,925 | 2,096 |
| City of Houston, Airport System Rev. Ref. Bonds, Series 2007-B, FGIC-National insured, 5.00% 2019 | 5,000 | 5,503 |
| City of Houston, Airport System Rev. Ref. Bonds, Series 2009-A, 5.50% 2034 | 8,000 | 9,092 |
| City of Houston, Airport System Rev. Ref. Bonds, Series 2009-A, 5.50% 2039 | 2,000 | 2,265 |
| City of Houston, Airport System Rev. Ref. Bonds, Series 2011-B, 5.00% 2019 | 1,000 | 1,159 |
| City of Houston, Airport System Rev. Ref. Bonds, Series 2011-B, 5.00% 2025 | 2,000 | 2,257 |
| City of Houston, Airport System Rev. Ref. Bonds, Series 2012-B, 5.00% 2031 | 5,305 | 5,776 |
| City of Houston, Public Improvement Ref. Bonds, Series 2008-A, 5.50% 2025 | 5,000 | 5,756 |
| City of Houston, Water and Sewer System Rev. Ref. Bonds, Series 1998-A, Assured Guaranty Municipal insured, 0% 2019 | 845 | 767 |
| City of Houston, Water and Sewer System Rev. Ref. Bonds, Series 1998-A, Assured Guaranty Municipal insured, 0% 2019 (escrowed to maturity) | 2,155 | 2,001 |
| Houston Community College System Public Fac. Corp., Lease Rev. Bonds (Northline Mall Campus Project), Series 2007, AMBAC insured, 5.00% 2017 | 1,035 | 1,155 |
Houston Community College System, Student Fee Rev. Ref. Bonds (Harris and Fort Bend Counties),
Series 2006, XLCA insured, 5.00% 2022 | 5,500 | 5,907 |
| Houston Independent School Dist. (Harris County), Limited Tax SchoolHouse Bonds, Series 2008, 5.00% 2024 | 7,350 | 8,116 |
Keller Independent School Dist. (Tarrant County), Unlimited Tax School Building Bonds, Series 2007,
5.00% 2020 | 3,720 | 4,209 |
| La Vernia Higher Education Fin. Corp., Education Rev. Bonds (KIPP, Inc.), Series 2009-A, 6.25% 2039 | 2,500 | 2,790 |
Lone Star College System (Harris and Montgomery Counties), Limited Tax G.O. Bonds, Series 2009,
5.00% 2034 | 1,000 | 1,122 |
| Longview Independent School Dist. (Gregg County), Unlimited Tax School Building Bonds, Series 2008, 5.00% 2025 | 2,000 | 2,299 |
The Tax-Exempt Bond Fund of America — Page 50 of 60
Bonds, notes & other debt instruments
Texas (continued) | Principal amount
(000) | Value
(000) |
| Longview Independent School Dist. (Gregg County), Unlimited Tax School Building Bonds, Series 2008, 5.00% 2026 | $1,500 | $1,721 |
| Love Field Airport Modernization Corp., Special Facs. Rev. Bonds (Southwest Airlines Co. - Love Field Modernization Program Project), Series 2010, 5.25% 2040 | 10,525 | 11,045 |
| Lower Colorado River Auth., Transmission Contract Rev. Ref. and Improvement Bonds (LCRA Transmission Services Corp. Project), Series 2010, 5.00% 2030 | 2,520 | 2,729 |
| Lower Colorado River Auth., Transmission Contract Rev. Ref. and Improvement Bonds (LCRA Transmission Services Corp. Project), Series 2010, 5.00% 2040 | 6,550 | 6,904 |
| Lower Colorado River Auth., Transmission Contract Rev. Ref. Bonds (LCRA Transmission Services Corp. Project), Series 2011-A, 5.00% 2041 | 1,500 | 1,592 |
| Lower Colorado River Auth., Transmission Contract Rev. Ref. Bonds (LCRA Transmission Services Corp. Project), Series 2013, 5.00% 2026 | 5,000 | 5,671 |
| Lower Colorado River Auth., Transmission Contract Rev. Ref. Bonds (LCRA Transmission Services Corp. Project), Series 2013-A, 5.00% 2027 | 3,500 | 3,990 |
| Lower Colorado River Auth., Transmission Contract Rev. Ref. Bonds (LCRA Transmission Services Corp. Project), Series 2013-A, 5.00% 2036 | 7,000 | 7,511 |
| City of Lubbock, Tax and Waterworks System Surplus Rev. Certificates of Obligation, Series 2007-A, Assured Guaranty Municipal insured, 5.25% 2027 | 5,000 | 5,466 |
| Matagorda County Navigation Dist. Number One, Pollution Control Rev. Ref. Bonds (AEP Texas Central Co. Project), Series 2005-A, AMBAC insured, 4.40% 2030 | 3,450 | 3,597 |
| Midlothian Dev. Auth., Tax Increment Contract Rev. Ref. Bonds, Series 2007-A, RADIAN insured, 5.00% 2017 | 1,940 | 2,019 |
| Midlothian Dev. Auth., Tax Increment Contract Rev. Ref. Bonds, Series 2007-A, RADIAN insured, 5.00% 2021 | 1,235 | 1,258 |
| Midlothian Dev. Auth., Tax Increment Contract Rev. Ref. Bonds, Series 2007-A, RADIAN insured, 5.00% 2026 | 2,190 | 2,218 |
| Municipal Gas Acquisition and Supply Corp. I, Gas Supply Rev. Bonds, Series 2006-A, 5.25% 2017 | 2,500 | 2,797 |
| Municipal Gas Acquisition and Supply Corp. I, Gas Supply Rev. Bonds, Series 2006-A, 5.25% 2019 | 5,000 | 5,730 |
| Municipal Gas Acquisition and Supply Corp. I, Gas Supply Rev. Bonds, Series 2006-A, 5.25% 2021 | 1,000 | 1,157 |
| Municipal Gas Acquisition and Supply Corp. II, Gas Supply Rev. Bonds, Series 2007-A, 1.025% 20271 | 20,000 | 17,713 |
| Municipal Gas Acquisition and Supply Corp. III, Gas Supply Rev. Bonds, Series 2012, 5.00% 2021 | 6,155 | 7,042 |
| Municipal Gas Acquisition and Supply Corp. III, Gas Supply Rev. Bonds, Series 2012, 5.00% 2022 | 1,000 | 1,149 |
| Municipal Gas Acquisition and Supply Corp. III, Gas Supply Rev. Bonds, Series 2012, 5.00% 2026 | 15,000 | 16,449 |
| Municipal Gas Acquisition and Supply Corp. III, Gas Supply Rev. Bonds, Series 2012, 5.00% 2030 | 8,250 | 8,838 |
| Municipal Gas Acquisition and Supply Corp. III, Gas Supply Rev. Bonds, Series 2012, 5.00% 2031 | 1,500 | 1,593 |
| New Hope Cultural Education Facs. Fin. Corp., First Mortgage Rev. Ref. Bonds (Morningside Ministries Project), Series 2013, 6.50% 2043 | 1,000 | 1,067 |
| North Central Texas Health Facs. Dev. Corp., Hospital Rev. Ref. Bonds (Children’s Medical Center of Dallas Project), Series 2012, 5.00% 2032 | 3,000 | 3,306 |
| North East Independent School Dist., Unlimited Tax Ref. Bonds, Series 2007, 5.25% 2026 | 4,655 | 5,857 |
| North Forest Independent School Dist. (Harris County), Unlimited Tax Schoolhouse Ref. Bonds, Series 2006-A, 5.00% 2020 | 1,995 | 2,174 |
| North Texas Health Facs. Dev. Corp., Hospital Rev. Ref. Bonds (United Regional Health Care System, Inc. Project), Series 2007, Assured Guaranty Municipal insured, 5.00% 2019 | 1,075 | 1,184 |
| North Texas Health Facs. Dev. Corp., Hospital Rev. Ref. Bonds (United Regional Health Care System, Inc. Project), Series 2007, Assured Guaranty Municipal insured, 5.00% 2023 | 1,600 | 1,762 |
| North Texas Health Facs. Dev. Corp., Hospital Rev. Ref. Bonds (United Regional Health Care System, Inc. Project), Series 2007, Assured Guaranty Municipal insured, 5.00% 2025 | 5,295 | 5,810 |
| North Texas Municipal Water Dist., Water System Rev. Bonds, Series 2008, 5.00% 2038 | 5,000 | 5,591 |
North Texas Tollway Auth., Special Projects System Rev. Bonds, Current Interest Bonds, Series 2011-D,
5.00% 2031 | 6,500 | 7,335 |
| North Texas Tollway Auth., System Rev. Ref. Bonds, Current Interest Bonds, Series 2008-A, 5.50% 2018 | 1,000 | 1,136 |
| North Texas Tollway Auth., System Rev. Ref. Bonds, Current Interest Bonds, Series 2008-A, 5.625% 2033 | 15,100 | 16,811 |
| North Texas Tollway Auth., System Rev. Ref. Bonds, Current Interest Bonds, Series 2008-A, 6.00% 2021 | 3,760 | 4,287 |
| North Texas Tollway Auth., System Rev. Ref. Bonds, Current Interest Bonds, Series 2008-A, 6.00% 2023 | 12,570 | 14,332 |
| North Texas Tollway Auth., System Rev. Ref. Bonds, Current Interest Bonds, Series 2008-A, 6.00% 2025 | 5,000 | 5,662 |
| North Texas Tollway Auth., System Rev. Ref. Bonds, Series 2008-E-3, 5.75% 2038 (put 2016) | 2,150 | 2,297 |
| North Texas Tollway Auth., System Rev. Ref. Bonds, Series 2008-F, 5.75% 2033 | 11,000 | 12,269 |
The Tax-Exempt Bond Fund of America — Page 51 of 60
Bonds, notes & other debt instruments
Texas (continued) | Principal amount
(000) | Value
(000) |
| North Texas Tollway Auth., System Rev. Ref. Bonds, Series 2008-F, 5.75% 2038 | $8,500 | $9,454 |
| North Texas Tollway Auth., System Rev. Ref. Bonds, Series 2009-A, 6.00% 2028 | 16,000 | 18,763 |
| North Texas Tollway Auth., System Rev. Ref. Bonds, Series 2009-A, 6.10% 2028 | 5,000 | 5,857 |
| North Texas Tollway Auth., System Rev. Ref. Bonds, Series 2009-A, 6.25% 2039 | 5,000 | 5,794 |
| North Texas Tollway Auth., System Rev. Ref. Bonds, Series 2010, 6.00% 2034 | 1,500 | 1,752 |
| North Texas Tollway Auth., System Rev. Ref. Bonds, Series 2010, 6.00% 2038 | 5,000 | 5,780 |
| North Texas Tollway Auth., System Rev. Ref. Bonds, Series 2011-A, 0.86% 2050 (put 2019)1 | 3,600 | 3,595 |
| North Texas Tollway Auth., System Rev. Ref. Bonds, Series 2011-B, 5.00% 2038 | 8,000 | 8,502 |
| North Texas Tollway Auth., System Rev. Ref. Bonds, Series 2012-C, 1.95% 2038 (put 2019) | 8,600 | 8,644 |
| City of Olmos Park, Higher Education Facs. Corp., Higher Education Rev. Improvement and Ref. Bonds (University of the Incarnate Word Project), Series 2012, 5.00% 2026 | 2,075 | 2,352 |
| Private Activity Bond Surface Transportation Corp., Rev. Bonds (NTE Mobility Partners LLC North Tarrant Express Managed Lanes Project), Series 2009, 6.875% 2039 | 5,250 | 6,177 |
| Public Fin. Auth. Charter School Fin. Corp., Education Rev. Ref. Bonds (KIPP, Inc.), Series 2006-A, ACA insured, 5.00% 2036 | 20 | 20 |
| Public Fin. Auth., G.O. Bonds, Series 2007, 5.00% 2024 | 1,525 | 1,718 |
| SA Energy Acquisition Public Fac. Corp., Gas Supply Rev. Bonds, Series 2007, 5.25% 2018 | 2,000 | 2,240 |
| SA Energy Acquisition Public Fac. Corp., Gas Supply Rev. Bonds, Series 2007, 5.50% 2022 | 1,220 | 1,417 |
| SA Energy Acquisition Public Fac. Corp., Gas Supply Rev. Bonds, Series 2007, 5.50% 2023 | 1,980 | 2,305 |
| SA Energy Acquisition Public Fac. Corp., Gas Supply Rev. Bonds, Series 2007, 5.50% 2027 | 1,920 | 2,229 |
| Sam Rayburn Municipal Power Agcy., Power Supply System Rev. Ref. Bonds, Series 2012, 5.00% 2021 | 1,915 | 2,217 |
| City of San Antonio, Bexar County, Water System Rev. Ref. Bonds, Series 2005, National insured, 5.00% 2019 | 1,540 | 1,598 |
| City of San Antonio, Bexar County, Water System Rev. Ref. Bonds, Series 2005, National insured, 5.00% 2019 (preref. 2015) | 4,630 | 4,808 |
| City of San Antonio, Electric and Gas Systems Rev. Bonds (CPS Energy), Series 2014, 5.00% 2044 | 3,000 | 3,349 |
| City of San Antonio, Electric and Gas Systems Rev. Ref. Bonds, New Series 2007, 5.00% 2017 | 5,000 | 5,564 |
| City of San Antonio, Electric and Gas Systems Rev. Ref. Bonds, New Series 2007, 5.00% 2023 | 10,000 | 11,015 |
| City of San Antonio, Electric and Gas Systems Rev. Ref. Bonds, New Series 2009-A, 5.00% 2030 | 13,080 | 14,838 |
San Leanna Education Facs. Corp., Higher Education Rev. Ref. Bonds (St. Edward’s University Project),
Series 2007, 5.00% 2020 | 1,100 | 1,176 |
San Leanna Education Facs. Corp., Higher Education Rev. Ref. Bonds (St. Edward’s University Project),
Series 2007, 5.125% 2021 | 1,410 | 1,500 |
San Leanna Education Facs. Corp., Higher Education Rev. Ref. Bonds (St. Edward’s University Project),
Series 2007, 5.125% 2023 | 1,000 | 1,055 |
San Leanna Education Facs. Corp., Higher Education Rev. Ref. Bonds (St. Edward’s University Project),
Series 2007, 5.125% 2036 | 1,600 | 1,639 |
Sherman Independent School Dist. (Grayson County), Unlimited Tax School Building and Ref. Bonds,
Series 2005-A, 5.00% 2017 | 275 | 282 |
Sherman Independent School Dist. (Grayson County), Unlimited Tax School Building and Ref. Bonds,
Series 2005-A, 5.00% 2017 (preref. 2015) | 1,210 | 1,242 |
South San Antonio Independent School Dist. (Bexar County), Unlimited Tax School Building Bonds,
Series 2005, 5.50% 2030 | 7,510 | 9,570 |
| Tarrant County Cultural Education Facs. Fin. Corp., Health Resources System Rev. Ref. Bonds, Series 2007-A, 5.00% 2024 | 2,000 | 2,195 |
| Tarrant County Cultural Education Facs. Fin. Corp., Health Resources System Rev. Ref. Bonds, Series 2007-A, 5.00% 2036 | 2,000 | 2,081 |
| Tarrant County Cultural Education Facs. Fin. Corp., Hospital Rev. Ref. Bonds (Baylor Health Care System Project), Series 2011-A, 5.00% 2030 | 3,000 | 3,294 |
| Tarrant County Cultural Education Facs. Fin. Corp., Hospital Rev. Ref. Bonds (Scott & White Healthcare Project), Series 2013-A, 5.00% 2033 | 1,000 | 1,107 |
| Tarrant County Cultural Education Facs. Fin. Corp., Hospital Rev. Ref. Bonds (Scott and White Memorial Hospital and Scott, Sherwood and Brindley Foundation Project), Series 2008-A, 5.00% 2019 | 5,000 | 5,628 |
| Tarrant County Cultural Education Facs. Fin. Corp., Hospital Rev. Ref. Bonds (Scott and White Memorial Hospital and Scott, Sherwood and Brindley Foundation Project), Series 2008-A, 5.25% 2028 | 2,000 | 2,167 |
The Tax-Exempt Bond Fund of America — Page 52 of 60
Bonds, notes & other debt instruments
Texas (continued) | Principal amount
(000) | Value
(000) |
| Tarrant County Cultural Education Facs. Fin. Corp., Hospital Rev. Ref. Bonds (Scott and White Memorial Hospital and Scott, Sherwood and Brindley Foundation Project), Series 2008-A, 5.50% 2031 | $3,000 | $3,226 |
| Tarrant County Cultural Education Facs. Fin. Corp., Retirement Fac. Rev. Ref. Bonds (Buckner Retirement Services, Inc. Project), Series 2007, 5.25% 2022 | 1,855 | 1,945 |
| Tarrant County Cultural Education Facs. Fin. Corp., Retirement Fac. Rev. Ref. Bonds (Buckner Retirement Services, Inc. Project), Series 2007, 5.25% 2027 | 6,900 | 7,118 |
| Tarrant County Cultural Education Facs. Fin. Corp., Retirement Fac. Rev. Ref. Bonds (Buckner Retirement Services, Inc. Project), Series 2007, 5.25% 2037 | 14,355 | 14,631 |
| Tarrant County Cultural Education Facs. Fin. Corp., Retirement Fac. Rev. Ref. Bonds (Northwest Senior Housing Corp. - Edgemere Project), Series 2006-A, 6.00% 2036 | 1,000 | 1,027 |
| Tarrant County Health Facs. Dev. Corp., Health Resources System Rev. Ref. Bonds, Series 1997-A, National insured, 5.75% 2015 (escrowed to maturity) | 3,000 | 3,090 |
| Tarrant Regional Water Dist., Water Control and Improvement Dist., Water Rev. Ref. and Improvement Bonds, Series 2009, 5.00% 2021 | 1,400 | 1,609 |
| Tarrant Regional Water Dist., Water Control and Improvement Dist., Water Rev. Ref. and Improvement Bonds, Series 2009, 5.00% 2022 | 1,000 | 1,150 |
| Tarrant Regional Water Dist., Water Control and Improvement Dist., Water Rev. Ref. and Improvement Bonds, Series 2009, 5.00% 2023 | 1,000 | 1,150 |
| Board of Regents of the Texas A&M University System, Rev. Fncg. System Bonds, Series 2009-B, 5.00% 2021 | 1,955 | 2,290 |
| Board of Regents of the Texas A&M University System, Series 2009-A, 5.00% 2020 | 3,355 | 3,930 |
| Board of Regents of the Texas A&M University System, Series 2009-A, 5.00% 2021 | 2,360 | 2,764 |
| Board of Regents, Texas State University System, Rev. Fncg. System Ref. Bonds, Series 2008, 5.25% 2025 | 4,500 | 5,093 |
Board of Regents of Texas Tech University System, Rev. Fncg. Ref. System and Improvement Bonds,
Series 2009-12, 5.00% 2024 | 2,000 | 2,263 |
| Tomball Hospital Auth., Hospital Rev. Ref. Bonds, Series 2005, 5.00% 2020 (preref. 2015) | 3,000 | 3,131 |
| Transportation Commission, Central Texas Turnpike System, Rev. Ref. Bonds, Series 2012-A, 4.00% 2038 | 7,500 | 7,214 |
| Transportation Commission, G.O. Mobility Fund Bonds, Series 2008, 5.00% 2017 | 2,050 | 2,297 |
| Transportation Commission, G.O. Mobility Fund Bonds, Series 2008, 5.00% 2017 (escrowed to maturity) | 200 | 224 |
| Transportation Commission, G.O. Mobility Fund Bonds, Series 2008, 5.00% 2021 | 11,420 | 13,059 |
| Transportation Commission, G.O. Mobility Fund Bonds, Series 2008, 5.00% 2021 (preref. 2018) | 1,125 | 1,295 |
| Transportation Commission, G.O. Mobility Fund Bonds, Series 2008, 5.00% 2028 | 6,375 | 7,134 |
| Transportation Commission, G.O. Mobility Fund Bonds, Series 2008, 5.00% 2028 (preref. 2018) | 625 | 720 |
| Transportation Commission, State Highway Fund Rev. Bonds, Series 2006, 5.00% 2018 (preref. 2016) | 7,500 | 8,089 |
Travis County Health Facs. Dev. Corp., Retirement Fac. Rev. Bonds (Querencia at Barton Creek Project),
Series 2005-A, 5.50% 2025 | 2,500 | 2,524 |
Travis County Health Facs. Dev. Corp., Retirement Fac. Rev. Bonds (Querencia at Barton Creek Project),
Series 2005-A, 5.65% 2035 | 5,635 | 5,659 |
| Travis County Health Facs. Dev. Corp., Rev. Bonds (Westminster Manor Project), Series 2010, 7.00% 2030 | 1,000 | 1,133 |
| Travis County Health Facs. Dev. Corp., Rev. Bonds (Westminster Manor Project), Series 2010, 7.125% 2040 | 2,750 | 3,086 |
Board of Regents of the University of Houston System, Consolidated Rev. Ref. Bonds, Series 2009,
5.00% 2025 | 2,735 | 3,085 |
Board of Regents of the University of North Texas System, Rev. Fncg. System Bonds, Series 2009-A,
5.00% 2035 | 1,000 | 1,099 |
| Board of Regents of the University of Texas System, Rev. Ref. Fncg. System Bonds, Series 2002-B, 5.25% 2016 | 7,280 | 8,019 |
| Waco Education Fin. Corp., Rev. Bonds (Baylor University Issue), Series 2012, 5.00% 2043 | 3,500 | 3,792 |
Waco Health Facs. Dev. Corp., FHA insured Mortgage Rev. Bonds (Hillcrest Health System Project),
Series 2006-A, National insured, 5.00% 2016 (escrowed to maturity) | 1,000 | 1,092 |
Waco Health Facs. Dev. Corp., FHA insured Mortgage Rev. Bonds (Hillcrest Health System Project),
Series 2006-A, National insured, 5.00% 2019 (preref. 2016) | 3,465 | 3,792 |
| Water Dev. Board, State Revolving Fund, Rev. Bonds, Program Series 2008-B, 5.00% 2028 | 6,500 | 7,140 |
| Water Dev. Board, State Revolving Fund, Rev. Bonds, Program Series 2008-B, 5.00% 2029 | 5,000 | 5,493 |
| Water Dev. Board, State Revolving Fund, Rev. Bonds, Program Series 2008-B, 5.00% 2033 | 2,000 | 2,203 |
| Weatherford Independent School Dist., Capital Appreciation Ref. Bonds, 0% 2018 | 2,380 | 2,294 |
The Tax-Exempt Bond Fund of America — Page 53 of 60
Bonds, notes & other debt instruments
Texas (continued) | Principal amount
(000) | Value
(000) |
| Weatherford Independent School Dist., Capital Appreciation Ref. Bonds, 0% 2018 (escrowed to maturity) | $245 | $238 |
| Ysleta Independent School Dist. (El Paso County), Unlimited Tax School Building Bonds, Series 2006, 5.00% 2018 (preref. 2016) | 2,480 | 2,717 |
| | | 869,430 |
| Utah 0.06% | | |
| Housing Corp., Single-family Mortgage Bonds, Series 2010-B-1, Class III, 4.00% 2024 | 645 | 665 |
| Intermountain Power Agcy., Subordinated Power Supply Rev. Ref. Bonds, Series 2009-A, 5.00% 2015 | 3,000 | 3,135 |
| Salt Lake County, College Rev. Ref. Bonds (Westminster College Project), Series 2007, 5.00% 2026 | 1,875 | 1,986 |
| | | 5,786 |
| Virgin Islands 0.40% | | |
| Public Fin. Auth., Rev. Bonds (Matching Fund Loan Note - Diageo Project), Series 2009-A, 6.625% 2029 | 5,000 | 5,500 |
| Public Fin. Auth., Rev. Bonds (Matching Fund Loan Note - Diageo Project), Series 2009-A, 6.75% 2019 | 1,250 | 1,398 |
| Public Fin. Auth., Rev. Bonds (Matching Fund Loan Note), Series 2010-A, 5.00% 2029 | 10,500 | 11,273 |
| Public Fin. Auth., Rev. Bonds (Matching Fund Loan Notes), Series 2012-A, 5.00% 2032 | 2,750 | 2,954 |
| Public Fin. Auth., Rev. Ref. Bonds (Matching Fund Loan Note), Series 2010-B, 5.00% 2025 | 1,000 | 1,068 |
| Public Fin. Auth., Rev. Ref. Bonds (Matching Fund Loan Note), Series 2013-B, 5.00% 2024 | 4,000 | 4,537 |
| Public Fin. Auth., Rev. Ref. Bonds (Matching Fund Loan Notes), Series 2009-B, 5.00% 2018 | 3,500 | 3,928 |
| Public Fin. Auth., Rev. Ref. Bonds (Matching Fund Loan Notes), Series 2009-C, 5.00% 2015 | 2,000 | 2,085 |
| Public Fin. Auth., Rev. Ref. Bonds (Matching Fund Loan Notes), Series 2012-A, 2.25% 2017 | 1,655 | 1,678 |
| Public Fin. Auth., Rev. Ref. Bonds (Matching Fund Loan Notes), Series 2012-A, 4.00% 2022 | 2,500 | 2,638 |
| | | 37,059 |
| Virginia 0.31% | | |
| Industrial Dev. Auth. of Botetourt County, Residential Care Fac. Rev. Ref. Bonds (Glebe, Inc.), Series 2014-A, 6.00% 2044 | 3,500 | 3,350 |
| City of Chesapeake, Chesapeake Transportation System Toll Road Rev. Ref. Bonds (Capital Appreciation Bonds), Series 2012-B, 0%/4.875% 20404 | 2,000 | 1,210 |
City of Chesapeake, Chesapeake Transportation System Toll Road Rev. Ref. Bonds,
Series 2012-A, 5.00% 2047 | 3,000 | 3,087 |
| Fairfax County Econ. Dev. Auth., Retirement Community Rev. Ref. Bonds (Greenspring Village, Inc. Fac.), Series 2006-A, 4.75% 2026 | 1,500 | 1,539 |
| Industrial Dev. Auth. of the City of Harrisonburg, Residential Care Fac. Rev. Ref. Bonds (Sunnyside Presbyterian Home), Series 2013-B, 6.50% 2039 | 2,000 | 2,114 |
Econ. Dev. Auth. of Henrico County, Residential Care Fac. Rev. Ref. Bonds (United Methodist Homes),
5.00% 2022 | 655 | 709 |
Heritage Hunt Commercial Community Dev. Auth. (Prince William County), Special Assessment Bonds,
Series 1999-B, 7.00% 2029 | 580 | 581 |
| Industrial Dev. Auth. of Loudoun County, Residential Care Fac. Rev. Ref. Bonds (Falcons Landing Project), Series 2004-B, 6.00% 2028 | 2,000 | 2,114 |
| Peninsula Town Center Community Dev. Auth., Special Obligation Bonds, Series 2007, 6.35% 2028 | 1,000 | 1,083 |
| Peninsula Town Center Community Dev. Auth., Special Obligation Bonds, Series 2007, 6.45% 2037 | 4,450 | 4,805 |
| Resources Auth., Infrastructure Rev. Bonds (Pooled Fncg. Program), Series 2008-B, 5.00% 2027 | 4,845 | 5,491 |
Resources Auth., Infrastructure Rev. Bonds (Pooled Fncg. Program), Series 2008-B, 5.00% 2027
(preref. 2018) | 155 | 181 |
Tobacco Settlement Fncg. Corp., Tobacco Settlement Asset-backed Rev. Ref. Bonds,
Series 2007-B-1, 5.00% 2047 | 4,235 | 2,825 |
| | | 29,089 |
The Tax-Exempt Bond Fund of America — Page 54 of 60
Bonds, notes & other debt instruments
Washington 3.04% | Principal amount
(000) | Value
(000) |
| Central Puget Sound Regional Transit Auth., Sales Tax and Motor Vehicle Excise Tax Bonds, Series 1999, FGIC-National insured, 4.75% 2028 | $11,940 | $12,075 |
| Central Puget Sound Regional Transit Auth., Sales Tax and Motor Vehicle Excise Tax Bonds, Series 1999, FGIC-National insured, 5.25% 2021 | 4,500 | 5,312 |
| Central Puget Sound Regional Transit Auth., Sales Tax Bonds, Series 2007-A, 5.00% 2034 | 5,000 | 5,504 |
| Clark County, Vancouver School Dist. No. 37, Unlimited Tax Deferred Interest G.O. Bonds, Series 2001-C, FGIC-National insured, 0% 2016 | 2,500 | 2,466 |
| Energy Northwest, Columbia Generating Station Electric Rev. Bonds, Series 2006-A, 5.00% 2020 | 4,125 | 4,488 |
Energy Northwest, Columbia Generating Station Electric Rev. Bonds, Series 2006-A, 5.00% 2020
(preref. 2016) | 1,875 | 2,044 |
| Energy Northwest, Electric Rev. Ref. Bonds (Project 1), Series 2006-A, 5.00% 2016 | 2,000 | 2,180 |
| Energy Northwest, Electric Rev. Ref. Bonds (Project 1), Series 2012-A, 5.00% 2017 | 17,000 | 19,178 |
| Federal Highway Grant Anticipation Rev. Bonds (SR 520 Corridor Program), Series 2012-F, 5.00% 2023 | 5,000 | 5,890 |
| Federal Highway Grant Anticipation Rev. Bonds (SR 520 Corridor Program), Series 2014-C, 5.00% 2021 | 2,500 | 2,967 |
| FYI Properties, Lease Rev. Bonds (State of Washington DIS Project), Series 2009, 5.00% 2027 | 4,000 | 4,436 |
| FYI Properties, Lease Rev. Bonds (State of Washington DIS Project), Series 2009, 5.25% 2029 | 2,500 | 2,793 |
| FYI Properties, Lease Rev. Bonds (State of Washington DIS Project), Series 2009, 5.50% 2039 | 6,500 | 7,362 |
| Various Purpose G.O. Ref. Bonds, Series R-2005-A, AMBAC insured, 5.00% 2018 | 10,000 | 10,201 |
| Health Care Facs. Auth., Rev. Bonds (Group Health Cooperative), Series 2006, RADIAN insured, 5.00% 2023 | 1,000 | 1,020 |
| Health Care Facs. Auth., Rev. Bonds (Group Health Cooperative), Series 2006, RADIAN insured, 5.00% 2024 | 2,805 | 2,852 |
| Health Care Facs. Auth., Rev. Bonds (Group Health Cooperative), Series 2006, RADIAN insured, 5.00% 2025 | 2,000 | 2,029 |
| Health Care Facs. Auth., Rev. Bonds (Kadlec Regional Medical Center), Series 2012, 5.00% 2032 | 750 | 795 |
| Health Care Facs. Auth., Rev. Ref. Bonds (Children’s Hospital and Regional Medical Center), Series 2008-C, 5.375% 2031 | 3,000 | 3,345 |
| Health Care Facs. Auth., Rev. Ref. Bonds (Children’s Hospital and Regional Medical Center), Series 2008-C, 5.50% 2035 | 5,000 | 5,642 |
| Health Care Facs. Auth., Rev. Ref. Bonds (Kadlec Medical Center), Series 2006-A, Assured Guaranty insured, 5.00% 2021 | 3,025 | 3,196 |
| Health Care Facs. Auth., Rev. Ref. Bonds (PeaceHealth), Series 2014-A, 5.00% 2027 | 500 | 571 |
Health Care Facs. Auth., Rev. Ref. Bonds (Providence Health & Services),
Series 2012-B, 5.00% 2042 (put 2021) | 1,000 | 1,173 |
| Health Care Facs. Auth., Rev. Ref. Bonds (Virginia Mason Medical Center), Series 2007-A, 6.125% 2037 | 18,500 | 19,436 |
| Higher Education Facs. Auth., Rev. Bonds (Gonzaga University Project), Series 2013-A, 5.25% 2043 | 9,765 | 10,655 |
| Higher Education Facs. Auth., Rev. Ref. Bonds (Gonzaga University Project), Series 2009-B, 5.00% 2020 | 2,850 | 3,178 |
| Higher Education Facs. Auth., Rev. Ref. Bonds (Gonzaga University Project), Series 2009-B, 5.00% 2029 | 6,000 | 6,343 |
Housing Fin. Commission, Nonprofit Housing Rev. Ref. Bonds (Emerald Heights Project), Series 2013,
5.00% 2028 | 1,100 | 1,176 |
| Housing Fin. Commission, Nonprofit Housing Rev. Ref. Bonds (Rockwood Retirement Project), Series 2014-A, 7.375% 20442 | 15,880 | 17,154 |
| Housing Fin. Commission, Nonprofit Housing Rev. Ref. Bonds (Rockwood Retirement Project), Series 2014-A, 7.50% 20492 | 6,000 | 6,528 |
| Housing Fin. Commission, Homeownership Program Bonds, Series 2010-A, 4.70% 2028 | 580 | 619 |
| Housing Fin. Commission, Homeownership Program Bonds, Series 2011-B, 4.25% 2032 | 2,280 | 2,483 |
| Housing Fin. Commission, Single-family Program Bonds, Series 2014-1-N, 3.00% 2037 | 435 | 459 |
| Housing Fin. Commission, Single-family Program Rev. Ref. Bonds, Series 2013-1-N, 3.00% 2043 | 350 | 363 |
| King County, Limited Tax G.O. Bonds, Series 2007-E, 5.00% 2027 | 6,045 | 6,771 |
| King County, Sewer Rev. Ref. Bonds, Series 2011-B, 5.00% 2034 | 10,000 | 11,112 |
| King County, Sewer Rev. Ref. Bonds, Series 2013-B, 5.00% 2044 | 1,500 | 1,676 |
| Motor Vehicle Fuel Tax G.O. Bonds, Series 2014-B, 5.00% 2031 | 2,000 | 2,307 |
| Motor Vehicle Fuel Tax G.O. Ref. Bonds, 5.00% 2025 | 3,000 | 3,549 |
| Motor Vehicle Fuel Tax G.O. Ref. Bonds, Series R-2005-B, 5.00% 2028 | 5,000 | 5,657 |
| Public Power Supply System, Rev. Ref. Bonds (Nuclear Project No. 3), Series 1989-B, 7.125% 2016 | 5,250 | 5,926 |
| City of Seattle, Municipal Light and Power Improvement and Rev. Ref. Bonds, Series 2008, 5.25% 2015 | 1,000 | 1,034 |
| City of Seattle, Water System Rev. Ref. and Improvement Bonds, Series 2008, 5.00% 2027 | 3,000 | 3,374 |
| City of Seattle, Water System Rev. Ref. and Improvement Bonds, Series 2008, 5.00% 2029 | 5,000 | 5,572 |
The Tax-Exempt Bond Fund of America — Page 55 of 60
Bonds, notes & other debt instruments
Washington (continued) | Principal amount
(000) | Value
(000) |
| Port of Seattle, Passenger Fac. Charge Rev. Ref. Bonds, Series 2010-A, 5.00% 2023 | $5,000 | $5,660 |
| Port of Seattle, Rev. Bonds, Series 1999-A, FGIC-National insured, 5.50% 2016 | 1,080 | 1,191 |
| Port of Seattle, Rev. Bonds, Series 1999-A, FGIC-National insured, 5.50% 2018 | 7,920 | 9,277 |
| Port of Seattle, Rev. Bonds, Series 1999-A, FGIC-National insured, 5.50% 2019 | 3,630 | 4,309 |
| Port of Seattle, Rev. Bonds, Series 2009-A, 5.25% 2028 | 10,425 | 11,746 |
| Port of Seattle, Rev. Ref. Bonds, Series 2010-B, 5.00% 2030 | 2,600 | 2,877 |
Public Utility Dist. No. 1 of Snohomish County, Electric System Rev. Ref. Bonds, Series 2005,
Assured Guaranty Municipal insured, 5.00% 2019 | 5,000 | 5,315 |
| Tobacco Settlement Auth., Tobacco Settlement Rev. Ref. Bonds, Series 2013, 5.00% 2026 | 9,940 | 10,462 |
| Tobacco Settlement Auth., Tobacco Settlement Rev. Ref. Bonds, Series 2013, 5.00% 2027 | 2,500 | 2,670 |
| Tobacco Settlement Auth., Tobacco Settlement Rev. Ref. Bonds, Series 2013, 5.25% 2029 | 5,000 | 5,370 |
| Tobacco Settlement Auth., Tobacco Settlement Rev. Ref. Bonds, Series 2013, 5.25% 2031 | 1,940 | 2,103 |
| | | 283,871 |
| West Virginia 0.13% | | |
| County Commission of Pleasants County, Pollution Control Rev. Ref. Bonds (Allegheny Energy Supply Co., LLC Pleasants Station Project), Series 2007-F, 5.25% 2037 | 11,500 | 11,823 |
| Wisconsin 1.95% | | |
| Clean Water Rev. Bonds, Series 2008-1, 5.00% 2027 | 7,245 | 8,239 |
| Clean Water Rev. Bonds, Series 2008-1, 5.00% 2028 | 2,620 | 2,954 |
| General Fund Annual Appropriation Rev. Ref. Bonds, Series 2009-A, 5.75% 2033 | 5,000 | 5,839 |
| General Fund Annual Appropriation Rev. Ref. Bonds, Series 2009-A, 6.00% 2036 | 52,960 | 62,553 |
| Health and Educational Facs. Auth., Health Facs. Rev. Bonds (SSM Health Care), Series 2010-A, 5.25% 2034 | 2,000 | 2,156 |
| Health and Educational Facs. Auth., Rev. Bonds (Agnesian HealthCare, Inc.), Series 2013-B, 5.00% 2036 | 4,500 | 4,803 |
Health and Educational Facs. Auth., Rev. Bonds (Ascension Health Alliance Senior Credit Group),
Series 2013-B-1, 4.00% 2043 (put 2018) | 2,500 | 2,763 |
Health and Educational Facs. Auth., Rev. Bonds (Ascension Health Alliance Senior Credit Group),
Series 2013-B-4, 5.00% 2043 (put 2021) | 7,000 | 8,212 |
| Health and Educational Facs. Auth., Rev. Bonds (Ascension Health Credit Group), Series 2010-E, 5.00% 2033 | 11,000 | 11,881 |
| Health and Educational Facs. Auth., Rev. Bonds (Wheaton Franciscan Healthcare System), Series 2006-A, 5.25% 2022 | 11,855 | 12,682 |
| Health and Educational Facs. Auth., Rev. Ref. Bonds (Aurora Health Care, Inc.), Series 2012-A, 5.00% 2026 | 11,000 | 11,992 |
| Health and Educational Facs. Auth., Rev. Ref. Bonds (Aurora Health Care, Inc.), Series 2012-A, 5.00% 2028 | 1,000 | 1,076 |
| Health and Educational Facs. Auth., Rev. Ref. Bonds (Aurora Health Care, Inc.), Series 2013-A, 5.125% 2031 | 1,750 | 1,871 |
| Health and Educational Facs. Auth., Rev. Ref. Bonds (Children’s Hospital of Wisconsin, Inc.), Series 1998, AMBAC insured, 5.625% 2015 | 1,130 | 1,162 |
| Health and Educational Facs. Auth., Rev. Ref. Bonds (Children’s Hospital of Wisconsin, Inc.), Series 2008-A, 5.25% 2022 | 3,645 | 4,148 |
| Health and Educational Facs. Auth., Rev. Ref. Bonds (Childre’s Hospital of Wisconsin, Inc.), Series 2008-A, 5.25% 2023 | 3,990 | 4,524 |
| Health and Educational Facs. Auth., Rev. Ref. Bonds (Children’s Hospital of Wisconsin, Inc.), Series 2008-A, 5.25% 2024 | 3,360 | 3,782 |
| Health and Educational Facs. Auth., Rev. Ref. Bonds (Gundersen Lutheran), Series 2011-A, 5.25% 2039 | 9,000 | 9,692 |
Health and Educational Facs. Auth., Rev. Ref. Bonds (Milwaukee Catholic Home, Inc.), Series 2006,
5.00% 2026 (preref. 2016) | 2,250 | 2,449 |
| Milwaukee County, Airport Rev. Bonds, Series 2010-A, 5.00% 2034 | 2,000 | 2,113 |
| Public Fin. Auth., Rev. Bonds (Roseman University of Health Sciences Project), Series 2012, 5.50% 2032 | 1,000 | 1,050 |
| Public Fin. Auth., Senior Living Rev. Bonds (Rose Villa Project), Series 2014-B2, 4.25% 2020 | 600 | 603 |
| Public Fin. Auth., Senior Living Rev. Bonds (Rose Villa Project), Series 2014-B3, 3.75% 2019 | 1,000 | 1,009 |
| City of Superior, Limited Obligation Rev. Ref. Bonds (Midwest Energy Resources Co. Project), Series 1991-E, FGIC-National insured, 6.90% 2021 | 6,000 | 7,550 |
The Tax-Exempt Bond Fund of America — Page 56 of 60
Bonds, notes & other debt instruments
Wisconsin (continued) | Principal amount
(000) | Value
(000) |
| University of Wisconsin Hospitals and Clinics Auth., Rev. Bonds, Series 2013-A, 5.00% 2038 | $3,000 | $3,230 |
| WPPI Energy, Power Supply System Rev. Ref. Bonds, Series 2013-A, 5.00% 2037 | 3,650 | 3,957 |
| | | 182,290 |
| Total bonds, notes & other debt instruments (cost: $7,869,514,000) | | 8,381,471 |
| Short-term securities 9.47% | | |
| State of Alaska, City of Valdez, Marine Terminal Rev. Ref. Bonds (Exxon Pipeline Co. Project), Series 1993-A, 0.05% 20331 | 3,500 | 3,500 |
| State of Alaska, City of Valdez, Marine Terminal Rev. Ref. Bonds (Exxon Pipeline Co. Project), Series 1993-C, 0.05% 20331 | 13,100 | 13,100 |
State of Alaska, City of Valdez, Marine Terminal Rev. Ref. Bonds (Exxon Pipeline Co. Project),
Series 1993-B, 0.05% 20331 | 9,000 | 9,000 |
State of Alaska, City of Valdez, Marine Terminal Rev. Ref. Bonds (ExxonMobil Project),
Series 2001, 0.05% 20291 | 7,600 | 7,600 |
| State of California, County of Los Angeles, 2014-15 Tax and Rev. Anticipation Notes, 1.50% 2015 | 22,670 | 22,961 |
| State of California, County of Ventura, 2014-15 Tax and Rev. Anticipation Notes 1.50% 2015 | 20,000 | 20,252 |
| State of California, Dept. of Water and Power of the City of Los Angeles, Power System Demand Rev. Bonds, Series 2001-B, Subseries B-6, 0.04% 20341 | 2,700 | 2,700 |
| State of California, Econ. Recovery Bonds, Series 2004-C-4, JPMorgan Chase LOC, 0.04% 20231 | 4,500 | 4,500 |
| State of California, Health Facs. Fncg. Auth., Health Fac. Rev. Bonds (Catholic Healthcare West), Series 2005-H, Bank of America LOC, 0.05% 20351 | 5,450 | 5,450 |
| State of California, Pollution Control Fncg. Auth., Pollution Control Rev. Ref. Bonds (Pacific Gas and Electric Co.), Series 1996-E, JPMorgan Chase LOC, 0.04% 20261 | 1,500 | 1,500 |
State of California, Sacramento Municipal Utility Dist. Fncg. Auth., Electric Rev. Bonds, Series 2012-L,
US Bank LOC, 0.05% 20411 | 11,400 | 11,400 |
| State of Colorado, General Fund Tax and Rev. Anticipation Notes, Series 2014-A, 1.50% 6/26/2015 | 56,000 | 56,704 |
State of Connecticut, Health and Educational Facs. Auth., Rev. Bonds (Yale-New Haven Hospital Issue),
Series 2014-C, 0.04% 20251 | 10,000 | 10,000 |
State of District of Columbia, Demand Rev. Ref. Bonds (American University Issue), Series 2008,
JPMorgan Chase LOC, 0.08% 20381 | 3,750 | 3,750 |
| State of Florida, Sarasota County, Public Hospital Dist., Hospital Rev. Ref. Bonds (Sarasota Memorial Hospital Project), Series 2009-B, JPMorgan Chase LOC, 0.07% 20371 | 9,750 | 9,750 |
| State of Idaho, Tax Anticipation Notes, Series 2014, 2.00% 6/30/2015 | 8,550 | 8,699 |
| State of Illinois, City of Chicago, G.O. Ref. Bonds, Series 2007-E, Barclays Bank PLC LOC, 0.08% 20421 | 2,300 | 2,300 |
| State of Illinois, City of Chicago, G.O. Ref. Bonds, Series 2007-F, JPMorgan Chase LOC, 0.08% 20421 | 12,000 | 12,000 |
State of Illinois, Fin. Auth., Demand Rev. Bonds (University of Chicago Medical Center), Series 2009-E-1,
JPMorgan Chase LOC, 0.08% 20431 | 5,650 | 5,650 |
State of Illinois, Fin. Auth., Demand Rev. Bonds (University of Chicago Medical Center), Series 2010-B,
Wells Fargo LOC, 0.04% 20441 | 1,510 | 1,510 |
State of Illinois, Fin. Auth., Demand Rev. Bonds (University of Chicago Medical Center), Series 2011-B,
Wells Fargo LOC, 0.04% 20441 | 4,700 | 4,700 |
| State of Iowa, Fin. Auth., Demand Health Facs. Rev. Ref. Bonds (Health System), Series 2009-B, JPMorgan Chase LOC, 0.07% 20351 | 5,030 | 5,030 |
| State of Iowa, Fin. Auth., Demand Private College Rev. Ref. Bonds (Drake University Project), Series 2008, Wells Fargo Bank LOC, 0.07% 20311 | 935 | 935 |
State of Iowa, Fin. Auth., Health Facs. Rev. Bonds (Health System), Series 2009-A, JPMorgan
Chase LOC, 0.07% 20351 | 10,120 | 10,120 |
| State of Kentucky, Econ. Dev. Fin. Auth., Demand Hospital Rev. Ref. Bonds (Baptist Healthcare System Obligated Group), Series 2009-B-1, JPMorgan Chase LOC, 0.05% 20381 | 3,700 | 3,700 |
| State of Kentucky, Econ. Dev. Fin. Auth., Demand Hospital Rev. Ref. Bonds (Baptist Healthcare System Obligated Group), Series 2009-B-2, JPMorgan Chase LOC, 0.05% 20381 | 12,210 | 12,210 |
State of Louisiana, Industrial Dev. Board of the Parish of East Baton Rouge, Inc., Gulf Opportunity Zone
Rev. Bonds (ExxonMobil Project), Series 2010-B, 0.05% 20401 | 4,550 | 4,550 |
The Tax-Exempt Bond Fund of America — Page 57 of 60
| Short-term securities | Principal amount
(000) | Value
(000) |
| State of Louisiana, Parish of East Baton Rouge, Pollution Control Rev. Ref. Bonds (Exxon Project), Series 1989, 0.04% 20191 | $7,020 | $7,020 |
State of Louisiana, Parish of East Baton Rouge, Pollution Control Rev. Ref. Bonds (ExxonMobil Project),
Series 2010-A, 0.05% 20351 | 5,200 | 5,200 |
| State of Massachusetts, Health and Educational Facs. Auth., Demand Rev. Bonds (Dana Farber Cancer Institute Issue), Series 2008-L1, JPMorgan Chase LOC, 0.04% 20461 | 20,000 | 20,000 |
| State of Massachusetts, Health and Educational Facs. Auth., Rev. Bonds (Massachusetts Institute of Technology Issue), Series J-2, 0.05% 20311 | 15,070 | 15,070 |
State of Michigan, Fin. Auth., State Aid Rev. Notes (School Dist. of the City of Detroit),
Series 2013-C, 4.375% 8/20/2014 | 1,000 | 1,002 |
State of Minnesota, City of Rochester, Health Care Facs. Rev. Bonds (Mayo Foundation), Series 2002-B,
0.05% 20321 | 10,000 | 10,000 |
State of Minnesota, Housing and Redev. Auth. of the City of Saint Paul, Health Care System Demand
Rev. Bonds (Allina Health System), Series 2009-B-2, JPMorgan Chase LOC, 0.07% 20351 | 3,215 | 3,215 |
| State of Mississippi, Business Fin. Corp., Gulf Opportunity Zone Industrial Dev. Rev. Bonds (Chevron U.S.A. Inc. Project), Series 2007-B, 0.05% 20301 | 20,200 | 20,200 |
| State of Mississippi, Business Fin. Corp., Gulf Opportunity Zone Industrial Dev. Rev. Bonds (Chevron U.S.A. Inc. Project), Series 2007-E, 0.05% 20301 | 22,100 | 22,100 |
| State of Mississippi, Business Fin. Corp., Gulf Opportunity Zone Industrial Dev. Rev. Bonds (Chevron U.S.A. Inc. Project), Series 2009-A, 0.05% 20301 | 12,400 | 12,400 |
| State of Mississippi, Business Fin. Corp., Gulf Opportunity Zone Industrial Dev. Rev. Bonds (Chevron U.S.A. Inc. Project), Series 2009-F, 0.05% 20301 | 4,000 | 4,000 |
| State of Mississippi, Business Fin. Corp., Gulf Opportunity Zone Industrial Dev. Rev. Bonds (Chevron U.S.A. Inc. Project), Series 2009-G, 0.04% 20301 | 2,300 | 2,300 |
| State of Mississippi, Business Fin. Corp., Gulf Opportunity Zone Industrial Dev. Rev. Bonds (Chevron U.S.A. Inc. Project), Series 2010-G, 0.04% 20351 | 2,400 | 2,400 |
| State of Mississippi, Business Fin. Corp., Gulf Opportunity Zone Industrial Dev. Rev. Bonds (Chevron U.S.A. Inc. Project), Series 2010-H, 0.04% 20351 | 1,100 | 1,100 |
| State of Mississippi, Business Fin. Corp., Gulf Opportunity Zone Industrial Dev. Rev. Bonds (Chevron U.S.A. Inc. Project), Series 2010-K, 0.05% 20351 | 14,100 | 14,100 |
| State of Mississippi, Business Fin. Corp., Gulf Opportunity Zone Industrial Dev. Rev. Bonds (Chevron U.S.A. Inc. Project), Series 2010-L, 0.04% 20351 | 1,275 | 1,275 |
| State of Mississippi, Business Fin. Corp., Gulf Opportunity Zone Industrial Dev. Rev. Bonds (Chevron U.S.A. Inc. Project), Series 2010-L, 0.05% 20351 | 1,780 | 1,780 |
| State of Mississippi, Business Fin. Corp., Gulf Opportunity Zone Industrial Dev. Rev. Bonds(Chevron U.S.A. Inc. Project), Series 2007-A, 0.05% 20301 | 18,800 | 18,800 |
State of Mississippi, Jackson County, Pollution Control Rev. Ref. Bonds (Chevron U.S.A. Inc. Project),
Series 1992, 0.05% 20161 | 1,200 | 1,200 |
State of Mississippi, Jackson County, Port Fac. Rev. Ref. Bonds (Chevron U.S.A. Inc. Project),
Series 1993, 0.04% 20231 | 5,430 | 5,430 |
State of Missouri, Health and Educational Facs. Auth., Demand Educational Facs. Rev. Bonds
(Washington University), Series 2000-C, 0.04% 20401 | 4,300 | 4,300 |
State of Missouri, Health and Educational Facs. Auth., Demand Educational Facs. Rev. Bonds
(Washington University), Series 2004-A, 0.05% 20341 | 3,455 | 3,455 |
State of Missouri, Health and Educational Facs. Auth., Demand Educational Facs. Rev. Bonds
(Washington University), Series 2004-B, 0.05% 20341 | 8,800 | 8,800 |
| State of Montana, Fac. Fin. Auth., Demand Rev. Bonds (Sisters of Charity of Leavenworth Health System), Series 2003, 0.08% 20251 | 2,260 | 2,260 |
State of New Hampshire, Health and Education Facs. Auth., Rev. Ref. Bonds (Dartmouth College Issue),
Series 2007-A, 0.08% 20311 | 4,600 | 4,600 |
State of New Hampshire, Health and Education Facs. Auth., Rev. Ref. Bonds (Dartmouth College Issue),
Series 2007-B, 0.04% 20411 | 7,200 | 7,200 |
State of New Jersey, Health Care Facs. Fin. Auth., Rev. Bonds (Virtua Health Issue), Series 2009-B,
JPMorgan Chase LOC, 0.05% 20431 | 8,600 | 8,600 |
The Tax-Exempt Bond Fund of America — Page 58 of 60
| Short-term securities | Principal amount
(000) | Value
(000) |
| State of New Jersey, Health Care Facs. Fncg. Auth., Rev. Ref. Bonds, Series 2006-A-4, Wells Fargo & Co. LOC, 0.05% 20271 | $4,000 | $4,000 |
| State of New Jersey, South Jersey Transportation Auth.,Transportation System Rev. Bonds, Series 2009-A-4, 0.05% 20391 | 9,920 | 9,920 |
State of New Jersey, Transportation Trust Fund Auth., Transportation System Bonds, Series 2009-C,
0.06% 20321 | 6,250 | 6,250 |
| State of New York, City of New York, G.O. Bonds, Fiscal 1993 Series A-7, JPMorgan Chase LOC, 0.06% 20201 | 5,500 | 5,500 |
| State of New York, City of New York, G.O. Bonds, Fiscal 1999 Series B-2, JPMorgan Chase LOC, 0.05% 20231 | 1,550 | 1,550 |
| State of New York, City of New York, G.O. Bonds, Fiscal 2008 Series L, Subseries L-4, 0.06% 20381 | 12,000 | 12,000 |
| State of New York, City of New York, G.O. Bonds, Fiscal 2012 Series G, Subseries G-5, 0.04% 20421 | 3,000 | 3,000 |
| State of New York, Dormitory Auth., Rev. Bonds (St. John’s University), Series 2008-B-1, Bank of America LOC, 0.08% 20341 | 9,715 | 9,715 |
State of New York, Housing Fin. Agcy, Gotham West Housing Fin. Agcy. Rev. Bonds, Series 2011-A-1,
Wells Fargo & Co. LOC, 0.05% 20451 | 8,535 | 8,535 |
State of New York, Housing Fin. Agcy., 2180 Broadway Housing Rev. Bonds, Series 2011-A,
Wells Fargo Bank LOC, 0.05% 20441 | 10,000 | 10,000 |
State of New York, New York City, Municipal Water Fin. Auth., Water and Sewer System Rev. Ref. Bonds,
Fiscal 2003 Series A, Subseries F-1-A, 0.05% 20351 | 10,000 | 10,000 |
| State of New York, New York City, Transitional Fin. Auth., New York City Recovery Bonds, Fiscal Series 2003-1, Subseries 1-C, 0.06% 20221 | 7,940 | 7,940 |
| State of New York, Trust for Cultural Resources of the City of New York, Rev. Ref. Bonds (Lincoln Center for the Performing Arts, Inc.), Series 2008-A-1, JPMorgan Chase LOC, 0.05% 20351 | 4,155 | 4,155 |
| State of North Carolina, Charlotte-Mecklenburg Hospital Auth., Carolinas HealthCare System, Health Care Rev. Ref. Bonds, Series 2007-B, Wells Fargo Bank LOC, 0.04% 20451 | 4,200 | 4,200 |
| State of Oregon, Full Faith and Credit Tax Anticipation Notes, Series 2014-A, 2.00% 6/15/2015 | 14,850 | 15,093 |
| State of South Carolina, Educational Facs. Auth. for Private Nonprofit Institutions of Higher Learning, Rev. Ref. Improvement Bonds (Anderson College Project), Series 2004-A, Bank of America LOC, 0.09% 20251 | 1,200 | 1,200 |
| State of South Carolina, North Charleston Public Facs. Corp. Ref. Certs. of Part. (Convention Center Complex Projects), Series 2005, Bank of America LOC, 0.06% 20191 | 3,595 | 3,595 |
| State of Tennessee, Public Building Auth. of the City of Clarksville, Pooled Fncg. Rev. Bonds, Series 2003, Bank of America LOC, 0.08% 20331 | 770 | 770 |
| State of Tennessee, Public Building Auth. of the City of Clarksville, Pooled Fncg. Rev. Bonds, Series 2004, Bank of America LOC, 0.08% 20341 | 1,715 | 1,715 |
| State of Tennessee, Public Building Auth. of the City of Clarksville, Pooled Fncg. Rev. Bonds, Series 2008, Bank of America LOC, 0.08% 20381 | 830 | 830 |
| State of Tennessee, Public Building Auth. of the County of Montgomery, Pooled Fncg. Rev. Bonds (Tennessee County Loan Pool), Series 2002, Bank of America LOC, 0.08% 20321 | 3,400 | 3,400 |
| State of Tennessee, Public Building Auth. of the County of Montgomery, Pooled Fncg. Rev. Bonds (Tennessee County Loan Pool), Series 2004, Bank of America LOC, 0.08% 20341 | 1,035 | 1,035 |
| State of Texas, Harris County Cultural Education Facs. Fin. Corp., Special Facs. Rev. Ref. Bonds (Medical Center), Series 2008, Subseries 2008-B-2, JPMorgan Chase LOC, 0.07% 20311 | 2,700 | 2,700 |
| State of Texas, Harris County Cultural Education Facs. Fin. Corp., Special Facs. Rev. Ref. Bonds (Medical Center), Series 2008-A, JPMorgan Chase LOC, 0.07% 20311 | 2,900 | 2,900 |
| State of Texas, Harris County Cultural Education Facs. Fin. Corp., Special Facs. Rev. Ref. Bonds (Medical Center), Series 2008-B-1, JPMorgan Chase LOC, 0.07% 20311 | 9,030 | 9,030 |
State of Texas, Lower Neches Valley Auth., Industrial Dev. Corp. Rev. Bonds (ExxonMobil Project),
Series 2011, 0.04% 20381 | 21,800 | 21,800 |
| State of Texas, Tarrant County, Cultural Education Facs. Fin. Corp., Hospital Rev. Ref. Bonds (Methodist Hospitals of Dallas Project), Series 2008-A, JPMorgan Chase LOC, 0.05% 20411 | 5,500 | 5,500 |
| State of Texas, Tax and Rev. Anticipation Notes, Series 2013, 2.00% 8/28/2014 | 225,000 | 225,333 |
| State of Virginia, Industrial Dev. Auth. of Montgomery County, Rev. Ref. Bonds (Virginia Tech Foundation), Series 2005-A, Bank of America LOC, 0.06% 20351 | 615 | 615 |
The Tax-Exempt Bond Fund of America — Page 59 of 60
| Short-term securities | Principal amount
(000) | Value
(000) |
State of Wyoming, Sublette County, Pollution Control Rev. Bonds (Exxon Project), Series 1984,
0.04% 11/1/20141 | $9,500 | $9,500 |
State of Wyoming, Uinta County, Pollution Control Rev. Ref. Bonds (Chevron U.S.A. Inc. Project),
Series 1993, 0.04% 20201 | 19,520 | 19,520 |
| Total short-term securities (cost: $882,640,000) | | 882,679 |
| Total investment securities 99.34% (cost: $8,752,154,000) | | 9,264,150 |
| Other assets less liabilities 0.66% | | 61,625 |
| Net assets 100.00% | | $9,325,775 |
| 1 | Coupon rate may change periodically. For short-term securities, the date of the next scheduled coupon rate change is considered to be the maturity date. |
| 2 | Acquired in a transaction exempt from registration under Rule 144A of the Securities Act of 1933. May be resold in the U.S. in transactions exempt from registration, normally to qualified institutional buyers. The total value of all such securities was $113,731,000, which represented 1.22% of the net assets of the fund. |
| 3 | Principal payments may be made periodically. Therefore, the effective maturity date may be earlier than the stated maturity date. |
| 4 | Step bond; coupon rate will increase at a later date. |
| 5 | Scheduled interest and/or principal payment was not received. |
| Key to abbreviations |
| Agcy. = Agency |
| Auth. = Authority |
| Certs. of Part. = Certificates of Participation |
| Dept. = Department |
| Dev. = Development |
| Dist. = District |
| Econ. = Economic |
| Fac. = Facility |
| Facs. = Facilities |
| Fin. = Finance |
| Fncg. = Financing |
| G.O. = General Obligation |
| LOC = Letter of Credit |
| Preref. = Prerefunded |
| Redev. = Redevelopment |
| Ref. = Refunding |
| Rev. = Revenue |
| TECP = Tax-Exempt Commercial Paper |
Investments are not FDIC-insured, nor are they deposits of or guaranteed by a bank or any other entity, so they may lose value.
Investors should carefully consider investment objectives, risks, charges and expenses. This and other important information is contained in the fund prospectus and summary prospectus, which can be obtained from your financial professional and should be read carefully before investing. You may also call American Funds Service Company (AFS) at (800) 421-4225 or visit the American Funds website at americanfunds.com.
| MFGEFPX-019-0914O-S42259 | The Tax-Exempt Bond Fund of America — Page 60 of 60 |
Report of Independent Registered Public Accounting Firm
To the Board of Trustees and Shareholders of American Funds Short-Term Tax-Exempt Bond Fund, Limited Term Tax-Exempt Bond Fund of America, The Tax-Exempt Bond Fund of America, American High-Income Municipal Bond Fund and The Tax-Exempt Fund of California
In our opinion, the accompanying statements of assets and liabilities, including the summary investment portfolios, and the related statements of operations and of changes in net assets and the financial highlights (included in Item 1 of this Form N-CSR) and the investment portfolios (included in Item 6 of this Form N-CSR) present fairly, in all material respects, the financial position of American Funds Short-Term Tax-Exempt Bond Fund, Limited Term Tax-Exempt Bond Fund of America, The Tax-Exempt Bond Fund of America, American High-Income Municipal Bond Fund and The Tax-Exempt Fund of California (the “Funds”) at July 31, 2014, the results of each of their operations for the year then ended, the changes in each of their net assets and the financial highlights for each of the periods presented (other than as noted below for The Tax-Exempt Fund of California), in conformity with accounting principles generally accepted in the United States of America. These financial statements, financial highlights, and investment portfolios (hereafter referred to as "financial statements") are the responsibility of the Funds’ management. Our responsibility is to express an opinion on these financial statements based on our audits. We conducted our audits of these financial statements in accordance with the standards of the Public Company Accounting Oversight Board (United States). Those standards require that we plan and perform the audit to obtain reasonable assurance about whether the financial statements are free of material misstatement. An audit includes examining, on a test basis, evidence supporting the amounts and disclosures in the financial statements, assessing the accounting principles used and significant estimates made by management, and evaluating the overall financial statement presentation. We believe that our audits, which included confirmation of securities at July 31, 2014 by correspondence with the custodians and brokers, provide a reasonable basis for our opinion. The financial statements of The Tax-Exempt Fund of California as of July 31, 2013, and for the fiscal years ended through July 31, 2013 as appearing herein, were audited by other auditors whose report dated September 9, 2013, expressed an unqualified opinion on those statements.
PricewaterhouseCoopers LLP
Los Angeles, California
September 9, 2014
ITEM 7 – Disclosure of Proxy Voting Policies and Procedures for Closed-End Management Investment Companies
Not applicable to this Registrant, insofar as the Registrant is not a closed-end management investment company.
ITEM 8 – Portfolio Managers of Closed-End Management Investment Companies
Not applicable to this Registrant, insofar as the Registrant is not a closed-end management investment company.
ITEM 9 – Purchases of Equity Securities by Closed-End Management Investment Company and Affiliated Purchasers
Not applicable to this Registrant, insofar as the Registrant is not a closed-end management investment company.
ITEM 10 – Submission of Matters to a Vote of Security Holders
There have been no material changes to the procedures by which shareholders may recommend nominees to the Registrant’s board of trustees since the Registrant last submitted a proxy statement to its shareholders. The procedures are as follows. The Registrant has a nominating and governance committee comprised solely of persons who are not considered ‘‘interested persons’’ of the Registrant within the meaning of the Investment Company Act of 1940, as amended. The committee periodically reviews such issues as the board’s composition, responsibilities, committees, compensation and other relevant issues, and recommends any appropriate changes to the full board of trustees. While the committee normally is able to identify from its own resources an ample number of qualified candidates, it will consider shareholder suggestions of persons to be considered as nominees to fill future vacancies on the board. Such suggestions must be sent in writing to the nominating and governance committee of the Registrant, c/o the Registrant’s Secretary, and must be accompanied by complete biographical and occupational data on the prospective nominee, along with a written consent of the prospective nominee for consideration of his or her name by the nominating and governance committee.
ITEM 11 – Controls and Procedures
| (a) | The Registrant’s Principal Executive Officer and Principal Financial Officer have concluded, based on their evaluation of the Registrant’s disclosure controls and procedures (as such term is defined in Rule 30a-3 under the Investment Company Act of 1940), that such controls and procedures are adequate and reasonably designed to achieve the purposes described in paragraph (c) of such rule. |
| | |
| (b) | There were no changes in the Registrant’s internal controls over financial reporting (as defined in Rule 30a-3(d) under the Investment Company Act of 1940) that occurred during the Registrant’s second fiscal quarter of the period covered by this report that has materially affected, or is reasonably likely to materially affect, the Registrant’s internal control over financial reporting. |
ITEM 12 – Exhibits
| (a)(1) | The Code of Ethics that is the subject of the disclosure required by Item 2 is attached as an exhibit hereto. |
| | |
| (a)(2) | The certifications required by Rule 30a-2 of the Investment Company Act of 1940 and Sections 302 and 906 of the Sarbanes-Oxley Act of 2002 are attached as exhibits hereto. |
SIGNATURES
Pursuant to the requirements of the Securities Exchange Act of 1934 and the Investment Company Act of 1940, the Registrant has duly caused this report to be signed on its behalf by the undersigned, thereunto duly authorized.
| | THE TAX-EXEMPT BOND FUND OF AMERICA |
| | |
| | By /s/ Neil L. Langberg |
| | Neil L. Langberg, President and Principal Executive Officer |
| | |
| | Date: September 30, 2014 |
Pursuant to the requirements of the Securities Exchange Act of 1934 and the Investment Company Act of 1940, this report has been signed below by the following persons on behalf of the Registrant and in the capacities and on the dates indicated.
| By /s/ Neil L. Langberg |
Neil L. Langberg, President and Principal Executive Officer |
| |
| Date: September 30, 2014 |
| By /s/ Karl C. Grauman |
Karl C. Grauman, Treasurer and Principal Financial Officer |
| |
| Date: September 30, 2014 |