
| |  | The Tax-Exempt Fund
of Maryland®
The Tax-Exempt Fund
of Virginia®
Semi-annual reports
for the six months ended
January 31, 2016 |
The Tax-Exempt Fund of Maryland seeks to provide you with a high level of current income exempt from regular federal and Maryland state income taxes. Its secondary objective is preservation of capital.
The Tax-Exempt Fund of Virginia seeks to provide you with a high level of current income exempt from regular federal and Virginia state income taxes. Its secondary objective is preservation of capital.
These funds are two of more than 40 offered by one of the nation’s largest mutual fund families, American Funds, from Capital Group. For more than 80 years, Capital has invested with a long-term focus based on thorough research and attention to risk.
Fund results shown in this report, unless otherwise indicated, are for Class A shares at net asset value. If a sales charge (maximum 3.75%) had been deducted, the results would have been lower. Results are for past periods and are not predictive of results for future periods. Current and future results may be lower or higher than those shown. Share prices and returns will vary, so investors may lose money. Investing for short periods makes losses more likely. Investments are not FDIC-insured, nor are they deposits of or guaranteed by a bank or any other entity, so they may lose value. For current information and month-end results, visit americanfunds.com.
Here are the average annual total returns on a $1,000 investment with all distributions reinvested for periods ended December 31, 2015 (the most recent calendar quarter-end):
| Class A shares | | 1 year | | 5 years | | 10 years |
| | | | | | | | | | | | | |
| Reflecting 3.75% maximum sales charge | | | | | | | | | | | | |
| The Tax-Exempt Fund of Maryland | | | –1.83 | % | | | 3.41 | % | | | 3.08 | % |
| The Tax-Exempt Fund of Virginia | | | –1.64 | | | | 3.45 | | | | 3.31 | |
| At net asset value | | | | | | | | | | | | |
| The Tax-Exempt Fund of Maryland | | | 2.03 | | | | 4.20 | | | | 3.48 | |
| The Tax-Exempt Fund of Virginia | | | 2.18 | | | | 4.24 | | | | 3.70 | |
For other share class results, visit americanfunds.com.
The total annual fund operating expense ratios were 0.69% for The Tax-Exempt Fund of Maryland and 0.66% for The Tax-Exempt Fund of Virginia for Class A shares as of the prospectus dated October 1, 2015.
Investment results assume all distributions are reinvested and reflect applicable fees and expenses. When applicable, investment results reflect fee waivers, without which results would have been lower. Visit americanfunds.com for more information.
All investments are subject to certain risks. The value of shares of the funds will fluctuate as interest rates change. Bond funds carry the risks of the securities in which they invest, such as inflation, interest rate fluctuations and credit or default risk. The return of principal for bond funds is not guaranteed. Additionally, each fund is more susceptible to factors adversely affecting issuers of its state’s tax-exempt securities than a more widely diversified municipal bond fund. Bond ratings, which typically range from AAA/Aaa (highest) to D (lowest), are assigned by credit rating agencies such as Standard & Poor’s, Moody’s and/or Fitch as an indication of an issuer’s creditworthiness. Income may be subject to federal alternative minimum taxes. Certain other income, as well as capital gain distributions, may be taxable. Refer to the fund prospectus and the Risk Factors section of this report for more information on these and other risks associated with investing in the funds.
Fellow investors:
We are pleased to present you with this semi-annual report for The Tax-Exempt Fund of Maryland and The Tax-Exempt Fund of Virginia. This report covers results from August 1, 2015, through January 31, 2016.
Municipal bond prices advanced steadily throughout the first half of the funds’ fiscal year, as investors began to shift their focus from an impending increase in U.S. interest rates to geopolitical conflicts, slowing global growth and falling energy prices. Against this backdrop, both funds delivered solid gains. The table below highlights the funds’ total returns against their respective indexes (the Barclays Maryland Municipal Index and the Barclays Virginia Municipal Index) and peer-group averages (the Lipper Maryland Municipal Debt Funds Average and the Lipper Virginia Municipal Debt Funds Average).
For the six-month period, The Tax-Exempt Fund of Maryland (the Maryland fund) and The Tax-Exempt Fund of Virginia (the Virginia fund) had total returns of 2.56% and 2.80%, respectively, with all dividends reinvested, which were below their peer group averages.
While lagging their respective indexes for this six-month period, the funds are ahead of their peers for the past year and have kept pace with their peer-group averages over five- and 10-year periods. The Maryland fund distributed tax-free income dividends of approximately 24 cents a share, and the Virginia fund approximately 25 cents a share for this six-month period. Neither fund made capital gain distributions.
During the period, the Maryland fund’s tax-exempt income return, with dividends reinvested, was 1.54%, which is equivalent to a 2.99% taxable return for those in the highest combined federal, state and local tax bracket of 48.47%. If dividends were taken in cash, the income return was 1.53%, the equivalent of a 2.98% taxable income return.
For the same period, the Virginia fund’s tax-exempt income return, with dividends reinvested, was 1.48%, which is equivalent to a 2.77% taxable return for those in the highest combined federal and state tax bracket of 46.65%. If dividends were taken in cash, the income return was 1.47%, the equivalent of a 2.75% taxable income return.
Results at a glance
For periods ended January 31, 2016, with all distributions reinvested
| | | Cumulative | | Average annual |
| | | total returns | | total returns |
| | | 6 months | | 1 year | | 5 years | | 10 years |
| | | | | | | | | | | | | | | | | |
| The Tax-Exempt Fund of Maryland (Class A shares) | | | 2.56 | % | | | 1.71 | % | | | 4.56 | % | | | 3.54 | % |
| Barclays Maryland Municipal Index* | | | 3.16 | | | | 2.43 | | | | 4.50 | | | | 4.41 | |
| Lipper Maryland Municipal Debt Funds Average | | | 2.86 | | | | 1.41 | | | | 4.45 | | | | 3.56 | |
| The Tax-Exempt Fund of Virginia (Class A shares) | | | 2.80 | | | | 1.69 | | | | 4.62 | | | | 3.77 | |
| Barclays Virginia Municipal Index* | | | 3.44 | | | | 2.76 | | | | 4.86 | | | | 4.54 | |
| Lipper Virginia Municipal Debt Funds Average | | | 3.10 | | | | 1.27 | | | | 4.69 | | | | 3.64 | |
| * | The market indexes are unmanaged and, therefore, have no expenses. Investors cannot invest directly in an index. |
| The American Funds Tax-Exempt Series I | 1 |
Economic and market overview
Municipal bond market returns were broadly positive over the reporting period. In fact, January marked the seventh consecutive month of gains for the Barclays Municipal Bond Index, a broad measure of the investment-grade (bonds rated BBB/ Baa and above) municipal market.
This strength could be attributed to a number of factors. Equity markets were volatile. The unmanaged Standard & Poor’s 500 Composite Index, a market capitalization-weighted index based on the results of 500 widely held common stocks, slid 6.77% for the six months ended January 31, 2016. Uneasy investors turned to higher quality fixed-income securities for their potential to provide relative stability. The yield on 10-year U.S. Treasury bonds fell from 2.20% on July 31, 2015, to 1.94% at the close of the period. Tax-exempt bonds delivered some of the strongest returns. The Barclays Municipal Bond Index was up 3.66%, compared to a 2.11% gain for the Barclays U.S. Treasury Index.
Record-low oil prices and China’s economic woes did have an adverse impact on some areas of the taxable bond market, particularly among high-yield taxable bonds. However, this was not the case in the tax-exempt bond market. In fact, the current low cost of oil can be helpful to some areas of the tax-exempt market. Consider, for example, revenue bonds supporting infrastructure projects that can be driven by low fuel costs, like toll roads and bridges, which benefit from higher volumes of traffic.
After maintaining its federal funds rate near 0% since 2006, the Federal Reserve in December increased it to a target range of .25% to .50%. Investors had been anticipating this move for several months, and there was little immediate impact on the bond markets.
Strong inflows into municipal bond mutual funds and relatively low issuance also facilitated an increase in bond prices. Broadly speaking, the fiscal health of municipal issuers continues to improve with a few exceptions, most notably Puerto Rico. Recently, government officials indicated that principal and interest payments on some bonds may be suspended so that essential services will not be jeopardized. We remind investors that Puerto Rico’s unique challenges have little bearing on the health of the thousands of other issuers in the diverse municipal bond market.
In general, municipal bonds of lower credit quality outgained those of higher rated issuers, and longer term bonds tended to outpace those with shorter maturities. Given the moderate growth of the U.S. economy and the Fed’s expected rate hike last December, the Maryland and Virginia funds took a conservative stance, maintaining relatively short duration positions over the six months. While we are pleased with the funds’ overall results and how the funds are positioned heading into the second half of the fiscal year, this conservative approach proved to be a drag on returns in relative terms.
Looking ahead
The factors that have triggered greater volatility in equity markets and some areas of the taxable bond market play a much smaller role in the municipal bond market.
| 2 | The American Funds Tax-Exempt Series I |
Slowing global growth has primarily affected issuers in the energy sector or those that generate revenues in non-U.S. currencies. These largely have been issuers in the taxable bond market.
In spite of market volatility, the U.S. economy remains among the strongest in the world. The Fed has indicated that there will be further rate hikes, but faced with ongoing economic challenges, there seems to be little certainty as to when that might happen.
In this environment, we are paying close attention to risk as we seek out investments that can add value for our investors. While valuations are richer today than they were at the start of the fiscal year, we believe we are finding solid investment opportunities at reasonable prices.
Proposed reorganizations
On March 17, 2016, the board of trustees unanimously determined that the mergers of the Maryland fund and the Virginia fund into The Tax-Exempt Bond Fund of America® would be in the best interests of the funds. The proposed mergers of the Maryland fund and the Virginia fund are each subject to approval by the applicable fund’s shareholders. As a shareholder of either the Maryland or Virginia fund, you should expect to receive proxy materials regarding the proposed mergers in late April 2016. These materials will provide further information regarding The Tax-Exempt Bond Fund of America and the proposed mergers and will request your votes on the mergers. If approved, the mergers are expected to occur on or about June 17, 2016.
Sincerely,
 | |  |
| Paul F. Roye | | Brenda S. Ellerin |
| Vice Chairman of the Board | | President |
| | | |
| March 17, 2016 | | |
For current information about the funds, visit americanfunds.com.
The funds’ 30-day yields for Class A shares as of February 29, 2016, calculated in accordance with the U.S. Securities and Exchange Commission (SEC) formula, were 1.47% for The Tax-Exempt Fund of Maryland and 1.12% for The Tax-Exempt Fund of Virginia. (For investors in the 48.47% Maryland tax bracket and the 46.65% Virginia tax bracket, this is equivalent to taxable yields of 2.85% for The Tax-Exempt Fund of Maryland and 2.10% for The Tax-Exempt Fund of Virginia.) The funds’ 12-month distribution rates for Class A shares as of that date were 3.00% and 2.83%, respectively. All figures reflect the 3.75% maximum sales charge. The SEC yield reflects the rate at which each fund is earning income on its current portfolio of securities while the distribution rate reflects the funds’ past dividends paid to shareholders. Accordingly, the funds’ SEC yields and distribution rates may differ.
| The American Funds Tax-Exempt Series I | 3 |
The Tax-Exempt Fund of Maryland
| Summary investment portfolio January 31, 2016 | unaudited |
| | |
| Portfolio quality summary* | Percent of net assets |
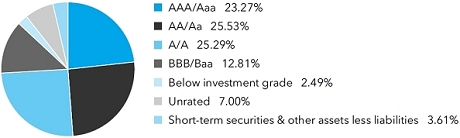
| * | Bond ratings, which typically range from AAA/Aaa (highest) to D (lowest), are assigned by credit rating agencies such as Standard & Poor’s, Moody’s and/or Fitch as an indication of an issuer’s creditworthiness. In assigning a credit rating to a security, the fund looks specifically to the ratings assigned to the issuer of the security by Standard & Poor’s, Moody’s and/or Fitch. If agency ratings differ, the security will be considered to have received the highest of those ratings, consistent with the fund’s investment policies. Securities in the “unrated” category (above) have not been rated by a rating agency; however, the investment adviser performs its own credit analysis and assigns comparable ratings that are used for compliance with the fund’s investment policies. |
| Bonds, notes & other debt instruments 96.39% | | Principal amount
(000) | | | Value
(000) | |
| Maryland 87.28% | | | | | | | | |
| State issuers 49.19% | | | | | | | | |
| Community Dev. Administration, Dept. of Housing and Community Dev., Housing Rev. Bonds, Series 2015-B, 4.05% 2040 | | $ | 2,500 | | | $ | 2,572 | |
| Community Dev. Administration, Dept. of Housing and Community Dev., Residential Rev. Bonds, Series 2014-B, AMT, 3.25% 2044 | | | 1,990 | | | | 2,109 | |
| Community Dev. Administration, Dept. of Housing and Community Dev., Residential Rev. Ref. Bonds, Series 2015-A, 3.50% 2045 | | | 3,340 | | | | 3,588 | |
| Community Dev. Administration, Dept. of Housing and Community Dev., Residential Rev. Ref. Bonds, Series 2014-D, AMT, 4.00% 2036 | | | 2,990 | | | | 3,231 | |
| Community Dev. Administration, Dept. of Housing and Community Dev., Residential Rev. Ref. Bonds, Series D, AMT, 4.65% 2022 | | | 1,000 | | | | 1,029 | |
| Community Dev. Administration, Dept. of Housing and Community Dev., Single-family Housing Rev. Bonds, Series 2011-B, 4.00% 2027 | | | 830 | | | | 860 | |
| Econ. Dev. Corp., Senior Student Housing Rev. Ref. Bonds (University of Maryland, Baltimore Project), Series 2015, 5.00% 2035 | | | 1,000 | | | | 1,088 | |
| Econ. Dev. Corp., Senior Student Housing Rev. Ref. Bonds (University of Maryland, Baltimore Project), Series 2015, 5.00% 2039 | | | 2,605 | | | | 2,804 | |
| Econ. Dev. Corp., Student Housing Rev. Bonds (Towson University Project), Series 2007-A, 5.25% 2024 | | | 1,000 | | | | 1,059 | |
| Econ. Dev. Corp., Student Housing Rev. Bonds (Towson University Project), Series 2007-A, 5.25% 2037 | | | 3,265 | | | | 3,416 | |
| Econ. Dev. Corp., Student Housing Rev. Bonds (Towson University Project), Series 2012, 5.00% 2027 | | | 700 | | | | 779 | |
| 4 | The American Funds Tax-Exempt Series I |
| | | Principal amount
(000) | | | Value
(000) | |
| Econ. Dev. Corp., Student Housing Rev. Bonds (Towson University Project), Series 2012, 5.00% 2029 | | $ | 250 | | | $ | 276 | |
| Econ. Dev. Corp., Student Housing Rev. Bonds (University of Maryland, College Park Projects), Series 2008, 5.80% 2038 | | | 3,000 | | | | 3,237 | |
| Econ. Dev. Corp., Student Housing Rev. Bonds (University of Maryland, College Park Projects), Series 2008, 5.875% 2043 | | | 950 | | | | 1,027 | |
| Econ. Dev. Corp., Student Housing Rev. Ref. Bonds (Morgan State University Project), Series 2012, 5.00% 2034 | | | 2,930 | | | | 3,136 | |
| Econ. Dev. Corp., Student Housing Rev. Ref. Bonds (University of Maryland, College Park Projects), Series 2006, Assured Guaranty insured, 5.00% 2021 | | | 1,000 | | | | 1,014 | |
| Econ. Dev. Corp., Student Housing Rev. Ref. Bonds (University of Maryland, College Park Projects), Series 2006, Assured Guaranty insured, 5.00% 2026 | | | 1,000 | | | | 1,013 | |
| Econ. Dev. Corp., Utility Infrastructure Rev. Ref. Bonds (University of Maryland, College Park Project), Series 2011, 5.00% 2018 | | | 3,000 | | | | 3,273 | |
| Econ. Dev. Corp., Student Housing Rev. Ref. Bonds (Bowie State University Project), Series 2015, 5.00% 20331 | | | 2,540 | | | | 2,660 | |
| G.O. Bonds, State and Local Facs., Second Series, 5.00% 2016 | | | 1,070 | | | | 1,094 | |
| G.O. Bonds, State and Local Facs. Loan of 2008, Second Series, 5.00% 2021 (preref. 2018) | | | 2,000 | | | | 2,206 | |
| G.O. Bonds, State and Local Facs. Loan of 2009, Second Series B, 5.00% 2020 | | | 3,000 | | | | 3,444 | |
| G.O. Bonds, State and Local Facs. Loan of 2011, Second Series B, 5.00% 2023 (preref. 2019) | | | 2,000 | | | | 2,282 | |
| G.O. Bonds, State and Local Facs., First Series 2012- C, 4.00% 2016 | | | 1,000 | | | | 1,020 | |
| G.O. Ref. Bonds, State and Local Facs. Loan of 2010, First Series B, 5.00% 2022 | | | 2,000 | | | | 2,317 | |
| Health and Higher Educational Facs. Auth., Rev. Bonds (Carroll Hospital Center Issue), Series 2006, 5.00% 2036 | | | 1,500 | | | | 1,529 | |
| Health and Higher Educational Facs. Auth., Rev. Bonds (LifeBridge Health Issue), 5.00% 2040 | | | 1,000 | | | | 1,146 | |
| Health and Higher Educational Facs. Auth., Rev. Bonds (LifeBridge Health Issue), 5.00% 2047 | | | 2,000 | | | | 2,271 | |
| Health and Higher Educational Facs. Auth., Rev. Bonds (LifeBridge Health Issue), Assured Guaranty insured, 5.00% 2020 | | | 2,320 | | | | 2,461 | |
| Health and Higher Educational Facs. Auth., Rev. Bonds (LifeBridge Health Issue), Assured Guaranty insured, 5.00% 2020 (preref. 2017) | | | 390 | | | | 415 | |
| Health and Higher Educational Facs. Auth., Rev. Bonds (LifeBridge Health Issue), Assured Guaranty insured, 5.00% 2028 | | | 615 | | | | 645 | |
| Health and Higher Educational Facs. Auth., Rev. Bonds (LifeBridge Health Issue), Assured Guaranty insured, 5.00% 2028 (preref. 2017) | | | 385 | | | | 409 | |
| Health and Higher Educational Facs. Auth., Rev. Bonds (LifeBridge Health Issue), Series 2011, 5.50% 2026 | | | 700 | | | | 819 | |
| Health and Higher Educational Facs. Auth., Rev. Bonds (LifeBridge Health Issue), Series 2011, 5.75% 2031 | | | 2,000 | | | | 2,318 | |
| Health and Higher Educational Facs. Auth., Rev. Bonds (LifeBridge Health Issue), Series 2011, 6.00% 2025 | | | 425 | | | | 513 | |
| The American Funds Tax-Exempt Series I | 5 |
The Tax-Exempt Fund of Maryland
| Bonds, notes & other debt instruments (continued) | | Principal amount
(000) | | | Value
(000) | |
| Maryland (continued) | | | | | | | | |
| State issuers (continued) | | | | | | | | |
| Health and Higher Educational Facs. Auth., Rev. Bonds (Mercy Medical Center Issue), Series 2007-A, 5.00% 2032 | | $ | 2,000 | | | $ | 2,097 | |
| Health and Higher Educational Facs. Auth., Rev. Bonds (Peninsula Regional Medical Center Issue), Series 2006, 5.00% 2036 | | | 1,750 | | | | 1,784 | |
| Health and Higher Educational Facs. Auth., Rev. Bonds (Peninsula Regional Medical Center Issue), Series 2015, 5.00% 2045 | | | 1,350 | | | | 1,531 | |
| Health and Higher Educational Facs. Auth., Rev. Bonds (University of Maryland Medical System Issue), Series 2006-A, 5.00% 2036 | | | 1,000 | | | | 1,020 | |
| Health and Higher Educational Facs. Auth., Rev. Bonds (University of Maryland Medical System Issue), Series 2010, 5.00% 2034 | | | 1,000 | | | | 1,086 | |
| Health and Higher Educational Facs. Auth., Rev. Bonds (University of Maryland Medical System Issue), Series 2010, 5.25% 2024 | | | 1,240 | | | | 1,390 | |
| Health and Higher Educational Facs. Auth., Rev. Ref. Bonds (Anne Arundel Health System Issue), Series 2012, 4.00% 2034 | | | 1,000 | | | | 1,038 | |
| Health and Higher Educational Facs. Auth., Rev. Ref. Bonds (Anne Arundel Health System Issue), Series 2012, 5.00% 2021 | | | 800 | | | | 955 | |
| Health and Higher Educational Facs. Auth., Rev. Ref. Bonds (Anne Arundel Health System Issue), Series 2012, 5.00% 2027 | | | 400 | | | | 464 | |
| Health and Higher Educational Facs. Auth., Rev. Ref. Bonds (Anne Arundel Health System Issue), Series 2014, 5.00% 2039 | | | 2,000 | | | | 2,257 | |
| Health and Higher Educational Facs. Auth., Rev. Ref. Bonds (Carroll Hospital Center Issue), Series 2012-A, 5.00% 2037 | | | 1,500 | | | | 1,646 | |
| Health and Higher Educational Facs. Auth., Rev. Ref. Bonds (Edenwald Issue), Series 2006-A, 5.40% 2031 | | | 1,000 | | | | 1,021 | |
| Health and Higher Educational Facs. Auth., Rev. Ref. Bonds (Edenwald Issue), Series 2006-A, 5.40% 2037 | | | 1,500 | | | | 1,532 | |
| Health and Higher Educational Facs. Auth., Rev. Ref. Bonds (Edenwald Issue), Series 2015, 5.25% 2037 | | | 2,000 | | | | 2,264 | |
| Health and Higher Educational Facs. Auth., Rev. Ref. Bonds (LifeBridge Health Issue), Series 2008, Assured Guaranty insured, 4.75% 2038 | | | 1,000 | | | | 1,028 | |
| Health and Higher Educational Facs. Auth., Rev. Ref. Bonds (MedStar Health Issue), 5.00% 2042 | | | 3,500 | | | | 3,981 | |
| Health and Higher Educational Facs. Auth., Rev. Ref. Bonds (Mercy Medical Center Issue), Series 2012, 5.00% 2031 | | | 1,000 | | | | 1,088 | |
| Health and Higher Educational Facs. Auth., Rev. Ref. Bonds (Mercy Ridge Issue), Series 2007, 4.50% 2022 | | | 1,065 | | | | 1,096 | |
| Health and Higher Educational Facs. Auth., Rev. Ref. Bonds (Mercy Ridge Issue), Series 2007, 4.75% 2034 | | | 3,590 | | | | 3,661 | |
| Morgan State University, Public Higher Education Institution of the State of Maryland, Academic Fees and Auxiliary Facs. Fees Rev. Ref. Bonds, Series 2012, 5.00% 2021 | | | 230 | | | | 272 | |
| Morgan State University, Public Higher Education Institution of the State of Maryland, Academic Fees and Auxiliary Facs. Fees Rev. Ref. Bonds, Series 2012, 5.00% 2022 | | | 360 | | | | 433 | |
| Morgan State University, Public Higher Education Institution of the State of Maryland, Academic Fees and Auxiliary Facs. Fees Rev. Ref. Bonds, Series 2012, 5.00% 2023 | | | 320 | | | | 386 | |
| 6 | The American Funds Tax-Exempt Series I |
| | | Principal amount
(000) | | | Value
(000) | |
| Morgan State University, Public Higher Education Institution of the State of Maryland, Academic Fees and Auxiliary Facs. Fees Rev. Ref. Bonds, Series 2012, 5.00% 2024 | | $ | 600 | | | $ | 718 | |
| Morgan State University, Public Higher Education Institution of the State of Maryland, Academic Fees and Auxiliary Facs. Fees Rev. Ref. Bonds, Series 2012, 5.00% 2028 | | | 300 | | | | 348 | |
| Morgan State University, Public Higher Education Institution of the State of Maryland, Academic Fees and Auxiliary Facs. Fees Rev. Ref. Bonds, Series 2012, 5.00% 2030 | | | 150 | | | | 173 | |
| Morgan State University, Public Higher Education Institution of the State of Maryland, Academic Fees and Auxiliary Facs. Fees Rev. Ref. Bonds, Series 2012, 5.00% 2032 | | | 225 | | | | 257 | |
| Dept. of Transportation, Consolidated Transportation Bonds, Series 2002, 5.50% 2017 | | | 2,000 | | | | 2,102 | |
| Dept. of Transportation, Consolidated Transportation Bonds, Series 2007, 4.00% 2018 | | | 1,630 | | | | 1,692 | |
| Dept. of Transportation, Consolidated Transportation Bonds, Series 2008, 5.00% 2018 | | | 1,000 | | | | 1,088 | |
| Transportation Auth., Airport Parking Rev. Ref. Bonds (Baltimore/Washington International Thurgood Marshall Airport Projects), Series 2012-B, AMT, 5.00% 2021 | | | 2,000 | | | | 2,329 | |
| Transportation Auth., Airport Parking Rev. Ref. Bonds (Baltimore/Washington International Thurgood Marshall Airport Projects), Series 2012-B, AMT, 5.00% 2023 | | | 3,720 | | | | 4,370 | |
| Transportation Auth., Grant and Rev. Anticipation Bonds, Series 2007, 5.00% 2019 | | | 2,500 | | | | 2,623 | |
| Transportation Auth., Grant and Rev. Anticipation Bonds, Series 2008, 5.25% 2018 | | | 3,000 | | | | 3,285 | |
| Transportation Auth., Grant and Rev. Anticipation Bonds, Series 2008, 5.25% 2020 | | | 1,000 | | | | 1,131 | |
| Transportation Auth., Passenger Fac. Charge Rev. Bonds (Baltimore/Washington International Thurgood Marshall Airport), AMT, 5.00% 2020 | | | 2,165 | | | | 2,486 | |
| Transportation Auth., Passenger Fac. Charge Rev. Bonds (Baltimore/Washington International Thurgood Marshall Airport), Series 2012-B, AMT, 4.00% 2019 | | | 1,000 | | | | 1,087 | |
| Transportation Auth., Passenger Fac. Charge Rev. Bonds (Baltimore/Washington International Thurgood Marshall Airport), Series 2012-B, AMT, 4.00% 2020 | | | 1,515 | | | | 1,676 | |
| Transportation Auth., Passenger Fac. Charge Rev. Bonds (Baltimore/Washington International Thurgood Marshall Airport), Series 2014, AMT, Assured Guaranty Municipal insured, 3.00% 2024 | | | 500 | | | | 524 | |
| Transportation Auth., Passenger Fac. Charge Rev. Bonds (Baltimore/Washington International Thurgood Marshall Airport), Series 2014, AMT, Assured Guaranty Municipal insured, 3.50% 2028 | | | 1,500 | | | | 1,559 | |
| Transportation Auth., Transportation Facs. Projects Rev. Bonds, Series 2007, Assured Guaranty Municipal insured, 5.00% 2021 | | | 3,000 | | | | 3,190 | |
| The American Funds Tax-Exempt Series I | 7 |
The Tax-Exempt Fund of Maryland
| Bonds, notes & other debt instruments (continued) | | Principal amount
(000) | | | Value
(000) | |
| Maryland (continued) | | | | | | | | |
| State issuers (continued) | | | | | | | | |
| Transportation Auth., Transportation Facs. Projects Rev. Bonds, Series 2008, 5.00% 2020 | | $ | 1,545 | | | $ | 1,697 | |
| Transportation Auth., Transportation Facs. Projects Rev. Bonds, Series 2008, 5.00% 2023 | | | 3,140 | | | | 3,443 | |
| Transportation Auth., Transportation Facs. Projects Rev. Bonds, Series 2009-A, 5.00% 2020 | | | 1,000 | | | | 1,138 | |
| Transportation Auth., Transportation Facs. Projects Rev. Bonds, Series 2009-A, 5.00% 2021 | | | 1,000 | | | | 1,135 | |
| Transportation Auth., Transportation Facs. Projects Rev. Ref. Bonds, Series 2012, 4.00% 2026 | | | 1,000 | | | | 1,118 | |
| Water Quality Fncg. Administration, Revolving Loan Fund Rev. Bonds, Series 2008-A, 4.40% 2025 | | | 1,750 | | | | 1,872 | |
| Water Quality Fncg. Administration, Revolving Loan Fund Rev. Bonds, Series 2008-A, 5.00% 2021 | | | 1,245 | | | | 1,355 | |
| Other securities | | | | | | | 17,830 | |
| | | | | | | | 155,316 | |
| | | | | | | | | |
| City & county issuers 38.09% | | | | | | | | |
| Anne Arundel County, Special Obligation Bonds (National Business Park-North Project), Series 2010, 6.10% 2040 | | | 2,250 | | | | 2,388 | |
| Baltimore County, G.O. Bonds, Metropolitan Dist. Bonds (71st Issue), 4.625% 2028 | | | 1,500 | | | | 1,618 | |
| Baltimore County, Rev. Ref. Bonds (Oak Crest Village, Inc. Fac.), Series 2007-A, 5.00% 2022 | | | 2,600 | | | | 2,698 | |
| Baltimore County, Rev. Ref. Bonds (Oak Crest Village, Inc. Fac.), Series 2007-A, 5.00% 2037 | | | 2,000 | | | | 2,053 | |
| Mayor and City Council of Baltimore, G.O. Consolidated Public Improvement Bonds, Series 2008-A, 5.00% 2020 | | | 2,315 | | | | 2,580 | |
| Mayor and City Council of Baltimore, Project and Rev. Ref. Bonds (Water Projects), Series 1994-A, FGIC insured, 5.00% 2024 | | | 2,275 | | | | 2,546 | |
| Mayor and City Council of Baltimore, Project Rev. Bonds (Water Projects), Series 2011-A, 5.00% 2041 | | | 1,000 | | | | 1,155 | |
| Mayor and City Council of Baltimore, Rev. Bonds (Wastewater Projects), Series 2014-C, 5.00% 2032 | | | 2,000 | | | | 2,387 | |
| Mayor and City Council of Baltimore, Rev. Bonds (Water Projects), Series 2014-A, 5.00% 2044 | | | 1,500 | | | | 1,726 | |
| Mayor and City Council of Baltimore, Rev. Ref. Bonds (Wastewater Projects), Series 2014, 5.00% 2039 | | | 3,215 | | | | 3,729 | |
| Carroll County, G.O. Bonds, Consolidated Public Improvement Bonds of 2008, 5.00% 2021 | | | 2,800 | | | | 3,123 | |
| Frederick County, G.O. Public Facs. Bonds of 2008, 5.00% 2021 (preref. 2018) | | | 2,005 | | | | 2,204 | |
| Frederick County, G.O. Public Facs. Bonds of 2008, 5.00% 2024 (preref. 2018) | | | 1,000 | | | | 1,099 | |
| Frederick County, Special Obligation Bonds (Urbana Community Dev. Auth.), Series 2010-A, 5.00% 2023 | | | 1,500 | | | | 1,733 | |
| Frederick County, Special Obligation Bonds (Urbana Community Dev. Auth.), Series 2010-A, 5.00% 2024 | | | 1,000 | | | | 1,152 | |
| 8 | The American Funds Tax-Exempt Series I |
| | | Principal amount
(000) | | | Value
(000) | |
| Frederick County, Special Obligation Bonds (Urbana Community Dev. Auth.), Series 2010-A, 5.00% 2030 | | $ | 3,000 | | | $ | 3,406 | |
| City of Gaithersburg, Econ. Dev. Rev. Ref. Bonds (Asbury Maryland Obligated Group), Series 2006-A, 5.125% 2026 | | | 1,000 | | | | 1,021 | |
| City of Gaithersburg, Econ. Dev. Rev. Ref. Bonds (Asbury Maryland Obligated Group), Series 2006-A, 5.125% 2036 | | | 1,500 | | | | 1,523 | |
| City of Gaithersburg, Econ. Dev. Rev. Ref. Bonds (Asbury Maryland Obligated Group), Series 2009-B, 6.00% 2023 | | | 1,750 | | | | 1,975 | |
| Howard County Special Obligation Bonds (Annapolis Junction Town Center Project), Series 2014, 6.10% 2044 | | | 1,420 | | | | 1,540 | |
| Howard County, G.O. Consolidated Public Improvement Bonds, Series 2009-A, 5.00% 2023 | | | 2,970 | | | | 3,356 | |
| City of Hyattsville, Special Obligation Bonds (University Town Center Project), Series 2004, 5.75% 2034 | | | 3,650 | | | | 3,680 | |
| Montgomery County Housing Opportunities Commission, Multi-family Housing Dev. Bonds, Series 2004-A, 4.65% 2030 | | | 2,670 | | | | 2,674 | |
| Montgomery County Housing Opportunities Commission, Multi-family Housing Dev. Bonds, Series 2007-A, AMT, 4.55% 2027 | | | 2,000 | | | | 2,019 | |
| Montgomery County Housing Opportunities Commission, Multi-family Housing Dev. Bonds, Series 2007-A, AMT, 4.625% 2032 | | | 765 | | | | 769 | |
| Montgomery County Housing Opportunities Commission, Multi-family Housing Dev. Bonds, Series 2007-A, AMT, 4.70% 2037 | | | 1,350 | | | | 1,355 | |
| Montgomery County Housing Opportunities Commission, Single-family Housing Rev. Bonds, Series 2013-A, 4.00% 2031 | | | 2,805 | | | | 2,962 | |
| Montgomery County Housing Opportunities Commission, Single-family Housing Rev. Ref. Bonds, Series 2012-A, 5.00% 2043 | | | 735 | | | | 786 | |
| Montgomery County Housing Opportunities Commission, Single-family Mortgage Rev. Bonds, Series 2007-D, AMT, 5.50% 2038 | | | 50 | | | | 51 | |
| Montgomery County, G.O. Consolidated Public Improvement Bonds, Series 2007-A, 5.00% 2020 (preref. 2017) | | | 1,000 | | | | 1,056 | |
| Montgomery County, G.O. Consolidated Public Improvement Bonds, Series 2008-A, 5.00% 2018 | | | 3,000 | | | | 3,318 | |
| Montgomery County, Rev. Bonds (Dept. of Liquor Control), Series 2009-A, 5.00% 2026 | | | 3,010 | | | | 3,347 | |
| Montgomery County, Rev. Bonds (Dept. of Liquor Control), Series 2009-A, 5.00% 2027 | | | 1,475 | | | | 1,636 | |
| Montgomery County, Rev. Bonds (Dept. of Liquor Control), Series 2009-A, 5.00% 2028 | | | 1,515 | | | | 1,672 | |
| Montgomery County, Rev. Ref. Bonds (Trinity Health Credit Group), 5.00% 2044 | | | 3,000 | | | | 3,472 | |
| Montgomery County, Rev. Ref. Bonds (Trinity Health Credit Group), 5.00% 2045 | | | 1,000 | | | | 1,175 | |
| Montgomery County, Rev. Ref. Bonds (Trinity Health Credit Group), Series 2011, 5.00% 2040 | | | 1,100 | | | | 1,238 | |
| Prince George’s County, Special Obligation Bonds (National Harbor Project), Series 2004, 5.20% 2034 | | | 5,500 | | | | 5,505 | |
| The American Funds Tax-Exempt Series I | 9 |
The Tax-Exempt Fund of Maryland
| Bonds, notes & other debt instruments (continued) | | Principal amount
(000) | | | Value
(000) | |
| Maryland (continued) | | | | | | | | |
| City & county issuers (continued) | | | | | | | | |
| Prince George’s County, Special Obligation Bonds (Woodview Village Infrastructure Improvements), Series 1997-A, 4.50% 2017 | | $ | 725 | | | $ | 736 | |
| Prince George’s County, Special Obligation Bonds (Woodview Village Infrastructure Improvements), Series 1997-A, 4.60% 2021 | | | 1,660 | | | | 1,685 | |
| Prince George’s County, Special Obligation Bonds (Woodview Village Infrastructure Improvements), Series 1997-A, 4.70% 2026 | | | 1,545 | | | | 1,569 | |
| Prince George’s County, Special Tax Dist. Bonds (Victoria Falls Project), Series 2005, 5.25% 2035 | | | 3,495 | | | | 3,518 | |
| Washington Suburban Sanitary Dist., Montgomery and Prince George’s Counties, Consolidated Public Improvement Bonds, 3.00% 2028 | | | 3,305 | | | | 3,473 | |
| Washington Suburban Sanitary Dist., Montgomery and Prince George’s Counties, Consolidated Public Improvement Bonds, Series 2009-A, 4.00% 2019 | | | 2,305 | | | | 2,547 | |
| Washington Suburban Sanitary Dist., Montgomery and Prince George’s Counties, Consolidated Public Improvement Bonds, Series 2014-2, 4.00% 2029 | | | 1,875 | | | | 2,131 | |
| Washington Suburban Sanitary Dist., Montgomery and Prince George’s Counties, Consolidated Public Improvement Bonds, Series 2014-2, 4.00% 2043 | | | 1,500 | | | | 1,604 | |
| Washington Suburban Sanitary Dist., Montgomery and Prince George’s Counties, G.O. Ref. Bonds of 1997, 5.75% 2017 | | | 1,510 | | | | 1,616 | |
| Mayor and Common Council of Westminster, Project and Rev. Ref. Bonds (Carroll Lutheran Village, Inc.), Series 2014, 5.125% 2040 | | | 2,250 | | | | 2,388 | |
| Other securities | | | | | | | 17,266 | |
| | | | | | | | 120,260 | |
| | | | | | | | | |
| District of Columbia 1.44% | | | | | | | | |
| Metropolitan Area Transit Auth., Gross Rev. Ref. Transit Bonds, Series 2009-A, 5.25% 2025 | | | 2,000 | | | | 2,282 | |
| Metropolitan Area Transit Auth., Gross Rev. Ref. Transit Bonds, Series 2009-A, 5.25% 2028 | | | 2,000 | | | | 2,272 | |
| | | | | | | | 4,554 | |
| | | | | | | | | |
| Guam 2.71% | | | | | | | | |
| Waterworks Auth., Water and Wastewater System Rev. Bonds, Series 2013, 5.50% 2043 | | | 2,000 | | | | 2,282 | |
| Other securities | | | | | | | 6,282 | |
| | | | | | | | 8,564 | |
| | | | | | | | | |
| Puerto Rico 4.81% | | | | | | | | |
| Public Fin. Corp., Commonwealth Appropriation Bonds, Series 2001-E, 6.00% 2026 (escrowed to maturity) | | | 2,455 | | | | 3,294 | |
| Public Fin. Corp., Commonwealth Appropriation Bonds, Series 2001-E, 6.00% 2026 (escrowed to maturity) | | | 45 | | | | 60 | |
| Other securities | | | | | | | 11,833 | |
| | | | | | | | 15,187 | |
| 10 | The American Funds Tax-Exempt Series I |
| | | Principal amount
(000) | | | Value
(000) | |
| Virgin Islands 0.15% | | | | | | | | |
| Other securities | | | | | | $ | 462 | |
| | | | | | | | | |
| Total bonds, notes & other debt instruments (cost: $291,472,000) | | | | | | | 304,343 | |
| | | | | | | | | |
| Short-term securities 2.38% | | | | | | | | |
| Baltimore County, G.O. Bonds, 1.25% 4/1/2016 | | $ | 2,800 | | | | 2,806 | |
| Baltimore County, G.O. Bonds, 1.25% 4/1/2016 | | | 2,200 | | | | 2,204 | |
| Health and Higher Educational Facs. Auth., Rev. Ref. Bonds (University of Maryland Medical System Issue), Series 2008-D, TD Bank LOC, 0.01% 20412 | | | 500 | | | | 500 | |
| Montgomery County, Consolidated Public Improvement Bond Anticipation Notes, Series 2010-B, 0.03% 3/10/2016 | | | 2,000 | | | | 2,000 | |
| | | | | | | | | |
| Total short-term securities (cost: $7,509,000) | | | | | | | 7,510 | |
| Total investment securities 98.77% (cost: $298,981,000) | | | | | | | 311,853 | |
| Other assets less liabilities 1.23% | | | | | | | 3,873 | |
| | | | | | | | | |
| Net assets 100.00% | | | | | | $ | 315,726 | |
This summary investment portfolio is designed to streamline the report and help investors better focus on the fund’s principal holdings. See the inside back cover for details on how to obtain a complete schedule of portfolio holdings.
“Other securities” includes all issues that are not disclosed separately in the summary investment portfolio.
| 1 | Acquired in a transaction exempt from registration under Rule 144A of the Securities Act of 1933. May be resold in the U.S. in transactions exempt from registration, normally to qualified institutional buyers. The total value of all such securities was $2,660,000, which represented .84% of the net assets of the fund. |
| 2 | Coupon rate may change periodically. For short-term securities, the date of the next scheduled coupon rate change is considered to be the maturity date. |
Key to abbreviations
Agcy. = Agency
AMT = Alternative Minimum Tax
Auth. = Authority
Certs. of Part. = Certificates of Participation
Dept. = Department
Dev. = Development
Dist. = District
Econ. = Economic
Fac. = Facility
Facs. = Facilities
Fin. = Finance
Fncg. = Financing
G.O. = General Obligation
LOC = Letter of Credit
Preref. = Prerefunded
Redev. = Redevelopment
Ref. = Refunding
Rev. = Revenue
TECP = Tax-Exempt Commercial Paper
See Notes to Financial Statements
| The American Funds Tax-Exempt Series I | 11 |
The Tax-Exempt Fund of Maryland
Financial statements
| Statement of assets and liabilities | unaudited |
| at January 31, 2016 | (dollars in thousands) |
| Assets: | | | | | | | | |
| Investment securities, at value (cost: $298,981) | | | | | | $ | 311,853 | |
| Cash | | | | | | | 302 | |
| Receivables for: | | | | | | | | |
| Sales of investments | | $ | 1,909 | | | | | |
| Sales of fund’s shares | | | 944 | | | | | |
| Interest | | | 2,636 | | | | | |
| Other | | | 30 | | | | 5,519 | |
| | | | | | | | 317,674 | |
| Liabilities: | | | | | | | | |
| Payables for: | | | | | | | | |
| Purchases of investments | | | 1,153 | | | | | |
| Repurchases of fund’s shares | | | 376 | | | | | |
| Dividends on fund’s shares | | | 111 | | | | | |
| Investment advisory services | | | 91 | | | | | |
| Services provided by related parties | | | 97 | | | | | |
| Trustees’ deferred compensation | | | 120 | | | | | |
| Other | | | — | * | | | 1,948 | |
| Net assets at January 31, 2016 | | | | | | $ | 315,726 | |
| | | | | | | | | |
| Net assets consist of: | | | | | | | | |
| Capital paid in on shares of beneficial interest | | | | | | $ | 310,022 | |
| Undistributed net investment income | | | | | | | 332 | |
| Accumulated net realized loss | | | | | | | (7,500 | ) |
| Net unrealized appreciation | | | | | | | 12,872 | |
| Net assets at January 31, 2016 | | | | | | $ | 315,726 | |
| (dollars and shares in thousands, except per-share amounts) |
| |
Shares of beneficial interest issued and outstanding (no stated par value) —
unlimited shares authorized (19,768 total shares outstanding) |
| | | Net assets | | | Shares
outstanding | | | Net asset value
per share | |
| Class A | | $ | 241,987 | | | | 15,152 | | | $ | 15.97 | |
| Class B | | | 322 | | | | 20 | | | | 15.97 | |
| Class C | | | 29,387 | | | | 1,840 | | | | 15.97 | |
| Class F-1 | | | 15,756 | | | | 986 | | | | 15.97 | |
| Class F-2 | | | 28,274 | | | | 1,770 | | | | 15.97 | |
| * | Amount less than one thousand. |
See Notes to Financial Statements
| 12 | The American Funds Tax-Exempt Series I |
| Statement of operations | unaudited |
| for the six months ended January 31, 2016 | (dollars in thousands) |
| Investment income: | | | | | | |
| Income: | | | | | | | | |
| Interest | | | | | | $ | 6,105 | |
| Fees and expenses*: | | | | | | | | |
| Investment advisory services | | $ | 538 | | | | | |
| Distribution services | | | 467 | | | | | |
| Transfer agent services | | | 69 | | | | | |
| Administrative services | | | 30 | | | | | |
| Reports to shareholders | | | 23 | | | | | |
| Registration statement and prospectus | | | 11 | | | | | |
| Trustees’ compensation | | | 18 | | | | | |
| Auditing and legal | | | 5 | | | | | |
| Custodian | | | — | † | | | | |
| State and local taxes | | | 13 | | | | | |
| Other | | | 1 | | | | 1,175 | |
| Net investment income | | | | | | | 4,930 | |
| | | | | | | | | |
| Net realized gain and unrealized appreciation: | | | | | | | | |
| Net realized gain on investments | | | | | | | 102 | |
| Net unrealized appreciation on investments | | | | | | | 2,695 | |
| Net realized gain and unrealized appreciation | | | | | | | 2,797 | |
| Net increase in net assets resulting from operations | | | | | | $ | 7,727 | |
| * | Additional information related to class-specific fees and expenses is included in the Notes to Financial Statements. |
| † | Amount less than one thousand. |
See Notes to Financial Statements
| The American Funds Tax-Exempt Series I | 13 |
The Tax-Exempt Fund of Maryland
Statements of changes in net assets
| | | (dollars in thousands) | |
| | | | |
| | | Six months ended
January 31, 2016* | | | Year ended
July 31, 2015 | |
| Operations: | | | | | | | | |
| Net investment income | | $ | 4,930 | | | $ | 10,084 | |
| Net realized gain (loss) | | | 102 | | | | (1,789 | ) |
| Net unrealized appreciation (depreciation) | | | 2,695 | | | | (1,336 | ) |
| Net increase in net assets resulting from operations | | | 7,727 | | | | 6,959 | |
| | | | | | | | | |
| Dividends paid or accrued to shareholders from net investment income | | | (4,639 | ) | | | (9,953 | ) |
| | | | | | | | | |
| Net capital share transactions | | | (1,809 | ) | | | (553 | ) |
| | | | | | | | | |
| Total increase (decrease) in net assets | | | 1,279 | | | | (3,547 | ) |
| | | | | | | | | |
| Net assets: | | | | | | | | |
| Beginning of period | | | 314,447 | | | | 317,994 | |
| End of period (including undistributed net investment income: $332 and $41, respectively) | | $ | 315,726 | | | $ | 314,447 | |
See Notes to Financial Statements
| 14 | The American Funds Tax-Exempt Series I |
The Tax-Exempt Fund of Virginia
| Summary investment portfolio January 31, 2016 | unaudited |
| | |
| Portfolio quality summary* | Percent of net assets |

| * | Bond ratings, which typically range from AAA/Aaa (highest) to D (lowest), are assigned by credit rating agencies such as Standard & Poor’s, Moody’s and/or Fitch as an indication of an issuer’s creditworthiness. In assigning a credit rating to a security, the fund looks specifically to the ratings assigned to the issuer of the security by Standard & Poor’s, Moody’s and/or Fitch. If agency ratings differ, the security will be considered to have received the highest of those ratings, consistent with the fund’s investment policies. Securities in the “unrated” category (above) have not been rated by a rating agency; however, the investment adviser performs its own credit analysis and assigns comparable ratings that are used for compliance with the fund’s investment policies. |
| Bonds, notes & other debt instruments 90.57% | | Principal amount
(000) | | | Value
(000) | |
| Virginia 77.59% | | | | | | | | |
| State issuers 30.55% | | | | | | | | |
| College Building Auth., Educational Facs. Rev. Bonds (21st Century College and Equipment Programs), Series 2009-A, 5.00% 2029 | | $ | 1,000 | | | $ | 1,113 | |
| College Building Auth., Educational Facs. Rev. Bonds (21st Century College and Equipment Programs), Series 2012-A, 5.00% 2023 | | | 2,000 | | | | 2,433 | |
| College Building Auth., Educational Facs. Rev. Bonds (Public Higher Education Fncg. Program), Series 2009-A, 5.00% 2016 | | | 680 | | | | 699 | |
| College Building Auth., Educational Facs. Rev. Bonds (Public Higher Education Fncg. Program), Series 2009-A, 5.00% 2016 (escrowed to maturity) | | | 5 | | | | 5 | |
| College Building Auth., Educational Facs. Rev. Bonds (Public Higher Education Fncg. Program), Series 2009-A, 5.00% 2020 | | | 990 | | | | 1,098 | |
| College Building Auth., Educational Facs. Rev. Bonds (Public Higher Education Fncg. Program), Series 2009-A, 5.00% 2020 (preref. 2018) | | | 10 | | | | 11 | |
| College Building Auth., Educational Facs. Rev. Bonds (Public Higher Education Fncg. Program), Series 2009-A, 5.00% 2028 | | | 2,480 | | | | 2,750 | |
| College Building Auth., Educational Facs. Rev. Bonds (Public Higher Education Fncg. Program), Series 2009-A, 5.00% 2028 (preref. 2018) | | | 20 | | | | 22 | |
| College Building Auth., Educational Facs. Rev. Ref. Bonds (21st Century College and Equipment Programs), Series 2009-E-2, 5.00% 2023 | | | 3,000 | | | | 3,704 | |
| College Building Auth., Educational Facs. Rev. Ref. Bonds (Public Higher Education Fncg. Program), Series 2014, 5.00% 2044 | | | 2,385 | | | | 2,765 | |
| The American Funds Tax-Exempt Series I | 15 |
The Tax-Exempt Fund of Virginia
| Bonds, notes & other debt instruments (continued) | | Principal amount
(000) | | | Value
(000) | |
| Virginia (continued) | | | | | | | | |
| State issuers (continued) | | | | | | | | |
| College Building Auth., Educational Facs. Rev. Ref. Bonds (Public Higher Education Fncg. Program), Series 2015-B, 5.00% 2026 | | $ | 900 | | | $ | 1,139 | |
| College Building Auth., Educational Facs. Rev. Ref. Bonds (Public Higher Education Fncg. Program), Series 2014, 5.00% 2025 | | | 4,710 | | | | 5,941 | |
| Commonwealth Transportation Board, Federal Transportation Grant Anticipation Rev. Notes, Series 2012-A, 5.00% 2027 | | | 1,000 | | | | 1,197 | |
| Commonwealth Transportation Board, Federal Transportation Grant Anticipation Rev. Notes, Series 2012-B, 5.00% 2023 | | | 1,545 | | | | 1,895 | |
| Commonwealth Transportation Board, Federal Transportation Grant Anticipation Rev. Notes, Series 2012-B, 5.00% 2024 | | | 1,000 | | | | 1,227 | |
| Commonwealth Transportation Board, Transportation Capital Projects Rev. Bonds, Series 2011, 5.00% 2025 | | | 1,500 | | | | 1,797 | |
| Commonwealth Transportation Board, Transportation Rev. Ref. Bonds, Series 2012-A, 5.00% 2021 | | | 2,000 | | | | 2,396 | |
| Port Auth., Port Facs. Rev. Ref. Bonds, Series 2007, AMT, Assured Guaranty Municipal insured, 5.00% 2027 | | | 1,000 | | | | 1,020 | |
| Port Auth., Port Facs. Rev. Ref. Bonds, Series 2010, 5.00% 2030 | | | 2,970 | | | | 3,320 | |
| Port Auth., Port Facs. Rev. Ref. Bonds, Series 2010, 5.00% 2040 | | | 1,000 | | | | 1,112 | |
| Port Auth., Port Facs. Rev. Ref. Bonds, AMT, 5.00% 2039 | | | 1,000 | | | | 1,160 | |
| Port Auth., Port Facs. Rev. Ref. Bonds, AMT, 5.00% 2040 | | | 2,000 | | | | 2,312 | |
| Public Building Auth., Public Facs. Rev. Bonds, Series 2009-B, 5.00% 2024 | | | 2,000 | | | | 2,279 | |
| Public Building Auth., Public Facs. Rev. Bonds, Series 2009-B, 5.00% 2027 | | | 2,000 | | | | 2,258 | |
| Public Building Auth., Public Facs. Rev. Bonds, Series 2014-A, 5.00% 2027 | | | 2,000 | | | | 2,474 | |
| Public Building Auth., Public Facs. Rev. Bonds, Series 2015-B, 5.00% 2026 | | | 1,140 | | | | 1,438 | |
| Public School Auth., School Fncg. Bonds (1997 Resolution), Series 2008-B, 5.25% 2021 | | | 1,055 | | | | 1,172 | |
| Public School Auth., School Fncg. Bonds (1997 Resolution), Series 2008-B, 5.25% 2023 | | | 1,000 | | | | 1,111 | |
| Public School Auth., School Fncg. Rev. Ref. Bonds (1997 Resolution), 5.00% 2026 | | | 2,000 | | | | 2,534 | |
| Public School Auth., School Fncg. Rev. Ref. Bonds (1997 Resolution), Series 2005-A, 5.25% 2017 | | | 1,000 | | | | 1,071 | |
| Public School Auth., School Fncg. Rev. Ref. Bonds (1997 Resolution), Series 2005-B, 5.25% 2017 | | | 1,000 | | | | 1,071 | |
| Public School Auth., School Fncg. Rev. Ref. Bonds (1997 Resolution), Series 2009-A, 5.00% 2019 | | | 1,000 | | | | 1,140 | |
| Public School Auth., School Fncg. Rev. Ref. Bonds (1997 Resolution), Series 2009-C, 5.00% 2018 | | | 800 | | | | 884 | |
| Public School Auth., School Fncg. Rev. Ref. Bonds (1997 Resolution), Series 2009-C, 5.00% 2020 | | | 1,000 | | | | 1,144 | |
| Public School Auth., School Fncg. Rev. Ref. Bonds (1997 Resolution), Series 2009-C, 5.00% 2022 | | | 2,000 | | | | 2,279 | |
| Resources Auth., Infrastructure Rev. Ref. Bonds (Pooled Fncg. Program), Series 2009-B, 5.00% 2027 (preref. 2019) | | | 1,000 | | | | 1,151 | |
| 16 | The American Funds Tax-Exempt Series I |
| | | Principal amount
(000) | | | Value
(000) | |
| Resources Auth., Clean Water State Revolving Fund Rev. Bonds, Series 2007, 4.75% 2021 (preref. 2017) | | $ | 2,610 | | | $ | 2,789 | |
| Resources Auth., Clean Water State Revolving Fund Rev. Bonds, Series 2007, 4.75% 2023 (preref. 2017) | | | 2,500 | | | | 2,672 | |
| Resources Auth., Clean Water State Revolving Fund Rev. Bonds, Series 2008, 5.00% 2028 | | | 1,500 | | | | 1,668 | |
| Resources Auth., Clean Water State Revolving Fund Rev. Bonds, Series 2009, 5.00% 2027 | | | 1,750 | | | | 2,013 | |
| Resources Auth., Clean Water State Revolving Fund Rev. Bonds, Series 2009, 5.00% 2029 | | | 1,500 | | | | 1,725 | |
| Resources Auth., Clean Water State Revolving Fund Rev. Bonds, Series 2009, 5.00% 2030 | | | 1,500 | | | | 1,725 | |
| Resources Auth., Infrastructure Rev. Bonds (Pooled Fncg. Program), 5.00% 2025 | | | 1,555 | | | | 2,006 | |
| Resources Auth., Infrastructure Rev. Bonds (Pooled Fncg. Program), Series 2006-A, 5.00% 2017 | | | 940 | | | | 974 | |
| Resources Auth., Infrastructure Rev. Bonds (Pooled Fncg. Program), Series 2006-A, 5.00% 2017 (preref. 2016) | | | 545 | | | | 564 | |
| Resources Auth., Infrastructure Rev. Bonds (Pooled Fncg. Program), Series 2006-A, 5.00% 2017 (preref. 2016) | | | 315 | | | | 326 | |
| Resources Auth., Infrastructure Rev. Bonds (Pooled Fncg. Program), Series 2006-A, 5.00% 2017 (preref. 2016) | | | 305 | | | | 316 | |
| Resources Auth., Infrastructure Rev. Bonds (Pooled Fncg. Program), Series 2008-A, 5.00% 2028 (preref. 2018) | | | 555 | | | | 619 | |
| Resources Auth., Infrastructure Rev. Bonds (Pooled Fncg. Program), Series 2008-B, 5.00% 2027 | | | 465 | | | | 514 | |
| Resources Auth., Infrastructure Rev. Bonds (Pooled Fncg. Program), Series 2008-B, 5.00% 2027 (preref. 2018) | | | 470 | | | | 524 | |
| Resources Auth., Infrastructure Rev. Bonds (Pooled Fncg. Program), Series 2008-B, 5.00% 2027 (preref. 2018) | | | 65 | | | | 73 | |
| Resources Auth., Infrastructure Rev. Bonds (Pooled Fncg. Program), Series 2008-B, 5.00% 2028 | | | 1,000 | | | | 1,102 | |
| Resources Auth., Infrastructure Rev. Bonds (Pooled Fncg. Program), Series 2009-A, 5.00% 2028 | | | 250 | | | | 287 | |
| Resources Auth., Infrastructure Rev. Bonds (Pooled Fncg. Program), Series 2009-A, 5.00% 2028 (preref. 2019) | | | 780 | | | | 897 | |
| Resources Auth., Infrastructure Rev. Bonds (Pooled Fncg. Program), Series 2011-A, 5.00% 2024 | | | 1,365 | | | | 1,647 | |
| Resources Auth., Infrastructure Rev. Bonds (Pooled Fncg. Program), Series 2011-A, 5.00% 2024 (preref. 2021) | | | 85 | | | | 103 | |
| Resources Auth., Infrastructure Rev. Bonds (Pooled Fncg. Program), Series 2014-B, 5.00% 2027 | | | 1,000 | | | | 1,242 | |
| Resources Auth., Infrastructure Rev. Bonds, Series 2008-B, 5.00% 2020 (preref. 2018) | | | 60 | | | | 67 | |
| Resources Auth., Infrastructure Rev. Bonds, Series 2008-B, 5.00% 2023 (preref. 2018) | | | 145 | | | | 162 | |
| Resources Auth., State Moral Obligation Rev. Ref. Bonds (Pooled Fncg. Program), Series 2011-B, 5.00% 2027 | | | 2,000 | | | | 2,387 | |
| Resources Auth., Infrastructure Rev. Bonds (Pooled Fncg. Program), Series 2008-A, 5.00% 2028 (preref. 2018) | | | 925 | | | | 1,030 | |
| The American Funds Tax-Exempt Series I | 17 |
The Tax-Exempt Fund of Virginia
| Bonds, notes & other debt instruments (continued) | | Principal amount
(000) | | | Value
(000) | |
| Virginia (continued) | | | | | | | | |
| State issuers (continued) | | | | | | | | |
| Resources Auth., Infrastructure Rev. Bonds (Pooled Fncg. Program), Series 2008-B, 5.00% 2038 (preref. 2018) | | $ | 1,000 | | | $ | 1,115 | |
| Resources Auth., Infrastructure Rev. Bonds (Pooled Fncg. Program), Series 2008-B, 5.00% 2023 (preref. 2018) | | | 970 | | | | 1,082 | |
| Resources Auth., Infrastructure Rev. Bonds (Pooled Fncg. Program), Series 2008-B, 5.00% 2020 (preref. 2018) | | | 370 | | | | 413 | |
| Resources Auth., Infrastructure Rev. Bonds (Pooled Fncg. Program), Series 2008-A, 5.00% 2028 | | | 90 | | | | 99 | |
| Resources Auth., Infrastructure Rev. Bonds (Pooled Fncg. Program), Series 2008-B, 5.00% 2023 | | | 1,055 | | | | 1,168 | |
| Resources Auth., Infrastructure Rev. Bonds (Pooled Fncg. Program), Series 2008-B, 5.00% 2020 | | | 425 | | | | 472 | |
| Small Business Fncg. Auth., Rev. Bonds (Elizabeth River Crossings Opco, LLC Project), Series 2012, AMT, 5.50% 2042 | | | 6,000 | | | | 6,685 | |
| Tobacco Settlement Fncg. Corp., Tobacco Settlement Asset-backed Rev. Ref. Bonds, Series 2007-B-1, 5.00% 2047 | | | 3,755 | | | | 2,975 | |
| College Building Auth., Educational Facs. Rev. Bonds (University of Richmond Project), Series 2011-B, 5.00% 2016 | | | 1,695 | | | | 1,702 | |
| Rector and Visitors of the University of Virginia, General Rev. Ref. Pledge Bonds, Series 2008, 5.00% 2040 | | | 3,000 | | | | 3,273 | |
| Rector and Visitors of the University of Virginia, General Rev. Ref. Pledge Bonds, Series 2011, 5.00% 2030 | | | 1,000 | | | | 1,174 | |
| Rector and Visitors of the University of Virginia, General Rev. Ref. Pledge Bonds, Series 2011, 5.00% 2031 | | | 1,000 | | | | 1,174 | |
| Upper Occoquan Sewage Auth., Regional Sewerage System Rev. Bonds, 5.00% 2026 | | | 4,500 | | | | 5,734 | |
| Upper Occoquan Sewage Auth., Regional Sewerage System Rev. Bonds, 5.00% 2027 | | | 2,485 | | | | 3,146 | |
| Upper Occoquan Sewage Auth., Regional Sewerage System Rev. Bonds, Series 2007-B, 4.75% 2034 | | | 1,000 | | | | 1,059 | |
| Upper Occoquan Sewage Auth., Regional Sewerage System Rev. Bonds, Series A, Assured Guaranty Municipal insured, 5.15% 2020 | | | 1,000 | | | | 1,105 | |
| Other securities | | | | | | | 27,958 | |
| | | | | | | | 148,888 | |
| | | | | | | | | |
| City & county issuers 47.04% | | | | | | | | |
| Econ. Dev. Auth. of Albemarle County, Public Fac. Rev. Ref. Bonds (Albemarle County Project), Series 2011, 5.00% 2022 | | | 2,955 | | | | 3,509 | |
| Industrial Dev. Auth. of the City of Alexandria, Demand Rev. Ref. Bonds (Goodwin House), Series 2015, 5.00% 2045 | | | 1,000 | | | | 1,128 | |
| Industrial Dev. Auth. of the City of Alexandria, Demand Rev. Ref. Bonds (Goodwin House), Series 2015, 5.00% 2050 | | | 2,000 | | | | 2,250 | |
| Arlington County, G.O. Public Improvement Bonds, Series 2008, 5.00% 2024 (preref. 2017) | | | 1,500 | | | | 1,565 | |
| Arlington County, G.O. Public Improvement Bonds, Series 2008, 5.00% 2025 (preref. 2017) | | | 2,000 | | | | 2,087 | |
| Arlington County, G.O. Ref. Bonds, 5.00% 2018 (preref. 2016) | | | 2,660 | | | | 2,724 | |
| Arlington County, G.O. Ref. Bonds, 5.00% 2018 (preref. 2016) | | | 1,765 | | | | 1,807 | |
| 18 | The American Funds Tax-Exempt Series I |
| | | Principal amount
(000) | | | Value
(000) | |
| Industrial Dev. Auth. of Arlington County, Hospital Rev. Ref. Bonds (Virginia Hospital Center Arlington Health System), Series 2010, 4.25% 2024 | | $ | 415 | | | $ | 449 | |
| Industrial Dev. Auth. of Arlington County, Hospital Rev. Ref. Bonds (Virginia Hospital Center Arlington Health System), Series 2010, 5.00% 2031 | | | 6,355 | | | | 7,064 | |
| Industrial Dev. Auth. of Botetourt County, Residential Care Fac. Rev. Ref. Bonds (Glebe, Inc.), Series 2014-A, 6.00% 2044 | | | 2,250 | | | | 2,357 | |
| Econ. Dev. Auth. of County of Chesterfield, Rev. Bonds (Bon Secours Health System, Inc.), Series 2008-C, Assured Guaranty insured, 5.00% 2042 | | | 2,500 | | | | 2,771 | |
| Fairfax County Econ. Dev. Auth., Lease Rev. Bonds (Joint Public Uses Complex Project), Series 2006, 5.00% 2024 (preref. 2016) | | | 3,795 | | | | 3,848 | |
| Fairfax County Econ. Dev. Auth., Residential Care Facs. Mortgage Rev. Bonds (Goodwin House Incorporated), Series 2007, 5.125% 2037 | | | 2,000 | | | | 2,083 | |
| Fairfax County Econ. Dev. Auth., Retirement Community Rev. Ref. Bonds (Greenspring Village, Inc. Fac.), Series 2006-A, 4.875% 2036 | | | 2,500 | | | | 2,527 | |
| Fairfax County Industrial Dev. Auth., Health Care Rev. Bonds (Inova Health System Project), Series 2012-A, 5.00% 2035 | | | 1,000 | | | | 1,149 | |
| Fairfax County Industrial Dev. Auth., Health Care Rev. Bonds (Inova Health System Project), Series 2012-A, 5.00% 2040 | | | 2,000 | | | | 2,272 | |
| Fairfax County Industrial Dev. Auth., Health Care Rev. Bonds (Inova Health System Project), Series 2014-A, 5.00% 2044 | | | 625 | | | | 719 | |
| Fairfax County Industrial Dev. Auth., Health Care Rev. Ref. Bonds (Inova Health System Project), Series 2009-A, 5.25% 2026 | | | 1,000 | | | | 1,132 | |
| Fairfax County Industrial Dev. Auth., Health Care Rev. Ref. Bonds (Inova Health System Project), Series 2009-A, 5.50% 2035 | | | 5,500 | | | | 6,241 | |
| Fairfax County Industrial Dev. Auth., Health Care Rev. Ref. Bonds (Inova Health System Project), Series 2009-C, 5.00% 2025 | | | 1,500 | | | | 1,687 | |
| Fairfax County Industrial Dev. Auth., Hospital Rev. Ref. Bonds (Inova Health System Hospitals Project), Series 1993-A, 5.25% 2019 | | | 2,500 | | | | 2,704 | |
| Fairfax County Industrial Dev. Auth., Hospital Rev. Ref. Bonds (Inova Health System Hospitals Project), Series 1993-A, Assured Guaranty Municipal insured, 5.25% 2019 | | | 1,000 | | | | 1,085 | |
| Fairfax County Redev. and Housing Auth., Multi-family Housing Rev. Bonds (Cedar Ridge Project), Series 2007, AMT, 4.75% 2038 | | | 3,775 | | | | 3,843 | |
| Fairfax County Sewer Rev. Bonds, Series 2012, 5.00% 2021 | | | 2,055 | | | | 2,487 | |
| Fairfax County Water Auth., Water Rev. Ref. Bonds, Series 1997, 5.00% 2021 | | | 1,000 | | | | 1,128 | |
| Fairfax County Water Auth., Water Rev. Ref. Bonds, Series 2005-B, 5.25% 2019 | | | 1,000 | | | | 1,139 | |
| Fairfax County Water Auth., Water Rev. Ref. Bonds, Series 2005-B, 5.25% 2026 | | | 1,500 | | | | 1,979 | |
| Fairfax County Water Auth., Water Rev. Ref. Bonds, Series 2007, 5.00% 2017 | | | 1,000 | | | | 1,053 | |
| Fairfax County Water Auth., Water Rev. Ref. Bonds, Series 2012, 5.00% 2028 | | | 1,000 | | | | 1,206 | |
| The American Funds Tax-Exempt Series I | 19 |
The Tax-Exempt Fund of Virginia
| Bonds, notes & other debt instruments (continued) | | Principal amount
(000) | | | Value
(000) | |
| Virginia (continued) | | | | | | | | |
| City & county issuers (continued) | | | | | | | | |
| Industrial Dev. Auth. of Halifax County, Recovery Zone Fac. Rev. Bonds (Virginia Electric and Power Co. Project), Series 2010-A, 2.15% 2041 (put 2020) | | $ | 2,000 | | | $ | 2,054 | |
| Hampton Roads Sanitation Dist., Wastewater Rev. Bonds, Series 2012-A, 5.00% 2020 | | | 515 | | | | 596 | |
| Hampton Roads Sanitation Dist., Wastewater Rev. Bonds, Series 2012-A, 5.00% 2039 | | | 4,000 | | | | 4,560 | |
| Hampton Roads Sanitation Dist., Wastewater Rev. Ref. Bonds, Series 2008, 5.00% 2025 | | | 1,000 | | | | 1,092 | |
| Hampton Roads Sanitation Dist., Wastewater Rev. Ref. Bonds, Series 2008, 5.00% 2033 | | | 1,260 | | | | 1,363 | |
| Hampton Roads Sanitation Dist., Wastewater Rev. Ref. Bonds, Series 2008, 5.00% 2033 (preref. 2018) | | | 740 | | | | 808 | |
| Industrial Dev. Auth. of County of Hanover, Hospital Rev. Bonds (Memorial Regional Medical Center Project at Hanover Medical Park), Series 1995, National insured, 6.375% 2018 | | | 650 | | | | 687 | |
| Industrial Dev. Auth. of the City of Harrisonburg, Hospital Facs. Rev. Bonds (Rockingham Memorial Hospital), Series 2006, AMBAC insured, 4.00% 2018 | | | 1,170 | | | | 1,189 | |
| Econ. Dev. Auth. of Henrico County, Rev. Bonds (Bon Secours Health System, Inc.), Series 2008-B-2, Assured Guaranty insured, 5.25% 2042 | | | 2,000 | | | | 2,244 | |
| Henrico County, Water and Sewer System Rev. Bonds, Series 2006-A, 5.00% 2025 (preref. 2016) | | | 2,945 | | | | 2,981 | |
| Henrico County, Water and Sewer System Rev. Ref. Bonds, Series 2009, 5.00% 2024 | | | 1,000 | | | | 1,129 | |
| Henrico County, Water and Sewer System Rev. Ref. Bonds, Series 2013, 5.00% 2023 | | | 945 | | | | 1,184 | |
| Henrico County, Water and Sewer System Rev. Ref. Bonds, Series 2013, 5.00% 2024 | | | 1,000 | | | | 1,234 | |
| Industrial Dev. Auth. of the Town of Louisa, Pollution Control Rev. Ref. Bonds (Virginia Electric and Power Co. Project), Series 2014-C, 0.70% 2035 (put 2016) | | | 500 | | | | 500 | |
| Econ. Dev. Auth. of Montgomery County, Rev. Ref. Bonds (Virginia Tech Foundation), Series 2011-A, 5.00% 2027 | | | 2,000 | | | | 2,347 | |
| Econ. Dev. Auth. of Montgomery County, Rev. Ref. Bonds (Virginia Tech Foundation), Series 2011-A, 5.00% 2030 | | | 2,000 | | | | 2,304 | |
| Mosaic Dist. Community Dev. Auth. (Fairfax County), Rev. Bonds, Series 2011-A, 6.875% 2036 | | | 3,000 | | | | 3,470 | |
| Newport News Industrial Dev. Auth., Health Systems Rev. Ref. Bonds (Custodial Receipts), 5.33% 20451 | | | 3,500 | | | | 3,675 | |
| City of Norfolk, Water Rev. Bonds, Series 2015-A, 5.25% 2044 | | | 2,000 | | | | 2,388 | |
| City of Norfolk, Water Rev. Bonds, Series 2008, 5.00% 2027 | | | 2,120 | | | | 2,364 | |
| Econ. Dev. Auth. of the City of Norfolk, Health Care Facs. Rev. Ref. Bonds (Sentara Healthcare), Series 2012-B, 5.00% 2036 | | | 1,865 | | | | 2,163 | |
| Econ. Dev. Auth. of the City of Norfolk, Health Care Facs. Rev. Ref. Bonds (Sentara Healthcare), Series 2012-B, 5.00% 2043 | | | 1,500 | | | | 1,719 | |
| 20 | The American Funds Tax-Exempt Series I |
| | | Principal amount
(000) | | | Value
(000) | |
| Industrial Dev. Auth. of the County of Prince William, Student Housing Rev. Bonds (George Mason University Foundation Prince William Housing LLC Project), Series 2011-A, 5.125% 2041 | | $ | 3,400 | | | $ | 3,767 | |
| Rappahannock Regional Jail Auth., Fac. Capital Improvement and Rev. Ref. Bonds, 5.00% 2032 | | | 2,250 | | | | 2,724 | |
| Rappahannock Regional Jail Auth., Fac. Capital Improvement and Rev. Ref. Bonds, 5.00% 2031 | | | 2,000 | | | | 2,435 | |
| Rappahannock Regional Jail Auth., Fac. Capital Improvement and Rev. Ref. Bonds, 5.00% 2030 | | | 1,750 | | | | 2,141 | |
| Greater Richmond Convention Center Auth., Hotel Tax Rev. Ref. Bonds, Series 2015, 5.00% 2026 | | | 2,520 | | | | 3,124 | |
| Small Business Fncg. Auth., Health Care Facs. Rev. Ref. Bonds (Sentara Healthcare), Series 2010, 5.00% 2040 | | | 7,500 | | | | 8,371 | |
| City of Spotsylvania, Water and Sewer System Rev. Ref. Bonds, 5.00% 2026 | | | 3,000 | | | | 3,784 | |
| Industrial Dev. Auth. of the City of Winchester, Hospital Rev. Ref. Bonds (Valley Health System Obligated Group), 5.00% 2044 | | | 2,000 | | | | 2,277 | |
| Industrial Dev. Auth. of the City of Winchester, Hospital Rev. Ref. Bonds (Valley Health System Obligated Group), 5.00% 2035 | | | 1,000 | | | | 1,156 | |
| Industrial Dev. Auth. of the City of Winchester, Hospital Rev. Ref. Bonds (Valley Health System Obligated Group), Series 2014-A, 5.00% 2044 | | | 2,000 | | | | 2,257 | |
| Industrial Dev. Auth. of Wise County, Solid Waste and Sewage Disposal Rev. Bonds (Virginia Electric and Power Co. Project), Series 2009-A, 2.15% 2040 (put 2020) | | | 2,000 | | | | 2,057 | |
| Industrial Dev. Auth. of Wise County, Solid Waste and Sewage Disposal Rev. Bonds (Virginia Electric and Power Co. Project), Series 2010-A, 1.875% 2040 (put 2020) | | | 1,000 | | | | 1,017 | |
| Econ. Dev. Auth. of York County, Pollution Control Rev. Ref. Bonds (Virginia Electric and Power Co. Project), Series 2009-A, 1.875% 2033 (put 2019) | | | 3,000 | | | | 3,059 | |
| Other securities | | | | | | | 83,064 | |
| | | | | | | | 229,277 | |
| | | | | | | | | |
| District of Columbia 5.87% | | | | | | | | |
| Dulles Toll Road, Rev. Bonds (Dulles Metrorail and Capital Improvement Projects), Convertible Capital Appreciation Bonds, Series 2010-B, 0%/6.50% 20442 | | | 2,000 | | | | 2,213 | |
| Dulles Toll Road, Rev. Bonds (Dulles Metrorail and Capital Improvement Projects), Current Interest Bonds, Series 2009-A, 5.00% 2039 | | | 4,000 | | | | 4,449 | |
| Dulles Toll Road, Rev. Bonds (Dulles Metrorail and Capital Improvement Projects), Current Interest Bonds, Series 2009-A, 5.25% 2044 | | | 3,000 | | | | 3,356 | |
| Metropolitan Washington Airports Auth., Airport System Rev. Bonds, Series 2007-B, AMT, AMBAC insured, 5.00% 2020 | | | 1,000 | | | | 1,070 | |
| Metropolitan Washington Airports Auth., Airport System Rev. Bonds, Series 2008-A, AMT, 5.375% 2028 | | | 1,825 | | | | 2,014 | |
| Metropolitan Washington Airports Auth., Airport System Rev. Bonds, Series 2010-A, 5.00% 2039 | | | 1,800 | | | | 2,051 | |
| The American Funds Tax-Exempt Series I | 21 |
The Tax-Exempt Fund of Virginia
| Bonds, notes & other debt instruments (continued) | | Principal amount
(000) | | | Value
(000) | |
| District of Columbia (continued) | | | | | | | | |
| Metropolitan Washington Airports Auth., Airport System Rev. Ref. Bonds, Series 2006-A, AMT, Assured Guaranty Municipal insured, 5.00% 2032 | | $ | 1,000 | | | $ | 1,029 | |
| Metropolitan Washington Airports Auth., Airport System Rev. Ref. Bonds, Series 2006-C, FGIC-National insured, 5.00% 2023 | | | 1,965 | | | | 2,027 | |
| Metropolitan Washington Airports Auth., Airport System Rev. Ref. Bonds, Series 2010-B, AMT, 5.00% 2025 | | | 1,000 | | | | 1,147 | |
| Metropolitan Washington Airports Auth., Airport System Rev. Ref. Bonds, Series 2011-C, AMT, 5.00% 2026 | | | 3,000 | | | | 3,472 | |
| Metropolitan Washington Airports Auth., Airport System Rev. Ref. Bonds, Series 2012-A, AMT, 5.00% 2031 | | | 1,000 | | | | 1,139 | |
| Metropolitan Washington Airports Auth., Airport System Rev. Ref. Bonds, Series 2015-B, AMT, 5.00% 2027 | | | 1,000 | | | | 1,218 | |
| Other securities | | | | | | | 3,418 | |
| | | | | | | | 28,603 | |
| | | | | | | | | |
| Guam 2.76% | | | | | | | | |
| Waterworks Auth., Water and Wastewater System Rev. Bonds, Series 2013, 5.50% 2043 | | | 2,500 | | | | 2,852 | |
| Other securities | | | | | | | 10,607 | |
| | | | | | | | 13,459 | |
| | | | | | | | | |
| Puerto Rico 4.03% | | | | | | | | |
| Industrial, Tourist, Educational, Medical and Environmental Control Facs. Fncg. Auth., Hospital Rev. and Rev. Ref. Bonds (Hospital Auxilio Mutuo Obligated Group Project), Series 2011-A, 6.00% 2033 | | | 2,250 | | | | 2,362 | |
| Other securities | | | | | | | 17,256 | |
| | | | | | | | 19,618 | |
| | | | | | | | | |
| Virgin Islands 0.32% | | | | | | | | |
| Other securities | | | | | | | 1,573 | |
| | | | | | | | | |
| Total bonds, notes & other debt instruments (cost: $417,155,000) | | | | | | | 441,418 | |
| | | | | | | | | |
| Short-term securities 8.07% | | | | | | | | |
| Virginia College Building Auth., Educational Facs. Rev. Bonds (21st Century College and Equipment Programs), Series 2006-B, 0.01% 20263 | | | 4,680 | | | | 4,680 | |
| Virginia College Building Auth., Educational Facs. Rev. Bonds (21st Century College and Equipment Programs), Series 2006-C, 0.01% 20263 | | | 10,395 | | | | 10,395 | |
| Virginia College Building Auth., Educational Facs. Rev. Bonds (University of Richmond Project), Series 2006, 0.01% 20363 | | | 13,955 | | | | 13,955 | |
| 22 | The American Funds Tax-Exempt Series I |
| | | Principal amount
(000) | | | Value
(000) | |
| Industrial Dev. Auth. of Loudoun County, Multi-Modal Rev. Bonds (Howard Hughes Medical Institute Issue), Series 2003-A, 0.06% 20383 | | $ | 5,000 | | | $ | 5,000 | |
| Industrial Dev. Auth. of Montgomery County, Rev. Ref. Bonds (Virginia Tech Foundation), Series 2005-A, Bank of America LOC, 0.01% 20353 | | | 1,560 | | | | 1,560 | |
| Other securities | | | | | | | 3,740 | |
| | | | | | | | | |
| Total short-term securities (cost: $39,330,000) | | | | | | | 39,330 | |
| Total investment securities 98.64% (cost: $456,485,000) | | | | | | | 480,748 | |
| Other assets less liabilities 1.36% | | | | | | | 6,621 | |
| | | | | | | | | |
| Net assets 100.00% | | | | | | $ | 487,369 | |
This summary investment portfolio is designed to streamline the report and help investors better focus on the fund’s principal holdings. See the inside back cover for details on how to obtain a complete schedule of portfolio holdings.
“Other securities” includes all issues that are not disclosed separately in the summary investment portfolio.
| 1 | Acquired in a transaction exempt from registration under Rule 144A of the Securities Act of 1933. May be resold in the U.S. in transactions exempt from registration, normally to qualified institutional buyers. The total value of all such securities, including those in “Other securities,“ was $4,715,000, which represented .97% of the net assets of the fund. |
| 2 | Step bond; coupon rate will increase at a later date. |
| 3 | Coupon rate may change periodically. For short-term securities, the date of the next scheduled coupon rate change is considered to be the maturity date. |
Key to abbreviations
Agcy. = Agency
AMT = Alternative Minimum Tax
Auth. = Authority
Certs. of Part. = Certificates of Participation
Dept. = Department
Dev. = Development
Dist. = District
Econ. = Economic
Fac. = Facility
Facs. = Facilities
Fin. = Finance
Fncg. = Financing
G.O. = General Obligation
LOC = Letter of Credit
Preref. = Prerefunded
Redev. = Redevelopment
Ref. = Refunding
Rev. = Revenue
TECP = Tax-Exempt Commercial Paper
See Notes to Financial Statements
| The American Funds Tax-Exempt Series I | 23 |
The Tax-Exempt Fund of Virginia
Financial statements
Statement of assets and liabilities
at January 31, 2016 | unaudited
(dollars in thousands) |
| Assets: | | | | | | | | |
| Investment securities, at value (cost: $456,485) | | | | | | $ | 480,748 | |
| Cash | | | | | | | 3,425 | |
| Receivables for: | | | | | | | | |
| Sales of fund’s shares | | $ | 766 | | | | | |
| Interest | | | 5,037 | | | | | |
| Other | | | 47 | | | | 5,850 | |
| | | | | | | | 490,023 | |
| Liabilities: | | | | | | | | |
| Payables for: | | | | | | | | |
| Purchases of investments | | | 1,737 | | | | | |
| Repurchases of fund’s shares | | | 420 | | | | | |
| Dividends on fund’s shares | | | 102 | | | | | |
| Investment advisory services | | | 134 | | | | | |
| Services provided by related parties | | | 140 | | | | | |
| Trustees’ deferred compensation | | | 121 | | | | | |
| Other | | | — | * | | | 2,654 | |
| Net assets at January 31, 2016 | | | | | | $ | 487,369 | |
| | | | | | | | | |
| Net assets consist of: | | | | | | | | |
| Capital paid in on shares of beneficial interest | | | | | | $ | 468,526 | |
| Undistributed net investment income | | | | | | | 438 | |
| Accumulated net realized loss | | | | | | | (5,858 | ) |
| Net unrealized appreciation | | | | | | | 24,263 | |
| Net assets at January 31, 2016 | | | | | | $ | 487,369 | |
(dollars and shares in thousands, except per-share amounts)
Shares of beneficial interest issued and outstanding (no stated par value) —
unlimited shares authorized (28,746 total shares outstanding)
| | | Net assets | | | Shares
outstanding | | | Net asset value
per share | |
| Class A | | $ | 373,903 | | | | 22,053 | | | $ | 16.95 | |
| Class B | | | 344 | | | | 20 | | | | 16.95 | |
| Class C | | | 36,048 | | | | 2,126 | | | | 16.95 | |
| Class F-1 | | | 20,778 | | | | 1,226 | | | | 16.95 | |
| Class F-2 | | | 56,296 | | | | 3,321 | | | | 16.95 | |
| * | Amount less than one thousand. |
See Notes to Financial Statements
| 24 | The American Funds Tax-Exempt Series I |
Statement of operations
for the six months ended January 31, 2016 | unaudited
(dollars in thousands) |
| Investment income: | | | | | | | | |
| Income: | | | | | | | | |
| Interest | | | | | | $ | 8,436 | |
| | | | | | | | | |
| Fees and expenses*: | | | | | | | | |
| Investment advisory services | | $ | 780 | | | | | |
| Distribution services | | | 661 | | | | | |
| Transfer agent services | | | 102 | | | | | |
| Administrative services | | | 46 | | | | | |
| Reports to shareholders | | | 24 | | | | | |
| Registration statement and prospectus | | | 6 | | | | | |
| Trustees’ compensation | | | 20 | | | | | |
| Auditing and legal | | | 6 | | | | | |
| Custodian | | | — | † | | | | |
| State and local taxes | | | 3 | | | | | |
| Other | | | 1 | | | | 1,649 | |
| Net investment income | | | | | | | 6,787 | |
| | | | | | | | | |
| Net realized loss and unrealized appreciation: | | | | | | | | |
| Net realized loss on investments | | | | | | | (1,497 | ) |
| Net unrealized appreciation on investments | | | | | | | 7,931 | |
| Net realized loss and unrealized appreciation | | | | | | | 6,434 | |
| Net increase in net assets resulting from operations | | | | | | $ | 13,221 | |
| * | Additional information related to class-specific fees and expenses is included in the Notes to Financial Statements. |
| † | Amount less than one thousand. |
See Notes to Financial Statements
| The American Funds Tax-Exempt Series I | 25 |
The Tax-Exempt Fund of Virginia
| Statements of changes in net assets | |
| | (dollars in thousands) |
| | | Six months ended | | | Year ended | |
| | | January 31, 2016* | | | July 31, 2015 | |
| Operations: | | | | | | | | |
| Net investment income | | $ | 6,787 | | | $ | 14,290 | |
| Net realized loss | | | (1,497 | ) | | | (1,264 | ) |
| Net unrealized appreciation (depreciation) | | | 7,931 | | | | (2,182 | ) |
| Net increase in net assets resulting from operations | | | 13,221 | | | | 10,844 | |
| |
| Dividends paid or accrued to shareholders from net investment income | | | (6,794 | ) | | | (14,041 | ) |
| |
| Net capital share transactions | | | 12,953 | | | | 12,098 | |
| |
| Total increase in net assets | | | 19,380 | | | | 8,901 | |
| |
| Net assets: | | | | | | | | |
| Beginning of period | | | 467,989 | | | | 459,088 | |
| End of period (including undistributed net investment income: $438 and $445, respectively) | | $ | 487,369 | | | $ | 467,989 | |
See Notes to Financial Statements
| 26 | The American Funds Tax-Exempt Series I |
| Notes to financial statements | unaudited |
1. Organization
The American Funds Tax-Exempt Series I (the “trust”) is registered under the Investment Company Act of 1940 as an open-end, diversified management investment company and has issued two series of shares, The Tax-Exempt Fund of Maryland (the “Maryland fund”) and The Tax-Exempt Fund of Virginia (the “Virginia fund,” and, together with the Maryland fund, the “funds”). Each fund seeks to provide a high level of current income exempt from regular federal and its respective state income taxes. Each fund’s secondary objective is preservation of capital.
Each fund has five retail share classes (Classes A, B and C, as well as two F share classes, F-1 and F-2). Some share classes are available only to limited categories of investors. The funds’ share classes are further described below:
| Share class | | Initial sales
charge | | Contingent deferred sales charge upon redemption | | Conversion feature | |
| Class A | | Up to 3.75% | | None (except 1% for certain redemptions within one year of purchase without an initial sales charge) | | None | |
| Class B* | | None | | Declines from 5% to 0% for redemptions within six years of purchase | | Class B converts to Class A after eight years | |
| Class C | | None | | 1% for redemptions within one year of purchase | | Class C converts to Class F-1 after 10 years | |
| Classes F-1 and F-2 | | None | | None | | None | |
*Class B shares of the funds are not available for purchase.
Holders of all share classes of each fund have equal pro rata rights to the assets, dividends and liquidation proceeds of each fund held. Each share class of each fund has identical voting rights, except for the exclusive right to vote on matters affecting only its class. Share classes have different fees and expenses (“class-specific fees and expenses”), primarily due to different arrangements for distribution, transfer agent and administrative services. Differences in class-specific fees and expenses will result in differences in net investment income and, therefore, the payment of different per-share dividends by each share class of each fund.
2. Significant accounting policies
Each fund is an investment company that applies the accounting and reporting guidance issued in Topic 946 by the U.S. Financial Accounting Standards Board. Each fund’s financial statements have been prepared to comply with U.S. generally accepted accounting principles (“U.S. GAAP”). These principles require the funds’ investment adviser to make estimates and assumptions that affect reported amounts and disclosures. Actual results could differ from those estimates. Subsequent events, if any, have been evaluated through the date of issuance in the preparation of the financial statements. The
| The American Funds Tax-Exempt Series I | 27 |
funds follow the significant accounting policies described in this section, as well as the valuation policies described in the next section on valuation.
Security transactions and related investment income — Security transactions are recorded by the funds as of the date the trades are executed with brokers. Realized gains and losses from security transactions are determined based on the specific identified cost of the securities. In the event a security is purchased with a delayed payment date, the funds will segregate liquid assets sufficient to meet their payment obligations. Interest income is recognized on an accrual basis. Market discounts, premiums and original issue discounts on fixed-income securities are amortized daily over the expected life of the security.
Class allocations — Income, fees and expenses (other than class-specific fees and expenses) are allocated daily among the various share classes of each fund based on the relative value of their settled shares. Realized and unrealized gains and losses are allocated daily among the various share classes of each fund based on their relative net assets. Class-specific fees and expenses, such as distribution, transfer agent and administrative services, are charged directly to the respective share class of each fund.
Dividends and distributions to shareholders — Dividends to shareholders are declared daily after the determination of each fund’s net investment income and are paid to shareholders monthly. Distributions to shareholders are recorded on each fund’s ex-dividend date.
3. Valuation disclosures
Capital Research and Management Company (“CRMC”), the funds’ investment adviser, values the funds’ investments at fair value as defined by U.S. GAAP. The net asset value of each share class of each fund is generally determined as of approximately 4:00 p.m. New York time each day the New York Stock Exchange is open.
Methods and inputs — The funds’ investment adviser uses the following methods and inputs to establish the fair value of the funds’ assets and liabilities. Use of particular methods and inputs may vary over time based on availability and relevance as market and economic conditions evolve.
Fixed-income securities, including short-term securities, are generally valued at prices obtained from one or more pricing vendors. Vendors value such securities based on one or more of the following inputs: benchmark yields, transactions, bids, offers, quotations from dealers and trading systems, new issues, spreads and other relationships observed in the markets among comparable securities; and proprietary pricing models such as yield measures calculated using factors such as cash flows, financial or collateral performance and other reference data. For certain distressed securities, valuations may include cash flows or liquidation values using a net present value calculation based on inputs that include, but are not limited to, financial statements and debt contracts.
| 28 | The American Funds Tax-Exempt Series I |
When the funds’ investment adviser deems it appropriate to do so (such as when vendor prices are unavailable or deemed to be not representative), fixed-income securities will be valued in good faith at the mean quoted bid and ask prices that are reasonably and timely available (or bid prices, if ask prices are not available) or at prices for securities of comparable maturity, quality and type.
Securities and other assets for which representative market quotations are not readily available or are considered unreliable by the funds’ investment adviser are fair valued as determined in good faith under fair valuation guidelines adopted by authority of the trust’s board of trustees as further described. The investment adviser follows fair valuation guidelines, consistent with U.S. Securities and Exchange Commission rules and guidance, to consider relevant principles and factors when making fair value determinations. The investment adviser considers relevant indications of value that are reasonably and timely available to it in determining the fair value to be assigned to a particular security, such as the type and cost of the security; contractual or legal restrictions on resale of the security; relevant financial or business developments of the issuer; actively traded similar or related securities; conversion or exchange rights on the security; related corporate actions; significant events occurring after the close of trading in the security; and changes in overall market conditions. In addition, the closing prices of equity securities that trade in markets outside U.S. time zones may be adjusted to reflect significant events that occur after the close of local trading but before the net asset value of each share class of the fund is determined. Fair valuations and valuations of investments that are not actively trading involve judgment and may differ materially from valuations that would have been used had greater market activity occurred.
Processes and structure — The trust’s board of trustees has delegated authority to the funds’ investment adviser to make fair value determinations, subject to board oversight. The investment adviser has established a Joint Fair Valuation Committee (the “Fair Valuation Committee”) to administer, implement and oversee the fair valuation process, and to make fair value decisions. The Fair Valuation Committee regularly reviews its own fair value decisions, as well as decisions made under its standing instructions to the investment adviser’s valuation teams. The Fair Valuation Committee reviews changes in fair value measurements from period to period and may, as deemed appropriate, update the fair valuation guidelines to better reflect the results of back testing and address new or evolving issues. The Fair Valuation Committee reports any changes to the fair valuation guidelines to the board of trustees with supplemental information to support the changes. The trust’s board and audit committee also regularly review reports that describe fair value determinations and methods.
The funds’ investment adviser has also established a Fixed-Income Pricing Review Group to administer and oversee the fixed-income valuation process, including the use of fixed-income pricing vendors. This group regularly reviews pricing vendor information and market data. Pricing decisions, processes and controls over security valuation are also subject to additional internal reviews, including an annual control self-evaluation program facilitated by the investment adviser’s compliance group.
| The American Funds Tax-Exempt Series I | 29 |
Classifications — The funds’ investment adviser classifies the funds’ assets and liabilities into three levels based on the inputs used to value the assets or liabilities. Level 1 values are based on quoted prices in active markets for identical securities. Level 2 values are based on significant observable market inputs, such as quoted prices for similar securities and quoted prices in inactive markets. Certain securities trading outside the U.S. may transfer between Level 1 and Level 2 due to valuation adjustments resulting from significant market movements following the close of local trading. Level 3 values are based on significant unobservable inputs that reflect the investment adviser’s determination of assumptions that market participants might reasonably use in valuing the securities. The valuation levels are not necessarily an indication of the risk or liquidity associated with the underlying investment. For example, U.S. government securities are reflected as Level 2 because the inputs used to determine fair value may not always be quoted prices in an active market. At January 31, 2016, all of the investment securities held by each fund were classified as Level 2.
4. Risk factors
Investing in each fund may involve certain risks including, but not limited to, those described below.
Risks of investing in municipal bonds issued in the state of Maryland or Virginia — Because the funds invest primarily in securities of issuers in the state of Maryland or Virginia, the funds are more susceptible to factors adversely affecting issuers of the respective state’s securities than a comparable municipal bond mutual fund that does not concentrate its investments in a single state. Both states are affected by changes in levels of federal funding and financial support of certain industries, as well as by federal spending cutbacks due to the large number of residents who are employed by the federal government. In addition, each state is dependent on certain economic sectors. Maryland’s economy is largely dependent on the government, education, health services, retail trade, finance, insurance and real estate sectors. Virginia’s economy is largely dependent on the government and service sectors, manufacturing, wholesale and retail trade, financial services, insurance and real estate. To the extent there are changes to any of these sectors, the funds may be adversely impacted.
Market conditions — The prices of, and the income generated by, the securities held by the funds may decline - sometimes rapidly or unpredictably - due to various factors, including events or conditions affecting the general economy or particular industries; overall market changes; local, regional or global political, social or economic instability; governmental or governmental agency responses to economic conditions; and currency exchange rate, interest rate and commodity price fluctuations.
Issuer risks — The prices of, and the income generated by, securities held by the funds may decline in response to various factors directly related to the issuers of such securities, including reduced demand for an issuer’s goods or services, poor management performance and strategic initiatives such as mergers, acquisitions or dispositions and the market response to any such initiatives.
| 30 | The American Funds Tax-Exempt Series I |
Investing in municipal securities —The yield and/or value of each fund’s investments in municipal securities may be adversely affected by events tied to the municipal securities markets, which can be very volatile and significantly impacted by unfavorable legislative or political developments and negative changes in the financial conditions of municipal securities issuers and the economy. To the extent the fund invests in obligations of a municipal issuer, the volatility, credit quality and performance of the fund may be adversely impacted by local political and economic conditions of the issuer. For example, a credit rating downgrade, bond default or bankruptcy involving an issuer within a particular state or territory could affect the market values and marketability of many or all municipal obligations of that state or territory. Income from municipal securities held by the fund could also be declared taxable because of changes in tax laws or interpretations by taxing authorities or as a result of noncompliant conduct of a municipal issuer. Additionally, the relative amount of publicly available information about municipal securities is generally less than that for corporate securities.
Investing in debt instruments — The prices of, and the income generated by, bonds and other debt instruments held by the funds may be affected by changing interest rates and by changes in the effective maturities and credit ratings of these securities.
Rising interest rates will generally cause the prices of bonds and other debt securities to fall. Falling interest rates may cause an issuer to redeem, call or refinance a debt security before its stated maturity, which may result in a fund having to reinvest the proceeds in lower yielding securities. Longer maturity debt securities generally have greater sensitivity to changes in interest rates and may be subject to greater price fluctuations than shorter maturity debt securities.
Bonds and other debt securities are also subject to credit risk, which is the possibility that the credit strength of an issuer will weaken and/or an issuer of a debt security will fail to make timely payments of principal or interest and the security will go into default. Lower quality debt securities generally have higher rates of interest and may be subject to greater price fluctuations than higher quality debt securities. Credit risk is gauged, in part, by the credit ratings of the debt securities in which a fund invests. However, ratings are only the opinions of the rating agencies issuing them and are not guarantees as to credit quality or an evaluation of market risk. The funds’ investment adviser relies on its own credit analysts to research issuers and issues in seeking to mitigate various credit and default risks.
Credit and liquidity support — Changes in the credit quality of banks and financial institutions providing credit and liquidity support features with respect to securities held by the funds could cause the values of these securities to decline.
Investing in lower rated debt instruments — Lower rated bonds and other lower rated debt securities generally have higher rates of interest and involve greater risk of default or price declines due to changes in the issuer’s creditworthiness than those of higher quality debt securities. The market prices of these securities may fluctuate more than the
| The American Funds Tax-Exempt Series I | 31 |
prices of higher quality debt securities and may decline significantly in periods of general economic difficulty. These risks may be increased with respect to investments in junk bonds.
Thinly traded securities — There may be little trading in the secondary market for particular bonds or other debt securities, which may make them more difficult to value, acquire or sell.
Investing in similar municipal bonds — Investing significantly in municipal obligations of issuers in the same state or backed by revenues of similar types of projects or industries may make the funds more susceptible to certain economic, political or regulatory occurrences. As a result, the potential for fluctuations in the funds’ share prices may increase.
Management — The investment adviser to the funds actively manages the funds’ investments. Consequently, the funds are subject to the risk that the methods and analyses employed by the investment adviser in this process may not produce the desired results. This could cause the funds to lose value or their investment results to lag relevant benchmarks or other funds with similar objectives.
5. Taxation and distributions
Federal income taxation — Each fund complies with the requirements under Subchapter M of the Internal Revenue Code applicable to mutual funds and intends to distribute substantially all of its net income and net capital gains each year. The funds are not subject to income taxes to the extent taxable income and net capital gains are distributed. Generally, income earned by each fund is exempt from federal income taxes; however, each fund may earn taxable income from certain investments.
As of and during the period ended January 31, 2016, neither fund had a liability for any unrecognized tax benefits. The funds recognize interest and penalties, if any, related to unrecognized tax benefits as income tax expense in the statement of operations. During the period, neither fund incurred any significant interest or penalties.
The funds are not subject to examination by U.S. federal tax authorities or state tax authorities for tax years before 2011.
Distributions — Distributions paid to shareholders are based on each fund’s net investment income and net realized gains determined on a tax basis, which may differ from net investment income and net realized gains for financial reporting purposes. These differences are due primarily to different treatment for items such as short-term capital gains and losses; capital losses related to sales of certain securities within 30 days of purchase; deferred expenses; net capital losses; amortization of premiums and discounts; and income on certain investments. The fiscal year in which amounts are distributed may differ from the year in which the net investment income and net realized gains are recorded by the funds for financial reporting purposes.
| 32 | The American Funds Tax-Exempt Series I |
The components of distributable earnings on a tax basis are reported as of each fund’s most recent year-end. As of July 31, 2015, the components of distributable earnings on a tax basis were as follows (dollars in thousands):
| | | Maryland fund | | | Virginia fund | |
| Undistributed tax-exempt income | | $ | 11 | | | $ | 106 | |
| Capital loss carryforward*: | | | | | | | | |
| No expiration | | | (5,130 | ) | | | (4,324 | ) |
| Expiring 2018 | | | (2,271 | ) | | | — | |
| Expiring 2019 | | | (73 | ) | | | — | |
| | | $ | (7,474 | ) | | $ | (4,324 | ) |
| * | The capital loss carryforward will be used to offset any capital gains realized by each fund in the current year or in subsequent years through the expiration dates. Neither fund will make distributions from capital gains while a capital loss carryforward remains. |
Under the Regulated Investment Company Modernization Act of 2010 (the “Act”), net capital losses recognized after July 31, 2011, may be carried forward indefinitely, and their character is retained as short-term and/or long-term losses. Previously, net capital losses were carried forward for eight years and treated as short-term losses. As a transition rule, the Act requires that post-enactment net capital losses be used before pre-enactment net capital losses.
As of January 31, 2016, the tax basis unrealized appreciation (depreciation) and cost of investment securities were as follows (dollars in thousands):
| | | Maryland fund | | | Virginia fund | |
| Gross unrealized appreciation on investment securities | | $ | 14,746 | | | $ | 28,562 | |
| Gross unrealized depreciation on investment securities | | | (1,721 | ) | | | (3,646 | ) |
| Net unrealized appreciation on investment securities | | | 13,025 | | | | 24,916 | |
| Cost of investment securities | | | 298,828 | | | | 455,832 | |
Tax-exempt income distributions paid or accrued to shareholders of each fund were as follows (dollars in thousands):
| Maryland fund | | | | | | |
| | | | | | | |
| | | Six months ended | | | Year ended | |
| | | January 31, | | | July 31, | |
| Share class | | 2016 | | | 2015 | |
| Class A | | $ | 3,652 | | | $ | 7,985 | |
| Class B | | | 4 | | | | 14 | |
| Class C | | | 327 | | | | 730 | |
| Class F-1 | | | 236 | | | | 501 | |
| Class F-2 | | | 420 | | | | 723 | |
| Total | | $ | 4,639 | | | $ | 9,953 | |
| The American Funds Tax-Exempt Series I | 33 |
| Virginia fund | | | | | | |
| | | | | | | |
| | | Six months ended | | | Year ended | |
| | | January 31, | | | July 31, | |
| Share class | | 2016 | | | 2015 | |
| Class A | | $ | 5,323 | | | $ | 11,102 | |
| Class B | | | 5 | | | | 20 | |
| Class C | | | 374 | | | | 804 | |
| Class F-1 | | | 295 | | | | 650 | |
| Class F-2 | | | 797 | | | | 1,465 | |
| Total | | $ | 6,794 | | | $ | 14,041 | |
6. Fees and transactions with related parties
CRMC, the funds’ investment adviser, is the parent company of American Funds Distributors,® Inc. (“AFD”), the principal underwriter of the funds’ shares, and American Funds Service Company® (“AFS”), the funds’ transfer agent. CRMC, AFD and AFS are considered related parties to the funds.
Investment advisory services — Each fund has an investment advisory agreement with CRMC that provides for monthly fees accrued daily. These fees are based on a series of decreasing annual rates beginning with 0.300% on the first $60 million of each fund’s daily net assets and decreasing to 0.180% on such assets in excess of $1 billion. The agreement also provides for monthly fees, accrued daily, of 3.00% of the first $3,333,333 of each fund’s monthly gross income and 2.50% on such income in excess of $3,333,333. For the six months ended January 31, 2016, the investment advisory services fee was $538,000 and $780,000, which was equivalent to an annualized rate of 0.345% and 0.328% of average daily net assets for the Maryland and Virginia funds, respectively.
Class-specific fees and expenses — Expenses that are specific to individual share classes are accrued directly to the respective share class of each fund. The principal class-specific fees and expenses are further described below:
Distribution services — Each fund has plans of distribution for all share classes, except Class F-2 shares. Under the plans, the board of trustees approves certain categories of expenses that are used to finance activities primarily intended to sell fund shares and service existing accounts. The plans provide for payments, based on an annualized percentage of average daily net assets, with plan limits of 0.25% for Class A shares and 1.00% for Class B and C shares. For Class F-1 shares, each fund’s plan limit is 0.50% of which 0.25% is currently the approved limit. All share classes with a plan may use up to 0.25% of each fund’s average daily net assets to pay service fees, or to compensate AFD for paying service fees, to firms that have entered into agreements with AFD to provide certain shareholder services. The remaining amounts available to be paid under each plan are paid to dealers to compensate them for their sales activities.
For Class A shares, distribution-related expenses include the reimbursement of dealer and wholesaler commissions paid by AFD for certain shares sold without a
| 34 | The American Funds Tax-Exempt Series I |
sales charge. This share class of each fund reimburses AFD for amounts billed within the prior 15 months but only to the extent that the overall annual expense limit of 0.25% is not exceeded. As of January 31, 2016, unreimbursed expenses subject to reimbursement totaled $71,000 for the Maryland fund and $177,000 for the Virginia fund.
Transfer agent services — Each fund has a shareholder services agreement with AFS under which each fund compensates AFS for providing transfer agent services to each of the funds’ share classes. These services include recordkeeping, shareholder communications and transaction processing. In addition, each fund reimburses AFS for amounts paid to third parties for performing transfer agent services on behalf of its respective fund shareholders.
Administrative services — Each fund has an administrative services agreement with CRMC under which each fund compensates CRMC for providing administrative services to Class A, C and F shares. These services include, but are not limited to, coordinating, monitoring, assisting and overseeing third parties that provide services to fund shareholders. Under the agreement, Class A shares of each fund pay an annual fee of 0.01% and Class C and F shares of each fund pay an annual fee of 0.05% of their respective average daily net assets.
For the six months ended January 31, 2016, class-specific expenses under the agreements for each fund were as follows (dollars in thousands):
| Maryland fund | | | | | | | | | |
| | | | | | | | | | |
| | | Distribution | | | Transfer agent | | | Administrative | |
| Share class | | services | | | services | | | services | |
| Class A | | | $301 | | | | $40 | | | | $12 | |
| Class B | | | 2 | | | | — | * | | | Not applicable | |
| Class C | | | 144 | | | | 5 | | | | 7 | |
| Class F-1 | | | 20 | | | | 9 | | | | 4 | |
| Class F-2 | | | Not applicable | | | | 15 | | | | 7 | |
| Total class-specific expenses | | | $467 | | | | $69 | | | | $30 | |
| Virginia fund | | | | | | | | | | | | |
| | | | | | | | | | | | | |
| | | Distribution | | | Transfer agent | | | Administrative | |
| Share class | | services | | | services | | | services | |
| Class A | | | $458 | | | | $54 | | | | $19 | |
| Class B | | | 2 | | | | — | * | | | Not applicable | |
| Class C | | | 176 | | | | 5 | | | | 9 | |
| Class F-1 | | | 25 | | | | 13 | | | | 5 | |
| Class F-2 | | | Not applicable | | | | 30 | | | | 13 | |
| Total class-specific expenses | | | $661 | | | | $102 | | | | $46 | |
| * | Amount less than one thousand. |
| The American Funds Tax-Exempt Series I | 35 |
Trustees’ deferred compensation — Trustees who are unaffiliated with CRMC may elect to defer the cash payment of part or all of their compensation. These deferred amounts, which remain as liabilities of the funds, are treated as if invested in shares of the funds or other American Funds. These amounts represent general, unsecured liabilities of the funds and vary according to the total returns of the selected funds. Trustees’ compensation of $18,000 in the Maryland fund’s statement of operations includes $20,000 in current fees (either paid in cash or deferred) and a net decrease of $2,000 in the value of the deferred amounts. Trustees’ compensation of $20,000 in the Virginia fund’s statement of operations includes $23,000 in current fees (either paid in cash or deferred) and a net decrease of $3,000 in the value of the deferred amounts.
Affiliated officers and trustees — Officers and certain trustees of the trust are or may be considered to be affiliated with CRMC, AFD or AFS. No affiliated officers or trustees received any compensation directly from the funds.
7. Capital share transactions
Capital share transactions in the funds were as follows (dollars and shares in thousands):
| Maryland fund | | | | | | | | | | | | | | | | | | | | | | | | |
| | | | | | | | | | | | | | | | | | | | | | | | | |
| | | | | | | | | Reinvestments | | | | | | | | | Net (decrease) | |
| | | Sales* | | | of dividends | | | Repurchases* | | | increase | |
| Share class | | Amount | | | Shares | | | Amount | | | Shares | | | Amount | | | Shares | | | Amount | | | Shares | |
| | | | | | | | | | | | | | | | | | | | | | | | | |
| Six months ended January 31, 2016 | | | | | | | | | | | | | | | | | | | | | | | | |
| | | | | | | | | | | | | | | | | | | | | | | | | |
| Class A | | $ | 14,433 | | | | 910 | | | $ | 3,318 | | | | 209 | | | $ | (22,908 | ) | | | (1,446 | ) | | $ | (5,157 | ) | | | (327 | ) |
| Class B | | | — | † | | | — | † | | | 4 | | | | — | † | | | (69 | ) | | | (4 | ) | | | (65 | ) | | | (4 | ) |
| Class C | | | 2,730 | | | | 172 | | | | 299 | | | | 19 | | | | (2,481 | ) | | | (157 | ) | | | 548 | | | | 34 | |
| Class F-1 | | | 928 | | | | 58 | | | | 215 | | | | 13 | | | | (2,020 | ) | | | (127 | ) | | | (877 | ) | | | (56 | ) |
| Class F-2 | | | 6,779 | | | | 428 | | | | 378 | | | | 24 | | | | (3,415 | ) | | | (216 | ) | | | 3,742 | | | | 236 | |
| Total net increase (decrease) | | $ | 24,870 | | | | 1,568 | | | $ | 4,214 | | | | 265 | | | $ | (30,893 | ) | | | (1,950 | ) | | $ | (1,809 | ) | | | (117 | ) |
| | | | | | | | | | | | | | | | | | | | | | | | | | | | | | | | | |
| Year ended July 31, 2015 | | | | | | | | | | | | | | | | | | | | | | | | |
| | | | | | | | | | | | | | | | | | | | | | | | | | | | | | | | | |
| Class A | | $ | 23,046 | | | | 1,438 | | | $ | 7,276 | | | | 455 | | | $ | (34,176 | ) | | | (2,137 | ) | | $ | (3,854 | ) | | | (244 | ) |
| Class B | | | — | † | | | — | † | | | 14 | | | | 1 | | | | (330 | ) | | | (21 | ) | | | (316 | ) | | | (20 | ) |
| Class C | | | 4,271 | | | | 267 | | | | 666 | | | | 42 | | | | (7,482 | ) | | | (468 | ) | | | (2,545 | ) | | | (159 | ) |
| Class F-1 | | | 3,633 | | | | 227 | | | | 454 | | | | 28 | | | | (3,511 | ) | | | (219 | ) | | | 576 | | | | 36 | |
| Class F-2 | | | 7,508 | | | | 469 | | | | 659 | | | | 41 | | | | (2,581 | ) | | | (161 | ) | | | 5,586 | | | | 349 | |
| Total net increase (decrease) | | $ | 38,458 | | | | 2,401 | | | $ | 9,069 | | | | 567 | | | $ | (48,080 | ) | | | (3,006 | ) | | $ | (553 | ) | | | (38 | ) |
| 36 | The American Funds Tax-Exempt Series I |
| Virginia fund | | | | | | | | | | | | | | | | | | | | | | | | |
| | | | | | | | | | | | | | | | | | | | | | | | | |
| | | | | | | | | Reinvestments | | | | | | | | | Net increase | |
| | | Sales* | | | of dividends | | | Repurchases* | | | (decrease) | |
| Share class | | Amount | | | Shares | | | Amount | | | Shares | | | Amount | | | Shares | | | Amount | | | Shares | |
| | | | | | | | | | | | | | | | | | | | | | | | | |
| Six months ended January 31, 2016 | | | | | | | | | | | | | | | | | | | | | | |
| | | | | | | | | | | | | | | | | | | | | | | | | | | | | | | | | |
| Class A | | $ | 21,766 | | | | 1,294 | | | $ | 4,939 | | | | 294 | | | $ | (18,845 | ) | | | (1,123 | ) | | $ | 7,860 | | | | 465 | |
| Class B | | | 4 | | | | — | † | | | 4 | | | | — | † | | | (194 | ) | | | (11 | ) | | | (186 | ) | | | (11 | ) |
| Class C | | | 3,179 | | | | 190 | | | | 343 | | | | 20 | | | | (2,467 | ) | | | (147 | ) | | | 1,055 | | | | 63 | |
| Class F-1 | | | 842 | | | | 50 | | | | 289 | | | | 17 | | | | (1,890 | ) | | | (112 | ) | | | (759 | ) | | | (45 | ) |
| Class F-2 | | | 8,995 | | | | 535 | | | | 768 | | | | 46 | | | | (4,780 | ) | | | (284 | ) | | | 4,983 | | | | 297 | |
| Total net increase (decrease) | | $ | 34,786 | | | | 2,069 | | | $ | 6,343 | | | | 377 | | | $ | (28,176 | ) | | | (1,677 | ) | | $ | 12,953 | | | | 769 | |
| | | | | | | | | | | | | | | | | | | | | | | | | | | | | | | | | |
| Year ended July 31, 2015 | | | | | | | | | | | | | | | | | | | | | | |
| | | | | | | | | | | | | | | | | | | | | | | | | | | | | | | | | |
| Class A | | $ | 42,814 | | | | 2,531 | | | $ | 10,227 | | | | 605 | | | $ | (50,099 | ) | | | (2,959 | ) | | $ | 2,942 | | | | 177 | |
| Class B | | | — | † | | | — | † | | | 18 | | | | 1 | | | | (665 | ) | | | (40 | ) | | | (647 | ) | | | (39 | ) |
| Class C | | | 5,253 | | | | 310 | | | | 745 | | | | 44 | | | | (6,364 | ) | | | (377 | ) | | | (366 | ) | | | (23 | ) |
| Class F-1 | | | 4,008 | | | | 237 | | | | 639 | | | | 38 | | | | (6,577 | ) | | | (389 | ) | | | (1,930 | ) | | | (114 | ) |
| Class F-2 | | | 16,596 | | | | 977 | | | | 1,403 | | | | 83 | | | | (5,900 | ) | | | (349 | ) | | | 12,099 | | | | 711 | |
| Total net increase (decrease) | | $ | 68,671 | | | | 4,055 | | | $ | 13,032 | | �� | | 771 | | | $ | (69,605 | ) | | | (4,114 | ) | | $ | 12,098 | | | | 712 | |
| * | Includes exchanges between share classes of the fund. |
| † | Amount less than one thousand. |
8. Investment transactions
The Maryland fund and the Virginia fund made purchases of investment securities of $32,828,000 and $40,409,000 and sales of investment securities of $39,103,000 and $33,011,000, respectively, during the six months ended January 31, 2016. Short-term securities and U.S. government obligations, if any, were excluded.
9. Subsequent events
On March 17, 2016, the Board of Trustees approved a proposal to merge the Maryland fund and the Virginia fund into The Tax-Exempt Bond Fund of America, subject to shareholder approval. Shareholder meetings regarding the merger proposal are expected to occur on or about June 10, 2016. If approved, the mergers are expected to occur on or about June 17, 2016.
| The American Funds Tax-Exempt Series I | 37 |
The Tax-Exempt Fund of Maryland
Financial highlights
| | | | | | Income (loss) from investment operations1 | |
| | | Net asset
value,
beginning
of period | | | Net
investment
income | | | Net gains
(losses) on
securities (both
realized and
unrealized) | | | Total from
investment
operations | |
| Class A: | | | | | | | | | | | | | | | | |
| Six months ended 1/31/20163,4 | | $ | 15.81 | | | $ | .25 | | | $ | .15 | | | $ | .40 | |
| Year ended 7/31/2015 | | | 15.96 | | | | .52 | | | | (.16 | ) | | | .36 | |
| Year ended 7/31/2014 | | | 15.73 | | | | .52 | | | | .23 | | | | .75 | |
| Year ended 7/31/2013 | | | 16.51 | | | | .51 | | | | (.78 | ) | | | (.27 | ) |
| Year ended 7/31/2012 | | | 15.58 | | | | .53 | | | | .93 | | | | 1.46 | |
| Year ended 7/31/2011 | | | 15.74 | | | | .55 | | | | (.16 | ) | | | .39 | |
| Class B: | | | | | | | | | | | | | | | | |
| Six months ended 1/31/20163,4 | | | 15.81 | | | | .19 | | | | .15 | | | | .34 | |
| Year ended 7/31/2015 | | | 15.96 | | | | .40 | | | | (.16 | ) | | | .24 | |
| Year ended 7/31/2014 | | | 15.73 | | | | .40 | | | | .23 | | | | .63 | |
| Year ended 7/31/2013 | | | 16.51 | | | | .39 | | | | (.78 | ) | | | (.39 | ) |
| Year ended 7/31/2012 | | | 15.58 | | | | .41 | | | | .93 | | | | 1.34 | |
| Year ended 7/31/2011 | | | 15.74 | | | | .43 | | | | (.16 | ) | | | .27 | |
| Class C: | | | | | | | | | | | | | | | | |
| Six months ended 1/31/20163,4 | | | 15.81 | | | | .19 | | | | .15 | | | | .34 | |
| Year ended 7/31/2015 | | | 15.96 | | | | .39 | | | | (.16 | ) | | | .23 | |
| Year ended 7/31/2014 | | | 15.73 | | | | .39 | | | | .23 | | | | .62 | |
| Year ended 7/31/2013 | | | 16.51 | | | | .38 | | | | (.78 | ) | | | (.40 | ) |
| Year ended 7/31/2012 | | | 15.58 | | | | .40 | | | | .93 | | | | 1.33 | |
| Year ended 7/31/2011 | | | 15.74 | | | | .42 | | | | (.16 | ) | | | .26 | |
| Class F-1: | | | | | | | | | | | | | | | | |
| Six months ended 1/31/20163,4 | | | 15.81 | | | | .24 | | | | .15 | | | | .39 | |
| Year ended 7/31/2015 | | | 15.96 | | | | .50 | | | | (.16 | ) | | | .34 | |
| Year ended 7/31/2014 | | | 15.73 | | | | .50 | | | | .23 | | | | .73 | |
| Year ended 7/31/2013 | | | 16.51 | | | | .48 | | | | (.78 | ) | | | (.30 | ) |
| Year ended 7/31/2012 | | | 15.58 | | | | .51 | | | | .93 | | | | 1.44 | |
| Year ended 7/31/2011 | | | 15.74 | | | | .53 | | | | (.16 | ) | | | .37 | |
| Class F-2: | | | | | | | | | | | | | | | | |
| Six months ended 1/31/20163,4 | | | 15.81 | | | | .26 | | | | .15 | | | | .41 | |
| Year ended 7/31/2015 | | | 15.96 | | | | .54 | | | | (.16 | ) | | | .38 | |
| Year ended 7/31/2014 | | | 15.73 | | | | .54 | | | | .23 | | | | .77 | |
| Year ended 7/31/2013 | | | 16.51 | | | | .53 | | | | (.78 | ) | | | (.25 | ) |
| Year ended 7/31/2012 | | | 15.58 | | | | .56 | | | | .93 | | | | 1.49 | |
| Year ended 7/31/2011 | | | 15.74 | | | | .58 | | | | (.16 | ) | | | .42 | |
| | | Six months ended
January 31, | | | Year ended July 31 |
| | | 20163,4,5 | | | 2015 | | 2014 | | 2013 | | 2012 | | 2011 |
| Portfolio turnover rate for all share classes | | | 11% | | | | 27 | % | | | 11 | % | | | 13 | % | | | 7 | % | | | 9 | % |
| 38 | The American Funds Tax-Exempt Series I |
Dividends
(from net
investment
income) | | | Net asset
value, end
of period | | | Total
return2 | | | Net assets,
end of period
(in millions) | | | Ratio of
expenses
to average
net assets | | | Ratio of
net income
to average
net assets | |
| | | | | | | | | | | | | | | | | | | | | | | |
| $ | (.24 | ) | | $ | 15.97 | | | | 2.56 | %5 | | $ | 242 | | | | .68 | %6 | | | 3.23 | %6 |
| | (.51 | ) | | | 15.81 | | | | 2.26 | | | | 245 | | | | .69 | | | | 3.23 | |
| | (.52 | ) | | | 15.96 | | | | 4.83 | | | | 251 | | | | .70 | | | | 3.25 | |
| | (.51 | ) | | | 15.73 | | | | (1.73 | ) | | | 274 | | | | .67 | | | | 3.10 | |
| | (.53 | ) | | | 16.51 | | | | 9.51 | | | | 304 | | | | .67 | | | | 3.30 | |
| | (.55 | ) | | | 15.58 | | | | 2.54 | | | | 271 | | | | .67 | | | | 3.55 | |
| | | | | | | | | | | | | | | | | | | | | | | |
| | (.18 | ) | | | 15.97 | | | | 2.18 | 5 | | | 1 | | | | 1.43 | 6 | | | 2.49 | 6 |
| | (.39 | ) | | | 15.81 | | | | 1.51 | | | | — | 7 | | | 1.42 | | | | 2.48 | |
| | (.40 | ) | | | 15.96 | | | | 4.07 | | | | 1 | | | | 1.44 | | | | 2.52 | |
| | (.39 | ) | | | 15.73 | | | | (2.45 | ) | | | 2 | | | | 1.41 | | | | 2.36 | |
| | (.41 | ) | | | 16.51 | | | | 8.71 | | | | 2 | | | | 1.40 | | | | 2.59 | |
| | (.43 | ) | | | 15.58 | | | | 1.79 | | | | 4 | | | | 1.42 | | | | 2.80 | |
| | | | | | | | | | | | | | | | | | | | | | | |
| | (.18 | ) | | | 15.97 | | | | 2.16 | 5 | | | 29 | | | | 1.47 | 6 | | | 2.44 | 6 |
| | (.38 | ) | | | 15.81 | | | | 1.47 | | | | 29 | | | | 1.47 | | | | 2.44 | |
| | (.39 | ) | | | 15.96 | | | | 4.01 | | | | 31 | | | | 1.49 | | | | 2.47 | |
| | (.38 | ) | | | 15.73 | | | | (2.50 | ) | | | 39 | | | | 1.46 | | | | 2.31 | |
| | (.40 | ) | | | 16.51 | | | | 8.64 | | | | 41 | | | | 1.46 | | | | 2.51 | |
| | (.42 | ) | | | 15.58 | | | | 1.74 | | | | 37 | | | | 1.47 | | | | 2.75 | |
| | | | | | | | | | | | | | | | | | | | | | | |
| | (.23 | ) | | | 15.97 | | | | 2.50 | 5 | | | 16 | | | | .80 | 6 | | | 3.11 | 6 |
| | (.49 | ) | | | 15.81 | | | | 2.15 | | | | 16 | | | | .80 | | | | 3.12 | |
| | (.50 | ) | | | 15.96 | | | | 4.71 | | | | 16 | | | | .82 | | | | 3.14 | |
| | (.48 | ) | | | 15.73 | | | | (1.88 | ) | | | 17 | | | | .82 | | | | 2.96 | |
| | (.51 | ) | | | 16.51 | | | | 9.40 | | | | 20 | | | | .76 | | | | 3.20 | |
| | (.53 | ) | | | 15.58 | | | | 2.43 | | | | 16 | | | | .77 | | | | 3.44 | |
| | | | | | | | | | | | | | | | | | | | | | | |
| | (.25 | ) | | | 15.97 | | | | 2.63 | 5 | | | 28 | | | | .55 | 6 | | | 3.37 | 6 |
| | (.53 | ) | | | 15.81 | | | | 2.40 | | | | 24 | | | | .56 | | | | 3.36 | |
| | (.54 | ) | | | 15.96 | | | | 4.97 | | | | 19 | | | | .57 | | | | 3.38 | |
| | (.53 | ) | | | 15.73 | | | | (1.59 | ) | | | 17 | | | | .54 | | | | 3.25 | |
| | (.56 | ) | | | 16.51 | | | | 9.70 | | | | 16 | | | | .49 | | | | 3.47 | |
| | (.58 | ) | | | 15.58 | | | | 2.74 | | | | 12 | | | | .47 | | | | 3.74 | |
| 1 | Based on average shares outstanding. |
| 2 | Total returns exclude any applicable sales charges, including contingent deferred sales charges. |
| 3 | Unaudited. |
| 4 | Based on operations for the period shown and, accordingly, is not representative of a full year. |
| 5 | Not annualized. |
| 6 | Annualized. |
| 7 | Amount less than $1 million. |
See Notes to Financial Statements
| The American Funds Tax-Exempt Series I | 39 |
The Tax-Exempt Fund of Virginia
Financial highlights
| | | | | | Income (loss) from investment operations1 | |
| | | Net asset
value,
beginning
of period | | | Net
investment
income | | | Net gains
(losses) on
securities (both
realized and
unrealized) | | | Total from
investment
operations | |
| Class A: | | | | | | | | | | | | | | | | |
| Six months ended 1/31/20163,4 | | $ | 16.73 | | | $ | .25 | | | $ | .22 | | | $ | .47 | |
| Year ended 7/31/2015 | | | 16.84 | | | | .53 | | | | (.12 | ) | | | .41 | |
| Year ended 7/31/2014 | | | 16.47 | | | | .53 | | | | .37 | | | | .90 | |
| Year ended 7/31/2013 | | | 17.44 | | | | .52 | | | | (.97 | ) | | | (.45 | ) |
| Year ended 7/31/2012 | | | 16.47 | | | | .56 | | | | .97 | | | | 1.53 | |
| Year ended 7/31/2011 | | | 16.65 | | | | .58 | | | | (.18 | ) | | | .40 | |
| Class B: | | | | | | | | | | | | | | | | |
| Six months ended 1/31/20163,4 | | | 16.73 | | | | .18 | | | | .22 | | | | .40 | |
| Year ended 7/31/2015 | | | 16.84 | | | | .41 | | | | (.13 | ) | | | .28 | |
| Year ended 7/31/2014 | | | 16.47 | | | | .41 | | | | .37 | | | | .78 | |
| Year ended 7/31/2013 | | | 17.44 | | | | .39 | | | | (.97 | ) | | | (.58 | ) |
| Year ended 7/31/2012 | | | 16.47 | | | | .43 | | | | .97 | | | | 1.40 | |
| Year ended 7/31/2011 | | | 16.65 | | | | .46 | | | | (.18 | ) | | | .28 | |
| Class C: | | | | | | | | | | | | | | | | |
| Six months ended 1/31/20163,4 | | | 16.73 | | | | .18 | | | | .22 | | | | .40 | |
| Year ended 7/31/2015 | | | 16.84 | | | | .39 | | | | (.11 | ) | | | .28 | |
| Year ended 7/31/2014 | | | 16.47 | | | | .40 | | | | .37 | | | | .77 | |
| Year ended 7/31/2013 | | | 17.44 | | | | .38 | | | | (.97 | ) | | | (.59 | ) |
| Year ended 7/31/2012 | | | 16.47 | | | | .42 | | | | .97 | | | | 1.39 | |
| Year ended 7/31/2011 | | | 16.65 | | | | .45 | | | | (.18 | ) | | | .27 | |
| Class F-1: | | | | | | | | | | | | | | | | |
| Six months ended 1/31/20163,4 | | | 16.73 | | | | .24 | | | | .22 | | | | .46 | |
| Year ended 7/31/2015 | | | 16.84 | | | | .51 | | | | (.12 | ) | | | .39 | |
| Year ended 7/31/2014 | | | 16.47 | | | | .51 | | | | .37 | | | | .88 | |
| Year ended 7/31/2013 | | | 17.44 | | | | .49 | | | | (.97 | ) | | | (.48 | ) |
| Year ended 7/31/2012 | | | 16.47 | | | | .54 | | | | .97 | | | | 1.51 | |
| Year ended 7/31/2011 | | | 16.65 | | | | .56 | | | | (.18 | ) | | | .38 | |
| Class F-2: | | | | | | | | | | | | | | | | |
| Six months ended 1/31/20163,4 | | | 16.73 | | | | .26 | | | | .22 | | | | .48 | |
| Year ended 7/31/2015 | | | 16.84 | | | | .55 | | | | (.12 | ) | | | .43 | |
| Year ended 7/31/2014 | | | 16.47 | | | | .55 | | | | .37 | | | | .92 | |
| Year ended 7/31/2013 | | | 17.44 | | | | .54 | | | | (.97 | ) | | | (.43 | ) |
| Year ended 7/31/2012 | | | 16.47 | | | | .59 | | | | .97 | | | | 1.56 | |
| Year ended 7/31/2011 | | | 16.65 | | | | .60 | | | | (.18 | ) | | | .42 | |
| | | Six months ended
January 31, | | | Year ended July 31 |
| | | 20163,4,5 | | | 2015 | | 2014 | | 2013 | | 2012 | | 2011 |
| Portfolio turnover rate for all share classes | | | 8% | | | | 14 | % | | | 12 | % | | | 15 | % | | | 9 | % | | | 10 | % |
| 40 | The American Funds Tax-Exempt Series I |
Dividends
(from net
investment
income) | | | Net asset
value, end
of period | | | Total
return2 | | | Net assets,
end of period
(in millions) | | | Ratio of
expenses
to average
net assets | | | Ratio of
net income
to average
net assets | |
| | | | | | | | | | | | | | | | | | | | | | | |
| $ | (.25 | ) | | $ | 16.95 | | | | 2.80 | %5 | | $ | 374 | | | | .64 | %6 | | | 2.90 | %6 |
| | (.52 | ) | | | 16.73 | | | | 2.43 | | | | 361 | | | | .66 | | | | 3.12 | |
| | (.53 | ) | | | 16.84 | | | | 5.57 | | | | 361 | | | | .67 | | | | 3.23 | |
| | (.52 | ) | | | 16.47 | | | | (2.70 | ) | | | 376 | | | | .65 | | | | 2.99 | |
| | (.56 | ) | | | 17.44 | | | | 9.42 | | | | 394 | | | | .66 | | | | 3.29 | |
| | (.58 | ) | | | 16.47 | | | | 2.47 | | | | 343 | | | | .65 | | | | 3.53 | |
| | | | | | | | | | | | | | | | | | | | | | | |
| | (.18 | ) | | | 16.95 | | | | 2.43 | 5 | | | — | 7 | | | 1.36 | 6 | | | 2.20 | 6 |
| | (.39 | ) | | | 16.73 | | | | 1.69 | | | | 1 | | | | 1.39 | | | | 2.40 | |
| | (.41 | ) | | | 16.84 | | | | 4.80 | | | | 1 | | | | 1.41 | | | | 2.49 | |
| | (.39 | ) | | | 16.47 | | | | (3.41 | ) | | | 2 | | | | 1.39 | | | | 2.26 | |
| | (.43 | ) | | | 17.44 | | | | 8.62 | | | | 3 | | | | 1.39 | | | | 2.57 | |
| | (.46 | ) | | | 16.47 | | | | 1.71 | | | | 4 | | | | 1.41 | | | | 2.77 | |
| | | | | | | | | | | | | | | | | | | | | | | |
| | (.18 | ) | | | 16.95 | | | | 2.40 | 5 | | | 36 | | | | 1.43 | 6 | | | 2.11 | 6 |
| | (.39 | ) | | | 16.73 | | | | 1.63 | | | | 34 | | | | 1.45 | | | | 2.33 | |
| | (.40 | ) | | | 16.84 | | | | 4.74 | | | | 35 | | | | 1.46 | | | | 2.44 | |
| | (.38 | ) | | | 16.47 | | | | (3.45 | ) | | | 38 | | | | 1.44 | | | | 2.21 | |
| | (.42 | ) | | | 17.44 | | | | 8.56 | | | | 43 | | | | 1.45 | | | | 2.50 | |
| | (.45 | ) | | | 16.47 | | | | 1.66 | | | | 38 | | | | 1.45 | | | | 2.74 | |
| | | | | | | | | | | | | | | | | | | | | | | |
| | (.24 | ) | | | 16.95 | | | | 2.74 | 5 | | | 21 | | | | .76 | 6 | | | 2.79 | 6 |
| | (.50 | ) | | | 16.73 | | | | 2.32 | | | | 21 | | | | .77 | | | | 3.00 | |
| | (.51 | ) | | | 16.84 | | | | 5.43 | | | | 23 | | | | .80 | | | | 3.10 | |
| | (.49 | ) | | | 16.47 | | | | (2.83 | ) | | | 37 | | | | .79 | | | | 2.86 | |
| | (.54 | ) | | | 17.44 | | | | 9.30 | | | | 38 | | | | .76 | | | | 3.18 | |
| | (.56 | ) | | | 16.47 | | | | 2.36 | | | | 28 | | | | .76 | | | | 3.42 | |
| | | | | | | | | | | | | | | | | | | | | | | |
| | (.26 | ) | | | 16.95 | | | | 2.87 | 5 | | | 56 | | | | .52 | 6 | | | 3.03 | 6 |
| | (.54 | ) | | | 16.73 | | | | 2.56 | | | | 51 | | | | .53 | | | | 3.24 | |
| | (.55 | ) | | | 16.84 | | | | 5.70 | | | | 39 | | | | .54 | | | | 3.36 | |
| | (.54 | ) | | | 16.47 | | | | (2.57 | ) | | | 29 | | | | .52 | | | | 3.12 | |
| | (.59 | ) | | | 17.44 | | | | 9.59 | | | | 26 | | | | .50 | | | | 3.43 | |
| | (.60 | ) | | | 16.47 | | | | 2.64 | | | | 17 | | | | .49 | | | | 3.69 | |
| 1 | Based on average shares outstanding. |
| 2 | Total returns exclude any applicable sales charges, including contingent deferred sales charges. |
| 3 | Unaudited. |
| 4 | Based on operations for the period shown and, accordingly, is not representative of a full year. |
| 5 | Not annualized. |
| 6 | Annualized. |
| 7 | Amount less than $1 million. |
See Notes to Financial Statements
| The American Funds Tax-Exempt Series I | 41 |
As a fund shareholder, you incur two types of costs: (1) transaction costs, such as initial sales charges on purchase payments and contingent deferred sales charges on redemptions (loads), and (2) ongoing costs, including management fees, distribution and service (12b-1) fees, and other expenses. This example is intended to help you understand your ongoing costs (in dollars) of investing in the fund so you can compare these costs with the ongoing costs of investing in other mutual funds. The examples are based on an investment of $1,000 invested at the beginning of the period and held for the entire six-month period (August 1, 2015, through January 31, 2016).
Actual expenses:
The first line of each share class in the tables on the following page provides information about actual account values and actual expenses. You may use the information in this line, together with the amount you invested, to estimate the expenses that you paid over the period. Simply divide your account value by $1,000 (for example, an $8,600 account value divided by $1,000 = 8.6), then multiply the result by the number in the first line under the heading entitled “Expenses paid during period” to estimate the expenses you paid on your account during this period.
Hypothetical example for comparison purposes:
The second line of each share class in the tables on the following page provides information about hypothetical account values and hypothetical expenses based on the actual expense ratio for the share class and an assumed rate of return of 5.00% per year before expenses, which is not the actual return of the share class. The hypothetical account values and expenses may not be used to estimate the actual ending account balance or expenses you paid for the period. You may use this information to compare the ongoing costs of investing in the fund and other funds. To do so, compare this 5.00% hypothetical example with the 5.00% hypothetical examples that appear in the shareholder reports of the other funds.
Notes:
Retirement plan participants may be subject to certain fees charged by the plan sponsor and Class F-1 and F-2 shareholders may be subject to fees charged by financial intermediaries, typically ranging from 0.75% to 1.50% of assets annually depending on services offered. You can estimate the impact of these fees by adding the amount of the fees to the total estimated expenses you paid on your account during the period as calculated above. In addition, your ending account value would be lower by the amount of these fees.
Note that the expenses shown in the tables on the following page are meant to highlight your ongoing costs only and do not reflect any transactional costs, such as sales charges (loads). Therefore, the second line of each share class in the tables is useful in comparing ongoing costs only and will not help you determine the relative total costs of owning different funds. In addition, if these transactional costs were included, your costs would have been higher.
| 42 | The American Funds Tax-Exempt Series I |
The Tax-Exempt Fund of Maryland
| | | Beginning
account value
8/1/2015 | | | Ending
account value
1/31/2016 | | | Expenses paid
during period* | | | Annualized
expense ratio | |
| Class A – actual return | | $ | 1,000.00 | | | $ | 1,025.64 | | | $ | 3.46 | | | | .68 | % |
| Class A – assumed 5% return | | | 1,000.00 | | | | 1,021.72 | | | | 3.46 | | | | .68 | |
| Class B – actual return | | | 1,000.00 | | | | 1,021.81 | | | | 7.27 | | | | 1.43 | |
| Class B – assumed 5% return | | | 1,000.00 | | | | 1,017.95 | | | | 7.25 | | | | 1.43 | |
| Class C – actual return | | | 1,000.00 | | | | 1,021.60 | | | | 7.47 | | | | 1.47 | |
| Class C – assumed 5% return | | | 1,000.00 | | | | 1,017.75 | | | | 7.46 | | | | 1.47 | |
| Class F-1 – actual return | | | 1,000.00 | | | | 1,025.00 | | | | 4.07 | | | | .80 | |
| Class F-1 – assumed 5% return | | | 1,000.00 | | | | 1,021.11 | | | | 4.06 | | | | .80 | |
| Class F-2 – actual return | | | 1,000.00 | | | | 1,026.33 | | | | 2.80 | | | | .55 | |
| Class F-2 – assumed 5% return | | | 1,000.00 | | | | 1,022.37 | | | | 2.80 | | | | .55 | |
| | | | | | | | | | | | | | | | | |
| The Tax-Exempt Fund of Virginia |
| |
| | | Beginning
account value
8/1/2015 | | | Ending
account value
1/31/2016 | | | Expenses paid
during period* | | | Annualized
expense ratio | |
| Class A – actual return | | $ | 1,000.00 | | | $ | 1,028.03 | | | $ | 3.26 | | | | .64 | % |
| Class A – assumed 5% return | | | 1,000.00 | | | | 1,021.92 | | | | 3.25 | | | | .64 | |
| Class B – actual return | | | 1,000.00 | | | | 1,024.27 | | | | 6.92 | | | | 1.36 | |
| Class B – assumed 5% return | | | 1,000.00 | | | | 1,018.30 | | | | 6.90 | | | | 1.36 | |
| Class C – actual return | | | 1,000.00 | | | | 1,023.97 | | | | 7.28 | | | | 1.43 | |
| Class C – assumed 5% return | | | 1,000.00 | | | | 1,017.95 | | | | 7.25 | | | | 1.43 | |
| Class F-1 – actual return | | | 1,000.00 | | | | 1,027.44 | | | | 3.87 | | | | .76 | |
| Class F-1 – assumed 5% return | | | 1,000.00 | | | | 1,021.32 | | | | 3.86 | | | | .76 | |
| Class F-2 – actual return | | | 1,000.00 | | | | 1,028.66 | | | | 2.65 | | | | .52 | |
| Class F-2 – assumed 5% return | | | 1,000.00 | | | | 1,022.52 | | | | 2.64 | | | | .52 | |
| * | The “expenses paid during period” are equal to the “annualized expense ratio,” multiplied by the average account value over the period, multiplied by the number of days in the period, and divided by 366 (to reflect the one-half year period). |
| The American Funds Tax-Exempt Series I | 43 |
Offices of the fund and of the investment adviser
Capital Research and Management Company
333 South Hope Street
Los Angeles, CA 90071-1406
6455 Irvine Center Drive
Irvine, CA 92618-4518
Transfer agent for shareholder accounts
American Funds Service Company
(Write to the address near you.)
P.O. Box 6007
Indianapolis, IN 46206-6007
P.O. Box 2280
Norfolk, VA 23501-2280
Custodian of assets
JPMorgan Chase Bank
270 Park Avenue
New York, NY 10017-2070
Counsel
Dechert LLP
1900 K Street, NW
Washington, DC 20006-1110
Independent registered public accounting firm
PricewaterhouseCoopers LLP
601 South Figueroa Street
Los Angeles, CA 90017-5704
Principal underwriter
American Funds Distributors, Inc.
333 South Hope Street
Los Angeles, CA 90071-1406
| 44 | The American Funds Tax-Exempt Series I |
Investors should carefully consider investment objectives, risks, charges and expenses. This and other important information is contained in the funds’ prospectus and summary prospectus, which can be obtained from your financial professional and should be read carefully before investing. You may also call American Funds Service Company (AFS) at (800) 421-4225 or visit the American Funds website at americanfunds.com.
“American Funds Proxy Voting Procedures and Principles” — which describes how we vote proxies relating to portfolio securities — is available on the American Funds website or upon request by calling AFS. The funds file their proxy voting record with the U.S. Securities and Exchange Commission (SEC) for the 12 months ended June 30 by August 31. The proxy voting record is available free of charge on the SEC website at sec.gov and on the American Funds website.
Complete January 31, 2016, portfolios of The Tax-Exempt Fund of Maryland and The Tax-Exempt Fund of Virginia’s investments are available free of charge by calling AFS or visiting the SEC website (where they are part of Form N-CSR).
The Tax-Exempt Fund of Maryland and The Tax-Exempt Fund of Virginia file a complete list of their portfolio holdings with the SEC for the first and third quarters of each fiscal year on Form N-Q. This filing is available free of charge on the SEC website. You may also review or, for a fee, copy this filing at the SEC’s Public Reference Room in Washington, D.C. Additional information regarding the operation of the Public Reference Room may be obtained by calling the SEC’s Office of Investor Education and Advocacy at (800) SEC-0330. Additionally, the list of portfolio holdings is available by calling AFS.
This report is for the information of shareholders of The Tax-Exempt Fund of Maryland and The Tax-Exempt Fund of Virginia, but it also may be used as sales literature when preceded or accompanied by the current prospectus or summary prospectus, which gives details about charges, expenses, investment objectives and operating policies of the funds. If used as sales material after March 31, 2016, this report must be accompanied by an American Funds statistical update for the most recently completed calendar quarter.
The American Funds AdvantageSM
Since 1931, American Funds, part of Capital Group, has helped investors pursue long-term investment success. Our consistent approach — in combination with The Capital SystemSM — has resulted in a superior long-term track record.
Aligned with investor success
We base our decisions on a long-term perspective, which we believe aligns our goals with the interests of our clients. Our portfolio managers average 27 years of investment experience, including 22 years at our company, reflecting a career commitment to our long-term approach.1
The Capital SystemSM
The Capital System combines individual accountability with teamwork. Funds using The Capital System are divided into portions that are managed independently by investment professionals with diverse backgrounds, ages and investment approaches. An extensive global research effort is the backbone of our system.
Superior long-term track record
Our equity funds have beaten their Lipper peer indexes in 91% of 10-year periods and 95% of 20-year periods. Our fixed-income funds have beaten their Lipper indexes in 58% of 10-year periods and 58% of 20-year periods.2 Our fund management fees have been among the lowest in the industry.3
| 1 | Portfolio manager experience as of December 31, 2015. |
| 2 | Based on Class A share results for rolling periods through December 31, 2015. Periods covered are the shorter of the fund’s lifetime or since the comparable Lipper index inception date (except Capital Income Builder and SMALLCAP World Fund, for which the Lipper average was used). |
| 3 | On average, our management fees were in the lowest quintile 68% of the time, based on the 20-year period ended December 31, 2015, versus comparable Lipper categories, excluding funds of funds. |
