Within our product lines, Telephonics is an important supplier to large prime contractors in the defense industry such as Lockheed Martin Corporation (“Lockheed Martin”), The Boeing Company (“Boeing”), Northrop Grumman Corporation (“Northrop Grumman”), MacDonald Dettwiler and Associates Ltd., Airbus, Agusta Westland, Sikorsky Aircraft (“Sikorsky”), and the DoD.
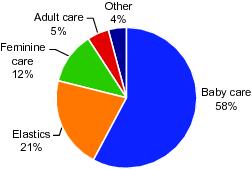
In our PPC business, we have emerged as a leading global provider of plastic films used in a wide variety of consumer and industrial applications. Our core diaper film ranks #1 globally, and we maintain a top three position in North America, Europe and Brazil for a variety of other products, including feminine hygiene products and protective barriers for surgical or industrial gowns.
Our market leadership across our subsidiaries is driven by a reputation for product innovation, high quality, strong customer service, breadth of product portfolio, strong brands and ability to compete effectively in all relevant channels.
Stable and diversified customer base with long-standing relationships
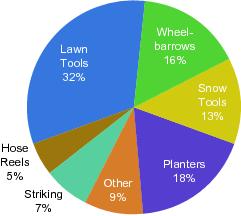
We have long-standing relationships with a large and expansive customer base. In our Home & Building Products business, we are the leading supplier of residential garage doors and non-powered lawn and garden tools for many of the industry’s leading companies, including The Home Depot, Inc. (“Home Depot”), Lowe’s Companies, Inc. (“Lowe’s”), Wal-mart Stores Inc. (“Walmart”), Costco Wholesale Corporation (“Costco”), Rona Inc. (“Rona”), Bunnings Warehouse (“Bunnings”), Woodies, Ace, True Value Company, W.W. Grainger, Inc. (“Grainger”), ORS Nasco and Canadian Tire Corporation, Limited (“Canadian Tire”). In many cases, we have grown along with these customers, often maintaining sales offices adjacent to the customer to ensure efficient product placement and timely service. We also work closely with numerous mass merchants, clubs, regional retailers, co-ops and approximately 2,000 installing dealers. We are especially proud to be the sole supplier of residential garage doors for The Home Depot and principal supplier for Menards. CBP distributes its garage doors directly to customer from its manufacturing facilities and through its distribution centers located throughout the U.S. and Canada.
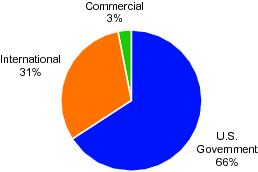
The success of our Telephonics segment has been driven by our strategic nexus with the U.S. government and its agencies, which we have served for over 30 years. Additionally, we have been a major supplier of information and communications technologies to many of the world’s most prestigious aerospace and defense firms, including Boeing, Northrop Grumman, General Dynamics and Lockheed Martin.
At PPC, our largest customer is P&G with whom we have maintained a mutually beneficial relationship for 30 years. Other key customers include 3M, Kimberly-Clark, Johnson & Johnson, SCA, Avery Dennison and First Quality.
Throughout our history, we have earned a leading position with our customers by leveraging our innovative products, customer service and scale to successfully meet our partners’ product and logistical goals. We understand the strategic importance of these relationships and are highly focused on building these relationships into the future.
Well capitalized balance sheet and healthy cash flow generation
We have maintained a well capitalized balance sheet with seasonal working capital usage and adequate cash balances. As of March 31, 2016, we had a total debt, net of issuance costs of $941.8 million (gross debt of $957.2 million), cash of $54.3 million and net debt to adjusted EBITDA ratio of 4.77x. Our operating cash usage in the first six months of the current fiscal year was mostly related to seasonal inventory build at AMES. Accordingly, we expect strong positive cash flow generation in the second half of the year. We expect stable cash flow generation from operations to continue. In addition, we have historically
maintained relatively low normalized capital expenditure levels of approximately 3% to 5% of net sales, which we believe contributes to a favorable cash flow profile.
Attractive end-market outlook across our businesses
Our business segments participate in three distinct industries—building products, aerospace and defense and plastics each with unique attributes and market drivers.
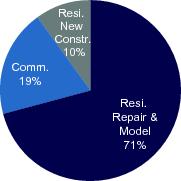
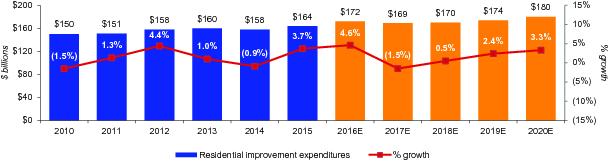
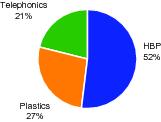
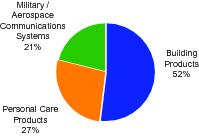
Comprising over 50% of our revenue, the Home & Building Products segment will lead our overall business in the near-term as the housing market continues to recover from its historic bottom. We believe we will benefit from our exposure to the more resilient R&R market, which, according to IHS Economics, is forecast to experience a 1.9% compounded annual growth rate from 2015-2020.
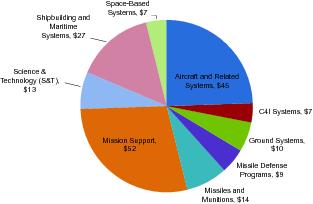
Our Telephonics segment is entering a period of uncertainty surrounding the U.S. military’s long-term plans and budget constraints; however, the DoD continues to modernize or refresh its weapons systems with advanced electronic information and communications systems similar to those in which we are a leading provider. Historically, Telephonics has been a consistent performer, driven by our long-standing relationship with the U.S. government and the segment’s strong funded backlog, which was $446 million as of March 31, 2016. “Funded backlog” means unfilled firm orders for our products for which funding has been both authorized and appropriated by the customer—Congress, in the case of U.S. Government agencies.
According to Technavio, global baby diaper market is expected to grow at a CAGR of 4.76% in terms of revenue over the period 2014-2019. We believe that our PPC business is particularly well suited to benefit from the positive macro-economic trends affecting emerging markets. As the global economy recovers and the middle class grows, households are projected to spend more of their discretionary income on personal hygiene items, a trend that is expected to spur growth in our core diaper and feminine care offerings.
Strong and highly experienced management team
We have a highly experienced management team with a successful track record of profitable growth and demonstrated leadership in cyclical markets, including an ability to reduce costs, improve operational efficiencies and successfully introduce new products. Griffon’s senior management team has an average of 29 years of professional experience and average of 6 years with Griffon. Our management holds, and will continue to hold, a significant equity interest in our company reflecting their confidence in, and ongoing commitment to, the future growth and success of our businesses.
Business Strategy
Focus on capital and operating efficiency
We manage our business using various qualitative and quantitative measures of success, including a proven commitment to deploying capital in areas with the greatest expected returns and maximizing free cash flow generation. We will continue to manage our business with rigorous financial and operating discipline aimed at improving value for our shareholders, lenders, customers, employees and communities. As a result, we will continue to implement a variety of strategies to proactively increase financial and operating performance and enhance cash flow, including manufacturing productivity initiatives, joint ventures and raw materials sourcing arrangements.
Emphasize new product development and innovation
We will continue to invest capital to develop new products and enhance the functionality of our existing products. In response to evolving customer requirements, we routinely
12
update our core products and technologies and coordinate with customers at the earliest stages of new program and product development. As an established innovator, we will continue to leverage our engineering and scientific capabilities to exceed our customers’ minimum specifications, providing them with greater performance, flexibility and value. The selection of our R&D projects is based on available opportunities in the marketplace, as well as input from our customers. Over the past 3 years, we have invested $71.4 million in our R&D initiatives.
Leverage our existing global presence across our businesses to target major multinational and regional customers
We will continue to leverage our existing global relationships and market-share leading positions to target new multinational and regional customers. We will also continue to work closely with external research firms and other organizations to identify and capitalize on emerging consumer and professional end-user trends. In addition, we plan to leverage our extensive distribution network to market our existing products more broadly and to aggressively rollout our new, technologically enhanced product offerings. We have been successful in expanding our customer base in international markets and will continue to use our incumbent status on major platforms to bolster our international presence.
Continuous improvement and cost savings initiatives
We are highly focused on cost reductions and margin improvement. In addition to our existing programs, we will continue to implement new initiatives and operating strategies at the corporate and segment level to further enhance our performance. Initiatives are developed and tracked at the segment level with corporate guidance. For example:
|
| | • | | In January 2013, AMES undertook to close certain US manufacturing facilities and consolidate affected operations primarily into its Camp Hill and Carlisle locations. The actions, completed at the end of the 2015 first quarter, improved manufacturing and distribution efficiencies, allowed for in-sourcing of certain production previously performed by third party suppliers, and improved material flow and absorption of fixed costs. Management estimates that AMES’ initiative resulted in annual cash savings exceeding $10.0 million. Realization of expected savings began in the 2015 second quarter. |
|
| | • | | Through the 2013 Plastics Europe restructuring, we exited low margin businesses and eliminated approximately 80 positions. |
|
| | • | | During the third quarter of 2016, PPC anticipates incurring pre-tax restructuring and related exit costs approximating $5.0 million primarily related to headcount reductions at PPC’s Dombuhl, Germany facility, other location headcount reductions and for costs related to the shut down of PPC’s Turkey facility. The Dombuhl charges are related to an optimization plan that will drive innovation and enhance our industry leading position in printed breathable back sheet. The facility will be transformed into a state of the art hygiene products facility focused on breathable printed film and siliconized products. In conjunction with this effort, our customer base will be streamlined, and we will dispose of old assets and reduce overhead costs, allowing for gains in efficiencies. |
Optimize global footprint
Over the long-term, we plan to continue to optimize our manufacturing and distribution networks in existing and select new geographic markets. Where appropriate, we will continue to pursue joint ventures and other agreements to leverage the operating experience, technical expertise and local market knowledge of our strategic partners.
13
Enhance positions, product and service offerings through strategic acquisitions
Making strategic acquisitions is an important part of our growth plan. Building products, in particular the non-powered lawn and garden industry is highly-fragmented and provides significant acquisition opportunities. As global economic conditions improve, we will continue to seek out, evaluate and, where appropriate, acquire additional businesses that can benefit from our global distribution channels and offer potentially attractive returns on capital. We regularly review potential acquisition opportunities and frequently participate in processes in which we submit indications of interest and occasionally execute letters of intent. While many of these expressions of interest fail to result in actual acquisitions, we believe that our proven ability to identify and integrate acquisitions, as well as our strong balance sheet and access to capital, enhances our credibility as an acquirer with sellers and their representatives.
We have historically funded our acquisitions and other growth initiatives with cash on hand, through free cash flow generated from our business as well as through external financing sources. Where we have utilized debt financing, we believe we have financed such growth appropriately in order to maintain a conservative leverage profile, both at our operating subsidiaries and at the holding company level.
14
Summary Historical Consolidated Financial Data
The following table presents our summary historical consolidated financial data as of and for the periods presented. This information should only be read in conjunction with “Management’s Discussion and Analysis of Financial Condition and Results of Operations,” in our Annual Report on Form 10-K for the fiscal year ended September 30, 2015 and our Quarterly Report on Form 10-Q for the quarter ended March 31, 2016, and our consolidated financial statements and the notes related thereto, which are contained therein. The summary historical financial data for the years ended September 30, 2015, 2014 and 2013 have been derived from our audited consolidated financial statements. The summary financial data for the six months ended March 31, 2016 and 2015 were derived from our unaudited consolidated financial statements. The summary unaudited financial data for the twelve months ended March 31, 2016 has been derived by adding our operating results and cash flow for our fiscal year ended September 30, 2015 and for the six months period ended March 31, 2016 and deducting such financial data for the six months ended March 31, 2015. The unaudited financial statements have been prepared on the same basis as the audited financial statements and include, in the opinion of our management, all normal recurring adjustments necessary for a fair presentation of the information set forth herein.
| | | | | | | | | | | | |
| | For the Years Ended September 30, | | Six Months
Ended
March 31, | | Twelve
Months
Ended
March 31, |
| | 2013(1) | | 2014(2) | | 2015(3) | | 2015 | | 2016 | | 2016 |
| | (Dollars in thousands) |
Operating Results Data: | | | | | | | | | | | | |
Revenue | | | $ | | 1,871,327 | | | | $ | | 1,991,811 | | | | $ | | 2,016,032 | | | | $ | | 1,002,180 | | | | $ | | 994,256 | | | | $ | | 2,008,108 | |
Cost of goods and services | | | | 1,453,742 | | | | | 1,532,412 | | | | | 1,540,254 | | | | | 769,816 | | | | | 763,994 | | | | | 1,534,432 | |
| | | | | | | | | | | | |
Gross profit | | | | 417,585 | | | | | 459,399 | | | | | 475,778 | | | | | 232,364 | | | | | 230,262 | | | | | 473,676 | |
Selling, general administrative expenses. | | | | 340,469 | | | | | 375,099 | | | | | 374,761 | | | | | 187,462 | | | | | 182,885 | | | | | 370,184 | |
Restructuring and other related charges | | | | 13,262 | | | | | 6,136 | | | | | — | | | | | — | | | | | — | | | | | — | |
| | | | | | | | | | | | |
Total operating expenses | | | | 353,731 | | | | | 381,235 | | | | | 374,761 | | | | | 187,462 | | | | | 182,885 | | | | | 370,184 | |
Income from operations | | | | 63,854 | | | | | 78,164 | | | | | 101,017 | | | | | 44,902 | | | | | 47,377 | | | | | 103,492 | |
Other income (expense) | | | | | | | | | | | | |
Interest expense | | | | (52,520 | ) | | | | | (48,447 | ) | | | | | (48,173 | ) | | | | | (23,766 | ) | | | | | (24,415 | ) | | | | | (48,822 | ) | |
Interest income | | | | 353 | | | | | 303 | | | | | 301 | | | | | 272 | | | | | 55 | | | | | 84 | |
Loss from debt extinguishment and Other, net | | | | 2,646 | | | | | (35,736 | ) | | | | | 491 | | | | | (1,208 | ) | | | | | 170 | | | | | 1,869 | |
| | | | | | | | | | | | |
Total other income (expense) | | | | (49,521 | ) | | | | | (83,880 | ) | | | | | (47,381 | ) | | | | | (24,702 | ) | | | | | (24,190 | ) | | | | | (46,869 | ) | |
| | | | | | | | | | | | |
Income (loss) before taxes | | | | 14,333 | | | | | (5,716 | ) | | | | | 53,636 | | | | | 20,200 | | | | | 23,187 | | | | | 56,623 | |
Provision (benefit) for income taxes | | | | 7,543 | | | | | (5,539 | ) | | | | | 19,347 | | | | | 7,607 | | | | | 8,496 | | | | | 20,236 | |
| | | | | | | | | | | | |
Income (loss) from continuing operations | | | | 6,790 | | | | | (177 | ) | | | | | 34,289 | | | | | 12,593 | | | | | 14,691 | | | | | 36,387 | |
Discontinued operations: | | | | | | | | | | | | |
Loss from operations of discontinued business | | | | (4,651 | ) | | | | | (— | ) | | | | | (— | ) | | | | | (— | ) | | | | | (— | ) | | | | | (— | ) | |
Benefit from income taxes | | | | 1,628 | | | | | (— | ) | | | | | (— | ) | | | | | (— | ) | | | | | (— | ) | | | | | (— | ) | |
Loss from discontinued operations | | | | (3,023 | ) | | | | | (— | ) | | | | | (— | ) | | | | | (— | ) | | | | | (— | ) | | | | | (— | ) | |
| | | | | | | | | | | | |
Net Income (loss) | | | $ | | 3,767 | | | | $ | | (177 | ) | | | | $ | | 34,289 | | | | $ | | 12,593 | | | | $ | | 14,691 | | | | $ | | 36,387 | |
| | | | | | | | | | | | |
Cash Flow Data: | | | | | | | | | | | | |
Net cash provided by (used in) | | | | | | | | | | | | |
Operating activities | | | $ | | 85,683 | | | | $ | | 93,301 | | | | $ | | 76,137 | | | | $ | | (43,051 | ) | | | | $ | | (5,408 | ) | | | | $ | | 113,780 | |
Investing activities | | | $ | | (62,868 | ) | | | | $ | | (147,250 | ) | | | | $ | | (66,620 | ) | | | | $ | | (30,645 | ) | | | | $ | | (48,839 | ) | | | | $ | | (84,814 | ) | |
Financing activities | | | $ | | (52,249 | ) | | | | $ | | (27,930 | ) | | | | $ | | (44,851 | ) | | | | $ | | (28,206 | ) | | | | $ | | 56,321 | | | | $ | | 39,676 | |
15
| | | | | | | | | | | | |
| | For the Years Ended September 30, | | Six Months
Ended
March 31, | | Twelve
Months
Ended
March 31, |
| | 2013(1) | | 2014(2) | | 2015(3) | | 2015 | | 2016 | | 2016 |
| | (Dollars in thousands) |
Balance Sheet Data: | | | | | | | | | | | | |
Cash and equivalents | | | $ | | 178,130 | | | | $ | | 92,405 | | | | $ | | 52,001 | | | | $ | | 42,602 | | | | $ | | 54,282 | | | | $ | | 54,282 | |
Property, plant and equipment, net | | | | 353,593 | | | | | 370,565 | | | | | 379,972 | | | | | 361,200 | | | | | 386,109 | | | | | 386,109 | |
Total assets | | | | 1,788,779 | | | | | 1,808,826 | | | | | 1,731,433 | | | | | 1,747,253 | | | | | 1,778,514 | | | | | 1,778,514 | |
Total debt, net | | | | 677,672 | | | | | 799,187 | | | | | 843,569 | | | | | 867,477 | | | | | 941,780 | | | | | 941,780 | |
Total liabilities | | | | 1,138,315 | | | | | 1,276,799 | | | | | 1,300,908 | | | | | 1,282,621 | | | | | 1,353,133 | | | | | 1,353,133 | |
Total shareholders’ equity | | | | 650,464 | | | | | 532,027 | | | | | 430,525 | | | | | 464,632 | | | | | 425,381 | | | | | 425,381 | |
Other Financial Data: | | | | | | | | | | | | |
Capital expenditures | | | $ | | 64,441 | | | | $ | | 77,094 | | | | $ | | 73,620 | | | | $ | | 39,713 | | | | $ | | 45,952 | | | | $ | | 79,859 | |
Depreciation and amortization | | | | 70,748 | | | | | 67,396 | | | | | 69,800 | | | | | 34,453 | | | | | 34,202 | | | | | 69,549 | |
EBITDA(4) | | | | 137,248 | | | | | 109,824 | | | | | 171,308 | | | | | 78,147 | | | | | 81,749 | | | | | 174,910 | |
Adjusted EBITDA(5) | | | | 165,147 | | | | | 169,484 | | | | | 182,418 | | | | | 83,519 | | | | | 87,304 | | | | | 186,203 | |
Financial Ratios (Pro Forma): | | | | | | | | | | | | |
Cash and equivalents(6) | | | $ | | 54,282 | |
Total senior debt(6) | | | | 859,692 | |
Total net senior debt(6) | | | | 805,410 | |
Total debt(6) | | | | 959,692 | |
Total net debt(6) | | | | 905,410 | |
Total senior leverage ratio | | | | 4.6x | |
Total net senior leverage ratio | | | | 4.3x | |
Total leverage ratio | | | | 5.2x | |
Total net leverage ratio | | | | 4.9x | |
|
| | (1) | | 2013 includes $13,262 of restructuring charges ($8,266, net of tax), a loss on pension settlement of $2,142 ($1,392, net of tax) and discrete tax benefits, net, of $325. |
|
| | (2) | | 2014 includes $6,136 of restructuring charges ($3,804, net of tax), $3,161 of acquisition costs ($1,960, net of tax), $38,890 loss on debt extinguishment ($24,964, net of tax) and discrete tax benefits, net, of $4,674. |
|
| | (3) | | 2015 includes discrete tax benefits, net of $62. |
|
| | (4) | | EBITDA is a non-GAAP measurement that consists of income from continuing operations plus the sum of provision (benefit) for income taxes, interest expense (net of interest income) and depreciation and amortization. The reconciliation from income from continuing operations to EBITDA is as follows: |
| | | | | | | | | | | | |
| | For the Years Ended September 30, | | Six Months Ended
March 31, | | Twelve Months Ended March 31, |
| | 2013 | | 2014 | | 2015 | | 2015 | | 2016 | | 2016 |
| | (Dollars in thousands) |
Income (loss) from continuing operations | | | $ | | 6,790 | | | | $ | | (177 | ) | | | | $ | | 34,289 | | | | $ | | 12,593 | | | | $ | | 14,691 | | | | $ | | 36,387 | |
Add/(deduct): | | | | | | | | | | | | |
Provision (benefit) for income taxes | | | | 7,543 | | | | | (5,539 | ) | | | | | 19,347 | | | | | 7,607 | | | | | 8,496 | | | | | 20,236 | |
Interest expense, net. | | | | 52,167 | | | | | 48,144 | | | | | 47,872 | | | | | 23,494 | | | | | 24,360 | | | | | 48,738 | |
Depreciation and Amortization | | | | 70,748 | | | | | 67,396 | | | | | 69,800 | | | | | 34,453 | | | | | 34,202 | | | | | 69,549 | |
| | | | | | | | | | | | |
EBITDA | | | $ | | 137,248 | | | | $ | | 109,824 | | | | $ | | 171,308 | | | | $ | | 78,147 | | | | $ | | 81,749 | | | | $ | | 174,910 | |
| | | | | | | | | | | | |
|
| | (5) | | Adjusted EBITDA is a non-GAAP measurement that consists of EBITDA plus the sum of restructuring and other related charges, loss on debt extinguishment and pension settlement, stock compensation and acquisition costs. The reconciliation from EBITDA to Adjusted EBITDA is as follows: |
16
| | | | | | | | | | | | |
| | For the Years Ended September 30, | | Six Months Ended
March 31, | | Trailing
Twelve Months Ended March 31, |
| | 2013 | | 2014 | | 2015 | | 2015 | | 2016 | | 2016 |
| | (Dollars in thousands) |
EBITDA | | | $ | | 137,248 | | | | $ | | 109,824 | | | | $ | | 171,308 | | | | $ | | 78,147 | | | | $ | | 81,749 | | | | $ | | 174,910 | |
Add/(deduct): | | | | | | | | | | | | |
Restructuring charges(a) | | | | 13,262 | | | | | 6,136 | | | | | — | | | | | — | | | | | — | | | | | — | |
Loss from debt extinguishment | | | | — | | | | | 38,890 | | | | | — | | | | | — | | | | | — | | | | | — | |
Loss on pension settlement | | | | 2,142 | | | | | — | | | | | — | | | | | — | | | | | — | | | | | — | |
Stock-based compensation | | | | 12,495 | | | | | 11,473 | | | | | 11,110 | | | | | 5,372 | | | | | 5,555 | | | | | 11,293 | |
Acquisition costs | | | | — | | | | | 3,161 | | | | | — | | | | | — | | | | | — | | | | | — | |
| | | | | | | | | | | | |
Adjusted EBITDA | | | $ | | 165,147 | | | | $ | | 169,484 | | | | $ | | 182,418 | | | | $ | | 83,519 | | | | $ | | 87,304 | | | | $ | | 186,203 | |
| | | | | | | | | | | | |
|
| | (a) | | Restructuring charges primarily related to consolidation of HBP facilities and the Telephonics and Plastics European restructuring. See Management’s Discussion and Analysis of Financial Condition and Results of Operations and our audited financial statements incorporated by reference herein for a description of the restructuring charges by business. |
EBITDA and Adjusted EBITDA are provided for illustrative and informational purposes only and do not purport to represent, and should not be viewed as indicative of, our actual or future financial condition or results of operations. EBITDA and Adjusted EBITDA do not represent and should not be considered as alternatives to net income (loss), operating income (loss), net cash provided by (used in) operating activities or any other measure of operating performance or liquidity that is calculated in accordance with U.S. generally accepted accounting principles. EBITDA and Adjusted EBITDA information has been included in this offering memorandum because we believe that certain analysts, rating agencies and investors may use it as supplemental information to evaluate a company’s ability to service its indebtedness and overall operating performance over time. However, EBITDA and Adjusted EBITDA have material limitations as analytical tools and should not be considered in isolation, or as substitutes for analysis of our results as reported under U.S. generally accepted accounting principles. A limitation associated with EBITDA and Adjusted EBITDA is that they do not reflect the periodic costs of certain capitalized tangible and intangible assets used in generating revenue in our business. Any measure that eliminates components of our capital structure and costs associated with carrying significant amounts of assets on its balance sheet has material limitations as a performance measure. Management evaluates the costs of such tangible and intangible assets through other financial measures such as capital expenditures. In addition, in evaluating EBITDA and Adjusted EBITDA, you should be aware that the adjustments may vary from period to period and in the future we will incur expenses such as those used in calculating these measures. Furthermore, EBITDA and Adjusted EBITDA, as calculated by us, may not be comparable to calculations of similarly titled measures by other companies. In light of the foregoing limitations, we do not rely solely on EBITDA and Adjusted EBITDA as performance measures but also consider its results as calculated in accordance with U.S. generally accepted accounting principles.
|
| | (6) | | Pro forma amounts shown for total senior debt, total net senior debt, total debt and total net debt as of the twelve months ended March 31, 2016 are presented after giving effect to this offering and the application of the net proceeds therefrom. Total senior debt consists of (i) $100 million outstanding under the New Notes offered hereby, (ii) $600 million outstanding under the Existing Notes, (iii) $25 million drawn under our revolving credit facility, (iv) other secured debt of $89.6 million, consisting of outstanding amounts under our ESOP loan, capital leases, real estate mortgages and non-U.S. lines of credit and term loan, and (v) $45.1 million non-U.S. term loan and unsecured portion of ESOP loan. Total debt includes total senior debt plus $100 |
17
|
| | | | million outstanding under our 2017 Notes. Total net senior debt includes total senior debt less pro forma cash and cash equivalents. Total net debt includes total debt less pro forma cash and equivalents. |
|
| | | | On March 22, 2016, Griffon and certain of its subsidiaries amended and restated its revolving credit facility to, among other things, increase the size of the facility form $250 million to $350 million and extend its maturity to March 22, 2021. |
18