Additionally, general market and economic conditions or governmental actions generally may inhibit our successful integration of ClosetMaid.
Further, we will acquire the Business with the expectation that the ClosetMaid Acquisition will result in various benefits including, among other things, benefits relating to enhanced revenues, and increased earnings and cash flows. We believe that this acquisition will strengthen our Home & Building Products’ brand portfolio, expand our manufacturing, distribution and global sourcing capabilities and provide opportunities to leverage the segment. Additionally, we expect to derive potential benefits resulting from increased scale in our Home and Building Products segment which could result in cost savings from increased purchasing power, cross selling opportunities, internal sourcing opportunities, and technological and other operating efficiences. Achieving the anticipated benefits of this acquisition is subject to a number of uncertainties, including whether we can integrate ClosetMaid in an efficient and effective manner, whether or not the expected bases or sources of synergies produce the benefits anticipated and general competitive factors in the marketplace. While we believe that our expectations regarding the achievement of synergies and other benefits of the ClosetMaid Acquisition are reasonable, there can be no assurance that the integration of ClosetMaid’s operations, management and culture into ours will be timely or effectively accomplished. It is possible that the integration process could result in the loss of key employees, the disruption of ClosetMaid and our existing ongoing businesses, or inconsistencies in standards, controls, procedures and policies that adversely affect our ability to maintain relationships with customers.
In addition, our ability to realize the anticipated benefits are subject to significant business, economic and competitive uncertainties and contingencies, many of which are beyond our control, such as changes to government regulation governing or otherwise impacting our industry, reductions in service levels under our contracts, operating difficulties, customer preferences, changes in competition and general economic or industry conditions. Consequently, we may overestimate the synergies that will result from the Transactions or underestimate the cost of implementing such synergies.
Further, successful integration of our and ClosetMaid’s operations and personnel will place an additional burden on our management and our internal resources. The additional burden could lead to diversion of management attention, which could lead to a decrease in our future operating results and thereby negatively impact our financial condition.
Failure to achieve these anticipated benefits on the anticipated timeframe, or at all, could result in a reduction in the trading price of our shares as well as in increased costs, decreases in the amount of expected revenues and diversion of management’s time and energy and could materially and adversely affect our business, financial condition and operating results. Additionally, we will or have made fair value estimates of certain assets and liabilities in recording the ClosetMaid Acquisition. Actual values of these assets and liabilities could differ from our estimates, which could result in our not achieving the
anticipated benefits of the ClosetMaid Acquisition. Finally, any cost savings that are realized may be offset by losses in revenues or other charges to earnings.
Failure to successfully address these and other issues related to the ClosetMaid Acquisition or other expansion could have a material adverse effect on our financial condition and results of operations, and could adversely affect our ability to successfully implement our business strategy. Also, if our growth occurs more slowly than anticipated or declines, our operating results could be materially adversely affected.
The unaudited pro forma financial information included in this document is preliminary, and our actual financial position and operations after the ClosetMaid Acquisition may differ materially from the unaudited pro forma financial information included in this offering memorandum.
The unaudited pro forma condensed combined financial statements included in this offering memorandum are presented for illustrative purposes only and are not necessarily indicative of what our actual financial position or results of operations would have been had the ClosetMaid Acquisition been completed on the dates indicated. Our actual results and financial position after the consummation of the ClosetMaid Acquisition may differ materially and adversely from the unaudited pro forma financial information included in this offering memorandum.
If the ClosetMaid Acquisition does not close, we will have broad discretion as to the use of the proceeds from this offering, and we may not use the proceeds effectively.
The offering will be consummated prior to the closing of the ClosetMaid Acquisition and we expect to use all of the net proceeds from this offering to finance substantially all of the ClosetMaid Acquisition and to pay related fees and expenses. See “Use of Proceeds.” The ClosetMaid Acquisition is expected to close on or about October 2, 2017; the closing, however, is subject to the satisfaction or waiver of certain conditions, which make the completion and timing of the ClosetMaid Acquisition uncertain, and accordingly, there can be no assurance that all of these conditions will be satisfied, or, if they are, as to the timing of such satisfaction. As a result, the ClosetMaid Acquisition may be delayed or not occur at all.
This offering is not conditioned on the completion of the ClosetMaid Acquisition. Accordingly, if you decide to purchase New Notes in this offering, you should be willing to do so without the assumption that we will complete the ClosetMaid Acquisition. In the event that we fail to consummate the ClosetMaid Acquisition, we will have issued a significant amount of New Notes and we will not have acquired the revenue generating assets that would be required to produce the additional earnings, EBITDA and cash flow we anticipated. As a result, failure to consummate the ClosetMaid Acquisition could adversely affect our financial condition and results of operations.
In the event we do not consummate the ClosetMaid Acquisition for any reason, no mandatory redemption of the New Notes will be required and our management will have broad discretion as to the application of the net proceeds from this offering and could use them for purposes other than those contemplated at the time of this offering. The use of the net proceeds for the ClosetMaid Acquisition for other corporate purposes may not yield profitable results or increase our market value.
We intend to pursue strategic alternatives for PPC which may result in the use of a significant amount of our management resources or significant costs, and we may not be able to fully realize the potential benefit of such a transaction.
We are exploring strategic alternatives for PPC. Although we may devote significant time and resources in pursuit of such a transaction, we may struggle to successfully identify such an opportunity or to successfully consummate such a transaction. Should we be unable to identify or consummate a transaction involving a strategic alternative for PPC, our business
32
prospects and operations could be adversely affected as a result of the devotion of the significant managerial efforts required and the challenges of achieving our long-term objectives in the absence of the closing of such a transaction. In addition, we may incur significant costs in connection with seeking a strategic alternative for PPC, regardless of whether a transaction is completed. In the event that we consummate a strategic alternative for PPC in the future, we cannot assure you that we will fully realize the anticipated benefits of such a transaction.
Risks Related to the ClosetMaid Business
ClosetMaid is subject to intense competition in a marketplace dominated by large retailers and e-commerce companies.
ClosetMaid’s principal customers are large mass merchandisers, such as discount stores, home centers, warehouse clubs, office superstores, commercial distributors and e-commerce companies. The dominant share of the market represented by these large mass merchandisers, together with changes in consumer shopping patterns, has contributed to the formation of dominant multi-category retailers and e-commerce companies that have strong negotiating power with suppliers. Current trends among retailers and e-commerce companies include fostering high levels of competition among suppliers, demanding innovative new products and products tailored to each of their unique requirements, requiring suppliers to maintain or reduce product prices in response to competitive, economic or other factors, and requiring product delivery with shorter lead times. Other trends are for retailers and e-commerce companies to import products directly from foreign sources and to source and sell products under their own private label brands, typically at lower prices, that compete with the ClosetMaid’s products.
The combination of these market influences and retailer consolidation has created an intensely competitive environment in which the ClosetMaid’s principal customers continuously evaluate which product suppliers to use, resulting in downward pricing pressures and the need for big, consumer-meaningful brands, the ongoing introduction and commercialization of innovative new products, continuing improvements in category management and customer service, and the maintenance of strong relationships with large, high-volume purchasers. ClosetMaid also faces the risk of changes in the strategy or structure of its major customers, such as overall store and inventory reductions. The intense competition in the retail and e-commerce sectors, combined with the overall economic environment, may result in a number of customers experiencing financial difficulty, or failing in the future. In particular, a loss of, or a failure by, one of ClosetMaid’s large customers could adversely impact ClosetMaid’s sales and operating cash flows. To address these challenges, ClosetMaid must be able to respond to competitive factors, and the failure to respond effectively could result in a loss of sales, reduced profitability and a limited ability to recover cost increases through price increases.
If ClosetMaid is unable to effectively manage its proprietary online sales platform, its reputation and operating results may be harmed.
ClosetMaid sells merchandise over the Internet through its website, www.closetmaid.com, and through mobile applications for smart phones and tablets. ClosetMaid is vulnerable to certain risks and uncertainties associated with its e-commerce websites, including: changes in required technology interfaces; website downtime and other technical failures; costs and technical issues ClosetMaid may be required to upgrade its website software; computer viruses; changes in applicable federal and state regulations; security breaches; and consumer privacy concerns. The failure of ClosetMaid’s website or mobile applications to perform as expected could result in disruptions and costs to its operations and make it more difficult for customers to purchase merchandise online.
33
In addition, ClosetMaid must successfully respond to changing consumer preferences and buying trends relating to e-commerce usage, including the use of new or improved technology, creative user interfaces and other e-commerce marketing tools such as paid search and mobile applications, among others, which may increase its costs and which may not succeed in increasing sales or attracting customers. Many of ClosetMaid’s competitors, some of whom have greater resources than ClosetMaid, may also be able to benefit from changes in e-commerce technologies, which could harm the competitive position of ClosetMaid. ClosetMaid’s failure to successfully respond to these risks and uncertainties might adversely affect the sales in its e-commerce business, as well as damage its reputation and brands.
ClosetMaid faces risks related to the disruption of its primary manufacturing facilities
ClosetMaid’s manufacturing facilities are concentrated in just a few locations, some of which are located abroad in low-cost locations. These locations are subject to disruption for a variety of reasons, such as natural or man-made disasters, terrorist activities, disruptions of our information technology resources, and utility interruptions. Such disruptions may cause delays in shipping ClosetMaid’s products, which could result in the loss of business or customer trust, adversely affecting ClosetMaid’s business and operating results.
Manufacturing capacity constraints or increased manufacturing costs may have a material adverse effect on our business, results of operations, financial condition and cash flows.
ClosetMaid’s current manufacturing resources may be inadequate to meet significantly increased demand for some of its products. ClosetMaid’s ability to increase its manufacturing capacity depends on many factors, including the availability of capital, steadily increasing consumer demand, equipment delivery, construction lead-times, installation, qualification, regulatory permitting and regulatory requirements. Increasing capacity through the use of third party manufacturers may depend on ClosetMaid’s ability to develop and maintain such relationships and the ability of such third parties to devote additional capacity to fill its orders.
A lack of sufficient manufacturing capacity to meet demand could cause ClosetMaid’s customer service levels to decrease, which may negatively affect customer demand for its products and customer relations generally, which in turn could have a material adverse effect on ClosetMaid’s business, results of operations, financial condition and cash flows. In addition, operating facilities at or near capacity may also increase production and distribution costs and negatively affect relations with ClosetMaid’s employees or contractors, which could result in disruptions in our operations.
In addition, ClosetMaid’s manufacturing costs may increase significantly and ClosetMaid may not be able to successfully recover these cost increases with increased pricing to its customers. For example, subsequent to our entering into the Purchase Agreement, ClosetMaid management reported that the trend of increased manufacturing costs that occurred primarily during the quarter ended June 30, 2017 continued through the fourth quarter resulting in continued decreases in ClosetMaid’s operating results. ClosetMaid management also indicated that it expects this trend to impact future results. These increased manufacturing costs could have an adverse impact on our business, results of operations, financial condition and cash flows.
If ClosetMaid is unable to commercialize a continuing stream of new products that create demand, ClosetMaid’s ability to compete in the marketplace may be adversely impacted.
ClosetMaid’s strategy includes investment in new product development and a focus on innovation. Its long-term success in the competitive retail environment and the industrial and commercial markets depends on its ability to develop and commercialize a continuing stream of innovative new products and line extensions that create demand. New product
34
development and commercialization efforts, including efforts to enter markets or product categories in which ClosetMaid has limited or no prior experience, have inherent risks. These risks include the costs involved, such as development and commercialization, product development or launch delays, and the failure of new products and line extensions to achieve anticipated levels of market acceptance or growth in sales or operating income. ClosetMaid also faces the risk that its competitors will introduce innovative new products that compete with ClosetMaid products. In addition, sales generated by new products or line extensions could cause a decline in sales of ClosetMaid’s other existing products. If new product development and commercialization efforts are not successful, ClosetMaid’s financial results could be adversely affected.
If ClosetMaid does not continue to develop and maintain leading brands or realize the anticipated benefits of increased advertising and promotion spend, its operating results may suffer.
ClosetMaid’s ability to compete successfully also depends increasingly on its ability to develop and maintain leading brands so that ClosetMaid’s retail and other customers will need ClosetMaid’s products to meet consumer demand. Leading brands allow ClosetMaid to realize economies of scale in its operations. The development and maintenance of such brands require significant investment in brand-building and marketing initiatives. While ClosetMaid plans to continue to increase its expenditures for advertising and promotion and other brand-building and marketing initiatives over the long term, the initiatives may not deliver the anticipated results and the results of such initiatives may not cover the costs of the increased investment.
35
The loss of large customers can harm financial results.
A small number of customers account for, and are expected to continue to account for, a substantial portion of our consolidated revenue. Approximately 13% and 12% of consolidated revenue and 51% and 49% of the PPC segment revenue for the year ended September 30, 2016 and the nine months ended June 30, 2017 was generated from P&G. Home Depot, Lowe’s, Menards and Bunnings are significant customers of HBP with Home Depot accounting for approximately 13% of consolidated revenue and 24% of HBP’s revenue for the year ended September 30, 2016 and 13% of consolidated revenue and 23% of HBP’s revenue of the nine months ended June 30, 2017. This customer concentration will increase once we integrate ClosetMaid’s business into our Home and Building Products segment, as many of these businesses are large customers of ClosetMaid as well. ClosetMaid’s top ten customers accounted for approximately 74% of ClosetMaid’s total revenue for the nine months ended June 30, 2017. During such period, Home Depot accounted for approximately 48% of ClosetMaid’s sales while Target accounted for 10% of such sales. The U.S. Government and its agencies and subcontractors, including Lockheed Martin and Boeing, is a significant customer of Telephonics, and accounts for approximately 16% of consolidated revenue and 70% of Telephonics segment revenue for the year ended September 30, 2016 and 13% of consolidated revenue and 68% of Telephonics segment revenue for the nine months ended June 30, 2017. Future operating results will continue to substantially depend on the success of our largest customers, as well as our relationship with them. Orders from these customers are subject to fluctuation and may be reduced materially due to changes in customer needs or other factors. Any reduction or delay in sales of products to one or more of these customers could significantly reduce our revenue. Our operating results will also depend on successfully developing relationships with additional key customers. We cannot assure that our largest customers will be retained or that additional key customers will be recruited. Also, HBP and PPC extend credit to their customers, which exposes them to credit risk. HBP’s largest customer accounted for approximately 26% and 14% of HBP’s and our net accounts receivable as of September 30, 2016, respectively. PPC largest customer accounted for approximately 31% and 7% of PPC and our net accounts receivable as of September 30, 2016, respectively. If either of these customers were to become insolvent or otherwise unable to pay its debts, the financial condition, results of operations and cash flows of the respective segments and we could be adversely affected.
36
CAPITALIZATION
The following table sets forth our cash and capitalization as of June 30, 2017:
|
| | • | | on an actual basis; |
|
| | • | | on a pro forma basis to give effect to this offering and the application of the estimated net proceeds therefrom for the consummation of the ClosetMaid Acquisition as set forth under “Use of Proceeds”. |
The historical data in the table are derived from, and should be read in conjunction with “Use of Proceeds,” “Unaudited Pro Forma Condensed Combined Financial Statements” “Summary—Summary Historical Consolidated Financial Data of Griffon Corporation,” “Summary—Summary Historical Consolidated Financial Data of ClosetMaid Corporation,” “Management’s Discussion and Analysis of Financial Condition and Results of Operations,” and the consolidated financial statements and the related notes thereto incorporated herein by reference or attached hereto.
| | | | |
| | Actual | | As Adjusted for this
Offering and application
of net proceeds
for the ClosetMaid Acquisition(5) |
| | (Dollars in thousands) |
Cash and Cash Equivalents | | | $ | | 69,448 | | | | $ | | 58,448 | |
| | | | |
Debt: | | | | |
Revolving Credit Facilty(1) | | | | 163,748 | | | | | 163,748 | |
Existing Notes Due 2022 | | | | 725,000 | | | | | 725,000 | |
New Notes Offered Hereby(2) | | | | — | | | | | 200,000 | |
Other Debt(3) | | | | 121,705 | | | | | 121,705 | |
| | | | |
Total Debt | | | $ | | 1,010,453 | | | | $ | | 1,210,453 | |
Total Equity(4) | | | | 394,088 | | | | | 388,088 | |
| | | | |
Total Capitalization | | | $ | | 1,404,541 | | | | $ | | 1,598,541 | |
| | | | |
|
| | (1) | | As of June 30, 2017, we had $163.7 million outstanding under our revolving credit facility. On an as adjusted basis as of June 30, 2017, there would have been $171.9 million of availability under the revolving credit facility and $14.4 million in letters of credit expected to be outstanding. Assuming the use of proceeds to temporarily repay amounts outstanding under our revolving credit facility and without giving effect to the ClosetMaid Acquisition, approximately $335.6 million under our revolving credit facility would be available for borrowing, subject to certain covenants, all of which would be secured. |
|
| | (2) | | Assumes New Notes are issued at par. |
|
| | (3) | | Amount consists of outstanding amounts under our ESOP loans, capital leases, real estate mortgages, foreign lines of credit and term loans and other long-term debt. |
|
| | (4) | | On August 2, 2017 the Board of Directors declared a quarterly cash dividend of $0.06 per share, payable on September 21, 2017 to shareholders of record as of the close of business on August 24, 2017. |
|
| | (5) | | The completion of this offering is not contingent on the completion of the ClosetMaid Acquisition, which, if completed, may occur subsequent to the closing of this offering. There can be no assurance that we will consummate the ClosetMaid Acquisition. In the event we do not consummate the ClosetMaid Acquisition for any reason, the net proceeds of this offering would be available for general corporate purposes, including to temporarily repay amounts outstanding under our revolving credit facility and the as adjusted capitalization would no longer be applicable. |
37
SELECTED HISTORICAL FINANCIAL DATA OF GRIFFON CORPORATION
The following table presents selected consolidated financial data. This information should only be read in conjunction with “Griffon Corporation’s Management’s Discussion and Analysis of Financial Condition and Results of Operations,” included elsewhere in this offering memorandum, and our consolidated financial statements and the notes related thereto, which are incorporated herein by reference. The selected consolidated financial data for the nine months ended June 30, 2016 and 2017 were derived from our unaudited consolidated financial statements, which are incorporated herein by reference. The unaudited financial statements have been prepared on the same basis as the audited financial statements and, in the opinion of our management, include all normal recurring adjustments necessary for a fair presentation of the information set forth herein. The consolidated financial data for the fiscal years ended September 30, 2012 and 2013 were derived from our audited consolidated financial statements that are not included, or incorporated by reference, in this offering memorandum. The consolidated financial data for the fiscal years ended September 30, 2014, 2015 and 2016 have been derived from our audited consolidated financial statements, which are incorporated herein by reference. Historical results are not necessarily indicative of the results to be expected in the future. In addition, our results for the nine months ended June 30, 2017 are not necessarily indicative of results expected for the full year ending September 30, 2017.
| | | | | | | | | | | | | | |
| | For the Years Ended September 30, | | Nine Months Ended
June 30, |
| | 2012(1) | | 2013(2) | | 2014(3) | | 2015(4) | | 2016(5) | | 2016 | | 2017 |
| | (Dollars in thousands) |
Statement of Operations Data: | | | | | | | | | | | | | | |
Revenue | | | $ | | 1,861,145 | | | | $ | | 1,871,327 | | | | $ | | 1,991,811 | | | | $ | | 2,016,032 | | | | $ | | 1,957,161 | | | | $ | | 1,456,456 | | | | $ | | 1,436,184 | |
Cost of goods and services | | | | 1,442,340 | | | | | 1,453,742 | | | | | 1,532,412 | | | | | 1,540,254 | | | | | 1,483,727 | | | | | 1,106,837 | | | | | 1,088,550 | |
| | | | | | | | | | | | | | |
Gross profit | | | | 418,805 | | | | | 417,585 | | | | | 459,399 | | | | | 475,778 | | | | | 473,434 | | | | | 349,619 | | | | | 347,634 | |
Selling, general and administrative expenses. | | | | 341,696 | | | | | 340,469 | | | | | 375,099 | | | | | 374,761 | | | | | 364,027 | | | | | 271,765 | | | | | 272,972 | |
Restructuring and other related charges | | | | 4,689 | | | | | 13,262 | | | | | 6,136 | | | | | — | | | | | 5,900 | | | | | 5,900 | | | | | — | |
| | | | | | | | | | | | | | |
Total operating expenses | | | | 346,385 | | | | | 353,731 | | | | | 381,235 | | | | | 374,761 | | | | | 369,927 | | | | | 277,665 | | | | | 272,972 | |
Income from operations | | | | 72,420 | | | | | 63,854 | | | | | 78,164 | | | | | 101,017 | | | | | 103,507 | | | | | 71,954 | | | | | 74,662 | |
Other income (expense) | | | | | | | | | | | | | | |
Interest expense | | | | (52,007 | ) | | | | | (52,520 | ) | | | | | (48,447 | ) | | | | | (48,173 | ) | | | | | (51,254 | ) | | | | | (37,454 | ) | | | | | (38,747 | ) | |
Interest income | | | | 292 | | | | | 353 | | | | | 303 | | | | | 301 | | | | | 143 | | | | | 134 | | | | | 46 | |
Loss from debt extinguishment | | | | — | | | | | — | | | | | (38,890 | ) | | | | | — | | | | | — | | | | | — | | | | | — | |
Other, net | | | | 1,236 | | | | | 2,646 | | | | | 3,154 | | | | | 491 | | | | | 768 | | | | | 312 | | | | | (1,176 | ) | |
| | | | | | | | | | | | | | |
Total other income (expense) | | | | (50,479 | ) | | | | | (49,521 | ) | | | | | (83,880 | ) | | | | | (47,381 | ) | | | | | (50,343 | ) | | | | | (37,008 | ) | | | | | (39,877 | ) | |
| | | | | | | | | | | | | | |
Income (loss) before taxes | | | | 21,941 | | | | | 14,333 | | | | | (5,716 | ) | | | | | 53,636 | | | | | 53,164 | | | | | 34,946 | | | | | 34,785 | |
Provision (benefit) for income taxes | | | | 4,930 | | | | | 7,543 | | | | | (5,539 | ) | | | | | 19,347 | | | | | 23,154 | | | | | 10,467 | | | | | 7,923 | |
| | | | | | | | | | | | | | |
Income (loss) from continuing operations | | | | 17,011 | | | | | 6,790 | | | | | (177 | ) | | | | | 34,289 | | | | | 30,010 | | | | | 24,479 | | | | | 26,862 | |
Discontinued operations: | | | | | | | | | | | | | | |
Loss from operations of discontinued businesses | | | | — | | | | | (4,651 | ) | | | | | — | | | | | — | | | | | — | | | | | — | | | | | — | |
Benefit from income taxes | | | | — | | | | | 1,628 | | | | | — | | | | | — | | | | | 2,193 | | | | | — | | | | | — | |
| | | | | | | | | | | | | | |
Loss from discontinued operations | | | | — | | | | | (3,023 | ) | | | | | — | | | | | — | | | | | — | | | | | — | | | | | — | |
| | | | | | | | | | | | | | |
Net Income (loss) | | | $ | | 17,011 | | | | $ | | 3,767 | | | | $ | | (177 | ) | | | | $ | | 34,289 | | | | $ | | 30,010 | | | | $ | | 24,479 | | | | $ | | 26,862 | |
| | | | | | | | | | | | | | |
38
| | | | | | | | | | | | | | |
| | For the Years Ended September 30, | | Nine Months Ended
June 30, |
| | 2012(1) | | 2013(2) | | 2014(3) | | 2015(4) | | 2016(5) | | 2016 | | 2017 |
| | (Dollars in thousands) |
Balance Sheet Data: | | | | | | | | | | | | | | |
Cash and equivalents | | | $ | | 209,654 | | | | $ | | 178,130 | | | | $ | | 92,405 | | | | $ | | 52,001 | | | | $ | | 72,553 | | | | $ | | 68,616 | | | | $ | | 69,448 | |
Property, plant and equipment, net | | | | 356,879 | | | | | 353,593 | | | | | 370,565 | | | | | 379,972 | | | | | 405,404 | | | | | 388,149 | | | | | 410,472 | |
Total assets | | | | 1,802,921 | | | | | 1,777,608 | | | | | 1,808,826 | | | | | 1,712,813 | | | | | 1,782,096 | | | | | 1,779,641 | | | | | 1,804,483 | |
Total debt, net of issuance costs | | | | 685,991 | | | | | 677,672 | | | | | 799,187 | | | | | 843,569 | | | | | 936,558 | | | | | 931,614 | | | | | 997,376 | |
Total liabilities | | | | 1,148,769 | | | | | 1,127,144 | | | | | 1,276,799 | | | | | 1,282,288 | | | | | 1,371,149 | | | | | 1,359,614 | | | | | 1,410,395 | |
Total shareholders’ equity | | | | 654,152 | | | | | 650,464 | | | | | 532,027 | | | | | 430,525 | | | | | 410,947 | | | | | 420,027 | | | | | 394,088 | |
Other Financial Data: | | | | | | | | | | | | | | |
Capital expenditures | | | $ | | 68,851 | | | | $ | | 64,441 | | | | $ | | 77,094 | | | | $ | | 73,620 | | | | $ | | 90,759 | | | | $ | | 63,247 | | | | $ | | 59,153 | |
Depreciation and amortization | | | | 66,264 | | | | | 70,748 | | | | | 67,396 | | | | | 69,800 | | | | | 70,208 | | | | | 51,879 | | | | | 56,380 | |
|
| | (1) | | 2012 includes $4,689 of restructuring charges ($3,048, net of tax), $477 of acquisition related costs ($310, net of tax) and discrete tax benefits, net, of $5,110. |
|
| | (2) | | 2013 includes $13,262 of restructuring charges ($8,266, net of tax), a loss on pension settlement of $2,142 ($1,392, net of tax) and discrete tax benefits, net, of $325. |
|
| | (3) | | 2014 includes $6,136 of restructuring charges ($3,804, net of tax), $3,161 of acquisition costs ($1,960, net of tax), $38,890 loss on debt extinguishment ($24,964, net of tax) and discrete tax benefits, net, of $4,674. |
|
| | (4) | | 2015 includes discrete tax benefits, net, of $62. |
|
| | (5) | | 2016 includes $5,900 of restructuring charges ($4,247, net of tax, or $0.10 per share), discrete tax provisions, net, of $2,658 or $0.06 per share. |
39
UNAUDITED PRO FORMA CONDENSED CONSOLIDATED FINANCIAL INFORMATION
On September 1, 2017, CMLLC entered into the Purchase Agreement with Emerson pursuant to which CMLLC will (subject to the satisfaction or waiver of the closing conditions in the Purchase Agreement) acquire, directly or indirectly, the Business and on September 25, 2017 CMLLC and Emerson entered into the Amendment.
The following unaudited pro forma condensed combined financial information is based on our historical consolidated financial statements and ClosetMaid’s and the Business’ historical consolidated financial statements and has been prepared and adjusted to give effect to the ClosetMaid Acquisition and related financing transactions. Concurrently and in connection with our entering into the Purchase Agreement, we entered into the Commitment Letter, pursuant to which the DB Commitment Parties have committed to provide 100% of the principal amount of the Bridge Facility, subject to the satisfaction or waiver of certain conditions set forth therein. Pursuant to the Commitment Letter, the commitment under the Bridge Facility will be reduced, on a dollar-for-dollar basis, by the amount of aggregate proceeds, if any, from this offering. The commitment under the Bridge Facility will terminate upon the consummation of this offering in full.
The unaudited pro forma condensed combined statements of operations for the nine months ended June 30, 2017 and the year ended September 30, 2016 give effect to the ClosetMaid Acquisition as if it had occurred on October 1, 2015. The unaudited pro forma condensed combined balance sheet as of June 30, 2017 gives effect to the ClosetMaid Acquisition as if it had occurred on June 30, 2017.
The pro forma condensed combined financial information contained herein are provided for information purposes only and do not necessarily reflect what the combined company’s financial condition or results of operations would have been had the ClosetMaid Acquisition occurred on the dates indicated. They also may not be useful in predicting, and are not intended to project, the future financial condition and results of operations of the combined company. The actual financial position and results of operations may differ significantly from the pro forma amounts reflected herein due to a variety of factors, and do not reflect all of the costs, benefits and synergies, or any anticipated tax benefits, that may be incurred or realized as a result of the ClosetMaid Acquisition.
The unaudited pro forma financial statements reflect adjustments to give effect to pro forma events that are directly attributable to the ClosetMaid Acquisition and this offering, factually supportable and, with respect to the pro forma statement of statement of operations, expected to have a continuing impact on the operating results of the combined company. The pro forma adjustments included herein are based upon currently available information and certain assumptions that we believe are reasonable under the circumstances and which are set forth in the notes below. The pro forma adjustments are more fully described in the notes to the unaudited pro forma condensed combined financial statements below. In addition, the unaudited pro forma condensed combined balance sheet includes pro forma purchase price allocations based upon preliminary estimates of the fair value of the assets acquired and liabilities assumed in connection with the ClosetMaid Acquisition. These allocations are preliminary and may be adjusted in the future upon finalization of these preliminary estimates.
The pro forma condensed combined financial statements should be read in conjunction with, and are qualified in their entirety by reference to, the following information: (i) the notes to the unaudited pro forma condensed combined financial information below; (ii) our audited financial statements as of and for the year ended September 30, 2016, which are included in our Annual Report on Form 10-K for the year then ended filed on November 17, 2016 and incorporated by reference into this offering memorandum; (iii) our unaudited financial statements as of and for the period ended June 30, 2017, which are included in our Quarterly Report on Form 10-Q for the period then ended filed on August 2, 2017 and incorporated by reference into this offering memorandum; (iv) ClosetMaid’s audited financial statements as of and for the year ended September 30, 2016, which are included in this offering memorandum; and (v) ClosetMaid’s unaudited financial statements as of and for the period ended June 30, 2017, which are included elsewhere in this offering memorandum.
40
GRIFFON CORPORATION AND SUBSIDIARIES
UNAUDITED PRO FORMA CONDENSED COMBINED STATEMENT OF OPERATIONS
FOR THE YEAR ENDED SEPTEMBER 30, 2016
(in thousands)
| | | | | | | | | | |
($ in thousands) | | Historical | | Adjustments | | | | Pro Forma
Combined |
| | Griffon | | Closet Maid |
Revenue | | | $ | | 1,957,161 | | | | $ | | 318,600 | | | | $ | | — | | | | | | $ | | 2,275,761 | |
Cost of goods and services | | | | 1,483,727 | | | | | 220,100 | | | | | — | | | | | | | 1,703,827 | |
| | | | | | | | | | |
Gross profit | | | | 473,434 | | | | | 98,500 | | | | | — | | | | | | | 571,934 | |
Selling, general and administrative expenses, other | | | | 364,027 | | | | | 69,800 | | | | | 2,176 | | | | | a | | | | | 436,003 | |
Restructuring and other related charges | | | | 5,900 | | | | | 600 | | | | | — | | | | | | | 6,500 | |
| | | | | | | | | | |
Total operating expenses | | | | 369,927 | | | | | 70,400 | | | | | 2,176 | | | | | | | 442,503 | |
Income from operations | | | | 103,507 | | | | | 28,100 | | | | | (2,176 | ) | | | | | | | 129,431 | |
Other income (expense) | | | | | | | | | | |
Interest expense | | | | (51,111 | ) | | | | | 2,500 | | | | | (14,000 | ) | | | | | b | | | | | (62,611 | ) | |
Other, net | | | | 768 | | | | | — | | | | | — | | | | | | | 768 | |
| | | | | | | | | | |
Total other income (expense) | | | | (50,343 | ) | | | | | 2,500 | | | | | (14,000 | ) | | | | | | | (61,843 | ) | |
Income before taxes | | | | 53,164 | | | | | 30,600 | | | | | (16,176 | ) | | | | | | | 67,588 | |
Provision for income taxes | | | | 23,154 | | | | | 12,000 | | | | | (6,519 | ) | | | | | c | | | | | 28,635 | |
| | | | | | | | | | |
Net income | | | $ | | 30,010 | | | | $ | | 18,600 | | | | $ | | (9,657 | ) | | | | | | $ | | 38,953 | |
| | | | | | | | | | |
See Notes to Unaudited Pro Forma Combined Condensed Financial Statements.
41
GRIFFON CORPORATION AND SUBSIDIARIES
UNAUDITED PRO FORMA CONDENSED COMBINED STATEMENT OF OPERATIONS
FOR THE NINE MONTH PERIOD ENDED JUNE 30, 2017
(in thousands)
| | | | | | | | | | |
($ in thousands) | | Historical | | Adjustments | | | | Pro Forma
Combined |
| | Griffon | | Closet Maid |
Revenue | | | $ | | 1,436,184 | | | | $ | | 227,900 | | | | $ | | — | | | | | | $ | | 1,664,084 | |
Cost of goods and services | | | | 1,088,550 | | | | | 160,700 | | | | | ��� | | | | | | | 1,249,250 | |
| | | | | | | | | | |
Gross profit | | | | 347,634 | | | | | 67,200 | | | | | — | | | | | | | 414,834 | |
Selling, general and administrative expenses, other | | | | 272,972 | | | | | 52,400 | | | | | 1,632 | | | | | a | | | | | 327,004 | |
| | | | | | | | | | |
Income from operations | | | | 74,662 | | | | | 14,800 | | | | | (1,632 | ) | | | | | | | 87,830 | |
Other income (expense) | | | | | | | | | | |
Interest expense, net | | | | (38,701 | ) | | | | | 2,900 | | | | | (11,525 | ) | | | | | b | | | | | (47,326 | ) | |
Other, net | | | | (1,176 | ) | | | | | — | | | | | — | | | | | | | (1,176 | ) | |
| | | | | | | | | | |
Total other income (expense) | | | | (39,877 | ) | | | | | 2,900 | | | | | (11,525 | ) | | | | | | | (48,502 | ) | |
Income before taxes | | | | 34,785 | | | | | 17,700 | | | | | (13,157 | ) | | | | | | | 39,328 | |
Provision for income taxes | | | | 7,923 | | | | | 6,700 | | | | | (4,974 | ) | | | | | c | | | | | 9,649 | |
| | | | | | | | | | |
Net income | | | $ | | 26,862 | | | | $ | | 11,000 | | | | $ | | (8,184 | ) | | | | | | $ | | 29,678 | |
| | | | | | | | | | |
See Notes to Unaudited Pro Forma Combined Condensed Financial Statements.
42
GRIFFON CORPORATION AND SUBSIDIARIES
UNAUDITED PRO FORMA CONDENSED COMBINED STATEMENT OF OPERATIONS
FOR THE TRAILING TWELVE MONTH PERIOD ENDED JUNE 30, 2017
(in thousands)
| | | | | | | | | | |
($ in thousands) | | TTM | | Adjustments | | | | Pro Forma
Combined |
| | Griffon | | Closet Maid |
Revenue | | | $ | | 1,936,889 | | | | $ | | 309,700 | | | | $ | | — | | | | | | $ | | 2,246,589 | |
Cost of goods and services | | | | 1,465,440 | | | | | 215,700 | | | | | — | | | | | | | 1,681,140 | |
| | | | | | | | | | |
Gross profit | | | | 471,449 | | | | | 94,000 | | | | | — | | | | | | | 565,449 | |
Selling, general and administrative expenses, other | | | | 365,234 | | | | | 69,200 | | | | | 2,176 | | | | | a | | | | | 436,610 | |
| | | | | | | | | | |
Income from operations | | | | 106,215 | | | | | 24,800 | | | | | (2,176 | ) | | | | | | | 128,839 | |
Other income (expense) | | | | | | | | | | |
Interest expense, net | | | | (52,492 | ) | | | | | 3,500 | | | | | (15,000 | ) | | | | | b | | | | | (63,992 | ) | |
Other, net | | | | (720 | ) | | | | | — | | | | | — | | | | | | | (720 | ) | |
| | | | | | | | | | |
Total other income (expense) | | | | (53,212 | ) | | | | | 3,500 | | | | | (15,000 | ) | | | | | | | (64,712 | ) | |
Income before taxes | | | | 53,003 | | | | | 28,300 | | | | | (17,176 | ) | | | | | | | 64,127 | |
Provision for income taxes | | | | 20,610 | | | | | 11,300 | | | | | (7,073 | ) | | | | | c | | | | | 24,837 | |
| | | | | | | | | | |
Net income | | | $ | | 32,393 | | | | $ | | 17,000 | | | | $ | | (10,103 | ) | | | | | | $ | | 39,290 | |
| | | | | | | | | | |
See Notes to Unaudited Pro Forma Combined Condensed Financial Statements.
43
GRIFFON CORPORATION AND SUBSIDIARIES
UNAUDITED PRO FORMA CONDENSED COMBINED BALANCE SHEET
AS OF JUNE 30, 2017
| | | | | | | | | | |
($ in thousands) | | Historical | | Adjustments | | | | Pro Forma
Combined |
| | Griffon | | Closet Maid |
CURRENT ASSETS | | | | | | | | | | |
Cash and equivalents | | | $ | | 69,448 | | | | $ | | 8,900 | | | | $ | | (19,900 | ) | | | d | | | $ | | 58,448 | |
Accounts receivable, net of allowances | | | | 227,813 | | | | | 39,400 | | | | | — | | | | | | | 267,213 | |
Contract costs and recognized income not yet billed, net of progress payments | | | | 119,367 | | | | | — | | | | | — | | | | | | | 119,367 | |
Inventories, net | | | | 339,393 | | | | | 33,700 | | | | | — | | | | | | | 373,093 | |
Prepaid and other current assets | | | | 43,622 | | | | | 10,600 | | | | | (3,700 | ) | | | e | | | | 50,522 | |
Assets of discontinued operations | | | | 479 | | | | | — | | | | | — | | | | | | | 479 | |
| | | | | | | | | | |
Total Current Assets | | | | 800,122 | | | | | 92,600 | | | | | (23,600 | ) | | | | | | | 869,122 | |
PROPERTY, PLANT AND EQUIPMENT, net | | | | 410,472 | | | | | 33,700 | | | | | 794 | | | e | | | | 444,966 | |
GOODWILL | | | | 361,405 | | | | | 139,900 | | | | | (23,900 | ) | | | f | | | | 477,405 | |
INTANGIBLE ASSETS, net | | | | 210,060 | | | | | 1,300 | | | | | 36,206 | | | e,f | | | | 247,566 | |
OTHER ASSETS | | | | 18,110 | | | | | 400 | | | | | 3,700 | | | e | | | | 22,210 | |
ASSETS OF DISCONTINUED OPERATIONS | | | | 4,314 | | | | | — | | | | | — | | | | | | | 4,314 | |
| | | | | | | | | | |
Total Assets | | | $ | | 1,804,483 | | | | $ | | 267,900 | | | | $ | | (6,800 | ) | | | | | | $ | | 2,065,583 | |
| | | | | | | | | | |
CURRENT LIABILITIES | | | | | | | | | | |
Notes payable and current portion of long-term debt | | | $ | | 16,656 | | | | $ | | 1,700 | | | | $ | | — | | | | | | $ | | 18,356 | |
Accounts payable | | | | 178,571 | | | | | 48,400 | | | | | — | | | | | | | 226,971 | |
Accrued liabilities | | | | 97,871 | | | | | 15,400 | | | | | (8,900 | ) | | | g | | | | 104,371 | |
Liabilities of discontinued operations | | | | 1,107 | | | | | — | | | | | — | | | | | | | 1,107 | |
| | | | | | | | | | |
Total Current Liabilities | | | | 294,205 | | | | | 65,500 | | | | | (8,900 | ) | | | | | | | 350,805 | |
LONG-TERM DEBT, net of issuance costs | | | | 980,720 | | | | | 3,800 | | | | | 195,000 | | | h | | | | 1,179,520 | |
OTHER LIABILITIES | | | | 131,149 | | | | | 11,700 | | | | | — | | | | | | | 142,849 | |
LIABILITIES OF DISCONTINUED OPERATIONS | | | | 4,321 | | | | | — | | | | | — | | | | | | | 4,321 | |
| | | | | | | | | | |
Total Liabilities | | | | 1,410,395 | | | | | 81,000 | | | | | 186,100 | | | | | | | 1,677,495 | |
SHAREHOLDERS’ EQUITY | | | | | | | | | | |
Total Shareholders’ Equity (Deficit) | | | | 394,088 | | | | | 186,900 | | | | | (192,900 | ) | | | i | | | | 388,088 | |
| | | | | | | | | | |
Total Liabilities and Shareholders’ Equity | | | $ | | 1,804,483 | | | | $ | | 267,900 | | | | $ | | (6,800 | ) | | | | | | $ | | 2,065,583 | |
| | | | | | | | | | |
See Notes to Unaudited Pro Forma Combined Condensed Financial Statements.
44
NOTES TO UNAUDITED PRO FORMA CONDENSED COMBINED FINANCIAL STATEMENTS
1. Description of ClosetMaid Acquisition
On September 1, 2017, ClosetMaid Acquisition Corp., our indirect, wholly-owned subsidiary (“CMAC”) entered into a Purchase Agreement with Emerson as the seller. On September 12, 2017, CMAC was converted into CMLLC. On September 25, 2017, CMLLC and Emerson entered into the Amendment. Under the Purchase Agreement, CMLLC will (subject to the satisfaction or waiver of the closing conditions in the Purchase Agreement) acquire, directly or indirectly, all of the outstanding equity interests in ClosetMaid and certain other of Emerson’s subsidiaries as well as certain assets owned, used or held for use in connection with Business. The purchase price for ClosetMaid is $200.0 million.
The ClosetMaid acquisition is expected to close on or about October 2, 2017, subject to the satisfaction or waiver of certain closing conditions. There can be no assurance that the ClosetMaid acquisition will close, or if it does, when the closing will occur.
2. Basis of Presentation
The unaudited pro forma condensed combined financial information was prepared to give effect to the completed ClosetMaid acquisition, which will be accounted for using the acquisition method of accounting. The unaudited pro forma condensed combined financial information was based on the historical financial statements of Griffon and ClosetMaid. All pro forma financial statements use Griffon’s period-end date.
The acquisition method of accounting under U.S. GAAP requires, among other things, that most assets acquired and liabilities assumed be recognized at their fair values at the acquisition date. Fair value is defined under U.S. GAAP as “the price that would be received to sell an asset or paid to transfer a liability in an orderly transaction between market participants at the measurement date.” Market participants are assumed to be buyers and sellers in the principal (or most advantageous) market for the asset or liability. Fair value measurements for an asset assume the highest and best use by these market participants. Fair value measurements can be highly subjective and it is possible that other professionals, applying reasonable judgment to the same facts and circumstances, could develop and support a range of alternative estimated amounts.
We have not initiated a process to value the assets to be acquired and liabilities to be assumed and have made only an initial estimate of the intangible assets acquired from ClosetMaid for the purposes of presenting these unaudited pro forma condensed combined financial statements. Consequently, the recorded assets and liabilities on ClosetMaid’s financial statements, along with an initial estimate of the intangible assets to be acquired, were added to those of Griffon. Financial statements and reported results of operations of Griffon for periods following completion of the acquisition may reflect different values, and the related depreciation and amortization thereof, after Griffon completes the process of valuing the assets acquired and liabilities assumed. However, any adjustments will not be retroactively restated to reflect the historical financial position or results of operations of ClosetMaid for periods prior to the acquisition.
Acquisition-related transaction costs (e.g., advisory, legal, valuation, other professional fees) and certain acquisition-related restructuring charges impacting the acquired company are not included as a component of consideration transferred, but are accounted for as expenses in the periods in which the costs are incurred. The unaudited pro forma condensed combined statements of operations do not reflect acquisition-related transaction costs incurred by Griffon and ClosetMaid, however, the unaudited pro forma condensed combined balance sheets include the effect of expensing acquisition-related transaction costs as an adjustment to retained earnings and reduction to cash proceeds. The unaudited pro forma condensed combined financial statements reflect no restructuring and integration charges that may be incurred in connection with the acquisition.
45
Certain immaterial reclassifications were made to the overall presentation of the ClosetMaid’s financial statements to conform to Griffon’s presentation.
3. Accounting Policies
Griffon has not identified any differences in accounting policies that would have a material impact on the combined financial statements except as detailed below.
4. Assets Acquired and Liabilities Assumed
The estimated assets acquired and the liabilities assumed by Griffon in the acquisition of ClosetMaid, reconciled to the consideration transferred, are provided below (in thousands):
| | |
Accounts receivable, net | | | $ | | 39,400 | |
Inventories, net | | | | 33,700 | |
Other current assets | | | | 6,900 | |
Property, plant and equipment, net | | | | 34,494 | |
Intangible assets, net | | | | 37,506 | |
Goodwill | | | | 116,000 | |
Other assets | | | | 4,100 | |
| | |
Total assets acquired | | | | 272,100 | |
| | |
| | |
Notes payable and current portion of long-term debt | | | | 1,700 | |
Accounts payable and accrued liabilities | | | | 54,900 | |
Long-term debt | | | | 3,800 | |
Other liabilities | | | | 11,700 | |
| | |
Total liabilities assumed | | | | 72,100 | |
| | |
Total | | | $ | | 200,000 | |
| | |
Notes payable and current portion of long-term debt and Long-term debt reflect the assumption of capital leases. The above allocation is preliminary with the final allocation to be based upon the balance sheet as of the closing date of the ClosetMaid Acquisition. Griffon is expecting to finalize the above adjustments with the filing of its 10-K with the exception of certain purchase price adjustments required to be completed by the end of November, 2017.
5. Pro Forma Adjustments
This note should be read in conjunction withNote 1. Description of ClosetMaid Acquisition; Note 2. Basis of Presentation.
|
| | (a) | | To adjust for the amortization attributable to the estimated fair value of $37.5 million of intangible assets acquired (intellectual property and customer relationships); amortized over a fifteen year life. The $37.5 million is estimated to be approximately 20% of the $185 million attributed to the purchase of ClosetMaid ($200 million total purchase price less $15 million paid to acquire a 338(h)(10) tax benefit). |
|
| | (b) | | To eliminate interest income recorded by ClosetMaid, consisting of interest income on intercompany receivable from Emerson, and to recognize the cost of debt incurred by Griffon in connection with the acquisition of ClosetMaid as follows (in thousands) at an assumed rate of interest which would be higher if we are required to draw down on the Bridge Facility to pay for all or any portion of the ClosetMaid Acquisition: |
46
| | | | | | |
| | Fiscal Year 2016 | | Nine Months
Ended June 30,
2017 | | Trailing Twelve
Months Ended
June 30, 2017 |
Elimination of ClosetMaid interest income | | | $ | | 2,500 | | | | $ | | 2,900 | | | | $ | | 3,500 | |
Interest expense on New Notes | | | | 10,500 | | | | | 7,875 | | | | | 10,500 | |
Amortization of debt issuance costs | | | | 1,000 | | | | | 750 | | | | | 1,000 | |
| | | | | | |
Totals | | | $ | | 14,000 | | | | $ | | 11,525 | | | | $ | | 15,000 | |
| | | | | | |
|
| | (c) | | Griffon has estimated an incremental 38% tax rate in assessing the tax impact of the combination of ClosetMaid with Griffon. The effective tax rate and tax accounts in the balance sheet of the combined company could be significantly different (either higher or lower) depending on post-acquisition activities, including tax planning opportunities, cash repatriation decisions and geographic mix of income. |
|
| | (d) | | Represents cash paid for related advisory, legal and financing costs of $11 million and removal of ClosetMaid cash of $8.9 million. |
|
| | (e) | | The pro forma balance sheet adjustments included reclassifications of certain balances to conform to Griffon’s balance sheet presentation. ClosetMaid’s current deferred taxes of $3.7 million were reclassified from prepaid and other current assets to other assets as Griffon has already adopted Financial Accounting Standard Board ASU 2015-17 “Balance Sheet Classification of Deferred Taxes”. ClosetMaid’s capitalized software of $0.8 million was reclassified from intangible assets, net, to property, plant and equipment, net, to be consistent with Griffon’s balance sheet presentation. |
|
| | (f) | | Goodwill and intangible assets, net includes amounts to reflect the ClosetMaid acquisition as well as the reclassification of capitalized software discussed in note (e) above as follows (in thousands): |
| | | | |
| | Goodwill | | Acquired
Intangible Assets,
Net |
Remove ClosetMaid goodwill | | | $ | | (139,900 | ) | | | | $ | | — | |
Record goodwill from ClosetMaid acquisition | | | | 116,000 | | | | | — | |
Record intangible assets from ClosetMaid acquisition | | | | — | | | | | 37,000 | |
Reclassification of capitalized software | | | | — | | | | | (794 | ) | |
| | | | |
Totals | | | $ | | (23,900 | ) | | | | $ | | 36,206 | |
| | | | |
|
| | (g) | | To reflect the amount owed to Emerson for cash transferred upon the consummation of the ClosetMaid acquisition. |
|
| | (h) | | To record the debt related to the New Notes less estimated financing costs. |
|
| | (i) | | To eliminate ClosetMaid’s historical equity and reflect the impact of expensing certain advisory and legal costs associated with the acquisition of ClosetMaid and paid with the proceeds received from the New Notes. |
47
CLOSETMAID
Overview
ClosetMaid is a leader in the North American residential storage and organization solutions industry with leading positions across the major channels where it does business including retail, building and e-commerce. ClosetMaid designs, manufactures and sells a comprehensive portfolio of wire and laminate shelving, containers, storage cabinets and other closet and home organization accessories under the highly recognized ClosetMaid brand name and other private label brands. ClosetMaid currently operates as a business unit of Emerson’s Commercial & Residential Solutions segment. ClosetMaid was founded in 1965 in Delray Beach, Florida. In 1970, ClosetMaid moved its corporate headquarters to Ocala, Florida. In a 1990 joint venture, Emerson and Bosch each acquired 50% of ClosetMaid. Emerson purchased the remaining 50% of ClosetMaid from Bosch in 1997.
ClosetMaid offers a diversified and well-balanced mix of wood and wire storage and organizational solutions. ClosetMaid’s wood solutions include closet systems, cube storage, storage furniture and cabinets targeted at customers looking for functional storage with a strong aesthetic appeal and the look of quality furniture. Selected wood product brands include MasterSuite, Suite Symphony, Impressions, ExpressShelf, and SpaceCreations. In the twelve months ended September 30, 2016, wood solution products made up approximately 52% of total ClosetMaid sales.
ClosetMaid’s wire solutions include wire shelving and hardware, wire accessories and kitchen storage products that provide affordable, customizable, versatile and durable solutions for single and multi-family homes. Selected wire product brands include Maximum Load®, SuperSlide® and ShelfTrack®. In the twelve months ended September 30, 2016, wood solution products made up approximately 48% of total ClosetMaid sales.
For the twelve months ended June 30, 2017 and September 30, 2016, ClosetMaid generated net sales of approximately $309.7 million and $318.6 million, respectively. After giving effect to the ClosetMaid Acquisition, Griffon’s pro forma revenue and Adjusted EBITDA for the trailing twelve month period ended June 30, 2017 would have been approximately $2.25 billion and approximately $221.2 million, respectively. See footnote 3 to Summary Unaudited Pro Forma Condensed Consolidated financial Information and Other Information for a reconciliation to Adjusted EBITDA. The pie chart below illustrates ClosetMaid’s Net Sales by business category for the twelve months ended June 30, 2017.

48
ClosetMaid’s Business Strengths
|
| | • | | Premier Brand.ClosetMaid is a leader in the North American residential storage and organization industry, with a highly recognizable brand and strong reputation among customers as demonstrated by its net promoter score of 51 and 85% of total sales in products with leading industry share positions. Do-it-yourself customers and professional installers choose the ClosetMaid brand due to its reputation for quality, high value, functionality, durability, versatility and ease of installation. These qualities, along with the Company’s sell through rates and supply chain reliability and support, have made ClosetMaid the supplier of choice for a number of leading retailers and homebuilders; |
|
| | • | | Strong Position in Served Channels.We believe that ClosetMaid held an aggregate total market share of 15% within its addressable industry in 2016, which we believe was twice as large as each of ClosetMaid’s two largest competitors. ClosetMaid has built leading positions in the retail, building and e-commerce channels it serves. The retail channel, including home centers, mass merchants, hardware and specialty stores, recognizes ClosetMaid as a dependable supply chain partner who can consistently provide a breadth of quality products when needed and offers sales support both before and after the sale. ClosetMaid has a presence in over 20,000 retail stores worldwide, with a presence in approximately 16,000 retail stores in North America. The building channel, which includes homebuilders, developers, contractors and dealers, is driven by installing dealers and builders who decide which products to use and select ClosetMaid products due to their quality, ease of installation, availability and value. The e-commerce channel is comprised of fragmented brick and mortar retailers offering a wide variety of brands, online retailers, and ClosetMaid’s own website, Closetmaid.com. ClosetMaid has built a strong online presence through its own website and through large key online retailers, that drives customer awareness and influences decision making; |
|
| | • | | Comprehensive and Innovative Product Portfolio. ClosetMaid offers a breadth of products, providing storage and organizational solutions for every room in the home. ClosetMaid has a broad and balanced portfolio of wood and wire storage and organizational solutions including closet systems, wire shelving, hardware and accessories, cube storage, storage furniture and cabinets and kitchen storage. ClosetMaid has a strong history of continuous innovation and was the first manufacturer to introduce ventilated wire closet shelving for use in new homes. Today, that tradition of innovation continues with approximately 35% of sales through June 30, 2017 coming from products introduced in the prior five years and numerous recent new product introductions that are expected to drive additional growth; |
|
| | • | | Deep Customer and Channel Relationships. ClosetMaid has built established, long-term relationships with key retailers such as Home Depot, Lowe’s, and Walmart, and leading homebuilders such as D.R. Horton, KB Home, Lennar and NVR. ClosetMaid maintains collaborative relationships with key customers with a focus on new product development, managing planograms, demand planning and online design which creates more entrenched partnerships; |
|
| | • | | Strong Momentum in E-Commerce.Digital commerce is a key pillar of growth and focus for ClosetMaid. Over the last five years, ClosetMaid has built a proactive and focused business model that offers ClosetMaid products where they are most likely to be identified when customers are researching and making buying decisions online and has invested in digital and social media advertising to continue to build brand awareness and drive traffic. Today, ClosetMaid receives over 7,000 visitors per day on its websites. Additionally, ClosetMaid’s fulfillment centers have been redesigned to include single function and multi-order picking (implemented across all facilities) to support growth of the e-commerce platform. As a result, ClosetMaid has driven growth of approximately 72% per year over the last five years in its e-commerce platform and |
49
|
| | | | we believe it is well positioned to recognize additional growth in the future as more customers’ storage solution decisions are made online; |
|
| | • | | Best-in-Class Manufacturing and Supply Chain. ClosetMaid has four strategically located manufacturing facilities (two of which are located in low-cost locations) with highly efficient production processes and a wide distribution footprint to meet consumer demand. ClosetMaid’s lean inventory model minimizes working capital (which was 6.7% of ClosetMaid’s net sales for 2016 and 8.7% for the twelve months ended June 30, 2017) and supports strong free cash flow. ClosetMaid’s multi-facility footprint optimizes direct fulfillment speed and minimizes freight costs. In addition to traditional manufacturing operations, ClosetMaid utilizes a lean manufacturing process known as cellular manufacturing in which small workcells are organized in an assembly line fashion enabling them to quickly respond to niche segments in the closet business, support small runs of unique wood specifications and react swiftly to meet customer delivery speed expectations; |
|
| | • | | Experienced Management Team. ClosetMaid’s seasoned and dedicated management team have a successful history working together and an average of 18 years of experience at ClosetMaid. The management team has strong industry experience providing valuable operational acumen and knowledge of industry dynamics with a proven track record of executing sustainable growth as well as operating efficiency initiatives and acquisitions. Additionally, the management team has deep and long-standing relationships with decision-makers at key customers. |
ClosetMaid’s Growth Strategy
ClosetMaid’s growth strategy includes the following:
|
| | • | | Product Mix Shift Upward.ClosetMaid seeks to shift away from products with lower margins and growth, and develop new product lines to maintain and expand its leadership position in its core closet segment and drive increased profitability. |
|
| | • | | Retail and Building Growth. ClosetMaid plans to grow its space and productivity within the retail channel and continue to grow in the building segment through the development of new products (i.e., ExpressShelf), dealer and pull-through sales initiatives and field sales development. |
|
| | • | | Leverage E-Commerce Platform. ClosetMaid seeks to continue to grow its e-commerce business and expand differentiated programs that leverage the e-commerce selling platform it has built over the last five years. |
|
| | • | | Grow International Sales.ClosetMaid plans to grow its international sales in over 23 countries and increase its market presence in underpenetrated markets. |
|
| | • | | Investment in New Products.ClosetMaid expects that its strength in traditional closet storage solutions and its focus on innovation can be leveraged to expand into new growth adjacencies including garage and kitchen organization. |
ClosetMaid’s Industry
ClosetMaid is a leader in the North American residential storage and organizational industry, which is driven by demand for home organization products and spans a range of material and product categories. ClosetMaid operates in the building products sector where demand for its products is heavily influenced by the repair and remodeling (“R&R”) of existing homes and the construction of new homes. Additionally, existing home sales and increasing home equity help drive R&R spending on storage and organizational solutions.
ClosetMaid primarily competes in the fragmented $9.7 billion U.S. home organization market. According to analysis from The Freedonia Group, U.S. sales of home organization products increased at an annual rate of 3.6% from 2006 to 2016 and are projected to grow at an annual rate of 3.8% through 2021.
50

Source: The Freedonia Group
The U.S. home storage and organization industry has been impacted by changing consumer preferences and demographics. Significant demand has shifted towards space-conscious living in smaller areas, particularly for consumers living in urban areas, which has driven demand for stackable and nestable products to maximize limited space. The market has seen increased demand for higher-end storage solutions driven by the perception that closets and garages are no longer simply utilitarian areas reserved for storage, but extensions of daily living spaces. Additionally, new homes are being built with larger closets, increasing homeowners’ need for storage and organizational products. Finally, The Freedonia Group has indicated that baby boomers and empty nesters tend to invest more in their closets which results in the rising demand of storage products.
Raw Materials and Suppliers
ClosetMaid’s primary raw materials are particleboard wood and wire rod. ClosetMaid purchases its wood supply primarily from three suppliers in the United States and Mexico (for its particleboard) and Asia (for its finished goods). Wire supply comes primarily from Jacksonville, Florida (for wire rod used in shelving) and Asia (for small wire). ClosetMaid has favorable pricing and payment terms with its suppliers of raw materials.
Manufacturing, Distribution and Operations
ClosetMaid has two manufacturing facilities in the United States; a 620,000 square foot facility in Ocala Florida used for manufacturing wire shelving, and a 155,000 square foot facility in Grantsville, Maryland used for wood manufacturing. ClosetMaid also has manufacturing facilities in two low-cost locations; a 102,000 square foot facility in Reynosa, Mexico used for wood manufacturing and a 157,000 square foot facility in Jiangmen, China used for small wire manufacturing.
Finished goods are transported by truck and rail to ClosetMaid’s distribution/warehousing centers, strategically located in Ocala, Florida, Chino, California, Belle Vernon, Pennsylvania and Pharr, Texas.
In response to its rapid growth in e-commerce, ClosetMaid has implemented wave picking at distribution centers. Orders are grouped into batches, or “waves”, enabling employees to collect items all at once for multiple orders (split order capability vs. pickers checking out individual orders as they come in). Order pickers gather items within the wave using a consolidated pick list, reducing travel time by allowing them to make picks for multiple orders in the same area. Warehouse Management System (WMS) tools support organizing the daily flow of work and enable fulfillment processing, picking efficiencies, improvements in product flow, and simplified/visible order pulls.
51
Competition
The home storage and organizational solutions industry is highly fragmented. ClosetMaid sells through retail, direct to consumer (e-commerce category) and direct to installer (building) channels and competes with a significant number of companies across these unique channels. ClosetMaid’s strengths are its highly recognized brand, broad portfolio of quality products and services, product differentiation, successful history of innovation, dependable supply-chain and high on-time delivery rates. ClosetMaid’s leading industry position and brand recognition are key to expanding its customer base, entering new adjacencies and driving continued growth. We believe that ClosetMaid held an aggregate total market share of 15% within its addressable industry in 2016, which we believe was twice as large as each of ClosetMaid’s two largest competitors.
Employees
As of June 2017, ClosetMaid had approximately 1,500 full-time employees. None of ClosetMaid’s employees in the U.S. are represented by a union or covered by a collective bargaining agreement.
Regulation
ClosetMaid’s operations are subject to various environmental, health, and employee safety laws and regulations. ClosetMaid believes that it is in material compliance with these laws and regulations. Historically, compliance with environmental laws has not materially affected, and is not expected to materially affect, ClosetMaid’s capital expenditures, earnings or competitive position in the future. Nevertheless, there can be no assurance that, in the future, it will not incur additional costs for compliance or that such costs will not be material.
Customers
ClosetMaid’s large customer base, which included approximately 718 customers for the nine months ended June 30, 2017, is diversified among various industries. Key retail customers of ClosetMaid include Home Depot, Target, Lowes, and Walmart and building customers include D.R. Horton, KB Home, Lennar and NVR. ClosetMaid’s top ten customers accounted for approximately 74% of ClosetMaid’s total revenues for the nine months ended June 30, 2017. During this period, Home Depot and Target accounted for approximately 48% and 10% of ClosetMaid’s sales, respectively. No other customer accounted for 10% of ClosetMaid’s sales during such period.
Seasonality
Historically, ClosetMaid’s revenue and income are lowest in its quarter ending March 31 and highest in its quarter ending December 31, primarily due to the holiday season.
Financial Information About Geographic Areas
In 2016, 92% of ClosetMaid’s revenue was from sales to customers in the United States. Of the remainder of ClosetMaid’s revenue, 64% was from sales to customers in Canada and 36% was from sales to customers in Australia and the rest of the world. For the nine months ended June 30, 2017, 92% of ClosetMaid’s revenue was from sales to customers in the United States. Of the remainder of ClosetMaid’s revenue, 68% was from sales to customers in Canada and 32% was from sales to customers in Australia and the rest of the world.
Research and Development
ClosetMaid strives to improve existing products as well as develop new products to satisfy consumer needs, expand revenue opportunities, maintain or extend competitive
52
advantages, increase market share and reduce production costs. R&D costs for ClosetMaid were $1.1 million for the nine months ended June 30, 2017, $1.4 million in 2016 and $1.4 million in 2015.
Intellectual Property
ClosetMaid follows a practice of actively protecting and enforcing its proprietary rights in the U.S. and throughout the world where ClosetMaid’s products are sold. All intellectual property information presented in this section is as of June 30, 2017.
Trademarks are of significant importance to ClosetMaid’s business. With over 50 years of experience and innovation in the storage and organization industry, ClosetMaid has a significant level of goodwill in its strong family of brands, including: ClosetMaid®, ShelfTrack®, Cubeicals®, Selectives® and MasterSuite®. ClosetMaid has approximately 87 registered trademarks and approximately 11 pending trademark applications around the world.
ClosetMaid constantly seeks to offer new and innovative products to its customers. ClosetMaid has 68 issued patents and 10 pending patent applications. ClosetMaid’s patents are in various stages of their terms of validity.
Properties
ClosetMaid occupies approximately 1.6 million total square feet of general office, factory and warehouse space throughout the U.S., Mexico and China. The following table sets forth certain information related to ClosetMaid’s major facilities:
| | | | | | | | | |
Location | | Primary Use | | Approx. Square
Footage | | Owned/Leased | | Lease End Year |
Ocala, FL | | Warehouse and manufacturing | | | | 620,000 | | | Leased | | | | 2020 | |
Grantsville, MD | | Manufacturing | | | | 155,000 | | | Owned | | |
Reynosa, MX | | Warehouse and manufacturing | | | | 133,000 | | | Manufacturing site owned; warehouse site leased | | | | 2020 | |
Jiangmen, China | | Manufacturing | | | | 157,000 | | | Leased | | | | 2019 | |
Chino, CA | | Warehouse | | | | 202,000 | | | Leased | | | | 2021 | |
Pharr, TX | | Warehouse | | | | 80,000 | | | Leased | | | | 2018 | |
Belle Vernon, PA | | Warehouse | | | | 233,000 | | | Leased | | | | 2022 | |
Mississauga, ON | | Sales Office for Mississauga | | | | 5,300 | | | Leased | | | | 2018 | |
Moresville, NC | | Sales Office for Lowes | | | | 3,300 | | | Leased | | | | 2018 | |
Atlanta, GA | | Sales Office for Home Depot | | | | 6,800 | | | Leased | | | | 2018 | |
All of ClosetMaid’s facilities are generally well maintained and suitable for the operations conducted.
Legal Proceedings
ClosetMaid is involved in litigation, investigations and claims arising out of the normal conduct of business, including those relating to commercial transactions, product liability and warranty claims, environmental, employment, and health and safety matters. ClosetMaid estimates and accrues liabilities resulting from such matters based on a variety of factors, including the stage of the proceeding; potential settlement value; assessments by internal
53
and external counsel; and assessments by environmental engineers and consultants of potential environmental liabilities and remediation costs. Such estimates are not discounted to reflect the time value of money due to the uncertainty in estimating the timing of the expenditures, which may extend over several years.
While it is impossible to ascertain the ultimate legal and financial liability with respect to certain contingent liabilities and claims, we believe, based upon examination of currently available information, experience to date, and advice from its legal counsel, that the individual and aggregate liabilities resulting from the ultimate resolution of these contingent matters, after taking into consideration ClosetMaid’s existing insurance coverage and amounts already accrued, will not have a material adverse impact on ClosetMaid’s combined results of operations, financial position or cash flows.
ClosetMaid Performance Overview
ClosetMaid’s fiscal year, like ours, ends on September 30. For the nine months ended June 30, 2017 and year ended September 30, 2016, ClosetMaid generated approximately $227.9 million and $318.6 million, respectively, in revenue, which represented 16% of Griffon’s net sales for such periods on a pro forma basis, after giving effect to the ClosetMaid Acquisition.
Results of Operations.ClosetMaid’s net sales for the nine months ended June 30, 2017 declined by approximately $8.9 million from the comparable prior year period due to lower revenue from a large customer of ClosetMaid managing inventory levels and a price decrease related to reduced steel costs, partially offset by increased building channel and e-commerce sales. ClosetMaid’s net earnings for the nine months ended June 30, 2017 decreased by approximately $1.6 million from the comparable period in the prior year. The decrease was primarily due to the decrease in revenue described above and unfavorable sales mix impacting gross margins. Subsequent to our entering into the Purchase Agreement, ClosetMaid management reported that the trend of increased manufacturing costs that occurred primarily during the quarter ended June 30, 2017 continued through the fourth quarter resulting in continued decreases in operating results. ClosetMaid management also indicated it expects this trend to impact future results. Further, ClosetMaid’s results of operations may be adversely effected as a result of decreases in sales in regions impacted by Hurricane Harvey and Hurricane Irma. As a result of the foregoing, we currently expect that ClosetMaid net sales, EBITDA and Adjusted EBITDA for the fiscal year ending September 30, 2017 will be approximately $298 million, $24 million and $24.9 million, respectively
Net sales for the fiscal year ended September 30, 2016 declined by approximately $15.4 million compared with the fiscal year ended September 30, 2015 due to implementation of a freight allowance in lieu of delivery to stores of a large customer of ClosetMaid, reduced cubical and fabric drawer sales, and decreased Russia and Australia sales, partially offset by increased e-commerce and building channel sales. Earnings improved by $2.9 million due to reduced restructuring costs and reduced steel costs.
Balance Sheet.ClosetMaid’s inventories increased as of June 30, 2017 by approximately $5.6 million as compared with the levels as of June 30, 2016 due to increased purchase of finished goods and wire inventory levels in order to improve customer service. ClosetMaid’s June 30, 2017 receivables increased $1.6 million from June 30, 2016, while cash and cash equivalents decreased by approximately $1 million due to timing of sales and customer mix. Current liabilities increased as of June 30, 2017, by approximately $2.8 million as compared to June 30, 2016, primarily due to purchase of finished goods, which have longer payment terms.
Cash Flows.ClosetMaid’s net cash provided by operating activities for the nine months ended June 30, 2017 was approximately $14.1 million compared to $19.6 million for the comparable period in the prior year, primarily due to lower earnings and increased working capital. During the nine months ended June 30, 2017, ClosetMaid used net cash for investing activities of $2.1 million compared to $4.1 million in the comparable prior year period as a
54
result of lower capital expenditures due to prior year investment in assets for restructuring activities. During the nine months ended June 30, 2017, net cash used by financing activities totaled approximately $7.8 million compared to the approximately $9.2 million used by financing activities in the comparable period in the prior year, primarily due to lower intercompany short-term borrowings.
ClosetMaid’s net cash provided by operating activities for the year ended September 30, 2016 was approximately $31.7 million compared to $26.4 million in the year ended September 30, 2015 primarily from the increase in net earnings described above for the period. During the year ended September 30, 2016, ClosetMaid used net cash for investing activities of approximately $6.7 million compared to approximately $4.4 million in the year ended September 30, 2015 with the increase primarily due to capital expenditures implemented to effectuate ClosetMaid’s planned wood manufacturing restructuring in 2017. Over the second half of 2015 and first half of 2016, ClosetMaid moved its wood manufacturing operations from Chino, California to Reynosa and Grantsville, Maryland. ClosetMaid also moved equipment and invested in new wood production technology. In addition, ClosetMaid implemented c-cell technology in its Grantsville plant, to in-source MasterSuite and achieve “just-in-time” e-commerce volume. During the year ended September 30, 2016, net cash used by financing activities totaled approximately $19.6 million compared to the approximately $20.1 million used by financing activities in the year ended September 30, 2015 related to changes in intercompany payments and borrowings.
55
THE CLOSETMAID ACQUISITION
On September 1, 2017, CMAC entered into the Purchase Agreement with Emerson. On September 12, 2017, CMAC was converted into CMLLC. On September 25, 2017, CMLLC and Emerson entered into the Amendment. Under the Purchase Agreement, CMLLC will (subject to the satisfaction or waiver of the closing conditions in the Purchase Agreement) acquire, directly or indirectly, the Business. We refer to these transactions as the “ClosetMaid Acquisition.” The following summary of the Purchase Agreement and the ClosetMaid Acquisition is not complete and is subject to, and is qualified in its entirety by reference to, all provisions of the Purchase Agreement (including the definitions of terms used therein).
Acquisition Consideration
Pursuant to the terms of the Purchase Agreement, at the effective time of the transactions contemplated thereby (the “Effective Time”), the Purchased Assets, Domestic Subsidiary Shares and the Foreign Subsidiary Shares (each as defined in the Purchase Agreement) will be transferred to CMLLC (except that the shares of ClosetMaid China will be purchased at a later date pending regulatory approval). In consideration therefor, CMLLC will pay Emerson $200 million on a cash-free, debt-free basis. The Purchase Price (as defined in the Purchase Agreement) may be adjusted based on the Final Closing Working Capital, Final Closing Indebtedness and Final Transaction Expenses (each as defined in the Purchase Agreement). After taking into account the estimated present value of certain tax benefits expected to be realized by Griffon as a result of the transaction, the effective purchase price is expected to be approximately $175 million.
Conditions to Consummation of the ClosetMaid Acquisition
Under the Purchase Agreement, consummation of the ClosetMaid Acquisition is subject to the satisfaction or waiver of certain customary closing conditions, including, the absence of an event or circumstance having a material adverse effect on the Business.
Equity Commitment Letter
Griffon Corporation has provided CMLLC an equity commitment and have obtained a debt financing commitment (as further described below) for the Transaction, the aggregate proceeds of which will be sufficient for CMLLC to pay the Purchase Price and all related fees and expenses. We have committed that we and our subsidiaries will utilize approximately $200 million in cash to consummate the ClosetMaid Acquisition on the terms and subject to the conditions set forth in the equity commitment letter, dated September 1, 2017. We have also provided a limited guarantee in favor of Emerson, dated September 1, 2017 (the “Limited Guarantee”), guaranteeing the performance of certain obligations of CMLLC under the Purchase Agreement. Under the Limited Guarantee, the principal obligations guaranteed by us relate to the payment of certain termination fees in the event CMLLC breaches the Purchase Agreement and fails to consummate the ClosetMaid Acquisition (as described below), as well as certain indemnification obligations of CMLLC in favor of Emerson under the Purchase Agreement.
Bridge Facility
Pursuant to the Commitment Letter, DBCI has agreed to provide 100% of the principal amount of the Bridge Facility in an amount up to $200 million with DBCI acting as sole administrative agent for the Bridge Facility. The commitment under the Bridge Facility will be reduced, on a dollar-for-dollar basis, by the amount of aggregate proceeds, if any, from this offering. The commitment under the Bridge Facility will terminate upon the consummation of this offering in full. The Bridge Facility will be available only in a single draw of the full amount of the Bridge Facility on the Closing Date and amounts borrowed under the Bridge Facility that are repaid or prepaid may not be reborrowed.
56
Solicitations of Acquisition Proposals
From the execution of the Purchase Agreement and until the termination of the Purchase Agreement or the Closing (as defined in the Purchase Agreement), Emerson and its affiliates are prohibited from soliciting other offers for the Business or knowingly facilitating any proposals or offers for the Business or entering into any Contract (as defined in the Purchase Agreement), agreement or arrangement with any party, concerning or relating to any proposal to acquire ClosetMaid or the assets to be acquired pursuant to the Purchase Agreement.
ClosetMaid China
The Purchase Agreement also provides, that, in addition to the Business being acquired at the Closing, we will acquire from Emerson all of the outstanding shares of ClosetMaid (Jiangmen) StorageLimited (“ClosetMaid China”). The acquisition of ClosetMaid China is subject to further regulatory approvals from the Chinese government and will be completed at a later time. The consideration for the acquisition of ClosetMaid China is $14.1 million, which is a portion of the $200 million purchase price for ClosetMaid and will be paid into an escrow account upon consummation of the ClosetMaid Acquisition and released upon receipt of the requisite Chinese regulatory approvals.
Termination Rights; Termination Fees
The Purchase Agreement contains certain customary termination rights, including that each of CMLLC and Emerson has the right to terminate the Purchase Agreement after November 13, 2017 if the ClosetMaid Acquisition has not been consummated by such date. If Emerson terminates the Purchase Agreement due to our failure to consummate the ClosetMaid Acquisition because we do not receive debt financing, we will be required to pay Emerson a financing failure reverse termination fee of $13 million. If Emerson terminates the Purchase Agreement due to our failure to consummate the ClosetMaid Acquisition in breach of the Purchase Agreement even though our debt financing is available, we will be required to pay Emerson a breach termination fee in the amount of $32.5 million. Emerson also has the right to specifically enforce the obligations of CMLLC and Griffon in the Purchase Agreement and Equity Commitment Letter to consummate the ClosetMaid if our debt financing is available.
Tax Election
We and Emerson will make a joint election under Section 338(h)(10) of the Internal Revenue Code, permitting the ClosetMaid Acquisition to be treated as an asset purchase for tax purposes. This election is expected to generate a tax benefit with an estimated present value of $25 million for Griffon.
Representations, Warranties and Covenants
The Purchase Agreement includes customary representations, warranties and covenants of each of us and Emerson. Among other things, Emerson has agreed to conduct the Business in the ordinary course consistent with past practice until the ClosetMaid Acquisition is consummated.
Transition Services Agreement
Additionally, in connection with the ClosetMaid Acquisition, CMLLC will enter into a Transition Services Agreement with Emerson (the “TSA”) on the Effective Date (as defined in the Purchase Agreement). Pursuant to the TSA, for certain periods following the Effective Date up to twelve months, Emerson will provide us with various services to facilitate the transition of the Business, including information technology and employee benefits services. CMLLC will compensate Emerson for the ongoing provision of transition services pursuant to the TSA at rates generally based on the cost to Emerson of providing such services.
57
CLOSETMAID CORPORATION
A Business Unit of Emerson Electric Co.
Unaudited Combined Interim Financial Statements
for the Nine Months Ended June 30, 2016 and 2017
F-1
INDEX TO UNAUDITED INTERIM FINANCIAL STATEMENTS
Unaudited Combined Interim Financial Statements of ClosetMaid Corporation
F-2
Unaudited Combined Interim Statements of Earnings
CLOSETMAID CORPORATION
Nine Months ended June 30, 2016 and 2017
| | | | |
| | 2016 | | 2017 |
| | (Dollars in millions) |
Net sales | | | $ | | 236.8 | | | | | 227.9 | |
Costs and expenses | | | | |
Cost of sales | | | | 165.1 | | | | | 160.7 | |
Selling, general and administrative expenses | | | | 52.9 | | | | | 51.3 | |
Other deductions, net | | | | 0.7 | | | | | 1.1 | |
Interest income, net | | | | 1.9 | | | | | 2.9 | |
| | | | |
Earnings before income taxes | | | | 20.0 | | | | | 17.7 | |
Income taxes | | | | 7.4 | | | | | 6.7 | |
| | | | |
Net earnings | | | $ | | 12.6 | | | | | 11.0 | |
| | | | |
See accompanying Note to Unaudited Combined Interim Financial Statements
F-3
Unaudited Combined Interim Statements of Comprehensive Income
CLOSETMAID CORPORATION
Nine Months ended June 30, 2016 and 2017
| | | | |
| | 2016 | | 2017 |
| | (Dollars in millions) |
Net earnings | | | $ | | 12.6 | | | | | 11.0 | |
Other comprehensive income (loss), net of tax: | | | | |
Foreign currency translation | | | | 1.2 | | | | | (0.4 | ) | |
Cash flow hedges, net of income taxes of: 2016, $0.2; 2017, $(0.1) | | | | (0.3 | ) | | | | | 0.2 | |
| | | | |
Total other comprehensive income (loss) | | | | 0.9 | | | | | (0.2 | ) | |
| | | | |
Comprehensive income | | | $ | | 13.5 | | | | | 10.8 | |
| | | | |
See accompanying Note to Unaudited Combined Interim Financial Statements
F-4
Unaudited Combined Interim Balance Sheets
CLOSETMAID CORPORATION
June 30, 2016 and 2017
| | | | |
| | 2016 | | 2017 |
| | (Dollars in millions) |
ASSETS | | | | |
Current assets | | | | |
Cash and equivalents | | | $ | | 9.9 | | | | | 8.9 | |
Receivables, net of allowances for doubtful accounts of $0.5 and $0.3, respectively | | | | 37.8 | | | | | 39.4 | |
Inventories | | | | 28.1 | | | | | 33.7 | |
Deferred income taxes | | | | 6.6 | | | | | 3.7 | |
Other current assets | | | | 7.4 | | | | | 6.9 | |
| | | | |
Total current assets | | | | 89.8 | | | | | 92.6 | |
| | | | |
Property, plant and equipment, net | | | | 35.7 | | | | | 33.7 | |
| | | | |
Other assets | | | | |
Goodwill | | | | 141.1 | | | | | 139.9 | |
Other intangible assets | | | | 1.3 | | | | | 1.3 | |
Deferred income taxes | | | | 0.1 | | | | | 0.2 | |
Other | | | | 0.2 | | | | | 0.2 | |
| | | | |
Total other assets | | | | 142.7 | | | | | 141.6 | |
| | | | |
Total assets | | | $ | | 268.2 | | | | | 267.9 | |
| | | | |
LIABILITIES AND EQUITY | | | | |
Current liabilities | | | | |
Accounts payable | | | $ | | 42.7 | | | | | 48.4 | |
Accrued expenses | | | | 18.0 | | | | | 14.7 | |
Current portion of long-term debt | | | | 1.6 | | | | | 1.7 | |
Income taxes payable | | | | 0.4 | | | | | 0.7 | |
| | | | |
Total current liabilities | | | | 62.7 | | | | | 65.5 | |
| | | | |
Deferred income taxes | | | | 10.2 | | | | | 9.0 | |
| | | | |
Long-term debt | | | | 5.5 | | | | | 3.8 | |
| | | | |
Other long-term liabilities | | | | 2.3 | | | | | 2.7 | |
| | | | |
Equity | | | | |
Net parent investment | | | | 171.8 | | | | | 172.1 | |
Accumulated other comprehensive income | | | | 15.7 | | | | | 14.8 | |
| | | | |
Total equity | | | | 187.5 | | | | | 186.9 | |
| | | | |
Total liabilities and equity | | | $ | | 268.2 | | | | | 267.9 | |
| | | | |
See accompanying Note to Unaudited Combined Interim Financial Statements
F-5
Unaudited Combined Interim Statements of Equity
CLOSETMAID CORPORATION
Nine Months ended June 30, 2016 and 2017
| | | | |
| | 2016 | | 2017 |
| | (Dollars in millions) |
Net parent investment | | | | |
Beginning balance | | | $ | | 346.8 | | | | | 356.8 | |
Net earnings | | | | 12.6 | | | | | 11.0 | |
Dividends paid to Emerson | | | | (10.2 | ) | | | | | (10.2 | ) | |
Capital contribution of Emerson | | | | 4.4 | | | | | — | |
| | | | |
| | | | 353.6 | | | | | 357.6 | |
Cumulative intercompany receivable due from Emerson, beginning | | | | (183.0 | ) | | | | | (189.2 | ) | |
Net transfer to Emerson | | | | 1.2 | | | | | 3.7 | |
| | | | |
Cumulative intercompany receivable due from Emerson, ending | | | | (181.8 | ) | | | | | (185.5 | ) | |
| | | | |
Ending balance | | | | 171.8 | | | | | 172.1 | |
| | | | |
Accumulated other comprehensive income | | | | |
Beginning balance | | | | 14.8 | | | | | 15.0 | |
Foreign currency translation | | | | 1.2 | | | | | (0.4 | ) | |
Cash flow hedges | | | | (0.3 | ) | | | | | 0.2 | |
| | | | |
Ending balance | | | | 15.7 | | | | | 14.8 | |
| | | | |
Total equity | | | $ | | 187.5 | | | | | 186.9 | |
| | | | |
See accompanying Note to Unaudited Combined Interim Financial Statements
F-6
Unaudited Combined Interim Statements of Cash Flows
CLOSETMAID CORPORATION
Nine Months ended June 30, 2016 and 2017
| | | | |
| | 2016 | | 2017 |
| | (Dollars in millions) |
Operating activities | | | | |
Net earnings | | | $ | | 12.6 | | | | | 11.0 | |
Adjustments to reconcile net earnings to net cash provided by operating activities: | | | | |
Depreciation and amortization | | | | 5.4 | | | | | 4.8 | |
Changes in operating working capital | | | | (0.5 | ) | | | | | (1.7 | ) | |
Losses on foreign currency exchange activity | | | | 0.3 | | | | | 0.2 | |
Deferred income taxes | | | | 1.8 | | | | | (0.5 | ) | |
Other, net | | | | — | | | | | 0.3 | |
| | | | |
Net cash provided by operating activities | | | | 19.6 | | | | | 14.1 | |
| | | | |
Investing activities | | | | |
Capital expenditures | | | | (4.1 | ) | | | | | (1.7 | ) | |
Other, net | | | | — | | | | | (0.4 | ) | |
| | | | |
Net cash used by investing activities | | | | (4.1 | ) | | | | | (2.1 | ) | |
| | | | |
Financing activities | | | | |
Net payments to Emerson | | | | (4.6 | ) | | | | | (6.5 | ) | |
Net decrease in short-term borrowings | | | | (3.4 | ) | | | | | — | |
Payments of long-term debt | | | | (1.2 | ) | | | | | (1.3 | ) | |
| | | | |
Net cash used by financing activities | | | | (9.2 | ) | | | | | (7.8 | ) | |
| | | | |
Effect of exchange rate changes on cash and equivalents | | | | (3.8 | ) | | | | | (3.1 | ) | |
| | | | |
Increase in cash and equivalents | | | | 2.5 | | | | | 1.1 | |
Beginning cash and equivalents | | | | 7.4 | | | | | 7.8 | |
| | | | |
Ending cash and equivalents | | | $ | | 9.9 | | | | | 8.9 | |
| | | | |
Changes in operating working capital | | | | |
Receivables | | | $ | | 4.4 | | | | | (2.2 | ) | |
Inventories | | | | 1.7 | | | | | (5.9 | ) | |
Other current assets | | | | (2.1 | ) | | | | | 0.2 | |
Accounts payable | | | | (2.2 | ) | | | | | 7.4 | |
Accrued expenses | | | | (1.2 | ) | | | | | (1.2 | ) | |
Income taxes payable | | | | (1.1 | ) | | | | | — | |
| | | | |
Total changes in operating working capital | | | $ | | (0.5 | ) | | | | | (1.7 | ) | |
| | | | |
See accompanying Note to Unaudited Combined Interim Financial Statements
F-7
Note to Unaudited Combined Interim Financial Statements
CLOSETMAID CORPORATION
Nine Months ended June 30, 2016 and 2017
Description of Business
ClosetMaid (the Company) operates as a business unit of Emerson Electric Co.’s (Emerson) Commercial & Residential Solutions segment and is the worldwide leader in home storage and organization solutions. Product offerings include shelving systems, closet organizers, home office and kitchen storage, and drawer systems and containers, available primarily in wire and wood.
Basis of Presentation
The accompanying unaudited combined interim financial statements include all adjustments necessary for a fair presentation of operating results for the interim periods presented. Adjustments consist of normal and recurring accruals. These unaudited combined interim financial statements do not include all disclosures required for interim financial statements presented in conformity with U.S. generally accepted accounting principles (GAAP). These unaudited combined interim financial statements should be read in conjunction with the Company’s audited combined financial statements and notes thereto for the years ended September 30, 2016 and 2015.
F-8
CLOSETMAID CORPORATION
A Business Unit of Emerson Electric Co.
Combined Financial Statements
for the Years Ended September 30, 2015 and 2016
F-9
INDEX TO FINANCIAL STATEMENTS
F-10
Independent Auditors’ Report
The Board of Directors
ClosetMaid Corporation:
We have audited the accompanying combined financial statements of ClosetMaid Corporation and affiliates, which comprise the combined balance sheets as of September 30, 2016 and 2015, and the related combined statements of earnings, comprehensive income, equity, and cash flows for the years then ended, and the related notes to the combined financial statements.
Management’s Responsibility for the Financial Statements
Management is responsible for the preparation and fair presentation of these combined financial statements in accordance with U.S. generally accepted accounting principles; this includes the design, implementation, and maintenance of internal control relevant to the preparation and fair presentation of combined financial statements that are free from material misstatement, whether due to fraud or error.
Auditors’ Responsibility
Our responsibility is to express an opinion on these combined financial statements based on our audits. We conducted our audits in accordance with auditing standards generally accepted in the United States of America. Those standards require that we plan and perform the audit to obtain reasonable assurance about whether the combined financial statements are free from material misstatement.
An audit involves performing procedures to obtain audit evidence about the amounts and disclosures in the combined financial statements. The procedures selected depend on the auditors’ judgment, including the assessment of the risks of material misstatement of the combined financial statements, whether due to fraud or error. In making those risk assessments, the auditor considers internal control relevant to the entity’s preparation and fair presentation of the combined financial statements in order to design audit procedures that are appropriate in the circumstances, but not for the purpose of expressing an opinion on the effectiveness of the entity’s internal control. Accordingly, we express no such opinion. An audit also includes evaluating the appropriateness of accounting policies used and the reasonableness of significant accounting estimates made by management, as well as evaluating the overall presentation of the combined financial statements.
We believe that the audit evidence we have obtained is sufficient and appropriate to provide a basis for our audit opinion.
Opinion
In our opinion, the combined financial statements referred to above present fairly, in all material respects, the financial position of ClosetMaid Corporation and affiliates as of September 30, 2016 and 2015, and the results of their operations and their cash flows for the years then ended in accordance with U.S. generally accepted accounting principles.
Tampa, Florida
May 8, 2017
Certified Public Accountants
F-11
Combined Statements of Earnings
CLOSETMAID CORPORATION
Years ended September 30
| | | | |
| | 2015 | | 2016 |
| | (Dollars in millions) |
Net sales | | | $ | | 334.0 | | | | | 318.6 | |
Costs and expenses | | | | |
Cost of sales | | | | 233.3 | | | | | 220.1 | |
Selling, general and administrative expenses | | | | 72.3 | | | | | 69.6 | |
Other deductions, net | | | | 3.3 | | | | | 0.8 | |
Interest income, net | | | | 1.9 | | | | | 2.5 | |
| | | | |
Earnings before income taxes | | | | 27.0 | | | | | 30.6 | |
Income taxes | | | | 11.3 | | | | | 12.0 | |
| | | | |
Net earnings | | | $ | | 15.7 | | | | | 18.6 | |
| | | | |
See accompanying Notes to Combined Financial Statements
F-12
Combined Statements of Comprehensive Income
CLOSETMAID CORPORATION
Years ended September 30
| | | | |
| | 2015 | | 2016 |
| | (Dollars in millions) |
Net earnings | | | $ | | 15.7 | | | | | 18.6 | |
Other comprehensive income (loss), net of tax: | | | | |
Foreign currency translation | | | | (5.7 | ) | | | | | 0.4 | |
Cash flow hedges, net of income taxes of: 2015, $0.0; 2016, $0.1 | | | | — | | | | | (0.2 | ) | |
| | | | |
Total other comprehensive income (loss) | | | | (5.7 | ) | | | | | 0.2 | |
| | | | |
Comprehensive income | | | $ | | 10.0 | | | | | 18.8 | |
| | | | |
See accompanying Notes to Combined Financial Statements
F-13
Combined Balance Sheets
CLOSETMAID CORPORATION
September 30
| | | | |
| | 2015 | | 2016 |
| | (Dollars in millions) |
ASSETS | | | | |
Current assets | | | | |
Cash and equivalents | | | $ | | 7.4 | | | | | 7.8 | |
Receivables, net of allowances for doubtful accounts of $0.4 and $0.3, respectively | | | | 42.3 | | | | | 37.2 | |
Inventories | | | | 29.8 | | | | | 27.8 | |
Deferred income taxes | | | | 6.8 | | | | | 3.1 | |
Other current assets | | | | 5.8 | | | | | 7.5 | |
| | | | |
Total current assets | | | | 92.1 | | | | | 83.4 | |
| | | | |
Property, plant and equipment, net | | | | 37.2 | | | | | 36.1 | |
| | | | |
Other assets | | | | |
Goodwill | | | | 140.1 | | | | | 140.3 | |
Other intangible assets | | | | 1.7 | | | | | 1.2 | |
Deferred income taxes | | | | — | | | | | 0.1 | |
Other | | | | 0.2 | | | | | 0.2 | |
| | | | |
Total other assets | | | | 142.0 | | | | | 141.8 | |
| | | | |
Total assets | | | $ | | 271.3 | | | | | 261.3 | |
| | | | |
LIABILITIES AND EQUITY | | | | |
Current liabilities | | | | |
Accounts payable | | | $ | | 49.3 | | | | | 43.4 | |
Accrued expenses | | | | 19.2 | | | | | 16.4 | |
Short-term borrowing | | | | 3.4 | | | | | — | |
Current portion of long-term debt | | | | 1.5 | | | | | 1.6 | |
Income taxes payable | | | | 1.6 | | | | | 0.7 | |
| | | | |
Total current liabilities | | | | 75.0 | | | | | 62.1 | |
| | | | |
Deferred income taxes | | | | 8.6 | | | | | 8.7 | |
| | | | |
Long-term debt | | | | 6.7 | | | | | 5.1 | |
| | | | |
Other long-term liabilities | | | | 2.4 | | | | | 2.8 | |
| | | | |
Equity | | | | |
Net parent investment | | | | 163.8 | | | | | 167.6 | |
Accumulated other comprehensive income | | | | 14.8 | | | | | 15.0 | |
| | | | |
Total equity | | | | 178.6 | | | | | 182.6 | |
| | | | |
Total liabilities and equity | | | $ | | 271.3 | | | | | 261.3 | |
| | | | |
See accompanying Notes to Combined Financial Statements
F-14
Combined Statements of Equity
CLOSETMAID CORPORATION
Years ended September 30
| | | | |
| | 2015 | | 2016 |
| | (Dollars in millions) |
Net parent investment | | | | |
Beginning balance | | | $ | | 338.8 | | | | | 346.8 | |
Net earnings | | | | 15.7 | | | | | 18.6 | |
Dividends paid to Emerson | | | | (7.7 | ) | | | | | (13.0 | ) | |
Capital contribution of Emerson | | | | — | | | | | 4.4 | |
| | | | |
| | | | 346.8 | | | | | 356.8 | |
Cumulative intercompany receivable due from Emerson, beginning | | | | (171.5 | ) | | | | | (183.0 | ) | |
Net transfer to Emerson | | | | (11.5 | ) | | | | | (6.2 | ) | |
| | | | |
Cumulative intercompany receivable due from Emerson, ending | | | | (183.0 | ) | | | | | (189.2 | ) | |
| | | | |
Ending balance | | | | 163.8 | | | | | 167.6 | |
| | | | |
Accumulated other comprehensive income | | | | |
Beginning balance | | | | 20.5 | | | | | 14.8 | |
Foreign currency translation | | | | (5.7 | ) | | | | | 0.4 | |
Cash flow hedges | | | | — | | | | | (0.2 | ) | |
| | | | |
Ending balance | | | | 14.8 | | | | | 15.0 | |
| | | | |
Total equity | | | $ | | 178.6 | | | | | 182.6 | |
| | | | |
See accompanying Notes to Combined Financial Statements
F-15
Combined Statements of Cash Flows
CLOSETMAID CORPORATION
Years ended September 30
| | | | |
| | 2015 | | 2016 |
| | (Dollars in millions) |
Operating activities | | | | |
Net earnings | | | $ | | 15.7 | | | | | 18.6 | |
Adjustments to reconcile net earnings to net cash provided by operating activities: | | | | |
Depreciation and amortization | | | | 8.5 | | | | | 7.2 | |
Changes in operating working capital | | | | 3.5 | | | | | 1.9 | |
Losses on foreign currency exchange activity | | | | 0.5 | | | | | 0.5 | |
Deferred income taxes | | | | (3.2 | ) | | | | | 3.1 | |
Other, net | | | | 1.4 | | | | | 0.4 | |
| | | | |
Net cash provided by operating activities | | | | 26.4 | | | | | 31.7 | |
| | | | |
Investing activities | | | | |
Capital expenditures | | | | (3.8 | ) | | | | | (6.6 | ) | |
Other, net | | | | (0.6 | ) | | | | | (0.1 | ) | |
| | | | |
Net cash used by investing activities | | | | (4.4 | ) | | | | | (6.7 | ) | |
| | | | |
Financing activities | | | | |
Net payments to Emerson | | | | (19.2 | ) | | | | | (14.8 | ) | |
Net increase (decrease) in short-term borrowings | | | | 0.5 | | | | | (3.4 | ) | |
Payments of long-term debt | | | | (1.4 | ) | | | | | (1.4 | ) | |
| | | | |
Net cash used by financing activities | | | | (20.1 | ) | | | | | (19.6 | ) | |
| | | | |
Effect of exchange rate changes on cash and equivalents | | | | (4.1 | ) | | | | | (5.0 | ) | |
| | | | |
Increase (Decrease) in cash and equivalents | | | | (2.2 | ) | | | | | 0.4 | |
Beginning cash and equivalents | | | | 9.6 | | | | | 7.4 | |
| | | | | | | |
Ending cash and equivalents | | | $ | | 7.4 | | | | | 7.8 | |
| | | | |
Changes in operating working capital | | | | |
Receivables | | | $ | | (7.5 | ) | | | | | 5.0 | |
Inventories | | | | (5.1 | ) | | | | | 1.9 | |
Other current assets | | | | 1.6 | | | | | (1.4 | ) | |
Accounts payable | | | | 10.4 | | | | | (0.2 | ) | |
Accrued expenses | | | | 3.0 | | | | | (2.6 | ) | |
Income taxes payable | | | | 1.1 | | | | | (0.8 | ) | |
| | | | |
Total changes in operating working capital | | | $ | | 3.5 | | | | | 1.9 | |
| | | | |
See accompanying Notes to Combined Financial Statements
F-16
Notes to Combined Financial Statements
CLOSETMAID CORPORATION
Years ended September 30
(Dollars in millions, except where noted)
(1) SUMMARY OF SIGNIFICANT ACCOUNTING POLICIES
Description of Business
ClosetMaid (the Company) operates as a business unit of Emerson Electric Co.’s (Emerson) Commercial & Residential Solutions segment and is the worldwide leader in home storage and organization solutions. Product offerings include shelving systems, closet organizers, home office and kitchen storage, and drawer systems and containers, available primarily in wire and wood.
Basis of Presentation
The Company has historically operated as part of Emerson and not as a stand-alone entity. These financial statements present the carve-out historical financial position, results of operations, and cash flows of the Company as if it had operated on a stand-alone basis subject to Emerson’s control, and include all accounts of the Company and its subsidiaries and affiliates on a consolidated basis. Intercompany transactions, profits and balances among ClosetMaid entities have been eliminated. These financial statements were derived from Emerson’s historical financial statements and accounting records and have been prepared in conformity with accounting principles generally accepted in the United States of America (U.S. GAAP). Sale and purchase transactions between the Company and other Emerson affiliates are included in the financial statements. See Note 10.
Based on its management operating structure, the Company has one segment. Operations are managed and financial performance is evaluated on a Company-wide basis.
As a business unit of Emerson, ClosetMaid has been charged for costs directly related to the Company, and has been allocated a portion of Emerson’s general corporate costs. All these costs are reflected in the financial statements. The Company participates in various Emerson programs which include information technology services, employee benefits, medical insurance, and other programs. Costs associated with these programs are charged to the Company based on Emerson’s actual cost and the Company’s relative level of usage. The Company also utilizes Emerson’s global shared service centers and is charged for direct costs and its share of facilities overhead.
Emerson provides certain oversight and support services, including assistance with management strategy, logistics, marketing, finance, treasury, tax, human resources, legal and other activities. A charge for these services, including key executive stock-based compensation, has historically been allocated to the Company based principally on revenue. While management believes the methodologies and assumptions used to allocate these costs are reasonable, the financial statements do not purport to represent the financial position, or the results of operations, changes in equity, and cash flows of the Company in the future, or what they would have been had the Company operated as a stand-alone entity during the periods presented.
Emerson centrally manages substantially all its financial resources. ClosetMaid finances its operating and capital requirements through cash provided by operations and intercompany funding with Emerson. Emerson does not allocate corporate debt or the related interest costs to its business units. Therefore, these carve-out financial statements do not reflect an allocation of corporate interest expense.
Equity shown on the balance sheet constitutes Emerson’s “Net parent investment” in the Company, which includes a cumulative intercompany receivable due from Emerson. Interest income earned on this receivable due from Emerson is included in earnings. Changes in the
F-17
Notes to Combined Financial Statements—(Continued)
CLOSETMAID CORPORATION
Years ended September 30
(Dollars in millions, except where noted)
cumulative balance are included in “Net transfer to Emerson” in the financing activities section of the combined statements of cash flows.
Use of Estimates
The preparation of the financial statements in conformity with U.S. GAAP requires management to make estimates and assumptions that could affect the reported amounts of assets, liabilities, revenue and expenses for the periods presented. Actual results could differ from those estimates.
Foreign Currency
The financial statements are presented in U.S. dollars, which is the Company’s reporting currency. The functional currency for the Company’s Mexico operations is U.S. dollars while other non-U.S. operations use the local currency. Adjustments resulting from translating local currency financial statements into U.S. dollars are reflected in accumulated other comprehensive income. Transactions denominated in currencies other than the functional currencies are subject to changes in exchange rates with resulting gains/losses recorded in net earnings.
Cash and Equivalents
Cash equivalents consist of highly-liquid investments with original maturities of three months or less.
Inventories
Inventories are primarily stated at the lower of cost or market and are valued based on standard costs that approximate average costs. Cost standards are revised at the beginning of each fiscal year. The annual effect of resetting standards plus operating variances incurred during each period are allocated between inventories and cost of sales. Following are the components of inventories as of September 30:
| | | | |
| | 2015 | | 2016 |
Raw materials | | | $ | | 6.5 | | | | | 5.7 | |
Work in process | | | | 1.4 | | | | | 1.1 | |
Finished products | | | | 21.9 | | | | | 21.0 | |
| | | | |
Total inventories | | | $ | | 29.8 | | | | | 27.8 | |
| | | | |
Property, Plant and Equipment
The Company records investments in land, buildings, and machinery and equipment at cost. Depreciation is computed principally using the straight-line method over estimated service lives, which for principal assets are 30 to 40 years for buildings and 10 to 12 years for machinery and equipment. Long-lived tangible assets are reviewed for impairment whenever events or changes in business circumstances indicate the carrying value of the assets may not be recoverable. Impairment losses, if any, are recognized based on estimated fair values if the sum of expected future undiscounted cash flows of the related assets is less
F-18
Notes to Combined Financial Statements—(Continued)
CLOSETMAID CORPORATION
Years ended September 30
(Dollars in millions, except where noted)
than the carrying values. The components of property, plant and equipment as of September 30 follow:
| | | | |
| | 2015 | | 2016 |
Land | | | $ | | 3.2 | | | | | 3.2 | |
Buildings | | | | 47.6 | | | | | 47.2 | |
Machinery and equipment | | | | 110.7 | | | | | 106.6 | |
Construction in progress | | | | 3.6 | | | | | 2.7 | |
| | | | |
Property, plant and equipment, at cost | | | | 165.1 | | | | | 159.7 | |
Less: Accumulated depreciation | | | | (127.9 | ) | | | | | (123.6 | ) | |
| | | | |
Property, plant and equipment, net | | | $ | | 37.2 | | | | | 36.1 | |
| | | | |
Goodwill and Other Intangibles
Assets and liabilities acquired in business combinations are accounted for using the acquisition method and recorded at their respective fair values. Goodwill represents the excess of consideration paid over total fair value of the net assets acquired. The Company conducts its annual impairment test of goodwill in the fourth quarter and between annual tests if events or circumstances indicate its fair value may be less than its carrying value. If the carrying value exceeds its estimated fair value, goodwill impairment is recognized to the extent that recorded goodwill exceeds the implied fair value of goodwill. The estimated fair value of the reporting unit is a Level 3 measure, developed primarily under an income approach that discounts estimated future cash flows using risk adjusted interest rates. No goodwill impairment was recorded for any of the periods presented.
All the Company’s identifiable intangible assets are subject to amortization on a straight-line basis over their estimated useful lives. Identifiable intangibles consist of intellectual property such as patented and unpatented technology and trademarks, customer relationships and capitalized software. Identifiable intangible assets are also subject to evaluation for potential impairment if events or circumstances indicate the carrying value may not be recoverable. No identifiable intangible asset impairment was recorded for any of the periods presented.
Net Parent Investment
The net parent investment balance included in the combined balance sheets represents Emerson’s historical investment in the Company, the Company’s accumulated net earnings after income taxes, and the net effect of transactions with Emerson.
Revenue Recognition
The Company recognizes revenue from the sale of manufactured products. The Company records revenue when products are shipped or delivered, title and risk of loss pass to the customer, and collection is reasonably assured. Management believes all the relevant criteria and conditions have been met when recognizing revenue. The Company has various advertising and volume rebate programs with its major customers, where benefits accrue monthly and are settled at various intervals through the year. Although some are cash settled, amounts due customers are typically settled via issuance of debit and credit memos between the parties. Rebates are based on a negotiated scale and are available only after customers have purchased minimum specified quantities, and totaled $8.4 and $9.0 in 2016
F-19
Notes to Combined Financial Statements—(Continued)
CLOSETMAID CORPORATION
Years ended September 30
(Dollars in millions, except where noted)
and 2015, respectively. For advertising, the Company reimburses a portion of its customers’ advertising spending up to a pre-set percentage of sales volume. The cost of advertising reimbursements was $16.7 and $16.3 in 2016 and 2015, respectively. Costs related to these and other programs are deducted from gross sales in arriving at reported net sales.
The Company records amounts billed to customers for the costs of shipping and handling in sales transactions as revenue. Shipping and handling costs incurred by the Company were $20.7 and $25.3 for 2016 and 2015, respectively, and were reported in selling, general and administrative expenses.
The Home Depot accounted for 42.1 percent and 42.6 percent of the Company’s sales in 2016 and 2015, respectively. Target Stores accounted for an additional 16.0 percent and 16.8 percent of sales in those years.
Warranty
The Company warrants its products to be free of defects and replaces any defective products free of charge. Costs for defective products were $4.8 and $4.6, respectively, or approximately 1.5 percent and 1.4 percent of net sales in 2016 and 2015.
Fair Value Measurement
Accounting Standards Codification (ASC) 820,Fair Value Measurement, establishes a formal hierarchy and framework for measuring certain financial statement items at fair value, and requires disclosures about fair value measurements and the reliability of valuation inputs. Under ASC 820, measurement assumes the transaction to sell an asset or transfer a liability occurs in the principal or at least the most advantageous market for that asset or liability. Within the hierarchy, Level 1 instruments use observable market prices for the identical item in active markets and have the most reliable valuations. Level 2 instruments are valued through broker/dealer quotation or through market-observable inputs for similar items in active markets, including forward and spot prices, interest rates and volatilities. Level 3 instruments are valued using inputs not observable in an active market, such as company-developed future cash flows, and are considered the least reliable. Valuations for all the Company’s financial instruments fall within Level 2. Carrying value approximates fair value for cash and equivalents, accounts receivable and accounts payable.
Derivative Instruments and Hedging Activities
In the normal course of business, the Company is exposed to changes in foreign currency exchange rates relating to transactions denominated in currencies that differ from the functional currencies of its subsidiaries, principally Canadian dollars and Mexican pesos. Foreign exchange forwards are utilized, as needed, to hedge foreign currency exposures impacting sales or cost of sales transactions, firm commitments or the fair value of assets and liabilities. All derivatives are associated with specific underlying exposures and the Company does not hold derivatives for trading or speculative purposes. The initial duration of hedge positions is less than two years.
All derivatives are accounted for under ASC 815,Derivatives and Hedging, and recognized at fair value. For derivatives hedging variability in future cash flows, the effective portion of any gain or loss is deferred in equity and recognized when the underlying transaction impacts earnings. To the extent that any hedge is not fully effective at offsetting changes in the underlying hedged item, there could be a net earnings impact. Gains and
F-20
Notes to Combined Financial Statements—(Continued)
CLOSETMAID CORPORATION
Years ended September 30
(Dollars in millions, except where noted)
losses from the ineffective portion of any hedge are recognized in the combined statements of earnings immediately.
Income Taxes
The Company’s operations have historically been included in Emerson’s combined U.S. and non-U.S. income tax returns in most locations. Income tax expense included in the financial statements has been calculated following the separate return method, which applies ASC 740, Income Taxes, as if the Company was a stand-alone enterprise and a separate taxpayer for the periods presented. The calculation of income taxes on a separate return basis requires considerable judgment and the use of both estimates and allocations that affect the calculation of certain tax liabilities and the determination of the recoverability of certain deferred tax assets, which arise from temporary differences between the tax and financial statement recognition of revenue and expenses. As a result, the Company’s deferred income tax rate and deferred tax balances may differ from those in Emerson’s historical results.
The provision for income taxes is determined using the asset and liability approach of ASC 740. Deferred taxes represent the future tax consequences expected when the reported amounts of assets and liabilities are recovered or paid. Deferred taxes result from differences between financial statement and tax bases of the Company’s assets and liabilities. Valuation allowances are recorded to reduce deferred tax assets when it is more likely than not that a tax benefit will not be realized. Any tax carryforwards reflected in the financial statements have also been determined using the separate return method. Tax carryforwards include net operating losses.
The complexity of tax regulations require assessments of uncertainties in estimating taxes the Company will ultimately pay. The Company recognizes liabilities for anticipated tax audit uncertainties in the U.S. and other tax jurisdictions based on its estimate of whether, and the extent to which additional taxes would be due on a separate return basis. Tax liabilities are presented net of any related tax loss carryforwards.
The Company also provides for income taxes, net of any potentially available foreign tax credits, on earnings intended to be repatriated from foreign subsidiaries. Undistributed earnings of foreign subsidiaries were zero as of September 30, 2016. Recognition of income taxes on undistributed foreign earnings, if any, would be triggered by a decision to repatriate earnings. Determination of the amount of taxes that might be paid on any undistributed earnings if eventually remitted is not practicable.
Recent Accounting Pronouncements
In May 2014, the Financial Accounting Standards Board (FASB) amended ASC 606,Revenue from Contracts with Customers, to update and consolidate revenue recognition guidance from multiple sources into a single, comprehensive standard to be applied for all contracts with customers. The fundamental principle of the revised standard is to recognize revenue based on the transfer of goods and services to customers at an amount that the Company expects to be entitled to in exchange for those goods and services. Also required are additional disclosures regarding the nature, extent, timing and uncertainty of revenues and associated cash flows. Required adoption of the new standard is effective for the Company in the first quarter of fiscal 2019. The new rules may be adopted on either a prospective or retrospective basis. The Company is in the process of evaluating the impact of the revised standard on the financial statements and determining its method of adoption.
F-21
Notes to Combined Financial Statements—(Continued)
CLOSETMAID CORPORATION
Years ended September 30
(Dollars in millions, except where noted)
In November 2015, the FASB issued updates to ASC 740,Income Taxes, requiring noncurrent presentation of all deferred tax assets and liabilities on the balance sheet. These updates are effective for the Company in the first quarter of fiscal 2018, with early adoption permitted, and may be adopted on either a prospective or retrospective basis. The Company is in the process of evaluating the impact of the revised standard on its financial statements.
In February 2016, the FASB amended ASC 842,Leases, to require recognition on the balance sheet of assets and liabilities related to the rights and obligations associated with all lease arrangements. Currently, obligations classified as operating leases are not recorded on the balance sheet, but must be disclosed. The amendment also adds disclosures intended to provide more information regarding the amount, timing and uncertainty of cash flows arising from lease arrangements. Adoption of the new standard is effective for the Company in the first quarter of fiscal 2020. The Company is in the process of evaluating the impact of the revised standard on the financial statements.
(2) OTHER DEDUCTIONS, NET
Other deductions, net are summarized as follows:
| | | | |
| | 2015 | | 2016 |
Restructuring expense (see Note 3) | | | $ | | 2.9 | | | | | 0.6 | |
Other, net | | | | 0.4 | | | | | 0.2 | |
| | | | |
Total | | | $ | | 3.3 | | | | | 0.8 | |
| | | | |
Other, net is composed of several items that are individually immaterial, including amortization of intangibles, foreign currency transaction gains or losses, gains on disposals of property, plant and equipment and other items.
(3) RESTRUCTURING
Restructuring activity reflects costs associated with the Company’s efforts to continually improve operational efficiency and deploy assets to remain competitive. Shutdown costs can include severance, benefits, stay bonuses, lease and contract terminations and asset write-downs. Start-up and moving costs include any costs of moving fixed assets, employee training and relocation. Vacant facility costs include security, maintenance, utilities and other costs.
Restructuring expenses were $0.6 and $2.9, respectively, for 2016 and 2015. The Company currently expects to incur 2017 restructuring expense of approximately $0.9, including costs to complete actions initiated before the end of 2016 and for actions anticipated to be approved and initiated during 2017.
The change in the liability for the restructuring of operations during the year ended September 30 follows:
| | | | | | | | | | | | | | |
| | 2014 | | Expense | | Paid/
Utilized | | 2015 | | Expense | | Paid/
Utilized | | 2016 |
Severance and benefits | | | $ | | — | | | | | 0.8 | | | | | — | | | | | 0.8 | | | | | — | | | | | (0.8 | ) | | | | | — | |
Vacant facility and other shutdown costs | | | | — | | | | | 2.1 | | | | | (1.8 | ) | | | | | 0.3 | | | | | 0.6 | | | | | (0.9 | ) | | | | | — | |
| | | | | | | | | | | | | | |
Total | | | $ | | — | | | | | 2.9 | | | | | (1.8 | ) | | | | | 1.1 | | | | | 0.6 | | | | | (1.7 | ) | | | | | — | |
| | | | | | | | | | | | | | |
F-22
Notes to Combined Financial Statements—(Continued)
CLOSETMAID CORPORATION
Years ended September 30
(Dollars in millions, except where noted)
In 2016, restructuring activity reflected primarily vacant facilities costs, as well as limited amounts of severance, bonus and plant relocation costs related to closure of the Chino, CA manufacturing facility which was begun in 2015. U.S. forcecount was reduced by 17in 2016 due to the Chino action, while forcecount in China was reduced by a total of 72 due to the scaling back of production (55) and the elimination of a sales office (17). The Company incurred $2.1 in Chino shutdown costs in 2015, primarily for asset write-downs and plant relocation costs, plus severance and benefits. In addition, the Company incurred $0.8 in costs for the manufacturing and sales force reductions in China, principally for severance. Forcecount was reduced by 46 in 2015, all related to the Chino shutdown.
(4) GOODWILL AND OTHER INTANGIBLES
The change in the carrying value of goodwill for the years ended September 30, 2016 and 2015 is attributable to foreign currency translation. The Company has recognized no impairments of goodwill.
The gross carrying amounts and accumulated amortization of identifiable intangible assets by major class follow:
| | | | | | | | | | | | | | | | |
| | Customer
Relationships | | Intellectual
Property | | Capitalized Software | | Total |
| | 2015 | | 2016 | | 2015 | | 2016 | | 2015 | | 2016 | | 2015 | | 2016 |
Gross carrying amount | | | $ | | 10.8 | | | | | 10.7 | | | | | 3.3 | | | | | 3.2 | | | | | 5.5 | | | | | 5.6 | | | | | 19.6 | | | | | 19.5 | |
Less: Accumulated amortization | | | | 10.8 | | | | | 10.7 | | | | | 2.8 | | | | | 2.7 | | | | | 4.3 | | | | | 4.9 | | | | | 17.9 | | | | | 18.3 | |
| | | | | | | | | | | | | | | | |
Net carrying amount | | | $ | | — | | | | | — | | | | | 0.5 | | | | | 0.5 | | | | | 1.2 | | | | | 0.7 | | | | | 1.7 | | | | | 1.2 | |
| | | | | | | | | | | | | | | | |
Total intangible asset amortization expense for 2016 and 2015 was $0.7 and $0.9, respectively. Based on intangible asset balances as of September 30, 2016, expected amortization expense is $0.5 in 2017, $0.2 in 2018, $0.1 in 2019 and less than $0.1 in the years thereafter.
(5) FINANCIAL INSTRUMENTS
Hedging Activities
As of September 30, 2016, the notional amount of foreign currency hedge positions was approximately $15.0. All derivatives receiving deferral accounting are cash flow hedges. Most hedging gains and losses deferred as of September 30, 2016 are expected to be recognized over the next 12 months as the underlying forecasted transactions occur. Amounts included in earnings and other comprehensive income (OCI) follow:
| | | | | | | | |
Location | | Gain (Loss)
to Earnings | | Gain (Loss)
to OCI |
| | 2015 | | 2016 | | 2015 | | 2016 |
Foreign currency Cost of sales | | | | 0.2 | | | | | (0.1 | ) | | | | | 0.2 | | | | | (0.4 | ) | |
The Company expects hedging gains or losses to be essentially offset by losses or gains on the related underlying exposures. The amounts ultimately recognized will differ from those presented above for open positions, which remain subject to ongoing market price fluctuations until settlement. Derivatives receiving deferral accounting are highly effective and no amounts were excluded from the assessment of hedge effectiveness. Hedge ineffectiveness was inconsequential in 2016 and 2015.
F-23
Notes to Combined Financial Statements—(Continued)
CLOSETMAID CORPORATION
Years ended September 30
(Dollars in millions, except where noted)
Fair Value Measurement
The fair value of foreign currency contracts was reported in other current assets and accrued expenses. Carrying values of derivative contract positions were assets of $0.4 and liabilities of $0.7 as of September 30, 2016, and $0.6 and $0.7, respectively, as of September 30, 2015.
(6) LONG-TERM DEBT
Long-term debt, including the current portion, stems from three capital leases with concurrent terms related to the Ocala, FL manufacturing, warehouse and headquarters operations. All leases expire in June 2020 and bear interest at 8.02 percent. The gross carrying amount of assets under lease was $21.4, of which $21.2 was buildings and $0.2 was land; Remaining unamortized balances are $3.9 and less than $0.1, respectively. ClosetMaid has options to purchase the assets upon expiration for a total of $23.0 and it can also extend the lease terms. The Company has made no decision in this regard. Depreciation expense on leased assets was $1.0 in both 2015 and 2016. Interest expense was $0.7 in 2015 and $0.6 in 2016. Future cash lease payments, including interest, are $2.1 in 2017 through 2019 and $1.6 in 2020. There are no subleases, escalation clauses, contingencies, guarantees, restrictive covenants or capital requirements associated with the leases.
(7) RETIREMENT PLANS
Most of the Company’s employees participate in defined contribution plans, including 401(k), profit sharing, and other savings plans that provide retirement benefits. Expenses related to these plans equal cash contributions. Certain non-U.S. employees participate in statutorily required termination benefit plans, which have no associated assets or funding requirements. The liability related to these plans was $0.4 as of September 30, 2016 and 2015, and represents an apportionment from the total liability attributable to all Emerson affiliated employees. There are no plans specifically attributable to ClosetMaid. Additionally, certain Company employees participate in broad Emerson-sponsored defined benefit plans. Liabilities under these plans are obligations of Emerson and, accordingly, are not reflected in these financial statements. The Company accounts for the cost of these plans as a participant in a multiemployer pension plan in accordance with ASC 715,Compensation—Retirement Benefits. Costs charged to the Company by Emerson for participation in these plans are based on specific actuarially-determined service and interest costs for Company employees, and a proportionate allocation of actuarial loss amortization based on Emerson’s benefit obligations. The primary objective for the investment of broad Emerson pension plan assets is to secure participant retirement benefits while earning a reasonable rate of return, with assets invested consistent with the principles of prudence and diversification for a long-term investment horizon.
Retirement plans expense includes the following components:
| | | | | | | | |
| | U.S. Plans | | Non-U.S. Plans |
| | 2015 | | 2016 | | 2015 | | 2016 |
Defined benefit plans | | | $ | | 1.4 | | | | | 1.4 | | | | | — | | | | | — | |
Defined contribution plans | | | | 0.9 | | | | | 1.0 | | | | | 1.1 | | | | | 0.9 | |
| | | | | | | | |
Total retirement plans expense | | | $ | | 2.3 | | | | | 2.4 | | | | | 1.1 | | | | | 0.9 | |
| | | | | | | | |
F-24
Notes to Combined Financial Statements—(Continued)
CLOSETMAID CORPORATION
Years ended September 30
(Dollars in millions, except where noted)
(8) INCOME TAXES
The Company’s operations have historically been included in Emerson’s combined U.S. and non-U.S. income tax returns in most locations. Income tax expense and deferred income tax balances are presented in the financial statements as if the Company filed its own income tax returns in each jurisdiction. See Note 1.
Earnings before income taxes consist of the following:
| | | | |
| | 2015 | | 2016 |
United States | | | $ | | 24.5 | | | | | 26.0 | |
Non-U.S. | | | | 2.5 | | | | | 4.6 | |
| | | | |
Total earnings before income taxes | | | $ | | 27.0 | | | | | 30.6 | |
| | | | |
The principal components of income tax expense follow:
| | | | |
| | 2015 | | 2016 |
Current | | | | |
Federal | | | $ | | 11.7 | | | | | 5.6 | |
State and local | | | | 1.2 | | | | | 1.0 | |
Non-U.S. | | | | 1.6 | | | | | 2.3 | |
Deferred | | | | |
Federal | | | | (2.8 | ) | | | | | 2.7 | |
State and local | | | | (0.1 | ) | | | | | 0.3 | |
Non-U.S. | | | | (0.3 | ) | | | | | 0.1 | |
| | | | |
Income tax expense | | | $ | | 11.3 | | | | | 12.0 | |
| | | | |
Reconciliation of the U.S. statutory income tax rate to the Company’s effective income tax rate follows:
| | | | |
| | 2015 | | 2016 |
U.S. federal rate | | | | 35.0 | % | | | | | 35.0 | % | |
State and local taxes, net of federal benefit | | | | 2.6 | | | | | 2.7 | |
Impact of foreign income | | | | 3.7 | | | | | 1.0 | |
U.S. manufacturing deduction | | | | (1.1 | ) | | | | | (0.9 | ) | |
Unrecognized tax benefits | | | | — | | | | | 1.8 | |
Other | | | | 1.7 | | | | | (0.4 | ) | |
| | | | |
Effective income tax rate | | | | 41.9 | % | | | | | 39.2 | % | |
| | | | |
Following are changes in 2016 unrecognized tax benefits before considering recoverability of cross-jurisdictional tax credits (federal, state and non-U.S.) and temporary differences. The amount of unrecognized tax benefits is not expected to change significantly within the next 12 months. There were no 2015 unrecognized tax benefits or activity.
| | |
| | 2016 |
Beginning balance | | | $ | | — | |
Additions for current year tax positions | | | | 1.8 | |
| | |
Ending balance | | | $ | | 1.8 | |
| | |
If none of the unrecognized tax benefits shown is ultimately paid, the tax provision and the calculation of the effective tax rate would be favorably impacted $0.6. The Company accrues interest and penalties related to income taxes in income tax expense. Insignificant
F-25
Notes to Combined Financial Statements—(Continued)
CLOSETMAID CORPORATION
Years ended September 30
(Dollars in millions, except where noted)
interest was recognized in 2016 and none was recognized in 2015. No penalties were recognized in either year. Accrued interest and penalties at September 30, 2016 and 2015 were inconsequential.
The U.S. is the major jurisdiction for which the Company files income tax returns. U.S federal tax returns are closed through 2012. The status of state and non-U.S. tax examinations varies by the numerous legal entities and jurisdictions in which the Company operates.
The principal items that gave rise to deferred income tax assets and liabilities follow:
| | | | |
| | 2015 | | 2016 |
Deferred tax assets | | | | |
Net operating losses | | | $ | | 0.3 | | | | | 0.3 | |
Accrued liabilities | | | | 4.5 | | | | | 0.3 | |
Leveraged lease | | | | 1.2 | | | | | 1.0 | |
Employee compensation and benefits | | | | 1.7 | | | | | 2.1 | |
Other | | | | 0.9 | | | | | 1.2 | |
| | | | |
Total | | | $ | | 8.6 | | | | | 4.9 | |
| | | | |
Valuation allowances | | | $ | | (0.5 | ) | | | | | (0.4 | ) | |
| | | | |
Deferred tax liabilities | | | | |
Intangibles | | | | (6.7 | ) | | | | | (6.7 | ) | |
Property, plant & equipment | | | | (3.0 | ) | | | | | (3.1 | ) | |
Other | | | | (0.2 | ) | | | | | (0.2 | ) | |
| | | | |
Total | | | $ | | (9.9 | ) | | | | | (10.0 | ) | |
| | | | |
Net deferred income tax liability | | | $ | | (1.8 | ) | | | | | (5.5 | ) | |
| | | | |
Current deferred tax assets, net were $3.1 and $6.8 as of September 30, 2016 and 2015, respectively, while noncurrent deferred tax liabilities, net were $8.6 in both years. The $0.3 net operating losses as of September 30, 2016 expire over the next five years. Total income taxes paid were $10.8 in 2016 and $11.4 in 2015.
(9) STOCK-BASED COMPENSATION
Certain employees of the Company participate in Emerson stock-based compensation plans, which include stock options, performance shares and restricted stock. Compensation expense is recognized based on Emerson’s cost of the awards determined under ASC 718, Compensation—Stock Compensation. Stock-based compensation recognized by Emerson related to Company employees was $1.2 and $0.3 for 2016 and 2015, respectively. These costs are not specifically reflected as compensation expense in ClosetMaid’s financial statements. Instead, the allocation to the Company of Emerson corporate support costs is considered sufficient to ensure the Company’s results include expenses approximately equivalent to actual compensation expense. See Notes 1 and 10.
Stock Options
The Emerson stock option plan permits officers and certain other Emerson employees to purchase Emerson common stock at specified prices, which are equal to the closing market price on the date of grant. Options generally vest one-third in each of the three years subsequent to grant and expire 10 years from the date of grant. Compensation expense is
F-26
Notes to Combined Financial Statements—(Continued)
CLOSETMAID CORPORATION
Years ended September 30
(Dollars in millions, except where noted)
recognized by Emerson ratably over the vesting period based on the number of options expected to vest.
Performance Shares and Restricted Stock
Performance shares and restricted stock plans distribute the value of Emerson common stock subject to certain operating performance conditions, and service and other restrictions. Distribution is primarily in shares of Emerson common stock and cash. Compensation expense is recognized by Emerson at fair value over the service periods, based on the number of awards ultimately expected to be earned.
(10) RELATED-PARTY TRANSACTIONS
As a business unit of Emerson, the Company has been charged for costs directly attributable to ClosetMaid and allocated a portion of Emerson’s general corporate costs. All these costs are reflected in the Company’s financial statements. Management believes the methodologies and assumptions used to allocate costs to the Company are reasonable.
Emerson maintains a centralized information technology function that supports its business units. Services provided include application hosting, network support, network security, messaging and technology related services. Charges to the Company for these services are based on Emerson’s cost and the Company’s actual usage. Emerson administers a medical insurance program for its U.S. employees in which the Company participates and for which it records the cost of claims incurred each period. The Company participates in other Emerson programs including, but not limited to, workers’ compensation and general and product liability insurance. Other Emerson programs are charged to the Company based on costs incurred and usage. The Company utilizes Emerson global shared service centers that host Company-dedicated resources providing customer facing support, engineering and back office financial services. Costs for these resources are charged directly to the Company, with the clear majority relating to employee compensation and benefits and the remaining portion relating to facility overhead.
Costs incurred for Emerson-managed functions for the years ended September 30:
| | | | |
| | 2015 | | 2016 |
Corporate management | | | $ | | 3.8 | | | | | 3.7 | |
Information technology | | | $ | | 1.2 | | | | | 1.2 | |
Insurance / other benefits | | | $ | | 5.5 | | | | | 7.5 | |
Shared services | | | $ | | 2.0 | | | | | 1.9 | |
The Company had sales to Emerson affiliates of $0.8 in both 2016 and 2015, and had no product purchases from Emerson affiliates in those years.
Related-party amounts reported in the balance sheet as of September 30:
| | | | |
| | 2015 | | 2016 |
Accounts receivable | | | $ | | 0.1 | | | | | 0.1 | |
Accounts payable | | | $ | | 0.2 | | | | | 0.2 | |
Cash in cash pool | | | $ | | 6.2 | | | | | 6.2 | |
Cash pool borrowing | | | $ | | 3.4 | | | | | — | |
Cumulative intercompany receivable due from Emerson | | | $ | | 183.0 | | | | | 189.2 | |
The Company recognized interest income of $3.2 and $2.7, respectively, in 2016 and 2015 related to the cumulative intercompany receivable due from Emerson.
F-27
Notes to Combined Financial Statements—(Continued)
CLOSETMAID CORPORATION
Years ended September 30
(Dollars in millions, except where noted)
(11) CONTINGENT LIABILITIES AND COMMITMENTS
The Company is a party to a number of pending legal proceedings and claims, including those involving general and product liability and other matters. The Company accrues for such liabilities when it is probable that future costs (including legal fees and expenses) will be incurred and such costs can be reasonably estimated. Accruals are based on developments to date; management’s estimates of the outcomes of these matters; the Company’s experience in contesting, litigating and settling similar matters; and any related insurance coverage. While the Company believes a material adverse impact is unlikely, it is not possible to predict the ultimate outcome of these matters. Given the inherent uncertainty of litigation, a remote possibility does exist that a future development could have a material adverse impact on the Company. As of September 30, 2016, there were no known contingent liabilities (including guarantees, taxes and other claims) that management believes will be material in relation to the Company’s financial statements, nor were there any material commitments outside the normal course of business.
(12) ACCUMULATED OTHER COMPREHENSIVE INCOME
| | | | |
| | 2015 | | 2016 |
Foreign currency translation, beginning | | | $ | | 20.5 | | | | | 14.8 | |
Other comprehensive income (loss) | | | | (5.7 | ) | | | | | 0.4 | |
| | | | |
Foreign currency translation, ending | | | | 14.8 | | | | | 15.2 | |
| | | | |
Cash flow hedges, beginning | | | | — | | | | | — | |
Gains (losses) deferred during the period, net of income taxes of: 2015, $0.0; 2016, $0.1 | | | | 0.2 | | | | | (0.3 | ) | |
Reclassification of (gains) losses to sales and cost of sales, net of income taxes of: 2015, $0.0; 2016, $0.0 | | | | (0.2 | ) | | | | | 0.1 | |
| | | | |
Cash flow hedges, ending | | | | — | | | | | (0.2 | ) | |
| | | | |
Accumulated other comprehensive income | | | $ | | 14.8 | | | | | 15.0 | |
| | | | |
(13) GEOGRAPHIC INFORMATION
| | | | | | | | |
| | Sales by Destination | | Property, Plant and Equipment, net |
| | 2015 | | 2016 | | 2015 | | 2016 |
United States | | | $ | | 302.6 | | | | | 292.1 | | | | $ | | 31.1 | | | | | 30.2 | |
Canada | | | | 18.1 | | | | | 17.0 | | | | | — | | | | | — | |
Other | | | | 13.3 | | | | | 9.5 | | | | | 6.1 | | | | | 5.9 | |
| | | | | | | | |
Total | | | $ | | 334.0 | | | | | 318.6 | | | | $ | | 37.2 | | | | | 36.1 | |
| | | | | | | | |
Other property, plant and equipment primarily relates to manufacturing operations in Mexico.
F-28
Notes to Combined Financial Statements—(Continued)
CLOSETMAID CORPORATION
Years ended September 30
(Dollars in millions, except where noted)
(14) OTHER FINANCIAL DATA
Items reported in earnings during the years ended September 30 include the following:
| | | | |
| | 2015 | | 2016 |
Depreciation expense | | | $ | | 7.6 | | | | | 6.5 | |
Rent expense | | | $ | | 5.8 | | | | | 5.0 | |
Advertising expense | | | $ | | 5.0 | | | | | 4.3 | |
Research and development expense | | | $ | | 1.4 | | | | | 1.4 | |
Items reported in accrued expenses include the following:
| | | | |
| | 2015 | | 2016 |
Salaries and other employee compensation | | | $ | | 4.0 | | | | | 3.1 | |
Advertising | | | $ | | 2.3 | | | | | 2.7 | |
Workers’ compensation | | | $ | | 2.2 | | | | | 3.6 | |
Freight | | | $ | | 3.2 | | | | | 2.7 | |
Rebates and quantity discounts | | | $ | | 2.7 | | | | | 1.3 | |
The Company leases certain office and manufacturing facilities, transportation and office equipment, and other items under operating lease agreements. Minimum annual rentals under noncancelable long-term leases, exclusive of maintenance, taxes, insurance and other operating costs, approximate $3.1 in 2017, $1.7 in 2018, $1.4 in 2019, $1.4 in 2020, $0.4 in 2021 and zero thereafter.
(15) SUBSEQUENT EVENTS
The Company has evaluated subsequent events through May 8, 2017, which is the date the financial statements were available to be issued.
* * *
F-29


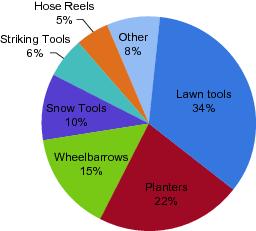

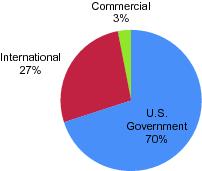
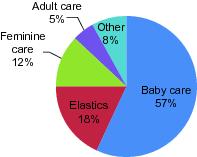
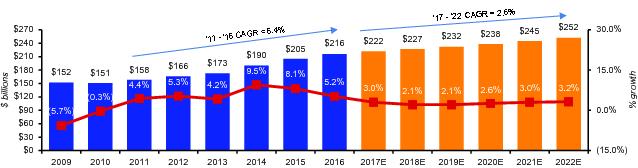
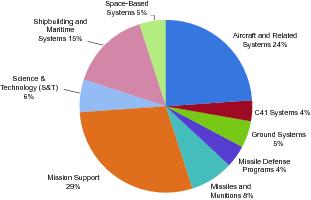
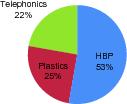
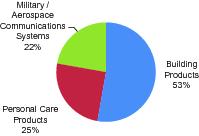
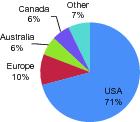
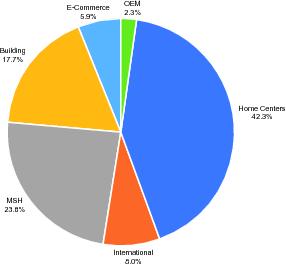
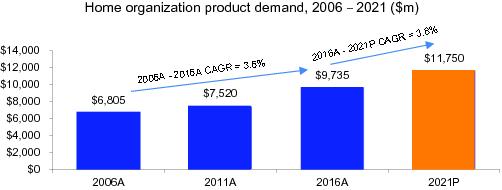

 (“ClosetMaid China”) may be completed on the deferred closing date (as describe below under “The ClosetMaid Acquisition—ClosetMaid China), certain approvals must be obtained from various Chinese regulators including the State Administration for Industry and Commerce of the People’s Republic of China or its designated local counterparts and the Ministry of Commerce of the People’s Republic of China or its designated local counterparts. We are required to use our reasonable best efforts to obtain the approvals to allow for the completion of the acquisition of ClosetMaid China. In deciding whether to grant regulatory clearances, the relevant governmental entities may impose requirements, limitations or costs or place restrictions on the conduct of the combined company’s business. There can be no assurance that Chinese regulators will not impose conditions, terms, obligations or restrictions to the consummation of our acquisition of ClosetMaid China and that such conditions, terms, obligations or restrictions will not have the effect of delaying the completion of the acquisition of ClosetMaid China or result in the delay or abandonment of the acquisition of ClosetMaid China. Additionally, the completion of the acquisition of ClosetMaid China is conditioned on the absence of certain restraining orders or injunctions by judgment, court order or law that would prohibit the completion of the acquisition of ClosetMaid China.