
Exhibit 99.1 CHIEF EXECUTIVE OFFICERExhibit 99.1 CHIEF EXECUTIVE OFFICER

This presentation contains non-GAAP financial measures. You can find the reconciliation of these measures to the most directly comparable GAAP financial measure in the Appendix at the end of this presentation. The non-GAAP financial measures disclosed by Intel should not be considered a substitute for, or superior to, the financial measures prepared in accordance with GAAP. Please refer to “Explanation of Non-GAAP Measures” in Intel's quarterly earnings release for a detailed explanation of the adjustments made to the comparable GAAP measures, the ways management uses the non-GAAP measures and the reasons why management believes the non-GAAP measures provide investors with useful supplemental information. Statements in this presentation that refer to business outlook, future plans and expectations are forward-looking statements that involve a number of risks and uncertainties. Words such as anticipates, expects, intends, goals, plans, believes, seeks, estimates, continues, may, will, “would,” should, “could,” and variations of such words and similar expressions are intended to identify such forward-looking statements. Statements that refer to or are based on estimates, forecasts, projections, uncertain events or assumptions, including statements relating to total addressable market (TAM) or market opportunity, future products and the expected availability and benefits of such products, and anticipated trends in our businesses or the markets relevant to them, also identify forward-looking statements. Such statements are based on management's expectations as of May 8, 2019, unless an earlier date is indicated, and involve many risks and uncertainties that could cause actual results to differ materially from those expressed or implied in these forward-looking statements. Important factors that could cause actual results to differ materially from the company's expectations are set forth in Intel's earnings release dated April 25, 2019, which is included as an exhibit to Intel’s Form 8-K furnished to the SEC on such date. Additional information regarding these and other factors that could affect Intel's results is included in Intel's SEC filings, including the company's most recent reports on Forms 10-K and 10-Q. Copies of Intel's Form 10- K, 10-Q and 8-K reports may be obtained by visiting our Investor Relations website at www.intc.com or the SEC's website at www.sec.gov. All information in this presentation reflects management’s views as of May 8, 2019, unless an earlier date is indicated. Intel does not undertake, and expressly disclaims any duty, to update any statement made in this presentation, whether as a result of new information, new developments or otherwise, except to the extent that disclosure may be required by law.This presentation contains non-GAAP financial measures. You can find the reconciliation of these measures to the most directly comparable GAAP financial measure in the Appendix at the end of this presentation. The non-GAAP financial measures disclosed by Intel should not be considered a substitute for, or superior to, the financial measures prepared in accordance with GAAP. Please refer to “Explanation of Non-GAAP Measures” in Intel's quarterly earnings release for a detailed explanation of the adjustments made to the comparable GAAP measures, the ways management uses the non-GAAP measures and the reasons why management believes the non-GAAP measures provide investors with useful supplemental information. Statements in this presentation that refer to business outlook, future plans and expectations are forward-looking statements that involve a number of risks and uncertainties. Words such as anticipates, expects, intends, goals, plans, believes, seeks, estimates, continues, may, will, “would,” should, “could,” and variations of such words and similar expressions are intended to identify such forward-looking statements. Statements that refer to or are based on estimates, forecasts, projections, uncertain events or assumptions, including statements relating to total addressable market (TAM) or market opportunity, future products and the expected availability and benefits of such products, and anticipated trends in our businesses or the markets relevant to them, also identify forward-looking statements. Such statements are based on management's expectations as of May 8, 2019, unless an earlier date is indicated, and involve many risks and uncertainties that could cause actual results to differ materially from those expressed or implied in these forward-looking statements. Important factors that could cause actual results to differ materially from the company's expectations are set forth in Intel's earnings release dated April 25, 2019, which is included as an exhibit to Intel’s Form 8-K furnished to the SEC on such date. Additional information regarding these and other factors that could affect Intel's results is included in Intel's SEC filings, including the company's most recent reports on Forms 10-K and 10-Q. Copies of Intel's Form 10- K, 10-Q and 8-K reports may be obtained by visiting our Investor Relations website at www.intc.com or the SEC's website at www.sec.gov. All information in this presentation reflects management’s views as of May 8, 2019, unless an earlier date is indicated. Intel does not undertake, and expressly disclaims any duty, to update any statement made in this presentation, whether as a result of new information, new developments or otherwise, except to the extent that disclosure may be required by law.
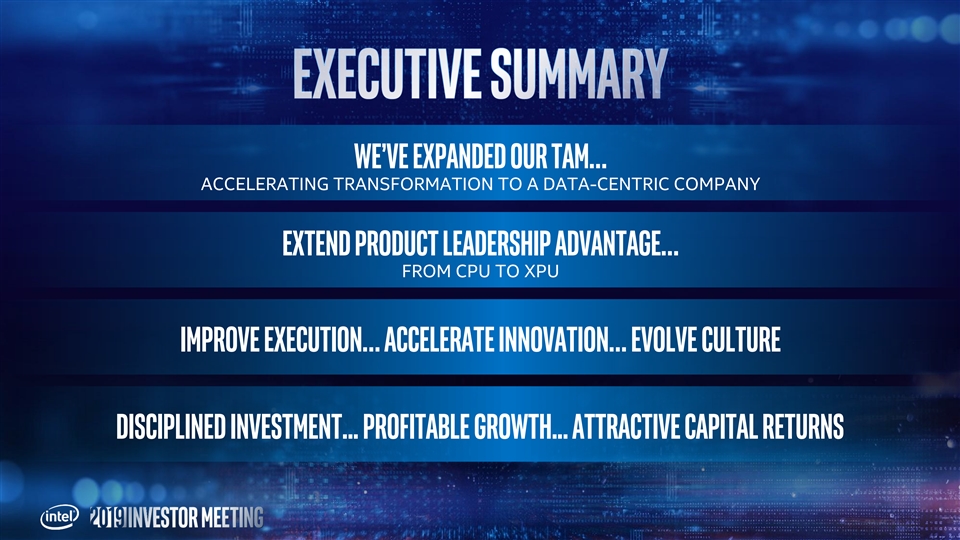
We’ve expanded our TAM… ACCELERATING TRANSFORMATION TO A DATA-CENTRIC COMPANY Extend product leadership advantage… FROM CPU TO XPU Improve execution… accelerate innovation… evolve culture Disciplined investment... Profitable growth... Attractive capital returnsWe’ve expanded our TAM… ACCELERATING TRANSFORMATION TO A DATA-CENTRIC COMPANY Extend product leadership advantage… FROM CPU TO XPU Improve execution… accelerate innovation… evolve culture Disciplined investment... Profitable growth... Attractive capital returns
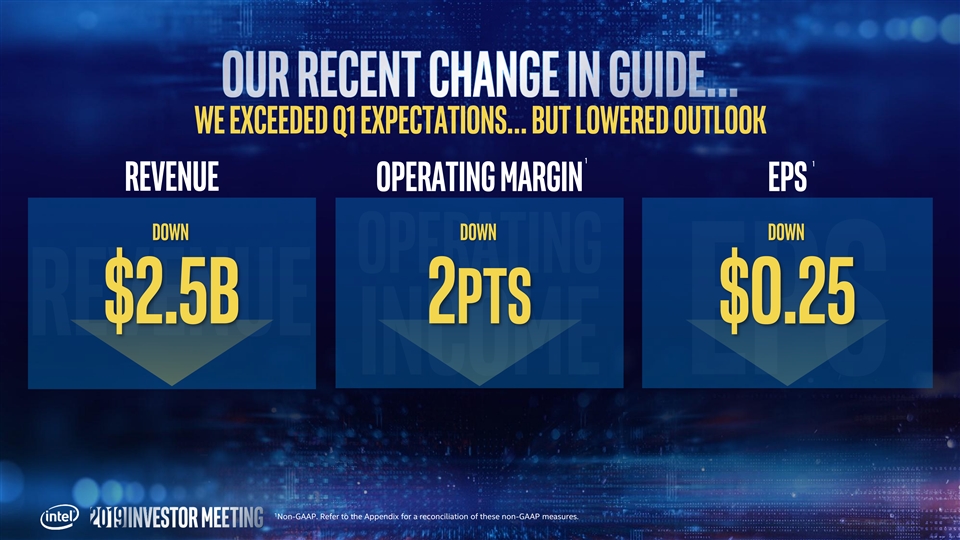
We exceeded Q1 expectations… but lowered outlook 1 1 Revenue Operating Margin EPS Down Down Down $2.5B 2pts $0.25 1 Non-GAAP. Refer to the Appendix for a reconciliation of these non-GAAP measures.We exceeded Q1 expectations… but lowered outlook 1 1 Revenue Operating Margin EPS Down Down Down $2.5B 2pts $0.25 1 Non-GAAP. Refer to the Appendix for a reconciliation of these non-GAAP measures.

Top Priorities for 2017 Growth in Data strong & healthy Client growth flawlessly execute in Center & Adjacencies business in IoT & devices Memory & FPGAS 29Top Priorities for 2017 Growth in Data strong & healthy Client growth flawlessly execute in Center & Adjacencies business in IoT & devices Memory & FPGAS 29
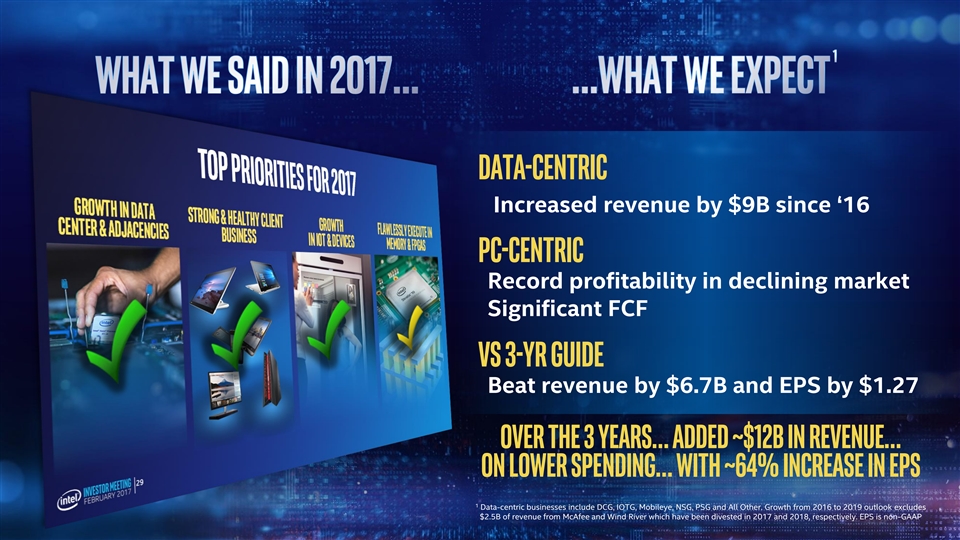
Data-centric Increased revenue by $9B since ‘16 PC-Centric Record profitability in declining market Significant FCF Vs 3-yr guide Beat revenue by $6.7B and EPS by $1.27 Over the 3 years… added ~$12B in revenue… on lower spending… with ~64% increase in EPS 1 Data-centric businesses include DCG, IOTG, Mobileye, NSG, PSG and All Other. Growth from 2016 to 2019 outlook excludes $2.5B of revenue from McAfee and Wind River which have been divested in 2017 and 2018, respectively. EPS is non-GAAPData-centric Increased revenue by $9B since ‘16 PC-Centric Record profitability in declining market Significant FCF Vs 3-yr guide Beat revenue by $6.7B and EPS by $1.27 Over the 3 years… added ~$12B in revenue… on lower spending… with ~64% increase in EPS 1 Data-centric businesses include DCG, IOTG, Mobileye, NSG, PSG and All Other. Growth from 2016 to 2019 outlook excludes $2.5B of revenue from McAfee and Wind River which have been divested in 2017 and 2018, respectively. EPS is non-GAAP
transformations …but it won’t be easytransformations …but it won’t be easy

Make the world’s best semiconductors Lead the AI, 5g, and Autonomous revolution Be the leading end to end platform provider for the new data world Relentless focus on operational excellence & efficiency Continue to hire, develop and retain the best, most diverse & inclusive talentMake the world’s best semiconductors Lead the AI, 5g, and Autonomous revolution Be the leading end to end platform provider for the new data world Relentless focus on operational excellence & efficiency Continue to hire, develop and retain the best, most diverse & inclusive talent

2021 & beyond Middle of a Journey Intel Powers the World 2017-2021 Data-Centric 2013 A PC-Centric Company2021 & beyond Middle of a Journey Intel Powers the World 2017-2021 Data-Centric 2013 A PC-Centric Company

Data-Centric Businesses PC-centric Business Growth Cash Flow/ ScaleData-Centric Businesses PC-centric Business Growth Cash Flow/ Scale
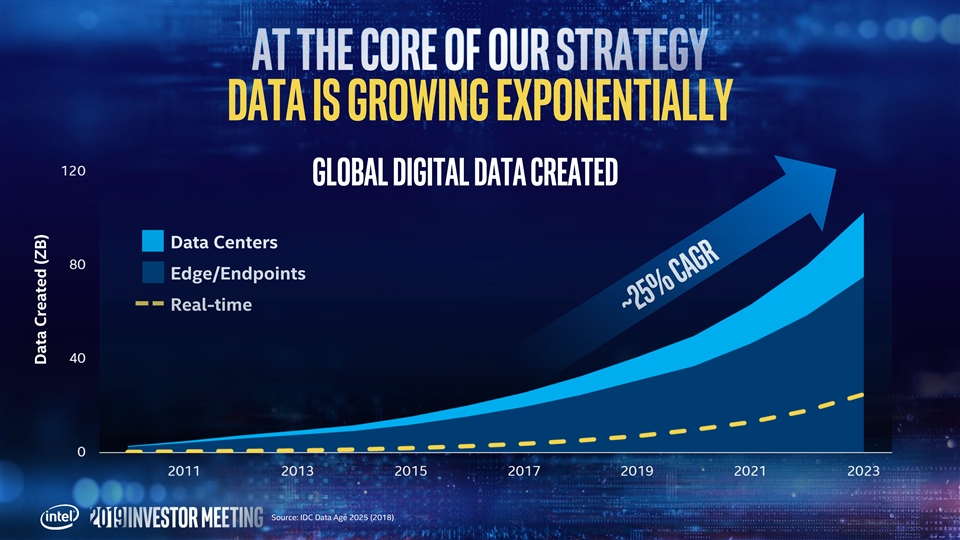
Data is growing exponentially Global Digital Data Created Data Centers Edge/Endpoints Real-time Source: IDC Data Age 2025 (2018) Data Created (ZB)Data is growing exponentially Global Digital Data Created Data Centers Edge/Endpoints Real-time Source: IDC Data Age 2025 (2018) Data Created (ZB)
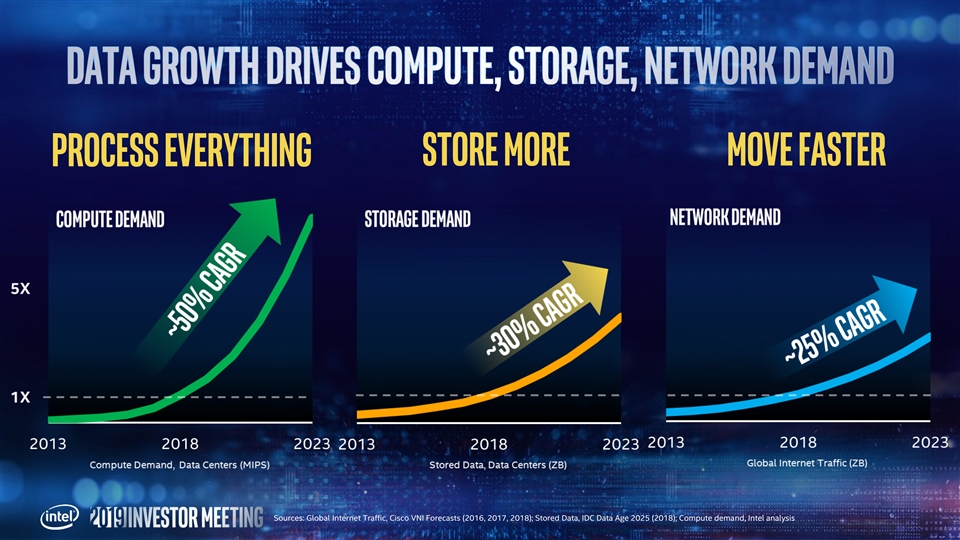
process everything store more Move faster Sources: Global Internet Traffic, Cisco VNI Forecasts (2016, 2017, 2018); Stored Data, IDC Data Age 2025 (2018); Compute demand, Intel analysisprocess everything store more Move faster Sources: Global Internet Traffic, Cisco VNI Forecasts (2016, 2017, 2018); Stored Data, IDC Data Age 2025 (2018); Compute demand, Intel analysis

Source: 2018 Intel Revenue is based on Intel financials. 2018 Si TAM is based on amalgamation of analyst data and Intel analysis. PC and Server include CPU and Chipsets revenue. Source: 2018 Intel Revenue is based on Intel financials. 2018 Si TAM is based on amalgamation of analyst data and Intel analysis. PC and Server include CPU and Chipsets revenue.
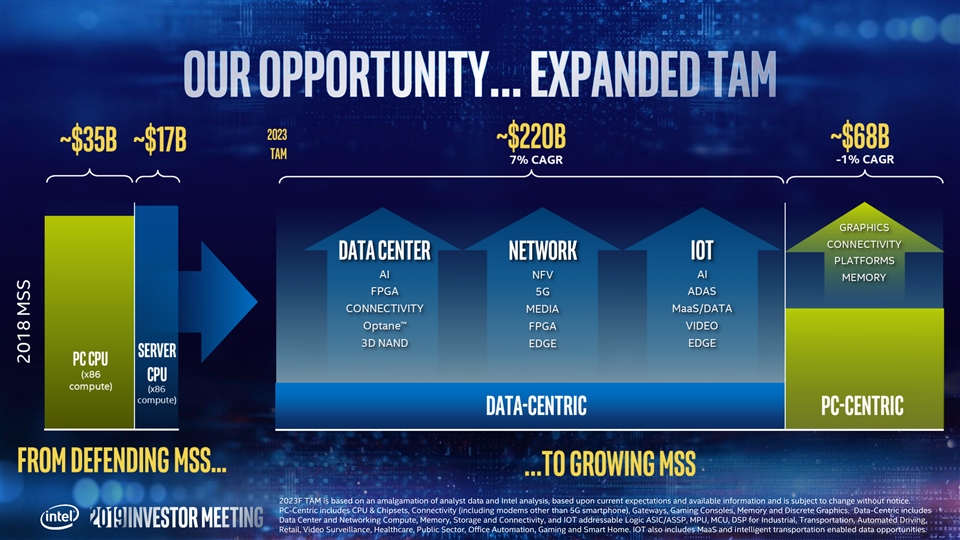
2023F TAM is based on an amalgamation of analyst data and Intel analysis, based upon current expectations and available information and is subject to change without notice. PC-Centric includes CPU & Chipsets, Connectivity (including modems other than 5G smartphone), Gateways, Gaming Consoles, Memory and Discrete Graphics. Data-Centric includes Data Center and Networking Compute, Memory, Storage and Connectivity, and IOT addressable Logic ASIC/ASSP, MPU, MCU, DSP for Industrial, Transportation, Automated Driving, Retail, Video Surveillance, Healthcare, Public Sector, Office Automation, Gaming and Smart Home. IOT also includes MaaS and intelligent transportation enabled data opportunities. 2023F TAM is based on an amalgamation of analyst data and Intel analysis, based upon current expectations and available information and is subject to change without notice. PC-Centric includes CPU & Chipsets, Connectivity (including modems other than 5G smartphone), Gateways, Gaming Consoles, Memory and Discrete Graphics. Data-Centric includes Data Center and Networking Compute, Memory, Storage and Connectivity, and IOT addressable Logic ASIC/ASSP, MPU, MCU, DSP for Industrial, Transportation, Automated Driving, Retail, Video Surveillance, Healthcare, Public Sector, Office Automation, Gaming and Smart Home. IOT also includes MaaS and intelligent transportation enabled data opportunities.

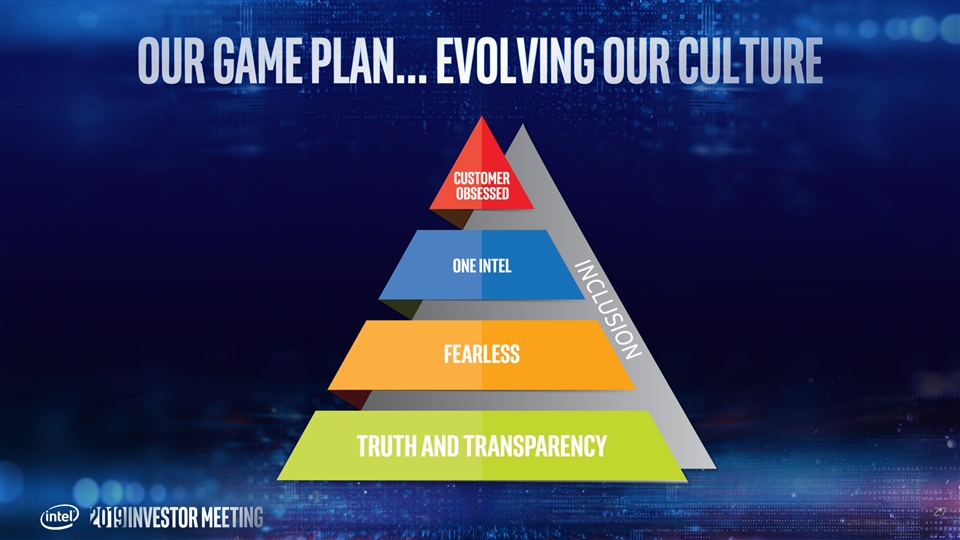
• Lead technology inflections • Extend product leadership… redefine Intel Inside • Make big bets… with attractive returns • Focus on execution • Evolve our culture • Lead CSR and D&I• Lead technology inflections • Extend product leadership… redefine Intel Inside • Make big bets… with attractive returns • Focus on execution • Evolve our culture • Lead CSR and D&I
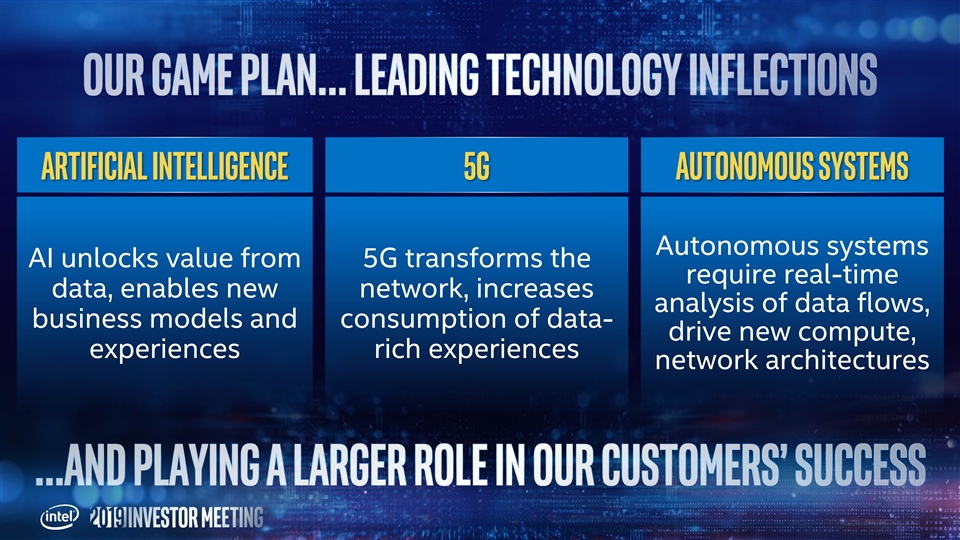
Artificial intelligence 5G Autonomous systems Autonomous systems AI unlocks value from 5G transforms the require real-time data, enables new network, increases analysis of data flows, business models and consumption of data- drive new compute, experiences rich experiences network architecturesArtificial intelligence 5G Autonomous systems Autonomous systems AI unlocks value from 5G transforms the require real-time data, enables new network, increases analysis of data flows, business models and consumption of data- drive new compute, experiences rich experiences network architectures
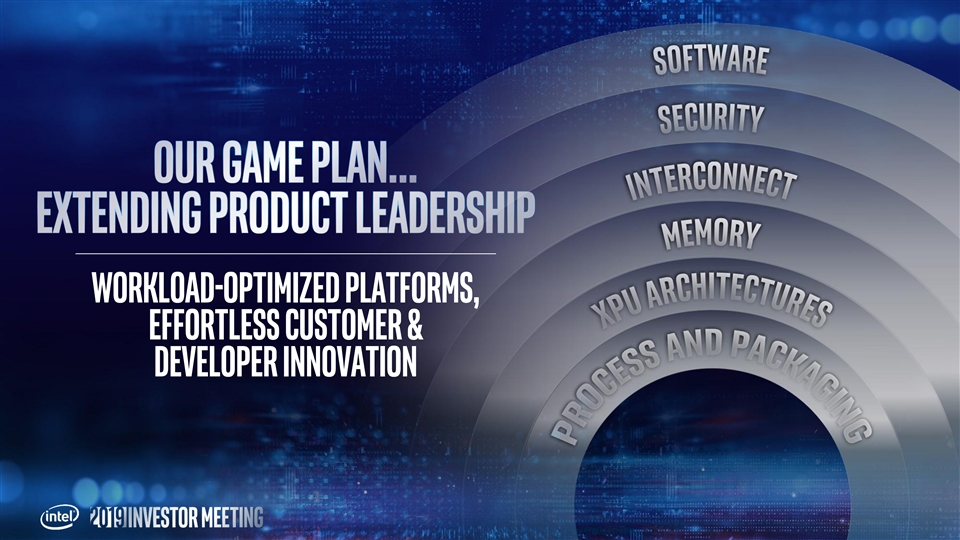
WORKLOAD-OPTIMIZED PLATFORMS, EFFORTLESS CUSTOMER & DEVELOPER INNOVATIONWORKLOAD-OPTIMIZED PLATFORMS, EFFORTLESS CUSTOMER & DEVELOPER INNOVATION
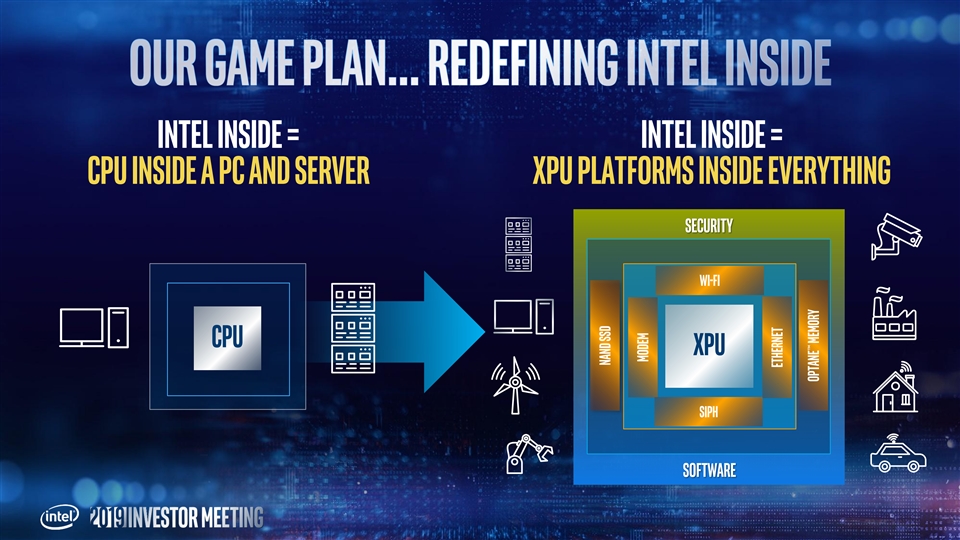
Intel Inside = Intel Inside = CPU inside a PC and server XPU platforms inside everything Security Wi-Fi CPU XPU siph Software Nand SSD Modem ethernet Optane™ MemoryIntel Inside = Intel Inside = CPU inside a PC and server XPU platforms inside everything Security Wi-Fi CPU XPU siph Software Nand SSD Modem ethernet Optane™ Memory
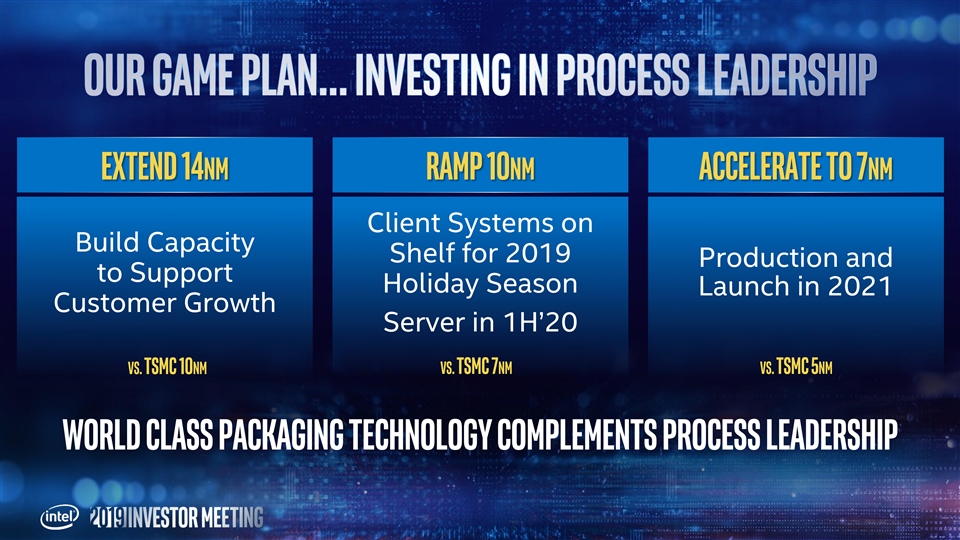
extend 14nm ramp 10nm Accelerate to 7nm Client Systems on Build Capacity Shelf for 2019 Production and to Support Holiday Season Launch in 2021 Customer Growth Server in 1H’20 vs. tsmc 10nm vs. tsmc 7nm vs. tsmc 5nm world class packaging technology complements process leadershipextend 14nm ramp 10nm Accelerate to 7nm Client Systems on Build Capacity Shelf for 2019 Production and to Support Holiday Season Launch in 2021 Customer Growth Server in 1H’20 vs. tsmc 10nm vs. tsmc 7nm vs. tsmc 5nm world class packaging technology complements process leadership
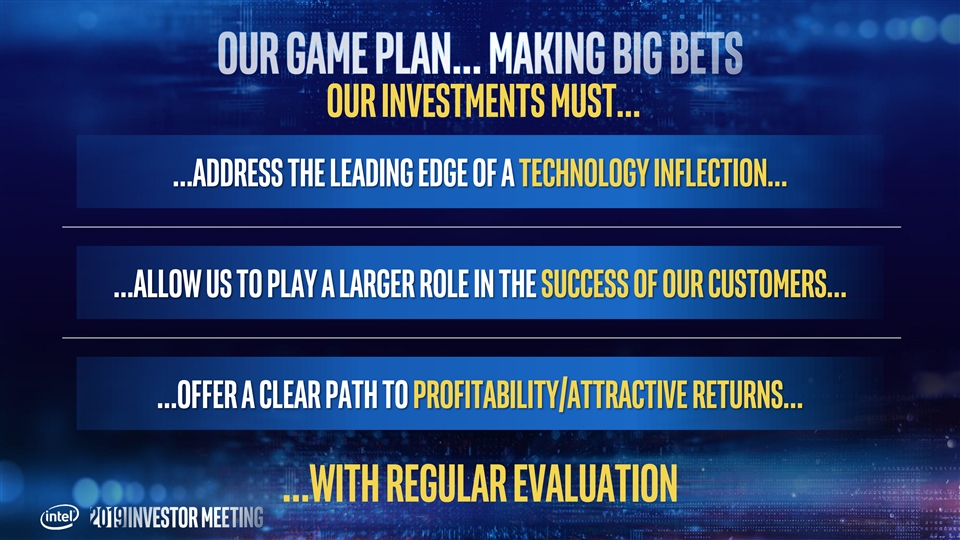
our investments must… …Address the leading edge of a technology inflection… …Allow us to play a larger role in the success of our customers… …Offer a clear path to profitability/attractive returns… …with regular evaluationour investments must… …Address the leading edge of a technology inflection… …Allow us to play a larger role in the success of our customers… …Offer a clear path to profitability/attractive returns… …with regular evaluation
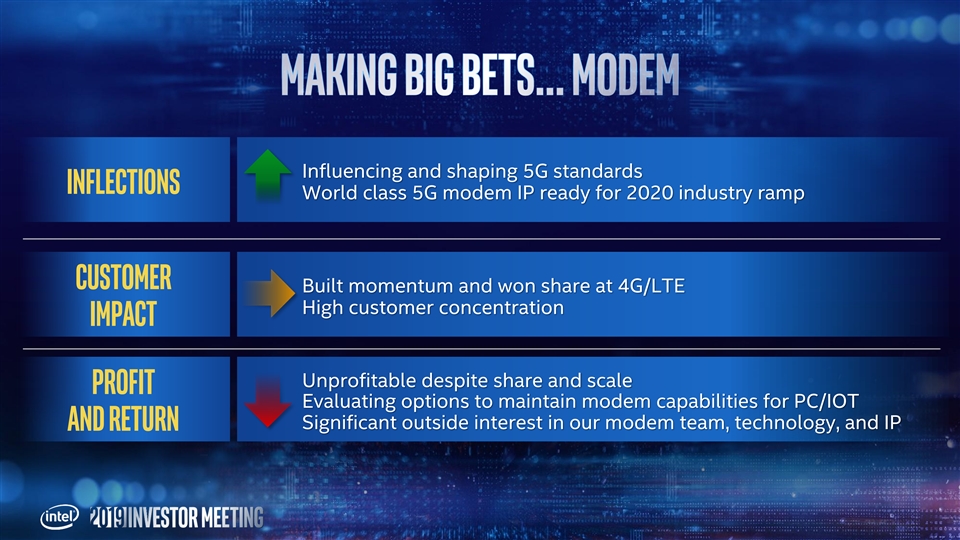
Influencing and shaping 5G standards Inflections World class 5G modem IP ready for 2020 industry ramp Customer Built momentum and won share at 4G/LTE High customer concentration Impact Unprofitable despite share and scale Profit Evaluating options to maintain modem capabilities for PC/IOT Significant outside interest in our modem team, technology, and IP and ReturnInfluencing and shaping 5G standards Inflections World class 5G modem IP ready for 2020 industry ramp Customer Built momentum and won share at 4G/LTE High customer concentration Impact Unprofitable despite share and scale Profit Evaluating options to maintain modem capabilities for PC/IOT Significant outside interest in our modem team, technology, and IP and Return
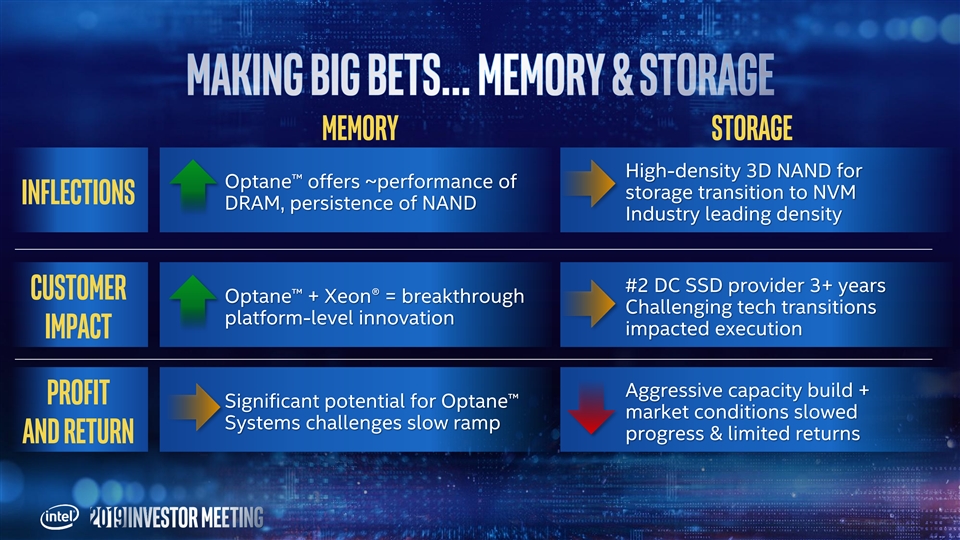
Memory storage High-density 3D NAND for Optane™ offers ~performance of storage transition to NVM Inflections DRAM, persistence of NAND Industry leading density #2 DC SSD provider 3+ years Customer Optane™ + Xeon® = breakthrough Challenging tech transitions platform-level innovation impacted execution Impact Aggressive capacity build + Profit Significant potential for Optane™ market conditions slowed Systems challenges slow ramp progress & limited returns and ReturnMemory storage High-density 3D NAND for Optane™ offers ~performance of storage transition to NVM Inflections DRAM, persistence of NAND Industry leading density #2 DC SSD provider 3+ years Customer Optane™ + Xeon® = breakthrough Challenging tech transitions platform-level innovation impacted execution Impact Aggressive capacity build + Profit Significant potential for Optane™ market conditions slowed Systems challenges slow ramp progress & limited returns and Return
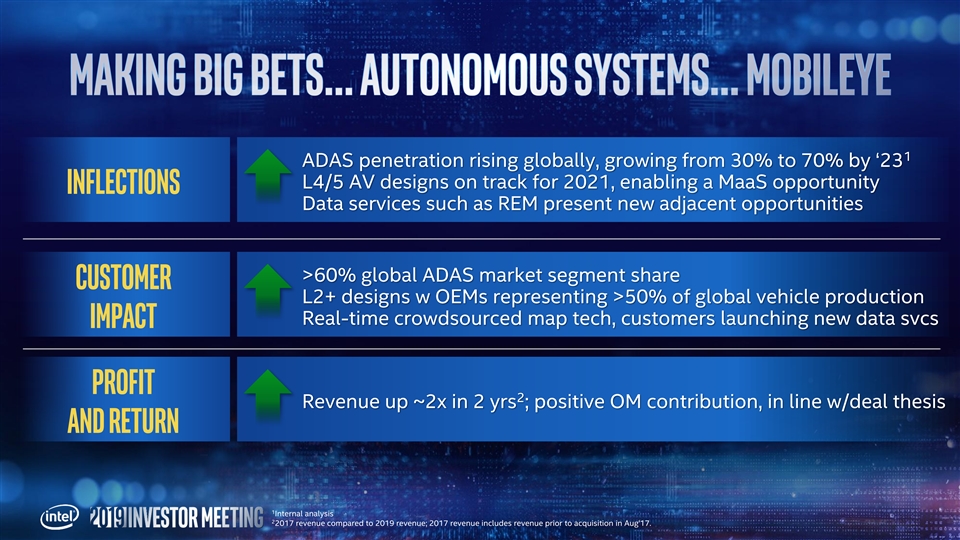
1 ADAS penetration rising globally, growing from 30% to 70% by ‘23 L4/5 AV designs on track for 2021, enabling a MaaS opportunity Inflections Data services such as REM present new adjacent opportunities >60% global ADAS market segment share Customer L2+ designs w OEMs representing >50% of global vehicle production Real-time crowdsourced map tech, customers launching new data svcs Impact Profit 2 Revenue up ~2x in 2 yrs ; positive OM contribution, in line w/deal thesis and Return 1 Internal analysis 2 2017 revenue compared to 2019 revenue; 2017 revenue includes revenue prior to acquisition in Aug'17.1 ADAS penetration rising globally, growing from 30% to 70% by ‘23 L4/5 AV designs on track for 2021, enabling a MaaS opportunity Inflections Data services such as REM present new adjacent opportunities >60% global ADAS market segment share Customer L2+ designs w OEMs representing >50% of global vehicle production Real-time crowdsourced map tech, customers launching new data svcs Impact Profit 2 Revenue up ~2x in 2 yrs ; positive OM contribution, in line w/deal thesis and Return 1 Internal analysis 2 2017 revenue compared to 2019 revenue; 2017 revenue includes revenue prior to acquisition in Aug'17.

Recoup Process Leadership deliver with predictability Meet Customer Demand Leadership products 10nm products Ensure Supply on schedule on shelves Investing to ensure we don’t On track to full-year 10nm Ice Lake and Lakefield for client constrain growth shipment goals Cascade Lake, AgileX™, Teton Glacier for data-centricRecoup Process Leadership deliver with predictability Meet Customer Demand Leadership products 10nm products Ensure Supply on schedule on shelves Investing to ensure we don’t On track to full-year 10nm Ice Lake and Lakefield for client constrain growth shipment goals Cascade Lake, AgileX™, Teton Glacier for data-centric
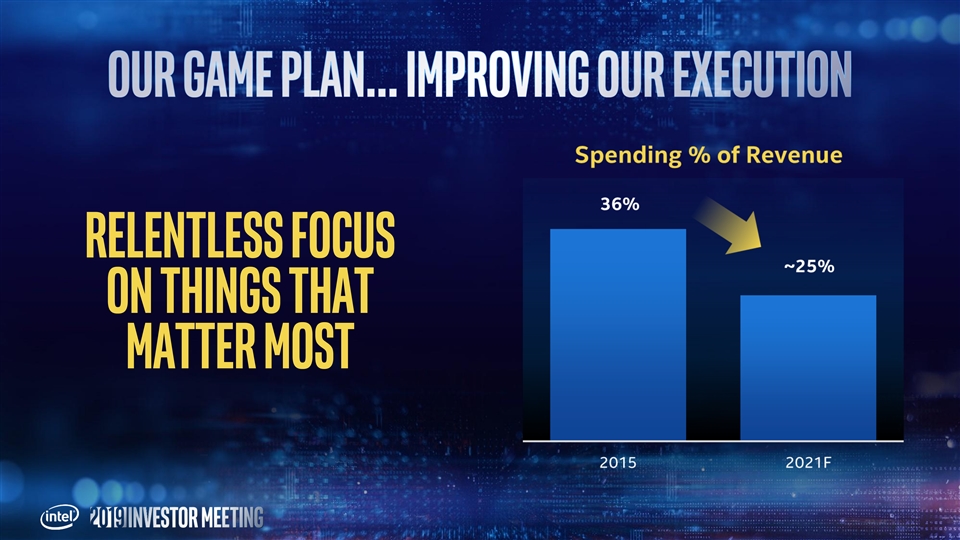
Relentless focus on things that matter mostRelentless focus on things that matter most

From To Build the best products… customers will come Listen to customers & enable their growth Nearly $300B TAM… Low MSS... growth mode $52B TAM… MSS >90%… protect & defend Very capable competition has high MSS Competition has <10% MSS… compete internally Product leadership trumps all IDM advantage/process lead trumps all AN INCREDIBLE 50 YEARS AN INCREDIBLE OPPORTUNITYFrom To Build the best products… customers will come Listen to customers & enable their growth Nearly $300B TAM… Low MSS... growth mode $52B TAM… MSS >90%… protect & defend Very capable competition has high MSS Competition has <10% MSS… compete internally Product leadership trumps all IDM advantage/process lead trumps all AN INCREDIBLE 50 YEARS AN INCREDIBLE OPPORTUNITY
2727

We are a recognized leader in corporate responsibility and take action to advance progress in environmental sustainability, supply chain responsibility, and social impact. #1 Scores 4B KWH ENERGY SAVED >20 years For our environmental & since 2012, resulting in Of TRANSPARENCY & PROACTIVE social disclosure quality by >$500M in cost SAVINGS ENGAGEMENT WITH INVESTORS ON ESG ISS Ethix ISSUES +500 SUPPLIER AUDITS 90% recycle RATE 17.4M square feet Completed since 2014 as part of for NON-HAZARDOUS WASTE in OF LEED CERTIFIED SPACE in our supply chain responsibility our global operations support of our green programs buildings goal www.intel.com/responsibility We are a recognized leader in corporate responsibility and take action to advance progress in environmental sustainability, supply chain responsibility, and social impact. #1 Scores 4B KWH ENERGY SAVED >20 years For our environmental & since 2012, resulting in Of TRANSPARENCY & PROACTIVE social disclosure quality by >$500M in cost SAVINGS ENGAGEMENT WITH INVESTORS ON ESG ISS Ethix ISSUES +500 SUPPLIER AUDITS 90% recycle RATE 17.4M square feet Completed since 2014 as part of for NON-HAZARDOUS WASTE in OF LEED CERTIFIED SPACE in our supply chain responsibility our global operations support of our green programs buildings goal www.intel.com/responsibility
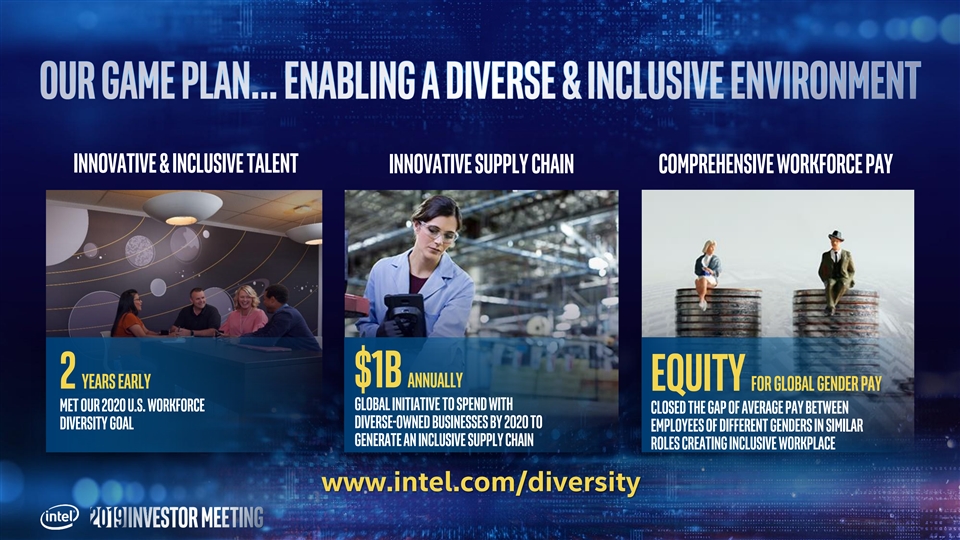
INNOVATIVE & INCLUSIVE TALENT Innovative supply chain Comprehensive workforce pay $1B annually 2 years Early Equity for global gender pay global initiative to spend with met our 2020 U.S. worKforce CLOSED THE GAP OF Average PAY BETWEEN Diverse-owned businesses by 2020 to diversity goal EMPLOYEES OF DIFFERENT GENDERS IN SIMILAR generate an Inclusive supply chain ROLES creating inclusive workplace www.intel.com/diversityINNOVATIVE & INCLUSIVE TALENT Innovative supply chain Comprehensive workforce pay $1B annually 2 years Early Equity for global gender pay global initiative to spend with met our 2020 U.S. worKforce CLOSED THE GAP OF Average PAY BETWEEN Diverse-owned businesses by 2020 to diversity goal EMPLOYEES OF DIFFERENT GENDERS IN SIMILAR generate an Inclusive supply chain ROLES creating inclusive workplace www.intel.com/diversity
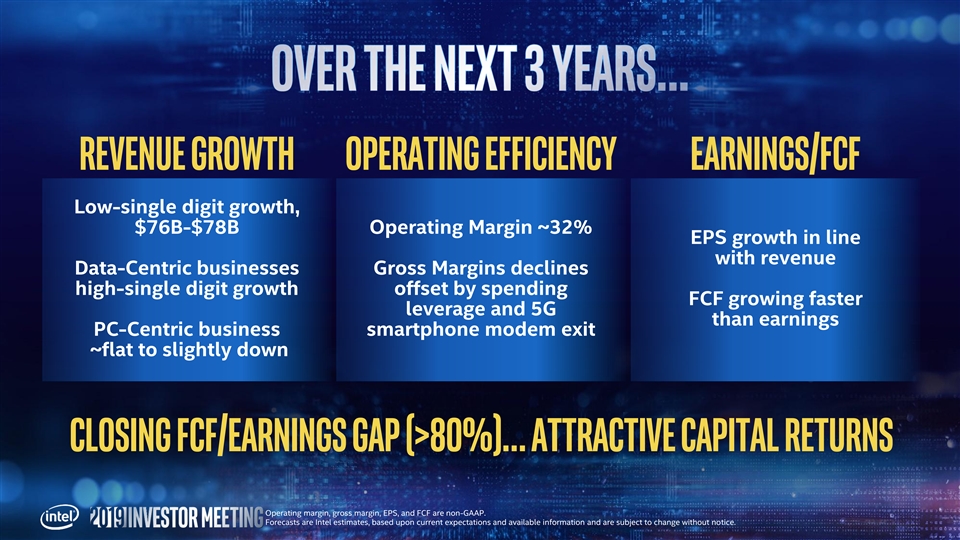
Revenue growth Operating efficiency Earnings/FCF Low-single digit growth, $76B-$78B Operating Margin ~32% EPS growth in line with revenue Data-Centric businesses Gross Margins declines high-single digit growth offset by spending FCF growing faster leverage and 5G than earnings PC-Centric business smartphone modem exit ~flat to slightly down Closing FCF/Earnings gap (>80%)… ATTRACTIVE capital RETURNS Operating margin, gross margin, EPS, and FCF are non-GAAP. Forecasts are Intel estimates, based upon current expectations and available information and are subject to change without notice.Revenue growth Operating efficiency Earnings/FCF Low-single digit growth, $76B-$78B Operating Margin ~32% EPS growth in line with revenue Data-Centric businesses Gross Margins declines high-single digit growth offset by spending FCF growing faster leverage and 5G than earnings PC-Centric business smartphone modem exit ~flat to slightly down Closing FCF/Earnings gap (>80%)… ATTRACTIVE capital RETURNS Operating margin, gross margin, EPS, and FCF are non-GAAP. Forecasts are Intel estimates, based upon current expectations and available information and are subject to change without notice.

EPS presented on a non-GAAP basis. Refer to the Appendix for a reconciliation of this non-GAAP measure Forecasts are Intel estimates, based upon current expectations and available information and are subject to change without noticeEPS presented on a non-GAAP basis. Refer to the Appendix for a reconciliation of this non-GAAP measure Forecasts are Intel estimates, based upon current expectations and available information and are subject to change without notice
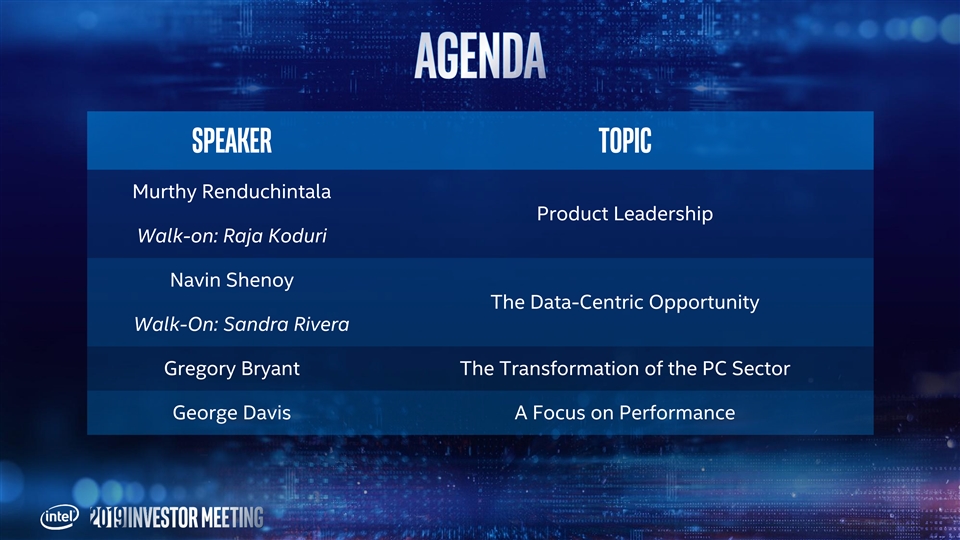
Speaker Topic Murthy Renduchintala Product Leadership Walk-on: Raja Koduri Navin Shenoy The Data-Centric Opportunity Walk-On: Sandra Rivera Gregory Bryant The Transformation of the PC Sector George Davis A Focus on PerformanceSpeaker Topic Murthy Renduchintala Product Leadership Walk-on: Raja Koduri Navin Shenoy The Data-Centric Opportunity Walk-On: Sandra Rivera Gregory Bryant The Transformation of the PC Sector George Davis A Focus on Performance
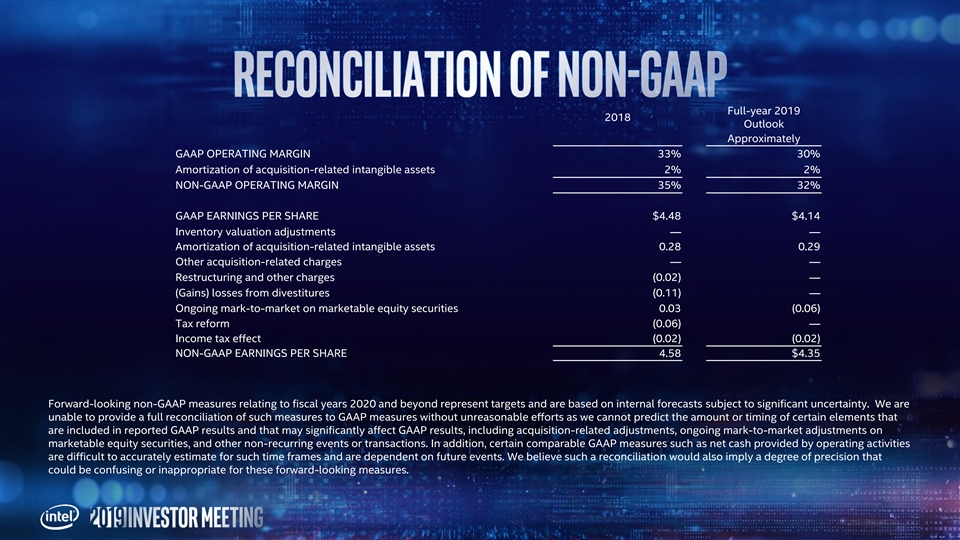
Full-year 2019 2018 Outlook Approximately GAAP OPERATING MARGIN 33% 30% Amortization of acquisition-related intangible assets 2% 2% NON-GAAP OPERATING MARGIN 35% 32% GAAP EARNINGS PER SHARE $4.48 $4.14 Inventory valuation adjustments — — Amortization of acquisition-related intangible assets 0.28 0.29 Other acquisition-related charges — — Restructuring and other charges (0.02) — (Gains) losses from divestitures (0.11) — Ongoing mark-to-market on marketable equity securities 0.03 (0.06) Tax reform (0.06) — Income tax effect (0.02) (0.02) NON-GAAP EARNINGS PER SHARE 4.58 $4.35 Forward-looking non-GAAP measures relating to fiscal years 2020 and beyond represent targets and are based on internal forecasts subject to significant uncertainty. We are unable to provide a full reconciliation of such measures to GAAP measures without unreasonable efforts as we cannot predict the amount or timing of certain elements that are included in reported GAAP results and that may significantly affect GAAP results, including acquisition-related adjustments, ongoing mark-to-market adjustments on marketable equity securities, and other non-recurring events or transactions. In addition, certain comparable GAAP measures such as net cash provided by operating activities are difficult to accurately estimate for such time frames and are dependent on future events. We believe such a reconciliation would also imply a degree of precision that could be confusing or inappropriate for these forward-looking measures. Full-year 2019 2018 Outlook Approximately GAAP OPERATING MARGIN 33% 30% Amortization of acquisition-related intangible assets 2% 2% NON-GAAP OPERATING MARGIN 35% 32% GAAP EARNINGS PER SHARE $4.48 $4.14 Inventory valuation adjustments — — Amortization of acquisition-related intangible assets 0.28 0.29 Other acquisition-related charges — — Restructuring and other charges (0.02) — (Gains) losses from divestitures (0.11) — Ongoing mark-to-market on marketable equity securities 0.03 (0.06) Tax reform (0.06) — Income tax effect (0.02) (0.02) NON-GAAP EARNINGS PER SHARE 4.58 $4.35 Forward-looking non-GAAP measures relating to fiscal years 2020 and beyond represent targets and are based on internal forecasts subject to significant uncertainty. We are unable to provide a full reconciliation of such measures to GAAP measures without unreasonable efforts as we cannot predict the amount or timing of certain elements that are included in reported GAAP results and that may significantly affect GAAP results, including acquisition-related adjustments, ongoing mark-to-market adjustments on marketable equity securities, and other non-recurring events or transactions. In addition, certain comparable GAAP measures such as net cash provided by operating activities are difficult to accurately estimate for such time frames and are dependent on future events. We believe such a reconciliation would also imply a degree of precision that could be confusing or inappropriate for these forward-looking measures.