QuickLinks -- Click here to rapidly navigate through this document
Financial Report
| Report of Management | | 42 |
| Report of Independent Accountants | | 42 |
| Management Discussion | | 43 |
| Consolidated Financial Statements | | |
| | Earnings | | 64 |
| | Financial Position | | 65 |
| | Stockholders' Equity | | 66 |
| | Cash Flows | | 69 |
| Notes to Consolidated Financial Statements | | |
| | A | | Significant Accounting Policies | | 70 |
| | B | | Accounting Changes | | 75 |
| | C | | Acquisitions/Divestitures | | 78 |
| | D | | Financial Instruments (excluding derivatives) | | 80 |
| | E | | Inventories | | 81 |
| | F | | Financing Receivables | | 81 |
| | G | | Plant, Rental Machines and Other Property | | 81 |
| | H | | Investments and Sundry Assets | | 81 |
| | I | | Goodwill | | 82 |
| | J | | Sale and Securitization of Receivables | | 82 |
| | K | | Borrowings | | 82 |
| | L | | Derivatives and Hedging Transactions | | 84 |
| | M | | Other Liabilities | | 86 |
| | N | | Stockholders' Equity Activity | | 87 |
| | O | | Contingencies and Commitments | | 88 |
| | P | | Taxes | | 89 |
| | Q | | Advertising and Promotional Expense | | 90 |
| | R | | Research, Development and Engineering | | 90 |
| | S | | 2002 Actions | | 90 |
| | T | | Earnings Per Share of Common Stock | | 93 |
| | U | | Rental Expense and Lease Commitments | | 93 |
| | V | | Stock-Based Compensation Plans | | 94 |
| | W | | Retirement-Related Benefits | | 95 |
| | X | | Segment Information | | 100 |
| | Y | | Subsequent Events | | 104 |
| Five-Year Comparison of Selected Financial Data | | 105 |
| Selected Quarterly Data | | 106 |
| Stockholder Information | | 107 |
| Board of Directors and Senior Executive Officers | | 108 |
41
Report of Management
Responsibility for the integrity and objectivity of the financial information presented in this Annual Report rests with IBM management. The accompanying financial statements have been prepared in conformity with generally accepted accounting principles, applying certain estimates and judgments as required.
IBM maintains an effective internal control structure. It consists, in part, of organizational arrangements with clearly defined lines of responsibility and delegation of authority, and comprehensive systems and control procedures. We believe this structure provides reasonable assurance that transactions are executed in accordance with management authorization, and that they are appropriately recorded in order to permit preparation of financial statements in conformity with generally accepted accounting principles and to adequately safeguard, verify and maintain accountability of assets. An important element of the control environment is an ongoing internal audit program.
To assure the effective administration of internal controls, we carefully select and train our employees, develop and disseminate written policies and procedures, provide appropriate communication channels, and foster an environment conducive to the effective functioning of controls. We believe that it is essential for the company to conduct its business affairs in accordance with the highest ethical standards, as set forth in the IBM Business Conduct Guidelines. These guidelines, translated into numerous languages, are distributed to employees throughout the world, and reemphasized through internal programs to assure that they are understood and followed.
PricewaterhouseCoopers LLP, independent accountants, is retained to examine IBM's financial statements. Its accompanying report is based on an examination conducted in accordance with generally accepted auditing standards, including a review of the internal control structure and tests of accounting procedures and records.
The Audit Committee of the Board of Directors is composed solely of outside directors, and is responsible for recommending to the Board the independent accounting firm to be retained for the coming year, subject to stockholder approval. The Audit Committee meets periodically and privately with the independent accountants, with the company's internal auditors, as well as with IBM management, to review accounting, auditing, internal control structure and financial reporting matters.

SAMUEL J. PALMISANO
Chairman of the Board,
President and Chief Executive Officer | | 
JOHN R. JOYCE
Senior Vice President
Chief Financial Officer |
Report of Independent Accountants
To the Stockholders and Board of Directors of International Business Machines Corporation:
In our opinion, based on our audits and the report of other auditors, the accompanying consolidated financial statements appearing on pages 64 through 104 present fairly, in all material respects, the financial position of International Business Machines Corporation and subsidiary companies at December 31, 2002 and 2001, and the results of their operations and their cash flows for each of the three years in the period ended December 31, 2002, in conformity with accounting principles generally accepted in the United States of America. These financial statements are the responsibility of the company's management; our responsibility is to express an opinion on these financial statements based on our audits. We did not audit the financial statements of the company's Business Consulting Services Reporting Unit (which includes the consulting practice acquired from us as discussed in note C) for the three months ended December 31, 2002, which statements reflect total revenues of 4.3 percent of the related consolidated total in the period ended December 31, 2002. Those statements were audited by other auditors whose report thereon has been furnished to us, and our opinion expressed herein, insofar as it relates to the amounts included for the company's Business Consulting Services Reporting Unit is based solely on the report of the other auditors. We conducted our audits of these statements in accordance with auditing standards generally accepted in the United States of America, which require that we plan and perform the audit to obtain reasonable assurance about whether the financial statements are free of material misstatement. An audit includes examining, on a test basis, evidence supporting the amounts and disclosures in the financial statements, assessing the accounting principles used and significant estimates made by management, and evaluating the overall financial statement presentation. We believe that our audits and the report of other auditors provide a reasonable basis for our opinion.

PRICEWATERHOUSECOOPERS LLP
New York, New York
January 16, 2003,
except for note Y, as to which the date is February 21, 2003
| | |
42
Management Discussion
Road Map
The financial section of the International Business Machines Corporation (IBM) 2002 Annual Report consisting of this Management Discussion, the Consolidated Financial Statements that follow and the related notes thereto comprises 64 pages of information. This Road Map is designed to provide you with some perspective regarding the information contained in the financial section and a few helpful hints for reading these 64 pages.
IBM's Business Model
IBM's business model is built to support two principal components: helping customers become more efficient and competitive through the use of information technology (IT) solutions; and providing long-term value to shareholders. In support of these objectives, the business model has been developed over time through strategic investments in services and technologies that have the best long-term growth and profitability prospects based on the value they deliver to customers.
The model is designed to allow for flexibility and periodic rebalancing, as demonstrated in 2002 with the acquisition of PricewaterhouseCoopers Consulting (PwCC), the agreement to acquire Rational Software Corp. (Rational), and the divestiture of the company's hard disk drive (HDD) business.
The company's portfolio of capabilities ranges from services that include business transformation consulting to software, hardware, fundamental research, financing and the component technologies used to build larger systems.
In terms of financial performance, this breadth of capabilities generally results in less volatile returns, because each capability has unique financial attributes. Some involve contractual long-term cash and income streams while others involve cyclical transactional-based sales. Each performs differently in strong and weak economic environments.
In terms of marketplace performance—i.e., the ability to deliver customer value—it is important to understand that the fundamental strength of this business model is not found in the breadth of the portfolio alone, but in the way the company's components work in harmony to create business solutions.
Transparency
Transparency is a primary goal of successful financial reporting. The following are additional improvements you will find in this year's Annual Report.
- •
- In the 2001 Annual Report, the company introduced a Road Map section that included a list of certain recurring and nonrecurring items. These items may contribute to or reduce earnings, sometimes in unpredictable or uncontrollable ways. This "Road Map table of expense items" was also used in the company's 2002 quarterly earnings presentations.
For 2002, the following are examples of such items:
| | Page
|
|---|
| Higher provision for bad debts | | 51 |
| Lower goodwill expense | | 51 |
| Lower intellectual property and custom development income | | 52 |
| Lower foreign currency transaction gains | | 52 |
| Lower net realized gains from certain real estate activities | | 52 |
| Lower writedowns on certain equity investments | | 52 |
| Lower net gains on sales of securities and other investments | | 52 |
| Lower retirement-related plans income | | 52 and 53 |
It is management's responsibility to deal with these events over time within the context of the company's business model. It is, however, just as or more important to maintain a longer-term perspective and to consider income from continuing operations in the context of revenue and cash flow. A fundamentally sound and strong company should have strength in all three of these measures.
- •
- The Results of Continuing Operations section of the Management Discussion from pages 44 to 53 is expanded to include a brief overview of the company's and each segment's business model and key success drivers. The goal is to enable the reader to understand the historical results as well as a new forward-looking section in the context of the business drivers.
- •
- The Management Discussion contains a new separate section dedicated to the company's Global Financing business on pages 60 through 63. This section includes a Global Financing balance sheet.
- •
- In order to help readers of the Annual Report place IBM's services accounting policies in the proper context, the description of IBM's services revenue recognition accounting policies has been explained in additional detail on page 70.
Helpful Hints
ORGANIZATION OF INFORMATION
- •
- This Management Discussion section provides the reader of the financial statements with a narrative on the company's financial results. It contains the results of operations for each segment of the business and is followed by a description of the company's financial position as well as certain employee data. The new section dedicated to the company's Global Financing business follows the employee data. It is useful to read the Management Discussion in conjunction with note X, "Segment Information," on pages 100 to 104.
43
- •
- Pages 64 through 69 include the Consolidated Financial Statements. These statements include an overview of the company's income and cash flow performance and its financial position.
- •
- The notes follow the Consolidated Financial Statements. Among other things, the notes contain the company's accounting policies (pages 70 to 75), detailed information on specific items within the financial statements, certain contingencies and commitments (pages 88 and 89), and the results of each IBM segment (pages 100 to 104).
DISCONTINUED OPERATIONS
On December 31, 2002, the company sold its HDD business to Hitachi, Ltd. (Hitachi). The HDD business is being accounted for as a discontinued operation under generally accepted accounting principles (GAAP). This means that income statement and cash flow information were reformatted for all years presented to separate the divested business from the company's continuing operations. This presentation is required by GAAP and facilitates historical and future trend analysis of IBM's continuing operations. On page 80 the company discusses this transaction and the accounting for the divestiture.
Forward-Looking and Cautionary Statements
Certain statements contained in this Annual Report may constitute forward-looking statements within the meaning of the Private Securities Litigation Reform Act of 1995. These statements involve a number of risks, uncertainties and other factors that could cause actual results to be materially different, as discussed more fully elsewhere in this Annual Report and in the company's filings with the Securities and Exchange Commission, including the company's 2002 Form 10-K filed on
March 10, 2003.
Results of Continuing Operations
Description of Business
As mentioned in the "IBM's Business Model" section of the Road Map on page 43, IBM's strategy is to lead customers into a new era of business transformation and computing. The company calls this e-business on demand. An on demand business is an enterprise that has integrated its processes end-to-end inside the company and across its extended value chain. On demand businesses manage themselves as a far more integrated whole, meaning they are able to respond with flexibility and speed to customer demands, market opportunities or external threats. There are four key attributes of an on demand business:
- •
- Responsive: On demand businesses seem to have the ability to sense and respond to dynamic, unpredictable changes in demand, supply, pricing, labor, competitor's moves, capital markets and the needs of all its constituencies—customers, partners, suppliers and employees.
- •
- Variable: On demand businesses use variable cost structures and adapt processes flexibly. This flexibility will enable them to reduce risk and do business at high levels of productivity, cost control, capital efficiency and financial predictability. The company's utility computing offerings—which allow customers to pay for only the processing, storage, or applications that they use—are one way to build flexibility and variability into their cost structures.
- •
- Focused: On demand businesses concentrate on their core competencies and the things that set them apart in the marketplace. At the same time, they forge tightly integrated partnerships and allow third parties to manage selected tasks such as manufacturing, logistics and fulfillment, or HR and financial operations.
- •
- Resilient: On demand businesses manage changes and threats—from the ebb and flow of system usage to viruses or natural disasters—with consistent availability and security.
Key business drivers that will influence IBM's future results are: the continued adoption of open technology standards; technology innovations; IBM's internal business transformation and efficiency initiatives; and the external economic environment and corporate IT budgets.
- •
- Open Technology Standards—"Open standards" is not a complex high technology catch phrase. The way we use electricity is a good example of an open standard. The outlets in each house and business universally accept any electrical appliance. An example of closed standards would be if every television maker required people to buy a certain type of electricity, perhaps from the television maker itself. So if you wanted to switch television brands, you would also need to rewire your house's electricity. In many ways, this is how the technology industry is today. Many different software products do not run on certain hardware or are not compatible with other software. Certain hardware does not communicate with other hardware. Open standards will solve this situation.
The broad adoption of open standards is essential to the computing model for e-business on demand. Without the open standards that enable all manner of computing platforms to communicate and work with one another, the integration of any customer's internal systems, applications and processes remains a monumental and expensive task. The broad-based acceptance of open standards—rather than closed, proprietary architectures—also allows the computing infrastructure to more easily absorb new technical innovations. IBM is committed to fostering open standards because they benefit customers, because they are vital to the on demand computing model, and because their acceptance will expand growth opportunities across the entire IT industry.
44
- •
- Technology Innovations—IBM has been moving away from commoditized segments of the IT industry and into areas in which it can differentiate itself through innovation, and by leveraging its investments in research and development (R&D). Examples include IBM's leadership position in the design and fabrication of Application Specific Integrated Circuits; work on designing smaller, faster and lower-power-consuming semiconductor devices (using such innovations as copper technology, silicon on insulator, silicon germanium and low-K dielectric); work to design "autonomic"or self-managing computing systems and build the "grid" computing networks that allow computers to go beyond sharing communications and actually combine processing power; and the company's efforts to advance open technology standards such as Linux.
- •
- Internal Business Transformation and Efficiency Initiatives—A critical element of the company's strategy to improve shareholder value is improving productivity and efficiency. The company continues to execute on the following three ongoing initiatives.
- 1.
- Internal implementation of the same business transformation activities that the company provides for its customers. Over the past ten years, IBM's cost and expense infrastructure has been improved by numerous simplification and transformation efforts. The following are a few examples:
- •
- Internal IT Infrastructure—Internal MVS/VM host data centers reduced from 155 to 11.
- •
- Customers—More than 80 percent of sales to business partners are achieved through the Web.
- •
- Suppliers—Number of electronically connected suppliers now exceeds 31,000.
- •
- Employees—eLearning represents almost 50 percent of all employee training.
- 2.
- Outsourcing or process redesign of certain hardware manufacturing to lower-cost contract manufacturers in order to increase the variability of the company's manufacturing cost structure. An example is the company's 2002 outsourcing of desktop personal computer manufacturing to Sanmina-SCI.
- 3.
- Intense focus on improving employee and process productivity in order to drive a more efficient expense structure.
- •
- Economic Environment and Corporate IT Spending Budgets—Although the diverse nature of IBM's capabilities somewhat mitigates the economic volatility of IBM's results, the company's financial performance is impacted by overall marketplace spending. Although IT spending is an important driver of IBM's financial results, a key objective is to outperform key competitors and gain market share during strong and weak economic environments.
Historical Results
(dollars in millions except per share amounts)
FOR THE YEAR ENDED DECEMBER 31:
| | 2002
| | 2001
| | 2000
| |
|---|
| Revenue | | $ | 81,186 | | $ | 83,067 | | $ | 85,089 | |
| Cost | | | 50,902 | | | 51,178 | | | 53,511 | |
| | |
| |
| |
| |
| Gross profit | | | 30,284 | | | 31,889 | | | 31,578 | |
| Gross profit margin | | | 37.3 | % | | 38.4 | % | | 37.1 | % |
| Total expense and other income | | | 22,760 | | | 20,439 | | | 20,167 | |
| | |
| |
| |
| |
| Income from continuing operations before income taxes | | $ | 7,524 | | $ | 11,450 | | $ | 11,411 | |
| | |
| |
| |
| |
| Income from continuing operations | | $ | 5,334 | | $ | 8,146 | | $ | 7,874 | |
| | |
| |
| |
| |
| Earnings per share of common stock from continuing operations: | | | | | | | | | | |
| | Assuming dilution | | $ | 3.07 | | $ | 4.59 | | $ | 4.32 | |
| | Basic | | $ | 3.13 | | $ | 4.69 | | $ | 4.45 | |
The average number of common shares outstanding assuming dilution was lower by 40.3 million shares in 2002 versus 2001 and 40.9 million shares in 2001 versus 2000, primarily as a result of the company's common share repurchase program. To the extent the company chooses to contribute additional funds to its pension plans in 2003, such actions may impact the amount of common shares that will be repurchased during the year. The decision to fund the pension plans will depend upon economic conditions, employee demographics, mortality rates and investment performance. The average number of common shares outstanding assuming dilution was 1,730.9 million, 1,771.2 million and 1,812.1 million in 2002, 2001 and 2000, respectively.
Revenue in 2002 totaled $81.2 billion, a decline of 2.3 percent (3 percent at constant currency) compared with revenue of $83.1 billion in 2001. This was primarily attributable to lower corporate spending on IT. Despite this decline, the company estimates that it is maintaining or gaining market share in most of its key business areas. Global Services and Software revenue grew year over year, but was more than offset by lower Hardware and Global Financing revenue.
45
The following table presents each segment's revenue as a percentage of the company's total:
FOR THE YEAR ENDED DECEMBER 31:
| | 2002
| | 2001
| | 2000
| |
|---|
| Global Services | | 44.8 | % | 42.1 | % | 39.0 | % |
| Hardware | | 33.8 | | 36.8 | | 40.5 | |
| Software | | 16.1 | | 15.6 | | 14.8 | |
| Global Financing | | 4.0 | | 4.1 | | 4.1 | |
| Enterprise Investments/Other | | 1.3 | | 1.4 | | 1.6 | |
| | |
| |
| |
| |
| Total | | 100.0 | % | 100.0 | % | 100.0 | % |
| | |
| |
| |
| |
In the Americas, full-year 2002 revenue was $36,423 million, down 2.7 percent (1 percent at constant currency) from the 2001 period. Revenue from Europe/Middle East/Africa was $24,260 million, an increase of 1.1 percent (down 4 percent at constant currency). Asia Pacific revenue declined 0.5 percent (flat at constant currency) to $17,153 million. Original equipment manufacturer (OEM) revenue decreased 24.1 percent (24 percent at constant currency) to $3,350 million.
The reference to constant currency is made so that a segment can be viewed without the impacts of changing foreign currency exchange rates and therefore facilitates a comparative view of business growth. The U.S. dollar generally weakened against other currencies during 2002, so growth at constant currency exchange rates was lower than growth at actual currency exchange rates.
The overall gross profit margin of 37.3 percent decreased 1.1 points from 2001, following a 1.3 point increase in 2001 versus 2000. The decrease in 2002 gross profit margin was primarily driven by lower gross profit in Global Services and Hardware, partially offset by improved gross profit margins in Software and Global Financing. The increase in 2001 gross profit margin was primarily driven by improvement in Global Services, Hardware, Software and Global Financing gross profit margins.
Total expense and other income increased primarily due to the company's special actions associated with its Microelectronics Division, productivity initiatives, and the PwCC acquisition. The provision for bad debts also increased in 2002. These increases were offset by lower advertising expense, the elimination of goodwill amortization and continued ongoing business transformation and efficiency initiatives as described on pages 50 and 51.
Looking Forward
The outlook for 2003 is dependent upon the following key factors, among others:
- •
- The market for IT products and services and the company's ability to gain market share
- •
- The acceptance of open standards such as Linux
- •
- The ability to continue converting the company's technology leadership into product and services leadership
- •
- The transformation of IBM's business into an on demand business and the streamlining and cost reduction initiatives associated with the company's Integrated Supply Chain
The following discussion is based on the Consolidated Financial Statements on pages 64 through 69, which reflect, in all material respects, the company's segment results on an external basis. Additional financial information about each segment including the results of certain intercompany transactions is included in note X, "Segment Information," on pages 100 to 104. The Global Financing results of operations are included in the new Global Financing section on pages 60 through 63.
Global Services
DESCRIPTION OF BUSINESS
Global Services is an important part of the company's strategy of providing insight and solutions to customers. The application of technology is becoming increasingly critical to customers' advantage in the marketplace. As a result, the value that customers place on IBM's business insight and solutions is increasing. As the company continues to evolve, the expectation is that Global Services will play a larger role interfacing with IBM's customers. Global Services comprises three main lines of business:
- •
- Strategic Outsourcing Services (SO) provides customers with competitive cost advantages by outsourcing customers' processes and operations.
- •
- Business Consulting Services (BCS), formerly Business Innovation Services, delivers value to customers through business process innovation, application enablement and integration services. The acquisition of PwCC greatly enhances IBM's capabilities in these areas.
- •
- Integrated Technology Services (ITS) designs, implements, and maintains customers' technology infrastructures.
HISTORICAL RESULTS
(dollars in millions)
FOR THE YEAR ENDED DECEMBER 31:
| | 2002
| | 2001
| | 2000
| |
|---|
| Global Services revenue | | $ | 36,360 | | $ | 34,956 | | $ | 33,152 | |
| Global Services cost | | | 26,812 | | | 25,355 | | | 24,309 | |
| | |
| |
| |
| |
| Gross profit | | $ | 9,548 | | $ | 9,601 | | $ | 8,843 | |
| | |
| |
| |
| |
| Gross profit margin | | | 26.3 | % | | 27.5 | % | | 26.7 | % |
| | |
| |
| |
| |
Global Services revenue increased 4.0 percent (3 percent at constant currency) in 2002 over 2001 and 5.4 percent (10 percent at constant currency) in 2001 over 2000. The increase in 2002 resulted from the acquisition of PwCC on October 1, 2002 and growth in the SO business. Global Services revenue, excluding maintenance, increased 4.5 percent (4 percent at constant currency) in 2002 versus 2001 and 6.8 percent (11 percent at constant currency) in 2001 versus 2000. Maintenance revenue improved 1.3 percent to $5,070 million (1 percent at constant currency) in 2002 versus 2001 and declined 2.2 percent (up 2 percent at constant currency) in 2001 when compared to 2000.
SO revenue increased 2.4 percent to $14,995 million (2 percent at constant currency) in 2002 versus 2001. SO remains attractive to customers in both strong and weak economies.
46
SO revenue in 2001 increased versus 2000 primarily as a result of strong growth in Asia Pacific.
BCS revenue increased 8.8 percent to $9,331 million (7 percent at constant currency) in 2002 versus 2001. The increase was due to the addition of PwCC results in the fourth quarter. BCS revenue excluding PwCC would have declined year over year. BCS continues to be impacted by the industry pressure on consulting services. The integration of PwCC is on schedule. BCS revenue in 2001 increased versus 2000. The fourth quarter 2002 results of BCS, which include the PwCC business acquired from PricewaterhouseCoopers (PwC) on October 1, 2002, were not audited by PwC; instead, such results were audited by another Big 4 auditing firm.
ITS revenue, excluding maintenance, increased 5.1 percent to $6,593 million (4 percent in constant currency) in 2002 versus 2001. This revenue growth resulted from increases in the deployment of network hardware and connectivity services, business continuity services and OEM alliances. ITS revenue increased in 2001 versus 2000 in support of server consolidations, business continuity services and OEM alliances.
Global Services gross profit dollars decreased 0.6 percent in 2002 compared to 2001 and increased 8.6 percent in 2001 versus 2000. The gross profit margin decreased 1.2 points in 2002 versus 2001 and increased 0.8 points in 2001 versus 2000. The declines in both gross profit dollars and gross profit margins in 2002 were attributable to market conditions, particularly in the Communications and Financial sectors, and continued weakness in the consulting and systems integration businesses. These declines were partially offset by improvements in gross profit for maintenance, driven by increased productivity and lower parts costs. The increases in both gross profit dollars and gross profit margin in 2001 versus 2000 were primarily a result of increased productivity and lower parts costs across all geographies for maintenance offerings and cost reductions across all services offerings.
GLOBAL SERVICES SIGNINGS
(dollars in millions)
FOR THE YEAR ENDED DECEMBER 31:
| | 2002
| | 2001
|
|---|
| Longer-term* | | $ | 33,068 | | $ | 32,016 |
| Shorter-term* | | | 20,020 | | | 19,261 |
| | |
| |
|
| Total* | | $ | 53,088 | | $ | 51,277 |
| | |
| |
|
- *
- Longer-term are contracts generally 7 to 9 years in length and represent SO contracts and those BCS contracts with the U.S. Federal Government and its agencies. Shorter-term are contracts generally 3 to 9 months in length and represent the remaining BCS contracts and ITS contracts.
In 2002, the company signed Global Services contracts totaling $53 billion as compared to $51 billion in 2001. Signings in 2002 included 42 contracts in excess of $100 million, five of which exceeded $1 billion, as well as $1.2 billion of new signings during the fourth quarter associated with the acquired PwCC business. The pace of signings accelerated in the fourth quarter of 2002. Contracts totaling $3.1 billion acquired as part of the PwCC acquisition are not included in the signings number. Instead, these contracts were added as an adjustment to backlog. Backlog estimates are subject to change and are affected by currency assumptions used in the company's plans, changes in the scope of contracts—mainly long-term contracts—and periodic revalidations. After adjustments for changes in the scope of contracts, the estimated backlog including SO, BCS, ITS and maintenance was $112 billion at December 31, 2002, as compared to $102 billion at December 31, 2001.
LOOKING FORWARD
The addition of PwCC into IBM Global Services on October 1, 2002, will play a significant role in the company's ability to help customers transform themselves into on demand businesses. As of the acquisition date, the company added about 30,000 professionals bringing with them industry-specific business transformation skills that can leverage existing IBM and business partner capabilities to deliver e-business on demand solutions.
Hardware
The company recently changed the names of its hardware segments, whereby Enterprise Systems is now the Systems Group and Personal and Printing Systems is now the Personal Systems Group.
DESCRIPTION OF BUSINESS
Systems Group
The Systems Group comprises eServer and Storage products. eServers are based upon IBM operating systems (zSeries and iSeries), as well as UNIX (pSeries) and the Microsoft Windows operating system (xSeries). All of these server lines have the capability to run Linux, a key open standard operating system. Data storage products include disk, tape and storage area networks included within the Storage brand.
The Systems Group provides business solutions to customers. Approximately half of the Systems Group's sales transactions are through business partners and approximately 40 percent direct to customers, slightly more than half of which are through the Web at ibm.com. In addition, while appropriately not reported as external revenue, hardware is also deployed internally in support of IBM Global Services offerings and contracts.
Personal Systems Group
The Personal Systems Group includes the company's lines of personal computers, printers and point-of-sale terminals. The personal computer business is characterized by a high degree of commoditization, short product life cycles, and intense price competition. Leaders in personal computers execute intense cost control and generate customer loyalty through the offering of differentiated features such as the company's new ThinkVantage technologies, superior post-sale support, and maintenance.
47
Technology Group
The Technology Group, primarily consisting of the Microelectronics Division, provides leading semiconductor technology, packaging solutions and engineering technology services to OEM customers and, although appropriately not reported as external revenue, to the Systems Group. The Microelectronics Division develops and manufactures products in three general categories:
Application Specific Integrated Circuits—The company manufactures and tests customized semiconductor products for customers. The customers design these customized product solutions using IBM's suite of design tools and portfolio of intellectual property (IP), resulting in faster speeds to market for the customers.
Foundry—Semiconductor customers provide IBM with their product designs based upon the customer's product IP. Using the customer's design, IBM provides a full suite of semiconductor manufacturing and integrated supply chain services to deliver the product to the customer.
Standard products—These are semiconductors that are manufactured and designed primarily based upon IBM's Power PC platform. Minor customization is performed for customers.
In addition, Technology Group launched in 2002 its new Engineering and Technology Services Division that provides system and component design services, strategic outsourcing of customers' design teams, and technology and manufacturing consulting services.
HISTORICAL RESULTS
(dollars in millions)
FOR THE YEAR ENDED DECEMBER 31:
| | 2002
| | 2001
| | 2000
| |
|---|
| Hardware revenue | | $ | 27,456 | | $ | 30,593 | | $ | 34,470 | |
| Hardware cost | | | 20,020 | | | 21,231 | | | 24,207 | |
| | |
| |
| |
| |
| Gross profit | | $ | 7,436 | | $ | 9,362 | | $ | 10,263 | |
| | |
| |
| |
| |
| Gross profit margin | | | 27.1 | % | | 30.6 | % | | 29.8 | % |
| | |
| |
| |
| |
Hardware revenue declined 10.3 percent (11 percent at constant currency) in 2002 versus 2001 and declined 11.2 percent (8 percent at constant currency) in 2001 compared with 2000.
In 2002, Systems Group revenue declined 8.0 percent (10 percent at constant currency) to $12,646 million from 2001, following a decrease of 3.2 percent in 2001 versus 2000. Revenue from the majority of the Systems Group products was affected by the continuing weak IT spending during 2002. zSeries revenue declined in 2002 following an increase in 2001. Total deliveries of zSeries computing power increased approximately 6 percent as measured in MIPS (millions of instructions per second) versus 2001, while the price per MIP continued to decline from 2000 through 2002. Revenue from pSeries UNIX servers decreased in 2002 versus 2001 although high-end pSeries server revenue increased in 2002 versus 2001. In November 2002 the company announced a new mid-range p650 server with Power 4 engines, which generated strong demand. Revenue from pSeries servers declined due to weak market conditions, although high-end server revenue increased in 2001 versus 2000. Revenue from iSeries servers declined in 2002 versus 2001 due to weak volumes across all product lines. Revenue from iSeries servers also declined in 2001 versus 2000. These declines in revenue were partially offset by increased revenue from xSeries servers, primarily in the high-end servers. The company expects to have gained market share in xSeries servers in 2002 against competitors. xSeries revenue declined in 2001 versus 2000, reflecting the competitive environment in the Intel-based server market.
Revenue from storage products decreased in direct access storage device (DASD) and tape product lines in 2002 versus 2001 as the company experienced weakness in this business consistent with general industry trends whereby the impact of price declines exceeded the impact of volume growth as measured in terabytes. In 2001, revenue increased primarily as a result of higher revenue from high-end storage products versus 2000.
Personal Systems Group revenue declined 7.8 percent (9 percent at constant currency) in 2002 to $11,049 million from 2001, following a decrease of 20.6 percent in 2001 versus 2000 with personal computers, retail stores solutions and printer systems all showing declines. The personal computer revenue decline was primarily driven by the continued demand weakness and price erosion in the industry.
The Technology Group no longer includes HDDs and comprises mainly the company's Microelectronics Division for all periods presented. Technology Group revenue in 2002 decreased 23.6 percent (23 percent at constant currency) to $3,935 million when compared with 2001, following a decrease of 0.7 percent in 2001 versus 2000. The decline in Technology Group revenue was primarily a result of the divestiture of multiple, non-core businesses over the past twelve months, including display and card manufacturing. These decreases were partially offset by increased revenue from OEM logic products driven by demand for the company's copper products and its growing foundry business. The decline in 2001 revenue was primarily driven by the severe slowdown in the semiconductor industry in 2001.
Hardware gross profit dollars decreased 20.6 percent in 2002 from 2001, following an 8.8 percent decrease in 2001 versus 2000. The Hardware gross profit margin decreased 3.5 points in 2002 following an increase of 0.8 points in 2001 versus 2000. The decline in gross profit dollars and gross profit margin in 2002 was primarily driven by lower volumes in the company's microelectronics business and lower gross profit margins on Systems Group products, primarily pSeries and storage products, which more than offset the benefits from hardware manufacturing infrastructure cost reductions.
The decline in gross profit dollars in 2001 was primarily due to lower volumes in the company's Technology Group and pricing pressures in personal computers.
The increase in 2001 gross profit margin was primarily driven by a shift in the company's revenue toward servers from lower gross profit margin products, such as personal computers.
48
LOOKING FORWARD
- •
- Two key product lines recently announced product refreshes. As discussed on page 48, the company experienced strong demand for its new pSeries products announcement in November. In January 2003, the company announced a major refresh of its iSeries midrange product line that allows customers to buy and pay for only the computing capacity they need.
- •
- Indications are that Linux is gaining additional support and popularity and is recognized as an open standard operating system. Systems Group servers are compatible with Linux.
- •
- The new Engineering and Technology Services Division is bringing entirely new value offerings to a broader customer base than traditionally associated with the Technology Group. These new offerings have the potential to generate more stable financial returns with characteristics similar to a services business.
- •
- Autonomic computing is a key competitive differentiator for the company.
- •
- The company outsourced its desktop manufacturing in January 2002 and recently announced an agreement to outsource the manufacturing of a significant portion of its low and midrange xSeries servers and to outsource certain mobile PC configuration processes to be effective in 2003. The outsourcing initiatives will increase the company's responsiveness to changes in demand. These initiatives along with internal initiatives to streamline the company's integrated supply chain have yielded, and will continue to yield, additional cost savings.
Software
DESCRIPTION OF BUSINESS
The Software business consists primarily of middleware and operating systems. Middleware software enables companies to manage processes and the flow of information as well as to collaborate. Operating systems are the software engines that run computers. Middleware brands include:
- •
- WebSphere (facilitates customers' ability to manage a wide variety of business processes through the Web)
- •
- Data Management such as DB2 database software
- •
- Tivoli (enables customers to centrally manage and efficiently utilize their network and storage)
- •
- Lotus (increases customer's ability to communicate, collaborate and learn in an effective manner)
Sales channels include direct to end users (70 percent) and business partners (21 percent). The remainder, while appropriately not reported as external revenue, is deployed internally in support of Global Services offerings and contracts. Approximately 40 percent of software revenue relates to one-time charge (OTC) arrangements whereby the customer pays one up-front payment for a lifetime license. Typically, arrangements for the sale of OTC software include one year of maintenance. The customer can also purchase ongoing maintenance after the first year, which includes product upgrades and technical support. The remaining software is sold on a monthly license charge arrangement.
HISTORICAL RESULTS
(dollars in millions)
FOR THE YEAR ENDED DECEMBER 31:
| | 2002
| | 2001
| | 2000
| |
|---|
| Software revenue | | $ | 13,074 | | $ | 12,939 | | $ | 12,598 | |
| Software cost | | | 2,043 | | | 2,265 | | | 2,283 | |
| | |
| |
| |
| |
| Gross profit | | $ | 11,031 | | $ | 10,674 | | $ | 10,315 | |
| | |
| |
| |
| |
| Gross profit margin | | | 84.4 | % | | 82.5 | % | | 81.9 | % |
| | |
| |
| |
| |
Software revenue increased 1.0 percent (flat at constant currency) in 2002, following an increase of 2.7 percent (7 percent at constant currency) in 2001 from 2000. The software market remained challenging in 2002. The company noted two trends driving this challenging market. First, customers were spending more time on the selection process for software solutions. Second, customers were more inclined to negotiate smaller software arrangements, which are perceived to provide a faster return on investment. The company's continued focus on customer base expansion, including mid-sized customers, offset these two trends. Despite the difficult software environment, the company believes it continued to gain share in key areas.
The company's middleware products revenue grew 4 percent (3 percent at constant currency) to $10,055 million in 2002 and increased 5 percent (9 percent at constant currency) in 2001 versus 2000. Middleware revenue increases in 2002 were driven by growth in data management software, WebSphere and Tivoli, partially offset by revenue declines in Lotus. The increase in 2001 resulted from strong growth in data management software and WebSphere, partially offset by revenue declines in Tivoli and Lotus. Revenue from the acquisition of the Informix database business in July 2001 contributed approximately 60 percent of the middleware software growth in 2002 and 2001.
Operating systems software revenue declined 3 percent (4 percent at constant currency) to $2,369 million in 2002 versus 2001 and declined 3 percent (up 1 percent at constant currency) in 2001 compared with the prior year. The decline in 2002 resulted from lower revenue associated with zSeries, iSeries and pSeries offerings. The decline in 2001 resulted from lower revenue associated with iSeries and pSeries server products.
Software gross profit dollars increased 3.3 percent in 2002 from 2001, following an increase of 3.5 percent in 2001 from 2000. The Software gross profit margin improved 1.9 points in 2002 following an increase of 0.6 points in 2001 compared to 2000. Lower support and services costs contributed to the increases. In addition, the company continues to leverage productivity initiatives such as shared component development.
49
The company develops software building blocks that may be used in multiple products to satisfy a wide range of customer needs. This has led to efficiencies, cost savings in the production of code, and improved time to market with new offerings. The increase in gross profit dollars and gross profit margin in 2001 versus 2000 was primarily due to higher Software revenue, lower service costs and purchased vendor software, partially offset by higher amortization costs and vendor royalty payments.
LOOKING FORWARD
The company purchased Rational on February 21, 2003 for approximately $2.1 billion in cash. Rational provides software tools that allow users to effectively capture and analyze requirements to create designs for software applications, test applications, and manage the software development process. Rational's software development tools can be used to develop and upgrade any other company's software products. Accordingly, this acquisition is a critical part of IBM's open standard strategy. Rational's revenue for the fiscal year ended March 31, 2002, was $690 million.
Major IBM customers are embracing the Linux operating system. Prior to open standard operating systems, a customer may have been more likely to purchase middleware from the software vendor that owns and sells the proprietary operating system used by that customer. An open standard operating system gives customers another reason to consider IBM middleware.
Enterprise Investments/Other
DESCRIPTION OF BUSINESS
The Enterprise Investments segment develops and provides industry-specific information technology solutions supporting the Hardware, Software and Global Services segments of the company. Primary product lines include product life cycle management software and document processing technologies. Product life cycle management software primarily serves the industrial sector and helps customers manage the development and manufacturing of their products. Document processor products service the financial sector and include products that enable electronic banking.
HISTORICAL RESULTS
(dollars in millions)
FOR THE YEAR ENDED DECEMBER 31:
| | 2002
| | 2001
| | 2000
| |
|---|
| Enterprise Investments/ Other revenue | | $ | 1,064 | | $ | 1,153 | | $ | 1,404 | |
| Enterprise Investments/ Other cost | | | 611 | | | 634 | | | 747 | |
| | |
| |
| |
| |
| Gross profit | | $ | 453 | | $ | 519 | | $ | 657 | |
| | |
| |
| |
| |
| Gross profit margin | | | 42.6 | % | | 45.0 | % | | 46.8 | % |
| | |
| |
| |
| |
Enterprise Investments/Other revenue decreased 7.7 percent (10 percent at constant currency) from 2001, following a decrease of 17.9 percent (14 percent at constant currency) in 2001 from 2000. The decrease in 2002 revenue was primarily a result of lower revenue from document processors, partially offset by increased revenue from product life-cycle management software. The company's strategy has been to shift development and distribution of certain products to third-party companies.
The gross profit dollars from Enterprise Investments/Other declined 12.6 percent in 2002 versus 2001 and decreased 21.0 percent in 2001 versus 2000. The Enterprise Investments/Other gross profit margin declined 2.4 points in 2002 following a decrease of 1.8 points in 2001 versus 2000. The declines in gross profit dollars and margins primarily relate to software as well as industry dynamics.
LOOKING FORWARD
The key factors that will impact the results of the Enterprise Investments segment are the economy and corporate IT spending budgets.
Expense and Other Income
(dollars in millions)
FOR THE YEAR ENDED DECEMBER 31:
| | 2002
| | 2001
| | 2000
| |
|---|
| Selling, general and administrative | | $ | 18,738 | | $ | 17,048 | | $ | 17,393 | |
| Percentage of revenue | | | 23.1 | % | | 20.5 | % | | 20.4 | % |
| Research, development and engineering | | | 4,750 | | | 4,986 | | | 5,084 | |
| Percentage of revenue | | | 5.9 | % | | 6.0 | % | | 6.0 | % |
| Intellectual property and custom development income | | | (1,100 | ) | | (1,476 | ) | | (1,664 | ) |
| Other (income) and expense | | | 227 | | | (353 | ) | | (990 | ) |
| Interest expense | | | 145 | | | 234 | | | 344 | |
| | |
| |
| |
| |
| Total expense and other income | | $ | 22,760 | | $ | 20,439 | | $ | 20,167 | |
| | |
| |
| |
| |
SELLING, GENERAL AND ADMINISTRATIVE EXPENSE
Historical Results
Total Selling, general and administrative (SG&A) expense increased 9.9 percent (9 percent at constant currency) in 2002 versus 2001, following a decrease of 2.0 percent (flat at constant currency) in 2001 compared with 2000. The increase in 2002 was due to actions taken in the second quarter and fourth quarter of 2002 totaling $1,489 million. See note S, "2002 Actions," on pages 90 through 92 for additional details regarding these actions.
50
PwCC acquisition-related costs of $292 million were incurred in 2002 and included the PwCC compensation costs discussed on page 78. These costs relate to the acquired PwCC business that are of a nonrecurring nature and also contributed to the increase in SG&A.
Workforce reductions, which are the ongoing reductions and rebalancing that occur each quarter, were $300 million in 2002, $285 million in 2001 and $167 million in 2000. The 2002 amount excludes workforce reductions that took place in the 2002 second quarter. These 2002 second-quarter workforce reductions were recorded in the second-quarter actions amount disclosed in note S, "2002 Actions," on pages 90 through 92 and included in the 2002 actions amount mentioned on page 50. The annual increases in workforce reductions are attributable to the difficult economic environment during 2001 and 2002, as well as the company's rebalancing of the workforce for shifts in required skills.
Advertising and promotional expense was $1,427 million in 2002, a decline of $188 million from 2001 following a decline of $127 million in 2001 versus 2000. The declines from 2000 to 2002 are primarily due to a strategic initiative to consolidate and centralize certain advertising at the corporate level in order to gain additional efficiencies. The decreases in 2002 were primarily in spending associated with direct response advertising, business partner programs and customer and sales events. The decline in 2001 was primarily driven by lower spending on brand advertising and promotional spending.
The provision for bad debts expense in 2002, 2001 and 2000 was $673 million, $490 million and $270 million, respectively. The increases were related primarily to the company's Global Financing receivables portfolio and were the result of the weakening economy and exposures in the Communications sector. See page 62 for further information about the company's financing receivables.
As described in "Standards Implemented," on pages 75 and 76, the company adopted new accounting rules that eliminate the amortization of goodwill starting January 1, 2002. Page 76 includes income and earnings per share amounts that are adjusted to present comparative amounts as if the new goodwill rules were in place prior to 2002. Goodwill expense, net of tax, was $262 million in 2001 and $436 million in 2000.
The remaining base SG&A expense includes all the other expenses that are not separately discussed above and amounted to $14,557 million, $14,396 million and $14,778 million in 2002, 2001 and 2000, respectively. The increase in 2002 was solely due to the acquired PwCC business. Base SG&A expense reductions, excluding the impact of PwCC, were primarily due to the company's business transformation and efficiency initiatives as well as concentrated and focused control of day-to-day discretionary spending.
Looking Forward
The company will continue to execute on its business transformation and efficiency initiatives.
The second quarter 2002 actions are estimated to reduce cost and expense by at least an incremental $900 million, pre-tax, in 2003 as compared to 2002. Approximately half of these incremental cost and expense reductions are estimated to benefit Global Services, approximately 25 percent for the Technology Group and approximately 20 percent for the Systems Group.
The future level of provision for bad debts will depend upon economic conditions and the health of each sector in which the company has a concentration of financing receivables. Refer to pages 61 to 63 for additional information about the company's financing receivables.
RESEARCH, DEVELOPMENT AND ENGINEERING
Description
Once again, the company had more patents awarded in the United States in 2002 than any other company. This marks the 10th year in a row that IBM achieved this distinction. Being the leader in patents contributes to IBM's ability to gain market share in key areas. Recent significant achievements and initiatives that have given IBM an edge in the marketplace include autonomic (self-healing) computing capabilities and copper chip and silicon-on-insulator technology, and the ongoing support of the open standard Linux operating system. Another significant benefit of being the leader in patents is the ability to generate income through sales of IP and custom development arrangements. The level of R&D spending is determined based upon IBM's projections of future customer technology needs and areas offering significant long-term growth opportunities for shareholders.
Historical Results
Research, development and engineering (RD&E) expense declined 4.7 percent in 2002 from 2001, following a decrease of 1.9 percent in 2001 from 2000. The declines in 2002 and 2001 were a result of actions taken to improve productivity. In addition, the company reprioritized its spending to increase its investment in high-growth opportunities such as e-business, initiatives to support Linux, middleware software products, autonomic computing and e-business on demand.
Looking Forward
In November 2002, the company announced On Demand Innovation Services, a new services arm located in its Research Division, which provides customers access to a discrete team of researchers who specialize in high-end business transformation and technology consulting. The new organization will be staffed with up to 200 IBM Research consultants worldwide.
51
INTELLECTUAL PROPERTY AND CUSTOM DEVELOPMENT INCOME
Description
As discussed above, the company's world-class R&D function results in superior products for the company's customers, and also results in IP income. Some of the technological breakthroughs that IBM achieves are used exclusively in IBM products while other breakthroughs are used by others when the new technology is not strategic to IBM's business goals. A third group is both used internally and licensed externally.
IP and custom development income comprises the three categories in the table below. Sales and other transfers of IP are typically transaction-based lump sums and are relatively less predictable in amount and timing than licensing/royalty-based fees. Licensing/royalty-based fees involve ongoing cash inflow and income streams. The key factors impacting the amount of income earned in these two categories are the timing and availability of the company's licensable IP. IBM also earns income from performing custom development for specific customers.
In addition to the IP income sources in the table below, the company also generates value from its patent portfolio through cross-licensing arrangements and IP licensed in divestiture transactions. Cross-licensing arrangements involve licensing of the company's IP to a third party in exchange for the third party's IP. The company does not record income on these transactions except to the extent that cash is received. The value received by IBM for IP transferred in divestiture transactions is included in the overall gain or loss from the divestiture and is therefore excluded from the table below.
Historical Results
(dollars in millions)
FOR THE YEAR ENDED DECEMBER 31:
| | 2002
| | 2001
| | 2000
|
|---|
| Sales and other transfers of intellectual property | | $ | 511 | | $ | 727 | | $ | 913 |
| Licensing/royalty-based fees | | | 351 | | | 465 | | | 528 |
| Custom development income | | | 238 | | | 284 | | | 223 |
| | |
| |
| |
|
| Total | | $ | 1,100 | | $ | 1,476 | | $ | 1,664 |
| | |
| |
| |
|
The decreases in sales and other transfers of IP in 2002 versus 2001 and 2001 versus 2000 were primarily due to a greater number of larger dollar sales and other transfers during the prior years. The amount of income from licensing/royalty-based fee transactions has been declining due to economic conditions and fewer licensing opportunities resulting from industry consolidation.
Looking Forward
The timing and amount of sales and other transfers of IP may vary significantly from year to year depending upon the timing of new patents and know-how development, economic conditions, and the extent of further industry consolidation, if any.
OTHER (INCOME) AND EXPENSE
The primary reason for the reduction in Other (income) and expense in 2002 was the actions taken by the company in the second and fourth quarters of 2002 amounting to $513 million. See note S, "2002 Actions," on pages 90 through 92 for further information. The remaining items of Other (income) and expense largely offset. These offsetting items include the lower writedowns of certain equity investments for other than temporary market declines of $58 million in 2002 as compared to $405 million in 2001. There were no such write-downs in 2000. Net realized gains on sales of securities and other investments were $(63) million in 2002, $(236) million in 2001 and $(265) million in 2000. These writedowns and sales activity are related to the dynamics in the equity markets over the past few years. Additionally, net realized gains from certain real estate activities were $(66) million in 2002, $(133) million in 2001 and $(222) million in 2000. The company recorded interest income (from securities and other investments excluding the Global Financing business transactions) of $(127) million in 2002, $(175) million in 2001 and $(308) million in 2000. Foreign currency transaction gains were $(39) million, $(190) million and $(128) million in 2002, 2001 and 2000, respectively. The reduction of Other (income) and expense from 2000 to 2001 was primarily attributable to the 2001 writedown of certain equity investments for other than temporary market declines.
INTEREST EXPENSE
Interest expense is presented in Cost of Global Financing in the Consolidated Statement of Earnings only if the related external borrowings are to support the Global Financing external business. See page 63 for additional information regarding Global Financing debt and interest expense.
Interest expense, excluding amounts recorded in Cost of Global Financing, declined 37.9 percent in 2002 from 2001 and 31.4 percent in 2001 versus 2000. The declines were primarily due to lower average interest rates and a decline in average debt outstanding in the periods.
Retirement-Related Benefits
DESCRIPTION
The company provides a number of retirement-related benefits to its employees including defined benefit pension plans and defined contribution pension plans. The company also provides nonpension postretirement plans comprising retiree medical and life insurance plans.
HISTORICAL RESULTS
The following table provides the total pre-tax (income)/cost for all retirement-related plans. (Income)/cost amounts are included as a reduction of/addition to, respectively, the company's cost and expense amounts in the Consolidated Statement of Earnings within the caption (e.g., Cost, SG&A, RD&E) relating to the job function of the individuals participating in the plans.
52
The amounts disclosed in this retirement-related benefits table are for continuing operations.
(dollars in millions)
FOR THE YEAR ENDED DECEMBER 31:
| | 2002
| | 2001*
| | 2000*
| |
|---|
| Total retirement-related plans—income | | $ | (248 | ) | $ | (493 | ) | $ | (389 | ) |
| | |
| |
| |
| |
| Comprise: | | | | | | | | | | |
| Defined benefit and contribution pension plans—income | | $ | (619 | ) | $ | (886 | ) | $ | (776 | ) |
| Nonpension postretirement benefits—cost | | | 371 | | | 393 | | | 387 | |
| | |
| |
| |
| |
- *
- Reclassified to conform with 2002 presentation.
Total retirement-related plans income decreased $245 million in 2002 as compared to 2001. This was primarily due to the defined benefit plans. The primary driver of the decrease in retirement-related plans income relates to the 2002 change in defined benefit plan assumptions.
See note W, "Retirement-Related Benefits," on pages 95 to 100 for detailed information about the company's plans including the components of defined benefit plan income, the funded status of defined benefit plans, the historical effects of actuarial assumptions on retirement-related plans (income)/cost, the company's accounting policy for retirement-related benefits, the company's funding of the U.S. defined benefit plan in the fourth quarter of 2002, the impact of certain plan amendments on retirement-related plans (income)/cost, and descriptions of the major plans.
LOOKING FORWARD
On January 1, 2003, the company reduced its expected return on plan assets for its U.S. defined benefit plan from 9.5 percent to 8.0 percent, and on December 31, 2002, the company lowered its discount rate assumption from 7.0 percent to 6.75 percent, and its rate of compensation increase from 6.0 percent to 4.0 percent. Reductions in these rates also occurred in certain non-U.S. countries. As discussed on page 99, the company contributed cash and IBM stock to the main U.S. defined benefit plan. As a result, it remains fully funded on an Accumulated Benefit Obligation (ABO) basis. The collective effect of these actions will be an estimated reduction in the 2003 Retirement-related plans income of approximately $500 million as compared to 2002 Retirement-related plans income.
Future impacts of pension plans, including the changes noted above, on the operating results of the company depend on economic conditions, employee demographics, mortality rates and investment performance.
Allocation of Expense to Segments
See note X, "Segment Information," on pages 100 to 104 for additional information about the pre-tax income/(loss) of each segment, as well as the methodologies employed by the company to allocate shared expenses to the segments.
Provision for Income Taxes
HISTORICAL RESULTS
The continuing operations provision for income taxes resulted in an effective tax rate of 29.1 percent for 2002, compared with the 2001 effective tax rate of 28.9 percent and the 2000 effective tax rate of 31.0 percent. Excluding the tax effect of the Microelectronics Division's portion of the 2002 actions as described in note S, "2002 Actions," on pages 90 through 92, the 2002 rate was 29.5 percent. This 0.6 point increase from the 2001 rate was principally attributable to a less favorable mix of geographic income. The 2.1 point decrease in the 2001 rate from the 2000 rate was primarily the result of a more favorable mix of income in countries with low tax rates as well as adjustments to estimated tax liabilities relating to prior years.
LOOKING FORWARD
In the normal course of business, the company expects that its effective tax rate will approximate 30 percent. The rate will change year to year based on nonrecurring events (such as the tax effect of the Microelectronics Division's actions in 2002) as well as recurring factors including the geographical mix of income before taxes, the timing and amount of foreign dividends, state and local taxes, and the interaction of various global tax strategies.
In 2001, the World Trade Organization (WTO) determined that tax provisions of the FSC Repeal and Extraterritorial Income (ETI) Exclusion Act of 2000 constitute an export subsidy prohibited by the WTO Agreement on Subsidies and Countervailing Measures Agreement. The U.S. government appealed the panel's decision and lost its appeal. The President of the United States has stated that the United States will comply with the WTO ruling. During 2002, the House Ways and Means Committee Chairman introduced the American Competitiveness and Corporate Accountability Act of 2002. This proposed bill would repeal the ETI regime and introduce broad-based international tax reform. If the ETI exclusion is repealed and replacement legislation is not enacted, the loss of the ETI tax benefit may adversely impact the company's tax rate.
Additional Information
In addition to the information in this Management Discussion section regarding the company's business, pages 1 through 3 of the IBM 2002 Form 10-K, filed with the Securities and Exchange Commission on March 10, 2003, provide additional information regarding IBM's business, focusing on high-level organization and certain key risk factors.
53
Results of Discontinued Operations
(dollars in millions)
FOR THE YEAR ENDED DECEMBER 31:
| | 2002
| | 2001
| | 2000
| |
|---|
| Revenue | | $ | 1,946 | | $ | 2,799 | | $ | 3,307 | |
| | |
| |
| |
| |
| Pre-tax (loss)/income | | $ | (2,037 | ) | $ | (497 | ) | $ | 123 | |
| Income tax benefit | | | (282 | ) | | (74 | ) | | (96 | ) |
| | |
| |
| |
| |
| (Loss)/income | | $ | (1,755 | ) | $ | (423 | ) | $ | 219 | |
| | |
| |
| |
| |
See the "Basis of Presentation" section in note A, "Significant Accounting Policies" on page 70 and note C, "Acquisitions/Divestitures" on pages 78 to 80 for a discussion of the company's divestiture of the HDD business.
Revenue from discontinued operations in 2002 totalled $1,946 million, a decline of 30.5 percent compared with revenue of $2,799 million in 2001. Revenue from discontinued operations decreased 15.4 percent in 2001 compared with 2000 revenue of $3,307 million. The HDD revenue declined as the company's ability to sell HDDs is highly dependent on the personal computer industry, which experienced a significant downturn beginning in 2000, as well as a result of general industry price declines.
Loss from discontinued operations in 2002 was $1,755 million as compared to a loss of $423 million in 2001 and income of $219 million in 2000. The loss in 2002 was primarily attributable to the operational loss of $1,373 million, net of tax, and an estimated loss on disposal of the HDD business of $382 million, net of tax. Included in the operational net loss in 2002 was a $508 million, net of tax, increase for certain actions taken by the company in the second and fourth quarters of 2002, a $217 million, net of tax, increase for inventory write-offs as compared to 2001 and a $57 million, net of tax, increase in warranty costs as compared to 2001. The announcement of the Hitachi transaction led the company to a strategic decision to cease reworking and selling efforts for some of the company's older HDD products. The increase in inventory write-offs was especially pronounced for these older products.
The second quarter actions primarily included charges for the abandonment and associated removal costs for machinery, equipment and tooling that are no longer needed by the company and will not be purchased by Hitachi. The fourth quarter actions primarily included the abandonment and associated removal costs for machinery and equipment and tooling, workforce reduction-related charges and excess leased space charges associated with the HDD business, all as a result of the final agreement completed with Hitachi.
The 2002 and 2001 discontinued operations tax rates of approximately 14 percent and 15 percent, respectively, resulted primarily from the mix of losses in countries with low tax rates. Additionally, the 2002 tax rate included an incremental U.S. tax charge of $248 million attributable to the December repatriation of non-U.S. transaction proceeds. The 2000 discontinued operations tax rate was impacted by the geographic mix of income and changes in the value of IP rights that were previously transferred to several non-U.S. subsidiaries.
Fourth Quarter
Continuing Operations
The company's fourth-quarter 2002 diluted earnings per common share from continuing operations was $1.11, compared with diluted earnings per common share of $1.46 in the fourth quarter of 2001. Fourth-quarter income from continuing operations was $1.9 billion compared with $2.6 billion in fourth quarter 2001. Revenue from continuing operations for the fourth quarter was $23.7 billion, up 7 percent (4 percent at constant currency) compared with the fourth quarter of 2001 revenue of $22.1 billion.
In the Americas, revenue was $10.3 billion, an increase of 4.6 percent (7 percent at constant currency) from the 2001 period. Revenue from Europe/Middle East/Africa was $7.8 billion, up 12.6 percent (1 percent at constant currency). Asia-Pacific revenue grew 7.1 percent (4 percent at constant currency) to $4.8 billion. OEM revenue decreased 11.3 percent (11 percent at constant currency) to $828 million compared with the fourth quarter of 2001.
Revenue from Global Services, including maintenance, grew 16.7 percent (13 percent at constant currency) in the fourth quarter to $10.6 billion, driven by the PwCC acquisition. Global Services revenue, excluding maintenance, increased 19 percent (15 percent at constant currency). IBM signed more than $18 billion in services contracts in the quarter compared with $9 billion in the 2002 third quarter.
Hardware revenue increased 1.3 percent (down 1 percent at constant currency) to $8.1 billion from the 2001 fourth quarter. Despite continued weak IT spending, revenue at constant currency from xSeries Intel-based servers grew with high-end server demand particularly strong, while revenue from pSeries UNIX-based servers was flat with fourth-quarter 2001 revenue. IBM eServer revenue from iSeries declined as compared to the fourth quarter of 2001, due to the weak economic environment. While zSeries revenue also declined in the quarter from a year ago, total deliveries of zSeries computing power as measured in MIPS increased 13 percent compared with 7 percent in third-quarter 2002. Storage products revenue declined although disk storage revenue increased, driven by high-end products. Microelectronics revenue decreased as compared to the fourth quarter of 2001.
The personal computer unit increased revenue as compared to the fourth quarter of 2001 due to higher sales of desktop and mobile products.
Software revenue was flat (down 2 percent at constant currency) at $3.8 billion compared to the 2001 fourth quarter due to the weak economic environment. Middleware products declined 1 percent at constant currency in the fourth quarter of 2002.
Operating systems revenue decreased compared with the prior-year period due primarily to the related volume trends of eServer hardware sales.
54
Global Financing revenue decreased 10.5 percent (11 percent at constant currency) in the fourth quarter of 2002 to $829 million. Revenue from the Enterprise Investments/Other area, which includes industry-specific IT solutions, increased 1.1 percent (down 6 percent at constant currency) compared to the fourth quarter of 2001 to $343 million.
The company's overall gross profit margin was 38.8 percent in the fourth quarter, compared to 40.3 percent in the 2001 fourth quarter, primarily due to lower Global Services margin as a result of PwCC being at a lower gross profit margin than the company's base business. Also, signings in the company's ITS Services business came late in the quarter, which resulted in the company's utilization rates being lower. This decline was partially offset by an increase in Software and Hardware gross profit margins in the fourth quarter of 2002.
In the fourth quarter, total expense and other income of $6.5 billion increased 21.4 percent over the year-earlier period, including charges of $614 million associated with the acquisition and integration of PwCC and related restructuring as well as one-time compensation costs, which are partially offset by a $40 million benefit from net adjustments to restructuring charges from the second-quarter 2002 actions. Specifically, SG&A expense increased 16 percent, reflecting the PwCC charges offset by the benefit from net adjustments related to second-quarter actions and lower goodwill expense due to the implementation of new accounting rules. RD&E expense decreased 2.9 percent in the fourth quarter. Lower IP and custom development income had a negative impact on results compared with the year-earlier period, despite two sizable contracts totaling, in the aggregate, approximately $170 million in the quarter. Other (income) and expense was negatively affected by foreign exchange losses as well as lower gains from certain real estate activities. Overall, IBM continues to benefit from the company's continuing e-business transformation and productivity enhancements.
The company's effective tax rate in the fourth quarter was 29.5 percent compared with 28.6 percent in the fourth quarter of 2001.
The company spent $74 million on common share repurchases in the fourth quarter. The average number of common shares outstanding assuming dilution was lower by 29.3 million shares in fourth quarter of 2002 versus the fourth quarter of 2001, primarily as a result of the ongoing common share repurchase program. The average number of shares assuming dilution was 1,728.7 million in fourth-quarter 2002 versus 1,758.0 million in fourth-quarter 2001.
Discontinued Operations
Revenue from discontinued operations for the fourth quarter of 2002 was $548 million, a 19.9 percent decrease from the fourth quarter of 2001. Net loss from discontinued operations for the fourth quarter of 2002 was $893 million as compared to a loss of $232 million in 2001. The underlying business dynamics causing these fourth quarter financial trends are consistent with those underlying the full-year 2002 and 2001 trends discussed in the Results of Discontinued Operations section on page 54, including the additional loss of $247 million, net of tax, incurred in the fourth quarter on disposal of the HDD business.
Financial Condition
Dynamics
The assets and debt associated with the company's Global Financing business are a significant part of IBM's financial condition. Accordingly, although the financial position amounts appearing below and on pages 56 and 57 are the company's consolidated amounts including Global Financing, to the extent the Global Financing business is a major driver of the consolidated financial position, reference in the narrative section will be made to a separate Global Financing section in this Management Discussion on pages 60 through 63. The amounts appearing in the separate Global Financing section are supplementary data presented to facilitate an understanding of the company's Global Financing business.
Overall
During 2002, the company made significant acquisitions as well as ongoing investments in RD&E and in fixed assets. In addition, the company fully funded, on an ABO basis, the IBM Personal Pension Plan (PPP). In spite of this activity, the company ended the year with $5,975 million in Cash and cash equivalents and current Marketable securities. In the fourth quarter, the company took advantage of the low interest rate environment to execute some term-debt financing that increased the non-Global Financing debt to $2,189 million at December 31, 2002. The debt-to-capital ratio of 10.2 percent is well within the company's target.
Cash Flow
The company's cash flow from operating, investing and financing activities, as reflected in the Consolidated Statement of Cash Flows on page 69, are summarized in the table on page 56. These amounts include the cash flows associated with the company's Global Financing business, which are presented on pages 60 through 63.
55
(dollars in millions)
FOR THE YEAR ENDED DECEMBER 31:
| | 2002
| | 2001
| | 2000
| |
|---|
| Net cash provided by/(used in) continuing operations: | | | | | | | | | | |
| | Operating activities | | $ | 13,788 | | $ | 13,966 | | $ | 8,837 | |
| | Investing activities | | | (6,897 | ) | | (5,862 | ) | | (4,001 | ) |
| | Financing activities | | | (7,265 | ) | | (5,309 | ) | | (6,359 | ) |
| Effect of exchange rate changes on cash and cash equivalents | | | 148 | | | (83 | ) | | (147 | ) |
| Net cash (used in)/provided by discontinued operations* | | | (722 | ) | | 55 | | | 190 | |
| | |
| |
| |
| |
| Net change in cash and cash equivalents | | $ | (948 | ) | $ | 2,767 | | $ | (1,480 | ) |
| | |
| |
| |
| |
- *
- Does not include approximately $1,170 million of net proceeds from the sale of the HDD business. Such proceeds are included in Net cash used in from Investing activities in the table above.
Working Capital
(dollars in millions)
AT DECEMBER 31:
| | 2002
| | 2001
|
|---|
| Current assets | | $ | 41,652 | | $ | 42,461 |
| Current liabilities | | | 34,550 | | | 35,119 |
| | |
| |
|
| Working capital | | $ | 7,102 | | $ | 7,342 |
| | |
| |
|
| Current ratio | | | 1.21:1 | | | 1.21:1 |
| | |
| |
|
In 2002 the company continued to focus on cash generation and improved its performance in several key working capital components, particularly accounts receivable and inventory. The $809 million decrease in Current assets was due primarily to the decline of $1,156 million in Inventories due to improvements in inventory levels across all business units and divestitures. The company's inventory levels now stand at a 20-year low and inventory turnover increased year to year. In addition, there was a decrease of $418 million in Cash and cash equivalents and Marketable securities, resulting from the $2,852 million cash payment for the purchase of PwCC, the $2,092 million cash contribution to fund the PPP, and $857 million in restructuring payments. These cash outlays were partially offset by the $1,170 million of net cash received from the sale of the HDD business to Hitachi, approximately $650 million received from the monetization of interest rate swaps associated with the company's debt portfolio, and the collection of a receivable for prior years' taxes and interest of $460 million. The decline of $660 million in Short-term financing receivables (see pages 60 through 63 and page 81) was offset by the $814 million increase in Notes and accounts receivable—trade, which resulted from the acquisition of PwCC and the stronger fourth quarter revenue in 2002 as compared to 2001.
Current liabilities decreased $569 million primarily due to the $5,157 million decline in Short-term debt (primarily associated with the company's Global Financing business, see pages 60 through 63), partially offset by increases in Accounts payable of $583 million, which was driven by the acquisition of PwCC and previous intercompany payables that were converted to external accounts payable as a result of the HDD divestiture on December 31, 2002, as well as increases in Other accrued liabilities of $2,192 million primarily due to the 2002 actions taken by the company as described in note S, "2002 Actions," on pages 90 through 92 and due to increases in short-term derivatives that are in a liability position, as well as increases in Deferred income of $1,053 million primarily due to the impact of foreign currencies.
Investments
The company made strategic acquisitions in 2002, totaling $3,958 million, including the purchase of PwCC for $3,474 million ($2,852 million in cash, $294 million primarily in the form of restricted shares of IBM common stock and $328 million in notes convertible to restricted shares of IBM common stock). In addition, $4,750 million was invested in RD&E and the company capitalized external software costs of $254 million and $343 million of internal-use software costs. The company invested $4,753 million for Plant, rental machines and other property. This comprises continuing investments in the Microelectronics Division 300 millimeter chip-making facility in East Fishkill, New York. In addition, Global Services purchased equipment for its SO business and Global Financing invested in equipment for leasing to customers.
In 2002, the company spent $4,212 million for the repurchase of the company's common shares. At December 31, 2002, the company has remaining authorization to purchase $3,864 million of IBM common shares in the open market from time to time, based on market conditions.
The company funded all of these investments primarily from cash from operations.
Debt and Equity
The company's funding requirements are continually monitored and strategies are executed to manage the company's overall asset and liability profile. Additionally, the company maintains sufficient flexibility to access global funding sources as needed. During 2002, the company issued debt denominated in U.S. dollars and Japanese yen to meet existing financing needs.
The major rating agencies' ratings of the company's debt securities at December 31, 2002, appear in the table below and remain unchanged from December 31, 2001:
| | STANDARD
AND
POOR'S
| | MOODY'S
INVESTORS
SERVICE
| | FITCH
RATINGS
|
|---|
| Senior long-term debt | | A+ | | A1 | | AA- |
| Commercial paper | | A-1 | | Prime-1 | | F-1+ |
| | |
| |
| |
|
56
(dollars in millions)
AT DECEMBER 31:
| | 2002
| | 2001
| |
|---|
| Total company debt | | $ | 26,017 | | $ | 27,151 | |
| | |
| |
| |
| Non-global financing debt* | | $ | 2,189 | | $ | 1,606 | |
| Non-global financing debt/ capitalization | | | 10.2 | % | | 7.5 | % |
| | |
| |
| |
- *
- Non-global financing debt is the company's total external debt less the Global Financing debt described in the Global Financing balance sheet on page 61.
The company's non-global financing businesses generate significant cash from ongoing operations and therefore generally do not require a significant amount of debt. Cash flows from operations are these businesses' primary source of funds for future investments.
The increase in the non-global financing debt was driven primarily by the PwCC acquisition.
A review of the company's debt and equity should also consider other contractual obligations and commitments, which are disclosed elsewhere in the financial section. These amounts are summarized in the table below to facilitate a reader's review.
The company's total consolidated Stockholders' equity decreased $666 million to $22,782 million at December 31, 2002, primarily due to a decline in Accumulated gains and (losses) not affecting retained earnings that resulted from a $2,765 million charge, net of a tax benefit of $1,574 million, to establish a minimum pension liability for certain of the company's non-U.S. pension plans. See page 95 for further information about this accounting. The decline was partially offset by an increase in common stock primarily due to the common stock issued or to be issued for a portion of the PwCC acquisition ($284 million), the funding of the PPP through the issuance of treasury shares ($1,871 million) and a reduction in the company's ongoing stock repurchase activity. See note N, "Stockholders' Equity Activity," on pages 87 and 88.
CONTRACTUAL OBLIGATIONS
| |
| | PAYMENTS DUE IN
|
|---|
(dollars in millions)
| | BALANCE AT
DEC. 31, 2002
| | 2003
| | 2004-05
| | 2006-07
| | after 2007
|
|---|
| Long-term debt | | $ | 22,723 | | $ | 3,949 | | $ | 5,283 | | $ | 3,551 | | $ | 9,940 |
| Lease commitments | | | 6,085 | | | 1,370 | | | 1,925 | | | 1,200 | | | 1,590 |
| | |
| |
| |
| |
| |
|
COMMITMENTS
| |
| | AMOUNTS EXPIRING IN
|
|---|
(dollars in millions)
| | BALANCE AT
DEC. 31, 2002
| | 2003
| | 2004-05
| | 2006-07
| | after 2007
|
|---|
| Unused lines of credit | | $ | 3,482 | | $ | 3,134 | | $ | 195 | | $ | 139 | | $ | 14 |
| Other commitments | | | 288 | | | 115 | | | 159 | | | 14 | | | — |
| Financial guarantees | | | 126 | | | 29 | | | 82 | | | 1 | | | 14 |
Unused lines of credit represent amounts available to the company's distributors to support their working capital needs and available lines of credit relating to the company's syndicated loan activities. Other commitments primarily include the company's commitments to provide financing for future purchases of the company's products. Financial guarantees represent guarantees for certain loans and financial commitments the company had made as of December 31, 2002. See note O, "Contingencies and Commitments," on pages 88 and 89.
Liquidity
As discussed on page 50, the company purchased Rational for approximately $2.1 billion in cash on February 21, 2003. The company may also decide to make additional contributions to its pension plans. The decision to fund any of the company's plans depends upon economic conditions, employee demographics, mortality rates and investment performance. The company estimates that future cash requirements for these transactions will be funded from cash flow from operations. See page 83 for a discussion of the company's lines of credit. See note Y, "Subsequent Events," on page 104 for information on the company's new shelf registration.
Critical Accounting Estimates
The application of GAAP involves the exercise of varying degrees of judgment. While the resulting accounting estimates will, by definition, not always precisely equal the related actual results, seven of these estimates involve more judgment than others. Two of these estimates are the allowance for uncollectible financing receivables and the fair value of lease residual values. See page 63 for a discussion of these estimates. The others are discussed below.
Useful Lives of Technology Group Equipment
The company determines the useful lives and related depreciation charges for plant and equipment in the Technology Group based on projected product life cycles that could change significantly due to technical innovations and competitor actions in response to relatively severe industry cycles. To the extent actual useful lives are less than previously estimated lives, the company will increase its depreciation charge or will write-off or writedown technically obsolete or non-strategic assets that have been abandoned or sold.
57
The company estimates useful lives of its Technology Group equipment by reference to the current and projected dynamics in the semiconductor industry, product life cycles, and anticipated competitor actions.
Expected Return on Plan Assets
The expected return on plan assets is used in calculating the net periodic pension (income)/cost. The differences between the actual return on plan assets and expected return on plan assets are recognized in the calculation of net periodic pension (income)/cost over five years and, over the long term, typically has not had a material effect on the Consolidated Financial Statements.
As described on pages 95 and 96, if the fair value of the pension plan's assets are below the plan's ABO, the company will be required to record a minimum liability. In some situations, the pension asset must be partially reversed through a charge to stockholders' equity. If the ABO in excess of plan assets is large enough, the company may be required, by law, to make an additional contribution to the pension plan. While the amount of funding is not dependent upon the company's expected long-term return assumption, the company's estimated expected return on plan assets is a critical estimate used by the company. Actual results that differ from the estimates may result in more or less future company funding into the pension plans than is planned by management.
Costs to Complete Long-Term Service Contracts
The company enters into numerous long-term service contracts through its SO and BCS businesses. SO contracts range for periods up to ten years and BCS contracts can be for several years. During the contractual period, revenue, cost and profits may be impacted by estimates of the ultimate profitability of each contract. If at any time, these estimates indicate the contract will be unprofitable, the entire estimated loss for the remainder of the contract is recorded immediately.
The company performs ongoing profitability analyses of its long-term services contracts in order to check whether the latest estimates require updating. Key factors reviewed by the company to estimate the future costs to complete each contract are future labor costs and productivity efficiencies.
Net Realizable Value and Customer Demand
The company reviews the net realizable value of and demand for its inventory on a quarterly basis to ensure recorded inventory is stated at the lower of cost or net realizable value and that obsolete inventory is written off. Inventory at higher risk for writedowns or write-offs are those in the industries that have lower relative gross margins and that are subject to a higher likelihood of changes in industry cycles. The semiconductor and personal computer businesses are two such industries.
Factors that could impact estimated demand and selling prices are the timing and success of future technological innovations and the economy.
Warranty Claims
The company generally offers three-year warranties for its personal computer products and one-year warranties on most of its other products. The company estimates the amount and cost of future warranty claims for its current period sales. These estimates are used to record accrued warranty cost for current period product shipments. The company uses historical warranty claim information as well as recent trends that might suggest that past cost information may differ from future claims.
Factors that could impact the estimated claim information include the success of the company's productivity and quality initiatives, as well as parts and labor costs.
Currency Rate Fluctuations
Changes in the relative values of non-U.S. currencies to the U.S. dollar affect the company's results. At December 31, 2002, currency changes resulted in assets and liabilities denominated in local currencies being translated into more dollars than at year-end 2001. The currency rate changes had a favorable effect on revenue growth of approximately 1 percentage point in 2002, and an unfavorable effect on revenue of approximately 4 percentage points and approximately 3 percentage points in 2001 and 2000, respectively.
For non-U.S. subsidiaries and branches that operate in U.S. dollars or whose economic environment is highly inflationary, translation adjustments are reflected in results of operations, as required by Statement of Financial Accounting Standards (SFAS) No. 52, "Foreign Currency Translation." Generally, the company manages currency risk in these entities by linking prices and contracts to U.S. dollars and by entering into foreign currency hedge contracts.
The company uses a variety of financial hedging instruments to limit specific currency risks related to financing transactions and other foreign currency-based transactions. Further discussion of currency and hedging appears in note L, "Derivatives and Hedging Transactions," on pages 84 to 86.
On January 1, 2001, the company adopted SFAS No. 133, "Accounting for Derivative Instruments and Hedging Activities," as amended by SFAS No. 138, "Accounting for Certain Derivative Instruments and Certain Hedging Activities." See "Standards Implemented," on pages 75 and 76 for additional information regarding SFAS No. 133.
Market Risk
In the normal course of business, the financial position of the company routinely is subjected to a variety of risks. In addition to the market risk associated with interest rate and currency movements on outstanding debt and non-U.S. dollar denominated assets and liabilities, other examples of risk include collectibility of accounts receivable and recoverability of residual values on leased assets.
58
The company regularly assesses these risks and has established policies and business practices to protect against the adverse effects of these and other potential exposures. As a result, the company does not anticipate any material losses from these risks.
The company's debt in support of the Global Financing business and the geographic breadth of the company's operations contain an element of market risk from changes in interest and currency rates. The company manages this risk, in part, through the use of a variety of financial instruments including derivatives, as explained in note L, "Derivatives and Hedging Transactions," on pages 84 to 86.
To meet disclosure requirements, the company performs a sensitivity analysis to determine the effects that market risk exposures may have on the fair values of the company's debt and other financial instruments.
The financial instruments that are included in the sensitivity analysis comprise all of the company's cash and cash equivalents, marketable securities, long-term non-lease receivables, investments, long-term and short-term debt and all derivative financial instruments. The company's portfolio of derivative financial instruments generally includes interest rate swaps, interest rate options, foreign currency swaps, forward contracts and option contracts.
To perform the sensitivity analysis, the company assesses the risk of loss in fair values from the effect of hypothetical changes in interest rates and foreign currency exchange rates on market-sensitive instruments. The market values for interest and foreign currency exchange risk are computed based on the present value of future cash flows as affected by the changes in rates that are attributable to the market risk being measured. The discount rates used for the present value computations were selected based on market interest and foreign currency exchange rates in effect at December 31, 2002 and 2001. The differences in this comparison are the hypothetical gains or losses associated with each type of risk.
Information provided by the sensitivity analysis does not necessarily represent the actual changes in fair value that the company would incur under normal market conditions because, due to practical limitations, all variables other than the specific market risk factor are held constant. In addition, the results of the model are constrained by the fact that certain items are specifically excluded from the analysis, while the financial instruments relating to the financing or hedging of those items are included by definition. Excluded items include leased assets, forecasted foreign currency cash flows, and the company's net investment in foreign operations. As a consequence, reported changes in the values of some of the financial instruments impacting the results of the sensitivity analysis are not matched with the offsetting changes in the values of the items that those instruments are designed to finance or hedge.
The results of the sensitivity analysis at December 31, 2002, and December 31, 2001, are as follows:
Interest Rate Risk
At December 31, 2002, a 10 percent decrease in the levels of interest rates with all other variables held constant would result in a decrease in the fair market value of the company's financial instruments of $237 million as compared with a decrease of $177 million at December 31, 2001. A 10 percent increase in the levels of interest rates with all other variables held constant would result in an increase in the fair value of the company's financial instruments of $210 million as compared to $151 million at December 31, 2001. Changes in the relative sensitivity of the fair value of the company's financial instrument portfolio for these theoretical changes in the level of interest rates are primarily driven by changes in the company's debt maturity, interest rate profile and amount. In 2002 versus 2001, the reported increase in interest rate sensitivity is primarily due to an increase in the proportion of long-term fixed rate debt outstanding at December 31, 2002.
Foreign Currency Exchange Rate Risk
At December 31, 2002, a 10 percent weaker U.S. dollar against foreign currencies with all other variables held constant would result in a decrease in the fair value of the company's financial instruments of $640 million as compared with a decrease of $1,401 million at December 31, 2001. Conversely, a 10 percent stronger U.S. dollar against foreign currencies with all other variables held constant would result in an increase in the fair value of the company's financial instruments of $660 million compared to $1,440 million at December 31, 2001. In 2002 versus 2001, the reported decrease in foreign currency exchange rate sensitivity was primarily due to a reduction in the amount of hedge of net investment related currency debt outstanding after taking into account the effect of "receive euro/pay U.S. dollar" and "receive yen/pay U.S. dollar" cross-currency swaps executed during 2002.
Financing Risks
See page 60 for a discussion of the financing risks associated with the company's Global Financing business and management's goals to mitigate such risks while striving for superior return on Global Financing's equity.
59
Employees and Related Workforce
| |
| |
| |
| | PERCENTAGE CHANGES
| |
|---|
| | 2002
| | 2001
| | 2000
| | 2002-01
| | 2001-00
| |
|---|
| IBM/wholly owned subsidiaries | | 315,889 | | 319,876 | | 316,303 | | (1.2 | ) | 1.1 | |
| Less-than-wholly owned subsidiaries | | 22,282 | | 25,403 | | 21,886 | | (12.3 | ) | 16.1 | |
| Complementary | | 17,250 | | 21,300 | | 25,500 | | (19.0 | ) | (16.5 | ) |
Employees at IBM and its wholly owned subsidiaries in 2002 decreased 3,987 from last year. The decrease was due primarily to workforce rebalancing initiatives designed to improve IBM's competitiveness in the marketplace. The major initiatives contributing to this decline include: the divestiture of the HDD business and 2002 workforce rebalancing and productivity actions offset by the acquisition of PwCC.
In less-than-wholly owned subsidiaries, the number of employees decreased from last year, primarily in China, as a result of the HDD divestiture.
The company's complementary workforce is an approximation of equivalent full-time employees hired under temporary, part-time and limited-term employment arrangements to meet specific business needs in a flexible and cost-effective manner.
Global Financing
Description of Business
Global Financing is a business segment within IBM, but is managed (on an arm's-length basis) and measured as if it were a standalone entity. Accordingly, the information presented in this section is consistent with this separate company view.
The mission of Global Financing is to generate a return on equity. It also facilitates the acquisition of IBM hardware, software and services.
Global Financing invests in financing assets, manages the associated risks, and leverages with debt, all with the objective of generating consistently strong returns on equity. The focus on IBM product and IBM customers mitigates the risks normally associated with a financing company. Global Financing has the benefit of both a deep knowledge of its customer base and a clear insight into the products that are being leased. This pairing allows Global Financing to manage two of the major risks (credit and residual value) that are normally associated with financing.
Global Financing comprises three lines of business:
- •
- Customer financing provides lease and loan financing to end users and internal customers for terms generally between two and five years. Internal financing is predominantly in support of Global Services' long-term customer service contracts. Global Financing also factors a selected portion of the company's accounts receivable, primarily for cash management purposes. All of these internal financing arrangements are at arm's-length rates and are based upon market conditions.
- •
- Commercial financing provides primarily short-term inventory and accounts receivable financing to dealers and remarketers of IT products. Global Financing also participates as a lender in selected syndicated loan facilities which originated from 1999 through 2001. Syndicated loans are loans in which Global Financing purchased a fixed percentage of a loan facility from a bank or other lending institution. Global Financing no longer participates in new syndicated loan programs. There are, however, remaining amounts committed and outstanding. Outstandings represent less than 2 percent of total Global Financing assets at December 31, 2002, as compared to 4 percent at December 31, 2001.
- •
- Remarketing includes the sale and lease of used equipment to new or existing customers. This equipment is primarily sourced from the conclusion of lease transactions.
Results of Operations
(dollars in millions)
FOR THE YEAR ENDED DECEMBER 31:
| | 2002
| | 2001
| | 2000
| |
|---|
| Global Financing external revenue | | $ | 3,203 | | $ | 3,407 | | $ | 3,500 | |
| Global Financing internal revenue | | | 939 | | | 836 | | | 944 | |
| | |
| |
| |
| |
| Total Global Financing revenue | | | 4,142 | | | 4,243 | | | 4,444 | |
| | |
| |
| |
| |
| Global Financing cost | | | 1,803 | | | 2,016 | | | 2,390 | |
| | |
| |
| |
| |
| Gross profit | | $ | 2,339 | | $ | 2,227 | | $ | 2,054 | |
| | |
| |
| |
| |
| Gross profit margin | | | 56.5 | % | | 52.5 | % | | 46.2 | % |
| Pre-tax income | | $ | 955 | | $ | 1,143 | | $ | 1,176 | |
| | |
| |
| |
| |
| After-tax income | | $ | 627 | | $ | 727 | | $ | 763 | |
| Return on equity* | | | 17.2 | % | | 18.4 | % | | 16.5 | % |
- *
- Return on equity is calculated using a five-point average of equity and an estimated tax rate principally based on Global Financing's geographic mix of earnings as IBM's provision for income taxes is determined on a consolidated basis. See page 89 for the IBM consolidated tax rate.
Global Financing total revenue declined 2.4 percent in 2002 from 2001, following a decline of 4.5 percent in 2001 versus 2000. The decline in 2002 was driven by a lower asset base, primarily due to decreases in demand for IT equipment caused by the current economic environment. The decline in 2001 was also driven by a lower asset base and a decline in used equipment sales.
Global Financing gross profit dollars increased 5.0 percent in 2002 versus 2001, following an increase of 8.4 percent in 2001 versus 2000. Global Financing gross profit margin improved 4.0 points in 2002 following an increase of 6.3 points in 2001 as
60
compared to 2000. The increases in 2002 gross profit dollars and gross profit margin were primarily driven by lower borrowing costs related to the current interest rate environment. The increase in 2001 was driven by lower borrowing costs discussed above and improved margins in used equipment sales due to a mix change to higher margin products.
Global Financing pre-tax income decreased 16.4 percent in 2002 versus 2001, following a decrease of 2.8 percent in 2001 versus 2000. The decrease in 2002 was driven by an increase in the provision for bad debts due to the current economic environment. See page 62 for an additional discussion of Global Financing Allowance for Doubtful Accounts. The decrease in 2001 was due to increases in provision for bad debts partially offset by an increase in gross profit discussed above.
The decline in return on equity from 2001 to 2002 was due to lower earnings primarily associated with an increased provision for bad debts expense. The increase in return on equity from 2000 to 2001 was primarily due to the decline in the equity balance from 2000 to 2001 as evidenced by the increase in the debt to equity ratio from 6.6x to 6.8x. See page 62 for a discussion of the allowance for doubtful accounts and page 63 for a discussion on debt.
Financial Condition
BALANCE SHEET
(dollars in millions)
AT DECEMBER 31:
| | 2002
| | 2001
|
|---|
| Cash | | $ | 1,157 | | $ | 785 |
| | |
| |
|
| Net investment in sales-type leases | | | 12,314 | | | 12,903 |
| Equipment under operating leases: | | | | | | |
| | External customers | | | 1,922 | | | 2,213 |
| | Internal customers* | | | 1,701 | | | 1,585 |
| Customer loans | | | 9,621 | | | 9,486 |
| | |
| |
|
| Total customer financing assets | | | 25,558 | | | 26,187 |
| Commercial financing receivables | | | 5,525 | | | 6,500 |
| Intercompany financing receivables* | | | 1,616 | | | 1,883 |
| Other receivables | | | 445 | | | 597 |
| Other assets | | | 941 | | | 718 |
| | |
| |
|
| Total financing assets | | $ | 35,242 | | $ | 36,670 |
| | |
| |
|
| Intercompany payables* | | $ | 5,383 | | $ | 4,820 |
| Debt | | | 23,828 | | | 25,545 |
| Other liabilities | | | 2,556 | | | 2,548 |
| | |
| |
|
| Total financing liabilities | | | 31,767 | | | 32,913 |
| Total financing equity | | | 3,475 | | | 3,757 |
| | |
| |
|
| Total financing liabilities and equity | | $ | 35,242 | | $ | 36,670 |
| | |
| |
|
- *
- Amounts eliminated for purposes of IBM's consolidated results and therefore do not appear on pages 65 or on page 69. These assets, along with the other assets in this table, are however, leveraged using Global Financing debt.
SOURCES AND USES OF FUNDS
The primary use of funds in Global Financing is to originate customer and commercial financing assets. Customer financing assets for end users consist primarily of IBM hardware, software and services, but also include non-IBM equipment, software and services to meet IBM customers' total solutions requirements. Customer financing assets are primarily sales-type, direct financing, and operating leases for equipment as well as loans for software and services with terms generally for two to five years.
Commercial financing originations arise primarily from inventory and accounts receivable financing for dealers and remarketers of IBM and non-IBM products. Payment terms for inventory financing generally range from 30 to 75 days. Payment terms for accounts receivable financing generally range from 30 to 90 days. Also included in commercial financing assets are syndicated loans.
ORIGINATIONS
The following are total external and internal financing originations.
(dollars in millions)
FOR THE YEAR ENDED DECEMBER 31:
| | 2002
| | 2001
|
|---|
| Customer finance: | | | | | | |
| | External | | $ | 12,845 | | $ | 15,620 |
| | Internal | | | 1,061 | | | 931 |
| Commercial finance | | | 22,546 | | | 25,071 |
| | |
| |
|
| Total | | $ | 36,452 | | $ | 41,622 |
| | |
| |
|
The decreases in originations were due to a lower demand for IT equipment associated with the current economic environment.
Cash collections of both customer and commercial financing assets exceeded new financing originations in both 2002 and 2001, which resulted in a net decline in financing assets in these years. Cash collections in 2002 and 2001 included $218 million and zero, respectively, generated through sales of portions of Global Financing's syndicated loan portfolio. These sales transactions did not have a material impact on the company's Consolidated Statement of Earnings. Additionally, funds were generated through the sale and lease of used equipment sourced primarily from prior years' lease originations.
Cash generated by Global Financing was deployed to pay dividends to IBM and to reduce debt.
FINANCING ASSETS BY SECTOR
The following are the percentage of external financing assets by industry sector.
AT DECEMBER 31:
| | 2002
| | 2001
| |
|---|
| Financial Services | | 31 | % | 27 | % |
| Industrial | | 18 | | 21 | |
| Business Partners* | | 14 | | 13 | |
| Communications | | 12 | | 13 | |
| Distribution | | 11 | | 9 | |
| Public | | 10 | | 12 | |
| Other | | 4 | | 5 | |
| | |
| |
| |
| Total | | 100 | % | 100 | % |
| | |
| |
| |
- *
- Business Partner financing assets represent a portion of commercial financing inventory and accounts receivable financing for terms generally less than 90 days.
61
FINANCING RECEIVABLES AND ALLOWANCES
The following table presents external financing receivables, excluding residual values, and the allowance for doubtful accounts.
(dollars in millions)
AT DECEMBER 31:
| | 2002
| | 2001
| |
|---|
| Financing receivables | | $ | 28,007 | | $ | 29,331 | |
| | |
| |
| |
| Specific allowance for doubtful accounts | | | 787 | | | 531 | |
| Unallocated allowance for doubtful accounts | | | 184 | | | 160 | |
| | |
| |
| |
| Total allowance for doubtful accounts | | | 971 | | | 691 | |
| | |
| |
| |
| Net financing receivables | | $ | 27,036 | | $ | 28,640 | |
| | |
| |
| |
| Allowance for doubtful account coverage | | | 3.5 | % | | 2.4 | % |
ROLL-FORWARD OF FINANCING RECEIVABLES ALLOWANCE FOR DOUBTFUL ACCOUNTS
(dollars in millions)
| |
| |
| |
|
|---|
DEC. 31,
2001
| | RESERVE
USED*
| | ADDITIONS:
BAD DEBTS
EXPENSE
| | OTHER**
| | DEC. 31,
2002
|
|---|
| $ | 691 | | $ | (321 | ) | $ | 576 | | $ | 25 | | $ | 971 |
- *
- Represents reserved receivables, net of recoveries, that were disposed of during the period.
- **
- Primarily represents translation adjustments.
The percentage of financing receivables reserved increased from 2.4 percent at December 31, 2001, to 3.5 percent at December 31, 2002. Unallocated reserves increased 15.0 percent from $160 million in 2001 to $184 million in 2002, even though the average receivables balance declined 4.5 percent over the same period. While the overall asset quality of the portfolio remains stable, the increase reflects the company's concern with the impact of the current economic environment on customer accounts. Specific reserves increased 48.2 percent from $531 million in 2001 to $787 million in 2002. The increase in specific reserves was due to continued weak economic conditions in the Communications industry, and deterioration in certain companies in this and other industries.
Global Financing's bad debts expense increased to $576 million for the year ended 2002, compared with $349 million for 2001 primarily attributable to the matters referred to above.
RESIDUAL VALUE
Residual value is a risk unique to the financing business and management of this risk is dependent upon the ability to accurately project future equipment values. As previously stated, Global Financing has clear insight into product plans and cycles for the IBM product under lease. Based upon this product information, Global Financing continually monitors projections of future equipment values and compares them to the residual values reflected in the portfolio. See note A, "Significant Accounting Policies" on page 74 for the company's accounting policy for residual values.
Sales of equipment, which are primarily sourced from equipment returned at end of lease, represented 32.1 percent of Global Financing's revenue in 2002 and 27.7 percent in 2001. The gross margin on these sales were 28.5 percent and 27.5 percent in 2002 and 2001, respectively. In addition to selling assets that are sourced from end of lease, Global Financing also leases used equipment to new customers or extends leasing arrangements with current customers. These are other ways that Global Financing profitably recovers the residual values. The following table presents the recorded amount of unguaranteed residual value for sales-type and operating leases at December 31, 2001 and 2002. In addition, the table presents the residual value as a percentage of the original amount financed, and a run out of the unguaranteed residual value over the remaining lives of these leases at December 31, 2002.
RESIDUAL VALUE
(dollars in millions)
| | 2001
| | 2002
| | 2003
| | 2004
| | 2005
| | 2006 AND
BEYOND
|
|---|
| Sales-type leases | | $ | 791 | | $ | 821 | | $ | 256 | | $ | 283 | | $ | 224 | | $ | 58 |
| Operating leases | | | 334 | | | 242 | | | 114 | | | 78 | | | 31 | | | 19 |
| | |
| |
| |
| |
| |
| |
|
| Total unguaranteed residual value | | $ | 1,125 | | $ | 1,063 | | $ | 370 | | $ | 361 | | $ | 255 | | $ | 77 |
| | |
| |
| |
| |
| |
| |
|
| Related original amount financed | | $ | 23,979 | | $ | 23,019 | | | | | | | | | | | | |
| Percentage | | | 4.7 | % | | 4.6 | % | | | | | | | | | | | |
62
DEBT
AT DECEMBER 31:
| | 2002
| | 2001
|
|---|
| Debt to equity ratio | | 6.9x | | 6.8x |
Global Financing funds its operations primarily through borrowings using a debt-to-equity ratio of approximately 7 to 1. The following table illustrates the correlation between Global Financing assets and Global Financing debt. Both assets and debt are presented in the Global Financing balance sheet on page 61.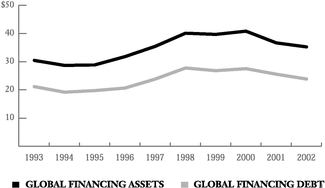
The company's Global Financing business provides funding predominantly for the company's external customers but also provides intercompany financing for the company (internal), as described in the "Description of Business" on page 60. As previously stated, IBM manages and measures Global Financing as if it were a standalone entity and accordingly, interest expense relating to debt supporting Global Financing's external customer and internal business is included in the "Global Financing Results of Operations" on page 60 and in note X, "Segment Information," on pages 100 to 104.
In the company's Consolidated Statement of Earnings on page 64, however, the interest expense supporting Global Financing's internal financing to the company is reclassified from Cost of financing to Interest expense.
LIQUIDITY
Global Financing is a segment of IBM and as such is supported by IBM's liquidity position and access to capital markets. Global Financing generated cash in 2002, which was primarily driven by net income and a decline in assets. Cash was deployed to reduce debt and pay dividends in order to maintain an appropriate debt to equity ratio.
Critical Accounting Estimates
As discussed in note A, "Significant Accounting Policies," on pages 70 to 75, the application of GAAP involves the exercise of varying degrees of judgment. The following areas require more judgment relative to the others and relate to Global Financing:
FINANCING RECEIVABLES RESERVES
The company reviews its financing receivables portfolio at least quarterly in order to assess collectibility. A description of the methods used by management to estimate the amount of uncollectible receivables is included on pages 73 and 74. Factors that could result in actual receivable losses that are materially different from the estimated reserve include sharp changes in the economy, or a large change in the health of a particular industry segment that represents a concentration in the company's receivables portfolio.
RESIDUAL VALUE
Residual value represents the estimated fair value of equipment under lease as of the end of the lease. The company estimates the future fair value of residual values by using historical models, the current market for used equipment and forward-looking product information such as marketing plans and technological innovations. These estimates are periodically reviewed and any other-than-temporary declines in estimated future residual values are recognized upon identification. Anticipated increases in future residual value are not recognized until the equipment is remarketed. Factors that could cause actual results that materially differ from the estimates include severe changes in the used equipment market brought on by unforeseen changes in technology innovations and any resulting changes in the useful lives of used equipment. Previous writedowns of residual values have not been material.
Market Risk
See pages 58 and 59 for discussion of the company's overall market risk.
Looking Forward
Given Global Financing's mission of supporting IBM's hardware, software and services, originations for both customer and commercial finance businesses will be dependent upon the overall demand for IT equipment.
Interest rates and the overall economy (including currency fluctuations) will have an effect on both revenue and gross profit. The company's interest rate risk management policy, however, combined with the Global Financing funding strategy (see page 60), should mitigate gross profit erosion due to changes in interest rates. The company's policy of matching asset and liability positions in foreign currencies will limit the impacts of currency fluctuations.
The economy could impact the credit quality of the Global Financing receivables portfolio and therefore the level of provision for bad debts. Global Financing will continue to apply rigorous credit policies in both the origination of new business and the evaluation of the existing portfolio.
As seen above, Global Financing has historically been able to manage residual value risk through both insight into the product cycles as well as through its remarketing business.
Global Financing has policies in place to manage each of the key risks involved in financing. These policies, combined with product and customer knowledge, should allow for the prudent management of the business going forward, even with the uncertainty of the current economy.
63
Consolidated Statement of Earnings
(dollars in millions except per share amount)
FOR THE YEAR ENDED DECEMBER 31:
| | NOTES
| | 2002
| | 2001
| | 2000
| |
|---|
| REVENUE: | | | | | | | | | | | | |
| Global Services | | | | $ | 36,360 | | $ | 34,956 | | $ | 33,152 | |
| Hardware | | | | | 27,456 | | | 30,593 | | | 34,470 | |
| Software | | | | | 13,074 | | | 12,939 | | | 12,598 | |
| Global Financing | | | | | 3,232 | | | 3,426 | | | 3,465 | |
| Enterprise Investments/Other | | | | | 1,064 | | | 1,153 | | | 1,404 | |
| | | | |
| |
| |
| |
| TOTAL REVENUE | | | | | 81,186 | | | 83,067 | | | 85,089 | |
| | | | |
| |
| |
| |
| COST: | | | | | | | | | | | | |
| Global Services | | | | | 26,812 | | | 25,355 | | | 24,309 | |
| Hardware | | | | | 20,020 | | | 21,231 | | | 24,207 | |
| Software | | | | | 2,043 | | | 2,265 | | | 2,283 | |
| Global Financing | | K | | | 1,416 | | | 1,693 | | | 1,965 | |
| Enterprise Investments/Other | | | | | 611 | | | 634 | | | 747 | |
| | | | |
| |
| |
| |
| TOTAL COST | | | | | 50,902 | | | 51,178 | | | 53,511 | |
| | | | |
| |
| |
| |
| GROSS PROFIT | | | | | 30,284 | | | 31,889 | | | 31,578 | |
| | | | |
| |
| |
| |
| EXPENSE AND OTHER INCOME: | | | | | | | | | | | | |
| Selling, general and administrative | | Q | | | 18,738 | | | 17,048 | | | 17,393 | |
| Research, development and engineering | | R | | | 4,750 | | | 4,986 | | | 5,084 | |
| Intellectual property and custom development income | | | | | (1,100 | ) | | (1,476 | ) | | (1,664 | ) |
| Other (income) and expense | | | | | 227 | | | (353 | ) | | (990 | ) |
| Interest expense | | K & L | | | 145 | | | 234 | | | 344 | |
| | | | |
| |
| |
| |
| TOTAL EXPENSE AND OTHER INCOME | | | | | 22,760 | | | 20,439 | | | 20,167 | |
| | | | |
| |
| |
| |
| INCOME FROM CONTINUING OPERATIONS BEFORE INCOME TAXES | | | | | 7,524 | | | 11,450 | | | 11,411 | |
| Provision for income taxes | | P | | | 2,190 | | | 3,304 | | | 3,537 | |
| | | | |
| |
| |
| |
| INCOME FROM CONTINUING OPERATIONS | | | | | 5,334 | | | 8,146 | | | 7,874 | |
| DISCONTINUED OPERATIONS: | | | | | | | | | | | | |
| (Loss)/income from discontinued operations | | C | | | (1,755 | ) | | (423 | ) | | 219 | |
| | | | |
| |
| |
| |
| NET INCOME | | | | | 3,579 | | | 7,723 | | | 8,093 | |
| Preferred stock dividends | | | | | — | | | 10 | | | 20 | |
| | | | |
| |
| |
| |
| NET INCOME APPLICABLE TO COMMON STOCKHOLDERS | | | | $ | 3,579 | | $ | 7,713 | | $ | 8,073 | |
| | | | |
| |
| |
| |
| EARNINGS/(LOSS) PER SHARE OF COMMON STOCK: | | | | | | | | | | | | |
| | ASSUMING DILUTION: | | | | | | | | | | | | |
| | | Continuing operations | | T | | $ | 3.07 | | $ | 4.59 | | $ | 4.32 | |
| | | Discontinued operations | | T | | | (1.01 | ) | | (0.24 | ) | | 0.12 | |
| | | | |
| |
| |
| |
| TOTAL | | T | | $ | 2.06 | | $ | 4.35 | | $ | 4.44 | |
| | | | |
| |
| |
| |
| | BASIC: | | | | | | | | | | | | |
| | | Continuing operations | | T | | $ | 3.13 | | $ | 4.69 | | $ | 4.45 | |
| | | Discontinued operations | | T | | | (1.03 | ) | | (0.24 | ) | | 0.12 | |
| | | | |
| |
| |
| |
| TOTAL | | T | | $ | 2.10 | | $ | 4.45 | | $ | 4.58* | |
| | | | |
| |
| |
| |
| AVERAGE NUMBER OF COMMON SHARES OUTSTANDING: | | | | | | | | | | | | |
| | Assuming dilution | | | | | 1,730,941,054 | | | 1,771,230,599 | | | 1,812,118,422 | |
| | Basic | | | | | 1,703,244,345 | | | 1,733,348,422 | | | 1,763,037,049 | |
| | | | |
| |
| |
| |
- *
- Does not total due to rounding.
The accompanying notes on pages 70 through 104 are an integral part of the financial statements.
64
Consolidated Statement of Financial Position
(dollars in million except per share amounts)
AT DECEMBER 31:
| | NOTES
| | 2002
| | 2001*
| |
|---|
| ASSETS | | | | | | | | | |
| Current assets: | | | | | | | | | |
| Cash and cash equivalents | | | | $ | 5,382 | | $ | 6,330 | |
| Marketable securities | | D | | | 593 | | | 63 | |
| Notes and accounts receivable—trade, net of allowances | | | | | 9,915 | | | 9,101 | |
| Short-term financing receivables | | F | | | 15,996 | | | 16,656 | |
| Other accounts receivable | | | | | 1,447 | | | 1,261 | |
| Inventories | | E | | | 3,148 | | | 4,304 | |
| Deferred taxes | | P | | | 2,617 | | | 2,402 | |
| Prepaid expenses and other current assets | | | | | 2,554 | | | 2,344 | |
| | | | |
| |
| |
| Total current assets | | | | | 41,652 | | | 42,461 | |
| | | | |
| |
| |
| Plant, rental machines and other property | | G | | | 36,083 | | | 38,375 | |
| Less: Accumulated depreciation | | | | | 21,643 | | | 21,871 | |
| | | | |
| |
| |
| Plant, rental machines and other property—net | | | | | 14,440 | | | 16,504 | |
| | | | |
| |
| |
| Long-term financing receivables | | F | | | 11,440 | | | 12,246 | |
| Prepaid pension assets | | W | | | 16,003 | | | 11,397 | |
| Investments and sundry assets | | H | | | 8,834 | | | 6,417 | |
| Goodwill | | I | | | 4,115 | | | 1,278 | |
| | | | |
| |
| |
| TOTAL ASSETS | | | | $ | 96,484 | | $ | 90,303 | |
| | | | |
| |
| |
| LIABILITIES AND STOCKHOLDERS' EQUITY | | | | | | | | | |
| Current liabilities: | | | | | | | | | |
| Taxes | | P | | $ | 5,476 | | $ | 4,644 | |
| Short-term debt | | K & L | | | 6,031 | | | 11,188 | |
| Accounts payable | | | | | 7,630 | | | 7,047 | |
| Compensation and benefits | | | | | 3,724 | | | 3,796 | |
| Deferred income | | | | | 5,276 | | | 4,223 | |
| Other accrued expenses and liabilities | | | | | 6,413 | | | 4,221 | |
| | | | |
| |
| |
| Total current liabilities | | | | | 34,550 | | | 35,119 | |
| | | | |
| |
| |
| Long-term debt | | K & L | | | 19,986 | | | 15,963 | |
| Retirement and nonpension postretirement benefit obligations | | W | | | 13,215 | | | 10,308 | |
| Other liabilities | | M | | | 5,951 | | | 5,465 | |
| | | | |
| |
| |
| TOTAL LIABILITIES | | | | | 73,702 | | | 66,855 | |
| | | | |
| |
| |
| Contingencies | | O | | | | | | | |
| Stockholders' equity: | | N | | | | | | | |
| Common stock, par value $.20 per share | | | | | 14,858 | | | 14,248 | |
| | Shares authorized: 4,687,500,000 | | | | | | | | | |
| | Shares issued (2002—1,920,957,772; 2001—1,913,513,218) | | | | | | | | | |
| Retained earnings | | | | | 31,555 | | | 30,142 | |
| Treasury stock, at cost (shares: 2002—198,590,876; 2001—190,319,489) | | | | | (20,213 | ) | | (20,114 | ) |
| Accumulated gains and (losses) not affecting retained earnings | | | | | (3,418 | ) | | (828 | ) |
| | | | |
| |
| |
| TOTAL STOCKHOLDERS' EQUITY | | | | | 22,782 | | | 23,448 | |
| | | | |
| |
| |
| TOTAL LIABILITIES AND STOCKHOLDERS' EQUITY | | | | $ | 96,484 | | $ | 90,303 | |
| | | | |
| |
| |
- *
- Reclassified to conform with 2002 presentation.
The accompanying notes on pages 70 through 104 are an integral part of the financial statements.
65
Consolidated Statement of Stockholders' Equity
(dollars in millions)
| | PREFERRED
STOCK
| | COMMON
STOCK
| | RETAINED
EARNINGS
| | TREASURY
STOCK
| | EMPLOYEE
BENEFITS
TRUST
| | ACCUMULATED
GAINS AND
(LOSSES) NOT
AFFECTING
RETAINED
EARNINGS
| | TOTAL
| |
|---|
| 2000* | | | | | | | | | | | | | | | | | | | | | | |
| Stockholders' equity, January 1, 2000 | | $ | 247 | | $ | 11,762 | | $ | 16,878 | | $ | (7,375 | ) | $ | (2,162 | ) | $ | 1,076 | | $ | 20,426 | |
| Net income plus gains and (losses) not affecting retained earnings: | | | | | | | | | | | | | | | | | | | | | | |
| | Net income | | | | | | | | | 8,093 | | | | | | | | | | | $ | 8,093 | |
| | | | | | | | | | | | | | | | | | | | |
| |
| | Gains and (losses) not affecting retained earnings (net of tax): | | | | | | | | | | | | | | | | | | | | | | |
| | | Foreign currency translation adjustments (net of tax expense of $289) | | | | | | | | | | | | | | | | | | (538 | ) | | (538 | ) |
| | | Minimum pension liability adjustment (net of tax expense of $12) | | | | | | | | | | | | | | | | | | 18 | | | 18 | |
| | | Net unrealized losses on marketable securities (net of tax benefit of $506) | | | | | | | | | | | | | | | | | | (925 | ) | | (925 | ) |
| | | | | | | | | | | | | | | | | | | | |
| |
| | Total gains and (losses) not affecting retained earnings | | | | | | | | | | | | | | | | | | | | | (1,445 | ) |
| | | | | | | | | | | | | | | | | | | | |
| |
| Subtotal: Net income plus gains and (losses) not affecting retained earnings | | | | | | | | | | | | | | | | | | | | $ | 6,648 | |
| | | | | | | | | | | | | | | | | | | | |
| |
| Cash dividends declared—common stock | | | | | | | | | (909 | ) | | | | | | | | | | | (909 | ) |
| Cash dividends declared—preferred stock | | | | | | | | | (20 | ) | | | | | | | | | | | (20 | ) |
| Common stock issued under employee plans (17,275,350 shares) | | | | | | 615 | | | 1 | | | | | | | | | | | | 616 | |
| Purchases (8,799,382 shares) and sales (9,074,212 shares) of treasury stock under employee plans—net | | | | | | | | | (259 | ) | | 6 | | | | | | | | | (253 | ) |
| Other treasury shares purchased, not retired (58,867,226 shares) | | | | | | | | | | | | (6,431 | ) | | | | | | | | (6,431 | ) |
| Fair value adjustment of employee benefits trust | | | | | | (439 | ) | | | | | | | | 450 | | | | | | 11 | |
| Increase due to shares remaining to be issued in acquisition | | | | | | 40 | | | | | | | | | | | | | | | 40 | |
| Tax effect—stock transactions | | | | | | 422 | | | | | | | | | | | | | | | 422 | |
| | |
| |
| |
| |
| |
| |
| |
| |
| Stockholders' equity, December 31, 2000 | | $ | 247 | | $ | 12,400 | | $ | 23,784 | | $ | (13,800 | ) | $ | (1,712 | ) | $ | (369 | ) | $ | 20,550 | |
| | |
| |
| |
| |
| |
| |
| |
| |
- *
- Reclassified to conform with 2002 presentation.
66
(dollars in millions)
| | PREFERRED
STOCK
| | COMMON
STOCK
| | RETAINED
EARNINGS
| | TREASURY
STOCK
| | EMPLOYEE
BENEFITS
TRUST
| | ACCUMULATED
GAINS AND
(LOSSES) NOT
AFFECTING
RETAINED
EARNINGS
| | TOTAL
| |
|---|
| 2001* | | | | | | | | | | | | | | | | | | | | | | |
| Stockholders' equity, December 31, 2000 | | $ | 247 | | $ | 12,400 | | $ | 23,784 | | $ | (13,800 | ) | $ | (1,712 | ) | $ | (369 | ) | $ | 20,550 | |
| Net income plus gains and (losses) not affecting retained earnings: | | | | | | | | | | | | | | | | | | | | | | |
| | Net income | | | | | | | | | 7,723 | | | | | | | | | | | $ | 7,723 | |
| | | | | | | | | | | | | | | | | | | | |
| |
| | Gains and (losses) not affecting retained earnings (net of tax): | | | | | | | | | | | | | | | | | | | | | | |
| | | Cumulative effect of adoption of SFAS No. 133 on Jan. 1 (net of tax expense of $120) | | | | | | | | | | | | | | | | | | 219 | | | 219 | |
| | | Net unrealized gains on SFAS No. 133 cash flow hedge derivatives during 2001 (net of tax expense of $44) | | | | | | | | | | | | | | | | | | 77 | | | 77 | |
| | | Foreign currency translation adjustments (net of tax expense of $323) | | | | | | | | | | | | | | | | | | (539 | ) | | (539 | ) |
| | | Minimum pension liability adjustment (net of tax benefit of $226) | | | | | | | | | | | | | | | | | | (308 | ) | | (308 | ) |
| | | Net unrealized gains on marketable securities (net of tax expense of $58) | | | | | | | | | | | | | | | | | | 92 | | | 92 | |
| | | | | | | | | | | | | | | | | | | | |
| |
| | Total gains and (losses) not affecting retained earnings | | | | | | | | | | | | | | | | | | | | | (459 | ) |
| | | | | | | | | | | | | | | | | | | | |
| |
| Subtotal: Net income plus gains and (losses) not affecting retained earnings | | | | | | | | | | | | | | | | | | | | $ | 7,264 | |
| | | | | | | | | | | | | | | | | | | | |
| |
| Cash dividends declared—common stock | | | | | | | | | (956 | ) | | | | | | | | | | | (956 | ) |
| Cash dividends declared—preferred stock | | | | | | | | | (10 | ) | | | | | | | | | | | (10 | ) |
| Preferred stock purchased and retired (10,184,043 shares) | | | (247 | ) | | | | | (7 | ) | | | | | | | | | | | (254 | ) |
| Common stock issued under employee plans (19,572,623 shares) | | | | | | 774 | | | (1 | ) | | | | | | | | | | | 773 | |
| Purchases (2,237,935 shares) and sales (11,801,053 shares) of treasury stock under employee plans—net | | | | | | 32 | | | (391 | ) | | 1,032 | | | | | | | | | 673 | |
| Other treasury shares purchased, not retired (48,841,196 shares) | | | | | | | | | | | | (5,091 | ) | | | | | | | | (5,091 | ) |
| Dissolution of employee benefits trust (20,000,000 shares) | | | | | | 546 | | | | | | (2,255 | ) | | 1,712 | | | | | | 3 | |
| Decrease in shares remaining to be issued in acquisition | | | | | | (6 | ) | | | | | | | | | | | | | | (6 | ) |
| Tax effect—stock transactions | | | | | | 502 | | | | | | | | | | | | | | | 502 | |
| | |
| |
| |
| |
| |
| |
| |
| |
| Stockholders' equity, December 31, 2001 | | $ | — | | $ | 14,248 | | $ | 30,142 | | $ | (20,114 | ) | $ | — | | $ | (828 | ) | $ | 23,448 | |
| | |
| |
| |
| |
| |
| |
| |
| |
* Reclassified to conform with 2002 presentation.
67
(dollars in millions)
| | COMMON
STOCK
| | RETAINED
EARNINGS
| | TREASURY
STOCK
| | EMPLOYEE
BENEFITS
TRUST
| | ACCUMULATED
GAINS AND
(LOSSES) NOT
AFFECTING
RETAINED
EARNINGS
| | TOTAL
| |
|---|
| 2002 | | | | | | | | | | | | | | | | | | | |
| Stockholders' equity, December 31, 2001 | | $ | 14,248 | | $ | 30,142 | | $ | (20,114 | ) | $ | — | | $ | (828 | ) | $ | 23,448 | |
| Net income plus gains and (losses) not affecting retained earnings: | | | | | | | | | | | | | | | | | | | |
| | Net income | | | | | | 3,579 | | | | | | | | | | | $ | 3,579 | |
| | | | | | | | | | | | | | | | | |
| |
| | Gains and (losses) not affecting retained earnings (net of tax): | | | | | | | | | | | | | | | | | | | |
| | | Net unrealized losses on SFAS No. 133 cash flow hedge derivatives during 2002 (net of tax benefit of $372) | | | | | | | | | | | | | | | (659 | ) | | (659 | ) |
| | | Foreign currency translation adjustments (net of tax benefit of $197) | | | | | | | | | | | | | | | 850 | | | 850 | |
| | | Minimum pension liability adjustment (net of tax benefit of $1,574) | | | | | | | | | | | | | | | (2,765 | ) | | (2,765 | ) |
| | | Net unrealized losses on marketable securities (net of tax benefit of $8) | | | | | | | | | | | | | | | (16 | ) | | (16 | ) |
| | | | | | | | | | | | | | | | | |
| |
| | Total gains and (losses) not affecting retained earnings | | | | | | | | | | | | | | | | | | (2,590 | ) |
| | | | | | | | | | | | | | | | | |
| |
| Subtotal: Net income plus gains and (losses) not affecting retained earnings | | | | | | | | | | | | | | | | | $ | 989 | |
| | | | | | | | | | | | | | | | | |
| |
| Cash dividends declared—common stock | | | | | | (1,005 | ) | | | | | | | | | | | (1,005 | ) |
| Common stock issued under employee plans (7,255,995 shares) | | | 440 | | | 4 | | | | | | | | | | | | 444 | |
| Purchases (1,169,043 shares) and sales (12,873,502 shares) of treasury stock under employee plans—net | | | | | | (475 | ) | | 1,210 | | | | | | | | | 735 | |
| Other treasury shares purchased, not retired (47,501,854 shares) | | | | | | | | | (4,111 | ) | | | | | | | | (4,111 | ) |
| Treasury shares issued to fund the U.S. pension fund (24,037,354 shares) | | | | | | (576 | ) | | 2,447 | | | | | | | | | 1,871 | |
| Shares issued/to be issued in the PwCC acquisition (3,677,213 shares issued) | | | 43 | | | (114 | ) | | 355 | | | | | | | | | 284 | |
| Decrease in shares remaining to be issued in acquisition | | | (9 | ) | | | | | | | | | | | | | | (9 | ) |
| Tax effect—stock transactions | | | 136 | | | | | | | | | | | | | | | 136 | |
| | |
| |
| |
| |
| |
| |
| |
| Stockholders' equity, December 31, 2002 | | $ | 14,858 | | $ | 31,555 | | $ | (20,213 | ) | $ | — | | $ | (3,418 | ) | $ | 22,782 | |
| | |
| |
| |
| |
| |
| |
| |
The accompanying notes on pages 70 through 104 are an integral part of the financial statements.
68
Consolidated Statement of Cash Flows
(dollars in millions)
FOR THE YEAR ENDED DECEMBER 31:
| | 2002
| | 2001*
| | 2000*
| |
|---|
| CASH FLOW FROM OPERATING ACTIVITIES FROM CONTINUING OPERATIONS: | | | | | | | | | | |
| Income from continuing operations | | $ | 5,334 | | $ | 8,146 | | $ | 7,874 | |
| Adjustments to reconcile net income from continuing operations to cash provided by operating activities: | | | | | | | | | | |
| Depreciation | | | 3,691 | | | 3,881 | | | 4,224 | |
| Amortization of software | | | 688 | | | 625 | | | 482 | |
| Deferred income taxes | | | (67 | ) | | 664 | | | 44 | |
| Net gain on assets sales and other | | | (343 | ) | | (340 | ) | | (751 | ) |
| Other than temporary declines in securities and other investments | | | 58 | | | 405 | | | — | |
| Noncash portion of special actions | | | 1,350 | | | — | | | — | |
| Change in operating assets and liabilities, net of acquisitions/divestitures: | | | | | | | | | | |
| | Receivables | | | 4,125 | | | 2,837 | | | (4,692 | ) |
| | Inventories | | | 793 | | | 287 | | | (22 | ) |
| | Pension assets | | | (4,227 | ) | | (1,758 | ) | | (1,333 | ) |
| | Other assets | | | 70 | | | 1,244 | | | 673 | |
| | Accounts payable | | | (55 | ) | | (918 | ) | | 2,134 | |
| | Pension liabilities | | | 83 | | | (69 | ) | | (237 | ) |
| | Other liabilities | | | 2,288 | | | (1,038 | ) | | 441 | |
| | |
| |
| |
| |
| NET CASH PROVIDED BY OPERATING ACTIVITIES FROM CONTINUING OPERATIONS | | | 13,788 | | | 13,966 | | | 8,837 | |
| | |
| |
| |
| |
| CASH FLOW FROM INVESTING ACTIVITIES FROM CONTINUING OPERATIONS: | | | | | | | | | | |
| Payments for plant, rental machines and other property | | | (4,753 | ) | | (5,400 | ) | | (5,319 | ) |
| Proceeds from disposition of plant, rental machines and other property | | | 775 | | | 1,149 | | | 1,569 | |
| Investment in software | | | (597 | ) | | (655 | ) | | (565 | ) |
| Purchases of marketable securities and other investments | | | (1,582 | ) | | (778 | ) | | (750 | ) |
| Proceeds from disposition of marketable securities and other investments | | | 1,185 | | | 738 | | | 1,393 | |
| Divestiture of businesses | | | 1,233 | | | — | | | — | |
| Acquisition of businesses | | | (3,158 | ) | | (916 | ) | | (329 | ) |
| | |
| |
| |
| |
| NET CASH USED IN INVESTING ACTIVITIES FROM CONTINUING OPERATIONS | | | (6,897 | ) | | (5,862 | ) | | (4,001 | ) |
| | |
| |
| |
| |
| CASH FLOW FROM FINANCING ACTIVITIES FROM CONTINUING OPERATIONS: | | | | | | | | | | |
| Proceeds from new debt | | | 6,726 | | | 4,535 | | | 9,604 | |
| Short-term (repayments)/borrowings less than 90 days—net | | | (4,087 | ) | | 2,926 | | | (1,400 | ) |
| Payments to settle debt | | | (5,812 | ) | | (7,898 | ) | | (7,561 | ) |
| Preferred stock transactions—net | | | — | | | (254 | ) | | — | |
| Common stock transactions—net | | | (3,087 | ) | | (3,652 | ) | | (6,073 | ) |
| Cash dividends paid | | | (1,005 | ) | | (966 | ) | | (929 | ) |
| | |
| |
| |
| |
| NET CASH USED IN FINANCING ACTIVITIES FROM CONTINUING OPERATIONS | | | (7,265 | ) | | (5,309 | ) | | (6,359 | ) |
| | |
| |
| |
| |
| Effect of exchange rate changes on cash and cash equivalents | | | 148 | | | (83 | ) | | (147 | ) |
| Net cash (used in)/provided by discontinued operations | | | (722 | ) | | 55 | | | 190 | |
| | |
| |
| |
| |
| Net change in cash and cash equivalents | | | (948 | ) | | 2,767 | | | (1,480 | ) |
| Cash and cash equivalents at January 1 | | | 6,330 | | | 3,563 | | | 5,043 | |
| | |
| |
| |
| |
| CASH AND CASH EQUIVALENTS AT DECEMBER 31 | | $ | 5,382 | | $ | 6,330 | | $ | 3,563 | |
| | |
| |
| |
| |
| SUPPLEMENTAL DATA: | | | | | | | | | | |
| Cash paid during the year for the total company: | | | | | | | | | | |
| Income taxes | | $ | 1,841 | | $ | 2,279 | | $ | 2,697 | |
| Interest | | $ | 831 | | $ | 1,247 | | $ | 1,447 | |
| | |
| |
| |
| |
NONCASH INVESTING AND FINANCING ACTIVITIES:
The noncash portion of the purchase price paid for PwCC is a significant noncash investing activity. This transaction is described on page 78.
- *
- Reclassified to conform with 2002 presentation.
The acompanying notes on pages 70 through 104 are an integral part of the financial statements.
69
Notes to Consolidated Financial Statements
A Significant Accounting Policies
Basis of Presentation
On December 31, 2002, the company sold its hard disk drive (HDD) business to Hitachi, Ltd. (Hitachi). See note C, "Acquisitions/Divestitures," on pages 78 to 80. The HDD business was part of the company's Technology Group reporting segment. The HDD business was accounted for as a discontinued operation under generally accepted accounting principles (GAAP) and therefore, the HDD results of operations and cash flows have been removed from the company's results of continuing operations and cash flows for all periods presented in this document. The financial results reported as discontinued operations include the external original equipment manufacturer (OEM) HDD business and charges related to HDDs used in the company's eServer and Storage products that were reported in the Technology Group segment. The discontinued operations results do not reflect HDD shipments to the company's internal customers.
Principles of Consolidation
The Consolidated Financial Statements include the accounts of International Business Machines Corporation (IBM) and its controlled subsidiary companies, which in general are majority owned. Investments in business entities in which the company does not have control, but has the ability to exercise significant influence over operating and financial policies (generally 20-50 percent ownership), are accounted for by the equity method. Other investments are accounted for by the cost method. The accounting policy for other investments in securities is described on page 74 within "Marketable Securities."
Use of Estimates
The preparation of Consolidated Financial Statements in conformity with GAAP requires management to make estimates and assumptions that affect the amounts that are reported in the Consolidated Financial Statements and accompanying disclosures. Although these estimates are based on management's best knowledge of current events and actions that the company may undertake in the future, actual results may be different from the estimates.
Revenue
The company recognizes revenue when it is realized or realizable and earned. The company considers revenue realized or realizable and earned when it has persuasive evidence of an arrangement, the product has been shipped or the services have been provided to the customer, the sales price is fixed or determinable and collectibility is reasonably assured. The company reduces revenue for estimated customer returns and other allowances. In addition to the aforementioned general policy, the following are the specific revenue recognition policies for each major category of revenue and for multiple-element arrangements.
SERVICES
The terms of services contracts generally range from less than one year to ten years. Revenue from time and material services contracts is recognized as the services are provided. Revenue from Strategic Outsourcing Services contracts in which IBM manages the customer's data center reflects the extent of actual services delivered in the period, based upon objective measures of output in accordance with the terms of the contract.
Revenue from Business Consulting Services (BCS) contracts that require IBM to design, develop, manufacture or modify complex information technology systems to a buyer's specifications, and to provide services related to the performance of such contracts, is recognized using the percentage of completion (POC) method of accounting. In using the POC method, the company records revenue by reference to the costs incurred to date and the estimated costs remaining to fulfill the contracts.
Provisions for losses on services contracts are recognized during the period in which the loss first becomes apparent. Revenue from maintenance is recognized over the contractual period or as the services are performed.
In some of the company's services contracts, the company bills the customer prior to performing the services. This situation gives rise to deferred income of $2.6 billion and $2.4 billion at December 31, 2002 and 2001, respectively, reported as Deferred income in the Consolidated Statement of Financial Position. In other services contracts, the company performs the services prior to billing the customer. This situation gives rise to unbilled accounts receivable of $1.3 billion at both December 31, 2002 and 2001, recorded as Notes and accounts receivable—trade in the Consolidated Statement of Financial Position. In these circumstances, billings usually occur shortly after the company performs the services and can range up to six months later. Unbilled receivables are expected to be billed and collected generally within four months, rarely exceeding nine months.
HARDWARE
Revenue from hardware sales or sales-type leases is recognized when the product is shipped to the customer and when there are no unfulfilled company obligations that affect the customer's final acceptance of the arrangement. Any cost of these obligations is accrued when the corresponding revenue is recognized. Revenue from rentals and operating leases is recognized on a straight-line basis over the term of the rental or lease.
SOFTWARE
Revenue from one-time charge licensed software is recognized at the inception of the license term. Revenue from monthly license charge arrangements is recognized on a subscription basis over the period in which the enterprise is using the
70
program. Revenue from maintenance, unspecified upgrades and technical support is recognized over the period such items are delivered. See "Multiple-Element Arrangements" below for further information.
FINANCING
Finance income attributable to sales-type leases, direct financing leases and loans is recognized at level rates of return over the term of the leases or loans. Operating lease income is recognized on a straight-line basis over the term of the lease.
MULTIPLE-ELEMENT ARRANGEMENTS
The company enters into transactions that include multiple-element arrangements, which may include any combination of services, hardware, software and/or financing. When some elements are delivered prior to others in an arrangement and all of the following criteria are met, revenue for the delivered element is recognized upon delivery of such item. Otherwise, revenue is deferred until the delivery of the last element.
- •
- Vendor-specific objective evidence (VSOE) of fair value of the undelivered elements.
- •
- The functionality of the delivered elements is not dependent on the undelivered elements.
- •
- Delivery of the delivered element represents the culmination of the earnings process.
VSOE is the price charged by the company to an external customer for the same element when such element is sold separately.
Expense and Other Income
SELLING, GENERAL AND ADMINISTRATIVE
Selling, general and administrative (SG&A) expense is charged to income as incurred. Expenses of promoting and selling products and services are classified as selling expense and include such items as advertising, sales commissions and travel. General and administrative expense includes such items as officers' salaries, office supplies, non-income taxes, insurance and office rental. In addition, general and administrative expense includes other operating items such as a provision for doubtful accounts, workforce accruals for contractually obligated payments to employees terminated in the ongoing course of business, amortization of intangible assets and environmental remediation costs. Certain special actions discussed in note S "2002 Actions" on pages 90 through 92 are also included in SG&A. The cost of internal environmental protection programs that are preventive in nature are expensed as incurred. The company accrues for all known environmental liabilities when it becomes probable that the company will incur cleanup costs and those costs can be reasonably estimated. In addition, estimated environmental costs that are associated with post-closure activities (for example, the removal and restoration of chemical storage facilities and monitoring) are accrued when the decision is made to close a facility.
RESEARCH, DEVELOPMENT AND ENGINEERING
Research, development and engineering (RD&E) costs are expensed as incurred.
INTELLECTUAL PROPERTY AND CUSTOM DEVELOPMENT INCOME
As part of the company's ongoing business model and as a result of the company's ongoing investment in research and development (R&D), the company licenses and sells the rights to certain of its intellectual property (IP) including internally developed patents, trade secrets and technological know-how. Certain transfers of IP to third parties are licensing/royalty fee based and other transfers are transaction-based sales and other transfers. Licensing/royalty-based fees involve transfers in which the company earns the income over time or the amount of income is not fixed and determinable until the licensee sells future related products (i.e., variable royalty, based upon licensee's revenue). Sales and other transfers typically include transfers of IP whereby the company has fulfilled its obligations and the fee received is fixed and determinable. The company also earns income from certain custom development projects for specific customers. The company records the income from these projects when the fee is earned, is not refundable, and is not dependent upon the success of the project.
OTHER (INCOME) AND EXPENSE
Other (income) and expense includes interest income (other than from the company's Global Financing business transactions), gains and losses from securities and other investments, realized gains and losses from certain real estate activity, and foreign currency transaction gains and losses.
Depreciation and Amortization
Plant, rental machines and other property are carried at cost and depreciated over their estimated useful lives using the straight-line method.
The estimated useful lives of depreciable properties generally are as follows: buildings, 50 years; building equipment, 20 years; land improvements, 20 years; plant, laboratory and office equipment, 2 to 15 years; and computer equipment, 1.5 to 5 years.
Capitalized software costs incurred or acquired after technological feasibility are amortized over periods up to 3 years. See "Software Costs" on page 74 for additional information. Other intangible assets are amortized for periods up to 7 years. See "Standards Implemented" on pages 75 and 76 for additional information on goodwill.
Retirement-Related Benefits
See note W, "Retirement-Related Benefits," on pages 95 to 100 for the company's accounting policy for retirement-related benefits.
71
Stock-Based Compensation
The company applies Accounting Principles Board (APB) Opinion No. 25, "Accounting for Stock Issued to Employees," and related Interpretations in accounting for its stock-based compensation plans. Accordingly, the company records expense for employee stock compensation plans equal to the excess of the market price of the underlying IBM shares at the date of grant over the exercise price of the stock-related award, if any (known as the intrinsic value). Generally, all employee stock options are issued with the exercise price equal to the market price of the underlying shares at the grant date and therefore, no compensation expense is recorded. In addition, no compensation expense is recorded for purchases under the Employees Stock Purchase Plan (ESPP) in accordance with APB Opinion No. 25. This plan is described on pages 94 and 95. The intrinsic value of restricted stock units and certain other stock-based compensation issued to employees as of the date of grant is amortized to compensation expense over the vesting period. To the extent there are performance criteria that could result in an employee receiving more or less (including zero) shares than the number of units granted, the unamortized liability is marked to market during the performance period based upon the intrinsic value at the end of each quarter.
The following table summarizes the pro forma operating results of the company had compensation cost for stock options granted and for employee stock purchases under the ESPP (see note V, "Stock-Based Compensation Plans" on pages 94 and 95) been determined in accordance with the fair value based method prescribed by Statement of Financial Accounting Standards (SFAS) No. 123, "Accounting for Stock-Based Compensation."
| |
| |
| |
|
|---|
(dollars in millions except per share amounts)
FOR THE YEAR ENDED DECEMBER 31:
| | 2002
| | 2001
| | 2000
|
|---|
| Net income applicable to common stockholders, as reported | | $ | 3,579 | | $ | 7,713 | | $ | 8,073 |
| Add: Stock-based employee compensation expense included in reported net income, net of related tax effects | | | 112 | | | 104 | | | 82 |
| Deduct: Total stock-based employee compensation expense determined under fair value method for all awards, net of related tax effects | | | 1,315 | | | 1,343 | | | 972 |
| | |
| |
| |
|
| Pro forma net income | | $ | 2,376 | | $ | 6,474 | | $ | 7,183 |
| | |
| |
| |
|
| Earnings per share: | | | | | | | | | |
| | Basic—as reported | | $ | 2.10 | | $ | 4.45 | | $ | 4.58 |
| | Basic—pro forma | | $ | 1.40 | | $ | 3.74 | | $ | 4.07 |
| | Assuming dilution—as reported | | $ | 2.06 | | $ | 4.35 | | $ | 4.44 |
| | Assuming dilution—pro forma | | $ | 1.39 | | $ | 3.69 | | $ | 3.99 |
The pro forma amounts that are disclosed in accordance with SFAS No. 123 reflect the portion of the estimated fair value of awards that was earned for the years ended December 31, 2002, 2001 and 2000.
The fair value of stock option grants is estimated using the Black-Scholes option-pricing model with the following assumptions:
FOR THE YEAR ENDED DECEMBER 31:
| | 2002
| | 2001
| | 2000
| |
|---|
| Term (years)* | | | 5 | | | 4/5 | | | 4/5 | |
| Volatility** | | | 40.4 | % | | 37.7 | % | | 32.0 | % |
| Risk-free interest rate (zero coupon U.S. treasury note) | | | 2.8 | % | | 4.4 | % | | 5.1 | % |
| Dividend yield | | | 0.7 | % | | 0.5 | % | | 0.5 | % |
| Weighted-average fair value per option | | $ | 28 | | $ | 42 | | $ | 36 | |
- *
- There were no tax incentive options granted in 2002. Option term is 5 years for non-tax incentive options for the year ended December 31, 2002. Option term is 4 years for tax incentive options and 5 years for non-tax incentive options for the years ended December 31, 2001 and 2000.
- **
- To determine volatility, the company measured the daily price changes of the stock over the respective term for tax incentive options and non-tax incentive options.
Income Taxes
Income tax expense is based on reported income before income taxes. Deferred income taxes reflect the effect of temporary differences between asset and liability amounts that are recognized for financial reporting purposes and the amounts that are recognized for income tax purposes. These deferred taxes are measured by applying currently enacted tax laws. Valuation allowances are recognized to reduce the deferred tax assets to the amount that is more likely than not to be realized. In assessing the likelihood of realization, management considers estimates of future taxable income.
Translation of Non-U.S. Currency Amounts
Assets and liabilities of non-U.S. subsidiaries that operate in a local currency environment are translated to U.S. dollars at year-end exchange rates. Income and expense items are translated at weighted-average rates of exchange prevailing during the year. Translation adjustments are recorded in Accumulated gains and (losses) not affecting retained earnings within Stockholders' equity.
Inventories, Plant, rental machines and other property-net, and other non-monetary assets and liabilities of non-U.S. subsidiaries and branches that operate in U.S. dollars, or whose economic environment is highly inflationary, are translated at approximate exchange rates prevailing when the company acquired the assets or liabilities. All other assets and liabilities are translated at year-end exchange rates. Cost of sales and depreciation are translated at historical exchange rates. All other income and expense items are translated at the weighted-average rates of exchange prevailing during the year. Gains and losses that result from translation are included in net income.
72
Derivatives
All derivatives are recognized in the Consolidated Statement of Financial Position at fair value and are reported in Prepaid expenses and other current assets, Investments and sundry assets, Other accrued expenses and liabilities or Other liabilities in the Consolidated Statement of Financial Position. Classification of each derivative as current or non-current is based upon whether the maturity of each instrument is less than or greater than 12 months. To qualify for hedge accounting in accordance with SFAS No. 133, "Accounting for Derivative Instruments and Hedging Activities," as amended by SFAS No. 138, "Accounting for Certain Derivative Instruments and Certain Hedging Activities," (SFAS No. 133), the company requires that the instruments are effective in reducing the risk exposure that they are designated to hedge. For instruments that are associated with the hedge of cash flows, hedge effectiveness criteria also require that it be probable that the underlying transaction will occur. Instruments that meet established accounting criteria are formally designated as hedges at the inception of the contract. These criteria demonstrate that the derivative is expected to be highly effective at offsetting changes in fair value or cash flows of the underlying exposure both at inception of the hedging relationship and on an ongoing basis. The assessment for effectiveness is formally documented at hedge inception and reviewed at least quarterly throughout the designated hedge period.
The company applies hedge accounting in accordance with SFAS No. 133, whereby the company designates each derivative as a hedge of; (1) the fair value of a recognized asset or liability or of an unrecognized firm commitment ("fair value" hedge); (2) the variability of anticipated cash flows of a forecasted transaction or the cash flows to be received or paid related to a recognized asset or liability ("cash flow" hedge); or (3) a hedge of a long-term investment ("net investment" hedge) in a foreign operation. From time to time, however, the company may enter into derivatives that economically hedge certain of its risks, even though hedge accounting does not apply under SFAS No. 133 or is not applied by the company. In these cases, there generally exists a natural hedging relationship in which changes in fair value of the derivative, which are recognized currently in net income, act as an economic offset to changes in the fair value of the underlying hedged item(s).
Changes in the value of a derivative that is designated as a fair value hedge, along with offsetting changes in the fair value of the underlying hedged exposure, are recorded in earnings each period. For hedges of interest rate risk, the fair value adjustments are recorded as adjustments to Interest expense and Cost of Global Financing in the Consolidated Statement of Earnings. For hedges of currency risk associated with recorded assets or liabilities, derivative fair value adjustments generally are recognized in Other (income) and expense in the Consolidated Statement of Earnings. Changes in the value of a derivative that is designated as a cash flow hedge are recorded in the Accumulated gains and (losses) not affecting retained earnings, a component of Stockholders' equity. When net income is affected by the variability of the underlying cash flow, the applicable offsetting amount of the gain or loss from the derivative that is deferred in Stockholders' equity is released to net income and reported in Interest expense, Cost, SG&A expense or Other (income) and expense in the Consolidated Statement of Earnings based on the nature of the underlying cash flow hedged. Effectiveness for net investment hedging derivatives is measured on a spot to spot basis. The effective portion of changes in the fair value of derivatives and other non-derivative risk management instruments designated as net investment hedges are recorded as foreign currency translation adjustments in the Accumulated gains and (losses) not affecting retained earnings section of Stockholders' equity. Changes in the fair value of the portion of a net investment hedging derivative excluded from the effectiveness assessment are recorded in Interest expense.
When the underlying hedged item ceases to exist, all changes in the fair value of the derivative are included in net income each period until the instrument matures. When the derivative transaction ceases to exist, a hedged asset or liability is no longer adjusted for changes in its fair value except as required under other relevant accounting standards. Derivatives that are not designated as hedges, as well as changes in the value of derivatives that do not offset the underlying hedged item throughout the designated hedge period (collectively, "ineffectiveness"), are recorded in net income each period and generally are reported in Other (income) and expense. See note L, "Derivatives and Hedging Transactions," on pages 84 to 86 for a description of the major risk management programs and classes of financial instruments used by the company.
Financial Instruments
In determining fair value of its financial instruments, the company uses a variety of methods and assumptions that are based on market conditions and risks existing at each balance sheet date. For the majority of financial instruments including most derivatives, long-term investments and long-term debt, standard market conventions and techniques such as discounted cash flow analysis, option pricing models, replacement cost and termination cost are used to determine fair value. Dealer quotes are used for the remaining financial instruments. All methods of assessing fair value result in a general approximation of value, and such value may never actually be realized.
73
Cash Equivalents
All highly liquid investments with a maturity of three months or less at the date of purchase are carried at fair value and considered to be cash equivalents.
Marketable Securities
Marketable securities included in Current assets represent securities with a maturity of less than one year. The company also has Marketable securities, including non-equity method alliance investments, with a maturity of more than one year. These non-current investments are included in Investments and sundry assets. The company's Marketable securities, including certain non-equity method alliance investments, are considered available for sale and are reported at fair value with changes in unrealized gains and losses, net of applicable taxes, recorded in Accumulated gains and (losses) not affecting retained earnings within Stockholders' equity. Realized gains and losses are calculated based on the specific identification method. Other-than-temporary declines in market value from original cost are charged to Other (income) and expense in the period in which the loss occurs. In determining whether an other-than-temporary decline in the market value has occurred, the company considers the duration that and extent to which market value is below original cost. Realized gains and losses and other than temporary declines in market value from original cost are included in Other (income) and expense in the Consolidated Statement of Earnings. All other investment securities not described above or in "Principles of Consolidation" on page 70, primarily non-publicly traded equity securities, are accounted for using the cost method.
Inventories
Raw materials, work in process and finished goods are stated at the lower of average cost or net realizable value.
Allowance for Uncollectible Receivables
TRADE
An allowance for uncollectible trade receivables is recorded based on a combination of write-off history, aging analysis, and any specific known troubled accounts.
FINANCING
Below are the methodologies the company uses to calculate both its specific and its unallocated reserves, which are applied consistently to its different portfolios.
Specific
The company reviews all accounts receivable considered at risk on a quarterly basis. The review primarily consists of an analysis based upon current information available about the customer, such as financial statements, news reports, published credit ratings, the current economic environment, as well as, collateral net of repossession cost, and prior history. For loans that are collateral dependent, impairment is measured using the fair value of the collateral when foreclosure is probable. Using this information, the company determines the expected cash flow for the receivable and calculates a recommended estimate of the potential loss and the probability of loss. For those accounts where the loss is probable, the company records a specific reserve.
Unallocated
The company records an unallocated reserve that is calculated by applying a write-off rate to the total portfolio, excluding accounts that have been specifically reserved. This write-off rate is based upon write-off history and is adjusted to reflect current economic conditions.
Certain receivables that have specific reserves recorded may also be placed on nonaccrual status. Nonaccrual assets are those receivables (impaired loans or nonperforming leases) with specific reserves and other accounts for which it is likely that the company will be unable to collect all amounts due according to original terms of the lease or loan agreement. Income recognition is discontinued on these receivables. Receivables may be removed from nonaccrual status, if appropriate, based upon changes in customer circumstances.
Estimated Residual Values of Lease Assets
The recorded residual values of the company's lease assets are estimated at the inception of the lease to be the expected fair market value of the assets at the end of the lease term. In accordance with GAAP, the company reassesses the realizable value of its lease residual values, and any anticipated increases in specific future residual values are not recognized before realization through remarketing efforts. Anticipated decreases in specific future residual values that are considered to be other than temporary are recognized immediately upon identification.
Software Costs
Costs that are related to the conceptual formulation and design of licensed programs are expensed as R&D. Also, for licensed programs, the company capitalizes costs that are incurred to produce the finished product after technological feasibility is established. The annual amortization of the capitalized amounts is performed using the straight-line method, and is applied over periods ranging up to three years. The company performs periodic reviews to ensure that unamortized program costs remain recoverable from future revenue. Costs to support or service licensed programs are expensed as the costs are incurred.
The company capitalizes certain costs that are incurred to purchase or to create and implement internal-use computer software, which includes software coding, installation, testing and data conversion. Capitalized costs are amortized on a straight-line basis over two years.
74
Common Stock
Common stock refers to the $.20 par value capital stock as designated in the company's Certificate of Incorporation. Treasury stock is accounted for using the cost method. When treasury stock is reissued, the value is computed and recorded using a weighted-average basis.
Product Warranties
The company estimates its warranty costs based on historical warranty claim experience and applies this estimate to the revenue stream for products under warranty. Included in the company's warranty accrual are costs for limited warranties and extended warranty coverage. Future costs for warranties applicable to revenue recognized in the current period are charged to cost of revenue. The warranty accrual is reviewed quarterly to verify that it properly reflects the remaining obligation based on the anticipated expenditures over the balance of the obligation period. Adjustments are made when actual warranty claim experience differs from estimates.
Earnings Per Share of Common Stock
Earnings per share of common stock—basic is computed by dividing Net income applicable to common stockholders by the weighted-average number of common shares outstanding for the period. Earnings per share of common stock—assuming dilution reflects the maximum potential dilution that could occur if securities or other contracts to issue common stock were exercised or converted into common stock and would then share in the net income of the company. See note T, "Earnings Per Share of Common Stock," on page 93 for additional information.
B Accounting Changes
Standards Implemented
In April 2002, the Financial Accounting Standards Board (FASB) issued SFAS No. 145, "Rescission of FASB Statements No. 4, 44 and 64, Amendment of FASB Statement No. 13, and Technical Corrections," effective May 15, 2002. SFAS No. 145 eliminates the requirement that gains and losses from the extinguishment of debt be aggregated and classified as an extraordinary item, net of tax, and makes certain other technical corrections. SFAS No. 145 did not have a material effect on the company's Consolidated Financial Statements.
Effective January 1, 2002, the company adopted Statement of Financial Position ("SOP") 01-6, "Accounting by Certain Entities (including entities with Trade Receivables) That Lend to or Finance the Activities of Others." With limited exception, SOP 01-6 applies to any entity that lends to or finances the activities of, others and provides specialized guidance for certain transactions specific to financial institutions. This SOP reconciles and conforms, as appropriate, the accounting and financial reporting guidance established by the American Institute of Certified Public Accountants. The adoption did not have a material effect on the company's Consolidated Financial Statements.
In October 2001, the FASB issued SFAS No. 144, "Accounting for the Impairment or Disposal of Long-Lived Assets." SFAS No. 144 addresses significant issues relating to the implementation of SFAS No. 121, "Accounting for the Impairment of Long-Lived Assets and for Long-Lived Assets to Be Disposed Of," and develops a single accounting model, based on the framework established in SFAS No. 121 for long-lived assets to be disposed of by sale, whether such assets are or are not deemed to be a business. SFAS No. 144 also modifies the accounting and disclosure rules for discontinued operations. The standard was adopted on January 1, 2002, and did not have a material impact on the company's Consolidated Financial Statements. The discontinued HDD operations are presented in the Consolidated Financial Statements in accordance with the new SFAS No. 144 rules.
In November 2001, the FASB issued Emerging Issues Task Force (EITF) Issue No. 01-14, "Income Statement Characterization of Reimbursements Received for 'Out of Pocket' Expenses Incurred." This guidance requires companies to recognize the recovery of reimbursable expenses such as travel costs on services contracts as revenue. These costs are not to be netted as a reduction of cost. This guidance was effective January 1, 2002. This guidance did not have a material effect on the company's Consolidated Financial Statements due to the company's billing practices. For instance, outside the United States, almost all of the company's contracts involve fixed billings that are designed to recover all costs, including out-of-pocket costs. Therefore, the "reimbursement" of these costs is already recorded in revenue.
In July 2001, the FASB issued SFAS No. 141, "Business Combinations," and SFAS No. 142, "Goodwill and Other Intangible Assets." SFAS No. 141 requires the use of the purchase method of accounting for business combinations and prohibits the use of the pooling of interests method. Under the previous rules, the company used the purchase method of accounting. SFAS No. 141 also refines the definition of intangible assets acquired in a purchase business combination. As a result, the purchase price allocation of current business combinations may be different than the allocation that would have resulted under the old rules. Business combinations must be accounted for using SFAS No. 141 effective July 1, 2001.
SFAS No. 142 eliminates the amortization of goodwill, requires annual impairment testing of goodwill and introduces the concept of indefinite life intangible assets. The company adopted SFAS No. 142 on January 1, 2002. The new rules also prohibit the amortization of goodwill associated with business combinations that closed after June 30, 2001.
75
In accordance with SFAS No. 141, the unamortized balance for acquired assembled workforce of $33 million, which had been recognized as an intangible asset separate from goodwill, has been reclassified to goodwill effective January 1, 2002. In addition, an initial goodwill impairment test was required to be performed in 2002 as of January 1, 2002. This initial test and the company's first annual goodwill impairment test, performed as of October 1, 2002, resulted in no goodwill impairment charges.
The following table presents reported Income from continuing operations and income adjusted to exclude goodwill amortization, which is no longer recorded under SFAS No. 142 effective January 1, 2002.
(dollars in millions except per share amounts)
FOR THE YEAR ENDED DECEMBER 31:
| | 2002
| | 2001
| | 2000
|
|---|
| Reported income from continuing operations | | $ | 5,334 | | $ | 8,146 | | $ | 7,874 |
| Add: Goodwill amortization net of tax effects | | | — | | | 262 | | | 436 |
| | |
| |
| |
|
| Adjusted income from continuing operations | | $ | 5,334 | | $ | 8,408 | | $ | 8,310 |
| | |
| |
| |
|
| Basic earnings per share from continuing operations: | | | | | | | | | |
| | Reported income from continuing operations | | $ | 3.13 | | $ | 4.69 | | $ | 4.45 |
| | Goodwill amortization | | | — | | | 0.15 | | | 0.25 |
| | |
| |
| |
|
| Adjusted basic earnings per share from continuing operations | | $ | 3.13 | | $ | 4.85 | * | $ | 4.70 |
| | |
| |
| |
|
| Diluted earnings per share from continuing operations: | | | | | | | | | |
| | Reported income from continuing operations | | $ | 3.07 | | $ | 4.59 | | $ | 4.32 |
| | Goodwill amortization | | | — | | | 0.15 | | | 0.24 |
| | |
| |
| |
|
| | Adjusted diluted earnings per share from continuing operations | | $ | 3.07 | | $ | 4.74 | | $ | 4.56 |
| | |
| |
| |
|
| Reported net income | | $ | 3,579 | | $ | 7,723 | | $ | 8,093 |
| Add: Goodwill amortization net of tax effects | | | — | | | 262 | | | 436 |
| | |
| |
| |
|
| Adjusted net income | | $ | 3,579 | | $ | 7,985 | | $ | 8,529 |
| | |
| |
| |
|
| Basic earnings per share: | | | | | | | | | |
| | Reported net income | | $ | 2.10 | | $ | 4.45 | | $ | 4.58 |
| | Goodwill amortization | | | — | | | 0.15 | | | 0.25 |
| | |
| |
| |
|
| | Adjusted basic earnings per share | | $ | 2.10 | | $ | 4.60 | | $ | 4.83 |
| | |
| |
| |
|
| Diluted earnings per share: | | | | | | | | | |
| | Reported net income | | $ | 2.06 | | $ | 4.35 | | $ | 4.44 |
| | Goodwill amortization | | | — | | | 0.15 | | | 0.24 |
| | |
| |
| |
|
| | Adjusted diluted earnings per share | | $ | 2.06 | | $ | 4.50 | | $ | 4.68 |
| | |
| |
| |
|
- *
- Does not total due to rounding.
On January 1, 2001, the company adopted SFAS No. 133, as amended. SFAS No. 133 establishes accounting and reporting standards for derivative instruments. As of January 1, 2001, the adoption of the new standard resulted in a cumulative effect, net-of-tax increase of $219 million to Accumulated gains and (losses) not affecting retained earnings in the Stockholders' equity section of the Consolidated Statement of Financial Position and a cumulative effect net-of-tax charge of $6 million included in Other (income) and expense in the Consolidated Statement of Earnings.
Effective January 1, 2001, the company adopted SFAS No. 140, "Accounting for Transfers and Servicing of Financial Assets and Extinguishments of Liabilities—a replacement of SFAS No. 125." This statement provides accounting and reporting standards for transfers and servicing of financial assets and extinguishments of liabilities and revises the accounting standards for securitizations and transfers of financial assets and collateral. The adoption did not have a material effect on the company's results of operations and financial position. The standard also requires new disclosures that were not applicable to the company.
New Standards to be Implemented
In June 2001, the FASB issued SFAS No. 143,"Accounting for Asset Retirement Obligations." SFAS No. 143 provides accounting and reporting guidance for legal obligations associated with the retirement of long-lived assets that result from the acquisition, construction or normal operation of a long-lived asset. SFAS No. 143 requires the recording of an asset and a liability equal to the present value of the estimated costs associated with the retirement of long-lived assets where a legal or contractual obligation exists. The asset is required to be depreciated over the life of the related equipment or facility, and the liability is required to be accreted each year based on a present value interest rate. The standard is effective for the company on January 1, 2003. The company has reviewed the provisions of this standard, and its adoption is not expected to have a material effect on the company's Consolidated Financial Statements.
76
In July 2002, the FASB issued SFAS No. 146, "Accounting for Costs Associated with Exit or Disposal Activities." SFAS No. 146 supersedes EITF No. 94-3, "Liability Recognition for Certain Employee Termination Benefits and Other Costs to Exit an Activity (Including Certain Costs Incurred in a Restructuring)," and requires that a liability for a cost associated with an exit or disposal activity be recognized when the liability is incurred. Such liabilities should be recorded at fair value and updated for any changes in the fair value each period. A notable change from EITF No. 94-3 involves one-time employee termination costs whereby the employee to be terminated is required to render service between the notification date and the date the employee will be terminated in order to receive any termination benefits. For these situations whereby the required postnotification service period extends beyond the minimum retention period required by local law, the fair value of the liability will be recognized ratably over the service period. This change is effective for new exit or disposal activities initiated after December 31, 2002. Had SFAS No. 146 been effective for the company's second quarter and fourth quarter 2002 actions, a portion of the pre-tax employee termination costs listed in the table on pages 91 and 92 would have been amortized over the applicable service periods, until the respective employees were terminated. The impact of SFAS No. 146 on the company's future Consolidated Financial Statements will depend upon the timing of and facts underlying any future one-time workforce reduction actions.
In November 2002, the EITF reached a consensus on Issue No. 00-21, "Accounting for Revenue Arrangements with Multiple Deliverables." This Issue provides guidance on when and how to separate elements of an arrangement that may involve the delivery or performance of multiple products, services and rights to use assets into separate units of accounting. The guidance in the consensus is effective for revenue arrangements entered into in fiscal periods beginning after June 15, 2003. The company will adopt Issue No. 00-21 in the quarter beginning July 1, 2003. The transition provision allows either prospective application or a cumulative effect adjustment upon adoption. The company is currently evaluating the impact of adopting this guidance.
In November 2002, the FASB issued Interpretation No. 45 (FIN 45), "Guarantor's Accounting and Disclosure Requirements for Guarantees, Including Indirect Guarantees of Indebtedness of Others," which addresses the disclosures to be made by a guarantor in its interim and annual financial statements about its obligations under guarantees. FIN 45 also requires the recognition of a liability by a guarantor at the inception of certain guarantees that are entered into or modified after December 31, 2002.
The company has adopted the disclosure requirements of FIN 45 (see note A, "Significant Accounting Policies," on pages 70 through 75, and note O, "Contingencies and Commitments," on pages 88 and 89) and will apply the recognition and measurement provisions for all material guarantees entered into or modified in periods beginning January 1, 2003. The impact of FIN 45 on the company's future Consolidated Financial Statements will depend upon whether the company enters into or modifies any material guarantee arrangements.
In January 2003, the FASB issued Interpretation No. 46 (FIN 46), "Consolidation of Variable Interest Entities," which addresses consolidation by business enterprises of variable interest entities that either: (1) do not have sufficient equity investment at risk to permit the entity to finance its activities without additional subordinated financial support, or (2) the equity investors lack an essential characteristic of a controlling financial interest.
FIN 46 requires disclosure of Variable Interest Entities (VIEs) in financial statements issued after January 31, 2003, if it is reasonably possible that as of the transition date: (1) the company will be the primary beneficiary of an existing VIE that will require consolidation or, (2) the company will hold a significant variable interest in, or have significant involvement with, an existing VIE. Pursuant to the transitional requirements of FIN 46, the company will adopt the consolidation guidance applicable to existing VIEs as of the reporting period beginning July 1, 2003. Any VIEs created after January 31, 2003, are immediately subject to the consolidation guidance in FIN 46.
The company's program to sell state and local government receivables, as described in note J, "Sale and Securitization of Receivables," on page 82, involves qualifying special purpose entities, and therefore is not subject to FIN 46.
The company does not have any entities that require disclosure or new consolidation as a result of adopting the provisions of FIN 46.
77
C Acquisitions/Divestitures
Acquisitions
2002
In 2002, the company completed 12 acquisitions at an aggregate cost of $3,958 million.
The largest acquisition was PricewaterhouseCoopers Consulting (PwCC). On October 1, 2002, the company purchased PricewaterhouseCoopers' (PwC) global business consulting and technology services unit, PwCC, for $3,474 million. The acquisition of PwCC provides the company with new expertise in business strategy, industry-based consulting, process integration and application management. The purchase price above includes an estimated amount of net tangible assets to be transferred of approximately $422 million. The recorded amount of net tangible assets transferred to IBM from PwC on October 1, 2002, was approximately $454 million higher than the estimate. The amount of recorded net tangible assets transferred will be subject to a review process between both parties under the terms of the agreement. Therefore, although the net tangible assets recorded by IBM include this incremental amount, such amounts may be adjusted, dollar for dollar, in 2003 under the terms of the agreement. Any cash settlement to either party resulting from this process is estimated to occur in 2003 and may affect the values assigned to assets acquired and liabilities assumed.
The company paid $2,852 million of the purchase price in cash, $294 million primarily in the form of restricted shares of IBM common stock and $328 million in notes convertible into restricted shares of IBM common stock.
In connection with the acquisition, the company incurred approximately $196 million of pre-tax, one-time compensation costs for certain PwCC partners and employees. This amount relates to restricted stock awards and the compensation element of the convertible notes issued as part of the purchase consideration and was recorded in the fourth quarter of 2002. The portion of this amount recorded as part of SG&A in the Consolidated Statement of Earnings as compensation expense for the convertible notes equals the difference between the fair value and the face value of the notes.
As a result of its acquisition of PwCC, the company recorded a liability of approximately $601 million in the fourth quarter of 2002 to rebalance its workforce and to vacate excess leased space. All employees affected by this action were notified as of December 31, 2002. The portion of the liability relating to IBM people and space was approximately $318 million, and substantially all was recorded as part of SG&A in the Consolidated Statement of Earnings. The portion of the liability relating to acquired PwCC workforce and leased space was approximately $283 million and was included as part of the liabilities assumed for purchase accounting and are presented in the following table.
The table below presents the allocation of purchase price related to the 2002 acquisitions as of the respective dates of acquisition.
(dollars in millions)
| | AMORTIZATION
LIFE (IN YEARS)
| | PwCC
| | OTHER
| |
|---|
| Current assets | | | | $ | 1,197 | | $ | 264 | |
| Fixed/non-current assets | | | | | 199 | | | 102 | |
| Intangible assets: | | | | | | | | | |
| | Goodwill | | N/A | | | 2,461 | | | 364 | |
| | Completed technology | | 3 | | | — | | | 66 | |
| | Strategic alliances | | 5 | | | 103 | | | — | |
| | Non-contractual customer relationships | | 4 to 7 | | | 131 | | | — | |
| | Customer contracts/backlog | | 3 to 5 | | | 82 | | | 6 | |
| | Other identifiable intangible assets | | 3 to 5 | | | 95 | | | 10 | |
| | | | |
| |
| |
| Total assets acquired | | | | | 4,268 | | | 812 | |
| | | | |
| |
| |
| Current liabilities | | | | | (560 | ) | | (208 | ) |
| Non-current liabilities | | | | | (234 | ) | | (124 | ) |
| | | | |
| |
| |
| Total liabilities assumed | | | | | (794 | ) | | (332 | ) |
| | | | |
| |
| |
| Net assets acquired | | | | | 3,474 | | | 480 | |
| In-process research and development | | | | | — | | | 4 | |
| | | | |
| |
| |
| Total purchase price | | | | $ | 3,474 | | $ | 484 | |
| | | | |
| |
| |
PwCC Acquisition
Almost half of the goodwill was estimated to be generated by the value of the acquired assembled workforce. The acquired assembled workforce is treated as goodwill under SFAS No. 141. The remaining items that generated goodwill are synergies between PwCC and the company created by the combination, and the premium paid by the company for the right to control PwCC. The goodwill has been assigned to the Global Services segment. The company estimates that approximately two-thirds of the goodwill is deductible for tax purposes. The overall weighted-average life of amortizable intangible assets purchased from PwC is approximately 5 years. The results of operations of PwCC were included in the company's Consolidated Financial Statements as of October 1, 2002.
Other Acquisitions
The company paid cash for the other acquisitions. Six of the acquisitions were for software companies, including Crossworlds Software, Inc., and Access360. The other five acquisitions were strategic outsourcing and business consulting companies. The primary items that generated goodwill are the synergies between the acquired businesses and the company, and the premium paid by the company for the right to control the businesses acquired. Approximately $300 million of the goodwill has been assigned to the Software segment and the
78
balance to the Global Services segment. The goodwill is not deductible for tax purposes. The overall weighted-average life of the intangible assets purchased is approximately three years. The results of operations of the acquired businesses were included in the company's Consolidated Financial Statements from the respective dates of acquisition.
2001
In 2001, the company completed two acquisitions at a cost of approximately $1,082 million.
The larger acquisition was Informix Corporation's (Informix) database software business. The company paid approximately $1 billion in cash for the net assets of the business. Under the terms of the acquisition, the company paid $889 million of the purchase price in 2001. The balance was paid in January 2003. The Informix acquisition provided the company with a database software system for data warehousing, business intelligence and transaction-handling systems that are used by more than 100,000 customers. In addition, the acquisition significantly increased the size of the company's Unix database business. The company purchased Informix in the third quarter of 2001.
The following table presents the allocation of purchase price related to the 2001 acquisitions as of the respective dates of acquisition.
(dollars in millions)
| | AMORTIZATION
LIFE (IN YEARS)
| | INFORMIX
| | OTHER
| |
|---|
| Current assets | | | | $ | 156 | | $ | 57 | |
| Fixed/non-current assets | | | | | 41 | | | 21 | |
| Intangible assets: | | | | | | | | | |
| | Goodwill | | | | | 591 | | | 25 | |
| | Customer lists | | 5 | | | 220 | | | — | |
| | Completed technology | | 3 | | | 140 | | | — | |
| | Trademarks | | 2 | | | 10 | | | — | |
| | | | |
| |
| |
| Total assets acquired | | | | | 1,158 | | | 103 | |
| | | | |
| |
| |
| Deferred revenue | | | | | (101 | ) | | (2 | ) |
| Payables/accrued expenses | | | | | (55 | ) | | (21 | ) |
| | | | |
| |
| |
| Total liabilities assumed | | | | | (156 | ) | | (23 | ) |
| | | | |
| |
| |
| Total purchase price | | | | $ | 1,002 | | $ | 80 | |
| | | | |
| |
| |
Informix
The primary items that generated goodwill are the value of the acquired assembled workforce and the synergies between Informix and the company created by the combination. Goodwill of $591 million has been assigned to the Software segment. Almost all of the goodwill is deductible for tax purposes. This transaction occurred after June 30, 2001, and therefore, the acquired goodwill is not subject to amortization. The overall weighted-average life of intangible assets purchased from Informix is 4.2 years. The results of operations of Informix were included in the company's Consolidated Financial Statements as of July 2, 2001.
Other Acquisitions
The primary items that generated goodwill are the synergies between the acquired business and the company and the premium paid by the company for the right to control the business acquired. Goodwill of $25 million has been assigned to the Global Services segment. The goodwill is not deductible for tax purposes. The results of operations of the acquired business were included in the company's Consolidated Financial Statements from the date of acquisition.
2000
In 2000, the company completed nine acquisitions at a cost of approximately $511 million.
The largest acquisition was LGS Group Inc. (LGS). The company acquired all the outstanding stock of LGS in April 2000 for $190 million. LGS offers services ranging from application development to information technology (IT) consulting. The results of operations of LGS were included in the company's Consolidated Financial Statements as of April 2000.
The table below presents the allocation of the purchase price related to the 2000 acquisitions as of the respective dates of acquisition.
(dollars in millions)
| | LGS
| | OTHER
| |
|---|
| Tangible net assets | | $ | 31 | | $ | 68 | |
| Goodwill | | | 159 | | | 220 | |
| Other identifiable intangible assets | | | — | | | 36 | |
| In-process research and development | | | — | | | 9 | |
| Deferred tax liabilities related to identifiable intangible assets | | | — | | | (12 | ) |
| | |
| |
| |
| Total purchase price | | $ | 190 | | $ | 321 | |
| | |
| |
| |
79
OVERALL
The company's acquisitions were accounted for as purchase transactions, and accordingly, the assets and liabilities of the acquired entities were recorded at their estimated fair value at the date of acquisition. The effects of these acquisitions on the company's Consolidated Financial Statements were not material. Hence, the company has not provided pro forma financial information as if the companies had combined at the beginning of the respective periods presented.
The tangible net assets comprise primarily cash, accounts receivable, land, buildings and leasehold improvements. The identifiable intangible assets comprise primarily patents, trademarks, customer lists, employee agreements and leasehold interests. The identifiable intangible assets have been amortized on a straight-line basis, generally not to exceed seven years. Goodwill from acquisitions that were consummated prior to July 1, 2001, was amortized over five years. The company adopted SFAS No. 142 on January 1, 2002, and ceased amortizing goodwill as of that date. The results of operations of all acquired businesses were included in the company's Consolidated Financial Statements from the respective dates of acquisition.
Divestitures
2002
On December 31, 2002, the company sold its HDD business to Hitachi. The total gross proceeds of the sale were $2 billion (excluding purchase price adjustments), of which $1,414 million was received by IBM at closing. According to the terms of the agreement, the remaining proceeds will be received one and three years after closing. The remaining proceeds are fixed and are not dependent or variable based upon the sold business' earnings or performance. The company transferred approximately $244 million of cash as part of the HDD business, resulting in a net cash inflow in 2002 related to the HDD transaction of $1,170 million.
IBM has entered into an arms-length five-year supply agreement with Hitachi, effective January 1, 2003, designed to provide the company with a majority of its ongoing internal disk drive requirements for the company's Server, Storage and Personal Systems products.
The loss on disposal recorded in 2002 was approximately $382 million, net of tax, and was recorded in (Loss)/income from discontinued operations in the Consolidated Statement of Earnings.
See note A, "Significant Accounting Policies," on pages 70 to 75 for the "Basis of Presentation" for the discontinued operations.
In the second and fourth quarters of 2002, the company announced certain asset and workforce reduction actions, and excess leased space charges related to its discontinued HDD business. The company recorded a charge of approximately $508 million, net of tax, in discontinued operations associated with these announced actions.
Summarized selected financial information for the discontinued operations is as follows:
(dollars in millions)
FOR THE YEAR ENDED DECEMBER 31:
| | 2002*
| | 2001
| | 2000
| |
|---|
| Revenue | | $ | 1,946 | | $ | 2,799 | | $ | 3,307 | |
| | |
| |
| |
| |
| (Loss)/income before income taxes | | $ | (2,037 | ) | $ | (497 | ) | $ | 123 | |
| Income tax benefit | | | (282 | ) | | (74 | ) | | (96 | ) |
| | |
| |
| |
| |
| (Loss)/income from discontinued operations | | $ | (1,755 | ) | $ | (423 | ) | $ | 219 | |
| | |
| |
| |
| |
- *
- At closing, the company incurred a significant U.S. tax charge of approximately $248 million related to the repatriation of divestiture proceeds from certain countries with low tax rates. This amount was included in the income tax benefit line item of discontinued operations.
D Financial Instruments (excluding derivatives)
Fair Value of Financial Instruments
Cash and cash equivalents, marketable securities, notes and other accounts receivable and other investments are financial assets with carrying values that approximate fair value. Accounts payable, other accrued expenses and liabilities, and short-term and long-term debt are financial liabilities with carrying values that approximate fair value.
Marketable Securities*
The following table summarizes the company's marketable securities, all of which are considered available for sale, and alliance investments.
| | FAIR VALUE
|
|---|
(dollars in millions)
AT DECEMBER 31:
|
|---|
| | 2002
| | 2001
|
|---|
| Marketable securities—current: | | | | | | |
| Time deposits and other obligations | | $ | 593 | | $ | 55 |
| Non-U.S. government securities and other fixed-term obligations | | | — | | | 8 |
| | |
| |
|
| Total | | $ | 593 | | $ | 63 |
| | |
| |
|
| Marketable securities—non-current:** | | | | | | |
| Time deposits and other obligations | | $ | 172 | | $ | 124 |
| Non-U.S. government securities and other fixed-term obligations | | | 20 | | | — |
| | |
| |
|
| Total | | $ | 192 | | $ | 124 |
| | |
| |
|
| Non-equity method alliance investments** | | $ | 249 | | $ | 574 |
| | |
| |
|
- *
- Gross unrealized gains (before taxes) on marketable securities and alliance investments were $9 million and $27 million at December 31, 2002 and 2001, respectively. Gross unrealized losses (before taxes) on marketable securities and alliance investments were $10 million and $4 million at December 31, 2002 and 2001, respectively. See note N, "Stockholders' Equity Activity," on pages 87 and 88 for net change in unrealized gains and losses on marketable securities.
- **
- Included within Investments and sundry assets in the Consolidated Statement of Financial Position. See note H, "Investments and Sundry Assets," on page 81.
80
E Inventories
(dollars in millions)
AT DECEMBER 31:
| | 2002
| | 2001
|
|---|
| Finished goods | | $ | 960 | | $ | 1,259 |
| Work in process and raw materials | | | 2,188 | | | 3,045 |
| | |
| |
|
| Total | | $ | 3,148 | | $ | 4,304 |
| | |
| |
|
F Financing Receivables
(dollars in millions)
AT DECEMBER 31:
| | 2002
| | 2001*
|
|---|
| Short-term: | | | | | | |
| Net investment in sales-type leases | | $ | 5,779 | | $ | 6,029 |
| Commercial financing receivables | | | 4,972 | | | 5,416 |
| Customer loans receivable | | | 4,462 | | | 4,225 |
| Installment payment receivables | | | 698 | | | 844 |
| Other non-Global Financing related | | | 85 | | | 142 |
| | |
| |
|
| Total | | $ | 15,996 | | $ | 16,656 |
| | |
| |
|
| Long-term: | | | | | | |
| Net investment in sales-type leases | | $ | 6,505 | | $ | 6,822 |
| Customer loans receivable | | | 4,179 | | | 4,014 |
| Commercial financing receivables | | | 462 | | | 1,009 |
| Installment payment receivables | | | 273 | | | 396 |
| Other non-Global Financing related | | | 21 | | | 5 |
| | |
| |
|
| Total | | $ | 11,440 | | $ | 12,246 |
| | |
| |
|
- *
- Reclassified to conform with 2002 presentation.
Net investment in sales-type leases is for leases that relate principally to IBM equipment and are generally for terms ranging from two to five years. Net investment in sales-type leases includes unguaranteed residual values of $821 million and $791 million at December 31, 2002 and 2001, respectively, and is reflected net of unearned income at those dates of $1,330 million and $1,428 million, respectively. Scheduled maturities of minimum lease payments outstanding at December 31, 2002, expressed as a percentage of the total, are approximately as follows: 2003, 51 percent; 2004, 28 percent; 2005, 15 percent; 2006, 4 percent; and 2007 and beyond, 2 percent.
Customer loans receivable are provided by Global Financing to the company's customers to finance the purchase of the company's software and services. Global Financing is one of many sources of funding from which customers can choose. Separate contractual relationships on these financing arrangements are generally for terms ranging from one to three years requiring straight-line payments over the term. Each financing contract is priced independently at competitive market rates. The company has a history of enforcing the terms of these separate financing agreements.
G Plant, Rental Machines and Other Property
(dollars in millions)
AT DECEMBER 31:
| | 2002
| | 2001
|
|---|
| Land and land improvements | | $ | 837 | | $ | 859 |
| Buildings and building improvements | | | 8,978 | | | 10,073 |
| Plant, laboratory and office equipment | | | 21,416 | | | 22,369 |
| | |
| |
|
| | | | 31,231 | | | 33,301 |
| Less: Accumulated depreciation | | | 18,525 | | | 18,982 |
| | |
| |
|
| | | | 12,706 | | | 14,319 |
| | |
| |
|
| Rental machines | | | 4,852 | | | 5,074 |
| Less: Accumulated depreciation | | | 3,118 | | | 2,889 |
| | |
| |
|
| | | | 1,734 | | | 2,185 |
| | |
| |
|
| Total | | $ | 14,440 | | $ | 16,504 |
| | |
| |
|
H Investments and Sundry Assets
(dollars in millions)
AT DECEMBER 31:
| | 2002
| | 2001*
|
|---|
| Deferred taxes | | $ | 4,314 | | $ | 2,395 |
| Alliance investments: | | | | | | |
| | Equity method | | | 562 | | | 544 |
| | Other | | | 249 | | | 574 |
| Software | | | 834 | | | 833 |
| Derivatives—non-current** | | | 689 | | | 230 |
| Intangible assets, net (other than goodwill) | | | 562 | | | 356 |
| Receivable from Hitachi+ | | | 356 | | | — |
| Marketable securities—non-current | | | 192 | | | 124 |
| Other assets | | | 1,076 | | | 1,361 |
| | |
| |
|
| Total | | $ | 8,834 | | $ | 6,417 |
| | |
| |
|
- *
- Reclassified to conform with 2002 presentation.
- **
- See note L, "Derivatives and Hedging Transactions" on pages 84 to 86 for the fair value of all derivatives reported in the Consolidated Statement of Financial Position.
- +
- See note C, "Acquisitions/Divestitures" on pages 78 to 80 for additional information.
The following schedule details the company's intangible asset balances by major asset class:
(dollars in millions)
INTANGIBLE ASSET CLASS
| | GROSS
CARRYING
AMOUNT
| | ACCUMULATED
AMORTIZATION
| | NET CARRYING
AMOUNT AT
DEC. 31, 2002
| |
|---|
| Customer-related | | $ | 517 | | $ | (124 | ) | $ | 393 | |
| Completed technology | | | 229 | | | (108 | ) | | 121 | |
| Strategic alliances | | | 118 | | | (15 | ) | | 103 | |
| Patents/trademarks | | | 109 | | | (80 | ) | | 29 | |
| Other* | | | 98 | | | (7 | ) | | 91 | |
| | |
| |
| |
| |
| Total | | $ | 1,071 | | $ | (334 | ) | $ | 737 | ** |
| | |
| |
| |
| |
- *
- Other intangibles are primarily acquired proprietary and nonproprietary business processes, methodologies and systems.
- **
- The $737 million comprises $175 million recorded as current assets and $562 million recorded as non-current assets.
81
The net carrying amount of intangible assets increased by $259 million for the year ended December 31, 2002, primarily due to the acquisition of PwCC, offset by the amortization of existing intangible asset balances and the intangible assets associated with divestitures.
The aggregate amortization expense was $181 million and $100 million for the years ended December 31, 2002 and 2001, respectively.
The future amortization expense for each of the five succeeding years relating to intangible assets currently recorded in the Consolidated Statement of Financial Position is estimated to be the following at December 31, 2002:
(dollars in millions)
| |
|
|---|
| 2003 | | $ | 245 |
| 2004 | | | 208 |
| 2005 | | | 138 |
| 2006 | | | 82 |
| 2007 | | | 42 |
I Goodwill
The changes in the carrying amount of goodwill, by reporting segment, for the year ended December 31, 2002, are as follows:
(dollars in millions)
SEGMENT
| | BALANCE
JAN. 1,
2002
| | ASSEMBLED
WORKFORCE
RECLASS*
| | GOODWILL
ADDITIONS
| | PURCHASE
PRICE
ADJUSTMENTS
| | DIVESTITURES
| | FOREIGN
CURRENCY
TRANSLATION
ADJUSTMENTS
| | BALANCE
DEC. 31,
2002
|
|---|
| Global Services | | $ | 325 | | $ | — | | $ | 2,532 | | $ | — | | $ | — | | $ | 69 | | $ | 2,926 |
| Enterprise Systems | | | 111 | | | 26 | | | — | | | — | | | — | | | — | | | 137 |
| Personal and Printing Systems | | | 13 | | | — | | | — | | | — | | | — | | | — | | | 13 |
| Technology | | | 102 | | | 5 | | | — | | | — | | | (83 | ) | | — | | | 24 |
| Software | | | 727 | | | 2 | | | 293 | | | (12 | ) | | — | | | 5 | | | 1,015 |
| Global Financing | | | — | | | — | | | — | | | — | | | — | | | — | | | — |
| Enterprise Investments | | | — | | | — | | | — | | | — | | | — | | | — | | | — |
| | |
| |
| |
| |
| |
| |
| |
|
| Total | | $ | 1,278 | | $ | 33 | | $ | 2,825 | | $ | (12 | ) | $ | (83 | ) | $ | 74 | | $ | 4,115 |
| | |
| |
| |
| |
| |
| |
| |
|
- *
- In accordance with SFAS No. 141, "Business Combinations," the unamortized balance for acquired assembled workforce, which had been recognized as an intangible asset separate from goodwill, has been reclassified to goodwill effective January 1, 2002.
There were no goodwill impairment losses recorded during the period.
J Sale and Securitization of Receivables
The company periodically sells receivables through the securitization of loans, leases and trade receivables. The company retains servicing rights in the securitized receivables for which it receives a servicing fee. Any gain or loss incurred as a result of such sales is recognized in the period in which the sale occurs.
During 2001, the company entered into an uncommitted trade receivables securitization facility that allows for the ongoing sale of up to $500 million of trade receivables. This facility was put in place primarily to provide backup liquidity and can be accessed on three days notice. The company sold $179 million of trade receivables through this facility in 2001. In addition, the company has a program to sell loans receivable from state and local government customers. This program was established in 1990 and has been used from time to time since then. The company sold $278 million of loans receivable due from state and local government customers in 2001. No receivables were sold under either of these programs in 2002.
At December 31, 2002 and 2001, the total balance of the state and local receivables securitized and under the company's management was $101 million and $213 million, respectively. Servicing assets net of servicing liabilities were insignificant.
The investors in the state and local loans receivable securitizations have recourse to the company via a limited guarantee of $69 million at December 31, 2002. At year-end 2002, delinquent amounts from the receivables sold and net credit losses were insignificant.
K Borrowings
Short-term debt
(dollars in millions)
AT DECEMBER 31:
| | 2002
| | 2001
|
|---|
| Commercial paper | | $ | 1,302 | | $ | 4,809 |
| Short-term loans | | | 1,013 | | | 1,564 |
| Long-term debt—current maturities | | | 3,716 | | | 4,815 |
| | |
| |
|
| Total | | $ | 6,031 | | $ | 11,188 |
| | |
| |
|
82
The weighted-average interest rates for commercial paper at December 31, 2002 and 2001, were 1.7 percent and 1.9 percent, respectively. The weighted-average interest rates for short-term loans at December 31, 2002 and 2001, were 2.5 percent and 4.0 percent, respectively.
Long-Term Debt
PRE-SWAP ACTIVITY
(dollars in millions)
AT DECEMBER 31:
| | MATURITIES
| | 2002
| | 2001
|
|---|
| U.S. Dollars: | | | | | | | | |
| Debentures: | | | | | | | | |
| 6.22% | | 2027 | | $ | 500 | | $ | 500 |
| 6.5% | | 2028 | | | 700 | | | 700 |
| 7.0% | | 2025 | | | 600 | | | 600 |
| 7.0% | | 2045 | | | 150 | | | 150 |
| 7.125% | | 2096 | | | 850 | | | 850 |
| 7.5% | | 2013 | | | 550 | | | 550 |
| 8.375% | | 2019 | | | 750 | | | 750 |
| 3.43% convertible notes* | | 2007 | | | 328 | | | — |
| Notes: 6.0% average | | 2003-2032 | | | 2,130 | | | 2,772 |
| Medium-term note program: 4.0% average | | 2003-2018 | | | 7,113 | | | 3,620 |
| Other: 4.9% average | | 2003-2009 | | | 610 | | | 828 |
| | |
| |
| |
|
| | | | | | 14,281 | | | 11,320 |
Other currencies (average interest rate at December 31, 2002, in parentheses): |
|
|
|
|
|
|
|
|
| Euros (5.4%) | | 2003-2009 | | | 2,111 | | | 3,042 |
| Japanese yen (1.0%) | | 2003-2015 | | | 4,976 | | | 4,749 |
| Canadian dollars (5.8%) | | 2003-2011 | | | 445 | | | 441 |
| Swiss francs (4.0%) | | 2003 | | | 180 | | | 151 |
| Other (6.6%) | | 2003-2014 | | | 730 | | | 726 |
| | |
| |
| |
|
| | | | | | 22,723 | | | 20,429 |
| Less: Net unamortized (premium)/discount | | | | | (1 | ) | | 47 |
| Add: SFAS No. 133 fair value adjustment** | | | | | 978 | | | 396 |
| | | | |
| |
|
| | | | | | 23,702 | | | 20,778 |
| Less: Current maturities | | | | | 3,716 | | | 4,815 |
| | | | |
| |
|
| Total | | | | $ | 19,986 | | $ | 15,963 |
| | | | |
| |
|
- *
- On October 1, 2002, as part of the purchase price consideration for the PwCC acquisition, as addressed in note C, "Acquisitions/Divestitures," on pages 78 to 80, the company issued convertible notes bearing interest at a stated rate of 3.4 percent with a face value of approximately $328 million to certain of the acquired PwCC partners. The notes are convertible into 4,764,543 shares of IBM common stock at the option of the holders at any time after the first anniversary of their issuance based on a fixed conversion price of $68.81 per share of the company's common stock.
- **
- In accordance with the requirements of SFAS No. 133, the portion of the company's fixed rate debt obligations that is hedged is reflected in the Consolidated Statement of Financial Position as an amount equal to the sum of the debt's carrying value plus a SFAS No. 133 fair value adjustment representing changes recorded in the fair value of the hedged debt obligations attributable to movements in market interest rates and applicable foreign currency exchange rates.
Annual contractual maturities on long-term debt outstanding at December 31, 2002, are as follows:
(dollars in millions)
| |
|
|---|
| 2003 | | $ | 3,949 |
| 2004 | | | 3,613 |
| 2005 | | | 1,670 |
| 2006 | | | 2,705 |
| 2007 | | | 846 |
| 2008 and beyond | | | 9,940 |
Interest on Debt
(dollars in millions)
FOR THE YEAR ENDED DECEMBER 31:
| | 2002
| | 2001
| | 2000
|
|---|
| Cost of Global Financing | | $ | 633 | | $ | 964 | | $ | 1,082 |
| Interest expense | | | 145 | | | 234 | | | 344 |
| Interest expense—discontinued operations | | | 2 | | | 4 | | | 3 |
| Interest capitalized | | | 35 | | | 33 | | | 20 |
| | |
| |
| |
|
| Total interest paid and accrued | | $ | 815 | | $ | 1,235 | | $ | 1,449 |
| | |
| |
| |
|
Refer to the related discussion on pages 101 through 103 in note X, "Segment Information," for the total interest expense of the Global Financing segment. See note L, "Derivatives and Hedging Transactions," on pages 84 to 86 for a discussion of the use of currency and interest rate swaps in the company's debt risk management program.
Lines of Credit
The company maintains two global credit facilities totaling $12.0 billion in committed lines, including an $8.0 billion multiyear facility with a term extending through May 31, 2006, and a $4.0 billion, 364-day facility that expires on May 30, 2003. The company's other lines of credit, most of which were uncommitted, totaled $7,190 million and $6,860 million at December 31, 2002 and 2001, respectively. Interest rates and other terms of borrowing under these lines of credit vary from country to country, depending on local market conditions.
(dollars in millions)
(dollars in millions)
AT DECEMBER 31:
| | 2002
| | 2001
|
|---|
| Unused lines: | | | | | | |
| | From the committed global credit facility | | $ | 11,945 | | $ | 11,383 |
| | From other committed and uncommitted lines | | | 4,989 | | | 4,738 |
| | |
| |
|
| Total unused lines of credit | | $ | 16,934 | | $ | 16,121 |
| | |
| |
|
83
L Derivatives and Hedging Transactions
The company operates in approximately 35 functional currencies and is a significant lender and borrower in the global markets. In the normal course of business, the company is exposed to the impact of interest rate changes and foreign currency fluctuations, and to a lesser extent equity price changes. The company limits these risks by following established risk management policies and procedures including the use of derivatives and, where cost-effective, financing with debt in the currencies in which assets are denominated. For interest rate exposures, derivatives are used to align rate movements between the interest rates associated with the company's lease and other financial assets and the interest rates associated with its financing debt. Derivatives are also used to manage the related cost of debt. For foreign currency exposures, derivatives are used to limit the effects of foreign exchange rate fluctuations on financial results.
The company does not use derivatives for trading or speculative purposes, nor is it a party to leveraged derivatives. Further, the company has a policy of only entering into contracts with carefully selected major financial institutions based upon their credit ratings and other factors, and maintains strict dollar and term limits that correspond to the institution's credit rating. When viewed in conjunction with the underlying and offsetting exposure that the derivatives are designed to hedge, the company has not sustained a material loss from these instruments.
In its hedging programs, the company employs the use of forward contracts, futures contracts, interest rate and currency swaps, options, caps, floors or a combination thereof depending upon the underlying exposure.
A brief description of the major hedging programs follows.
Debt Risk Management
The company issues debt on the global capital markets, principally to fund its financing lease and loan portfolio. Access to cost-effective financing can result in interest rate and/or currency mismatches with the underlying assets. To manage these mismatches and to reduce overall interest cost, the company primarily uses interest-rate and currency instruments, principally swaps, to convert specific fixed-rate debt issuances into variable-rate debt (i.e., fair value hedges) and to convert specific variable-rate debt and anticipated commercial paper issuances to fixed rate (i.e., cash flow hedges). The resulting cost of funds is lower than that which would have been available if debt with matching characteristics was issued directly. The weighted-average remaining maturity of all swaps in the debt risk management program is approximately four years.
Long-Term Investments in Foreign Subsidiaries (Net Investment)
A significant portion of the company's foreign currency denominated debt portfolio is designated as a hedge of net investment to reduce the volatility in stockholders' equity caused by changes in foreign currency exchange rates in the functional currency of major foreign subsidiaries with respect to the U.S. dollar. The company also uses currency swaps and foreign exchange forward contracts for this risk management purpose. The currency effects of these hedges (approximately $317 million for the current period, net of tax) are reflected as a loss in the Accumulated gains and (losses) not affecting retained earnings section of the Consolidated Statement of Stockholders' Equity, thereby offsetting a portion of the translation of the applicable foreign subsidiaries' net assets.
Anticipated Royalties and Cost Transactions
The company's operations generate significant non-functional currency, third party vendor payments and intercompany payments for royalties, and goods and services among the company's non-U.S. subsidiaries and with the parent company. In anticipation of these foreign currency cash flows and in view of the volatility of the currency markets, the company selectively employs foreign exchange forward and option contracts to manage its currency risk. At December 31, 2002, the maximum remaining maturity of these derivative instruments was less than 18 months, commensurate with the underlying hedged anticipated cash flows.
84
Subsidiary Cash and Foreign Currency
Asset/Liability Management
The company uses its Global Treasury Centers to manage the cash of its subsidiaries. These centers principally use currency swaps to convert cash flows in a cost-effective manner. In addition, the company uses foreign exchange forward contracts to hedge, on a net basis, the foreign currency exposure of a portion of the company's non-functional currency assets and liabilities. The terms of these forward and swap contracts are generally less than one year. The changes in fair value from these contracts and from the underlying hedged exposures are generally offsetting and are recorded in Other (income) and expense in the Consolidated Statement of Earnings.
Equity Risk Management
The company is exposed to certain equity price changes related to certain obligations to employees. These equity exposures are primarily related to market value movements in certain broad equity market indices and in the company's own stock. Changes in the overall value of this employee compensation obligation are recorded in SG&A expense in the Consolidated Statement of Earnings. Although not designated as accounting hedges, the company utilizes equity derivatives, including equity swaps and futures to economically hedge the equity exposures relating to this employee compensation obligation. To match the exposures relating to this employee compensation obligation, these derivatives are linked to the total return of certain broad equity market indices and/or the total return of the company's common stock. These derivatives are recorded at fair value with gains or losses also reported in SG&A expense in the Consolidated Statement of Earnings.
Other Derivatives
The company holds warrants in connection with certain investments that, although not designated as hedging instruments, are deemed derivatives since they contain net share settlement clauses. During the year, the company recorded the change in the fair value of these warrants in net income.
The following tables summarizes the net fair value of the company's derivative and other risk management instruments at December 31, 2002 and 2001 (included in the Consolidated Statement of Financial Position).
RISK MANAGEMENT PROGRAM
| | HEDGE DESIGNATION
| |
| |
|---|
(dollars in millions)
AT DECEMBER 31, 2002
| |
| |
|---|
| | FAIR VALUE
| | CASH FLOW
| | NET
INVESTMENT
| | NON-HEDGE/
OTHER
| |
|---|
| Derivatives: | | | | | | | | | | | | | |
| | Debt risk management | | $ | 643 | | $ | (7 | ) | $ | — | | $ | 3 | |
| | Long-term investments in foreign subsidiaries ("net investments") | | | — | | | — | | | 2 | | | — | |
| | Anticipated royalties and cost transactions | | | — | | | (469 | ) | | — | | | — | |
| | Subsidiary cash and foreign currency asset/liability management | | | — | | | — | | | — | | | (109 | ) |
| | Equity risk management | | | — | | | — | | | — | | | 6 | |
| | Other derivatives | | | — | | | — | | | — | | | 10 | |
| | |
| |
| |
| |
| |
| Total derivatives | | | 643 | (a) | | (476 | )(b) | | 2 | (c) | | (90 | )(d) |
| Debt: | | | | | | | | | | | | | |
| | Long-term investments in foreign subsidiaries ("net investments") | | | — | | | — | | | (2,474 | )* | | — | |
| | |
| |
| |
| |
| |
| Total | | $ | 643 | | $ | (476 | ) | $ | (2,472 | ) | $ | (90 | ) |
| | |
| |
| |
| |
| |
- *
- Represents fair value of foreign denominated debt issuances formally designated as a hedge of net investment.
- (a)
- Comprises assets of $754 million and liabilities of $111 million.
- (b)
- Comprises assets of $2 million and liabilities of $478 million.
- (c)
- Comprises assets of $2 million.
- (d)
- Comprises assets of $26 million and liabilities of $116 million.
85
| | HEDGE DESIGNATION
| |
| |
|---|
(dollars in millions)
AT DECEMBER 31, 2002
| | FAIR VALUE
| | CASH FLOW
| | NET
INVESTMENT
| | NON-HEDGE/
OTHER
| |
|---|
| Derivatives: | | | | | | | | | | | | | |
| | Debt risk management | | $ | 301 | | $ | (26 | ) | | — | | $ | (13 | ) |
| | Long-term investments in foreign subsidiaries ("net investments") | | | — | | | — | | | 92 | | | — | |
| | Anticipated royalties and cost transactions | | | — | | | 375 | | | — | | | — | |
| | Subsidiary cash and foreign currency asset/liability management | | | — | | | — | | | — | | | 16 | |
| | Equity risk management | | | — | | | — | | | — | | | 22 | |
| | Other derivatives | | | — | | | — | | | — | | | 3 | |
| | |
| |
| |
| |
| |
| Total derivatives | | | 301 | (a) | | 349 | (b) | | 92 | (c) | | 28 | (d) |
| Debt: | | | | | | | | | | | | | |
| | Long-term investments in foreign subsidiaries ("net investments") | | | — | | | — | | | (5,519 | )* | | — | |
| | |
| |
| |
| |
| |
| Total | | $ | 301 | | $ | 349 | | $ | (5,427 | ) | $ | 28 | |
| | |
| |
| |
| |
| |
- *
- Represents fair value of foreign denominated debt issuances formally designated as a hedge of net investment.
- (a)
- Comprises assets of $301 million.
- (b)
- Comprises assets of $383 million and liabilities of $34 million.
- (c)
- Comprises assets of $92 million.
- (d)
- Comprises assets of $60 million and liabilities of $32 million.
Accumulated Derivative Gains or Losses
As illustrated, the company makes extensive use of cash flow hedges, principally in the anticipated royalties and cost transactions risk management program. In connection with the company's cash flow hedges, it has recorded approximately $363 million of net losses in Accumulated gains and (losses) not affecting retained earnings as of December 31, 2002, net of tax, of which approximately $322 million is expected to be reclassified to net income within the next year, providing an offsetting economic impact against the underlying anticipated cash flows hedged.
The following table summarizes activity in the Accumulated gains and (losses) not affecting retained earnings section of the Consolidated Statement of Stockholders' Equity related to all derivatives classified as cash flow hedges held by the company during the periods January 1, 2001 (the date of the company's adoption of SFAS No. 133) through December 31, 2002:
(dollars in millions, net of tax)
| | DEBIT/
(CREDIT)
| |
|---|
| Cumulative effect of adoption of SFAS No. 133 as of January 1, 2001 | | $ | (219 | ) |
| Net gains reclassified into earnings from equity during 2001 | | | 379 | |
| Changes in fair value of derivatives in 2001 | | | (456 | ) |
| | |
| |
| December 31, 2001 | | | (296 | ) |
| | |
| |
| Net losses reclassified into earnings from equity during 2002 | | | (5 | ) |
| Changes in fair value of derivatives in 2002 | | | 664 | |
| | |
| |
| DECEMBER 31, 2002 | | $ | 363 | |
| | |
| |
At December 31, 2002, there were no significant gains or losses on derivative transactions or portions thereof that were either ineffective as hedges, excluded from the assessment of hedge effectiveness, or associated with an underlying exposure that did not occur; nor are there any anticipated in the normal course of business.
M Other Liabilities
(dollars in millions)
AT DECEMBER 31:
| | 2002
| | 2001*
|
|---|
| Deferred taxes | | $ | 1,450 | | $ | 1,485 |
| Deferred income | | | 1,079 | | | 1,145 |
| Executive compensation accruals | | | 851 | | | 868 |
| Restructuring actions | | | 1,024 | | | 589 |
| Postemployment/preretirement liability | | | 573 | | | 493 |
| Environmental accruals | | | 208 | | | 215 |
| Other | | | 766 | | | 670 |
| | |
| |
|
| Total | | $ | 5,951 | | $ | 5,465 |
| | |
| |
|
- *
- Reclassified to conform with 2002 presentation.
Each year the company takes certain workforce rebalancing actions to improve productivity and competitive position. The non-current contractually obligated future payments associated with these ongoing activities are reflected in the postemployment/preretirement liability caption in the table above.
In addition, the company executed certain actions prior to 1994, and in 1999 and 2002. The non-current liabilities associated with these actions are reflected in restructuring actions in the table above.The reconciliation of the December 31, 2001 to 2002, balances of the current and non-current liabilities for restructuring actions are presented in the table on page 87. The current liabilities presented in the table are included in Other accrued expenses and liabilities in the Consolidated Statement of Financial Position.
86
(dollars in millions)
| | BALANCE AT
DEC. 31,
2001
| | ADDITIONS
| | PAYMENTS
| | OTHER
ADJUST-
MENTS*
| | BALANCE AT
DEC. 31,
2002
|
|---|
| Current: | | | | | | | | | | | | | | | |
| | Workforce | | $ | 87 | | $ | 1,225 | | $ | 670 | | $ | 5 | | $ | 647 |
| | Space | | | 65 | | | 146 | | | 97 | | | 67 | | | 181 |
| | Other | | | — | | | 178 | | | 90 | | | 27 | | | 115 |
| | |
| |
| |
| |
| |
|
| Total | | $ | 152 | | $ | 1,549 | | $ | 857 | | $ | 99 | | $ | 943 |
| | |
| |
| |
| |
| |
|
| Non-current: | | | | | | | | | | | | | | | |
| | Workforce | | $ | 385 | | $ | 109 | | $ | — | | $ | 80 | | $ | 574 |
| | Space | | | 204 | | | 281 | | | — | | | (66 | ) | | 419 |
| | Other | | | — | | | 58 | | | — | | | (27 | ) | | 31 |
| | |
| |
| |
| |
| |
|
| Total | | $ | 589 | | $ | 448 | | $ | — | | $ | (13 | ) | $ | 1,024 |
| | |
| |
| |
| |
| |
|
- *
- The Other adjustments column in the table above includes the reclassification of non-current to current and foreign currency translation adjustments. In addition, net adjustments of $30 million were made in the fourth quarter of 2002 to reduce the liabilities previously recorded in the second quarter of 2002.
The workforce accruals primarily relate to the company's Global Services business. The non-current portion of the liability relates to terminated employees who are no longer working for the company, but who were granted annual payments to supplement their incomes in certain countries. Depending on the individual country's legal requirements, these required payments will continue until the former employee begins receiving pension benefits or dies.
The space accruals are for ongoing obligations to pay rent for vacant space that could not be sublet or space that was sublet at rates lower than the committed lease arrangement. The length of these obligations varies by lease with the longest extending through 2019.
Other accruals are primarily the remaining liabilities associated with the 2002 second quarter actions described in note S, "2002 Actions," on pages 90 through 92. In addition, there are $39 million of remaining liabilities associated with the HDD-related restructuring discussed in note C, "Acquisitions/ Divestitures" on pages 78 to 80.
The Additions column in the table above includes accruals for workforce, space and other reductions relating to actions taken in the second and fourth quarters of 2002. Please see note S, "2002 Actions" on pages 90 through 92 for a detailed discussion of second and fourth quarters 2002 actions. Also included in the Additions column are the actions associated with the HDD business for reductions in workforce, manufacturing capacity and space, totaling $295 million that were recorded in the (Loss)/income from discontinued operations in the Consolidated Statement of Earnings.
The company employs extensive internal environmental protection programs that primarily are preventive in nature. The company also participates in environmental assessments and cleanups at a number of locations, including operating facilities, previously owned facilities and Superfund sites.
The total amounts accrued for environmental liabilities, including amounts classified as current in the Consolidated Statement of Financial Position, that do not reflect actual or anticipated insurance recoveries, were $247 million and $238 million at December 31, 2002 and 2001, respectively.
Estimated environmental costs are not expected to materially affect the financial position or results of the company's operations in future periods. However, estimates of future costs are subject to change due to protracted cleanup periods and changing environmental remediation regulations.
N Stockholders' Equity Activity
In the fourth quarter of 2002, in connection with the PwCC acquisition, IBM issued 3,677,213 shares of restricted stock valued at approximately $254 million and recorded an additional $30 million for stock to be issued in future periods as part of the purchase price consideration paid to the PwCC partners. See note C, "Acquisitions/Divestitures," on pages 78 to 80, for further information regarding this acquisition and related payments made by the company. Additionally, in the fourth quarter of 2002, in conjunction with the funding of the company's U.S. pension plan, the company issued an additional 24,037,354 shares of common stock from treasury shares valued at $1,871 million.
Stock Repurchases
From time to time, the Board of Directors authorizes the company to repurchase IBM common stock. The company repurchased 48,481,100 common shares at a cost of $4,212 million and 50,764,698 common shares at a cost of $5,293 million in 2002 and 2001, respectively. In 2002 and 2001, the company issued 979,246 and 1,923,502 treasury shares, respectively, as a result of exercises of stock options by employees of certain recently acquired businesses and by non-U.S. employees. At December 31, 2002, $3,864 million of Board-authorized repurchases remained. The company plans to purchase shares on the open market from time to time, depending on market conditions. The company also repurchased 189,797 common shares at a cost of $18 million and 314,433 common shares at a cost of $31 million in 2002 and 2001, respectively, as part of other stock compensation plans.
In 1995, the Board of Directors authorized the company to repurchase all of its outstanding Series A 7-1/2 percent callable preferred stock. On May 18, 2001, the company announced it would redeem all outstanding shares of its Series A 71/2 percent callable preferred stock, represented by the outstanding depositary shares (10,184,043 shares). The depositary shares represent ownership of one-fourth of a share of preferred stock. Depositary shares were redeemed as of July 3, 2001, the redemption date, for cash at a redemption price of $25 plus accrued and unpaid dividends to the redemption date for each depositary share. Accordingly, these shares are no longer outstanding. Dividends on preferred stock, represented by the depositary shares, ceased to accrue on the redemption date. The company did not repurchase any shares in 2000.
87
Employee Benefits Trust
In 1997, the company created an employee benefits trust to which the company contributed 10 million shares of treasury stock. The company was authorized to instruct the trustee to sell such shares from time to time and to use the proceeds from such sales, and any dividends paid or earnings received on such stock, toward the partial payment of the company's obligations under certain of its compensation and benefit plans. The shares held in trust were not considered outstanding for earnings per share purposes until they were committed to be released. The company did not commit any shares for release from the trust during its existence nor were any shares sold from the trust. The trust would have expired in 2007. Due to the fact that the company had not used the trust, nor was it expected to need the trust prior to its expiration, the company dissolved the trust, effective May 31, 2001, and all of the shares (20 million on a split-adjusted basis) were returned to the company as treasury shares. Dissolution of the trust did not affect the company's obligations related to any of its compensation and employee benefit plans or its ability to settle the obligations. In addition, the dissolution is not expected to have any impact on net income. At this time, the company plans to fully meet its obligations for the compensation and benefit plans in the same manner as it does today, using cash from operations.
ACCUMULATED GAINS AND (LOSSES) NOT AFFECTING RETAINED EARNINGS*
(dollars in millions)
| | NET
UNREALIZED
GAINS/(LOSSES)
ON CASH FLOW
HEDGE DERIVATIVES
| | FOREIGN
CURRENCY
TRANSLATION
ADJUSTMENTS
| | MINIMUM
PENSION
LIABILITY
ADJUSTMENT**
| | NET
UNREALIZED
GAINS/(LOSSES)
ON MARKETABLE
SECURITIES
| | ACCUMULATED
GAINS/(LOSSES)
NOT AFFECTING
RETAINED
EARNINGS
| |
|---|
| December 31, 2000 | | $ | — | | $ | (73 | ) | $ | (218 | ) | $ | (78 | ) | $ | (369 | ) |
| Cumulative effect on January 1, 2001 | | | 219 | | | — | | | — | | | — | | | 219 | |
| Change for period | | | 77 | | | (539 | ) | | (308 | ) | | 92 | | | (678 | ) |
| | |
| |
| |
| |
| |
| |
| December 31, 2001 | | | 296 | | | (612 | ) | | (526 | ) | | 14 | | | (828 | ) |
| Change for period | | | (659 | ) | | 850 | | | (2,765 | ) | | (16 | ) | | (2,590 | ) |
| | |
| |
| |
| |
| |
| |
| DECEMBER 31, 2002 | | $ | (363 | ) | $ | 238 | | $ | (3,291 | ) | $ | (2 | ) | $ | (3,418 | ) |
| | |
| |
| |
| |
| |
| |
- *
- Net of tax.
- **
- Reclassified to conform with 2002 presentation.
NET CHANGE IN UNREALIZED (LOSSES)/GAINS ON MARKETABLE SECURITIES (NET OF TAX)
(dollars in millions)
AT DECEMBER 31:
| | 2002
| | 2001
| |
|---|
| Net unrealized losses arising during the period | | $ | (13 | ) | $ | (154 | ) |
| Less: Net gains/(losses) included in net income for the period | | | 3 | * | | (246 | )* |
| | |
| |
| |
| Net change in unrealized (losses)/gains on marketable securities | | $ | (16 | ) | $ | 92 | |
| | |
| |
| |
- *
- Includes write-downs of $36 million and $287 million in 2002 and 2001, respectively.
O Contingencies and Commitments
Contingencies
The company is subject to a variety of claims and suits that arise from time to time in the ordinary course of its business, including actions with respect to contracts, IP, product liability, employment and environmental matters. The company is a defendant and/or third-party defendant in a number of cases in which claims have been led by current and former employees, independent contractors, estate representatives, offspring and relatives of employees seeking damages for wrongful death and personal injuries allegedly caused by exposure to chemicals in various of the company's facilities from 1964 to the present.
In addition, the company is a defendant in a class action challenge to its defined benefit plan. The suit alleges that the current pension plan formulas violate a number of Employee Retirement Income Security Act (ERISA) provisions including the ERISA age discrimination provision.
While it is not possible to predict the ultimate outcome of the matters discussed above, given the unique factors and circumstances involved in each matter, historically, the company has been successful in defending itself against claims and suits that have been brought against it, and payments made by the company in such claims and suits have not been material to the company. The company will continue to defend itself vigorously in all such matters and believes that if it were to incur a loss in any such matter, such loss should not have a material effect on the company's business, financial condition or results of operations.
Commitments
The company has applied the disclosure provisions of FASB Interpretation No. 45 (FIN 45), "Guarantor's Accounting and Disclosure Requirements for Guarantees, Including Indirect Guarantees of Indebtedness of Others," to its agreements that contain guarantee or indemnification clauses. These disclosure provisions expand those required by FASB Statement No. 5, "Accounting for Contingencies," by requiring a guarantor to
88
disclose certain types of guarantees, even if the likelihood of requiring the guarantor's performance is remote. The following is a description of arrangements in which the company is the guarantor.
The company is a party to a variety of agreements pursuant to which it may be obligated to indemnify the other party with respect to certain matters. Typically, these obligations arise in the context of contracts entered into by the company, under which the company customarily agrees to hold the other party harmless against losses arising from a breach of representations and covenants related to such matters as title to assets sold, certain IP rights, specified environmental matters, and certain income taxes. In each of these circumstances, payment by the company is conditioned on the other party making a claim pursuant to the procedures specified in the particular contract, which procedures typically allow the company to challenge the other party's claims. Further, the company's obligations under these agreements may be limited in terms of time and/or amount, and in some instances, the company may have recourse against third parties for certain payments made by the company.
It is not possible to predict the maximum potential amount of future payments under these or similar agreements due to the conditional nature of the company's obligations and the unique facts and circumstances involved in each particular agreement. Historically, payments made by the company under these agreements did not have a material effect on the company's business, financial condition or results of operations. The company believes that if it were to incur a loss in any of these matters, such loss should not have a material effect on the company's business, financial condition or results of operations.
In addition, the company guarantees certain loans and financial commitments. The maximum potential future payment under these financial guarantees was $126 million and $218 million at December 31, 2002 and 2001, respectively. These amounts include the limited guarantee associated with the company's loans receivable securitization program. See note J, "Sale and Securitization of Receivables," on page 82.
The company extended lines of credit, of which the unused amounts were $3,482 million and $4,088 million at December 31, 2002 and 2001, respectively. A portion of these amounts was available to the company's business partners to support their working capital needs. In addition, the company committed to provide future financing to its customers in connection with customer purchase agreements for approximately $288 million and $269 million at December 31, 2002 and 2001, respectively.
Changes in the company's warranty liability balance are illustrated in the following table:
(dollars in millions)
| | 2002
| | 2001
| |
|---|
| Balance at January 1 | | $ | 520 | | $ | 572 | |
| Current period accruals | | | 863 | | | 823 | |
| Accrual adjustments to reflect actual experience | | | 121 | | | (2 | ) |
| Charges incurred | | | (890 | ) | | (873 | ) |
| | |
| |
| |
| Balance at December 31 | | $ | 614 | | $ | 520 | |
| | |
| |
| |
Accrual adjustments in 2002 principally reflect a significant increase in the failure rates of HDD components in the company's Server and Storage products as a result of product transitions.
P Taxes
(dollars in millions)
FOR THE YEAR ENDED DECEMBER 31:
| | 2002
| | 2001
| | 2000
|
|---|
| Income from continuing operations before income taxes: | | | | | | | | | |
| | U.S. operations | | $ | 3,838 | | $ | 5,644 | | $ | 5,914 |
| | Non-U.S. operations | | | 3,686 | | | 5,806 | | | 5,497 |
| | |
| |
| |
|
| Total income from continuing operations before income taxes | | $ | 7,524 | | $ | 11,450 | | $ | 11,411 |
| | |
| |
| |
|
The continuing operations provision for income taxes by geographic operations is as follows:
(dollars in millions)
FOR THE YEAR ENDED DECEMBER 31:
| | 2002
| | 2001
| | 2000
|
|---|
| U.S. operations | | $ | 934 | | $ | 1,543 | | $ | 1,798 |
| Non-U.S. operations | | | 1,256 | | | 1,761 | | | 1,739 |
| | |
| |
| |
|
| Total continuing operations provision for income taxes | | $ | 2,190 | | $ | 3,304 | | $ | 3,537 |
| | |
| |
| |
|
The components of the continuing operations provision for income taxes by taxing jurisdiction are as follows:
(dollars in millions)
FOR THE YEAR ENDED DECEMBER 31:
| | 2002
| | 2001
| | 2000
| |
|---|
| U.S. federal: | | | | | | | | | | |
| | Current | | $ | 287 | | $ | 434 | | $ | 719 | |
| | Deferred | | | (3 | ) | | 333 | | | 285 | |
| | |
| |
| |
| |
| | | | 284 | | | 767 | | | 1,004 | |
| | |
| |
| |
| |
| U.S. state and local: | | | | | | | | | | |
| | Current | | | 184 | | | 73 | | | 192 | |
| | Deferred | | | 3 | | | 155 | | | 47 | |
| | |
| |
| |
| |
| | | | 187 | | | 228 | | | 239 | |
| | |
| |
| |
| |
| Non-U.S.: | | | | | | | | | | |
| | Current | | | 1,786 | | | 2,133 | | | 2,582 | |
| | Deferred | | | (67 | ) | | 176 | | | (288 | ) |
| | |
| |
| |
| |
| | | | 1,719 | | | 2,309 | | | 2,294 | |
| | |
| |
| |
| |
| Total continuing operations provision for income taxes | | | 2,190 | | | 3,304 | | | 3,537 | |
| Provision for social security, real estate, personal property and other taxes | | | 2,789 | | | 2,730 | | | 2,734 | |
| | |
| |
| |
| |
| Total continuing operations provision for taxes | | $ | 4,979 | | $ | 6,034 | | $ | 6,271 | |
| | |
| |
| |
| |
89
The effect of tax law changes on deferred tax assets and liabilities did not have a significant effect on the company's effective tax rate.
The significant components of activities that gave rise to deferred tax assets and liabilities that are recorded in the Consolidated Statement of Financial Position were as follows:
DEFERRED TAX ASSETS
(dollars in millions)
AT DECEMBER 31:
| | 2002
| | 2001*
|
|---|
| Retirement benefits | | $ | 3,587 | | $ | 2,589 |
| Capitalized research and development | | | 2,251 | | | 747 |
| Alternative minimum tax credits | | | 1,316 | | | 1,282 |
| Employee benefits | | | 1,049 | | | 1,122 |
| Deferred income | | | 895 | | | 694 |
| Bad debt, inventory and warranty reserves | | | 850 | | | 863 |
| General business credits | | | 798 | | | 700 |
| Infrastructure reduction charges | | | 560 | | | 465 |
| Depreciation | | | 441 | | | 386 |
| Foreign tax loss carryforwards | | | 304 | | | 325 |
| State and local tax loss carryforwards | | | 239 | | | 238 |
| Other | | | 2,266 | | | 1,781 |
| | |
| |
|
| Gross deferred tax assets | | | 14,556 | | | 11,192 |
| Less: Valuation allowance | | | 628 | | | 581 |
| | |
| |
|
| Net deferred tax assets | | $ | 13,928 | | $ | 10,611 |
| | |
| |
|
DEFERRED TAX LIABILITIES
(dollars in millions)
AT DECEMBER 31:
| | 2002
| | 2001*
|
|---|
| Retirement benefits | | $ | 5,904 | | $ | 3,829 |
| Sales-type leases | | | 1,088 | | | 1,814 |
| Depreciation | | | 329 | | | 425 |
| Other | | | 1,431 | | | 1,475 |
| | |
| |
|
| Gross deferred tax liabilities | | $ | 8,752 | | $ | 7,543 |
| | |
| |
|
- *
- Reclassified to conform with 2002 presentation.
The valuation allowance at December 31, 2002, principally applies to certain state and local, and foreign tax loss carryforwards that, in the opinion of management, are more likely than not to expire before the company can use them.
A reconciliation of the company's continuing operations effective tax rate to the statutory U.S. federal tax rate is as follows:
FOR THE YEAR ENDED DECEMBER 31:
| | 2002
| | 2001
| | 2000
| |
|---|
| Statutory rate | | 35 | % | 35 | % | 35 | % |
| Foreign tax differential | | (7 | ) | (6 | ) | (6 | ) |
| State and local | | 1 | | 1 | | 1 | |
| Valuation allowance related items | | — | | — | | (1 | ) |
| Other | | — | | (1 | ) | 2 | |
| | |
| |
| |
| |
| Effective rate | | 29 | % | 29 | % | 31 | % |
| | |
| |
| |
| |
For tax return purposes, the company has available tax credit carryforwards of approximately $2,234 million, of which $1,316 million have an indefinite carryforward period and the remainder begin to expire in 2005. The company also has state and local, and foreign tax loss carryforwards, the tax effect of which is $543 million. Most of these carryforwards are available for five years or have an indefinite carryforward period.
Undistributed earnings of non-U.S. subsidiaries included in consolidated retained earnings were $16,631 million at December 31, 2002, and $16,851 million at December 31, 2001. These earnings, which reflect full provision for non-U.S. income taxes, are indefinitely reinvested in non-U.S. operations or will be remitted substantially free of additional tax.
Q Advertising and Promotional Expense
Advertising and promotional expense, which includes media, agency and promotional expense, was $1,427 million, $1,615 million and $1,742 million in 2002, 2001 and 2000, respectively, and is recorded in SG&A expense.
R Research, Development and Engineering
RD&E expense was $4,750 million in 2002, $4,986 million in 2001 and $5,084 million in 2000.
The company incurred expense of $4,247 million in 2002, $4,321 million in 2001 and $4,301 million in 2000 for basic scientific research and the application of scientific advances to the development of new and improved products and their uses. Of these amounts, software-related expense was $1,974 million, $1,926 million and $1,955 million in 2002, 2001 and 2000, respectively. Included in the expense for 2002 and 2000 were charges for acquired in-process R&D of $4 million and $9 million, respectively.
Expense for product-related engineering was $503 million, $665 million and $783 million in 2002, 2001 and 2000, respectively.
S 2002 Actions
Second Quarter Actions
During the second quarter of 2002, the company executed several actions in its Microelectronics Division. The Microelectronics Division is within the company's Technology Group segment. These actions were the result of the company's announced intentions to refocus and direct its microelectronics business to the high-end foundry, Application Specific Integrated Circuit and standard products, while creating a technology services business. A major part of the actions related to a significant reduction in the company's manufacturing capacity for aluminum technology.
In addition, the company rebalanced both its workforce and its leased space resources primarily in response to the recent decline in corporate spending on technology services.
90
The following table summarizes the significant components of these actions:
(dollars in millions)
| | PRE-TAX
CHARGES
| | WRITE-OFF
OF ASSETS
| | LIABILITY
RECORDED IN
2ND QTR. 2002
| | PAYMENTS
| | OTHER
ADJUSTMENTS+
| | LIABILITY
AS OF
DEC. 31, 2002
|
|---|
| Microelectronics: | | | | | | | | | | | | | | | | | | |
| | Machinery/equipment: | | $ | 423 | | $ | 323 | (a) | | | | | | | | | | | |
| | | Current | | | | | | | | $ | 67 | (b)* | $ | 38 | | $ | 13 | | $ | 42 |
| | | Non-current | | | | | | | | | 33 | (b)** | | — | | | (16 | ) | | 17 |
| | Non-cancelable purchase commitments: | | | 60 | | | | | | | | | | | | | | | |
| | | Current | | | | | | | | | 35 | (c)* | | 15 | | | 4 | | | 24 |
| | | Non-current | | | | | | | | | 25 | (c)** | | — | | | (12 | ) | | 13 |
| | Employee terminations: | | | 45 | | | | | | | | | | | | | | | |
| | | Current | | | | | | | | | 44 | (d)* | | 35 | | | (8 | ) | | 1 |
| | | Non-current | | | | | | | | | 1 | (d)** | | — | | | — | | | 1 |
| | Vacant space: | | | 11 | | | | | | | | | | | | | | | |
| | | Current | | | | | | | | | 5 | (e)* | | 1 | | | 1 | | | 5 |
| | | Non-current | | | | | | | | | 6 | (e)** | | — | | | (1 | ) | | 5 |
| | Sale of Endicott facility | | | 223 | | | 221 | (f) | | 2 | (f)* | | 3 | | | 11 | | | 10 |
| | Sale of certain operations | | | 63 | | | 53 | (g) | | 10 | (g)* | | 9 | | | — | | | 1 |
| Global Services and other: | | | | | | | | | | | | | | | | | | |
| | Employee terminations: | | | 722 | | | | | | | | | | | | | | | |
| | | Current | | | | | | | | | 671 | (h)* | | 505 | | | (23 | ) | | 143 |
| | | Non-current | | | | | | | | | 51 | (h)** | | — | | | 27 | | | 78 |
| | Vacant space: | | | 180 | | | 29 | (i) | | | | | | | | | | | |
| | | Current | | | | | | | | | 57 | (i)* | | 29 | | | 16 | | | 44 |
| | | Non-current | | | | | | | | | 94 | (i)** | | — | | | (8 | ) | | 86 |
| | |
| |
| |
| |
| |
| |
|
| Total | | $ | 1,727 | | $ | 626 | | $ | 1,101 | | $ | 635 | | $ | 4 | | $ | 470 |
| | |
| |
| |
| |
| |
| |
|
- *
- Recorded in Accounts payable and accruals in the Consolidated Statement of Financial Position.
- **
- Recorded in Other liabilities in the Consolidated Statement of Financial Position.
- +
- Principally represents currency translation adjustments and reclassification of non-current to current. In addition, net adjustments of $30 million were made in the fourth quarter of 2002 to reduce previously recorded liabilities. These adjustments, along with a net $10 million credit for assets previously written off, were for differences between the estimated and actual proceeds on the disposition of certain assets and changes in the estimated cost of employee terminations.
- (a)
- This amount was recorded in SG&A expense and primarily represents the abandonment and loss on sale of certain capital assets during the second quarter of 2002.
- (b)
- This amount comprises costs incurred to remove abandoned capital assets and the remaining lease payments for leased equipment that was abandoned in the second quarter of 2002. The company expects to pay the removal costs by June 30, 2003. The remaining lease payments will continue through 2005. These amounts were recorded in SG&A expense.
- (c)
- The company is subject to certain noncancelable purchase commitments. As a result of the decision to significantly reduce aluminum capacity, the company no longer has a need for certain materials subject to these agreements. The required future payments for materials no longer needed under these contracts are expected to be paid over two years. This amount was recorded in SG&A expense.
- (d)
- The workforce reductions represent 1,400 people of which approximately 94 percent left the business as of December 31, 2002. These amounts were recorded in SG&A expense. The non-current portion of the liability relates to terminated employees who were granted annual payments to supplement their income in certain countries. Depending on individual country legal requirements, these required payments will continue until the former employee begins receiving pension benefits or dies.
- (e)
- The space accruals are for ongoing obligations to pay rent for vacant space that could not be sublet or space that was sublet at rates lower than the committed lease arrangements. The length of these obligations varies by lease with the longest extending through 2006. These charges were recorded in Other (income) and expense in the Consolidated Statement of Earnings.
- (f)
- As part of the company's strategic decisions in its Microelectronics business to exit the manufacture and sale of certain products and component technologies, the company signed an agreement in the second quarter of 2002 to sell its interconnect products operations in Endicott to Endicott Interconnect Technologies, Inc. (EIT). As a result of this transaction, the company incurred a $223 million loss on sale in the second quarter of 2002, primarily relating to land, buildings, machinery and equipment. This loss was recorded in Other (income) and expense in the Consolidated Statement of Earnings. This transaction closed in
91
the fourth quarter of 2002. The company entered into a limited supply agreement with EIT for future products, and it will also lease back, at fair market value rental rates, approximately one-third of the Endicott campus' square footage for operations outside the interconnect OEM business.
- (g)
- As part of the strategic realignment of the company's Microelectronics business, the company reached an agreement to sell certain assets and liabilities comprising its Mylex business to LSI Logic Corporation and the company sold part of its wireless phone chipset operations to TriQuint Semiconductor, Inc. in June 2002. The Mylex transaction was completed in August 2002. The loss of $74 million for the Mylex transaction and the realized gain of $11 million for the chipset sale were recorded in Other (income) and expense in the Consolidated Statement of Earnings.
- (h)
- The majority of the workforce reductions relate to the company's Global Services business. The workforce reductions represent 14,213 people of which approximately 94 percent left the company as of December 31, 2002. See (d) on page 91 for information on the non-current portion of the liability. These charges were included in SG&A expense in the Consolidated Statement of Earnings.
- (i)
- The space accruals are for ongoing obligations to pay rent for vacant space that could not be sublet or space that was sublet at rates lower than the committed lease arrangements. This space relates primarily to workforce dynamics in the Global Services business and the downturn in corporate technology spending on services. The length of these obligations varies by lease with the longest extending through 2009. These charges were recorded in Other (income) and expense in the Consolidated Statement of Earnings.
Fourth Quarter Actions
During the fourth quarter of 2002, the company executed several actions related to the company's acquisition of PwCC. Specifically, the company rebalanced both its workforce and its leased space resources. The following table summarizes the significant components of these actions:
| |
| |
| |
| | RECORDED IN PURCHASE ACCOUNTING (SEE NOTE C)
| |
| |
| |
| |
|
|---|
| | RECORDED IN THE CONSOLIDATED
STATEMENT OF EARNINGS
| |
| |
| |
| |
|
|---|
| | TOTAL
LIABILITY
RECORDED
IN 4TH QTR.
| |
| |
| |
|
|---|
(dollars in millions)
| | TOTAL
PRE-TAX
CHARGES
| | SALE OR
WRITE-OFF
OF ASSETS
| | LIABILITY
RECORDED
IN 4TH QTR.
| | LIABILITY
RECORDED
IN 4TH QTR.
| | PAYMENTS
| | OTHER
ADJUSTMENTS*
| | LIABILITY
AS OF
DEC. 31, 2002
|
|---|
| Workforce: | | $ | 305 | (a) | $ | — | | | | | | | | | | | | | | | | | | |
| | Current | | | | | | | | $ | 248 | | $ | 48 | (a) | $ | 296 | | $ | 16 | | $ | (2 | ) | $ | 278 |
| | Non-current | | | | | | | | | 57 | (a) | | — | | | 57 | | | — | | | — | | | 57 |
| Vacant space: | | | 17 | (b) | | 4 | | | | | | | | | | | | | | | | | | |
| | Current | | | | | | | | | 6 | | | 62 | (b) | | 68 | | | 1 | | | — | | | 67 |
| | Non-current | | | | | | | | | 7 | | | 173 | (b) | | 180 | | | — | | | — | | | 180 |
| | |
| |
| |
| |
| |
| |
| |
| |
|
| Total | | $ | 322 | | $ | 4 | | $ | 318 | | $ | 283 | | $ | 601 | | $ | 17 | | $ | (2 | ) | $ | 582 |
| | |
| |
| |
| |
| |
| |
| |
| |
|
- *
- Principally represents currency translation adjustments.
- (a)
- The majority of the workforce reductions relate to the company's Global Services business. The workforce reductions represent 3,541 people who are expected to leave the company by the end of the first quarter of 2003 ($305 million in the table above). These charges were included in SG&A expense in the Consolidated Statement of Earnings. The workforce reductions also affected 1,203 acquired PwCC employees who are expected to leave the company by the end of the first quarter of 2003 ($48 million in the table above). These costs were included as part of the liabilities assumed for purchase accounting.
The non-current workforce accrual relates to terminated employees in certain countries outside the United States, for whom the company is required to make annual payments to supplement their incomes. Depending on individual country legal requirements, these required payments will continue until the former employee begins receiving pension benefits or dies.
- (b)
- The majority of the space accruals are for ongoing obligations to pay rent for vacant space of PwCC that could not be sublet or space that was sublet at rates lower than the committed lease arrangements. The length of these obligations varies by lease with the longest extending through 2019. The charges related to IBM space ($17 million) were included in Other (income) and expense in the Consolidated Statement of Earnings. The costs related to acquired PwCC space were included as part of the liabilities assumed for purchase accounting ($235 million in the table above comprise $62 million current and $173 million non-current).
92
T Earnings Per Share of Common Stock
The following table sets forth the computation of basic and diluted earnings per share of common stock.
FOR THE YEAR ENDED DECEMBER 31:
| | 2002
| | 2001
| | 2000
| |
|---|
| Weighted-average number of shares on which earnings per share calculations are based: | | | | | | | | | | |
| Basic | | | 1,703,244,345 | | | 1,733,348,422 | | | 1,763,037,049 | |
| | Add—incremental shares under stock compensation plans | | | 24,807,025 | | | 36,595,476 | | | 46,750,030 | |
| | Add—incremental shares associated with convertible notes | | | 1,191,136 | | | — | | | — | |
| | Add—incremental shares associated with contingently issuable shares | | | 1,698,548 | | | 1,277,222 | | | 2,331,343 | |
| | Add—incremental shares associated with put options* | | | — | | | 9,479 | | | — | |
| | |
| |
| |
| |
| Assuming dilution | | | 1,730,941,054 | | | 1,771,230,599 | | | 1,812,118,422 | |
| | |
| |
| |
| |
(dollars in millions except per share amounts)
| | | | | | | | | | |
| Income from continuing operations applicable to common stockholders | | $ | 5,334 | | $ | 8,136 | | $ | 7,854 | |
| (Loss)/income from discontinued operations | | | (1,755 | ) | | (423 | ) | | 219 | |
| | |
| |
| |
| |
| Net income from total operations on which basic earnings per share is calculated | | $ | 3,579 | | $ | 7,713 | | $ | 8,073 | |
| | |
| |
| |
| |
| Income from continuing operations applicable to common stockholders | | $ | 5,334 | | $ | 8,136 | | $ | 7,854 | |
| | Less—net income applicable to contingently issuable shares | | | 18 | | | 4 | | | 21 | |
| | |
| |
| |
| |
| Income from continuing operations on which diluted earnings per share is calculated | | | 5,316 | | | 8,132 | | | 7,833 | |
| (Loss)/income from discontinued operations on which basic and diluted earnings per share are calculated | | | (1,755 | ) | | (423 | ) | | 219 | |
| | |
| |
| |
| |
| Net income from total operations on which diluted earnings per share is calculated | | $ | 3,561 | | $ | 7,709 | | $ | 8,052 | |
| | |
| |
| |
| |
| Earnings/(loss) per share of common stock: | | | | | | | | | | |
| | Assuming dilution: | | | | | | | | | | |
| | | Continuing operations | | $ | 3.07 | | $ | 4.59 | | $ | 4.32 | |
| | |
| |
| |
| |
| | | Discontinued operations | | | (1.01 | ) | | (0.24 | ) | | 0.12 | |
| | |
| |
| |
| |
| Total | | $ | 2.06 | | $ | 4.35 | | $ | 4.44 | |
| | |
| |
| |
| |
| | Basic: | | | | | | | | | | |
| | | Continuing operations | | $ | 3.13 | | $ | 4.69 | | $ | 4.45 | |
| | | Discontinued operations | | | (1.03 | ) | | (0.24 | ) | | 0.12 | |
| | |
| |
| |
| |
| Total | | $ | 2.10 | | $ | 4.45 | | $ | 4.58 | ** |
| | |
| |
| |
| |
- *
- Represents short-term put option contracts sold by the company on a limited basis through private placements with independent third parties to reduce the cost of the share buy-back program. The put option contracts that were executed permitted net share settlement at the company's option and did not result in a put option liability in the Consolidated Statement of Financial Position. As of December 31, 2002, the company did not have any put option obligations outstanding.
- **
- Does not total due to rounding.
Stock options to purchase 111,713,072 common shares in 2002, 67,596,737 common shares in 2001 and 34,633,343 common shares in 2000 were outstanding, but were not included in the computation of diluted earnings per share because the exercise price of the options was greater than the average market price of the common shares and, therefore, the effect would have been antidilutive. Net income applicable to common stockholders excludes preferred stock dividends of $10 million in 2001 and $20 million in 2000.
U Rental Expense and Lease Commitments
Rental expense from continuing operations, including amounts charged to inventories and fixed assets, and excluding amounts previously reserved, was $1,377 million in 2002, $1,324 million in 2001 and $1,335 million in 2000. The table below depicts gross minimum rental commitments from continuing operations under noncancelable leases, amounts related to vacant space associated with infrastructure reduction and restructuring actions taken through 1993, and in 1999 and 2002 (previously reserved), and sublease income commitments. These amounts reflect activities primarily related to office space as well as manufacturing equipment.
93
(dollars in millions)
| | 2003
| | 2004
| | 2005
| | 2006
| | 2007
| | BEYOND
2007
|
|---|
| Gross minimum rental commitments | | $ | 1,370 | | $ | 1,066 | | $ | 859 | | $ | 689 | | $ | 511 | | $ | 1,590 |
| Vacant space | | | 206 | | | 161 | | | 131 | | | 92 | | | 54 | | | 185 |
| Sublease income commitments | | | 46 | | | 38 | | | 31 | | | 20 | | | 5 | | | 41 |
V Stock-Based Compensation Plans
The following is a description of the terms of the company's stock-based compensation plans:
Incentive Plans
Incentive awards are provided to employees and directors under the terms of the company's plans (the Plans). Employee awards are administered by the Executive Compensation and Management Resources Committee of the Board of Directors. The committee determines the type and terms of the awards to be granted, including vesting provisions.
Awards under the Plans may include stock options, stock appreciation rights, restricted stock, cash or stock awards, or any combination thereof. The original amount of shares authorized to be issued under the Plans was 411.3 million. There were 183.3 million and 193.4 million unused shares available to be granted under the Plans as of December 31, 2002 and 2001, respectively. Awards under the Plans resulted in compensation expense of $183 million, $170 million and $134 million in 2002, 2001 and 2000, respectively.
STOCK OPTION GRANTS
Stock options are granted to employees and directors at an exercise price equal to the fair market value of the company's stock at the date of grant. Generally, options vest 25 percent per year, are fully vested four years from the grant date and have a term of ten years. The following tables summarize option activity under the Plans during 2002, 2001 and 2000:
| | 2002
| | 2001
| | 2000
| |
|---|
| | WTD. AVG.
EXERCISE
PRICE
| | NO. OF SHARES
UNDER OPTION
| | WTD. AVG.
EXERCISE
PRICE
| | NO. OF SHARES
UNDER OPTION
| | WTD. AVG.
EXERCISE
PRICE
| | NO. OF SHARES
UNDER OPTION
| |
|---|
| Balance at January 1 | | $ | 85 | | 177,956,490 | | $ | 73 | | 160,557,003 | | $ | 60 | | 146,136,523 | |
| Options granted | | | 77 | | 59,966,106 | | | 110 | | 43,410,364 | | | 102 | | 42,601,014 | |
| Options exercised | | | 33 | | (7,490,424 | ) | | 37 | | (20,354,701 | ) | | 35 | | (18,243,347 | ) |
| Options canceled/expired | | | 103 | | (7,495,472 | ) | | 100 | | (5,656,176 | ) | | 87 | | (9,937,187 | ) |
| | |
| |
| |
| |
| |
| |
| |
| Balance at December 31 | | $ | 84 | | 222,936,700 | | $ | 85 | | 177,956,490 | | $ | 73 | | 160,557,003 | |
| | |
| |
| |
| |
| |
| |
| |
| Exercisable at December 31 | | $ | 75 | | 108,347,895 | | $ | 62 | | 80,773,980 | | $ | 45 | | 66,599,878 | |
| | |
| |
| |
| |
| |
| |
| |
The shares under option at December 31, 2002, were in the following exercise price ranges:
| | OPTIONS OUTSTANDING
| | OPTIONS CURRENTLY EXERCISABLE
|
|---|
EXERCISE PRICE RANGE
| | WTD. AVG.
EXERCISE
PRICE
| | NO. OF
OPTIONS
| | WTD. AVG.
REMAINING
CONTRACTUAL
LIFE (IN YEARS)
| | WTD. AVG.
EXERCISE
PRICE
| | NO. OF
OPTONS
|
|---|
| $12-$50 | | $ | 29 | | 30,094,313 | | 3 | | $ | 29 | | 30,094,313 |
| $51-$90 | | | 65 | | 74,701,940 | | 8 | | | 61 | | 32,466,761 |
| $91-$110 | | | 103 | | 68,564,527 | | 8 | | | 105 | | 22,223,431 |
| $111 and over | | | 122 | | 49,575,920 | | 8 | | | 126 | | 23,563,390 |
| | |
| |
| |
| |
| |
|
| | | $ | 84 | | 222,936,700 | | 7 | | $ | 75 | | 108,347,895 |
| | |
| |
| |
| |
| |
|
IBM Employees Stock Purchase Plan
The ESPP enables substantially all regular employees to purchase full or fractional shares of IBM common stock through payroll deductions of up to 10 percent of eligible compensation. Effective July 1, 2000, the ESPP was amended whereby the share price paid by an employee changed from 85 percent of the average market price on the last business day of each pay period, to the lesser of 85 percent of the average market price on the first business day of each offering period or 85 percent of the average market price on the last business day of each pay period. This change did not have a material impact on the company's financial condition. The current plan provides semi-annual offerings over the five-year period commencing July 1, 2000. ESPP participants are restricted from purchasing more than $25,000 of common stock in one calendar year or 1,000 shares in an offering period. Approximately 4.6 million, 16.5 million and 26.3 million reserved unissued shares were available for purchase under the ESPP at December 31, 2002, 2001 and 2000, respectively. The
94
company intends to request stockholder approval of a new ESPP in April 2003. If approved, shares may be issued under that plan and employee participation would be subject to the terms and conditions of that plan.
Pro Forma Disclosure
See "Stock-Based Compensation" on page 72, in note A, "Significant Accounting Policies," for the pro forma disclosures of net income and earnings per share required under SFAS No. 123.
W Retirement-Related Benefits
IBM offers defined benefit pension plans, defined contribution pension plans and nonpension postretirement plans, primarily consisting of retiree medical benefits. These benefits form an important part of the company's total compensation and benefits program that is designed to attract and retain highly skilled and talented employees. The following table provides the total retirement-related benefit plans' impact on income before income taxes.
| | U.S.
| | NON-U.S.
| | total
| |
|---|
(dollars in millions)
FOR THE YEAR ENDED DECEMBER 31:
| |
|---|
| | 2002
| | 2001
| | 2000
| | 2002
| | 2001
| | 2000
| | 2002
| | 2001
| | 2000
| |
|---|
| Total retirement-related plans—income | | $ | (154 | ) | $ | (256 | ) | $ | (156 | ) | $ | (17 | ) | $ | (181 | ) | $ | (171 | ) | $ | (171 | )* | $ | (437 | )* | $ | (327 | )* |
| | |
| |
| |
| |
| |
| |
| |
| |
| |
| |
| Comprise: | | | | | | | | | | | | | | | | | | | | | | | | | | | | |
| | Defined benefit and contribution pension plans—income | | $ | (478 | ) | $ | (632 | ) | $ | (530 | ) | $ | (46 | ) | $ | (209 | ) | $ | (198 | ) | $ | (524 | ) | $ | (841 | ) | $ | (728 | ) |
| | Nonpension postretirement benefits—cost | | | 324 | | | 376 | | | 374 | | | 29 | | | 28 | | | 27 | | | 353 | | | 404 | | | 401 | |
| | |
| |
| |
| |
| |
| |
| |
| |
| |
| |
- *
- Includes amounts for discontinued operations costs of $77 million, $56 million and $62 million for 2002, 2001 and 2000, respectively.
Accounting Policy
DEFINED BENEFIT PENSION AND NONPENSION POSTRETIREMENT BENEFIT PLANS
The company accounts for its defined benefit pension plans and its nonpension postretirement benefit plans using actuarial models required by SFAS No. 87, "Employers' Accounting for Pensions," and SFAS No. 106, "Employers' Accounting for Postretirement Benefits Other Than Pensions," respectively. These models use an attribution approach that generally spreads individual events over the service lives of the employees in the plan. Examples of "events" are plan amendments and changes in actuarial assumptions such as discount rate, rate of compensation increases and mortality. See the next paragraph for information on the expected long-term rate of return on plan assets. The principle underlying the required attribution approach is that employees render service over their service lives on a relatively smooth basis and therefore, the income statement effects of pensions or nonpension postretirement benefit plans are earned in, and should follow, the same pattern.
One of the principal components of the net periodic pension (income)/cost calculation is the expected long-term rate of return on plan assets. The required use of expected long-term rate of return on plan assets may result in recognized pension income that is greater or less than the actual returns of those plan assets in any given year. Over time, however, the expected long-term returns are designed to approximate the actual long-term returns and therefore result in a pattern of income and expense recognition that more closely matches the pattern of the services provided by the employees. Differences between actual and expected returns are recognized in the calculation of net periodic pension (income)/cost over five years as provided for in the accounting rules.
The company uses long-term historical actual return information, the expected mix of investments that comprise plan assets, and future estimates of long-term investment returns to develop its expected return on plan assets.
The discount rate assumptions used for pension and nonpension postretirement benefit plan accounting reflect the prevailing rates available on high-quality, fixed-income debt instruments. The rate of compensation increase is another significant assumption used in the actuarial model for pension accounting and is determined by the company, based upon its long-term plans for such increases. For retiree medical plan accounting, the company reviews external data and its own historical trends for health care costs to determine the health care cost trend rates.
As required by SFAS No. 87, for instances in which pension plan assets are less than the accumulated benefit obligation (ABO) as of the end of the reporting period (defined as an unfunded ABO position), a minimum liability equal to this difference is established in the Statement of Financial Position. The ABO is the present value of the actuarially determined company obligation for pension payments assuming no further salary increases for the employees. The offset to the minimum liability is a charge to equity, net of tax. In addition, any prepaid pension asset in excess of unrecognized prior service cost must be reversed through a net-of-tax charge to equity. The charge to equity is included in the Accumulated gains and (losses) not affecting retained earnings section of the Stockholders' equity in the Consolidated Statement of Financial Position.
95
DEFINED CONTRIBUTION PENSION PLANS
The company records pension expense for defined contribution plans when the employee renders service to the company, essentially coinciding with the cash contributions to plans.
Defined Benefit and Defined Contribution Plans
The company and its subsidiaries have defined benefit and defined contribution pension plans that cover substantially all regular employees, and supplemental retirement plans that cover certain executives.
U.S. PLANS
IBM Personal Pension Plan
IBM provides U.S. regular, full-time and part-time employees with noncontributory defined benefit pension benefits (the IBM Personal Pension Plan, "PPP"). The PPP comprises a tax qualified plan and a non-qualified plan. The qualified plan is funded by company contributions to an irrevocable trust fund, which is held for the sole benefit of participants.
Effective January 1, 2001, the company increased pension benefits to certain recipients who retired before January 1, 1997. The increases ranged from 2.5 percent to 25 percent, and were based on the year of retirement and the pension benefit then being received. This improvement resulted in an additional cost of $100 million in 2001 as compared to 2000.
The number of individuals receiving benefits from the PPP at December 31, 2002 and 2001, was 136,365 and 131,071, respectively. The pre-tax net periodic pension income for the qualified plan for the years ended December 31, 2002, 2001 and 2000, was $(917) million, $(1,086) million and $(971) million, respectively. The pre-tax net periodic pension cost for the non-qualified plan was $106 million, $118 million, $123 million for the years ended December 31, 2002, 2001 and 2000, respectively. The costs of the non-qualified plan are reflected in Cost of other defined benefit plans on page 97.
The funded status reconciliation for the qualified plan is on page 98. The benefit obligation of the non-qualified plan was $940 million and $847 million at December 31, 2002 and 2001, respectively, and the amounts included in Retirement and nonpension postretirement benefit obligations in the Consolidated Statement of Financial Position at December 31, 2002 and 2001, were liabilities of $798 million and $738 million, respectively.
U.S. regular, full-time and part-time employees are eligible to participate in the IBM Savings Plan, which is a tax qualified defined contribution plan under section 401(k) of the Internal Revenue Code. The company matches 50 percent of the employee's contribution up to the first 6 percent of the employee's compensation. All contributions, including the company match, are made in cash, in accordance with the participants' investment elections. There are no minimum amounts that must be invested in company stock, and there are no restrictions on transferring amounts out of the company's stock to another investment choice. The total cost of all of the company's U.S. defined contribution plans was $315 million, $313 million and $294 million for the years ended December 31, 2002, 2001 and 2000, respectively.
U.S. Supplemental Executive Retention Plan
The company also has a non-qualified U.S. Supplemental Executive Retention Plan (SERP). The SERP, which is unfunded, provides defined benefit pension benefits in addition to the PPP to eligible executives based on average earnings, years of service and age at retirement. Effective July 1, 1999, the company adopted the SERP (which replaced the previous Supplemental Executive Retirement Plan). Some participants of the prior SERP will still be eligible for benefits under that plan, but will not be eligible for the new plan. The total cost of this plan for the years ended December 31, 2002, 2001 and 2000, was $18 million, $23 million and $24 million, respectively. These amounts are reflected in Cost of other defined benefit plans on page 97. At December 31, 2002 and 2001, the benefit obligation was $130 million and $166 million, respectively, and the amounts included in Retirement and nonpension postretirement benefit obligations in the Consolidated Statement of Financial Position at December 31, 2002 and 2001, were liabilities of $165 million and $151 million, respectively.
NON-U.S. PLANS
Most subsidiaries and branches outside the United States have defined benefit and/or defined contribution retirement plans that cover substantially all regular employees, under which the company deposits funds under various fiduciary-type arrangements, purchases annuities under group contracts or provides reserves. Benefits under the defined benefit plans are typically based either on years of service and the employee's compensation, generally during a fixed number of years immediately before retirement, or on annual credits. The range of assumptions that are used for the non-U.S. defined benefit plans reflect the different economic environments within various countries. The total non-U.S. retirement plan income of these plans for the years ended December 31, 2002, 2001 and 2000, was $46 million, $209 million and $198 million, respectively.
96
(INCOME)/COST OF PENSION PLANS
| | U.S. PLANS
| | NON-U.S. PLANS
| |
|---|
(dollars in millions)
FOR THE YEAR ENDED DECEMBER 31:
| |
|---|
| | 2002
| | 2001*
| | 2000*
| | 2002
| | 2001
| | 2000
| |
|---|
| Service cost | | $ | 650 | | $ | 647 | | $ | 586 | | $ | 505 | | $ | 429 | | $ | 445 | |
| Interest cost | | | 2,591 | | | 2,560 | | | 2,485 | | | 1,270 | | | 1,214 | | | 1,234 | |
| Expected return on plan assets | | | (4,121 | ) | | (4,202 | ) | | (3,902 | ) | | (2,132 | ) | | (2,062 | ) | | (2,042 | ) |
| Amortization of transition assets | | | (144 | ) | | (143 | ) | | (144 | ) | | (12 | ) | | (10 | ) | | (10 | ) |
| Amortization of prior service cost | | | 61 | | | 52 | | | 4 | | | 28 | | | 28 | | | 24 | |
| Recognized actuarial losses/(gains) | | | — | | | — | | | — | | | 33 | | | (12 | ) | | 4 | |
| Divestitures/settlement losses/(gains) | | | 46 | | | — | | | — | | | 26 | | | (12 | ) | | (25 | ) |
| | |
| |
| |
| |
| |
| |
| |
| Net periodic pension income—U.S. Plan and material non-U.S. Plans | | | (917 | )** | | (1,086 | )** | | (971 | )** | | (282 | ) | | (425 | ) | | (370 | ) |
| Cost of other defined benefit plans | | | 124 | | | 141 | | | 147 | | | 58 | | | 54 | | | 23 | |
| | |
| |
| |
| |
| |
| |
| |
| Total net periodic pension income for all defined benefit plans | | | (793 | ) | | (945 | ) | | (824 | ) | | (224 | ) | | (371 | ) | | (347 | ) |
| | |
| |
| |
| |
| |
| |
| |
| Cost of defined contribution plans | | | 315 | | | 313 | | | 294 | | | 178 | | | 162 | | | 149 | |
| | |
| |
| |
| |
| |
| |
| |
| Total retirement plan income recognized in the Consolidated Statement of Earnings | | $ | (478 | ) | $ | (632 | ) | $ | (530 | ) | $ | (46 | ) | $ | (209 | ) | $ | (198 | ) |
| | |
| |
| |
| |
| |
| |
| |
- *
- Reclassified to conform with 2002 presentation.
- **
- Represents the qualified portion of the PPP.
See beginning of note W, "Retirement—Related Benefits," on page 95 for the company's total retirement-related benefits (income)/cost.
97
The changes in the benefit obligations and plan assets of the qualified portion of the PPP and the significant non-U.S. defined benefit plans for 2002 and 2001 were as follows:
| | PPP-QUALIFIED PORTION
| |
| |
| |
|---|
| | NON-U.S. PLANS
| |
|---|
(dollars in millions)
| |
|---|
| | 2002
| | 2001*
| | 2002
| | 2001*
| |
|---|
| Change in benefit obligation: | | | | | | | | | | | | | |
| Benefit obligation at beginning of year | | $ | 37,762 | | $ | 36,620 | | $ | 21,801 | | $ | 21,150 | |
| Service cost | | | 650 | | | 647 | | | 505 | | | 429 | |
| Interest cost | | | 2,591 | | | 2,560 | | | 1,270 | | | 1,214 | |
| Plan participants' contributions | | | — | | | — | | | 34 | | | 27 | |
| Acquisitions/divestitures, net | | | 32 | | | (29 | ) | | 246 | | | 22 | |
| Amendments | | | 18 | | | 99 | | | (280 | ) | | 8 | |
| Actuarial losses | | | 47 | | | 460 | | | 80 | | | 1,101 | |
| Benefits paid from trust | | | (2,743 | ) | | (2,595 | ) | | (866 | ) | | (748 | ) |
| Direct benefit payments | | | — | | | — | | | (221 | ) | | (198 | ) |
| Foreign exchange impact | | | — | | | — | | | 3,104 | | | (1,184 | ) |
| Plan curtailments/settlements/termination benefits | | | — | | | — | | | 26 | | | (20 | ) |
| | |
| |
| |
| |
| |
| Benefit obligation at end of year | | | 38,357 | | | 37,762 | | | 25,699 | | | 21,801 | |
| | |
| |
| |
| |
| |
| Change in plan assets: | | | | | | | | | | | | | |
| Fair value of plan assets at beginning of year | | | 39,565 | | | 44,594 | | | 21,531 | | | 24,833 | |
| Actual return on plan assets | | | (3,801 | ) | | (2,405 | ) | | (3,135 | ) | | (1,559 | ) |
| Employer contribution | | | 3,963 | | | — | | | 225 | | | 417 | |
| Acquisitions/divestitures, net | | | — | | | (29 | ) | | 191 | | | — | |
| Plan participants' contributions | | | — | | | — | | | 34 | | | 27 | |
| Benefits paid from trust | | | (2,743 | ) | | (2,595 | ) | | (866 | ) | | (748 | ) |
| Foreign exchange impact | | | — | | | — | | | 2,657 | | | (1,376 | ) |
| Settlements | | | — | | | — | | | — | | | (63 | ) |
| | |
| |
| |
| |
| |
| Fair value of plan assets at end of year** | | | 36,984 | | | 39,565 | | | 20,637 | | | 21,531 | |
| | |
| |
| |
| |
| |
| Fair value of plan assets in excess of benefit obligation | | | (1,373 | ) | | 1,803 | | | (5,062 | ) | | (270 | ) |
| Unrecognized net actuarial losses | | | 12,187 | | | 4,218 | | | 8,991 | | | 2,871 | |
| Unrecognized prior service costs | | | 584 | | | 641 | | | (187 | ) | | 140 | |
| Unrecognized net transition asset | | | (216 | ) | | (360 | ) | | (36 | ) | | (42 | ) |
| | |
| |
| |
| |
| |
| Net prepaid pension asset recognized in the Consolidated Statement of Financial Position | | $ | 11,182 | | $ | 6,302 | | $ | 3,706 | | $ | 2,699 | |
| | |
| |
| |
| |
| |
| Amounts recognized in the Consolidated Statement of Financial Position captions include: | | | | | | | | | | | | | |
| Prepaid pension assets | | $ | 11,182 | | $ | 6,302 | | $ | 4,397 | | $ | 4,576 | |
| Intangible asset | | | — | | | — | | | 54 | | | 56 | |
| | |
| |
| |
| |
| |
| Total prepaid pension assets | | | 11,182 | | | 6,302 | | | 4,451 | | | 4,632 | |
| Retirement and nonpension postretirement benefit obligation | | | — | | | — | | | (5,865 | ) | | (2,669 | ) |
| Accumulated gains and (losses) not affecting retained earnings | | | — | | | — | | | 3,277 | | | 462 | |
| Deferred tax assets (investments and sundry assets) | | | — | | | — | | | 1,843 | | | 274 | |
| | |
| |
| |
| |
| |
| Net amount recognized | | $ | 11,182 | | $ | 6,302 | | $ | 3,706 | | $ | 2,699 | |
| | |
| |
| |
| |
| |
| Accumulated benefit obligation | | $ | 36,738 | | $ | 35,134 | | $ | 24,186 | | $ | 20,202 | |
| | |
| |
| |
| |
| |
- *
- Reclassified to conform with 2002 presentation.
- **
- The amount of IBM stock represented 5 percent and 1 percent of the total plan assets for the U.S. Plan at December 31, 2002 and 2001, respectively.
Differences between the aggregate balance sheet amounts listed above (material pension plans) and on page 100 (material nonpension postretirement plan) and the totals listed in the Consolidated Statement of Financial Position and Consolidated Statement of Stockholders' Equity, relate to the non-material plans. The increase in the company's Prepaid pension asset balance from 2001 to 2002 was primarily attributable to the $3,963 million company contribution to the PPP in the fourth quarter of 2002. The increase in the company's Retirement and nonpension postretirement benefit obligation was primarily attributable to the required accounting for the unfunded status of the non-U.S. pension plans as discussed on page 99.
Assumptions used to determine costs and benefit obligations for principal pension plans follow:
| | U.S. PLAN
| | NON-U.S. PLANS
| |
|---|
WEIGHTED-AVERAGE
ASSUMPTIONS AS OF DECEMBER 31:
| |
|---|
| | 2002
| | 2001
| | 2000
| | 2002
| | 2000
| | 2001
| |
|---|
| Discount rate | | 6.75 | % | 7.0 | % | 7.25 | % | 4.25-6.5 | % | 4.5-7.1 | % | 4.5-7.1 | % |
| Expected long-term return on plan assets | | 9.5 | %* | 10.0 | % | 10.0 | % | 5.0-9.25 | % | 5.0-10.0 | % | 5.0-11.0 | % |
| Rate of compensation increase | | 4.0 | % | 6.0 | % | 6.0 | % | 2.2-5.0 | % | 2.0-6.1 | % | 2.6-6.1 | % |
| | |
| |
| |
| |
| |
| |
| |
- *
- The company lowered its expected long-term return on plan assets assumption for 2003 to 8 percent.
98
Changes in the discount rate assumptions and rate of compensation increase assumptions since 2000 have not had a material impact on the company's Consolidated Financial Statements. The changes in the expected long-term return on plan assets assumption in the U.S. and non-U.S. for 2002 reduced the 2002 income from retirement-related plans by approximately $375 million as compared to 2001.
FUNDED STATUS FOR DEFINED BENEFIT PENSION PLANS
It is the company's practice to fund amounts for pensions sufficient to meet the minimum requirements set forth in applicable employee benefits laws and local tax laws. From time to time, the company contributes additional amounts as it deems appropriate. The assets of the various plans include corporate equities, government securities, corporate debt securities and real estate. In the fourth quarter of 2002, the company voluntarily fully funded the qualified portion of the PPP, as measured by its ABO, through a total contribution of $3,963 million. The contribution comprised $2,092 million in cash and $1,871 million, or 24,037,354, shares, of IBM stock.
In contrast, the company's plan assets were less than the ABO in certain non-U.S. countries, and the company did not contribute funds up to the ABO level. As a result and consistent with the accounting rules for these "unfunded" positions as described on page 58, the company recorded an additional minimum liability of $2,676 million and a reduction to stockholders' equity of $2,765 million as of December 31, 2002. This accounting transaction does not impact 2003 retirement-related plans income.
The company's Benefit Obligation (BO) for its significant plans is disclosed at the top of page 98. BO is calculated similarly to ABO except for the fact that BO includes an estimate for future salary increases. SFAS No. 132, "Employers' Disclosures about Pensions and Other Postretirement Benefits," requires that companies disclose the aggregate BO and plan assets of all plans in which the BO exceeds plan assets. Similar disclosure is required for all plans in which the ABO exceeds plan assets. The aggregate BO and plan assets are also disclosed for plans in which the plan assets exceed the BO. The following table excludes the U.S. plans due to the fact that these plans' BO and plan assets, if any, appear either in the narrative on page 96 or the table on page 98.
| | 2002
| | 2001*
|
|---|
(dollars in millions)
| | BENEFIT
OBLIGATION
| | PLAN
ASSETS
| | BENEFIT
OBLIGATION
| | PLAN
ASSETS
|
|---|
| Plans with BO in excess of plan assets | | $ | 20,212 | | $ | 13,132 | | $ | 14,757 | | $ | 10,929 |
| Plans with ABO in excess of plan assets | | $ | 15,978 | | $ | 10,086 | | $ | 5,305 | | $ | 2,636 |
| Plans with assets in excess of BO | | $ | 5,487 | | $ | 7,505 | | $ | 7,044 | | $ | 10,602 |
| | |
| |
| |
| |
|
- *
- Reclassified to conform with 2002 presentation.
Nonpension Postretirement Benefits
The total cost of the company's nonpension postretirement benefits for the years ended December 31, 2002, 2001 and 2000, were $353 million, $404 million and $401 million, respectively. The company has a defined benefit postretirement plan that provides medical, dental and life insurance for U.S. retirees and eligible dependents. The total cost of this plan for the years ended December 31, 2002, 2001 and 2000, was $324 million, $376 million and $374 million, respectively. The changes in the benefit obligation and plan assets for this plan are presented on page 100. Effective July 1, 1999, the company established a "Future Health Account" (FHA) for employees who were more than five years away from retirement eligibility. Employees who were within five years of retirement eligibility are covered under the company's prior retiree health benefits arrangements. Under either the FHA or the preexisting plan, there is a maximum cost to the company for retiree health benefits. For employees who retired before January 1, 1992, that maximum became effective in 2001. For all other employees, the maximum is effective upon retirement.
Certain of the company's non-U.S. subsidiaries have similar plans for retirees. However, most of the retirees outside the United States are covered by government-sponsored and administered programs. The total cost of these plans for the years ended December 31, 2002, 2001 and 2000, was $29 million, $28 million and $27 million, respectively. At December 31, 2002 and 2001, Other liabilities in the Consolidated Statement of Financial Position include non-U.S. postretirement benefit liabilities of $211 million and $200 million, respectively.
The net periodic postretirement benefit cost for the U.S. plan for the years ended December 31 include the following components:
(dollars in millions)
| | 2002
| | 2001
| | 2000
| |
|---|
| Service cost | | $ | 49 | | $ | 65 | | $ | 50 | |
| Interest cost | | | 421 | | | 437 | | | 449 | |
| Expected return on plan assets | | | — | | | — | | | (2 | ) |
| Amortization of prior service costs | | | (147 | ) | | (148 | ) | | (147 | ) |
| Recognized actuarial losses | | | 30 | | | 22 | | | 24 | |
| Divestiture | | | (29 | ) | | — | | | — | |
| | |
| |
| |
| |
| Net periodic post-retirement benefit cost | | $ | 324 | | $ | 376 | | $ | 374 | |
| | |
| |
| |
| |
99
The changes in the benefit obligation and plan assets of the U.S. plan for 2002 and 2001 are as follows:
(dollars in millions)
| | 2002
| | 2001
| |
|---|
| Change in benefit obligation: | | | | | | | |
| Benefit obligation at beginning of year | | $ | 6,148 | | $ | 6,443 | |
| Service cost | | | 49 | | | 65 | |
| Interest cost | | | 421 | | | 437 | |
| Actuarial gains | | | (170 | ) | | (183 | ) |
| Participant contributions | | | — | | | 71 | |
| Benefits paid from trust | | | — | | | (68 | ) |
| Direct benefit payments | | | (566 | ) | | (617 | ) |
| | |
| |
| |
| Benefit obligation at end of year | | | 5,882 | | | 6,148 | |
| | |
| |
| |
| Change in plan assets: | | | | | | | |
| Fair value of plan assets at | | | | | | | |
| beginning of year | | | 8 | | | 4 | |
| Actual return on plan assets | | | 2 | | | 1 | |
| Participant contributions | | | 119 | | | 71 | |
| Benefits paid | | | (119 | ) | | (68 | ) |
| | |
| |
| |
| Fair value of plan assets at end of year | | | 10 | | | 8 | |
| | |
| |
| |
| Benefit obligation in excess | | | | | | | |
| of plan assets | | | (5,872 | ) | | (6,140 | ) |
| Unrecognized net actuarial losses | | | 595 | | | 781 | |
| Unrecognized prior service costs | | | (493 | ) | | (653 | ) |
| | |
| |
| |
| Accrued postretirement benefit liability recognized in the Consolidated Statement of Financial Position | | $ | (5,770 | ) | $ | (6,012 | ) |
| | |
| |
| |
The plan assets primarily comprise short-term fixed-income investments.
The benefit obligation was determined by applying the terms of medical, dental and life insurance plans, including the effects of established maximums on covered costs, together with relevant actuarial assumptions. These actuarial assumptions include a projected health care cost trend rate of 10 percent. The projected health care cost trend rate assumption is projected to be 10 percent in 2003, and is assumed to decrease gradually to 4.5 percent by 2008 and remain constant thereafter.
WEIGHTED-AVERAGE
ASSUMPTIONS FOR NONPENSION
POSTRETIREMENT BENEFIT PLANS
AS OF DECEMBER 31:
| | 2002
| | 2001
| | 2000
| |
|---|
| Discount rate | | 7.00 | % | 7.00 | % | 7.25 | % |
| Expected return on plan assets | | 5.0 | % | 5.0 | % | 5.0 | % |
The company evaluates its actuarial assumptions on an annual basis and considers changes in these long-term factors based upon market conditions and the requirements of SFAS No. 106, "Employers' Accounting for Postretirement Benefits Other Than Pensions." The discount rate changes did not have a material effect on net postretirement benefit cost for the years ended December 31, 2002, 2001 and 2000.
The health care cost trend rate has an insignificant effect on plan costs and obligations. A one-percentage-point change in the assumed health care cost trend rate would have the following effects as of December 31, 2002:
(dollars in millions)
| | ONE-PERCENTAGE-
POINT INCREASE
| | ONE-PERCENTAGE-
POINT DECREASE
| |
|---|
| Effect on total service and interest cost | | $ | 5 | | $ | (4 | ) |
| Effect on postretirement benefit obligation | | $ | 32 | | $ | (38 | ) |
X Segment Information
IBM uses advanced IT to provide customer solutions. The company operates primarily in a single industry using several segments that create value by offering a variety of solutions that include, either singularly or in some combination, technologies, systems, products, services, software and financing.
Organizationally, the company's major operations comprise a Global Services segment; three hardware product segments—Systems Group, Personal Systems Group and Technology Group; a Software segment; a Global Financing segment; and an Enterprise Investments segment. The segments are determined based on several factors, including customer base, homogeneity of products, technology and delivery channels.
Information about each segment's business and the products and services that generate each segment's revenue is located in the "Description of Business" sections of the Management Discussion on pages 44 through 50 and page 60.
In the first quarter of 2001, the company reorganized the Personal Systems segment and renamed it the Personal and Printing Systems segment. In accordance with the organizational change, the company transferred the Printing Systems Division from the Technology segment to the Personal and Printing Systems segment. At the same time, the xSeries servers were transferred to the Enterprise Systems segment from the Personal Systems segment.
In 2003, the company renamed all of its hardware segments without changing the organization of these segments. The Enterprise Systems segment was renamed the Systems Group segment, the Personal and Printing Systems segment was renamed the Personal Systems Group segment and the Technology segment was renamed the Technology Group segment.
Due to the sale of the HDD business as described in note C, "Acquisitions/Divestitures," on pages 78 to 80 and consistent with the "Basis of Presentation" discussed in note A, "Significant Accounting Policies," on page 70, the income statement and cash flow statement information for the Technology Group segment has been reclassified to exclude or to separate the results of the discontinued HDD business.
Segment revenue and pre-tax income include transactions between the segments that are intended to reflect an arm's-length transfer price. Specifically, semiconductors are
100
sourced internally from the Technology Group segment for use in the manufacture of the Systems Group segment and Personal Systems Group segment products. In addition, hardware and software that are used by the Global Services segment in outsourcing engagements are mostly sourced internally from the Systems Group, Personal Systems Group and Software segments. For the internal use of IT services, the Global Services segment recovers cost, as well as a reasonable fee, reflecting the arm's-length value of providing the services. The Global Services segment enters into arm's-length leases at prices equivalent to market rates with the Global Financing segment to facilitate the acquisition of equipment used in services engagements. Generally, all internal transaction prices are reviewed and reset annually if appropriate.
The company uses shared-resources concepts to realize economies of scale and efficient use of resources. Thus, a considerable amount of expense is shared by all of the company's segments. This expense represents sales coverage, marketing and support functions such as Accounting, Treasury, Procurement, Legal, Human Resources, and Billing and Collections. Where practical, shared expenses are allocated based on measurable drivers of expense, e.g., headcount. When a clear and measurable driver cannot be identified, shared expenses are allocated on a financial basis that is consistent with the company's management system; e.g., image advertising is allocated based on the gross profit of the segments. The unallocated corporate amounts arising from certain acquisitions, indirect infrastructure reductions, certain IP income, miscellaneous tax items, HDD internal activity from continuing operations and the unallocated corporate expense pool are recorded in net income but are not allocated to the segments.
The following tables reflect the results of continuing operations of the segments consistent with the company's management system. These results are not necessarily a depiction that is in conformity with GAAP; e.g., employee retirement plan costs are developed using actuarial assumptions on a country-by-country basis and allocated to the segments on headcount. Different amounts could result if actuarial assumptions that are unique to the segment were used. Performance measurement is based on income before income taxes (pre-tax income). These results are used, in part, by management, both in evaluating the performance of, and in allocating resources to, each of the segments. The results for 2000 have been reclassified to reflect the organizational changes and product transfers made in 2001.
MANAGEMENT SYSTEM SEGMENT VIEW
| |
| | HARDWARE
| |
| |
| |
| |
| |
|---|
(dollars in millions)
FOR THE YEAR ENDED DECEMBER 31:
| | GLOBAL
SERVICES
| | SYSTEMS
GROUP
| | PERSONAL
SYSTEMS
GROUP
| | TECHNOLOGY
GROUP
| | SOFTWARE
| | GLOBAL
FINANCING
| | ENTERPRISE
INVESTMENTS
| | TOTAL
SEGMENTS
| |
|---|
| 2002: | | | | | | | | | | | | | | | | | | | | | | | | | |
| External revenue | | $ | 36,360 | | $ | 12,646 | | $ | 11,049 | | $ | 3,935 | | $ | 13,074 | | $ | 3,203 | | $ | 1,022 | | $ | 81,289 | |
| Internal revenue | | | 2,854 | | | 659 | | | 139 | | | 877 | | | 1,225 | | | 939 | | | 4 | | | 6,697 | |
| | |
| |
| |
| |
| |
| |
| |
| |
| |
| Total revenue | | $ | 39,214 | | $ | 13,305 | | $ | 11,188 | | $ | 4,812 | | $ | 14,299 | | $ | 4,142 | | $ | 1,026 | | $ | 87,986 | |
| | |
| |
| |
| |
| |
| |
| |
| |
| |
| Pre-tax income/(loss) | | $ | 3,657 | | $ | 1,561 | | $ | 57 | | $ | (1,057 | ) | $ | 3,556 | | $ | 955 | | $ | (293 | ) | $ | 8,436 | |
| | |
| |
| |
| |
| |
| |
| |
| |
| |
| Revenue year-to-year change | | | 4.3 | % | | (7.9 | )% | | (7.2 | )% | | (27.1 | )% | | 2.7 | % | | (2.4 | )% | | (8.6 | )% | | (2.2 | )% |
| Pre-tax income year-to-year change | | | (29.1 | )% | | (14.7 | )% | | 137.3 | % | | (697.2 | )% | | 12.2 | % | | (16.4 | )% | | 7.6 | % | | (23.4 | )% |
| Pre-tax income margin | | | 9.3 | % | | 11.7 | % | | 0.5 | % | | (22.0 | )% | | 24.9 | % | | 23.1 | % | | (28.6 | )% | | 9.6 | % |
| 2001: | | | | | | | | | | | | | | | | | | | | | | | | | |
| External revenue | | $ | 34,956 | | $ | 13,743 | | $ | 11,982 | | $ | 5,149 | | $ | 12,939 | | $ | 3,407 | | $ | 1,118 | | $ | 83,294 | |
| Internal revenue | | | 2,647 | | | 710 | | | 73 | | | 1,451 | | | 981 | | | 836 | | | 4 | | | 6,702 | |
| | |
| |
| |
| |
| |
| |
| |
| |
| |
| Total revenue | | $ | 37,603 | | $ | 14,453 | | $ | 12,055 | | $ | 6,600 | | $ | 13,920 | | $ | 4,243 | | $ | 1,122 | | $ | 89,996 | |
| | |
| |
| |
| |
| |
| |
| |
| |
| |
| Pre-tax income/(loss) | | $ | 5,161 | | $ | 1,830 | | $ | (153 | ) | $ | 177 | | $ | 3,168 | | $ | 1,143 | | $ | (317 | ) | $ | 11,009 | |
| | |
| |
| |
| |
| |
| |
| |
| |
| |
| Revenue year-to-year change | | | 5.7 | % | | (2.6 | )% | | (20.5 | )% | | (8.0 | )% | | 3.7 | % | | (4.5 | )% | | (18.2 | )% | | (2.2 | )% |
| Pre-tax income year-to-year change | | | 14.3 | % | | (4.8 | )% | | (251.5 | )% | | (74.6 | )% | | 13.4 | % | | (2.8 | )% | | (6.7 | )% | | 0.9 | % |
| Pre-tax income margin | | | 13.7 | % | | 12.7 | % | | (1.3 | )% | | 2.7 | % | | 22.8 | % | | 26.9 | % | | (28.3 | )% | | 12.2 | % |
| 2000: | | | | | | | | | | | | | | | | | | | | | | | | | |
| External revenue | | $ | 33,152 | | $ | 14,194 | | $ | 15,098 | | $ | 5,184 | | $ | 12,598 | | $ | 3,500 | | $ | 1,369 | | $ | 85,095 | |
| Internal revenue | | | 2,439 | | | 649 | | | 70 | | | 1,987 | | | 828 | | | 944 | | | 3 | | | 6,920 | |
| | |
| |
| |
| |
| |
| |
| |
| |
| |
| Total revenue | | $ | 35,591 | | $ | 14,843 | | $ | 15,168 | | $ | 7,171 | | $ | 13,426 | | $ | 4,444 | | $ | 1,372 | | $ | 92,015 | |
| | |
| |
| |
| |
| |
| |
| |
| |
| |
| Pre-tax income/(loss) | | $ | 4,517 | | $ | 1,922 | | $ | 101 | | $ | 696 | | $ | 2,793 | | $ | 1,176 | | $ | (297 | ) | $ | 10,908 | |
| | |
| |
| |
| |
| |
| |
| |
| |
| |
| Revenue year-to-year change | | | 2.2 | % | | 3.1 | % | | (3.0 | )% | | 8.9 | % | | 0.0 | % | | 9.6 | % | | (17.8 | )% | | 1.6 | % |
| Pre-tax income year-to-year change | | | 1.2 | % | | 21.3 | % | | 304.0 | % | | 205.3 | % | | (9.9 | )% | | 12.3 | % | | 57.4 | % | | 11.9 | % |
| Pre-tax income margin | | | 12.7 | % | | 12.9 | % | | 0.7 | % | | 9.7 | % | | 20.8 | % | | 26.5 | % | | (21.6 | )% | | 11.9 | % |
| | |
| |
| |
| |
| |
| |
| |
| |
| |
101
RECONCILIATIONS TO IBM AS REPORTED
(dollars in millions)
| | 2002
| | 2001
| | 2000
| |
|---|
| REVENUE: | | | | | | | | | | |
| Total reportable segments | | $ | 87,986 | | $ | 89,996 | | $ | 92,015 | |
| Other revenue and adjustments | | | (103 | ) | | (227 | ) | | (6 | ) |
| Elimination of internal revenue | | | (6,697 | ) | | (6,702 | ) | | (6,920 | ) |
| | |
| |
| |
| |
| Total IBM consolidated | | $ | 81,186 | | $ | 83,067 | | $ | 85,089 | |
| | |
| |
| |
| |
(dollars in millions)
| | 2002
| | 2001
| | 2000
|
|---|
| PRE-TAX INCOME: | | | | | | | | | |
| Total reportable segments | | $ | 8,436 | | $ | 11,009 | | $ | 10,908 |
| Elimination of internal transactions | | | (164 | ) | | 108 | | | 62 |
| Unallocated corporate amounts | | | (748 | ) | | 333 | | | 441 |
| | |
| |
| |
|
| Total IBM consolidated | | $ | 7,524 | | $ | 11,450 | | $ | 11,411 |
| | |
| |
| |
|
Immaterial Items
INVESTMENT IN EQUITY ALLIANCES AND EQUITY ALLIANCES GAINS/(LOSSES)
The investments in equity alliances and the resulting gains and (losses) from these investments that are attributable to the segments do not have a material effect on the financial position or the financial results of the segments.
Segment Assets and Other Items
The Global Services assets primarily are accounts receivable, maintenance inventory, and plant, property and equipment including those associated with the segment's outsourcing business. The assets of the Hardware segments primarily are inventory and plant, property and equipment. The Software segment assets mainly are plant, property and equipment, and investment in capitalized software. The assets of the Global Financing segment are primarily financing receivables and fixed assets under operating leases.
To accomplish the efficient use of the company's space and equipment, it usually is necessary for several segments to share plant, property and equipment assets. Where assets are shared, landlord ownership of the assets is assigned to one segment and is not allocated to each user segment. This is consistent with the company's management system and is reflected accordingly in the schedule on page 103. In those cases, there will not be a precise correlation between segment pre-tax income and segment assets.
Similarly, the depreciation amounts reported by each segment are based on the assigned landlord ownership and may not be consistent with the amounts that are included in the segments' pre-tax income. The amounts that are included in pre-tax income reflect occupancy charges from the landlord segment and are not specifically identified by the management reporting system. Capital expenditures that are reported by each segment also are in line with the landlord ownership basis of asset assignment.
The Global Financing segment amounts on page 103 for Interest income and Cost of Global Financing interest expense reflect the interest income and interest expense associated with the Global Financing business, including the intercompany financing activities discussed on page 60 as well as the income from the investment in cash and marketable securities. The explanation of the difference between Cost of Global Financing and Interest expense for segment presentation versus presentation in the Consolidated Statement of Earnings is included on page 63 of the Management Discussion.
102
MANAGEMENT SYSTEM SEGMENT VIEW
| |
| | HARDWARE
| |
| |
| |
| |
|
|---|
(dollars in millions)
| | GLOBAL
SERVICES
| | SYSTEMS
GROUP
| | PERSONAL
SYSTEMS
GROUP
| | TECHNOLOGY
GROUP
| | SOFTWARE
| | GLOBAL
FINANCING
| | ENTERPRISE
INVESTMENTS
| | TOTAL
SEGMENTS
|
|---|
| 2002: | | | | | | | | | | | | | | | | | | | | | | | | |
| Assets | | $ | 14,462 | | $ | 3,124 | | $ | 1,776 | | $ | 5,771 | | $ | 3,361 | | $ | 35,242 | | $ | 88 | | $ | 63,824 |
| Depreciation/amortization: | | | | | | | | | | | | | | | | | | | | | | | | |
| | Continuing operations | | | 1,213 | | | 335 | | | 116 | | | 1,167 | | | 809 | | | 2,413 | | | 8 | | | 6,061 |
| | Discontinued operations | | | — | | | — | | | — | | | 617 | | | — | | | — | | | — | | | 617 |
| Capital expenditures/investment in software: | | | | | | | | | | | | | | | | | | | | | | | | |
| | Continuing operations | | | 1,294 | | | 307 | | | 96 | | | 1,365 | | | 687 | | | 2,561 | | | 9 | | | 6,319 |
| | Discontinued operations | | | — | | | — | | | — | | | 323 | | | — | | | — | | | — | | | 323 |
| Interest income | | | — | | | — | | | — | | | — | | | — | | | 2,703 | | | — | | | 2,703 |
| Interest expense | | | — | | | — | | | — | | | — | | | — | | | 825 | | | — | | | 825 |
2001: |
|
|
|
|
|
|
|
|
|
|
|
|
|
|
|
|
|
|
|
|
|
|
|
|
| Assets | | $ | 10,340 | | $ | 3,208 | | $ | 1,904 | | $ | 9,136 | | $ | 3,356 | | $ | 36,670 | | $ | 106 | | $ | 64,720 |
| Depreciation/amortization: | | | | | | | | | | | | | | | | | | | | | | | | |
| | Continuing operations | | | 1,219 | | | 308 | | | 131 | | | 676 | | | 782 | | | 2,476 | | | 8 | | | 5,600 |
| | Discontinued operations | | | — | | | — | | | — | | | 429 | | | — | | | — | | | — | | | 429 |
| Capital expenditures/investment in software: | | | | | | | | | | | | | | | | | | | | | | | | |
| | Continuing operations | | | 1,519 | | | 390 | | | 128 | | | 1,495 | | | 839 | | | 3,143 | | | 7 | | | 7,521 |
| | Discontinued operations | | | — | | | — | | | — | | | 360 | | | — | | | — | | | — | | | 360 |
| Interest income | | | — | | | — | | | — | | | — | | | — | | | 2,941 | | | — | | | 2,941 |
| Interest expense | | | — | | | — | | | — | | | — | | | — | | | 1,140 | | | — | | | 1,140 |
2000: |
|
|
|
|
|
|
|
|
|
|
|
|
|
|
|
|
|
|
|
|
|
|
|
|
| Assets | | $ | 10,492 | | $ | 3,451 | | $ | 2,448 | | $ | 9,316 | | $ | 2,488 | | $ | 40,822 | | $ | 246 | | $ | 69,263 |
| Depreciation/amortization: | | | | | | | | | | | | | | | | | | | | | | | | |
| | Continuing operations | | | 1,243 | | | 425 | | | 154 | | | 649 | | | 665 | | | 2,696 | | | 12 | | | 5,844 |
| | Discontinued operations | | | — | | | — | | | — | | | 411 | | | — | | | — | | | — | | | 411 |
| Capital expenditures/investment in software: | | | | | | | | | | | | | | | | | | | | | | | | |
| | Continuing operations | | | 1,311 | | | 325 | | | 180 | | | 1,326 | | | 770 | | | 2,898 | | | 9 | | | 6,819 |
| | Discontinued operations | | | — | | | — | | | — | | | 418 | | | — | | | — | | | — | | | 418 |
| Interest income | | | — | | | — | | | — | | | — | | | — | | | 3,051 | | | — | | | 3,051 |
| Interest expense | | | — | | | — | | | — | | | — | | | — | | | 1,319 | | | — | | | 1,319 |
| | |
| |
| |
| |
| |
| |
| |
| |
|
RECONCILIATIONS TO IBM AS REPORTED
(dollars in millions)
| | 2002
| | 2001*
| | 2000*
| |
|---|
| Assets: | | | | | | | | | | |
| Total reportable segments | | $ | 63,824 | | $ | 64,720 | | $ | 69,263 | |
| Elimination of internal transactions | | | (5,061 | ) | | (4,884 | ) | | (5,300 | ) |
| Unallocated amounts: | | | | | | | | | | |
| | Cash and marketable securities | | | 4,568 | | | 5,313 | | | 2,268 | |
| | Notes and accounts receivable | | | 3,553 | | | 2,810 | | | 3,145 | |
| | Deferred tax assets | | | 6,631 | | | 4,624 | | | 5,498 | |
| | Plant, other property and equipment | | | 3,239 | | | 3,260 | | | 3,798 | |
| | Pension assets | | | 15,996 | | | 11,398 | | | 8,872 | |
| | Other | | | 3,734 | | | 3,062 | | | 2,868 | |
| | |
| |
| |
| |
| Total IBM consolidated | | $ | 96,484 | | $ | 90,303 | | $ | 90,412 | |
| | |
| |
| |
| |
- *
- Reclassified to conform with 2002 presentation.
103
Revenue by Classes of Similar Products or Services
For the Personal Systems Group, Software and Global Financing segments, the segment data on page 101 represents the revenue contributions from the products that are contained in the segments and that are basically similar in nature. The following table provides external revenue for similar classes of products within the Technology Group, Systems Group, Global Services and Enterprise Investments segments. The Technology Group segment's OEM hardware comprises revenue primarily from the sale of semiconductors and display devices. Technology services comprise the Technology Group's existing circuit design business for its OEM customers and the new component design services, strategic outsourcing of customer's design team work, and technology and manufacturing consulting services associated with the new Engineering and Technology Services Division. The Systems Group segment's storage comprises revenue from the Enterprise Storage Server, other disk storage products and tape subsystems. Enterprise Investments software revenue is primarily from product life-cycle management products. The following table on the right is presented on a continuing operations basis.
| | CONSOLIDATED
|
|---|
(dollars in millions)
|
|---|
| | 2002
| | 2001*
| | 2000*
|
|---|
| Technology Group: | | | | | | | | | |
| | OEM | | $ | 3,612 | | $ | 4,805 | | $ | 4,900 |
| | Technology services | | | 323 | | | 344 | | | 284 |
| Systems Group: | | | | | | | | | |
| | Servers | | $ | 10,047 | | $ | 10,947 | | $ | 11,497 |
| | Storage | | | 2,581 | | | 2,755 | | | 2,539 |
| | Networking products | | | 18 | | | 41 | | | 158 |
| Global Services: | | | | | | | | | |
| | Services | | $ | 31,290 | | $ | 29,953 | | $ | 28,036 |
| | Maintenance | | | 5,070 | | | 5,003 | | | 5,116 |
| Enterprise Investments: | | | | | | | | | |
| | Software | | $ | 916 | | $ | 913 | | $ | 1,077 |
| | Hardware | | | 95 | | | 181 | | | 238 |
| | Others | | | 11 | | | 24 | | | 54 |
| | |
| |
| |
|
- *
- Reclassified to conform with 2002 presentation.
Major Customers
No single customer represents 10 percent or more of the company's total revenue.
Geographic Information
| | REVENUE*
| | LONG-LIVED ASSETS**
|
|---|
(dollars in millions)
|
|---|
| | 2002
| | 2001
| | 2000
| | 2002
| | 2001+
| | 2000+
|
|---|
| United States | | $ | 32,759 | | $ | 34,233 | | $ | 35,713 | | $ | 27,889 | | $ | 22,800 | | $ | 21,449 |
| Japan | | | 10,939 | | | 11,512 | | | 12,122 | | | 2,814 | | | 4,034 | | | 4,319 |
| Other countries | | | 37,488 | | | 37,322 | | | 37,254 | | | 13,027 | | | 11,560 | | | 12,092 |
| | |
| |
| |
| |
| |
| |
|
| Total | | $ | 81,186 | | $ | 83,067 | | $ | 85,089 | | $ | 43,730 | | $ | 38,394 | | $ | 37,860 |
| | |
| |
| |
| |
| |
| |
|
- *
- Revenues are attributed to countries based on location of customer and are for continuing operations.
- **
- Includes all non-current assets except non-current financial instruments and deferred tax assets.
- +
- Reclassified to conform with 2002 presentation.
Y Subsequent Events
On January 21, 2003, the company filed with the Securities and Exchange Commission a shelf registration to periodically sell up to $20 billion in debt securities, preferred and capital stock, depositary shares and warrants. The company may sell securities in one or more separate offerings with the size, price and terms to be determined at the time of sale. The net proceeds from the sale of the securities will be used for general corporate purposes, which may include debt repayment, investments in or extensions of credit to its subsidiaries, redemption of any preferred stock the company may issue, or financing of possible acquisitions or business expansion. The net proceeds may be invested temporarily or applied to repay short-term debt until they are used for their stated purpose.
Consistent with the company's strategy to concentrate borrowing at the IBM level, this shelf registration eliminates the need for a shelf registration associated with its U.S. financing subsidiary, IBM Credit Corporation (ICC). The ICC shelf will be terminated shortly after the effective date of the new IBM shelf.
On February 21, 2003, the company purchased the outstanding stock of Rational Software Corp. (Rational) for approximately $2.1 billion in cash. Rational provides open, industry standard tools, best practices and services for developing business applications and building software products and systems. The Rational acquisition provides the company with the ability to offer a complete software development environment for customers. The company intends to merge Rational's business operations and employees into the IBM Software Group as a new division and brand. The results of operations of Rational will be included in the company's Consolidated Financial Statements as of February 21, 2003. The company has not completed the allocation of the purchase price related to the Rational acquisition as it is in the process of identifying and determining the fair value of all assets acquired and liabilities assumed.
104
Five-Year Comparison of Selected Financial Data
(dollars in millions except per share amounts)
FOR THE YEAR:
| | 2002
| | 2001
| | 2000
| | 1999
| | 1998
| |
|---|
| Revenue | | $ | 81,186 | | $ | 83,067 | | $ | 85,089 | | $ | 83,334 | | $ | 77,548 | |
| Income from continuing operations | | | 5,334 | | | 8,146 | | | 7,874 | | | 7,359 | | | 5,469 | |
| (Loss)/income from discontinued operations | | | (1,755 | ) | | (423 | ) | | 219 | | | 353 | | | 859 | |
| Net income | | | 3,579 | | | 7,723 | | | 8,093 | | | 7,712 | | | 6,328 | |
| Earnings/(loss) per share of common stock: | | | | | | | | | | | | | | | | |
| | Assuming dilution: | | | | | | | | | | | | | | | | |
| | | Continuing operations | | | 3.07 | | | 4.59 | | | 4.32 | | | 3.93 | | | 2.84 | |
| | | Discontinued operations | | | (1.01 | ) | | (0.24 | ) | | 0.12 | | | 0.19 | | | 0.45 | |
| | |
| |
| |
| |
| |
| |
| Total | | | 2.06 | | | 4.35 | | | 4.44 | | | 4.12 | | | 3.29 | |
| | Basic: | | | | | | | | | | | | | | | | |
| | | Continuing operations | | | 3.13 | | | 4.69 | | | 4.45 | | | 4.06 | | | 2.92 | |
| | | Discontinued operations | | | (1.03 | ) | | (0.24 | ) | | 0.12 | | | 0.20 | | | 0.46 | |
| | |
| |
| |
| |
| |
| |
| Total | | | 2.10 | | | 4.45 | | | 4.58 | * | | 4.25 | * | | 3.38 | |
| Cash dividends paid on common stock | | | 1,005 | | | 956 | | | 909 | | | 859 | | | 814 | |
| | Per share of common stock | | | 0.59 | | | 0.55 | | | 0.51 | | | 0.47 | | | 0.43 | |
| Investment in plant, rental machines and other property | | | 5,022 | | | 5,660 | | | 5,616 | | | 5,959 | | | 6,520 | |
| Return on stockholders' equity | | | 15.5 | % | | 35.3 | %** | | 40.0 | %** | | 39.1 | %** | | 32.7 | %** |
AT END OF YEAR: |
|
|
|
|
|
|
|
|
|
|
|
|
|
|
|
|
| Total assets | | $ | 96,484 | | $ | 90,303 | ** | $ | 90,412 | ** | $ | 89,571 | ** | $ | 88,160 | ** |
| Net investment in plant, rental machines and other property | | | 14,440 | | | 16,504 | | | 16,714 | | | 17,590 | | | 19,631 | |
| Working capital | | | 7,102 | | | 7,342 | | | 7,474 | | | 3,577 | | | 5,533 | |
| Total debt | | | 26,017 | | | 27,151 | | | 28,576 | | | 28,354 | | | 29,413 | |
| Stockholders' equity | | | 22,782 | | | 23,448 | ** | | 20,550 | ** | | 20,426 | ** | | 19,383 | ** |
| | |
| |
| |
| |
| |
| |
- *
- Does not total due to rounding.
- **
- Reclassified to conform with 2002 presentation.
105
Selected Quarterly Data
(dollars in millions except per share amounts and stock prices)
2002:
| | FIRST
QUARTER
| | SECOND
QUARTER
| | THIRD
QUARTER
| | FOURTH
YEAR
| | FULL
QUARTER
| |
|---|
| Revenue | | $ | 18,030 | | $ | 19,651 | | $ | 19,821 | | $ | 23,684 | | $ | 81,186 | |
| Gross profit | | | 6,500 | | | 7,270 | | | 7,323 | | | 9,191 | | | 30,284 | |
| Income from continuing operations | | | 1,284 | | | 445 | * | | 1,694 | | | 1,911* | | | 5,334 | |
| Loss from discontinued operations | | | (92 | ) | | (389 | ) | | (381 | ) | | (893 | ) | | (1,755 | ) |
| Netincome | | | 1,192 | | | 56 | | | 1,313 | | | 1,018 | | | 3,579 | |
| Earnings/(loss) per share of common stock: | | | | | | | | | | | | | | | | |
| | Assuming dilution: | | | | | | | | | | | | | | | | |
| | | Continuing operations | | | 0.73 | | | 0.25 | | | 0.99 | | | 1.11 | | | 3.07 | ** |
| | | Discontinued operations | | | (0.05 | ) | | (0.22 | ) | | (0.22 | ) | | (0.52 | ) | | (1.01 | ) |
| | |
| |
| |
| |
| |
| |
| Total | | | 0.68 | | | 0.03 | | | 0.76 | + | | 0.59 | | | 2.06 | |
| Basic: | | | | | | | | | | | | | | | | |
| Continuing operations | | | 0.75 | | | 0.26 | | | 1.00 | | | 1.12 | | | 3.13 | |
| Discontinued operations | | | (0.05 | ) | | (0.23 | ) | | (0.23 | ) | | (0.53 | ) | | (1.03) | ** |
| | |
| |
| |
| |
| |
| |
| Total | | | 0.69 | + | | 0.03 | | | 0.78 | + | | 0.60 | + | | 2.10 | |
| Dividends per share of common stock | | | 0.14 | | | 0.15 | | | 0.15 | | | 0.15 | | | 0.59 | |
| Stock prices:++ | | | | | | | | | | | | | | | | |
| | High | | $ | 126.39 | | $ | 104.00 | | $ | 82.85 | | $ | 89.46 | | | | |
| | Low | | | 95.76 | | | 66.10 | | | 57.99 | | | 54.01 | | | | |
| | |
| |
| |
| |
| |
| |
2001:
| | FIRST
QUARTER
| | SECOND
QUARTER
| | THIRD
QUARTER
| | FOURTH
YEAR
| | FULL
QUARTER
| |
|---|
| Revenue | | $ | 20,309 | | $ | 20,834 | | $ | 19,783 | | $ | 22,141 | | $ | 83,067 | |
| Gross profit | | | 7,535 | | | 7,987 | | | 7,434 | | | 8,933 | | | 31,889 | |
| Income from continuing operations | | | 1,777 | | | 2,091 | | | 1,713 | | | 2,565 | | | 8,146 | |
| Loss from discontinued operations | | | (27 | ) | | (46 | ) | | (118 | ) | | (232 | ) | | (423 | ) |
| Net income | | | 1,750 | | | 2,045 | | | 1,595 | | | 2,333 | | | 7,723 | |
| Earnings/(loss) per share of common stock: | | | | | | | | | | | | | | | | |
| | Assuming dilution: | | | | | | | | | | | | | | | | |
| | | Continuing operations | | | 1.00 | | | 1.17 | | | 0.97 | | | 1.46 | | | 4.59 | ** |
| | | Discontinued operations | | | (0.02 | ) | | (0.03 | ) | | (0.07 | ) | | (0.13 | ) | | (0.24) | ** |
| | |
| |
| |
| |
| |
| |
| Total | | | 0.98 | | | 1.15 | + | | 0.90 | | | 1.33 | | | 4.35 | ** |
| | Basic: | | | | | | | | | | | | | | | | |
| | | Continuing operations | | | 1.02 | | | 1.20 | | | 0.99 | | | 1.49 | | | 4.69 | ** |
| | | Discontinued operations | | | (0.02 | ) | | (0.03 | ) | | (0.07 | ) | | (0.14 | ) | | (0.24) | ** |
| | |
| |
| |
| |
| |
| |
| Total | | | 1.00 | | | 1.17 | | | 0.92 | | | 1.35 | | | 4.45 | ** |
| Dividends per share of common stock | | | 0.13 | | | 0.14 | | | 0.14 | | | 0.14 | | | 0.55 | |
| Stock prices:++ | | | | | | | | | | | | | | | | |
| | High | | $ | 118.64 | | $ | 119.90 | | $ | 115.40 | | $ | 124.70 | | | | |
| | Low | | | 83.75 | | | 90.05 | | | 87.49 | | | 91.34 | | | | |
| | |
| |
| |
| |
| |
| |
- *
- The company executed special actions in the second and fourth quarter of 2002 recording charges of $1,727 million and $322 million, respectively. See note S, "2002 Actions" on pages 90 through 92 for additional information regarding these actions.
- **
- Earnings Per Share (EPS) in each quarter is computed using the weighted-average number of shares outstanding during that quarter while EPS for the full year is computed using the weighted-average number of shares outstanding during the year. Thus, the sum of the four quarters' EPS does not equal the full-year EPS.
- +
- Does not total due to rounding.
- ++
- The stock prices reflect the high and low prices for IBM's common stock on the New York Stock Exchange composite tape for the last two years.
106
Stockholder Information
IBM Stockholder Services
Stockholders with questions about their accounts should contact:
EquiServe Trust Company, N.A.
P.O. Box 43072
Providence, Rhode Island 02940-3072
(888) IBM-6700
Investors residing outside the United States, Canada and Puerto Rico should call (781) 575-2727.
Stockholders can also reach EquiServe Trust Company, N.A. via e-mail at: ibm@equiserve.com
Hearing-impaired stockholders with access to a telecommunications device (TDD) can communicate directly with EquiServe Trust Company, N.A., by calling (800) 490-1493. Stockholders residing outside the United States, Canada and Puerto Rico should call (781) 575-2694.
IBM on the Internet
Topics featured in this Annual Report can be found via the IBM home page on the Internet (www.ibm.com). Financial results, news on IBM products, services and other activities can also be found via that address. Stockholders of record can receive online account information and answers to frequently asked questions regarding stockholder accounts via the internet (www.ibm.com/investor).
Stockholders of record can also consent to receive future IBM Annual Reports and Proxy Statements online through the Internet at this site.
IBM files reports with the Securities and Exchange Commission (SEC), including annual reports on Form 10-K, quarterly reports on Form 10-Q, current reports on Form 8-K and any other filings required by the SEC.
IBM's website (www.ibm.com) contains a significant amount of information about IBM, including our annual report on Form 10-K, quarterly reports on Form 10-Q, current reports on Form 8-K, and all amendments to those reports as soon as reasonably practicable after such material is electronically filed with or furnished to the SEC (http://www.ibm.com/investor/). These materials are available free of charge on or through our website.
The public may read and copy any materials we file with the SEC at the SEC's Public Reference Room at 450 Fifth Street, NW, Washington, DC20549. The public may obtain information on the operation of the Public Reference Room by calling the SEC at 1-800-SEC-0330. The SEC maintains an Internet site (http://www.sec.gov) that contains reports, proxy and information statements, and other information regarding issuers that file electronically with the SEC.
IBM Investor Services Program
The Investor Services Program brochure outlines a number of services provided for IBM stockholders and potential IBM investors, including the reinvestment of dividends, direct purchase and the deposit of IBM stock certificates for safekeeping. Call (888) 421-8860 for a copy of the brochure. Investors residing outside the United States, Canada and Puerto Rico should call (781) 575-2727.
Investors with other requests may write to:
IBM Corporation
Stockholder Relations
New Orchard Road
Armonk, New York 10504
IBM Stock
IBM common stock is listed on the New York Stock Exchange and on other exchanges in the United States and around the world.
Annual Meeting
The IBM Annual Meeting of Stockholders will be held on Tuesday, April 29, 2003, at 10 a.m. at the Kansas City Convention Center, 201 West 14th Street, Kansas City, Missouri.
Stockholder Communications
Stockholders in the United States and Canada can get quarterly financial results, listen to a summary of the Annual Meeting remarks and hear voting results from the meeting by calling (800) IBM-7800. Callers can also request printed copies of the information via mail or fax. Stockholders residing outside the United States, Canada and Puerto Rico should call (402) 573-9861.
Literature for IBM Stockholders
The following literature on IBM is available without charge from:
EquiServe Trust Company, N.A.
P.O. Box 43072
Providence, Rhode Island 02940-3072
(888) IBM-6700
Investors residing outside the United States, Canada and Puerto Rico should call (781) 575-2727.
The Form 10-K Annual Report and Form 10-Q Quarterly Reports to the SEC provide additional information on IBM's business. The 10-K report is released in March; 10-Q reports are released in May, August and November.
An audio cassette recording of the 2002 Annual Report will be available for sight-impaired stockholders in June.
"A Blueprint, IBM Corporate Citizenship" reports on IBM's community relations programs around the world and IBM's commitment to education.
"IBM Environment and Well-Being: Progress Report" reports on IBM's health and safety, environmental and energy programs.
"Valuing Diversity: An Ongoing Commitment" communicates to the company's entire community of employees, customers, stockholders, vendors, suppliers, business partners and employment applicants the importance IBM places on the diversity of the company's workplace and marketplace.
General Information
For answers to general questions about IBM from within the continental United States, call (800) IBM-4YOU. From outside the United States, call (404) 238-1234.
Corporate Offices
International Business Machines Corporation
New Orchard Road
Armonk, New York 10504
(914) 499-1900
| |
|
|---|
 | | The IBM Annual Report is printed on recycled paper and is recyclable. |
DB2, e-business on demand, eServer, IBM, iSeries, Selectric, System/360, ThinkVantage, WebSphere, xSeries and zSeries are trademarks of International Business Machines Corporation or its wholly owned subsidiaries. Intel is a trademark of Intel Corporation.Linux is a trademark of Linus Torvalds. Lotus is a trademark of Lotus Development Corporation. Tivoli is a trademark of Tivoli Systems, Inc. Microsoft is a trademark of Microsoft Corporation. UNIX is a registered trademark of The Open Group in the United States and other countries. Other company, product and service names may be trademarks or service marks of others.
| |
|
|---|
| Printed in U.S. | | G507-0501-08 |
107
Board of Directors and Senior Executive Officers
Board of Directors
Cathleen Black
President
Hearst Magazines
Kenneth I. Chenault
Chairman and
Chief Executive Officer
American Express Company
Juergen Dormann*
Chairman of the Board
President and
Chief Executive Officer
ABB Ltd.
Nannerl O. Keohane
President
Duke University
Charles F. Knight
Chairman of the Board
Emerson Electric Company | | Minoru Makihara*
Chairman of the Board
Mitsubishi Corporation
Lucio A. Noto
Managing Partner
Midstream Partners LLC
Samuel J. Palmisano
Chairman of the Board
President and
Chief Executive Officer
IBM
John B. Slaughter
President and
Chief Executive Officer
National Action Council for
Minorities in Engineering, Inc. | | Sidney Taurel
Chairman of the Board
President and
Chief Executive Officer
Eli Lilly and Company
Alex Trotman
Chairman of the Board
Imperial Chemical
Industries PLC
Charles M. Vest
President
Massachusetts Institute
of Technology
* Retiring effective April 29, 2003 |
Senior Executive Officers
Nicholas M. Donofrio
Senior Vice President
Technology and
Manufacturing
Douglas T. Elix
Senior Vice President
and Group Executive
Global Services
Jesse J. Greene, Jr.
Vice President and
Treasurer
J. Bruce Harreld
Senior Vice President
Strategy
Paul M. Horn
Senior Vice President
Research
Jon C. Iwata
Senior Vice President
Communications
John R. Joyce
Senior Vice President and
Chief Financial Officer | | John E. Kelly III
Senior Vice President
and Group Executive
Technology Group
Abby F. Kohnstamm
Senior Vice President
Marketing
J. Michael Lawrie
Senior Vice President
and Group Executive
Sales and Distribution
Edward M. Lineen
Senior Vice President
and General Counsel
Mark Loughridge
Senior Vice President
and General Manager
Global Financing
J. Randall MacDonald
Senior Vice President
Human Resources
Steven A. Mills
Senior Vice President
and Group Executive
Software Group
Robert W. Moffat, Jr.
Senior Vice President
Integrated Supply Chain | | Daniel E. O'Donnell
Vice President
Assistant General Counsel
and Secretary
Samuel J. Palmisano
Chairman of the Board
President and
Chief Executive Officer
Linda S. Sanford
Senior Vice President
Enterprise On Demand
Transformation and
Information Technology
Stephen M. Ward, Jr.
Senior Vice President
and General Manager
Personal Systems Group
Robert F. Woods
Vice President and
Controller
William M. Zeitler
Senior Vice President
and Group Executive
Systems Group |
QuickLinks
Financial ReportReport of ManagementReport of Independent AccountantsManagement DiscussionConsolidated Statement of EarningsConsolidated Statement of Financial PositionConsolidated Statement of Cash FlowsNotes to Consolidated Financial StatementsFive-Year Comparison of Selected Financial DataSelected Quarterly DataStockholder InformationBoard of DirectorsSenior Executive Officers