UNITED STATES
SECURITIES AND EXCHANGE COMMISSION
WASHINGTON, D.C. 20549
FORM 8-K
CURRENT REPORT PURSUANT TO SECTION 13 OR 15 (d)
OF THE SECURITIES EXCHANGE ACT OF 1934
Date of Report: May 20, 2005
(Date of earliest event reported)
INTERNATIONAL BUSINESS MACHINES CORPORATION
(Exact name of registrant as specified in its charter)
New York |
| 1-2360 |
| 13-0871985 |
(State of Incorporation) |
| (Commission File Number) |
| (IRS employer Identification No.) |
|
|
|
|
|
ARMONK, NEW YORK |
| 10504 | ||
(Address of principal executive offices) |
| (Zip Code) | ||
914-499-1900
(Registrant’s telephone number)
Check the appropriate box below if the Form 8-K filing is intended to simultaneously satisfy the filing obligation of the registrant under any of the following provisions:
o Written communications pursuant to Rule 425 under the Securities Act (17 CFR 230.425)
o Soliciting material pursuant to Rule 14a-12 under the Exchange Act (17 CFR 240.14a-12)
o Pre-commencement communications pursuant to Rule 14d-2(b) under the Exchange Act (17 CFR 240.14d-2(b))
o Pre-commencement communications pursuant to Rule 13e-4(c) under the Exchange Act (17 CFR 240.13e-4(c))
Item 7.01 (Regulation FD Disclosure)
Attachment I contains presentation materials for IBM’s May 20, 2005 Investors’ Briefing by IBM’s Chairman and CEO and other senior IBM executives. This information is hereby furnished.
IBM’s web site (www.ibm.com) contains a significant amount of information about IBM, including financial and other information for investors (www.ibm.com/investor/). IBM encourages investors to visit its various web sites from time to time, as information is updated and new information is posted.
2
SIGNATURE
Pursuant to the requirements of the Securities Exchange Act of 1934, the registrant has duly caused this report to be signed on its behalf by the undersigned, hereunto duly authorized.
Date: May 20, 2005
| By: | /s/ | Andrew Bonzani |
|
|
|
| (Andrew Bonzani) | |
|
|
| Assistant Secretary & | |
|
| Associate General Counsel | ||
3
ATTACHMENT I
4
Exhibit 99.1
Link to searchable text of slide shown above
Link to searchable text of slide shown above
Link to searchable text of slide shown above
Good morning. I’d like to welcome you to this briefing for IBM investors.
I’m joined today by Mark Loughridge, our CFO, and the senior leaders of our major business units. Together, we’ll provide a perspective on IBM’s strategy and operations.
This is an important time for the industry and for IBM. It’s also a potentially confusing time for investors. It’s easy to intermix near-term issues with longer-term shifts, cyclical effects with more fundamental change.
That’s why we changed the agenda for today’s meeting. In previous years, you will recall that we used to separate these two sets of issues. We would give you a strategic update at the spring meeting, and focus on operational issues in the fall.
This year, we have combined the two. I will cover our long-term, strategic business model with you. Then the leaders of our business units will cover the executional actions we are taking to improve our performance and address opportunities going forward.
So before I turn it over to my colleagues, I’d like to provide some context. I think it would be helpful in understanding what we’ve been doing at IBM and why.
All of the major moves we’ve made at IBM over the past three or four years have been based on a small number of strategic choices ...
• choices that were made based on our understanding of where technology, client requirements, and global business were headed ...
1
• choices designed to maintain IBM’s leadership of a rapidly changing industry ...
• and to continue to generate consistent, high returns on invested capital for our owners.
Let me briefly review and comment on the major strategic choices. There are three.
First, we decided that IBM would lead the IT industry shift to the era of on demand business.
As we have discussed with you before, on demand business is our way of describing a fundamental industry shift in computing architecture and how it is applied to business. Others have referred to this as the “organic enterprise” or “adaptive enterprise.”
Whatever name you choose, it represents a shift in enterprise client buying behavior toward integrated solutions that draw on point products, and a shift toward providing quantifiable business value, not just technology features and functions. These shifts are well underway.
As you know, over many years the IT industry has progressively automated distinct operations and processes within companies — the back office, the factory floor, the desktop, the supply chain. Now, technology can enable — and our clients’ business demands require — a more integrated, end-to-end approach.
At the business process level, this means breaking down the silos that segregate one business operation from another, and creating common, optimized, and integrated processes that operate horizontally, across the enterprise.
2
This may sound simplistic, but implementing this kind of operating model requires extensive business transformation. And that, in turn, requires process-specific and industry-specific expertise.
The goal: Fusing advanced technology with business design to create an integrated, more flexible and responsive enterprise.
This is a change in how the IT industry engages with enterprise customers and in how it applies technology. This shift is reflected in market opportunity, which Mark Loughridge will show you in more detail.
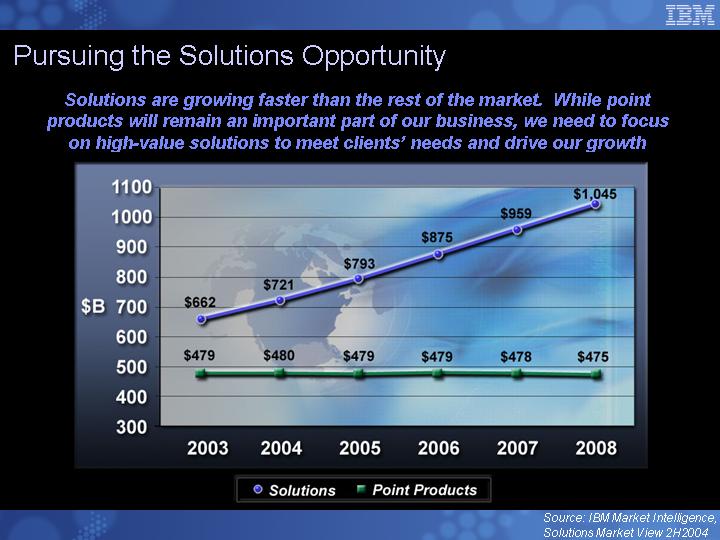
The bottom line is that these business value opportunities are growing faster than traditional point products, and they give us a much stronger relationship with enterprises.
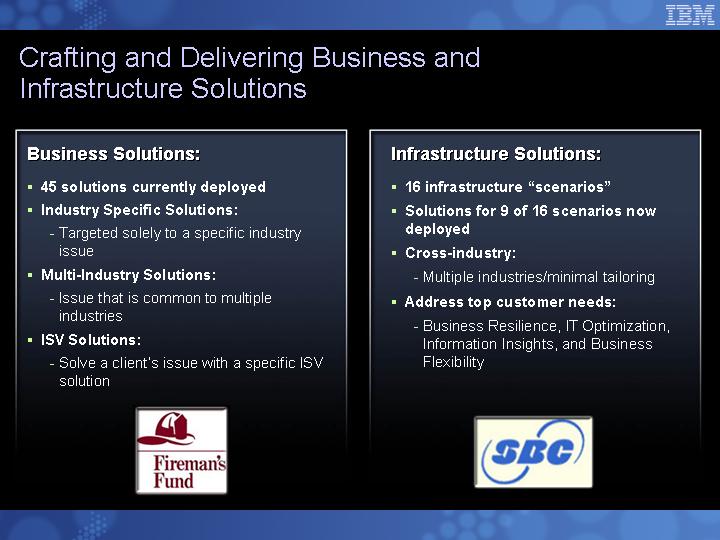
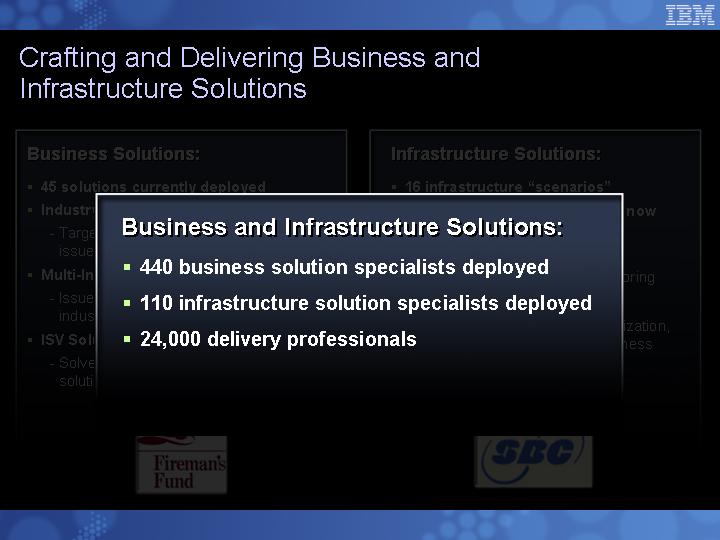
You know what we have done in recent years to strengthen our capability in business process and industry expertise — not just consulting skills, but also software and delivery capability specific to business processes and industry requirements.
Enabling these new business designs requires a different computing infrastructure.
• Instead of islands of computing distributed throughout the enterprise, it is more integrated.
• Instead of proprietary architectures, which impede integration and interoperability, it is based on open standards.
• And it exploits powerful new technologies like self-management and virtualization, which lower the cost of computing, while improving resiliency and security.
3
We have made significant investments in the strategic technologies to build out this new computing infrastructure.
It is well known that IBM is committed to open standards. This was recently confirmed when we announced our intent to acquire Gluecode, an open-source software company.
We have also substantially strengthened our middleware business, and — after years of R&D — brought to market game-changing technologies.
One example is the more than $1 billion we have invested in our Power 4 and 5 architectures. This has enabled our servers to gain 10 points of share over the last four and a half years.
It has also put IBM at the core of future video game consoles, where Power is the technology of choice for the top three players in this market.
Steve Mills and Bill Zeitler will expand upon what we’ve done to strengthen our software and hardware businesses today.
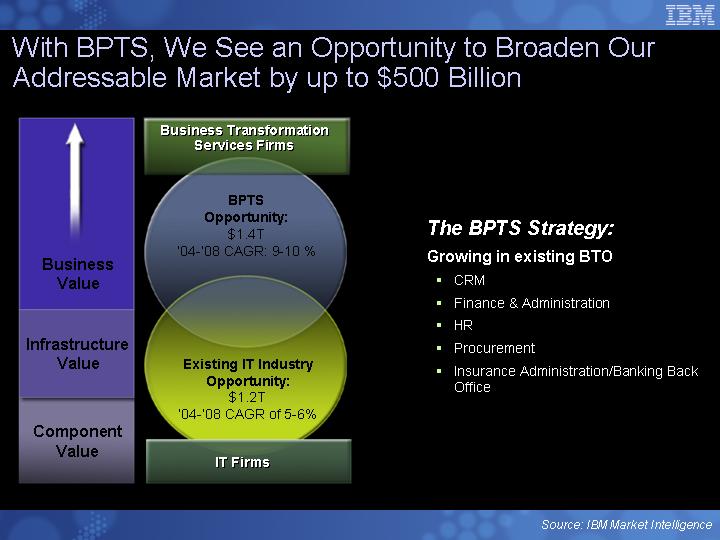
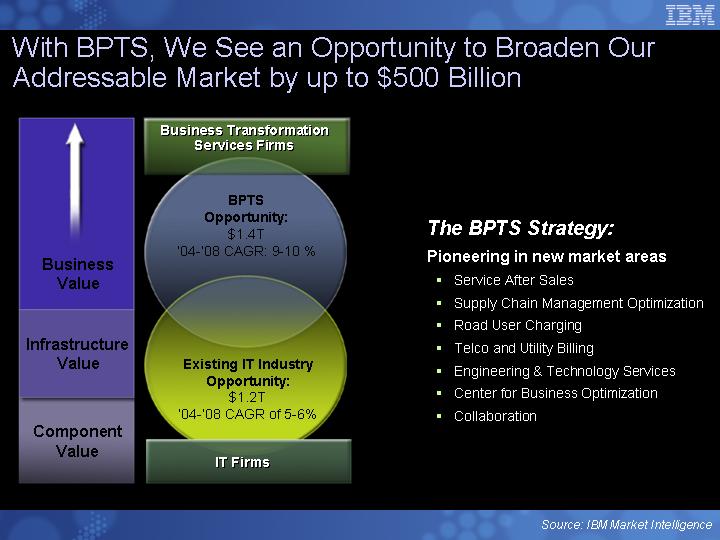
At our session with investors last year, I described a substantial growth opportunity stemming from the shift to on demand business.
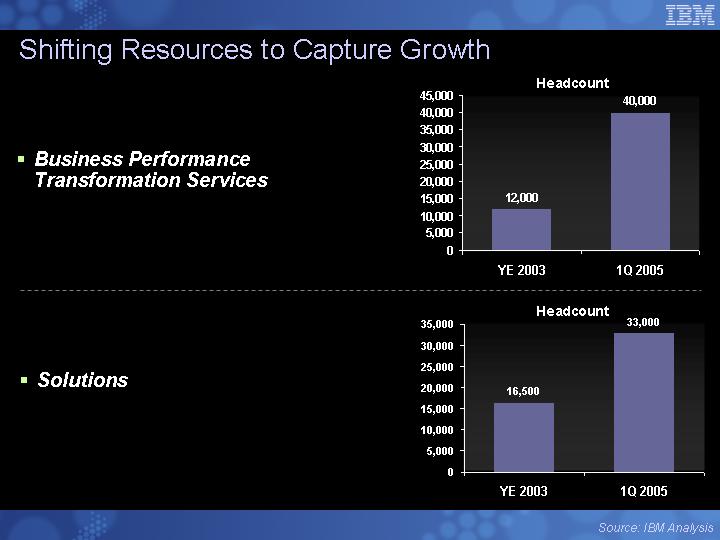
We call it business performance transformation services, or BPTS. It involves the application of technology to transform a client’s business processes and, in some cases, operate those processes for them.
Although BPTS draws on the full breadth of IBM’s capabilities in services, software and systems, we focus on four specific parts of the portfolio when we report our BPTS revenues — strategy and change consulting, business performance management software,
4
engineering and technology services, and business transformation outsourcing.
This portfolio already represents a $3 billion business for us. It grew 45% last year, and another 40% in the first quarter.
In BPTS, we work with clients in a variety of ways.
• We provide clients the counsel and technologies they need to transform their operations themselves.
• Our work with the German retailer Metro Group is a good example of this.
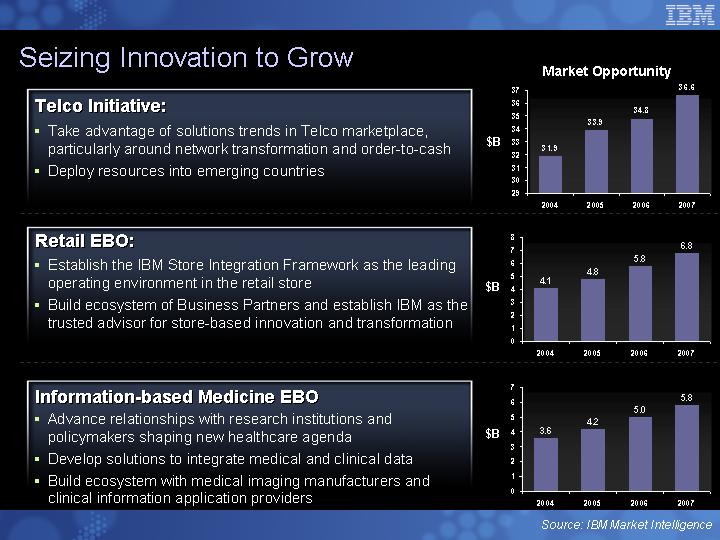
• IBM’s strategy consultants redesigned the supply chain and inventory management system for Metro’s “future store,” a prototype supermarket that integrates IBM’s business performance management software with RFID and wireless technologies.
• Other clients want to collaborate with us.
• Yesterday, we signed a strategic agreement with Nortel to establish a joint development center in Research Triangle Park, where IBM will collaborate in the research, design and development of Nortel’s “Next Generation Networks” products and services.
• An initial project will be a new class of blade servers for telecommunications networks. This project will combine IBM’s server technology and software with Nortel’s communications expertise.
• In some cases, we transform and actually manage the operations for the client.
• With Nextel, we worked with the client as it transformed its customer care processes, and we now manage that operation for them. Over the course of this engagement, Nextel’s customer satisfaction ratings
5
have improved, customer churn has declined, and we are on target to achieve $1 billion in cost savings for Nextel over eight years.
• With BP, where we recently extended our engagement, we transformed and manage their finance and accounting operations. We have accelerated BP’s ability to integrate new acquisitions and reduced F&A costs by a third.
• And we are among a group of partners managing the networks and IT infrastructure for Bharti Tele-Ventures, the largest private-sector telecommunications provider in India.
As I hope you can see from these examples, we will work with clients in whatever way they want to work with us — assist them, collaborate with them, or manage it for them.
Virtually every core process or operation has the potential for this kind of transformation — from supply chain management and customer care, to finance and administration, human resources management and, of course, information technology.
So this first strategic choice — to lead the era of on demand business — draws upon and leverages the entire IBM portfolio — services, software, hardware, technology and research.
The emphasis is on pulling together the right combinations of our technologies and services into business solutions for clients, which is increasingly how they want to buy and apply IT.
The second strategic choice was our decision to be the leader in high-value, innovation-based technologies and services.
Again, this is familiar to you. For several years I’ve talked about the bifurcation of the industry — between companies that create
6
and monetize intellectual capital in all its forms, and those that efficiently market and distribute other people’s innovations.
The cycle of innovation and commoditization that drives this bifurcation has never been faster or, I would say, more unforgiving than it is today.
IBM, as you know, has chosen to lead in the high-value, innovation space. And the changes in our business mix over the last several years reflect this strategic choice.
Through acquisitions and organic investments, we have strengthened our capabilities in software, high-value services and advanced technology. Since 2002, and through the first quarter of this year, we have acquired 38 companies, primarily in these spaces.
At the same time, we have exited low-margin businesses whose differentiating value was declining — hard disk drives, displays, memory chips and, most recently, PCs, through our alliance with Lenovo.
But it’s important to understand that, while highly visible, acquisitions and divestitures represent only one way that we continuously re-invent the company to stay in the high-value spaces.
The primary way we do this is by capitalizing on innovation to constantly move our hardware, software, services and core technology businesses into high growth and more profitable segments.
Our efforts in BPTS and integrating middleware to high-performance servers and the expansion of our Power architecture into the home market — are all examples of this.
7
It requires constant reinvention of the base business, investments in emerging business opportunities and extending our core franchises into adjacent spaces.
Our engineering and technology services business, which is only two and a half years old, is an example of how we’ve leveraged an important franchise — in this case, our core technologies and engineering tools and expertise — into wholly new spaces.
We are working with companies in aerospace, consumer electronics, defense and telecommunications to help them create advanced products. In many cases, they are using our technologies, such as Power, and open standard software like Linux, which provide compelling economic and speed of deployment advantages to these companies.
Engineering & Technology Services demonstrates how we monetize our R&D in ways that extend far beyond patent licensing.
I think you’d agree that companies like Honeywell, Lockheed Martin, Cisco and Sony would not simply outsource elements of their engineering and development operations to the lowest bidder. These are high-value engagements that draw on our recognized innovation capabilities.
We have essentially created a new services business around a set of technology assets. And it is allowing us to move into important adjacent spaces. Bill Zeitler will build on this.
So, we’ve decided that IBM will lead in identifying, creating and capturing the profit zones of our industry, and that we would differentiate IBM by our ability to give clients value and capability they cannot get from others.
8
This has compelled us to make many changes in our businesses. Some of those changes are already paying off; others are underway.
And yes, this strategic shift can lead to short-term performance issues. But this is what you do if you want to stay ahead of commoditization, and it’s what is required to deliver sustainable, high returns on invested capital for our owners.
As Mark will discuss with you in a moment, shifts that we have made in the model can have significant impact on our business profile. As we’ve pointed out to you before, eliminating the lower-margin PC business improves our profitability by one point.
At the same time, we are increasing the investments required for business value and solutions selling.
The third strategic choice we have made is to globally integrate the company.
This may sound surprising, given that IBM has been an international company since its founding. There are two aspects to this.
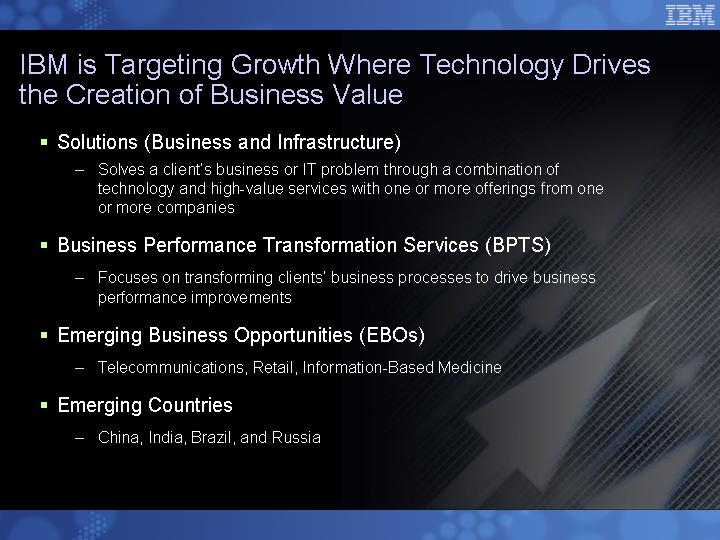
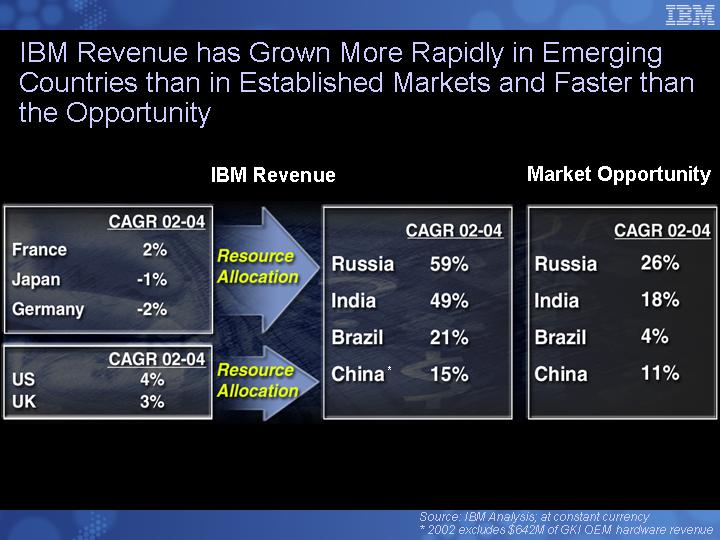
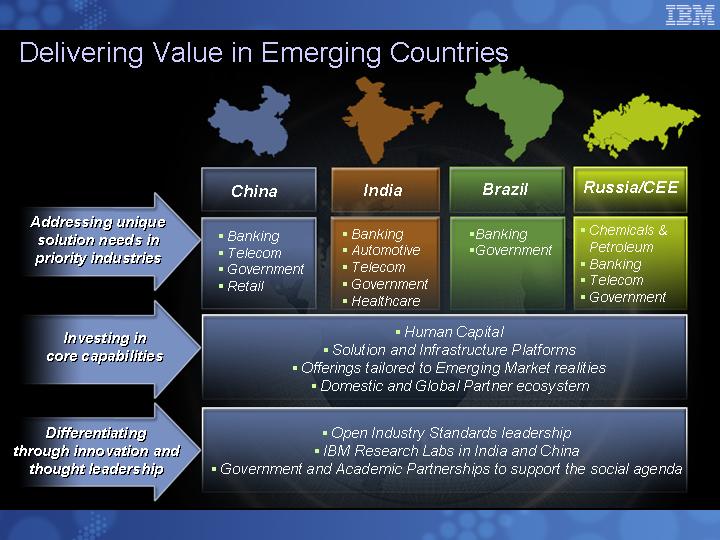
First, we are extending our reach into local markets around the world, particularly in high-growth economies such as China, India, Brazil and Russia. Last year, our business in these four countries grew more than 25%.
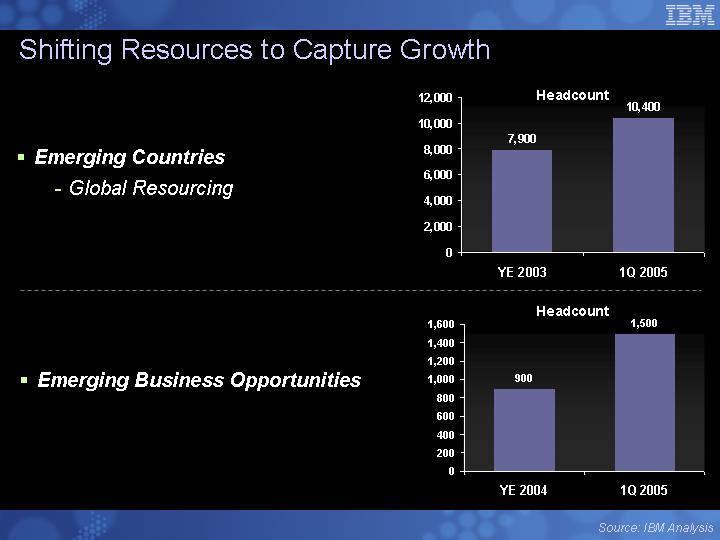
We are fueling our investments in these high-growth markets by reallocating resources from slower-growing, maturing markets. Over the past two years, we have increased our investment in these high-growth, developing markets by 40%, and expanded our work force by 30%.
9
This is a phenomenon that goes beyond cyclical economics.
We’re all aware that populations in western Europe and Japan are shrinking and also aging. Last week I heard that in 15 years, Italy will have just one worker supporting every retiree. In Germany and France, the ratio will be fewer than three workers for every retiree by the year 2025.
This will radically change the economics of these markets, with investments increasingly going to support the aging populations.
Also, consider that over the next five years, emerging parts of Asia, Eastern Europe and Latin America will grow to become more than one-fifth of the global GDP. This represents an economic gain of $2.5 trillion. These regions will account for 35% of global GDP growth in this period.
IBM’s share position in these markets is strong, and we are making the investments to strengthen it. We are number one in Brazil and China, and number two in India and eastern Europe.
The implications of this are clear — IBM is growing as fast or faster than the markets in these emerging nations, and we are reprioritizing our investments to continue to grow with them.
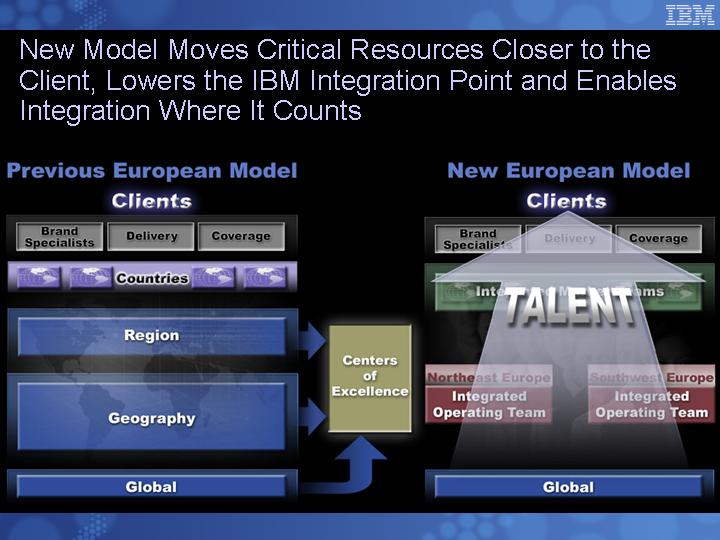
You see this in the restructuring of our operations in Europe, which we announced earlier this month.
This is freeing up resources that we can reinvest in higher-growth markets. It will also enable us to reduce overhead, eliminate layers of hierarchy, and deploy more resources out in the field, where they can execute closer to our clients.
10
But we are not lowering the center of gravity in Europe only to build it up again in places like China and India. Rather, we are moving to a new model, which is the second aspect of globally integrating IBM. Let me explain what I mean.
During the first half of the 20th century, IBM was the prototypical international enterprise. We set up sales offices overseas and exported our products to customers around the world. We did some customizing for local markets, but by and large our intellectual capital was created and managed in the U.S.
In the second half of the century — when Germany, France, the UK, Italy and Japan were in recovery — a new strategy emerged. To capitalize on the human resources available in those countries, and to make a stronger contribution to rebuilding their economies, we built largely self-contained and self-sufficient IBMs in each national market.
IBM Japan, IBM U.K., IBM Germany — each had its own headquarters, its own support operations and, in many cases, its own labs and plants. The result: a multinational IBM.
Today, we are evolving to a new model — the globally integrated company. It’s made possible by the emergence of skills in new parts of the world, high-growth markets in developing nations, the WTO and free trade agreements, and the rise of a global networked infrastructure.
We no longer have to replicate IBM from floor to ceiling in every country. We are optimizing key operations in the right places in the world — eliminating the redundancies and excess overhead — and integrating those operations horizontally and globally.
We’ve been working toward this for several years.
11
• We used to process purchase orders in 300 places around the world. Today, it’s three — Shanghai, Bangalore and Budapest.
• In customer support, we’ve moved certain functions closest to the client, and others we’ve consolidated into shared service centers in Malaysia, Slovakia, Spain and Brazil.
These moves are not just about lower labor cost. They’re about doing the right tasks, with the right skills, in the right places.
• We’ve centralized strategic sourcing for our procurement BTO practice in Greenock, Scotland ...
• Consolidated services operations for financial management and accounting in, among other places, Tulsa, Oklahoma ...
• And created a center of excellence for the shipping industry in Scandinavia and New York City.
• Our primary software development centers are in Toronto, San Jose, Texas and England.
• Our research labs are in New York, Austin, Silicon Valley, Switzerland, Israel, Japan, China and India.
Why? Because that’s where the right skills and the right business conditions exist.
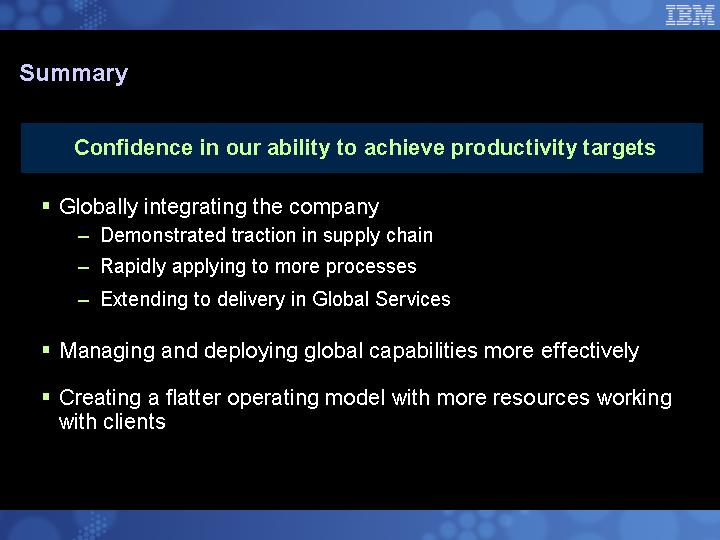
Creating a globally integrated IBM — an “on demand IBM” — will result in a flatter operating model with more resources working with clients in the field.
This will drive productivity, as Bob Moffat will discuss. And importantly, it will improve our ability to execute at the point of contact with the client, which Doug Elix will describe for you.
12
As we execute each of these strategies — leading the industry shift we describe as on demand business; reinventing our portfolio to be the innovation, high-value leader, and creating a globally integrated company — there will be bumps along the way.
Some will be due to exogenous factors — recessions, market corrections and the like — and some to execution missteps.
We hit a bump in the first quarter. We understand the issues and have taken corrective action. The issues mostly involve transitions of one type or another.
In services, for instance, our revenue mix is shifting away from the large, long-term engagements toward smaller, shorter-term contracts. In just the last two years, short-term contracts as a share of total signings have grown from 38% to 47%.
John Joyce will tell you about the actions he has taken to address this shift, including sales incentives and the deployment of sales resources to go after more of this opportunity.
Another transition reflects the changing interplay of customized and standardized capabilities. Traditionally in our services business, standardized capabilities referred to infrastructure assets — data centers, parts inventories, tools and the like.
Through increased automation techniques, we are able to manage these types of assets with fewer people. As a result, a greater share of our people are now focused on strategic consulting and business transformation.
Many of our top minds in IBM Research are collaborating with business consulting teams through our On Demand Innovation Services practice and the Center for Business Optimization, the
13
unit that deploys all of the deep, mathematical and analytic capability of IBM to solve some of our clients’ hardest problems.
Of course, not every client needs a high-end, custom-built solution. So we are translating more of our intellectual capital into replicable, software-based designs that are scalable to multiple clients, faster to deploy, and deliver faster time to value for the client.
For example, we have documented our methodology and standardized many of the processes and technologies involved in building wireless broadband infrastructures. These kinds of services packages are helping us keep ahead of the explosive growth in demand for such technologies as WiFi and RFID.
We are also expanding our capabilities to deliver standardized processes and applications as a service to our clients.
• Our acquisition of Corio, which we completed in March, gives us a global platform to deliver hosted applications like SAP, Oracle and Siebel to both our SMB and enterprise clients.
• We are integrating IBM’s custom hosted capabilities into Corio’s platform for faster deployment of these services. We can also use this platform to provide related capabilities, such as application deployment and automated application management.
Each of these examples represents a shift from custom services to more cost-efficient, scalable offerings.
This shift, as well as the steps we have taken to drive down cost in our strategic outsourcing business, will help us to improve our services margins and penetrate new market opportunities.
14
The other transitions you will hear about today involve our other two units — systems and software.
In systems, Bill will talk about transitions in some key products — specifically in our server and storage lines, where late availability of our some new offerings dampened our first-quarter performance. But we’ll now have the benefit of a full quarter of availability of these products.
These kinds of transitions are not unusual, and the effects are often short-lived. As you may remember, the Regatta and the T-Rex products also went through short, somewhat rocky transition periods before ultimately delivering significant growth.
After Bill, Steve Mills will describe to you the progress we’ve made to re-mix our software portfolio to capture the high-growth middleware opportunity.
During the course of the day you will hear — in much greater detail — about all of the issues I just laid out for you.
As I said at the beginning, we are talking about two sets of issues here.
The first are the long-term, strategic actions we are taking to capitalize on the shifts we see in client demand, technology and global economics. These areas are the fastest-growing segments in the IT industry.
The second set of issues involves the actions we are taking to improve business performance in the near term. We know what the executional issues are. We are managing through them. And we are confident that they will get IBM back on track.
15
But I think it’s more important to keep the overall game plan in mind.
16
Link to searchable text of slide shown above

Link to searchable text of slide shown above
Link to searchable text of slide shown above
Link to searchable text of slide shown above
Link to searchable text of slide shown above
Link to searchable text of slide shown above
Link to searchable text of slide shown above

Link to searchable text of slide shown above
Link to searchable text of slide shown above
Link to searchable text of slide shown above
Link to searchable text of slide shown above
Link to searchable text of slide shown above
Link to searchable text of slide shown above
Link to searchable text of slide shown above
Link to searchable text of slide shown above
Link to searchable text of slide shown above
Link to searchable text of slide shown above
Link to searchable text of slide shown above
Link to searchable text of slide shown above
Link to searchable text of slide shown above
Link to searchable text of slide shown above
Link to searchable text of slide shown above
Link to searchable text of slide shown above
Link to searchable text of slide shown above

Link to searchable text of slide shown above
Link to searchable text of slide shown above
Link to searchable text of slide shown above
Link to searchable text of slide shown above
Link to searchable text of slide shown above
Link to searchable text of slide shown above
Link to searchable text of slide shown above

Link to searchable text of slide shown above
Link to searchable text of slide shown above
Link to searchable text of slide shown above
Link to searchable text of slide shown above
Link to searchable text of slide shown above

Link to searchable text of slide shown above
Link to searchable text of slide shown above
Link to searchable text of slide shown above
Link to searchable text of slide shown above
Link to searchable text of slide shown above
Link to searchable text of slide shown above
Link to searchable text of slide shown above
Link to searchable text of slide shown above
Link to searchable text of slide shown above
Link to searchable text of slide shown above
Link to searchable text of slide shown above
Link to searchable text of slide shown above
Link to searchable text of slide shown above
Link to searchable text of slide shown above
Link to searchable text of slide shown above
Link to searchable text of slide shown above
Link to searchable text of slide shown above
Link to searchable text of slide shown above
Link to searchable text of slide shown above
Link to searchable text of slide shown above
Link to searchable text of slide shown above

Link to searchable text of slide shown above
Link to searchable text of slide shown above
Link to searchable text of slide shown above
Link to searchable text of slide shown above
Link to searchable text of slide shown above
Link to searchable text of slide shown above
Link to searchable text of slide shown above
Link to searchable text of slide shown above
Link to searchable text of slide shown above
Link to searchable text of slide shown above
Link to searchable text of slide shown above
Link to searchable text of slide shown above
Link to searchable text of slide shown above
Link to searchable text of slide shown above
Link to searchable text of slide shown above
Link to searchable text of slide shown above
Link to searchable text of slide shown above
Link to searchable text of slide shown above
Link to searchable text of slide shown above
Link to searchable text of slide shown above
Link to searchable text of slide shown above
Link to searchable text of slide shown above
Link to searchable text of slide shown above
Link to searchable text of slide shown above
Link to searchable text of slide shown above
Link to searchable text of slide shown above
Link to searchable text of slide shown above
Link to searchable text of slide shown above
Link to searchable text of slide shown above
Link to searchable text of slide shown above
Link to searchable text of slide shown above
Link to searchable text of slide shown above
Link to searchable text of slide shown above
Link to searchable text of slide shown above
Link to searchable text of slide shown above

Link to searchable text of slide shown above
Link to searchable text of slide shown above
Link to searchable text of slide shown above
Link to searchable text of slide shown above

Link to searchable text of slide shown above
Link to searchable text of slide shown above
Searchable text section of graphics shown above
[LOGO]
Agenda
9:00 AM |
| Strategy Overview |
| Sam Palmisano |
9:20 |
| Business Model |
| Mark Loughridge |
9:50 |
| Global Services |
| John Joyce |
10:20 |
| Systems and Technology |
| Bill Zeitler |
|
|
|
|
|
10:40 |
| Break |
|
|
|
|
|
|
|
11:00 |
| Software |
| Steve Mills |
11:20 |
| Global Integration |
| Bob Moffat |
11:40 |
| Sales and Distribution |
| Doug Elix |
12:00 PM |
| Q&A |
| All |
|
|
|
|
|
Lunch / Breakouts | ||||
Certain comments made in this presentation may be characterized as forward looking under the Private Securities Litigation Reform Act of 1995.
Those statements involve a number of factors that could cause actual results to differ materially.
Additional information concerning these factors is contained in the Company’s filing with the SEC. Copies are available from the SEC, from the IBM web site, or from IBM Investor Relations.
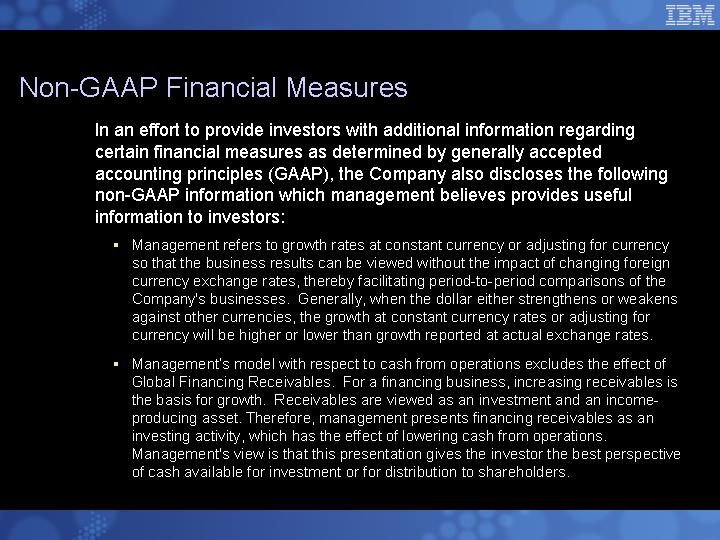
See IBM’s Form 8-K dated May 20, 2005 for reconciliation and other information in connection with certain non-GAAP financial measures in this presentation.
Strategy Overview
Sam Palmisano
Chairman and Chief Executive Officer
Good morning. I’d like to welcome you to this briefing for IBM investors.
I’m joined today by Mark Loughridge, our CFO, and the senior leaders of our major business units. Together, we’ll provide a perspective on IBM’s strategy and operations.
This is an important time for the industry and for IBM. It’s also a potentially confusing time for investors. It’s easy to intermix near-term issues with longer-term shifts, cyclical effects with more fundamental change.
That’s why we changed the agenda for today’s meeting. In previous years, you will recall that we used to separate these two sets of issues. We would give you a strategic update at the spring meeting, and focus on operational issues in the fall.
This year, we have combined the two. I will cover our long-term, strategic business model with you. Then the leaders of our business units will cover the executional actions we are taking to improve our performance and address opportunities going forward.
So before I turn it over to my colleagues, I’d like to provide some context. I think it would be helpful in understanding what we’ve been doing at IBM and why.
All of the major moves we’ve made at IBM over the past three or four years have been based on a small number of strategic choices ...
• choices that were made based on our understanding of where technology, client requirements, and global business were headed ...
1
• choices designed to maintain IBM’s leadership of a rapidly changing industry ...
• and to continue to generate consistent, high returns on invested capital for our owners.
Let me briefly review and comment on the major strategic choices. There are three.
First, we decided that IBM would lead the IT industry shift to the era of on demand business.
As we have discussed with you before, on demand business is our way of describing a fundamental industry shift in computing architecture and how it is applied to business. Others have referred to this as the “organic enterprise” or “adaptive enterprise.”
Whatever name you choose, it represents a shift in enterprise client buying behavior toward integrated solutions that draw on point products, and a shift toward providing quantifiable business value, not just technology features and functions. These shifts are well underway.
As you know, over many years the IT industry has progressively automated distinct operations and processes within companies — the back office, the factory floor, the desktop, the supply chain. Now, technology can enable — and our clients’ business demands require — a more integrated, end-to-end approach.
At the business process level, this means breaking down the silos that segregate one business operation from another, and creating common, optimized, and integrated processes that operate horizontally, across the enterprise.
2
This may sound simplistic, but implementing this kind of operating model requires extensive business transformation. And that, in turn, requires process-specific and industry-specific expertise.
The goal: Fusing advanced technology with business design to create an integrated, more flexible and responsive enterprise.
This is a change in how the IT industry engages with enterprise customers and in how it applies technology. This shift is reflected in market opportunity, which Mark Loughridge will show you in more detail.
The bottom line is that these business value opportunities are growing faster than traditional point products, and they give us a much stronger relationship with enterprises.
You know what we have done in recent years to strengthen our capability in business process and industry expertise — not just consulting skills, but also software and delivery capability specific to business processes and industry requirements.
Enabling these new business designs requires a different computing infrastructure.
• Instead of islands of computing distributed throughout the enterprise, it is more integrated.
• Instead of proprietary architectures, which impede integration and interoperability, it is based on open standards.
• And it exploits powerful new technologies like self-management and virtualization, which lower the cost of computing, while improving resiliency and security.
3
We have made significant investments in the strategic technologies to build out this new computing infrastructure.
It is well known that IBM is committed to open standards. This was recently confirmed when we announced our intent to acquire Gluecode, an open-source software company.
We have also substantially strengthened our middleware business, and — after years of R&D — brought to market game-changing technologies.
One example is the more than $1 billion we have invested in our Power 4 and 5 architectures. This has enabled our servers to gain 10 points of share over the last four and a half years.
It has also put IBM at the core of future video game consoles, where Power is the technology of choice for the top three players in this market.
Steve Mills and Bill Zeitler will expand upon what we’ve done to strengthen our software and hardware businesses today.
At our session with investors last year, I described a substantial growth opportunity stemming from the shift to on demand business.
We call it business performance transformation services, or BPTS. It involves the application of technology to transform a client’s business processes and, in some cases, operate those processes for them.
Although BPTS draws on the full breadth of IBM’s capabilities in services, software and systems, we focus on four specific parts of the portfolio when we report our BPTS revenues — strategy and change consulting, business performance management software,
4
engineering and technology services, and business transformation outsourcing.
This portfolio already represents a $3 billion business for us. It grew 45% last year, and another 40% in the first quarter.
In BPTS, we work with clients in a variety of ways.
• We provide clients the counsel and technologies they need to transform their operations themselves.
• Our work with the German retailer Metro Group is a good example of this.
• IBM’s strategy consultants redesigned the supply chain and inventory management system for Metro’s “future store,” a prototype supermarket that integrates IBM’s business performance management software with RFID and wireless technologies.
• Other clients want to collaborate with us.
• Yesterday, we signed a strategic agreement with Nortel to establish a joint development center in Research Triangle Park, where IBM will collaborate in the research, design and development of Nortel’s “Next Generation Networks” products and services.
• An initial project will be a new class of blade servers for telecommunications networks. This project will combine IBM’s server technology and software with Nortel’s communications expertise.
• In some cases, we transform and actually manage the operations for the client.
• With Nextel, we worked with the client as it transformed its customer care processes, and we now manage that operation for them. Over the course of this engagement, Nextel’s customer satisfaction ratings
5
have improved, customer churn has declined, and we are on target to achieve $1 billion in cost savings for Nextel over eight years.
• With BP, where we recently extended our engagement, we transformed and manage their finance and accounting operations. We have accelerated BP’s ability to integrate new acquisitions and reduced F&A costs by a third.
• And we are among a group of partners managing the networks and IT infrastructure for Bharti Tele-Ventures, the largest private-sector telecommunications provider in India.
As I hope you can see from these examples, we will work with clients in whatever way they want to work with us — assist them, collaborate with them, or manage it for them.
Virtually every core process or operation has the potential for this kind of transformation — from supply chain management and customer care, to finance and administration, human resources management and, of course, information technology.
So this first strategic choice — to lead the era of on demand business — draws upon and leverages the entire IBM portfolio — services, software, hardware, technology and research.
The emphasis is on pulling together the right combinations of our technologies and services into business solutions for clients, which is increasingly how they want to buy and apply IT.
The second strategic choice was our decision to be the leader in high-value, innovation-based technologies and services.
Again, this is familiar to you. For several years I’ve talked about the bifurcation of the industry — between companies that create
6
and monetize intellectual capital in all its forms, and those that efficiently market and distribute other people’s innovations.
The cycle of innovation and commoditization that drives this bifurcation has never been faster or, I would say, more unforgiving than it is today.
IBM, as you know, has chosen to lead in the high-value, innovation space. And the changes in our business mix over the last several years reflect this strategic choice.
Through acquisitions and organic investments, we have strengthened our capabilities in software, high-value services and advanced technology. Since 2002, and through the first quarter of this year, we have acquired 38 companies, primarily in these spaces.
At the same time, we have exited low-margin businesses whose differentiating value was declining — hard disk drives, displays, memory chips and, most recently, PCs, through our alliance with Lenovo.
But it’s important to understand that, while highly visible, acquisitions and divestitures represent only one way that we continuously re-invent the company to stay in the high-value spaces.
The primary way we do this is by capitalizing on innovation to constantly move our hardware, software, services and core technology businesses into high growth and more profitable segments.
Our efforts in BPTS and integrating middleware to high-performance servers and the expansion of our Power architecture into the home market — are all examples of this.
7
It requires constant reinvention of the base business, investments in emerging business opportunities and extending our core franchises into adjacent spaces.
Our engineering and technology services business, which is only two and a half years old, is an example of how we’ve leveraged an important franchise — in this case, our core technologies and engineering tools and expertise — into wholly new spaces.
We are working with companies in aerospace, consumer electronics, defense and telecommunications to help them create advanced products. In many cases, they are using our technologies, such as Power, and open standard software like Linux, which provide compelling economic and speed of deployment advantages to these companies.
Engineering & Technology Services demonstrates how we monetize our R&D in ways that extend far beyond patent licensing.
I think you’d agree that companies like Honeywell, Lockheed Martin, Cisco and Sony would not simply outsource elements of their engineering and development operations to the lowest bidder. These are high-value engagements that draw on our recognized innovation capabilities.
We have essentially created a new services business around a set of technology assets. And it is allowing us to move into important adjacent spaces. Bill Zeitler will build on this.
So, we’ve decided that IBM will lead in identifying, creating and capturing the profit zones of our industry, and that we would differentiate IBM by our ability to give clients value and capability they cannot get from others.
8
This has compelled us to make many changes in our businesses. Some of those changes are already paying off; others are underway.
And yes, this strategic shift can lead to short-term performance issues. But this is what you do if you want to stay ahead of commoditization, and it’s what is required to deliver sustainable, high returns on invested capital for our owners.
As Mark will discuss with you in a moment, shifts that we have made in the model can have significant impact on our business profile. As we’ve pointed out to you before, eliminating the lower-margin PC business improves our profitability by one point.
At the same time, we are increasing the investments required for business value and solutions selling.
The third strategic choice we have made is to globally integrate the company.
This may sound surprising, given that IBM has been an international company since its founding. There are two aspects to this.
First, we are extending our reach into local markets around the world, particularly in high-growth economies such as China, India, Brazil and Russia. Last year, our business in these four countries grew more than 25%.
We are fueling our investments in these high-growth markets by reallocating resources from slower-growing, maturing markets. Over the past two years, we have increased our investment in these high-growth, developing markets by 40%, and expanded our work force by 30%.
9
This is a phenomenon that goes beyond cyclical economics.
We’re all aware that populations in western Europe and Japan are shrinking and also aging. Last week I heard that in 15 years, Italy will have just one worker supporting every retiree. In Germany and France, the ratio will be fewer than three workers for every retiree by the year 2025.
This will radically change the economics of these markets, with investments increasingly going to support the aging populations.
Also, consider that over the next five years, emerging parts of Asia, Eastern Europe and Latin America will grow to become more than one-fifth of the global GDP. This represents an economic gain of $2.5 trillion. These regions will account for 35% of global GDP growth in this period.
IBM’s share position in these markets is strong, and we are making the investments to strengthen it. We are number one in Brazil and China, and number two in India and eastern Europe.
The implications of this are clear — IBM is growing as fast or faster than the markets in these emerging nations, and we are reprioritizing our investments to continue to grow with them.
You see this in the restructuring of our operations in Europe, which we announced earlier this month.
This is freeing up resources that we can reinvest in higher-growth markets. It will also enable us to reduce overhead, eliminate layers of hierarchy, and deploy more resources out in the field, where they can execute closer to our clients.
10
But we are not lowering the center of gravity in Europe only to build it up again in places like China and India. Rather, we are moving to a new model, which is the second aspect of globally integrating IBM. Let me explain what I mean.
During the first half of the 20th century, IBM was the prototypical international enterprise. We set up sales offices overseas and exported our products to customers around the world. We did some customizing for local markets, but by and large our intellectual capital was created and managed in the U.S.
In the second half of the century — when Germany, France, the UK, Italy and Japan were in recovery — a new strategy emerged. To capitalize on the human resources available in those countries, and to make a stronger contribution to rebuilding their economies, we built largely self-contained and self-sufficient IBMs in each national market.
IBM Japan, IBM U.K., IBM Germany — each had its own headquarters, its own support operations and, in many cases, its own labs and plants. The result: a multinational IBM.
Today, we are evolving to a new model — the globally integrated company. It’s made possible by the emergence of skills in new parts of the world, high-growth markets in developing nations, the WTO and free trade agreements, and the rise of a global networked infrastructure.
We no longer have to replicate IBM from floor to ceiling in every country. We are optimizing key operations in the right places in the world — eliminating the redundancies and excess overhead — and integrating those operations horizontally and globally.
We’ve been working toward this for several years.
11
• We used to process purchase orders in 300 places around the world. Today, it’s three — Shanghai, Bangalore and Budapest.
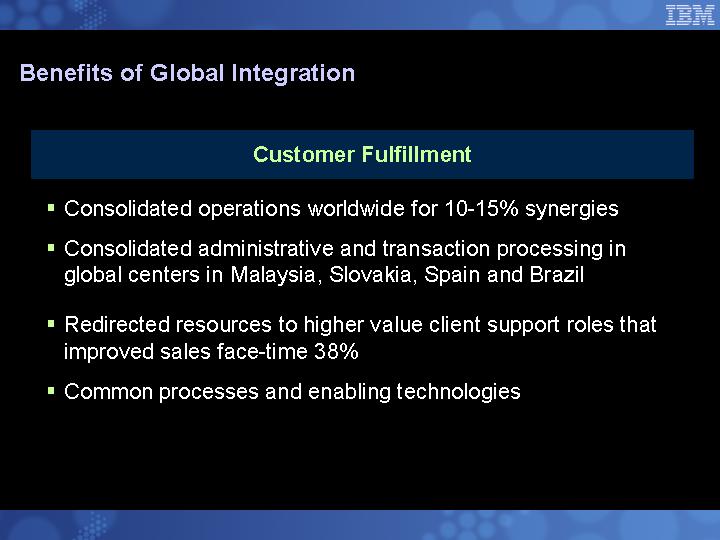
• In customer support, we’ve moved certain functions closest to the client, and others we’ve consolidated into shared service centers in Malaysia, Slovakia, Spain and Brazil.
These moves are not just about lower labor cost. They’re about doing the right tasks, with the right skills, in the right places.
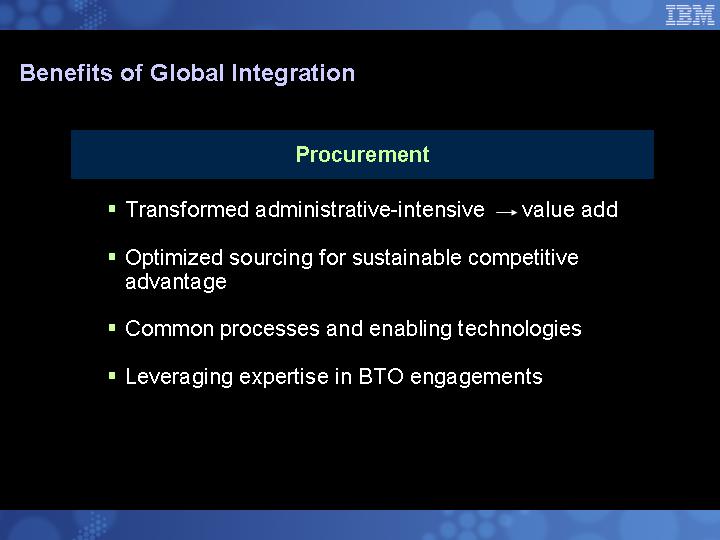
• We’ve centralized strategic sourcing for our procurement BTO practice in Greenock, Scotland ...
• Consolidated services operations for financial management and accounting in, among other places, Tulsa, Oklahoma ...
• And created a center of excellence for the shipping industry in Scandinavia and New York City.
• Our primary software development centers are in Toronto, San Jose, Texas and England.
• Our research labs are in New York, Austin, Silicon Valley, Switzerland, Israel, Japan, China and India.
Why? Because that’s where the right skills and the right business conditions exist.
Creating a globally integrated IBM — an “on demand IBM” — will result in a flatter operating model with more resources working with clients in the field.
This will drive productivity, as Bob Moffat will discuss. And importantly, it will improve our ability to execute at the point of contact with the client, which Doug Elix will describe for you.
12
As we execute each of these strategies — leading the industry shift we describe as on demand business; reinventing our portfolio to be the innovation, high-value leader, and creating a globally integrated company — there will be bumps along the way.
Some will be due to exogenous factors — recessions, market corrections and the like — and some to execution missteps.
We hit a bump in the first quarter. We understand the issues and have taken corrective action. The issues mostly involve transitions of one type or another.
In services, for instance, our revenue mix is shifting away from the large, long-term engagements toward smaller, shorter-term contracts. In just the last two years, short-term contracts as a share of total signings have grown from 38% to 47%.
John Joyce will tell you about the actions he has taken to address this shift, including sales incentives and the deployment of sales resources to go after more of this opportunity.
Another transition reflects the changing interplay of customized and standardized capabilities. Traditionally in our services business, standardized capabilities referred to infrastructure assets — data centers, parts inventories, tools and the like.
Through increased automation techniques, we are able to manage these types of assets with fewer people. As a result, a greater share of our people are now focused on strategic consulting and business transformation.
Many of our top minds in IBM Research are collaborating with business consulting teams through our On Demand Innovation Services practice and the Center for Business Optimization, the
13
unit that deploys all of the deep, mathematical and analytic capability of IBM to solve some of our clients’ hardest problems.
Of course, not every client needs a high-end, custom-built solution. So we are translating more of our intellectual capital into replicable, software-based designs that are scalable to multiple clients, faster to deploy, and deliver faster time to value for the client.
For example, we have documented our methodology and standardized many of the processes and technologies involved in building wireless broadband infrastructures. These kinds of services packages are helping us keep ahead of the explosive growth in demand for such technologies as WiFi and RFID.
We are also expanding our capabilities to deliver standardized processes and applications as a service to our clients.
• Our acquisition of Corio, which we completed in March, gives us a global platform to deliver hosted applications like SAP, Oracle and Siebel to both our SMB and enterprise clients.
• We are integrating IBM’s custom hosted capabilities into Corio’s platform for faster deployment of these services. We can also use this platform to provide related capabilities, such as application deployment and automated application management.
Each of these examples represents a shift from custom services to more cost-efficient, scalable offerings.
This shift, as well as the steps we have taken to drive down cost in our strategic outsourcing business, will help us to improve our services margins and penetrate new market opportunities.
14
The other transitions you will hear about today involve our other two units — systems and software.
In systems, Bill will talk about transitions in some key products — specifically in our server and storage lines, where late availability of our some new offerings dampened our first-quarter performance. But we’ll now have the benefit of a full quarter of availability of these products.
These kinds of transitions are not unusual, and the effects are often short-lived. As you may remember, the Regatta and the T-Rex products also went through short, somewhat rocky transition periods before ultimately delivering significant growth.
After Bill, Steve Mills will describe to you the progress we’ve made to re-mix our software portfolio to capture the high-growth middleware opportunity.
During the course of the day you will hear — in much greater detail — about all of the issues I just laid out for you.
As I said at the beginning, we are talking about two sets of issues here.
The first are the long-term, strategic actions we are taking to capitalize on the shifts we see in client demand, technology and global economics. These areas are the fastest-growing segments in the IT industry.
The second set of issues involves the actions we are taking to improve business performance in the near term. We know what the executional issues are. We are managing through them. And we are confident that they will get IBM back on track.
15
But I think it’s more important to keep the overall game plan in mind.
16
Business Model
Mark Loughridge
Senior Vice President and Chief Financial Officer
IBM Corporation
The Traditional View of the Technology Sector Opportunity Reflects Moderate Growth
[CHART]
Source: IBM analysis based on Industry Reports / Market Research
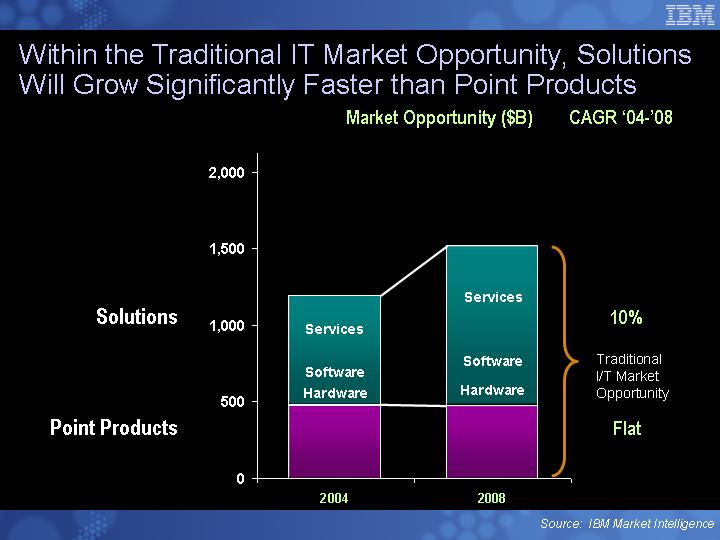
Within the Traditional IT Market Opportunity, Solutions Will Grow Significantly Faster than Point Products
[CHART]
Source: IBM Market Intelligence
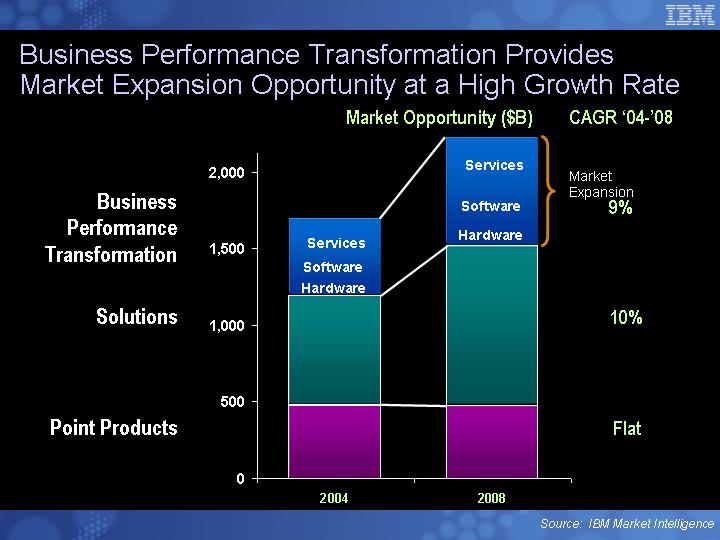
Business Performance Transformation Provides Market Expansion Opportunity at a High Growth Rate
[CHART]
Source: IBM Market Intelligence
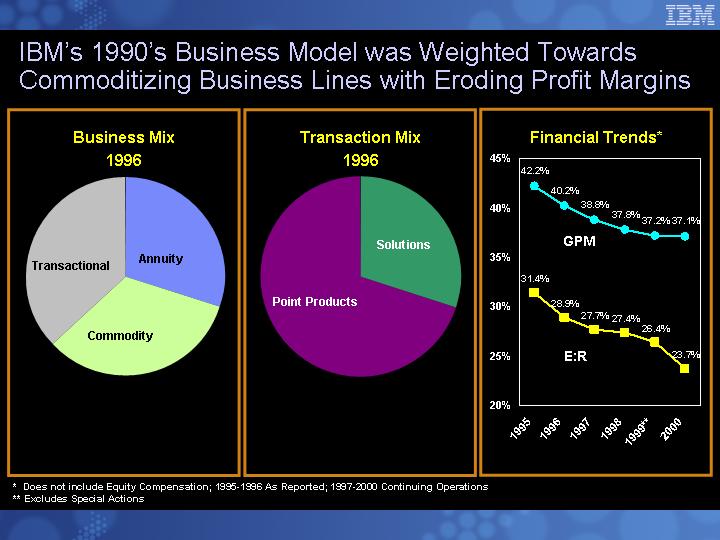
IBM’s 1990’s Business Model was Weighted Towards Commoditizing Business Lines with Eroding Profit Margins
Business Mix 1996
[CHART]
Transaction Mix 1996
[CHART]
Financial Trends*
[CHART]
* Does not include Equity Compensation; 1995-1996 As Reported; 1997-2000 Continuing Operations
** Excludes Special Actions
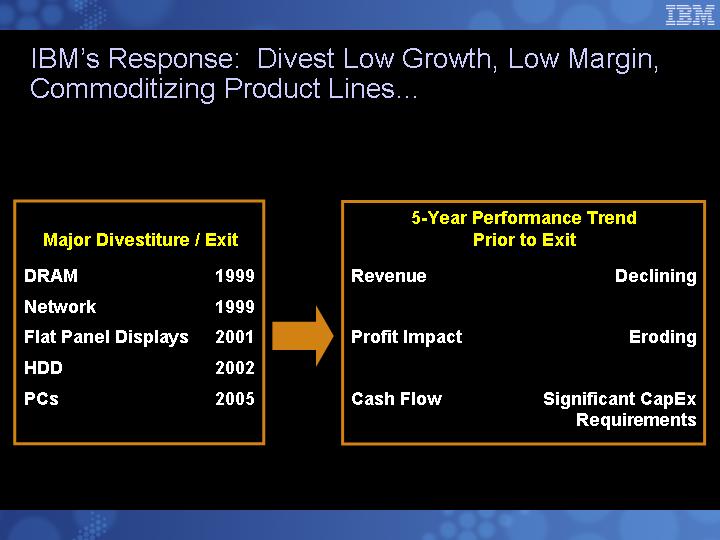
IBM’s Response: Divest Low Growth, Low Margin, Commoditizing Product Lines…
Major Divestiture / Exit
DRAM |
| 1999 |
|
Network |
| 1999 |
|
Flat Panel Displays |
| 2001 |
|
HDD |
| 2002 |
|
PCs |
| 2005 |
|
5-Year Performance Trend
Prior to Exit
Revenue |
| Declining |
|
|
|
Profit Impact |
| Eroding |
|
|
|
Cash Flow |
| Significant CapEx Requirements |
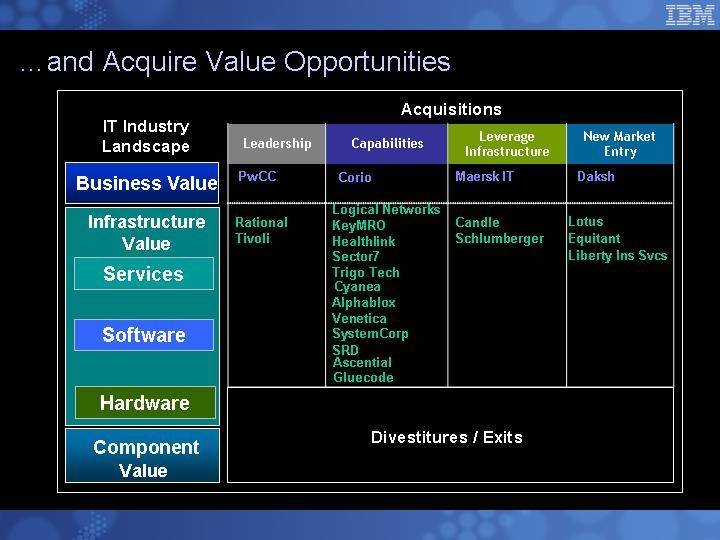
…and Acquire Value Opportunities
IT Industry Landscape
Business Value
Infrastructure Value
Services
Software
Hardware
Component Value
Acquisitions
Leadership |
| Capabilities |
| Leverage |
| New Market |
|
|
|
|
|
|
|
|
|
PwCC |
| Corio |
| Maersk IT |
| Daksh |
|
|
|
|
|
|
|
|
|
|
| Logical Networks |
|
|
|
|
|
Rational |
| KeyMRO |
| Candle |
| Lotus |
|
Tivoli |
| Healthlink |
| Schlumberger |
| Equitant |
|
|
| Sector7 |
|
|
| Liberty Ins Svcs |
|
|
| Trigo Tech |
|
|
|
|
|
|
| Cyanea |
|
|
|
|
|
|
| Alphablox |
|
|
|
|
|
|
| Venetica |
|
|
|
|
|
|
| SystemCorp |
|
|
|
|
|
|
| SRD |
|
|
|
|
|
|
| Ascential |
|
|
|
|
|
|
| Gluecode |
|
|
|
|
|
Divestitures / Exits
We Have Shifted Our Business from Commoditizing Business Lines to Higher Value
Business Mix 1996
[CHART]
Business Mix Today*
[CHART]
* Post PC divestiture
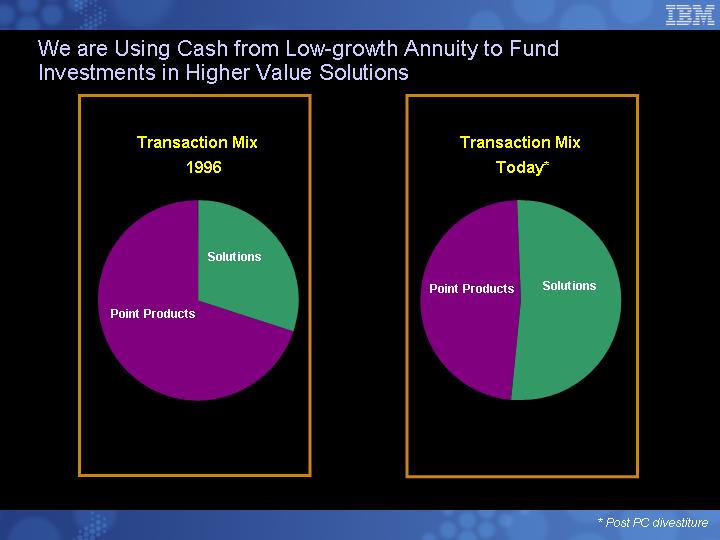
We are Using Cash from Low-growth Annuity to Fund Investments in Higher Value Solutions
Transaction Mix 1996
[CHART]
Transaction Mix Today*
[CHART]
* Post PC divestiture
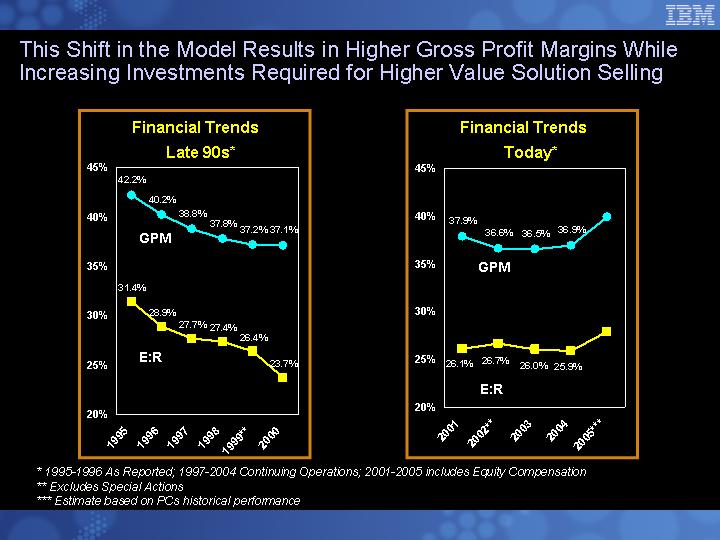
This Shift in the Model Results in Higher Gross Profit Margins While Increasing Investments Required for Higher Value Solution Selling
Financial Trends Late 90s*
[CHART]
Financial Trends Today*
[CHART]
* 1995-1996 As Reported; 1997-2004 Continuing Operations; 2001-2005 includes Equity Compensation
** Excludes Special Actions
*** Estimate based on PCs historical performance
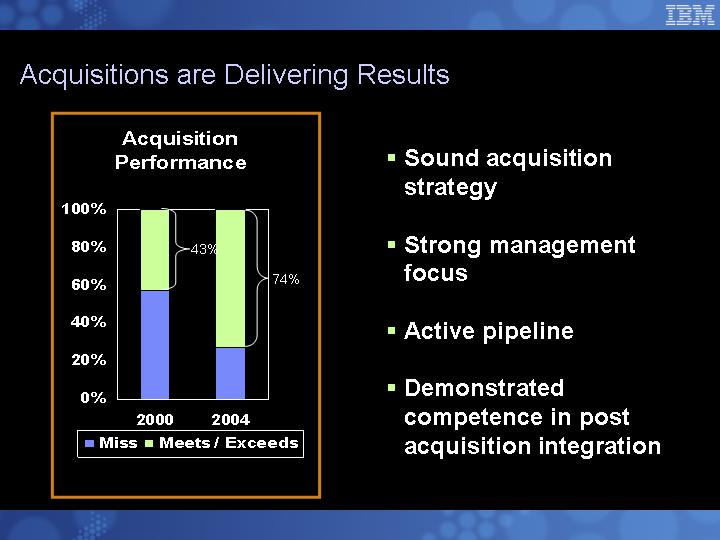
Acquisitions are Delivering Results
Acquisitions Performance
[CHART]
• Sound acquisition strategy
• Strong management focus
• Active pipeline
• Demonstrated competence in post acquisition integration
Financial Objectives
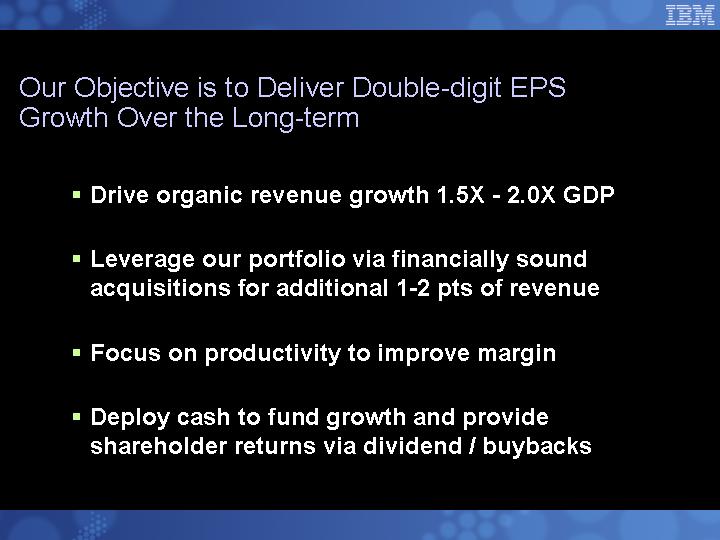
Our Objective is to Deliver Double-digit EPS Growth Over the Long-term
• Drive organic revenue growth 1.5X - 2.0X GDP
• Leverage our portfolio via financially sound acquisitions for additional 1-2 pts of revenue
• Focus on productivity to improve margin
• Deploy cash to fund growth and provide shareholder returns via dividend / buybacks
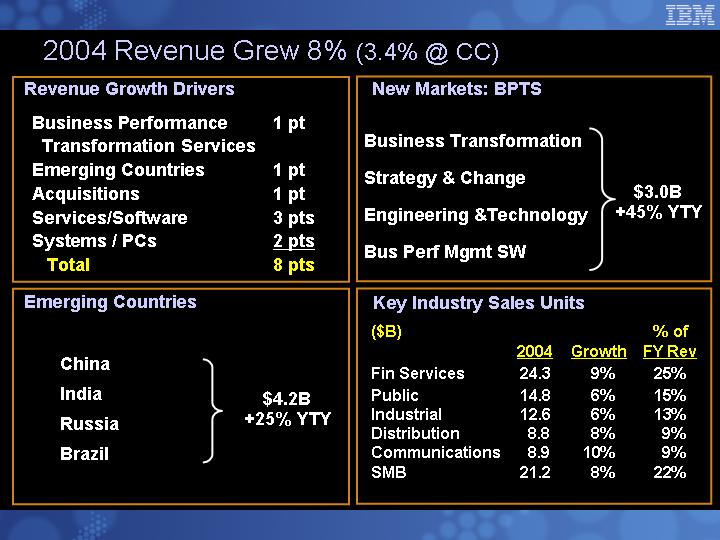
2004 Revenue Grew 8% (3.4% @ CC)
Revenue Growth Drivers
Business Performance |
| 1pt |
Transformation Services |
|
|
Emerging Countries |
| 1pt |
Acquisitions |
| 1pt |
Services/Software |
| 3pts |
Systems / PCs |
| 2pts |
Total |
| 8pts |
Emerging Countries
China |
|
|
|
|
|
India |
|
|
|
| $4.2B |
Russia |
| +25% YTY |
|
|
|
Brazil |
|
|
New Markets: BPTS
Business Transformation |
|
|
|
|
|
Strategy & Change |
|
|
|
| $3.0B |
Engineering &Technology |
| +45% YTY |
|
|
|
Bus Perf Mgmt SW |
|
|
Key Industry Sales Units
($B)
|
| 2004 |
| Growth |
| % of |
|
Fin Services |
| 24.3 |
| 9 | % | 25 | % |
Public |
| 14.8 |
| 6 | % | 15 | % |
Industrial |
| 12.6 |
| 6 | % | 13 | % |
Distribution |
| 8.8 |
| 8 | % | 9 | % |
Communications |
| 8.9 |
| 10 | % | 9 | % |
SMB |
| 21.2 |
| 8 | % | 22 | % |
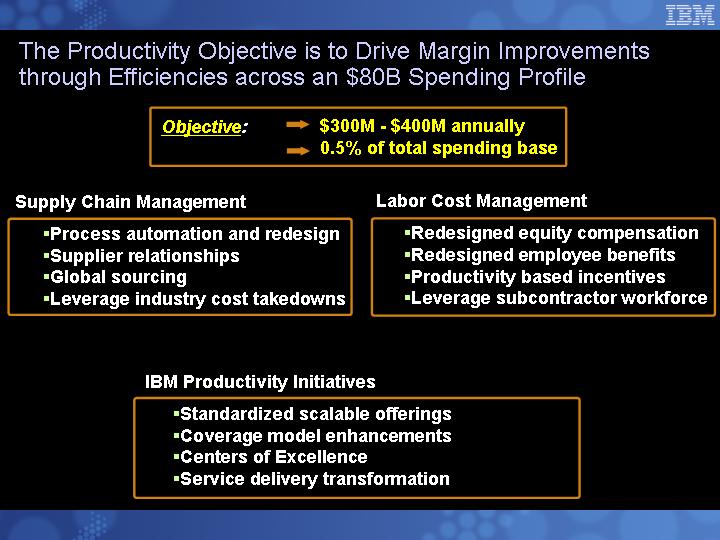
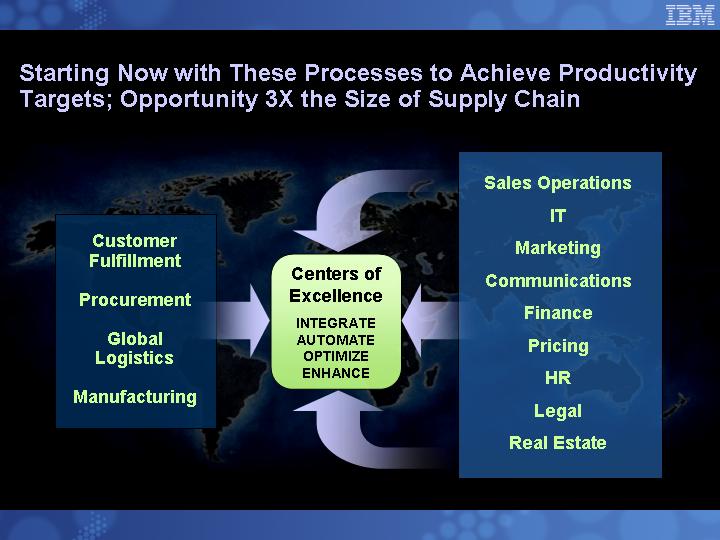
The Productivity Objective is to Drive Margin Improvements through Efficiencies across an $80B Spending Profile
Objective: | • | $300M - $400M annually |
| • | 0.5% of total spending base |
Supply Chain Management
• Process automation and redesign
• Supplier relationships
• Global sourcing
• Leverage industry cost takedowns
Labor Cost Management
• Redesigned equity compensation
• Redesigned employee benefits
• Productivity based incentives
• Leverage subcontractor workforce
IBM Productivity Initiatives
• Standardized scalable offerings
• Coverage model enhancements
• Centers of Excellence
• Service delivery transformation
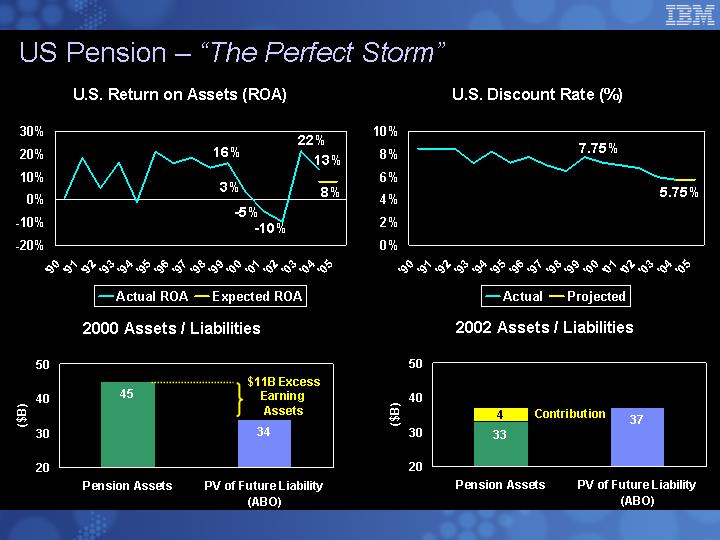
US Pension – “The Perfect Storm”
U.S. Return on Assets (ROA)
[CHART]
U.S. Discount Rate (%)
[CHART]
2000 Assets / Liabilities
[CHART]
2002 Assets / Liabilities
[CHART]
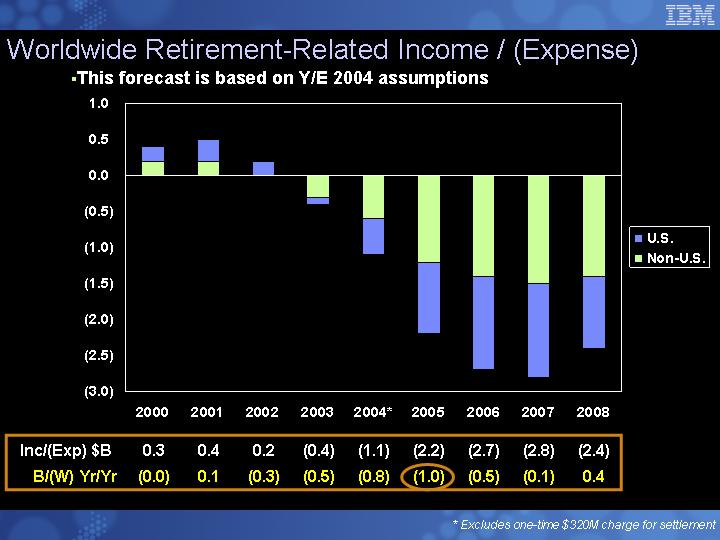
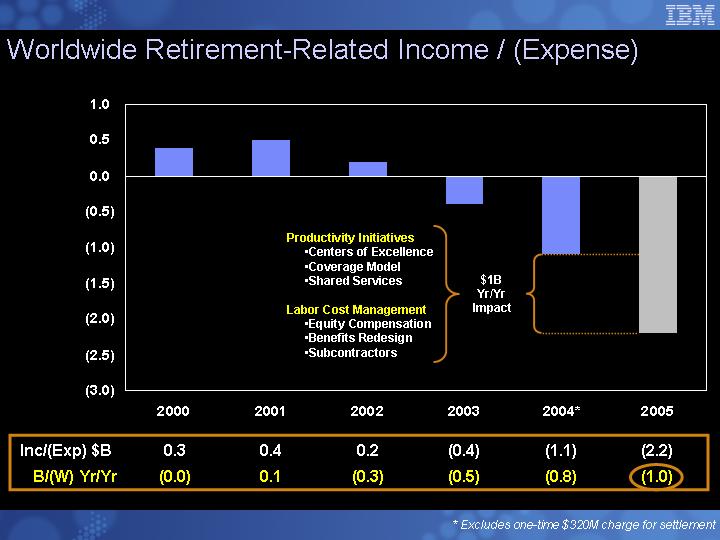
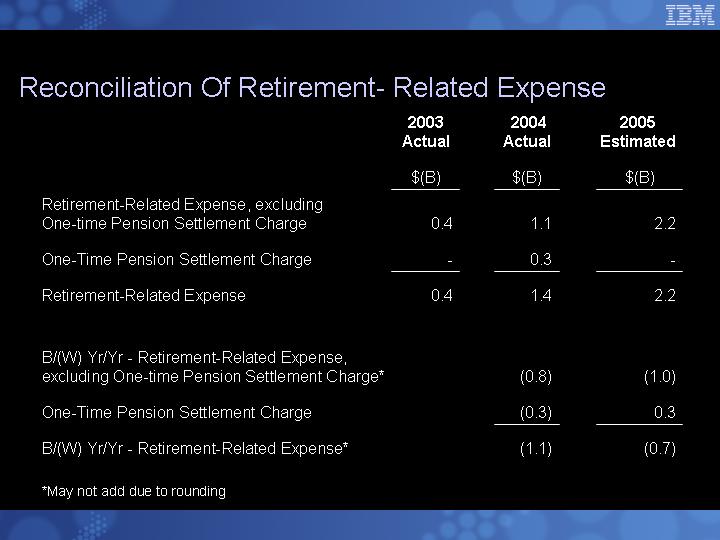
Worldwide Retirement-Related Income / (Expense)
• This forecast is based on Y/E 2004 assumptions
[CHART]
Inc/(Exp) $B |
| 0.3 |
| 0.4 |
| 0.2 |
| (0.4 | ) | (1.1 | ) | (2.2 | ) | (2.7 | ) | (2.8 | ) | (2.4 | ) |
B/(W) Yr/Yr |
| (0.0 | ) | 0.1 |
| (0.3 | ) | (0.5 | ) | (0.8 | ) | (1.0 | ) | (0.5 | ) | (0.1 | ) | 0.4 |
|
* Excludes one-time $320M charge for settlement
[CHART]
$1B Yr/Yr Impact
Productivity Initiatives
• Centers of Excellence
• Coverage Model
• Shared Services
Labor Cost Management
• Equity Compensation
• Benefits Redesign
• Subcontractors
Inc/(Exp) $B |
| 0.3 |
| 0.4 |
| 0.2 |
| (0.4 | ) | (1.1 | ) | (2.2 | ) |
B/(W) Yr/Yr |
| (0.0 | ) | 0.1 |
| (0.3 | ) | (0.5 | ) | (0.8 | ) | (1.0 | ) |
* Excludes one-time $320M charge for settlement
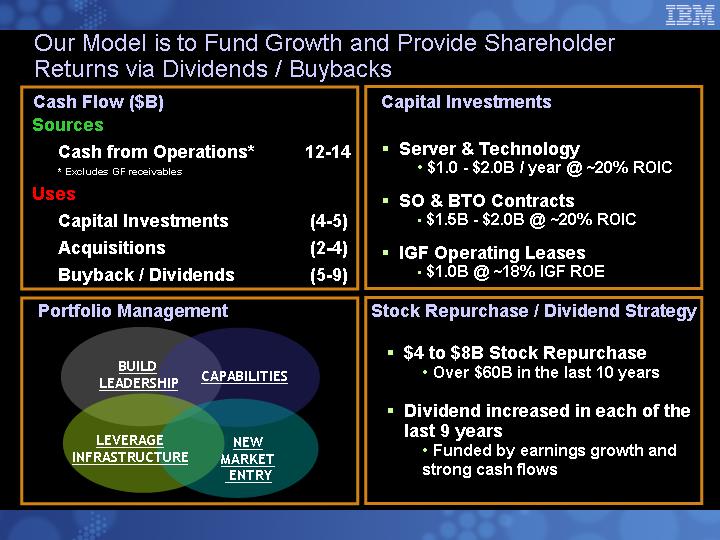
Our Model is to Fund Growth and Provide Shareholder Returns via Dividends / Buybacks
Cash Flow ($B)
Sources
Cash from Operations* |
| 12-14 |
|
* Excludes GF receivables
Uses
Capital Investments |
| (4-5) |
|
Acquisitions |
| (2-4) |
|
Buyback / Dividends |
| (5-9) |
|
Portfolio Management
BUILD |
|
|
LEADERSHIP |
| CAPABILITIES |
|
|
|
LEVERAGE |
| NEW |
INFRASTRUCTURE |
| MARKET |
|
| ENTRY |
Capital Investments
• Server & Technology
• $1.0 - $2.0B / year @ ~20% ROIC
• SO & BTO Contracts
• $1.5B - $2.0B @ ~20% ROIC
• IGF Operating Leases
• $1.0B @ ~18% IGF ROE
Stock Repurchase / Dividend Strategy
• $4 to $8B Stock Repurchase
• Over $60B in the last 10 years
• Dividend increased in each of the last 9 years
• Funded by earnings growth and strong cash flows
First Quarter Overview
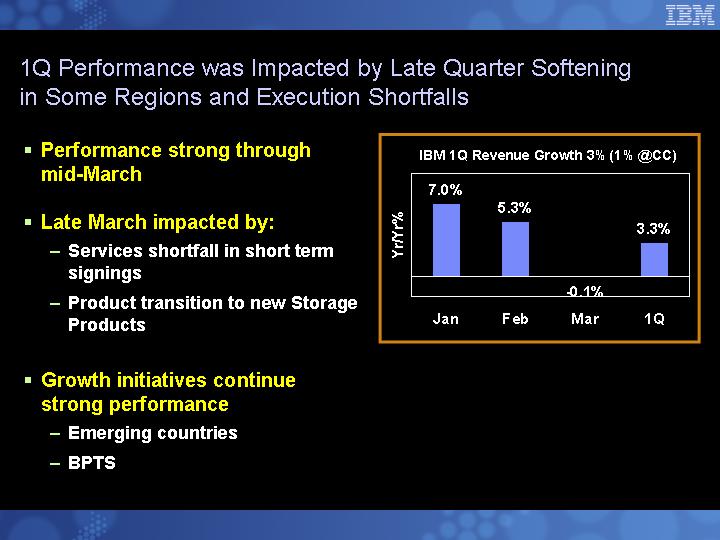
1Q Performance was Impacted by Late Quarter Softening in Some Regions and Execution Shortfalls
• Performance strong through mid-March
• Late March impacted by:
• Services shortfall in short term signings
• Product transition to new Storage Products
• Growth initiatives continue strong performance
• Emerging countries
• BPTS
IBM 1Q Revenue Growth 3% (1% @CC)
[CHART]
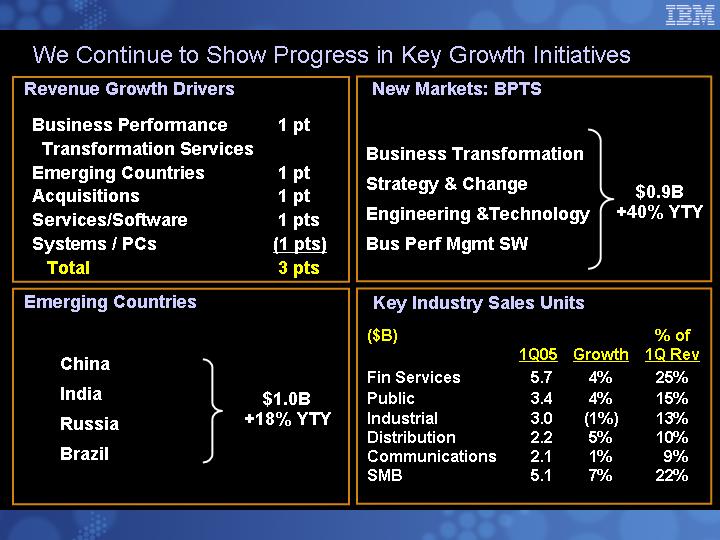
We Continue to Show Progress in Key Growth Initiatives
Revenue Growth Drivers
Business Performance |
| 1 | pt |
Transformation Services |
|
|
|
Emerging Countries |
| 1 | pt |
Acquisitions |
| 1 | pt |
Services/Software |
| 1 | pts |
Systems / PCs |
| (1 | pts) |
Total |
| 3 | pts |
Emerging Countries
China |
|
|
|
|
|
India |
|
|
|
| $1.0B |
Russia |
| +18% YTY |
|
|
|
Brazil |
|
|
New Markets: BPTS
Business Transformation |
|
|
|
|
|
Strategy & Change |
|
|
|
| $0.9B |
Engineering &Technology |
| +40% YTY |
|
|
|
Bus Perf Mgmt SW |
|
|
Key Industry Sales Units
($B)
|
| 1Q05 |
| Growth |
| % of |
|
Fin Services |
| 5.7 |
| 4 | % | 25 | % |
Public |
| 3.4 |
| 4 | % | 15 | % |
Industrial |
| 3.0 |
| (1 | )% | 13 | % |
Distribution |
| 2.2 |
| 5 | % | 10 | % |
Communications |
| 2.1 |
| 1 | % | 9 | % |
SMB |
| 5.1 |
| 7 | % | 22 | % |
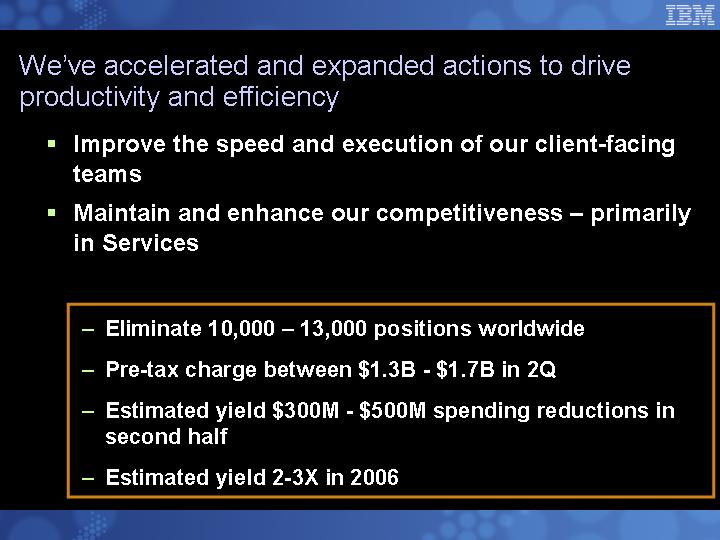
We’ve accelerated and expanded actions to drive productivity and efficiency
• Improve the speed and execution of our client-facing teams
• Maintain and enhance our competitiveness – primarily in Services
• Eliminate 10,000 – 13,000 positions worldwide
• Pre-tax charge between $1.3B - - $1.7B in 2Q
• Estimated yield $300M - $500M spending reductions in second half
• Estimated yield 2-3X in 2006
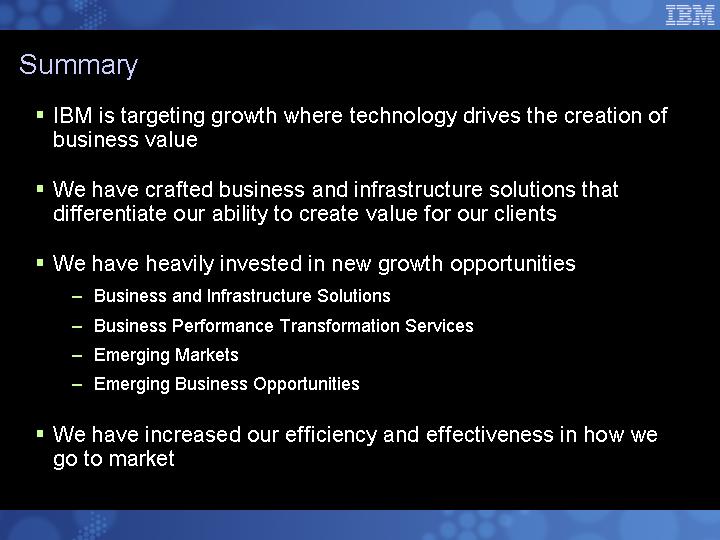
Summary
• Strong financial profile
• Investments in new products, new offerings and new markets
• Strategy that maintains leadership
• Committed to deliver double digit EPS growth over the long-term
[LOGO]
Global Services
John Joyce
Senior Vice President and Group Executive
IBM Global Services
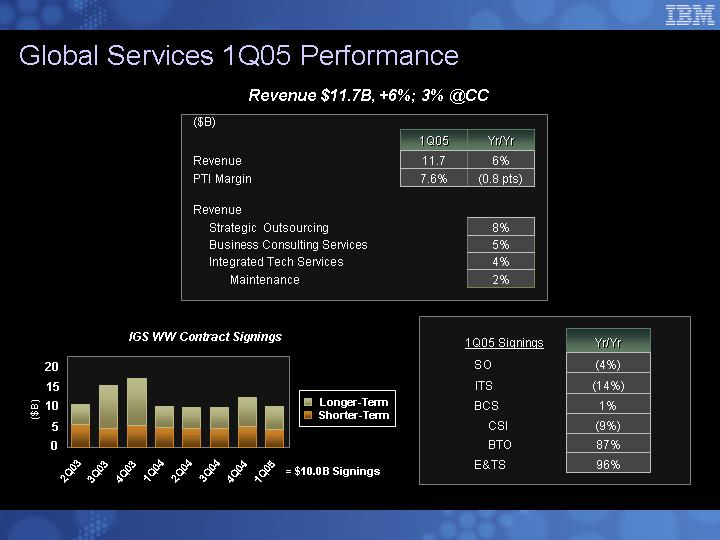
Global Services 1Q05 Performance
Revenue $11.7B, +6%; 3% @CC
($B)
|
| 1Q05 |
| Yr/Yr |
|
Revenue |
| 11.7 |
| 6 | % |
PTI Margin |
| 7.6 | % | (0.8 | pts) |
|
|
|
|
|
|
Revenue |
|
|
|
|
|
Strategic Outsourcing |
|
|
| 8 | % |
Business Consulting Services |
|
|
| 5 | % |
Integrated Tech Services |
|
|
| 4 | % |
Maintenance |
|
|
| 2 | % |
IGS WW Contract Signings
[CHART]
1Q05 Signings |
| Yr/Yr |
|
|
|
|
|
SO |
| (4 | )% |
ITS |
| (14 | )% |
BCS |
| 1 | % |
CSI |
| (9 | )% |
BTO |
| 87 | % |
E&TS |
| 96 | % |
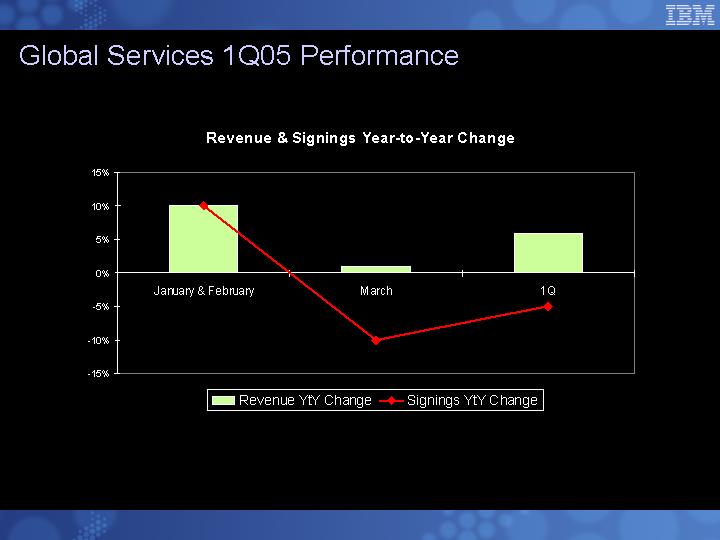
Revenue & Signings Year-to-Year Change
[CHART]
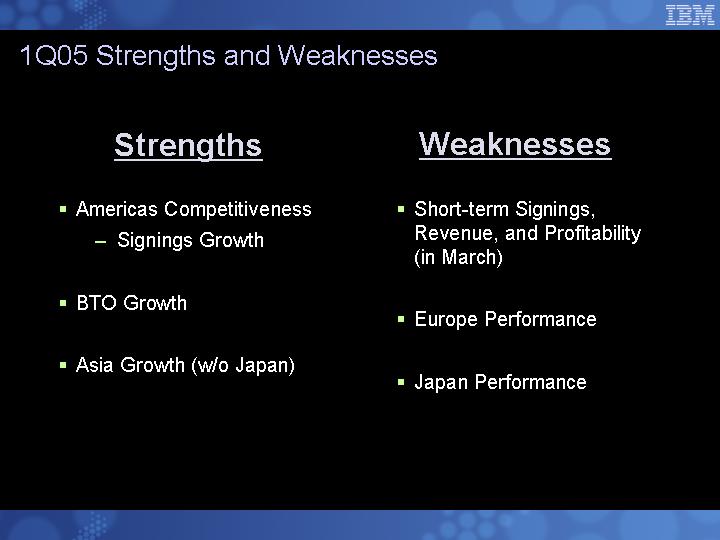
1Q05 Strengths and Weaknesses
Strengths
• Americas Competitiveness
• Signings Growth
• BTO Growth
• Asia Growth (w/o Japan)
Weaknesses
• Short-term Signings, Revenue, and Profitability (in March)
• Europe Performance
• Japan Performance
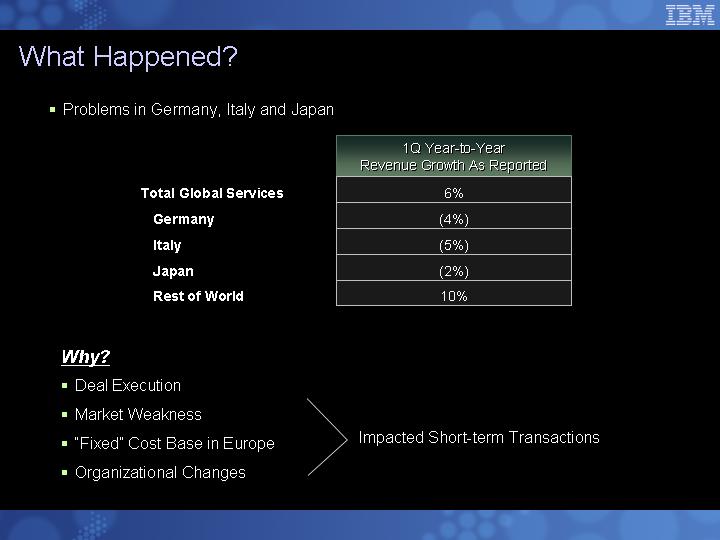
What Happened?
• Problems in Germany, Italy and Japan
|
| 1Q Year-to-Year |
|
|
|
|
|
Total Global Services |
| 6 | % |
Germany |
| (4 | )% |
Italy |
| (5 | )% |
Japan |
| (2 | )% |
Rest of World |
| 10 | % |
Why?
Impacted Short-term Transactions
• Deal Execution
• Market Weakness
• “Fixed” Cost Base in Europe
• Organizational Changes
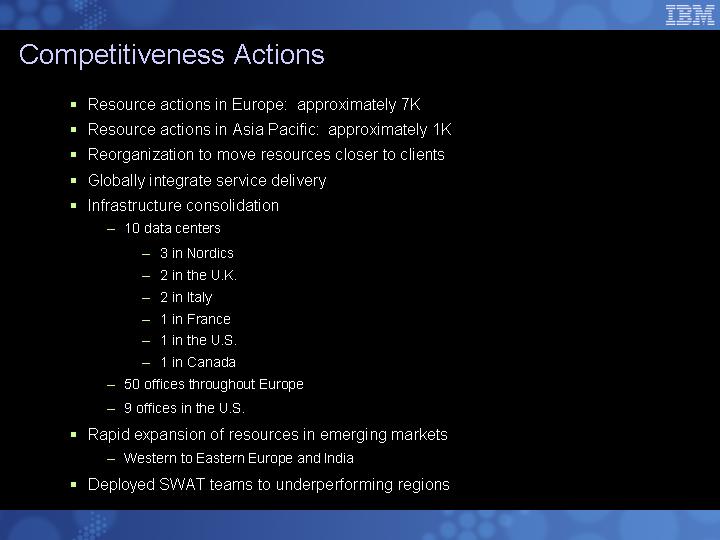
Competitiveness Actions
• Resource actions in Europe: approximately 7K
• Resource actions in Asia Pacific: approximately 1K
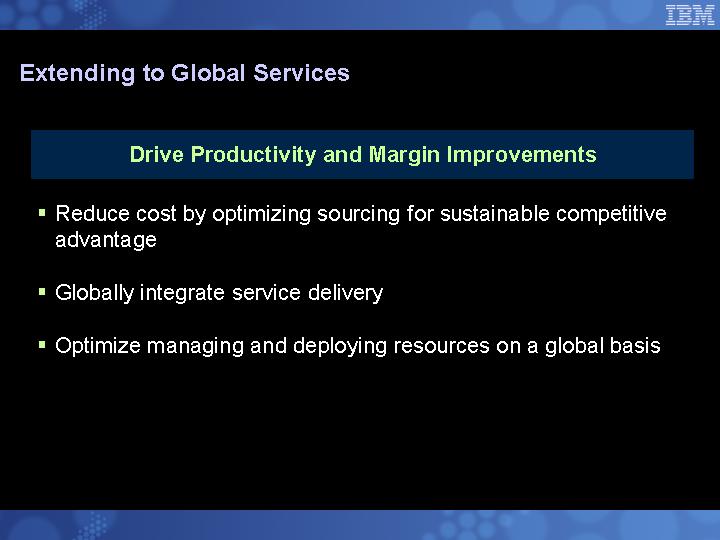
• Reorganization to move resources closer to clients
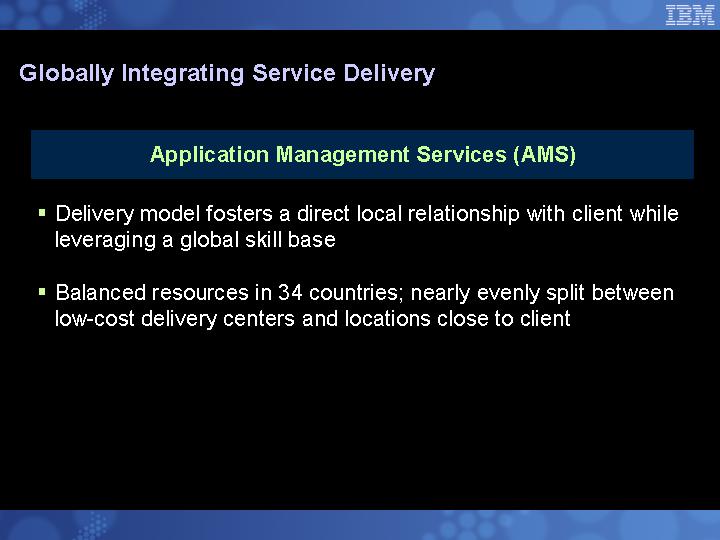
• Globally integrate service delivery
• Infrastructure consolidation
• 10 data centers
• 3 in Nordics
• 2 in the U.K.
• 2 in Italy
• 1 in France
• 1 in the U.S.
• 1 in Canada
• 50 offices throughout Europe
• 9 offices in the U.S.
• Rapid expansion of resources in emerging markets
• Western to Eastern Europe and India
• Deployed SWAT teams to underperforming regions
Business Line Actions
Integrated Technology Services & Consulting
• Coverage
• Increased coverage and technical sales resources
• Business Partners:
• Aggressively recruiting smaller, regional IT systems integrators
• Investing $300 million in new programs, consulting and education for Business Partners
• 300+ consultants redeployed to client-facing work
• Incentives
• Increased incentives on short-term contracts
• Offerings
• IT infrastructure services: wireless, security, networking/Voice Over IP, and storage
• New “Express” offerings targeted at fastest-growing segment of SMB
Strategic Outsourcing & Business Transformation Outsourcing
• Added experienced deal makers
• Increased incentives and resources to drive account growth
• Pipeline development initiatives and incentives
• Dedicated global management for BTO
Short-term Impacts
• More competitive pricing
• Improved pipeline
• Higher win rates
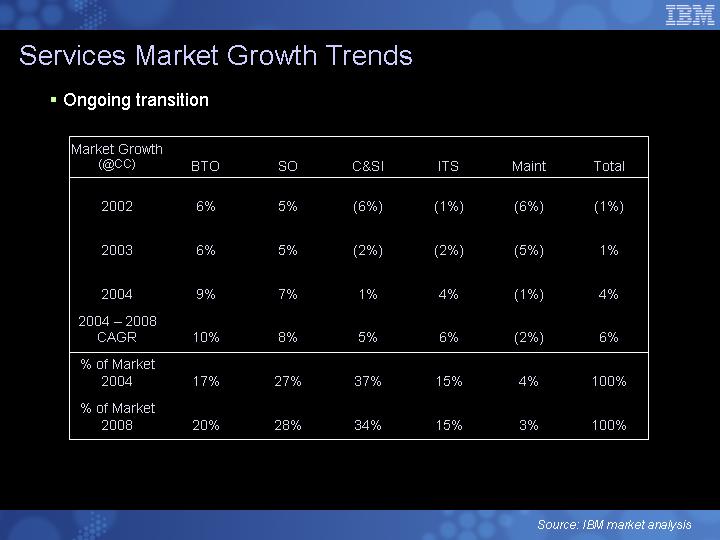
Services Market Growth Trends
• Ongoing transition
Market Growth |
| BTO |
| SO |
| C&SI |
| ITS |
| Maint |
| Total |
|
|
|
|
|
|
|
|
|
|
|
|
|
|
|
2002 |
| 6 | % | 5 | % | (6 | )% | (1 | )% | (6 | )% | (1 | )% |
|
|
|
|
|
|
|
|
|
|
|
|
|
|
2003 |
| 6 | % | 5 | % | (2 | )% | (2 | )% | (5 | )% | 1 | % |
|
|
|
|
|
|
|
|
|
|
|
|
|
|
2004 |
| 9 | % | 7 | % | 1 | % | 4 | % | (1 | )% | 4 | % |
|
|
|
|
|
|
|
|
|
|
|
|
|
|
2004 – 2008 |
| 10 | % | 8 | % | 5 | % | 6 | % | (2 | )% | 6 | % |
|
|
|
|
|
|
|
|
|
|
|
|
|
|
% of Market |
| 17 | % | 27 | % | 37 | % | 15 | % | 4 | % | 100 | % |
|
|
|
|
|
|
|
|
|
|
|
|
|
|
% of Market |
| 20 | % | 28 | % | 34 | % | 15 | % | 3 | % | 100 | % |
Source: IBM market analysis
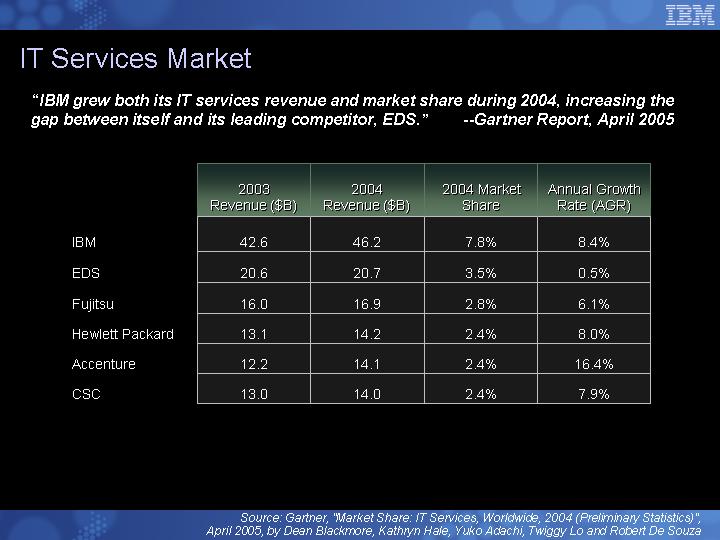
IT Services Market
“IBM grew both its IT services revenue and market share during 2004, increasing the gap between itself and its leading competitor, EDS.” �� —Gartner Report, April 2005
|
| 2003 |
| 2004 |
| 2004 Market |
| Annual Growth |
|
|
|
|
|
|
|
|
|
|
|
IBM |
| 42.6 |
| 46.2 |
| 7.8 | % | 8.4 | % |
|
|
|
|
|
|
|
|
|
|
EDS |
| 20.6 |
| 20.7 |
| 3.5 | % | 0.5 | % |
|
|
|
|
|
|
|
|
|
|
Fujitsu |
| 16.0 |
| 16.9 |
| 2.8 | % | 6.1 | % |
|
|
|
|
|
|
|
|
|
|
Hewlett Packard |
| 13.1 |
| 14.2 |
| 2.4 | % | 8.0 | % |
|
|
|
|
|
|
|
|
|
|
Accenture |
| 12.2 |
| 14.1 |
| 2.4 | % | 16.4 | % |
|
|
|
|
|
|
|
|
|
|
CSC |
| 13.0 |
| 14.0 |
| 2.4 | % | 7.9 | % |
Source: Gartner, “Market Share: IT Services, Worldwide, 2004 (Preliminary Statistics)”, |
April 2005, by Dean Blackmore, Kathryn Hale, Yuko Adachi, Twiggy Lo and Robert De Souza |
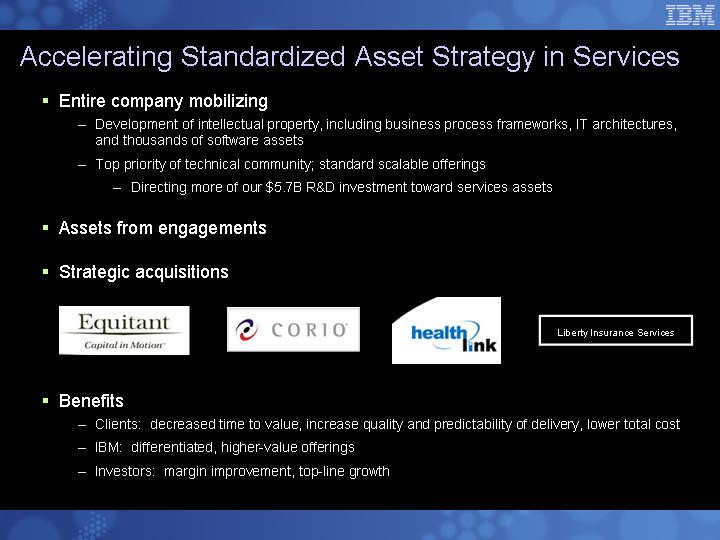
Accelerating Standardized Asset Strategy in Services
• Entire company mobilizing
• Development of intellectual property, including business process frameworks, IT architectures, and thousands of software assets
• Top priority of technical community; standard scalable offerings
• Directing more of our $5.7B R&D investment toward services assets
• Assets from engagements
• Strategic acquisitions
[LOGO]
• Benefits
• Clients: decreased time to value, increase quality and predictability of delivery, lower total cost
• IBM: differentiated, higher-value offerings
• Investors: margin improvement, top-line growth
Business Performance Transformation Services Market
BPTS Market Opportunity
[CHART]
Summary
Short-term
• More competitive pricing
• Improved pipeline
• Higher win rates
Long-term
• Market growth
• Well positioned
• Will continue to grow
• Will improve profitability
Good Start in Second Quarter
[LOGO]
[LOGO]
Systems and Technology
Bill Zeitler
Senior Vice President and Group Executive
IBM Systems and Technology
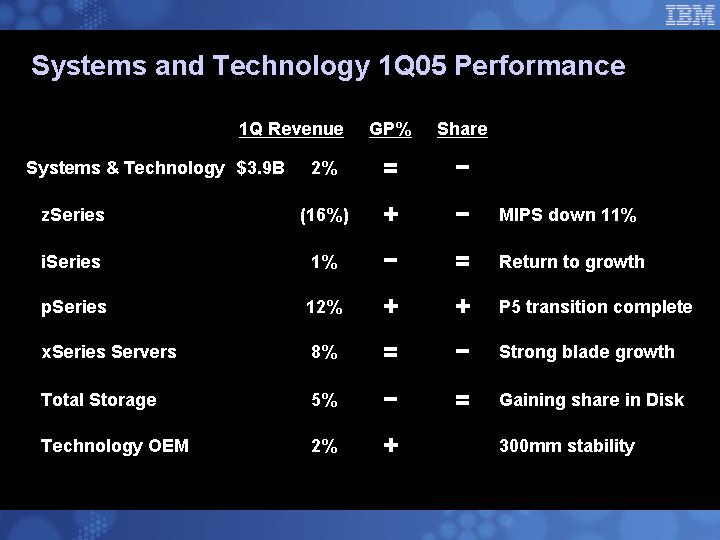
Systems and Technology 1Q05 Performance
|
| 1Q Revenue |
| GP% |
| Share |
|
|
| |
|
|
|
|
|
|
|
|
|
| |
Systems & Technology | $3.9B |
| 2 | % | = |
| - |
|
|
|
|
|
|
|
|
|
|
|
|
| |
zSeries |
| (16 | )% | + |
| - |
| MIPS down 11% |
| |
|
|
|
|
|
|
|
|
|
| |
iSeries |
| 1 | % | - |
| = |
| Return to growth |
| |
|
|
|
|
|
|
|
|
|
| |
pSeries |
| 12 | % | + |
| + |
| P5 transition complete |
| |
|
|
|
|
|
|
|
|
|
| |
xSeries Servers |
| 8 | % | = |
| - |
| Strong blade growth |
| |
|
|
|
|
|
|
|
|
|
| |
Total Storage |
| 5 | % | - |
| = |
| Gaining share in Disk |
| |
|
|
|
|
|
|
|
|
|
| |
Technology OEM |
| 2 | % | + |
|
|
| 300mm stability |
| |
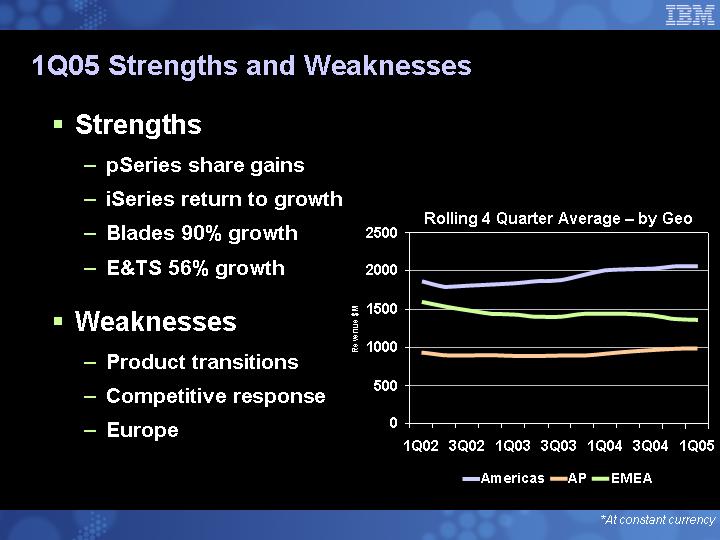
1Q05 Strengths and Weaknesses
• Strengths
• pSeries share gains
• iSeries return to growth
• Blades 90% growth
• E&TS 56% growth
• Weaknesses
• Product transitions
• Competitive response
• Europe
Rolling 4 Quarter Average – by Geo
[CHART]
*At constant currency
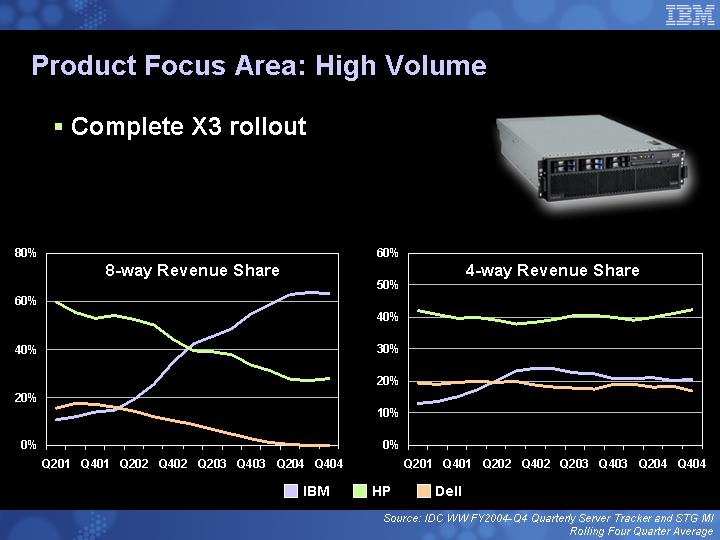
Product Focus Area: High Volume
• Complete X3 rollout
[GRAPHIC]
8-way Revenue Share
[CHART]
4-way Revenue Share
[CHART]
Source: IDC WW FY2004-Q4 Quarterly Server Tracker and STG MI
Rolling Four Quarter Average
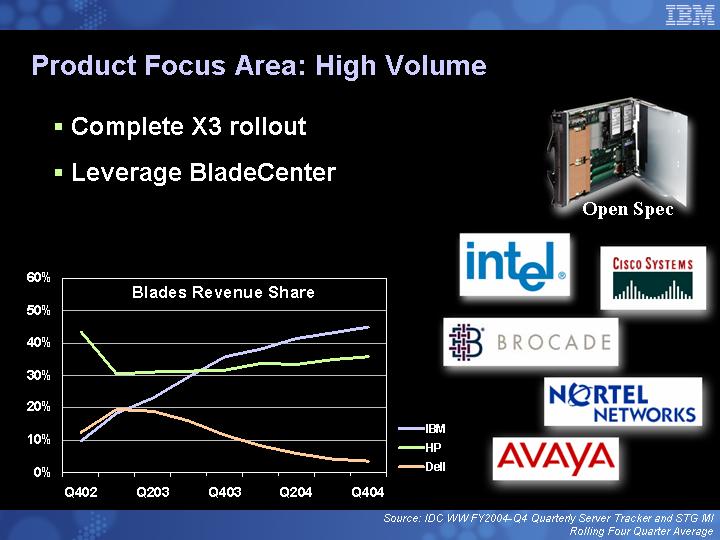
• Complete X3 rollout
• Leverage BladeCenter
Blades Revenue Share
[CHART]
[GRAPHIC]
Open Spec
[LOGO]
Source: IDC WW FY2004-Q4 Quarterly Server Tracker and STG MI
Rolling Four Quarter Average
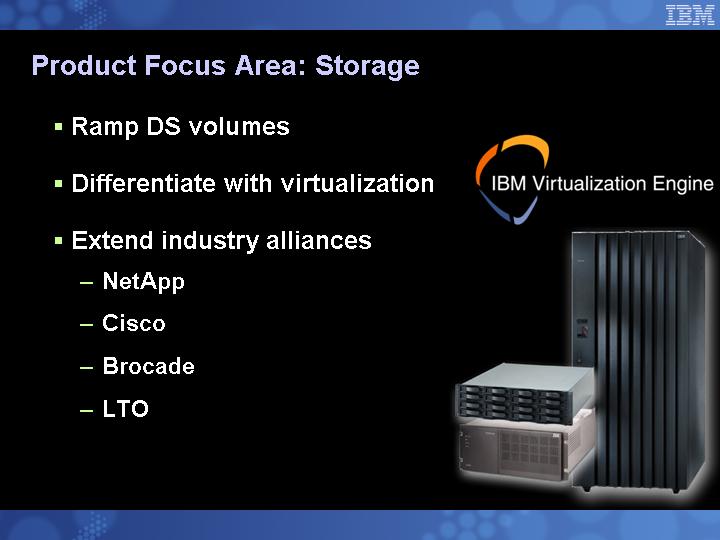
Product Focus Area: Storage
• Ramp DS volumes
• Differentiate with virtualization
• Extend industry alliances
• NetApp
• Cisco
• Brocade
• LTO
[LOGO]
[GRAPHIC]
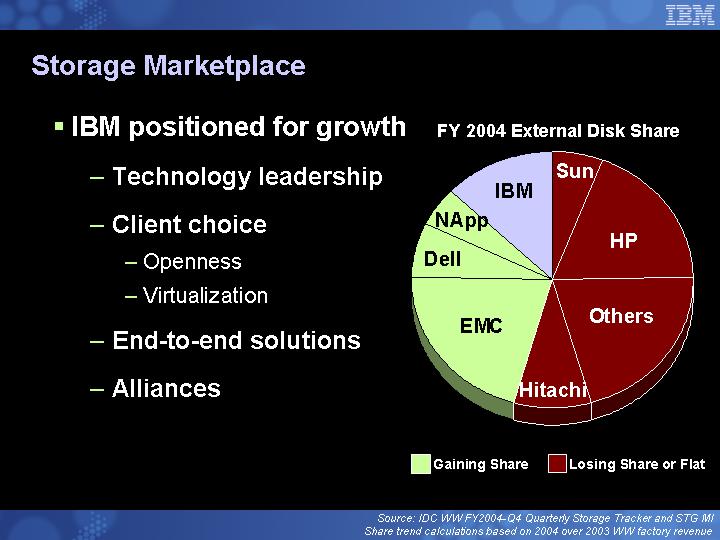
Storage Marketplace
• IBM positioned for growth
• Technology leadership
• Client choice
• Openness
• Virtualization
• End-to-end solutions
• Alliances
FY 2004 External Disk Share
[CHART]
Source: IDC WW FY2004-Q4 Quarterly Storage Tracker and STG MI
Share trend calculations based on 2004 over 2003 WW factory revenue
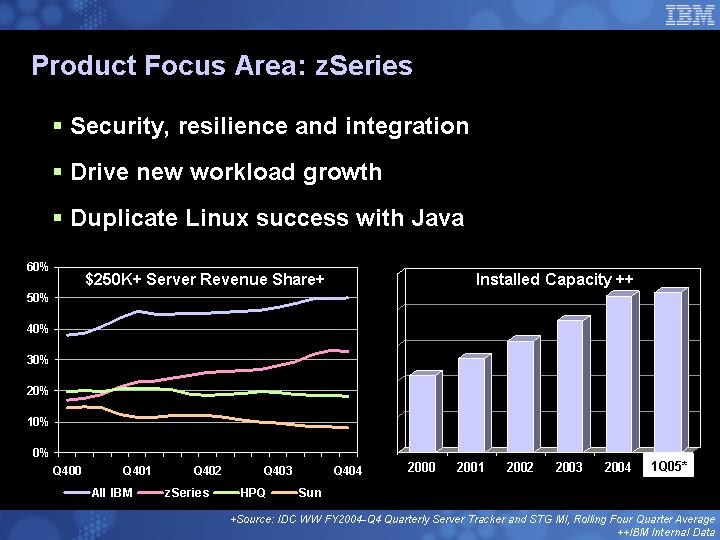
Product Focus Area: zSeries
• Security, resilience and integration
• Drive new workload growth
• Duplicate Linux success with Java
$250K+ Server Revenue Share+
[CHART]
Installed Capacity ++
[CHART]
+Source: IDC WW FY2004-Q4 Quarterly Server Tracker and STG MI, Rolling Four Quarter Average
++IBM Internal Data
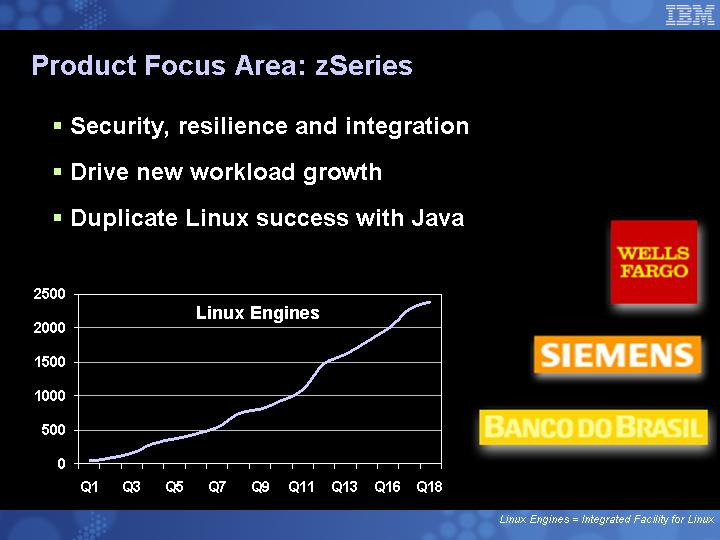
• Security, resilience and integration
• Drive new workload growth
• Duplicate Linux success with Java
Linux Engines
[CHART]
[LOGO]
Linux Engines = Integrated Facility for Linux
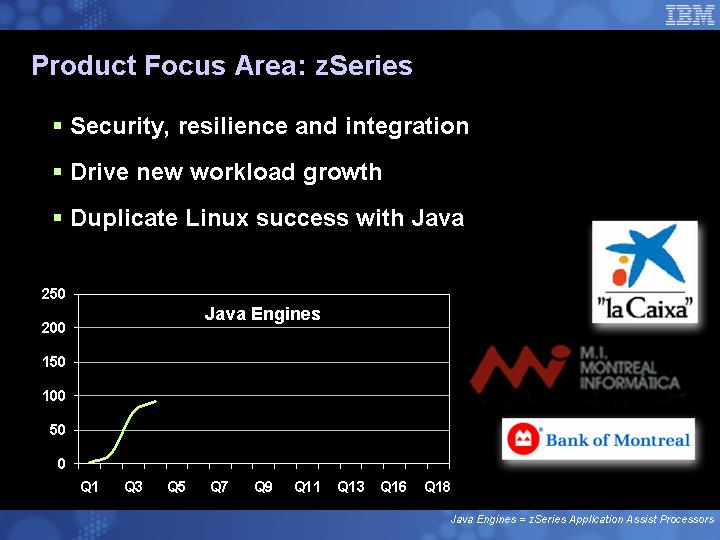
• Security, resilience and integration
• Drive new workload growth
• Duplicate Linux success with Java
Java Engines
[CHART]
[LOGO]
Java Engines = zSeries Application Assist Processors
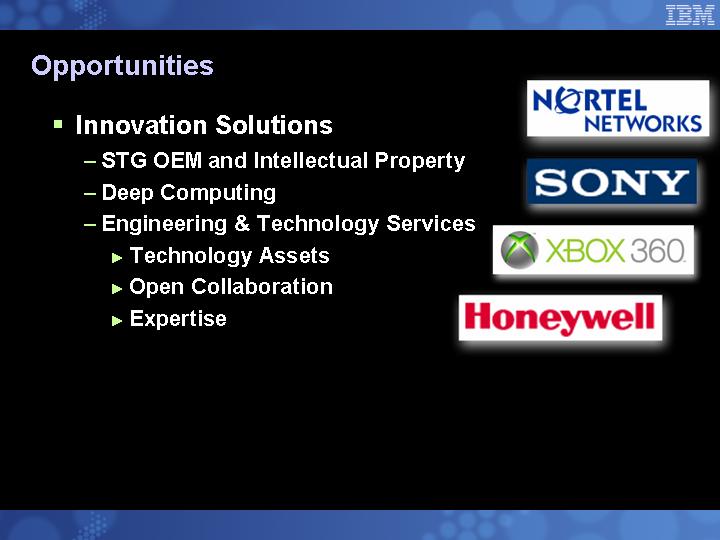
Opportunities
• Innovation Solutions
• STG OEM and Intellectual Property
• Deep Computing
• Engineering & Technology Services
• Technology Assets
• Open Collaboration
• Expertise
[LOGO]
• Innovation Solutions
• STG OEM and Intellectual Property
• Deep Computing
• Engineering & Technology Services
• Infrastructure Solutions
• Linux
• Grid
• Virtualization
• Technology
[LOGO]
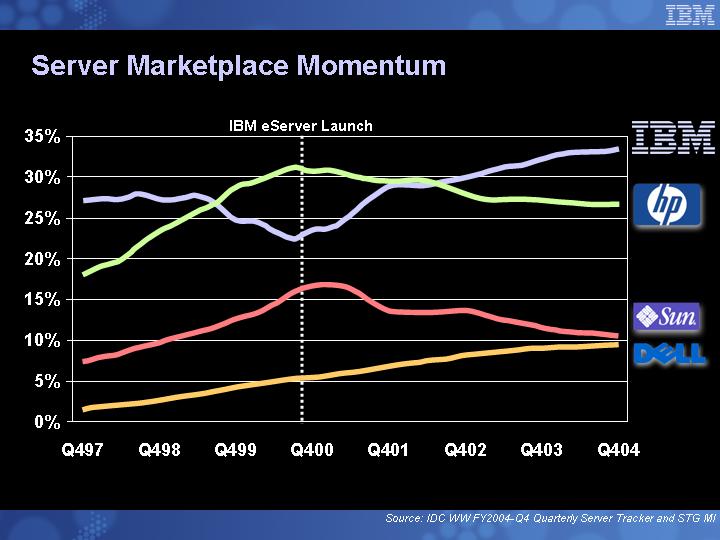
Server Marketplace Momentum
IBM eServer Launch
[CHART]
[LOGO]
Source: IDC WW FY2004-Q4 Quarterly Server Tracker and STG MI
Summary
• Execution focus
• Leadership offerings
• Positioned for growth
Software
Steve Mills
Senior Vice President and Group Executive
IBM Software
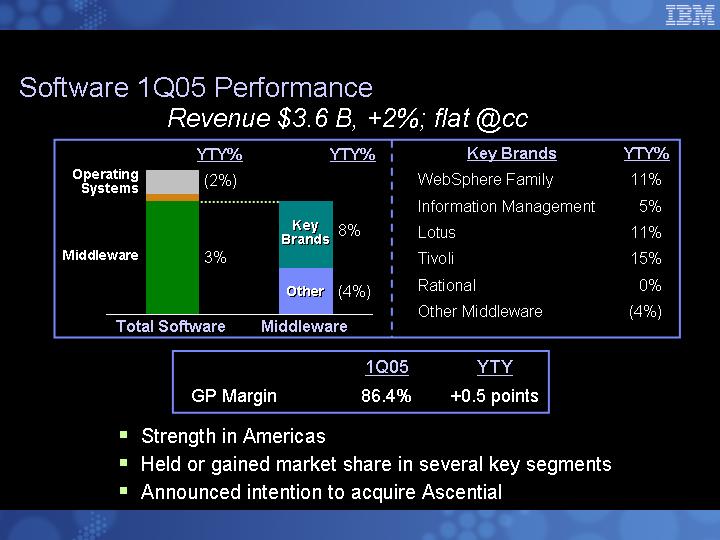
Software 1Q05 Performance
Revenue $3.6 B, +2%; flat @cc
[CHART]
Key Brands |
| YTY% |
|
WebSphere Family |
| 11 | % |
Information Management |
| 5 | % |
Lotus |
| 11 | % |
Tivoli |
| 15 | % |
Rational |
| 0 | % |
Other Middleware |
| (4 | )% |
|
| 1Q05 |
| YTY |
|
GP Margin |
| 86.4 | % | +0.5 points |
|
• Strength in Americas
• Held or gained market share in several key segments
• Announced intention to acquire Ascential
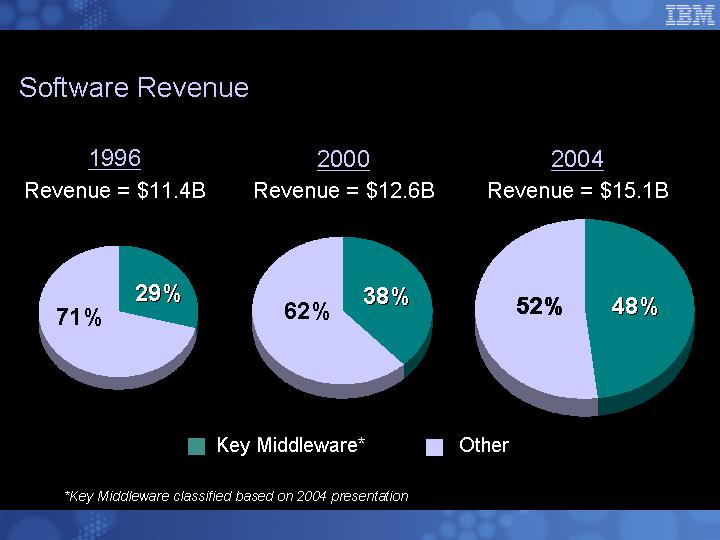
Software Revenue
1996 |
| 2000 |
| 2004 |
|
Revenue = $11.4B |
| Revenue = $12.6B |
| Revenue = $15.1B |
|
[CHART] |
| [CHART] |
| [CHART] |
|
*Key Middleware classified based on 2004 presentation
Software
2004 Revenue = $15.1 B
[CHART]
Other
$0.7B 6% YTY
• Software Services
Key Middleware Brands
$7.3B 10% YTY
• WebSphere Family
• Application Server
• Business Integration
• Portal
• Information Management
• DB2 Family / Tools
• Content Management
• Business Intelligence
• Information Integration
• Lotus Domino & Workplace
• Tivoli
• Systems Management
• Security Management
• Storage Management
• Rational
Other Middleware
$4.7B 2% YTY
• Legacy Host Tools & Compilers
• Communication Servers
• Printer Software
• Storage Software
Operating Systems
$2.5B 1% YTY
• System software for zSeries, pSeries, iSeries, and xSeries servers
1Q05 Strengths and Weaknesses
Strengths
• Americas growth
• Growth in key products
• More pronounced mix to small transactions
Weaknesses
• Country weakness – Germany, France, Italy, Japan
• Deal slippage
• Financial Services sector weakness after strong 4Q04
2005 Actions to Drive Sustained Growth
• Increased specialist sales teams
• Shifting 700+ sales resources to product specialty roles
• 400+ shifted in 1Q05
• Increased competitive focus teams
• Sales / technical sales / laboratory teams
• Increased Lab Services teams
• Proofs of concept
• Deployment
• Premium support
• Refocused telesales teams
• Opportunity identification for cross selling / upselling
• Renewals, emphasizing the value of ongoing development
• Improved partner programs / reach
• Over 8,000 Business Partners
• Supported by in-country IBM sales resources
• Increased local marketing spending
• 40 – 50 events per week
• Focused on lead generation, closings
• Joint marketing with Business Partners
• Improved industry focus
• Industry alignment of solution teams across IBM
• PartnerWorld Industry Networks
Evolution Towards Middleware
Business Processes |
| Customer |
| Enterprise |
| Product |
| Procurement |
| Value | |
|
|
|
|
|
|
|
|
|
|
| |
Applications |
| [LOGO] | |||||||||
|
|
|
|
|
|
|
|
|
|
| |
Middleware |
| Human |
| Transactions |
| Information |
| Systems |
| Software | |
| Lotus |
| WebSphere |
| DB2 |
| Tivoli |
| Rational | ||
|
|
|
|
|
|
|
|
|
|
| |
Systems |
| Linux |
| Unix |
| Windows |
| OS/400 |
| z/OS | |
| Servers | Storage | |||||||||
IBM Ranked #1 or #2 in the Majority of These Growth Segments
2004 Middleware
Opportunity = $ 75 B
’04 – ’08 CGR = 6%
[CHART]
2008 Market Mix
High Growth Product Segments |
| ‘04 – ‘08 |
|
Mobile Middleware |
| 13 | % |
Portals and Personalization |
| 11 | % |
Information Integration |
| 10 | % |
Content Management |
| 10 | % |
Advanced Collaboration |
| 9 | % |
Storage Management |
| 9 | % |
Integration Server |
| 8 | % |
Relational Database and Tools |
| 8 | % |
AD Lifecycle Management Tools |
| 7 | % |
Security / Identity Management |
| 7 | % |
Source: IBM analysis based on Industry Reports / Market Research, 5/05
Strategic Acquisitions to Drive Growth
Bold Market | + | Complementary | + | Opportunistic | + | Market |
Entry |
| Point Products |
| Consolidations |
| Leadership |
|
|
|
|
|
|
|
• High profile entry
• Leverage IBM strengths |
| • Highly complementary technology buys
• Gain time to market
• Leverage IBM channels |
| • Companies with significant revenue streams
• Retain customers and leverage install base
• Achieve cost and expense synergies |
| • Buy market leaders in growth segments
• Strong ecosystems
• Large customer install bases
• Usually command premium valuations |
|
|
|
|
|
|
|
• Lotus |
| • CrossWorlds • Access360 • ThinkDynamics • Trigo • SRD • Ascential • Gluecode Software
|
| • Informix • Candle
|
| • Tivoli • Rational
|
Leverage Partner Ecosystem
• ISVs
• 100+ Global ISVs
• 2,000+ Regional ISVs
• System Integrators
• 75+ Global SIs
• 2,300+ Regional SIs
• Resellers
• 2,500+ Value Added Resellers
• 1,000+ Software Resellers
Influenced Software Revenue
[CHART]
[LOGO]
Customer |
| Requirement |
| Middleware |
| Benefits |
|
|
|
|
|
|
|
[LOGO] | • | Integrate multiple SAP | • | WebSphere | • | 70% faster time-to-market |
|
| applications with legacy |
|
| • | 99.7% availability |
|
| mainframe systems |
|
|
|
|
|
|
|
|
|
|
|
[LOGO] | • | Deploy new policy rating | • | WebSphere | • | 98% of new applications |
|
| system | • | DB2 |
| processed within 24hrs |
|
|
| • | Lotus Domino | • | 48% higher productivity per |
|
|
| • | Rational |
| employee than national average |
|
|
|
|
|
|
|
|
|
|
|
|
|
|
[LOGO] | • | Build Web-based supply chain | • | WebSphere | • | Reduced cycle time by 2/3 |
|
| management system | • | DB2 | • | Reduced cost by 25% |
|
|
| • | Tivoli Security Mgmt. |
|
|
|
|
| • | IBM xSeries Servers |
|
|
Summary
• Invest in Development
• Acquire
• Invest in Sales and Marketing
Result
• Profitable, well protected install base
• Renewal streams accelerating
• New placements continue to drive growth
$2B+ Annual Development
42 Acquisitions 1995 -2005
10,000+ Geo Sales Force 8,000+ Partners
Global Integration
Bob Moffat
Senior Vice President, Integrated Supply Chain
IBM Corporation
Global Integration: Leveraging Our Multi-national Presence for Operational Advantage
Globally integrating operations of our company to:
• Capitalize on economies of expertise and scale
• Achieve greater levels of integration and efficiency
• Improve responsiveness
Benefits of Global Integration
Procurement
• Transformed administrative-intensive value add
• Optimized sourcing for sustainable competitive advantage
• Common processes and enabling technologies
• Leveraging expertise in BTO engagements
Customer Fulfillment
• Consolidated operations worldwide for 10-15% synergies
• Consolidated administrative and transaction processing in global centers in Malaysia, Slovakia, Spain and Brazil
• Redirected resources to higher value client support roles that improved sales face-time 38%
• Common processes and enabling technologies
Supply Chain as a Key Indicator of Expected Productivity Benefits as We Globally Integrate More of Our Operations
Efficiency
• Steady state cost reductions; 2/3 of total IBM savings in 2004 from IGS
Productivity
• Sales force spending 38% more time with clients
Responsiveness
• Turning orders 36% faster
Flexibility
• Executed Lenovo (2X) in half the time of Hitachi divestiture
Starting Now with These Processes to Achieve Productivity Targets; Opportunity 3X the Size of Supply Chain
|
| Sales Operations |
|
|
|
|
| IT |
|
|
|
Customer |
| Marketing |
Fulfillment | Centers of |
|
| Excellence | Communications |
Procurement |
|
|
| INTEGRATE | Finance |
Global | AUTOMATE |
|
Logistics | OPTIMIZE | Pricing |
|
|
|
Manufacturing |
| HR |
|
|
|
|
| Legal |
|
|
|
|
| Real Estate |
Extending to Global Services
Drive Productivity and Margin Improvements
• Reduce cost by optimizing sourcing for sustainable competitive advantage
• Globally integrate service delivery
• Optimize managing and deploying resources on a global basis
Globally Integrating Service Delivery
Application Management Services (AMS)
• Delivery model fosters a direct local relationship with client while leveraging a global skill base
• Balanced resources in 34 countries; nearly evenly split between low-cost delivery centers and locations close to client
Managing and Deploying Business Consulting Services Resources Faster and More Efficiently
[GRAPHIC]
• Full visibility of global talent pool; IBM and network of suppliers
• Dynamic searches based on skill, availability and cost
• Engagements staffed 20% percent faster
• Ability to weigh staffing alternatives to improve profitability
Summary
Confidence in our ability to achieve productivity targets
• Globally integrating the company
• Demonstrated traction in supply chain
• Rapidly applying to more processes
• Extending to delivery in Global Services
• Managing and deploying global capabilities more effectively
• Creating a flatter operating model with more resources working with clients
[LOGO]
Sales & Distribution
Doug Elix
Senior Vice President and Group Executive
IBM Sales and Distribution
IBM is Targeting Growth Where Technology Drives the Creation of Business Value
• Solutions (Business and Infrastructure)
• Solves a client’s business or IT problem through a combination of technology and high-value services with one or more offerings from one or more companies
• Business Performance Transformation Services (BPTS)
• Focuses on transforming clients’ business processes to drive business performance improvements
• Emerging Business Opportunities (EBOs)
• Telecommunications, Retail, Information-Based Medicine
• Emerging Countries
• China, India, Brazil, and Russia
Pursuing the Solutions Opportunity
Solutions are growing faster than the rest of the market. While point products will remain an important part of our business, we need to focus on high-value solutions to meet clients’ needs and drive our growth
[GRAPH]
|
| Source: IBM Market Intelligence, |
|
| Solutions Market View 2H2004 |
Crafting and Delivering Business and Infrastructure Solutions
Business Solutions:
• 45 solutions currently deployed
• Industry Specific Solutions:
• Targeted solely to a specific industry issue
• Multi-Industry Solutions:
• Issue that is common to multiple industries
• ISV Solutions:
• Solve a client’s issue with a specific ISV solution
[LOGO]
Infrastructure Solutions:
• 16 infrastructure “scenarios”
• Solutions for 9 of 16 scenarios now deployed
• Cross-industry:
• Multiple industries/minimal tailoring
Address top customer needs:
• Business Resilience, IT Optimization, Information Insights, and Business Flexibility
[LOGO]
Business and Infrastructure Solutions:
• 440 business solution specialists deployed
• 110 infrastructure solution specialists deployed
• 24,000 delivery professionals
With BPTS, We See an Opportunity to Broaden Our Addressable Market by up to $500 Billion
Business |
Value |
|
Infrastructure |
Value |
|
Component |
Value |
Business Transformation |
Services Firms |
|
BPTS |
Opportunity: |
$1.4T |
‘04-’08 CAGR: 9-10 % |
|
Existing IT Industry |
Opportunity: |
$1.2T |
‘04-’08 CAGR of 5-6% |
|
IT Firms |
The BPTS Strategy: |
Growing in existing BTO |
|
• CRM |
• Finance & Administration |
• HR |
• Procurement |
• Insurance Administration/Banking Back Office |
Source: IBM Market Intelligence |
Business |
Value |
|
Infrastructure |
Value |
|
Component |
Value |
Business Transformation |
Services Firms |
|
BPTS |
Opportunity: |
$1.4T |
‘04-’08 CAGR: 9-10 % |
|
Existing IT Industry |
Opportunity: |
$1.2T |
‘04-’08 CAGR of 5-6% |
|
IT Firms |
The BPTS Strategy: |
Pioneering in new market areas |
|
• Service After Sales |
• Supply Chain Management Optimization |
• Road User Charging |
• Telco and Utility Billing |
• Engineering & Technology Services |
• Center for Business Optimization |
• Collaboration |
Seizing Innovation to Grow
Telco Initiative:
• Take advantage of solutions trends in Telco marketplace, particularly around network transformation and order-to-cash
• Deploy resources into emerging countries
Market Opportunity
[CHART]
Retail EBO:
• Establish the IBM Store Integration Framework as the leading operating environment in the retail store
• Build ecosystem of Business Partners and establish IBM as the trusted advisor for store-based innovation and transformation
[CHART]
Information-based Medicine EBO
• Advance relationships with research institutions and policymakers shaping new healthcare agenda
• Develop solutions to integrate medical and clinical data
• Build ecosystem with medical imaging manufacturers and clinical information application providers
[CHART]
IBM Revenue has Grown More Rapidly in Emerging Countries than in Established Markets and Faster than the Opportunity
IBM Revenue |
| Market Opportunity |
|
| CAGR 02-04 |
|
|
|
|
| CAGR 02-04 |
|
|
| CAGR 02-04 |
|
France |
| 2 | % | Resource |
| Russia |
| 59 | % | Russia |
| 26 | % |
Japan |
| -1 | % | Allocation |
| India |
| 49 | % | India |
| 18 | % |
Germany |
| -2 | % |
|
| Brazil |
| 21 | % | Brazil |
| 4 | % |
|
|
|
| Resource |
| China* |
| 15 | % | China* |
| 11 | % |
|
|
|
| Allocation |
|
|
|
|
|
| |||
|
| CAGR 02-04 |
|
|
|
|
|
|
|
| |||
US |
| 4 | % |
|
|
|
|
|
|
| |||
UK |
| 3 | % |
|
|
|
|
|
|
| |||
|
| Source: IBM Analysis; at constant currency |
|
| * 2002 excludes $642M of GKI OEM hardware revenue |
Delivering Value in Emerging Countries
[GRAPHIC]
Addressing unique solution needs in priority industries
China |
| India |
| Brazil |
| Russia/CEE |
|
• Banking |
| • Banking |
| • Banking |
| • Chemicals & Petroleum |
|
• Telecom |
| • Automotive |
| • Government |
| • Banking |
|
• Government |
| • Telecom |
|
|
| • Telecom |
|
• Retail |
| • Government |
|
|
| • Government |
|
|
| • Healthcare |
|
|
|
|
|
Investing in core capabilities
• Human Capital
• Solution and Infrastructure Platforms
• Offerings tailored to Emerging Market realities’
• Domestic and Global Partner ecosystem
Differentiating through innovation and thought leadership
• Open Industry Standards leadership
• IBM Research Labs in India and China
• Government and Academic Partnerships to support the social agenda
Shifting Resources to Capture Growth
• Emerging Countries
• Global Resourcing
Headcount
[CHART]
• Emerging Business Opportunities
Headcount
[CHART]
Source: IBM Analysis |
Shifting Resources to Capture Growth
• Business Performance Transformation Services
Headcount
[CHART]
• Solutions
Headcount
[CHART]
New Model Moves Critical Resources Closer to the Client, Lowers the IBM Integration Point and Enables Integration Where It Counts
[GRAPHIC]
Summary
• IBM is targeting growth where technology drives the creation of business value
• We have crafted business and infrastructure solutions that differentiate our ability to create value for our clients
• We have heavily invested in new growth opportunities
• Business and Infrastructure Solutions
• Business Performance Transformation Services
• Emerging Markets
• Emerging Business Opportunities
• We have increased our efficiency and effectiveness in how we go to market
[LOGO]
Non-GAAP Financial Measures
In an effort to provide investors with additional information regarding certain financial measures as determined by generally accepted accounting principles (GAAP), the Company also discloses the following non-GAAP information which management believes provides useful information to investors:
• Management refers to growth rates at constant currency or adjusting for currency so that the business results can be viewed without the impact of changing foreign currency exchange rates, thereby facilitating period-to-period comparisons of the Company’s businesses. Generally, when the dollar either strengthens or weakens against other currencies, the growth at constant currency rates or adjusting for currency will be higher or lower than growth reported at actual exchange rates.
• Management’s model with respect to cash from operations excludes the effect of Global Financing Receivables. For a financing business, increasing receivables is the basis for growth. Receivables are viewed as an investment and an income-producing asset. Therefore, management presents financing receivables as an investing activity, which has the effect of lowering cash from operations. Management’s view is that this presentation gives the investor the best perspective of cash available for investment or for distribution to shareholders.
• Management has presented historical and forecasted retirement related income/expense excluding a one-time charge recorded in 2004 for the partial settlement of certain legal claims related to IBM’s pension plan. Given the unique and non-recurring nature of this charge, management believes that presenting such financial items without the charge is useful to investors in better understanding the company’s business performance. Management further believes that investors’understanding is enhanced when the year-to-year dynamics associated with pension cost is rendered explicit. Therefore, while giving appropriate prominence to the GAAP based financial measures, the Company believes it is appropriate and useful to investors to include these non-GAAP measures.
• Management has presented certain financial results excluding the effects of special actions in 1999 and 2002. Given the unique and non-recurring nature of these items (both gains and losses), management believes that presenting certain financial results without the effects of such actions is more representative of the company’s operational performance and year-over-year dynamics.
• Additionally, certain financial results have been restated to reflect the company’s adoption of expensing of stock based compensation in 2005. However, given certain data limitations, selected financial results (gross margin and expense to revenue ratio) from 1995 –2000 have been presented without the effects of equity compensation in those years.
• Management uses return on invested capital (ROIC) as a measure of how effectively we allocate our capital and measure our profitability. Since ROIC is a measure of return on invested capital, interest expense is excluded to isolate the return earned on capital prior to payment (interest) to the debt holders.
Reconciliation Of Gross Profit Margin (Gpm) And Expense To Revenue Ratio (E:r), Excluding Special Actions
|
| 1999 |
| 2002 |
|
|
| % |
| % |
|
|
|
|
|
|
|
GPM, excluding effects of Special Actions |
| 37.2 |
| 36.6 |
|
Effects of Special Actions |
| (0.2 | ) | — |
|
GPM |
| 37.0 |
| 36.6 |
|
|
|
|
|
|
|
E:R, excluding effects of Special Actions |
| 26.4 |
| 26.7 |
|
Effects of Special Actions |
| (3.5 | ) | 2.7 |
|
E:R |
| 22.9 |
| 29.4 |
|
Reconciliation Of Retirement- Related Expense
|
| 2003 |
| 2004 |
| 2005 |
|
|
| $(B) |
| $(B) |
| $(B) |
|
Retirement-Related Expense, excluding One-time Pension Settlement Charge |
| 0.4 |
| 1.1 |
| 2.2 |
|
One-Time Pension Settlement Charge |
| — |
| 0.3 |
| — |
|
Retirement-Related Expense |
| 0.4 |
| 1.4 |
| 2.2 |
|
|
|
|
|
|
|
|
|
B/(W) Yr/Yr - Retirement-Related Expense, excluding One-time Pension Settlement Charge* |
|
|
| (0.8 | ) | (1.0 | ) |
One-Time Pension Settlement Charge |
|
|
| (0.3 | ) | 0.3 |
|
B/(W) Yr/Yr - Retirement-Related Expense* |
|
|
| (1.1 | ) | (0.7 | ) |
*May not add due to rounding