UNITED STATES
SECURITIES AND EXCHANGE COMMISSION
WASHINGTON, D.C. 20549
FORM 8-K
CURRENT REPORT PURSUANT TO SECTION 13 OR 15 (d)
OF THE SECURITIES EXCHANGE ACT OF 1934
Date of Report: June 7, 2006
(Date of earliest event reported)
INTERNATIONAL BUSINESS MACHINES CORPORATION
(Exact name of registrant as specified in its charter)
New York |
| 1-2360 |
| 13-0871985 |
(State of Incorporation) |
| (Commission File Number) |
| (IRS employer Identification No.) |
|
|
|
|
|
ARMONK, NEW YORK |
| 10504 | ||
(Address of principal executive offices) |
| (Zip Code) | ||
914-499-1900
(Registrant’s telephone number)
Check the appropriate box below if the Form 8-K filing is intended to simultaneously satisfy the filing obligation of the registrant under any of the following provisions:
o Written communications pursuant to Rule 425 under the Securities Act (17 CFR 230.425)
o Soliciting material pursuant to Rule 14a-12 under the Exchange Act (17 CFR 240.14a-12)
o Pre-commencement communications pursuant to Rule 14d-2(b) under the Exchange Act (17 CFR 240.14d-2(b))
o Pre-commencement communications pursuant to Rule 13e-4(c) under the Exchange Act (17 CFR 240.13e-4(c))
Item 7.01 (Regulation FD Disclosure)
Attachment I contains certain presentation materials for the IBM Global Briefing in India on June 7, 2006. Attachment II contains supplementary materials about non-GAAP financial measures in the presentation materials. Attachments I and II are hereby furnished.
IBM’s web site (www.ibm.com) contains a significant amount of information about IBM, including financial and other information for investors (www.ibm.com/investor/). IBM encourages investors to visit its various web sites from time to time, as information is updated and new information is posted.
SIGNATURE
Pursuant to the requirements of the Securities Exchange Act of 1934, the registrant has duly caused this report to be signed on its behalf by the undersigned, hereunto duly authorized.
Date: June 7, 2006
| By: | /s/ Andrew Bonzani |
|
|
| Andrew Bonzani |
|
|
| Vice President, |
|
|
| Assistant General Counsel & |
|
|
| Assistant Secretary |
|
2


ATTACHMENT II
Searchable text section of graphics shown above
ATTACHMENT I
IBM Global Briefing |
|
|
|
|
|
Bangalore, India |
| [LOGO] |
|
|
|
June 6 & 7, 2006 |
|
|
1
IBM Global Briefing | [LOGO] |
Bangalore, India |
|
The IBM Model
Mark Loughridge
Senior VP and Chief Financial Officer
© 2006 IBM Corporation
2
Certain comments made in the presentation may be characterized as forward looking under the Private Securities Litigation Reform Act of 1995. Those statements involve a number of factors that could cause actual results to differ materially. Additional information concerning these factors is contained in the Company’s filings with the SEC. Copies are available from the SEC, from the IBM web site, or from IBM Investor Relations.
In an effort to provide additional and useful information regarding the company’s results as determined by generally accepted accounting principles (GAAP), these and the other materials presented during this event will include certain additional non-GAAP information.
The rationale for management’s use of this non-GAAP information, the reconciliation of that information to GAAP, and other related information is included in supplementary materials entitled “Non-GAAP Supplementary Materials” that are posted on the Company’s investor relations web site at http://www.ibm.com/investor/events/global0606/. The Non-GAAP Supplementary Materials are also included as Attachment II to the Company’s Form 8-K dated today.
3
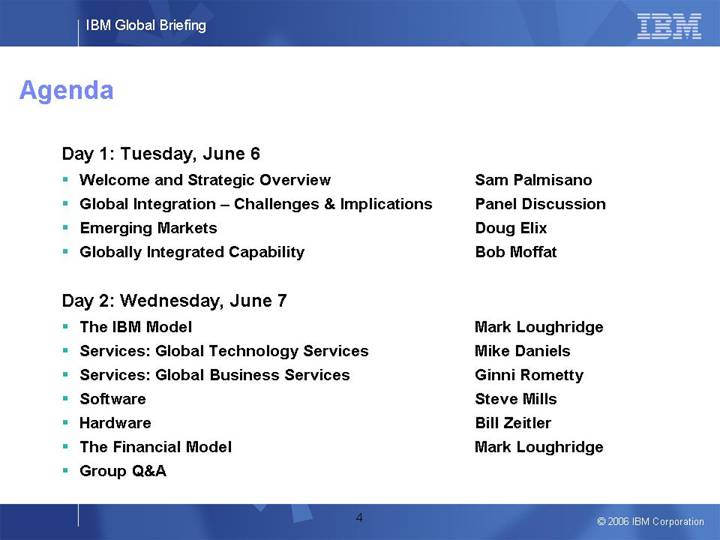
Agenda
Day 1: Tuesday, June 6 |
|
| |
• | Welcome and Strategic Overview | Sam Palmisano | |
• | Global Integration – Challenges & Implications | Panel Discussion | |
• | Emerging Markets | Doug Elix | |
• | Globally Integrated Capability | Bob Moffat | |
|
| ||
Day 2: Wednesday, June 7 |
|
| |
• | The IBM Model | Mark Loughridge | |
• | Services: Global Technology Services | Mike Daniels | |
• | Services: Global Business Services | Ginni Rometty | |
• | Software | Steve Mills | |
• | Hardware | Bill Zeitler | |
• | The Financial Model | Mark Loughridge | |
• | Group Q&A |
| |
4
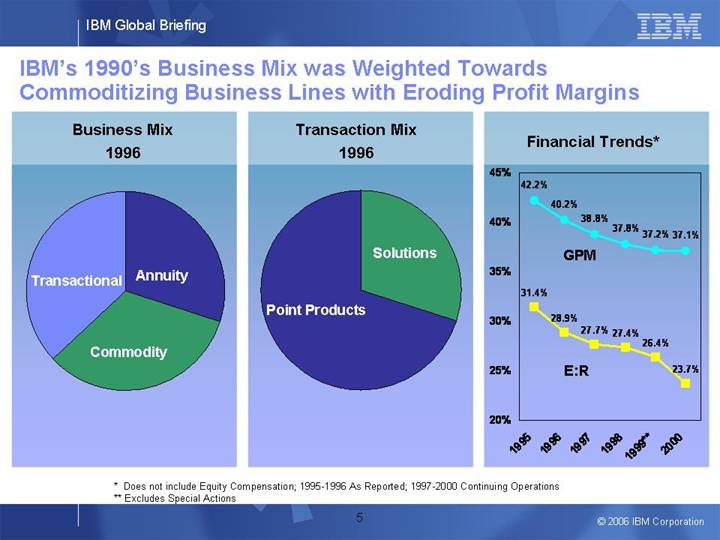
IBM’s 1990’s Business Mix was Weighted Towards Commoditizing Business Lines with Eroding Profit Margins
Business Mix |
| Transaction Mix |
| Financial Trends* |
|
|
|
|
|
[CHART] |
| [CHART] |
| [CHART] |
* Does not include Equity Compensation; 1995-1996 As Reported; 1997-2000 Continuing Operations
** Excludes Special Actions
5
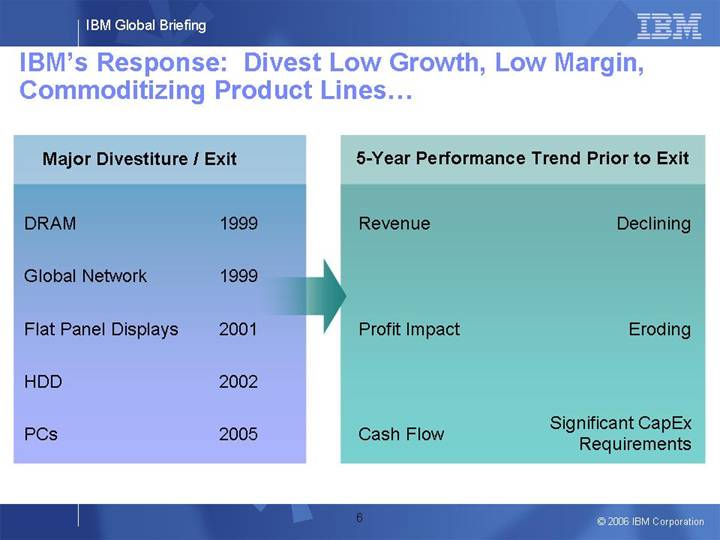
IBM’s Response: Divest Low Growth, Low Margin, Commoditizing Product Lines…
Major Divestiture / Exit
DRAM |
| 1999 |
|
|
|
|
|
Global Network |
| 1999 |
|
|
|
|
|
Flat Panel Displays |
| 2001 |
|
|
|
|
|
HDD |
| 2002 |
|
|
|
|
|
PCs |
| 2005 |
|
5-Year Performance Trend Prior to Exit
Revenue |
| Declining |
Profit Impact |
| Eroding |
Cash Flow |
| Significant CapEx |
6
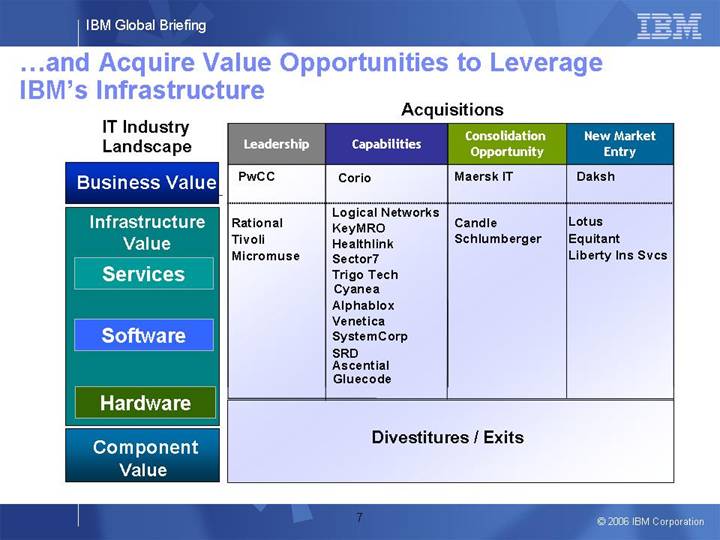
…and Acquire Value Opportunities to Leverage IBM’s Infrastructure
IT Industry Landscape |
|
Business Value |
|
Infrastructure Value |
|
Services |
|
Software |
|
Hardware |
|
Component Value |
Acquisitions
Leadership |
| Capabilities |
| Consolidation |
| New Market |
|
|
|
|
|
|
|
PwCC |
| Corio |
| Maersk IT |
| Daksh |
|
|
|
|
|
|
|
Rational |
| Logical Networks |
| Candle |
| Lotus |
|
|
|
|
|
|
|
Divestitures / Exits | ||||||
7
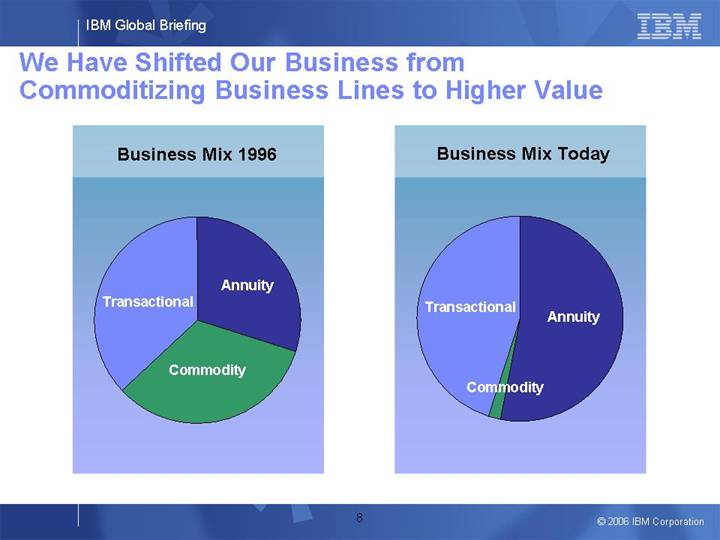
We Have Shifted Our Business from Commoditizing Business Lines to Higher Value
Business Mix 1996 |
| Business Mix Today |
|
|
|
[CHART] |
| [CHART] |
8
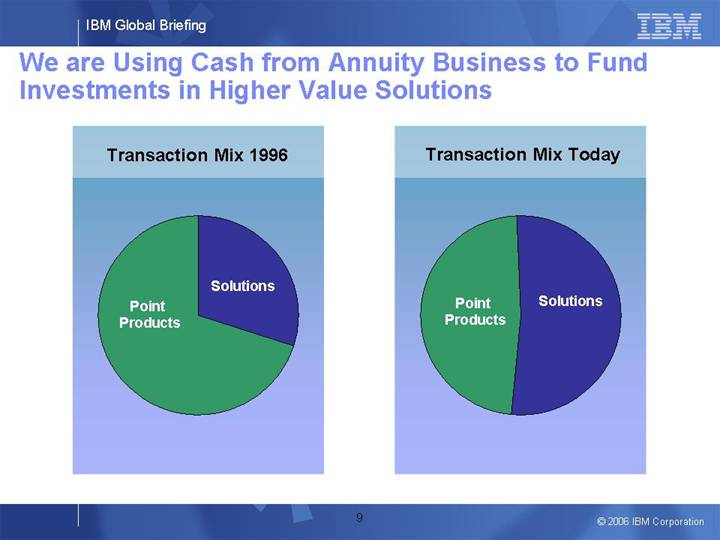
We are Using Cash from Annuity Business to Fund Investments in Higher Value Solutions
Transaction Mix 1996 |
| Transaction Mix Today |
|
|
|
[CHART] |
| [CHART] |
9
This Mix Shift Results in Higher Gross Profit Margins While Increasing Investments Required for Higher Value Solution Selling
Financial Trends Late 90s* |
| Financial Trends Today* |
|
|
|
[CHART] |
| [CHART] |
* 1995-1996 As Reported; 1997-2004 Continuing Operations; 2001-2005 includes Equity Compensation
** Excludes Special Action
10
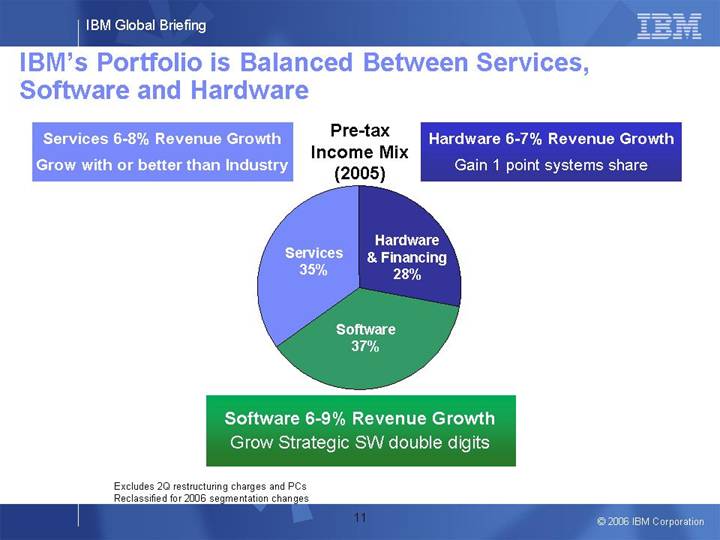
IBM’s Portfolio is Balanced Between Services, Software and Hardware
Services 6-8% Revenue Growth |
| Pre-tax |
| Hardware 6-7% Revenue Growth |
Grow with or better than Industry |
| Income Mix |
| Gain 1 point systems share |
|
| (2005) |
|
|
|
|
|
|
|
|
| [CHART] |
|
|
|
|
|
|
|
|
| Software 6-9% Revenue Growth |
|
|
|
| Grow Strategic SW double digits |
|
|
Excludes 2Q restructuring charges and PCs Reclassified for 2006 segmentation changes
11
IBM Global Briefing | [LOGO] |
Bangalore, India |
|
Global Technology Services
Mike Daniels
Senior Vice President
Global Technology Services
IBM Global Services
© 2006 IBM Corporation
2
Certain comments made in the presentation may be characterized as forward looking under the Private Securities Litigation Reform Act of 1995. Those statements involve a number of factors that could cause actual results to differ materially. Additional information concerning these factors is contained in the Company’s filings with the SEC. Copies are available from the SEC, from the IBM web site, or from IBM Investor Relations.
In an effort to provide additional and useful information regarding the company’s results as determined by generally accepted accounting principles (GAAP), these and the other materials presented during this event will include certain additional non-GAAP information.
The rationale for management’s use of this non-GAAP information, the reconciliation of that information to GAAP, and other related information is included in supplementary materials entitled “Non-GAAP Supplementary Materials” that are posted on the Company’s investor relations web site at http://www.ibm.com/investor/events/global0606/. The Non-GAAP Supplementary Materials are also included as Attachment II to the Company’s Form 8-K dated today.
3
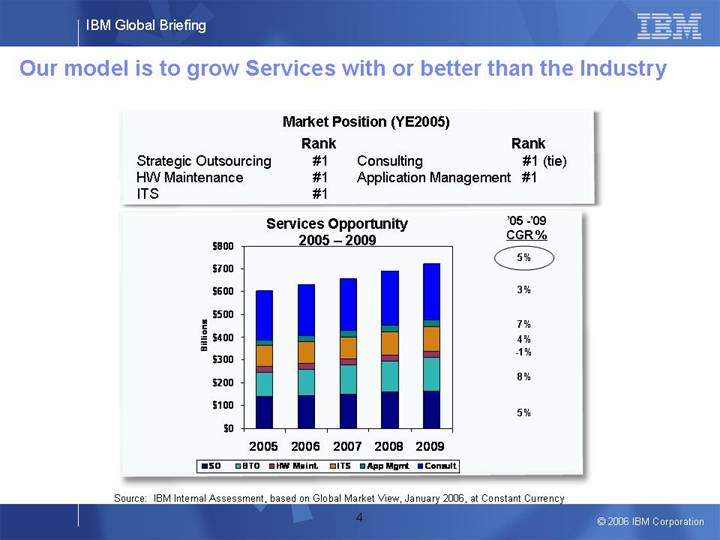
Our model is to grow Services with or better than the Industry
Market Position (YE2005)
|
| Rank |
|
Strategic Outsourcing |
| #1 |
|
HW Maintenance |
| #1 |
|
ITS |
| #1 |
|
Consulting |
| #1 | (tie) |
Application Management |
| #1 |
|
Services Opportunity
2005 – 2009
[CHART]
Source: IBM Internal Assessment, based on Global Market View, January 2006, at Constant Currency
4
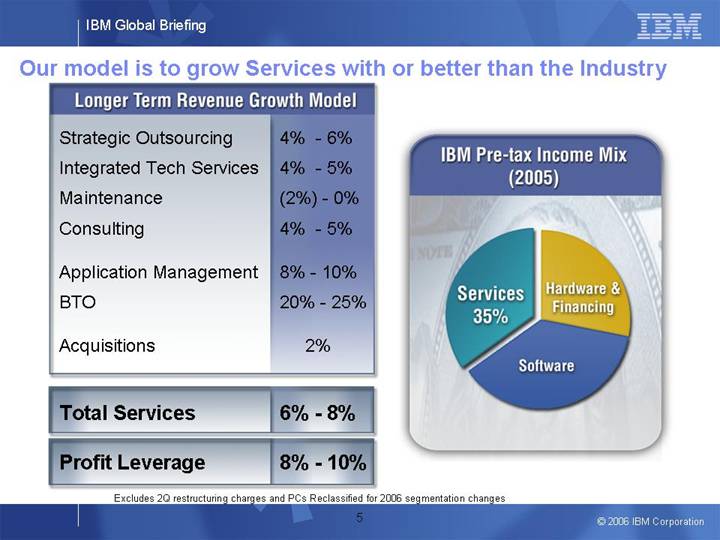
Our model is to grow Services with or better than the Industry
Longer Term Revenue Growth Model | ||
|
|
|
Strategic Outsourcing |
| 4% - 6% |
|
|
|
Integrated Tech Services |
| 4% - 5% |
|
|
|
Maintenance |
| (2) % - 0% |
|
|
|
Consulting |
| 4% - 5% |
|
|
|
Application Management |
| 8% - 10% |
|
|
|
BTO |
| 20% - 25% |
|
|
|
Acquisitions |
| 2% |
|
|
|
Total Services |
| 6% - 8% |
|
|
|
Profit Leverage |
| 8% - 10% |
|
|
|
IBM Pre-tax Income Mix | ||
(2005) | ||
|
|
|
[CHART] | ||
Excludes 2Q restructuring charges and PCs Reclassified for 2006 segmentation changes
5
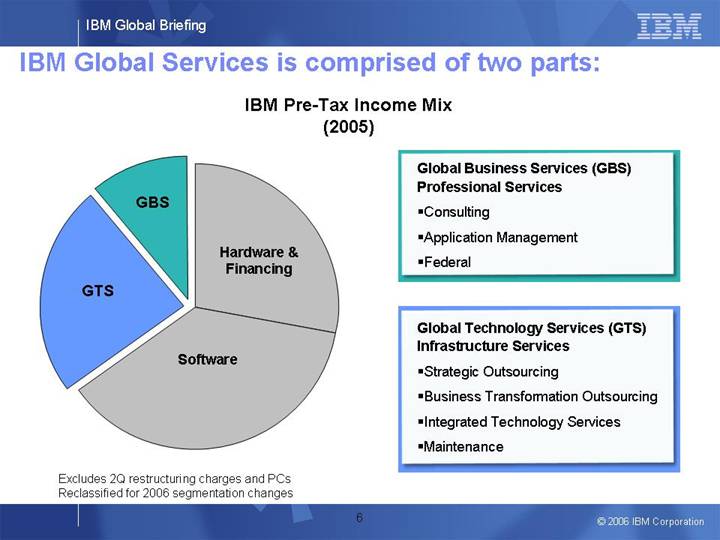
IBM Global Services is comprised of two parts:
IBM Pre-Tax Income Mix
(2005)
[CHART]
Global Business Services (GBS) Professional Services
• Consulting
• Application Management
• Federal
Global Technology Services (GTS) Infrastructure Services
• Strategic Outsourcing
• Business Transformation Outsourcing
• Integrated Technology Services
• Maintenance
Excludes 2Q restructuring charges and PCs Reclassified for 2006 segmentation changes
6
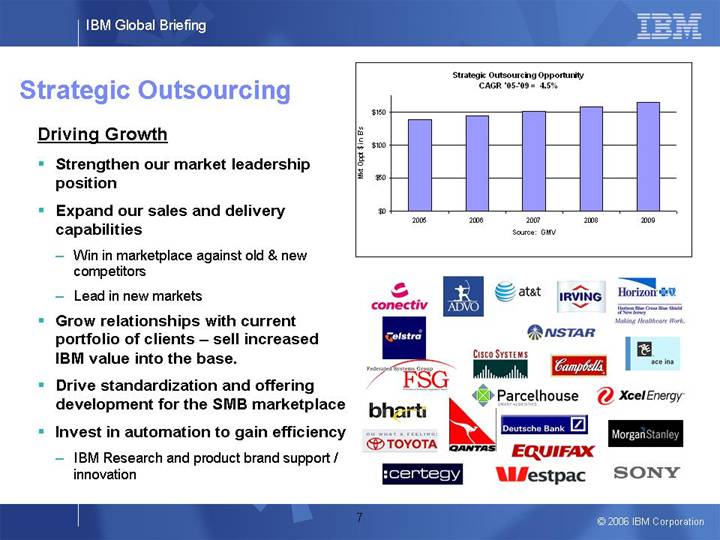
Strategic Outsourcing
Driving Growth
• Strengthen our market leadership position
• Expand our sales and delivery capabilities
• Win in marketplace against old & new competitors
• Lead in new markets
• Grow relationships with current portfolio of clients – sell increased IBM value into the base.
• Drive standardization and offering development for the SMB marketplace
• Invest in automation to gain efficiency
• IBM Research and product brand support / innovation
[CHART]
[LOGO]
7
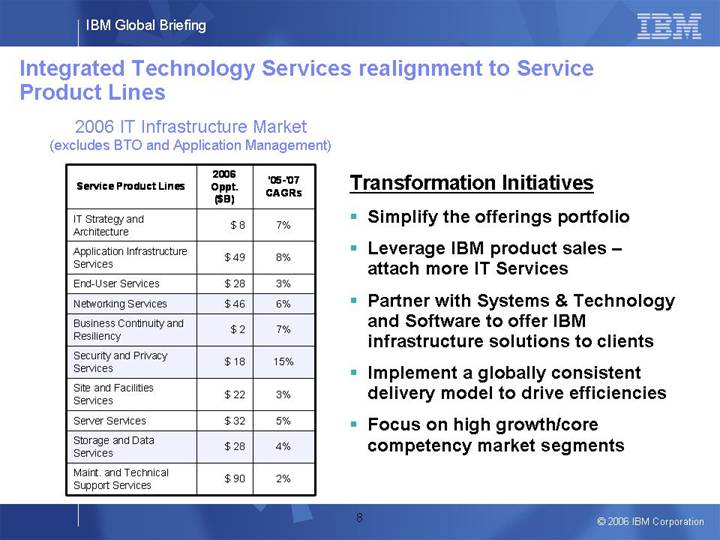
Integrated Technology Services realignment to Service Product Lines
2006 IT Infrastructure Market
(excludes BTO and Application Management)
|
| 2006 |
|
|
| |
|
| Oppt. |
| ‘05-’07 |
| |
Service Product Lines |
| ($B) |
| CAGRs |
| |
|
|
|
|
|
| |
IT Strategy and Architecture |
| $ | 8 |
| 7 | % |
|
|
|
|
|
| |
Application Infrastructure Services |
| $ | 49 |
| 8 | % |
|
|
|
|
|
| |
End-User Services |
| $ | 28 |
| 3 | % |
|
|
|
|
|
| |
Networking Services |
| $ | 46 |
| 6 | % |
|
|
|
|
|
| |
Business Continuity and Resiliency |
| $ | 2 |
| 7 | % |
|
|
|
|
|
| |
Security and Privacy Services |
| $ | 18 |
| 15 | % |
|
|
|
|
|
| |
Site and Facilities Services |
| $ | 22 |
| 3 | % |
|
|
|
|
|
| |
Server Services |
| $ | 32 |
| 5 | % |
|
|
|
|
|
| |
Storage and Data Services |
| $ | 28 |
| 4 | % |
|
|
|
|
|
| |
Maint. and Technical Support Services |
| $ | 90 |
| 2 | % |
Transformation Initiatives
• Simplify the offerings portfolio
• Leverage IBM product sales – attach more IT Services
• Partner with Systems & Technology and Software to offer IBM infrastructure solutions to clients
• Implement a globally consistent delivery model to drive efficiencies
• Focus on high growth/core competency market segments
8
Slide1
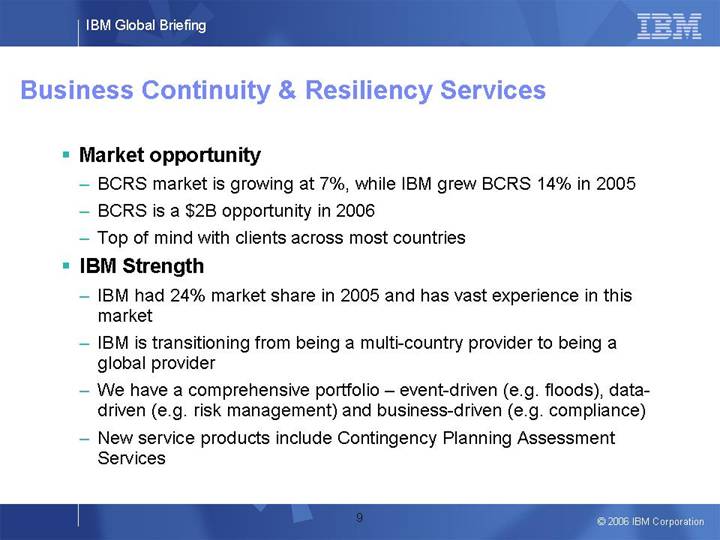
Business Continuity & Resiliency Services
• Market opportunity
• BCRS market is growing at 7%, while IBM grew BCRS 14% in 2005
• BCRS is a $2B opportunity in 2006
• Top of mind with clients across most countries
• IBM Strength
• IBM had 24% market share in 2005 and has vast experience in this market
• IBM is transitioning from being a multi-country provider to being a global provider
• We have a comprehensive portfolio – event-driven (e.g. floods), data-driven (e.g. risk management) and business-driven (e.g. compliance)
• New service products include Contingency Planning Assessment Services
9
Security & Privacy Services:
Managed Security Services
• Market opportunity
• IT Security is $18B opportunity in 2006, growing at 15% CAGR
• Companies are spending on security (anywhere from 3-8% of their IT budget) without industry expertise or knowledge
• Risk is great – one security incident costs a company about $14M, liability for phishing data could be in billions of dollars
• Managed Security Services (outsourcing) is about 10% of IT security market, with 95-98% retention rate
• IBM Strength
• IBM can leverage our scale from our global security operations centers, while lowering our clients’ security risk
• Experience from our SO base (manage security for 2/3 of our accounts)
• With IBM Research created analytical tools and models to evaluate behaviors and trends
• We scale to deliver security services cost effectively while lowering security risk to our clients
• 3,500 security consultants around the world
10
Storage & Data Services:
Including Information Lifecycle Management
• Market opportunity
• Storage & Data Services (managing client’s information & storage environments) is an $28B opportunity, growing over 4% annually
• Information Lifecycle Management (one of our solutions in this area) is growing at 14% CAGR and is a $6B opportunity – growing twice the rate of storage services in general
• IBM Strength
• IBM’s solutions include Information Lifecycle Management capabilities, data management & storage infrastructure
• Gartner & Giga say IBM is a leader & the strongest infrastructure player in Enterprise Content Management
• IBM award-winning technical platform
• Complete IBM solution
11
Networking Services: IP Convergence
• Market opportunity
• Networking Services is a $46B opportunity in 2006. Part of this opportunity is IP Convergence
• Enterprises recognize the value of moving all of their voice and data networks onto a single network
• 40% of companies will have completed convergence by 2010
• 95% of large & midsize companies will have started convergence by 2010
• As telephony becomes an application, enterprises must construct a plan to assess and then integrate communications and business applications to accelerate their business processes (Gartner)
• IBM Strength
• IBM’s leadership in solutions & services (including SO), exceptional global reach for services delivery, and deep industry knowledge position us to succeed in this market
• IBM has partnerships with industry leaders like Cisco, Avaya, Nortel, 3Com, Siemens, national & international telecom carriers
• Recognized a leader by IDC in Network Consulting and Integration Services
12
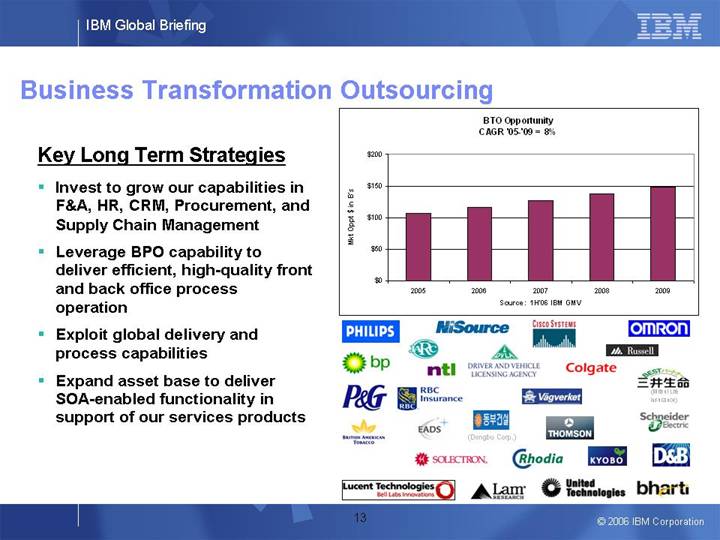
Business Transformation Outsourcing
Key Long Term Strategies
• Invest to grow our capabilities in F&A, HR, CRM, Procurement, and Supply Chain Management
• Leverage BPO capability to deliver efficient, high-quality front and back office process operation
• Exploit global delivery and process capabilities
• Expand asset base to deliver SOA-enabled functionality in support of our services products
[CHART]
[LOGO]
13
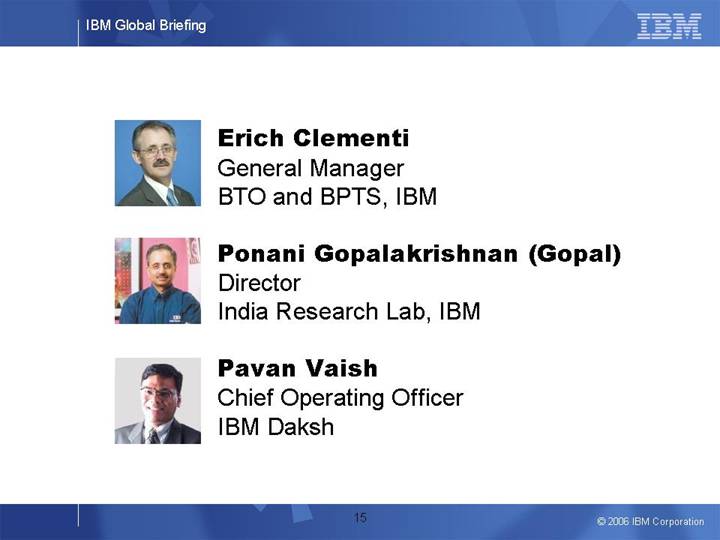
[GRAPHIC] | Erich Clementi |
General Manager | |
BTO and BPTS, IBM | |
|
|
[GRAPHIC] | Ponani Gopalakrishnan (Gopal) |
Director | |
India Research Lab, IBM | |
|
|
[GRAPHIC] | Pavan Vaish |
Chief Operating Officer | |
IBM Daksh |
15
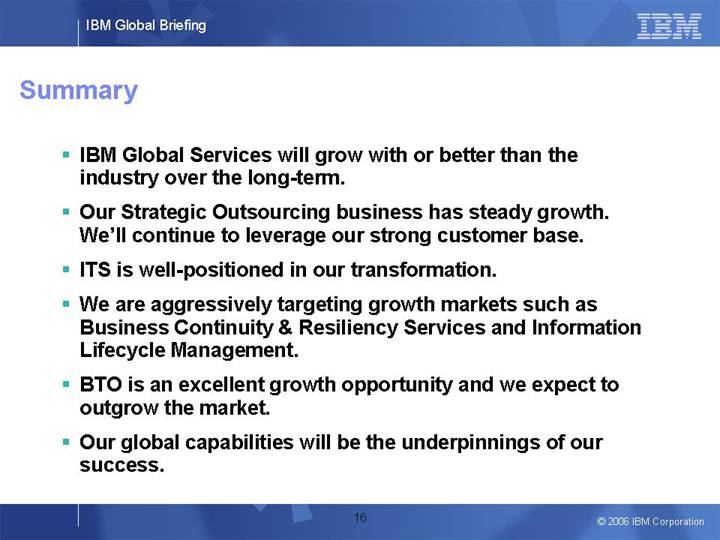
Summary
• IBM Global Services will grow with or better than the industry over the long-term.
• Our Strategic Outsourcing business has steady growth. We’ll continue to leverage our strong customer base.
• ITS is well-positioned in our transformation.
• We are aggressively targeting growth markets such as Business Continuity & Resiliency Services and Information Lifecycle Management.
• BTO is an excellent growth opportunity and we expect to outgrow the market.
• Our global capabilities will be the underpinnings of our success.
16
IBM Global Briefing | [LOGO] |
Bangalore, India |
|
Global Business Services
Ginni Rometty
Senior Vice President
Global Business Services
IBM Global Services
© 2006 IBM Corporation
2
Certain comments made in the presentation may be characterized as forward looking under the Private Securities Litigation Reform Act of 1995. Those statements involve a number of factors that could cause actual results to differ materially. Additional information concerning these factors is contained in the Company’s filings with the SEC. Copies are available from the SEC, from the IBM web site, or from IBM Investor Relations.
In an effort to provide additional and useful information regarding the company’s results as determined by generally accepted accounting principles (GAAP), these and the other materials presented during this event will include certain additional non-GAAP information.
The rationale for management’s use of this non-GAAP information, the reconciliation of that information to GAAP, and other related information is included in supplementary materials entitled “Non-GAAP Supplementary Materials” that are posted on the Company’s investor relations web site at http://www.ibm.com/investor/events/global0606/. The Non-GAAP Supplementary Materials are also included as Attachment II to the Company’s Form 8-K dated today.
3
Our model is to grow with or better than the industry
IBM Pre-tax Income Mix
(2005)
[CHART]
Market Position (YE2005)
|
| Rank |
|
Consulting |
| #1 | (tie) |
Application Management Services |
| #1 |
|
Services Opportunity 2005 – 2009
[CHART]
Source: IBM Internal Assessment, based on Global Market View, January 2006, at Constant Currency
Global Business Services
Longer-Term Revenue Growth Model
Consulting |
| 4% - 5% |
Application Management Services |
| 8% -10% |
Total Services |
| 6% - 8% |
Excludes 2Q restructuring charges and PCs Reclassified for 2006 segmentation changes
4
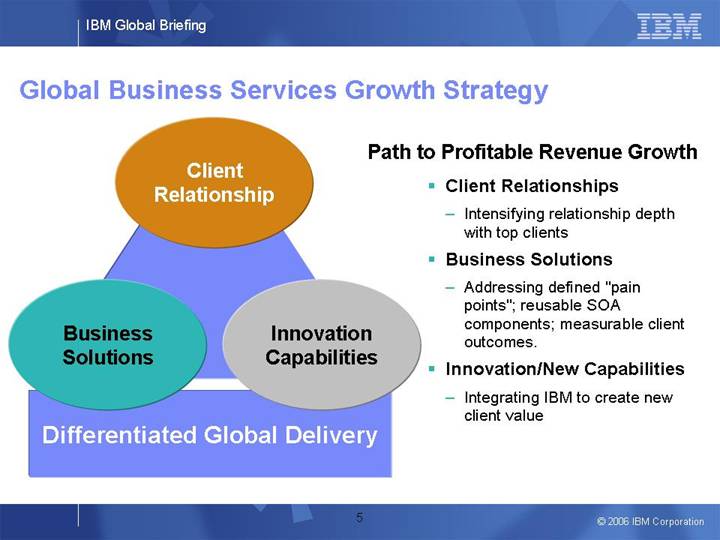
Global Business Services Growth Strategy
Client | |
Relationship | |
| |
Business | Innovation |
Solutions | Capabilities |
| |
Differentiated Global Delivery | |
Path to Profitable Revenue Growth
• Client Relationships
• Intensifying relationship depth with top clients
• Business Solutions
• Addressing defined “pain points”; reusable SOA components; measurable client outcomes.
• Innovation/New Capabilities
• Integrating IBM to create new client value
5
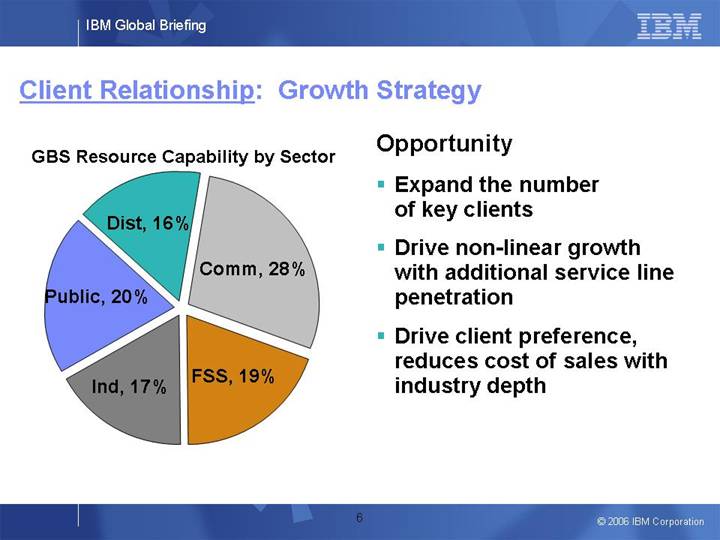
Client Relationship: Growth Strategy
GBS Resource Capability by Sector
[CHART]
Opportunity
• Expand the number of key clients
• Drive non-linear growth with additional service line penetration
• Drive client preference, reduces cost of sales with industry depth
6
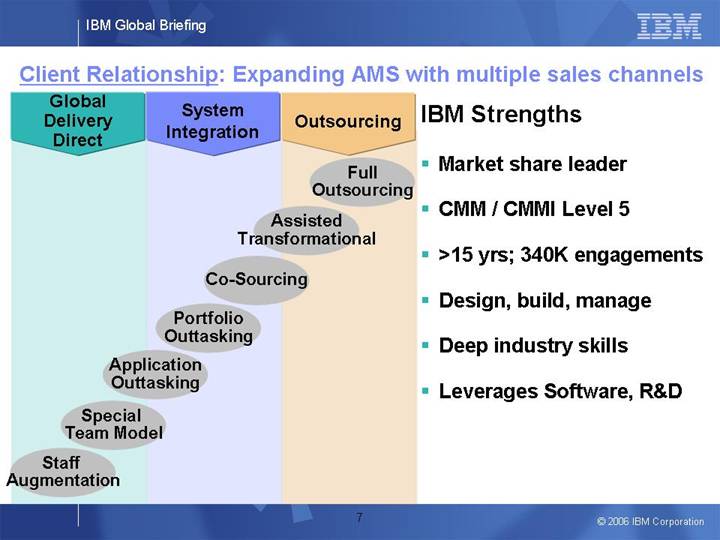
Client Relationship: Expanding AMS with multiple sales channels
Global | System | Outsourcing |
|
|
|
| |
Full | |||
Outsourcing | |||
|
|
| |
Assisted | |||
Transformational | |||
|
|
| |
Co-Sourcing | |||
|
|
| |
Portfolio | |||
Outtasking | |||
|
|
| |
Application | |||
Outtasking | |||
|
|
| |
Special | |||
Team Model | |||
|
|
| |
Staff | |||
Augmentation | |||
IBM Strengths
• Market share leader
• CMM / CMMI Level 5
• >15 yrs; 340K engagements
• Design, build, manage
• Deep industry skills
• Leverages Software, R&D
7
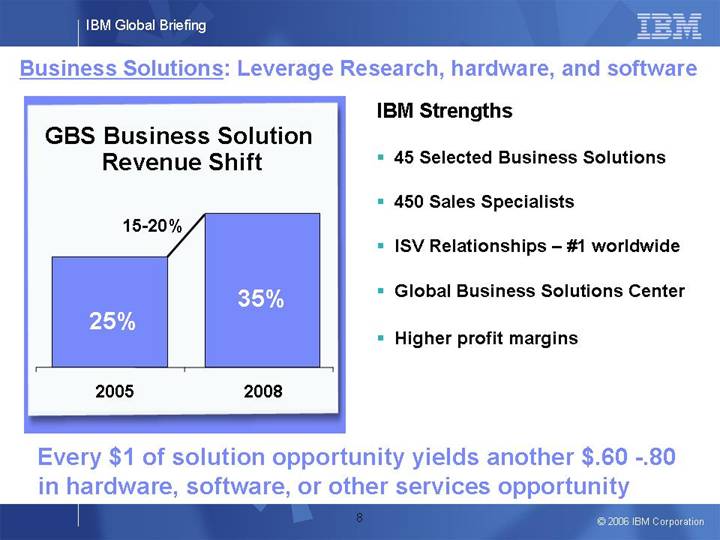
Business Solutions: Leverage Research, hardware, and software
GBS Business Solution
Revenue Shift
[CHART]
IBM Strengths
• 45 Selected Business Solutions
• 450 Sales Specialists
• ISV Relationships • #1 worldwide
• Global Business Solutions Center
• Higher profit margins
Every $1 of solution opportunity yields another $.60 - -.80 in hardware, software, or other services opportunity
8
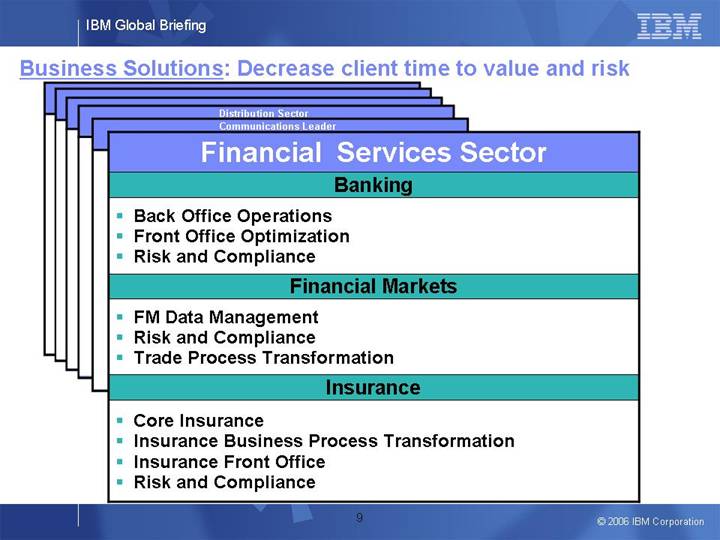
Business Solutions: Decrease client time to value and risk
Distribution Sector
Communications Leader
Financial Services Sector
Banking
• Back Office Operations
• Front Office Optimization
• Risk and Compliance
Financial Markets
• FM Data Management
• Risk and Compliance
• Trade Process Transformation
Insurance
• Core Insurance
• Insurance Business Process Transformation
• Insurance Front Office
• Risk and Compliance
9
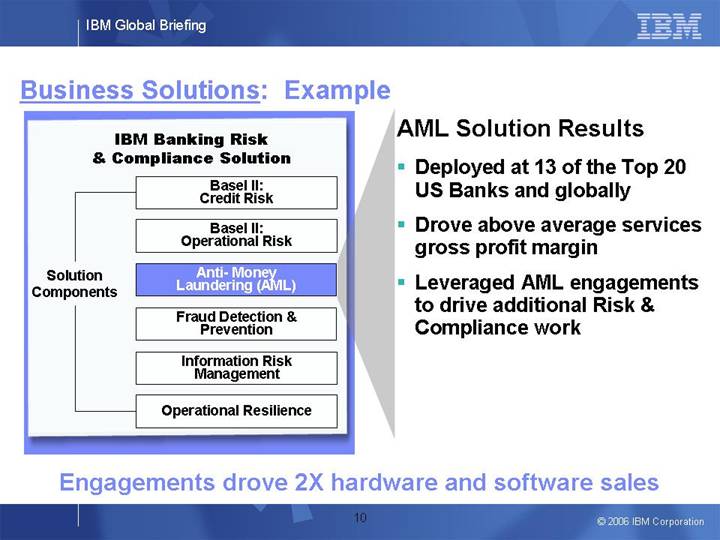
Business Solutions: Example
IBM Banking Risk
& Compliance Solution
Solution |
| Basel II: | AML Solution Results | |
| Credit Risk |
|
| |
|
| • | Deployed at 13 of the Top 20 US Banks and globally | |
| Basel II: |
|
| |
| Operational Risk | • | Drove above average services gross profit margin | |
|
|
|
| |
| Anti- Money | • | Leveraged AML engagements to drive additional Risk & | |
| Laundering (AML) |
| Compliance work | |
|
|
|
| |
| Fraud Detection & Prevention |
|
| |
|
|
|
| |
| Information Risk Management |
|
| |
|
|
|
| |
| Operational Resilience |
|
| |
Engagements drove 2X hardware and software sales
10
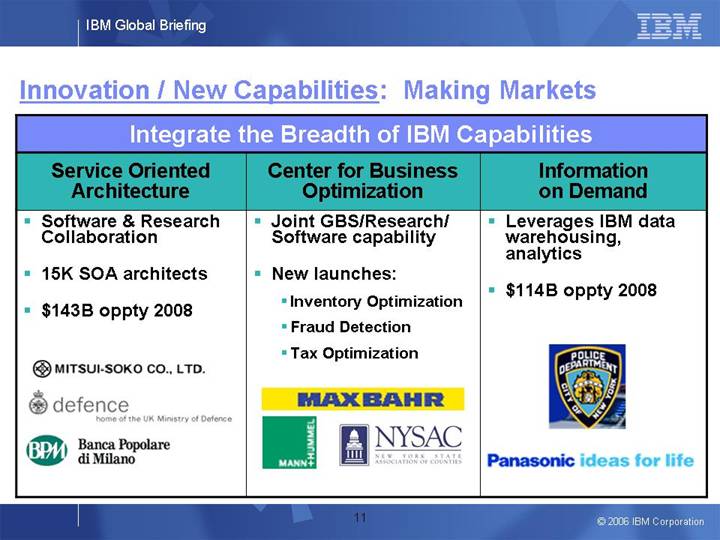
Innovation / New Capabilities: Making Markets
Integrate the Breadth of IBM Capabilities
Service Oriented |
| Center for Business |
| Information |
|
|
|
|
|
• Software & Research Collaboration
• 15K SOA architects
• $143B oppty 2008 |
| • Joint GBS/Research/ Software capability • New launches: • Inventory Optimization • Fraud Detection • Tax Optimization |
| • Leverages IBM data warehousing, analytics • $114B oppty 2008 |
|
|
|
|
|
[LOGO] |
| [LOGO] |
| [LOGO] |
11
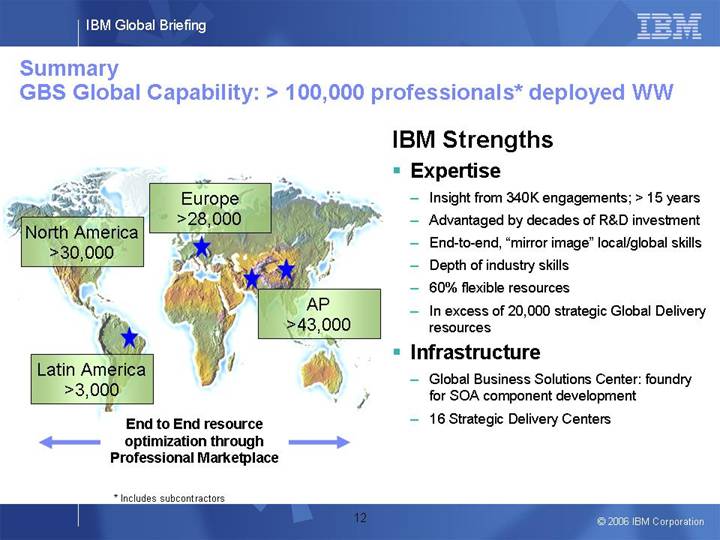
Summary
GBS Global Capability: > 100,000 professionals* deployed WW
[GRAPHIC]
End to End resource optimization through Professional Marketplace
IBM Strengths
• Expertise
• Insight from 340K engagements; > 15 years
• Advantaged by decades of R&D investment
• End-to-end, “mirror image” local/global skills
• Depth of industry skills
• 60% flexible resources
• In excess of 20,000 strategic Global Delivery resources
• Infrastructure
• Global Business Solutions Center: foundry for SOA component development
• 16 Strategic Delivery Centers
12
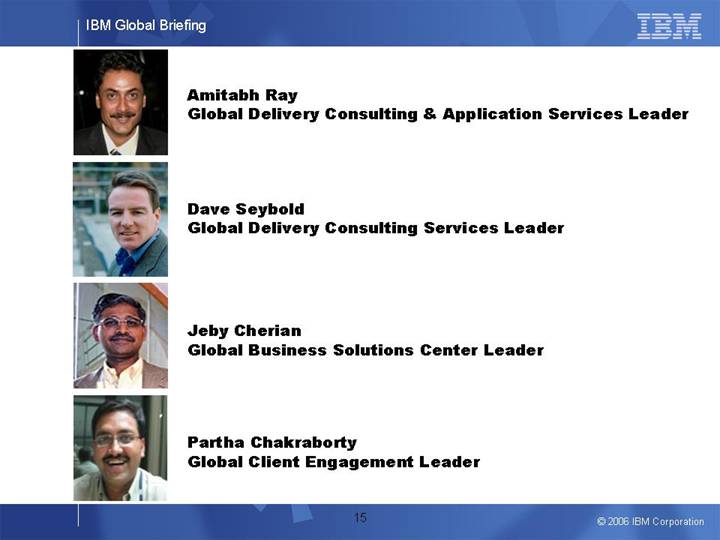
[GRAPHIC] | Amitabh Ray |
| Global Delivery Consulting & Application Services Leader |
|
|
[GRAPHIC] | Dave Seybold |
| Global Delivery Consulting Services Leader |
|
|
[GRAPHIC] | Jeby Cherian |
| Global Business Solutions Center Leader |
|
|
[GRAPHIC] | Partha Chakraborty |
| Global Client Engagement Leader |
15
[LOGO]
IBM Global Briefing |
|
|
Bangalore, India |
|
|
IBM Software
2006 Update
Steve Mills
Senior Vice President and Group Executive
IBM Software
© 2006 IBM Corporation
2
Certain comments made in the presentation may be characterized as forward looking under the Private Securities Litigation Reform Act of 1995. Those statements involve a number of factors that could cause actual results to differ materially. Additional information concerning these factors is contained in the Company’s filings with the SEC. Copies are available from the SEC, from the IBM web site, or from IBM Investor Relations.
In an effort to provide additional and useful information regarding the company’s results as determined by generally accepted accounting principles (GAAP), these and the other materials presented during this event will include certain additional non-GAAP information.
The rationale for management’s use of this non-GAAP information, the reconciliation of that information to GAAP, and other related information is included in supplementary materials entitled “Non-GAAP Supplementary Materials” that are posted on the Company’s investor relations web site at http://www.ibm.com/investor/events/global0606/. The Non-GAAP Supplementary Materials are also included as Attachment II to the Company’s Form 8-K dated today.
3
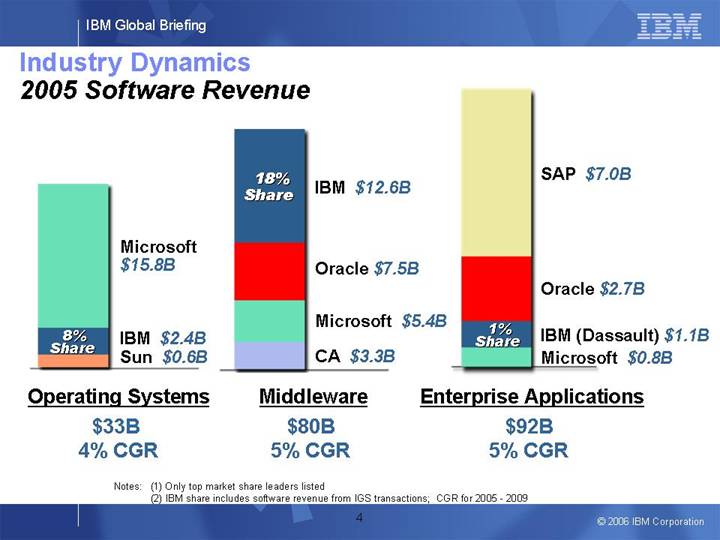
Industry Dynamics
2005 Software Revenue
[CHART] |
| [CHART] |
| [CHART] |
|
|
|
|
|
Operating Systems |
| Middleware |
| Enterprise Applications |
$33B |
| $80B |
| $92B |
4% CGR |
| 5% CGR |
| 5% CGR |
Notes: (1) Only top market share leaders listed
(2) IBM share includes software revenue from IGS transactions; CGR for 2005 - 2009
4
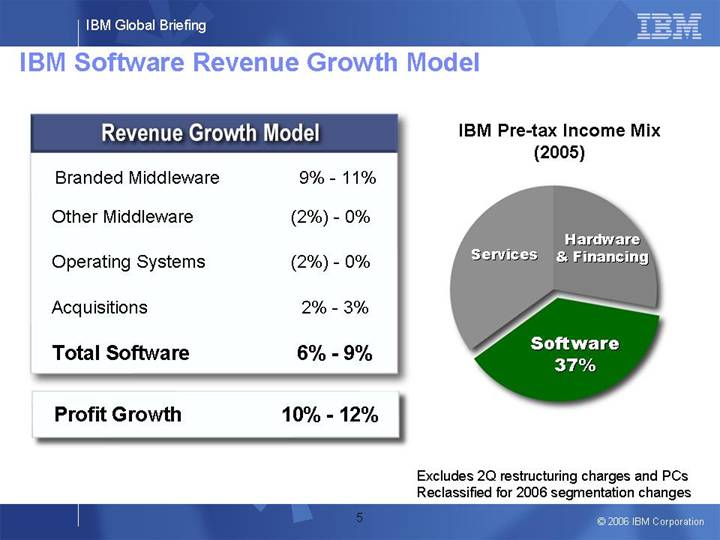
IBM Software Revenue Growth Model
Revenue Growth Model
Branded Middleware |
| 9 | % | - | 11% |
|
|
|
|
|
|
|
|
Other Middleware |
| (2 | )% | - | 0% |
|
|
|
|
|
|
|
|
Operating Systems |
| (2 | )% | - | 0% |
|
|
|
|
|
|
|
|
Acquisitions |
| 2 | % | - | 3% |
|
|
|
|
|
|
|
|
Total Software |
| 6 | % | - | 9% |
|
|
|
|
|
|
|
|
Profit Growth |
| 10 | % | - | 12% |
|
IBM Pre-tax Income Mix
(2005)
[CHART]
Excludes 2Q restructuring charges and PCs
Reclassified for 2006 segmentation changes
5
Software Revenue Growth
• Invest in high growth market segments
• Leverage IBM’s global reach
• Geographic presence
• Deep technical skills
• Extensive client relationships
• Capitalize on IBM’s unique ability to deliver SOA
• Make prudent investments in legacy/operating systems software
• Enhance the integration of our end-to-end portfolio
• Leverage z9 and other hardware sales to drive O/S revenue
• Selectively acquire software companies to extend the product portfolio
6
IBM Software
2005 Revenue = $16.8 Billion
Branded Middleware | Software Services/Other
| |
$8.0B +9%, +9% YTY @ CC | $0.8B +19%, +18% YTY @ CC | |
• WebSphere • Information Mgmt. • Lotus / WPLC • Tivoli • Rational | • Lab Software Services
| |
| ||
[CHART] | ||
| Operating Systems | |
Other Middleware | $2.4B -2%, -3% YTY @ CC | |
$4.6B -1%, -2% YTY @ CC | • System Software | |
• Host Tools & Compilers • Comm. Servers • Printer / Storage | PLM $1.1B +3%, +3% YTY @ CC • Computer-aided design and manufacturing software | |
Note: (1) Revenue $ as reported, YTY% @ CC
(2) Reclassified for 2006 segment changes
7
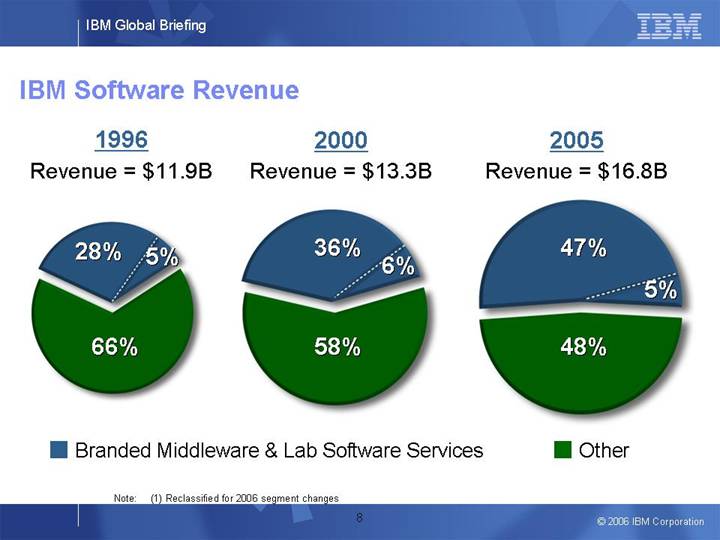
IBM Software Revenue
1996 |
| 2000 |
| 2005 |
|
Revenue = $11.9B |
| Revenue = $13.3B |
| Revenue = $16.8B |
|
|
|
|
|
|
|
[CHART] |
| [CHART] |
| [CHART] |
|
Note: (1) Reclassified for 2006 segment changes
8
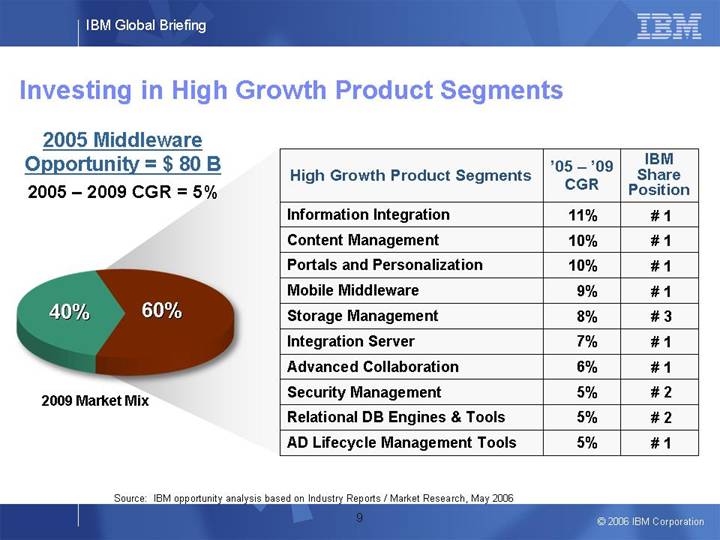
Investing in High Growth Product Segments
2005 Middleware
Opportunity = $ 80 B
2005 – 2009 CGR = 5%
[CHART]
2009 Market Mix
High Growth Product Segments |
| ‘05 – ’09 |
| IBM |
|
|
|
|
|
|
|
Information Integration |
| 11 | % | # 1 |
|
|
|
|
|
|
|
Content Management |
| 10 | % | # 1 |
|
|
|
|
|
|
|
Portals and Personalization |
| 10 | % | # 1 |
|
|
|
|
|
|
|
Mobile Middleware |
| 9 | % | # 1 |
|
|
|
|
|
|
|
Storage Management |
| 8 | % | # 3 |
|
|
|
|
|
|
|
Integration Server |
| 7 | % | # 1 |
|
|
|
|
|
|
|
Advanced Collaboration |
| 6 | % | # 1 |
|
|
|
|
|
|
|
Security Management |
| 5 | % | # 2 |
|
|
|
|
|
|
|
Relational DB Engines & Tools |
| 5 | % | # 2 |
|
|
|
|
|
|
|
AD Lifecycle Management Tools |
| 5 | % | # 1 |
|
Source: IBM opportunity analysis based on Industry Reports / Market Research, May 2006
9
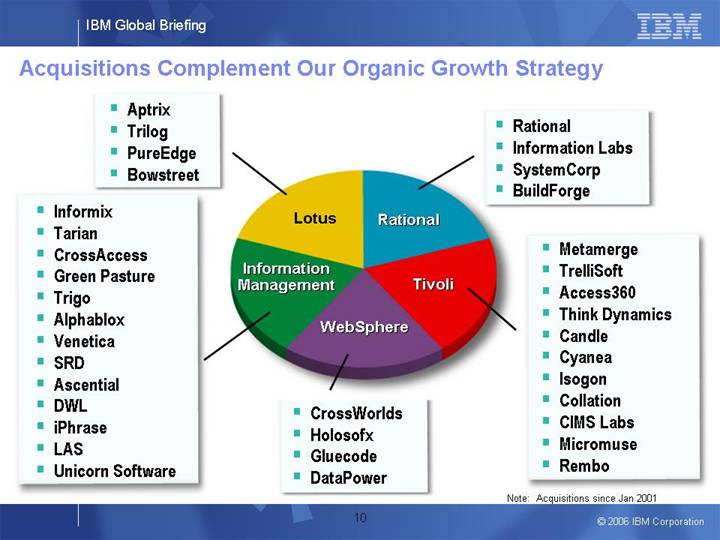
Acquisitions Complement Our Organic Growth Strategy
| • Aptrix • Trilog • PureEdge • Bowstreet |
|
|
| • Rational • Information Labs • SystemCorp • BuildForge |
| |
|
|
|
|
|
| ||
• Informix • Tarian • CrossAccess • Green Pasture • Trigo • Alphablox • Venetica • SRD • Ascential • DWL • iPhrase • LAS • Unicorn Software |
|
| • CrossWorlds • Holosofx • Gluecode • DataPower |
|
• Metamerge • TrelliSoft • Access360 • Think Dynamics • Candle • Cyanea • Isogon • Collation • CIMS Labs • Micromuse • Rembo |
| |
10
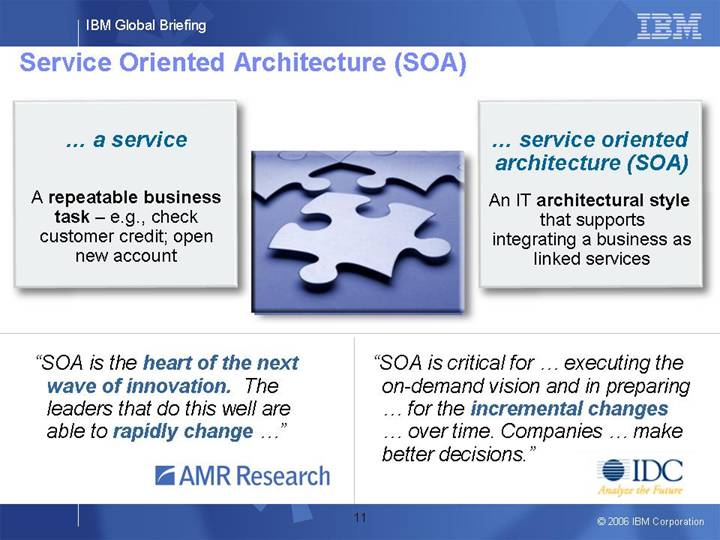
Service Oriented Architecture (SOA)
... a service |
| … service oriented architecture (SOA) | |
|
|
| |
A repeatable business | [GRAPHIC] | An IT architectural style | |
|
|
| |
“SOA is the heart of the next | “SOA is critical for … executing the | ||
|
| ||
[LOGO] | [LOGO] | ||
11
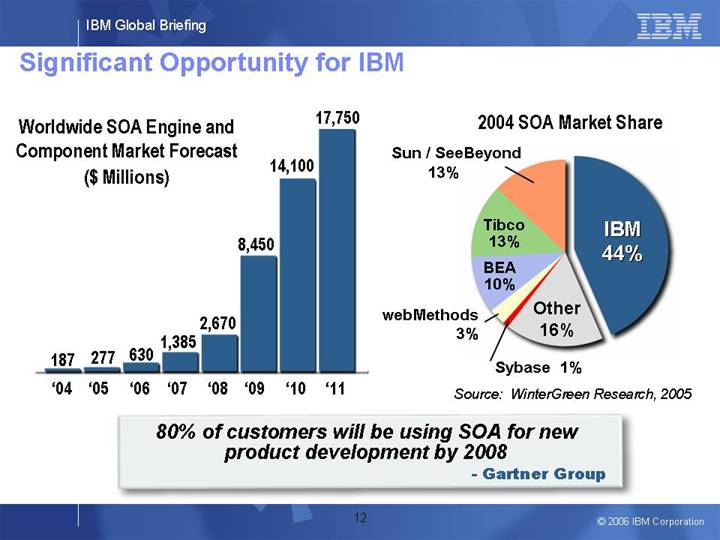
Significant Opportunity for IBM
Worldwide SOA Engine and
Component Market Forecast
($ Millions)
[CHART]
2004 SOA Market Share
[CHART]
Source: WinterGreen Research, 2005
80% of customers will be using SOA for new
product development by 2008
- Gartner Group
12
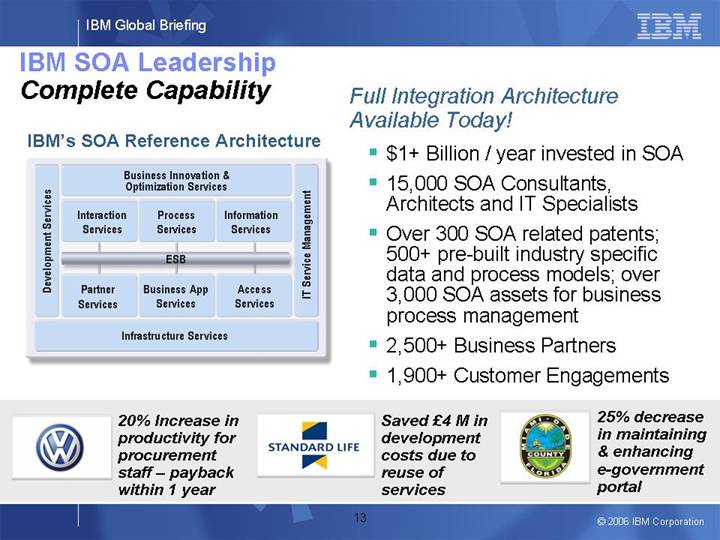
IBM SOA Leadership
Complete Capability
IBM’s SOA Reference Architecture
| Business Innovation & Optimization Services |
| |||
|
|
|
| ||
| Interaction | Process | Information |
| |
|
|
|
| ||
Development Services | ESB | IT Service Management | |||
|
|
|
| ||
| Partner | Business App | Access |
| |
|
|
|
| ||
| Infrastructure Services |
| |||
Full Integration Architecture Available Today!
• $1+ Billion / year invested in SOA
• 15,000 SOA Consultants, Architects and IT Specialists
• Over 300 SOA related patents; 500+ pre-built industry specific data and process models; over 3,000 SOA assets for business process management
• 2,500+ Business Partners
• 1,900+ Customer Engagements
[LOGO] | 20% Increase in productivity for procurement staff – payback within 1 year | [LOGO] | Saved £4 M in development costs due to reuse of services | [LOGO] | 25% decrease in maintaining & enhancing e-government portal |
13
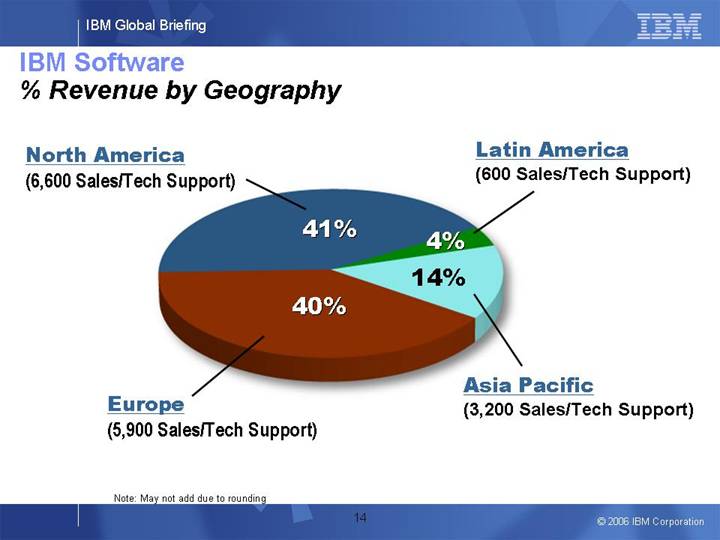
IBM Software
% Revenue by Geography
North America | [CHART] | Latin America |
(6,600 Sales/Tech Support) | (600 Sales/Tech Support) | |
|
| |
|
| |
|
| |
Europe | Asia Pacific | |
(5,900 Sales/Tech Support) | (3,200 Sales/Tech Support) |
Note: May not add due to rounding
14
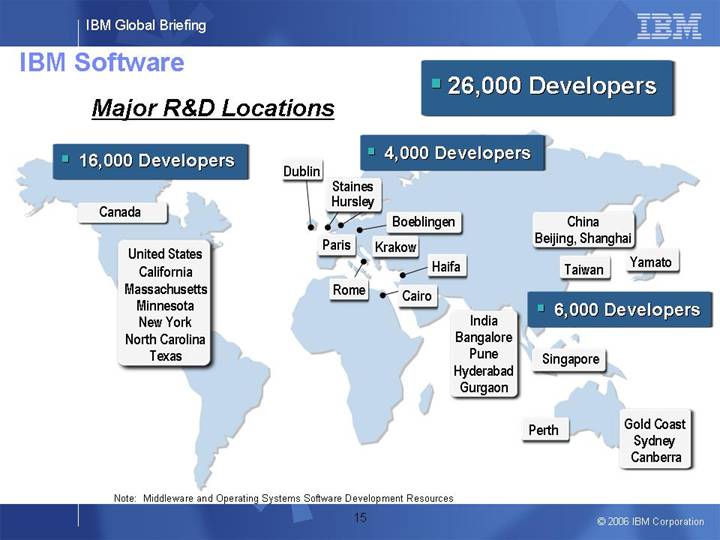
IBM Software
• 26,000 Developers
Major R&D Locations
• 16,000 Developers | • 4,000 Developers |
|
|
|
|
|
| • 6,000 Developers |
|
|
|
| [GRAPHIC] |
|
Note: Middleware and Operating Systems Software Development Resources
15
Summary
• Software Business Model delivers market share growth
• Strong profit / cash contribution
• Mix shifts improve leverage on growth rate
• Focus on higher growth segments
• IBM is uniquely positioned to capitalize on customer shift to Service Oriented Architecture (SOA)
• Resources are positioned to take advantage of global market shifts
16
[GRAPHIC] | Harish Grama |
| Vice President, IBM India Software Laboratory |
| IBM Software Group |
|
|
[GRAPHIC] | Willy Chiu |
| Vice President, High Performance On Demand Solutions |
| IBM Software Group |
18
[LOGO]
IBM Global Briefing |
|
Bangalore, India |
|
IBM Systems and Technology
Bill Zeitler
Senior Vice President and Group Executive
IBM Systems and Technology Group
© 2006 IBM Corporation
2
Certain comments made in the presentation may be characterized as forward looking under the Private Securities Litigation Reform Act of 1995. Those statements involve a number of factors that could cause actual results to differ materially. Additional information concerning these factors is contained in the Company’s filings with the SEC. Copies are available from the SEC, from the IBM web site, or from IBM Investor Relations.
In an effort to provide additional and useful information regarding the company’s results as determined by generally accepted accounting principles (GAAP), these and the other materials presented during this event will include certain additional non-GAAP information.
The rationale for management’s use of this non-GAAP information, the reconciliation of that information to GAAP, and other related information is included in supplementary materials entitled “Non-GAAP Supplementary Materials” that are posted on the Company’s investor relations web site at http://www.ibm.com/investor/events/global0606/. The Non-GAAP Supplementary Materials are also included as Attachment II to the Company’s Form 8-K dated today.
3
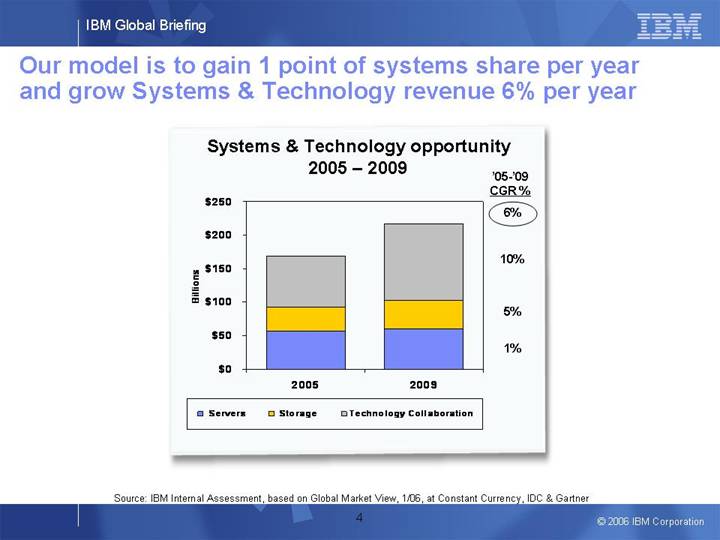
Our model is to gain 1 point of systems share per year and grow Systems & Technology revenue 6% per year
Systems & Technology opportunity
2005 – 2009
[CHART]
Source: IBM Internal Assessment, based on Global Market View, 1/06, at Constant Currency, IDC & Gartner
4
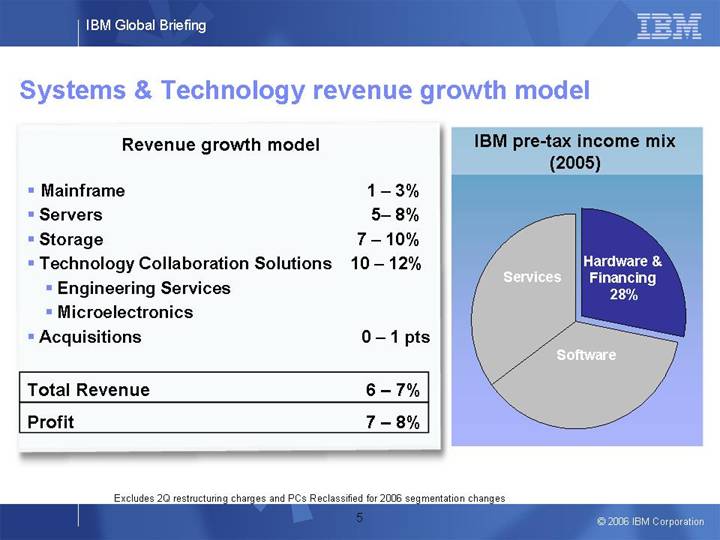
Systems & Technology revenue growth model
Revenue growth model
• |
| Mainframe | 1 – 3 | % | ||
• |
| Servers | 5– 8 | % | ||
• |
| Storage | 7 – 10 | % | ||
• |
| Technology Collaboration Solutions | 10 – 12 | % | ||
|
| • Engineering Services |
|
| ||
|
| • Microelectronics |
|
| ||
|
|
|
|
| ||
• |
| Acquisitions | 0 – 1 | pts | ||
|
|
|
|
| ||
Total Revenue | 6 – 7 | % | ||||
|
|
|
|
| ||
Profit | 7 – 8 | % | ||||
IBM pre-tax income mix
(2005)
[CHART]
Excludes 2Q restructuring charges and PCs Reclassified for 2006 segmentation changes
5
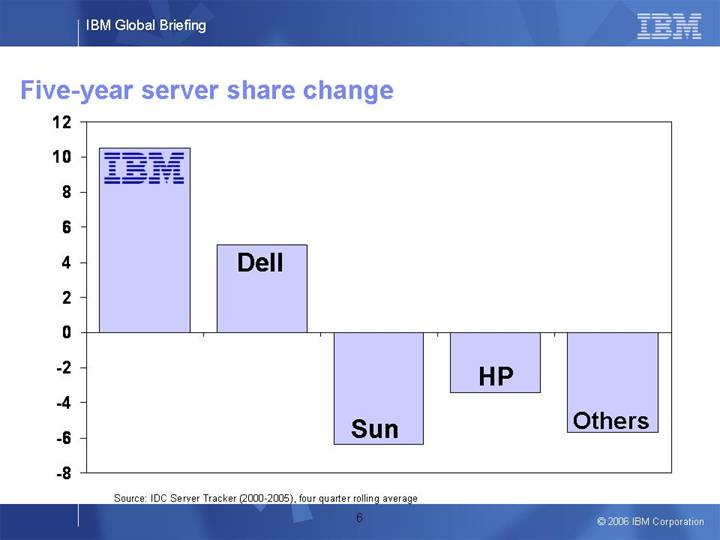
Five-year server share change
[CHART]
Source: IDC Server Tracker (2000-2005), four quarter rolling average
6
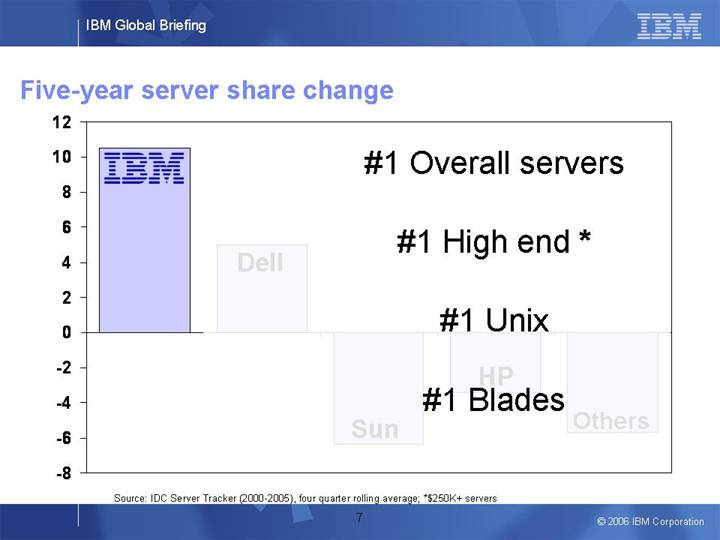
Five-year server share change
[CHART]
#1 Overall servers
#1 High end *
#1 Unix
#1 Blades
Source: IDC Server Tracker (2000-2005), four quarter rolling average; *$250K+ servers
7
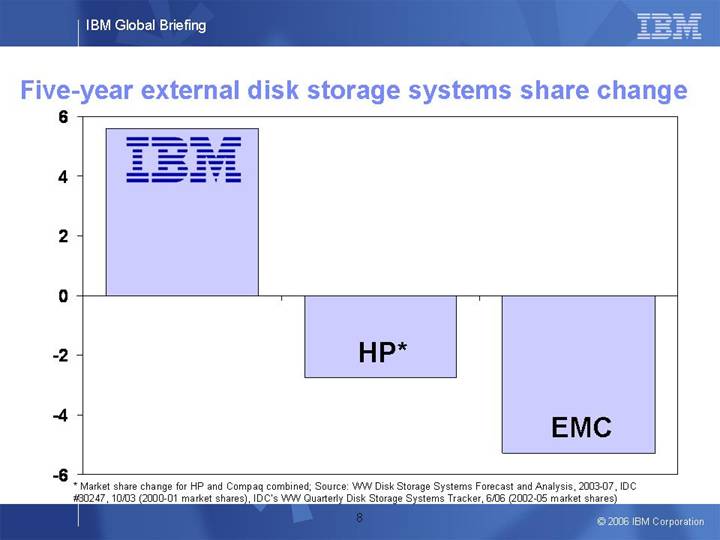
Five-year external disk storage systems share change
[CHART]
* Market share change for HP and Compaq combined; Source: WW Disk Storage Systems Forecast and Analysis, 2003-07, IDC #30247, 10/03 (2000-01 market shares), IDC’s WW Quarterly Disk Storage Systems Tracker, 6/06 (2002-05 market shares)
8
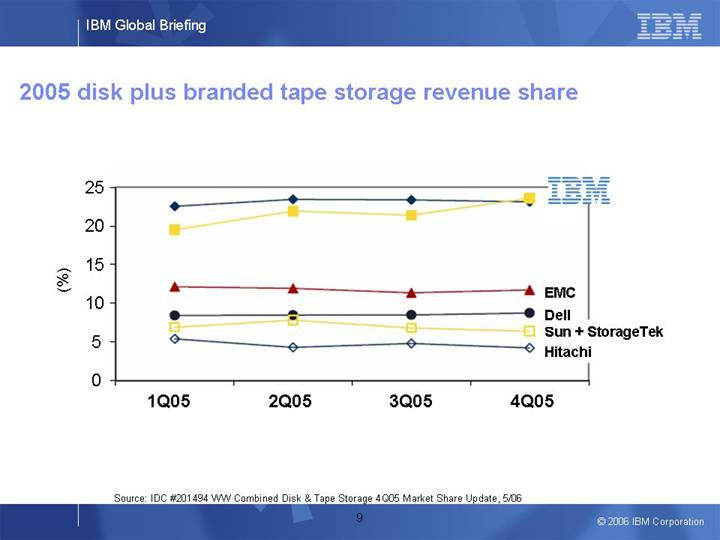
2005 disk plus branded tape storage revenue share
[CHART]
Source: IDC #201494 WW Combined Disk & Tape Storage 4Q05 Market Share Update, 5/06
9
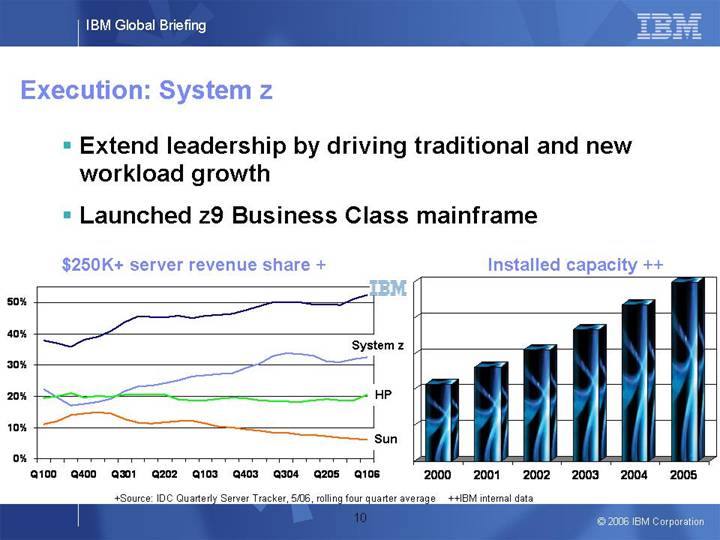
Execution: System z
• Extend leadership by driving traditional and new workload growth
• Launched z9 Business Class mainframe
$250K+ server revenue share +
[CHART]
Installed capacity ++
[CHART]
+Source: IDC Quarterly Server Tracker, 5/06, rolling four quarter average ++IBM internal data
10
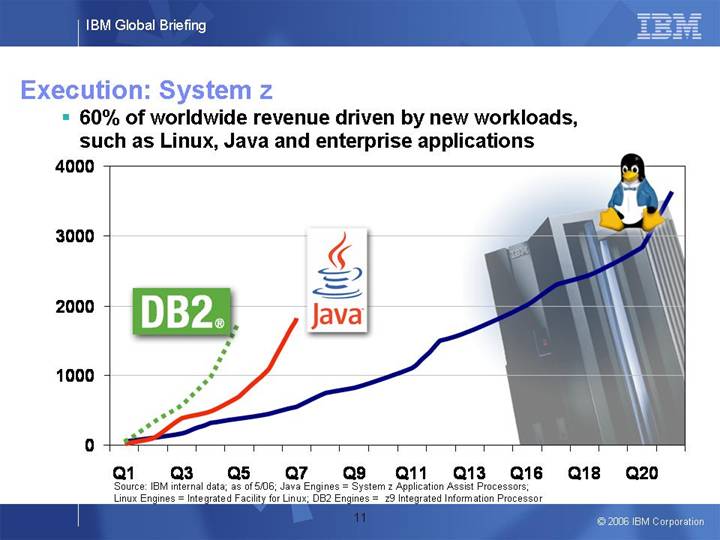
Execution: System z
• 60% of worldwide revenue driven by new workloads, such as Linux, Java and enterprise applications
[CHART]
Source: IBM internal data; as of 5/06; Java Engines = System z Application Assist Processors;
Linux Engines = Integrated Facility for Linux; DB2 Engines = z9 Integrated Information Processor
11
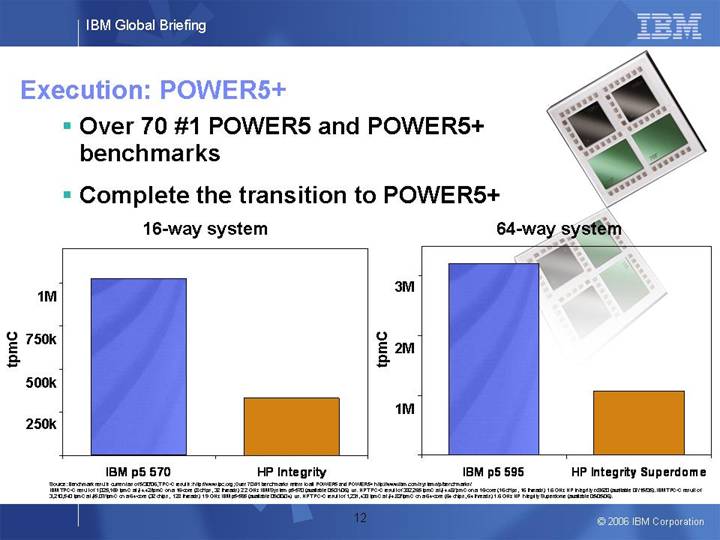
Execution: POWER5+
[GRAPHIC]
• Over 70 #1 POWER5 and POWER5+ benchmarks
• Complete the transition to POWER5+
16-way system
[CHART]
64-way system
[CHART]
Source: Benchmark results current as of 5/30/06, TPC-C results: http://www.tpc.org; Over 70 #1 benchmarks refers to all POWER5 and POWER5+ http://www.ibm.com/systems/p/benchmarks/
IBM TPC-C result of 1,025,169 tpmC at $4.42/tpmC on a 16-core (8 chips, 32 threads) 2.2 GHz IBM System p5-570 (available 05/31/06) vs. HP TPC-C result of 332,265 tpmC at $4.48/tpmC on a 16-core (16 chips, 16 threads) 1.6 GHz HP Integrity rx8620 (available 07/15/05). IBM TPC-C result of 3,210,540 tpmC at $5.07/tpmC on a 64-core (32 chips, 128 threads) 1.9 GHz IBM p5-595 (available 09/30/04) vs. HP TPC-C result of 1,231,433 tpmC at $4.82/tpmC on a 64-core (64 chips, 64 threads) 1.6 GHz HP Integrity Superdome (available 05/05/06).
12
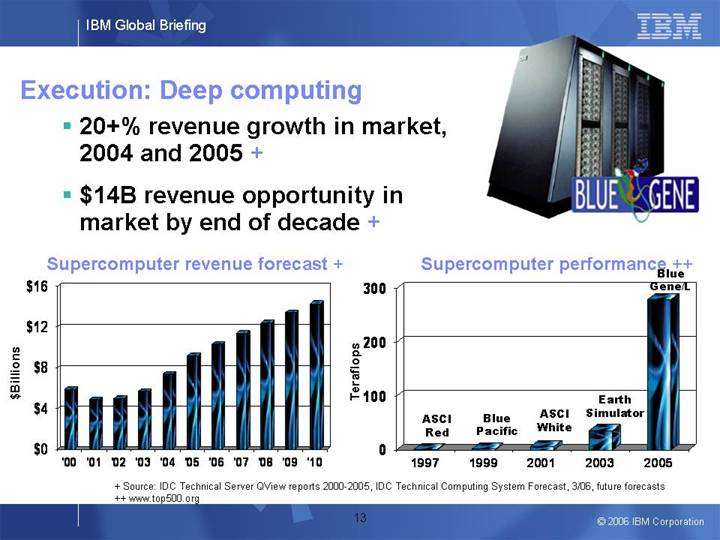
Execution: Deep computing
[GRAPHIC]
• 20+% revenue growth in market, 2004 and 2005 +
• $14B revenue opportunity in market by end of decade +
Supercomputer revenue forecast +
[CHART]
Supercomputer performance ++
[CHART]
+ Source: IDC Technical Server QView reports 2000-2005, IDC Technical Computing System Forecast, 3/06, future forecasts
++ www.top500.org
13
Infrastructure: Simplification
Virtualization
• Mainframe inspired
• Over 30,000 mainframe and POWER-based servers running virtualization
• A leader in x86 virtualization
• 2,000+ storage virtualization clients
14
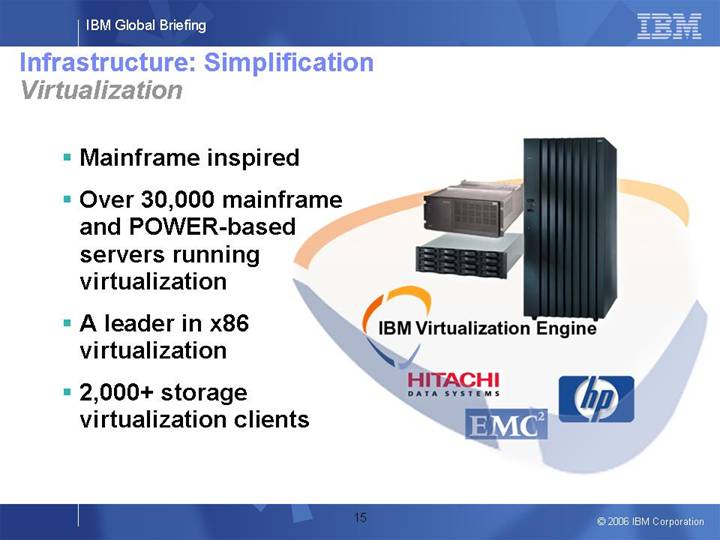
• Mainframe inspired
• Over 30,000 mainframe and POWER-based servers running virtualization
• A leader in x86 virtualization
• 2,000+ storage virtualization clients
[GRAPHIC]
[LOGO]
15
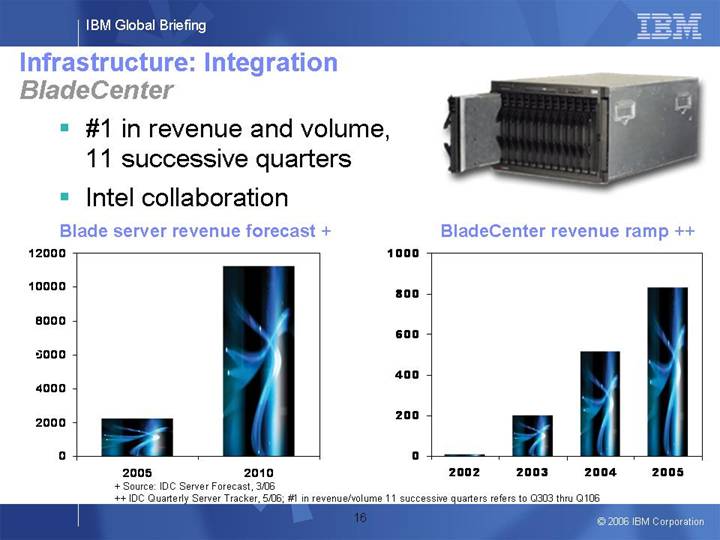
Infrastructure: Integration
BladeCenter
[GRAPHIC]
• #1 in revenue and volume, 11 successive quarters
• Intel collaboration
Blade server revenue forecast +
[CHART]
BladeCenter revenue ramp ++
[CHART]
+ Source: IDC Server Forecast, 3/06
++ IDC Quarterly Server Tracker, 5/06; #1 in revenue/volume 11 successive quarters refers to Q303 thru Q106
16
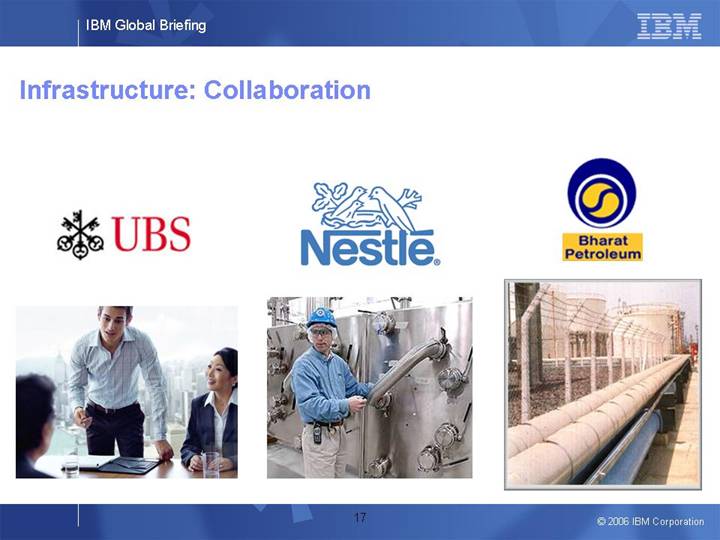
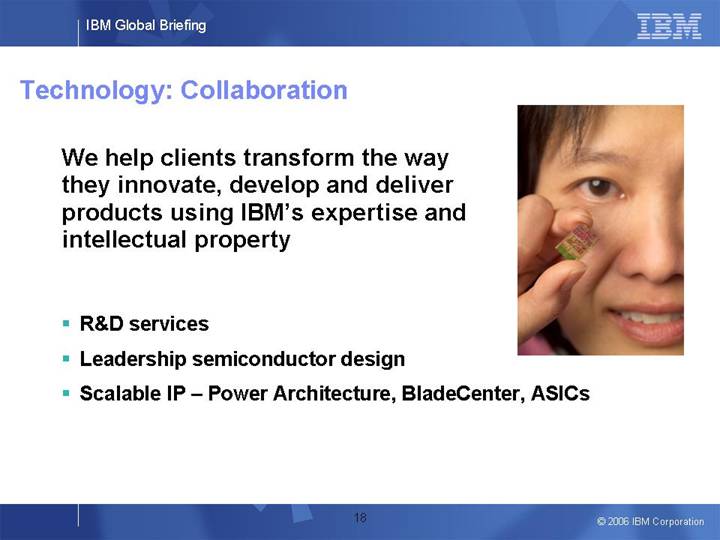
Technology: Collaboration
We help clients transform the way they innovate, develop and deliver products using IBM’s expertise and intellectual property
• R&D services
• Leadership semiconductor design
• Scalable IP – Power Architecture, BladeCenter, ASICs
[GRAPHIC]
18
[LOGO] |
| [LOGO] |
| [LOGO] |
|
|
|
|
|
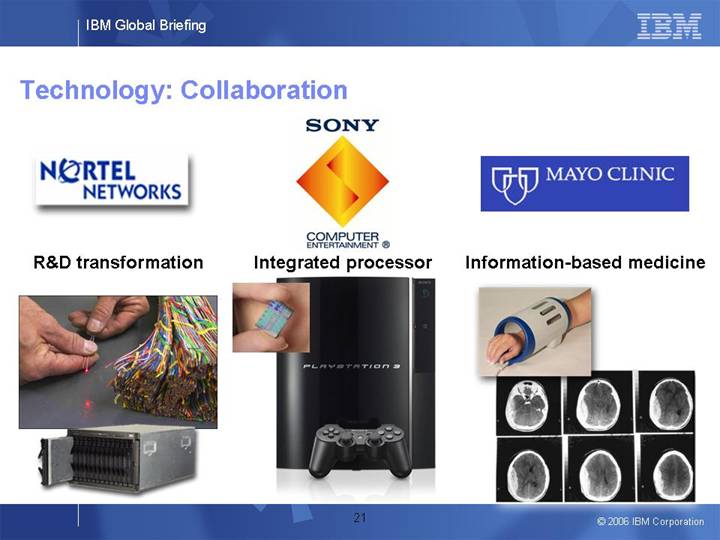
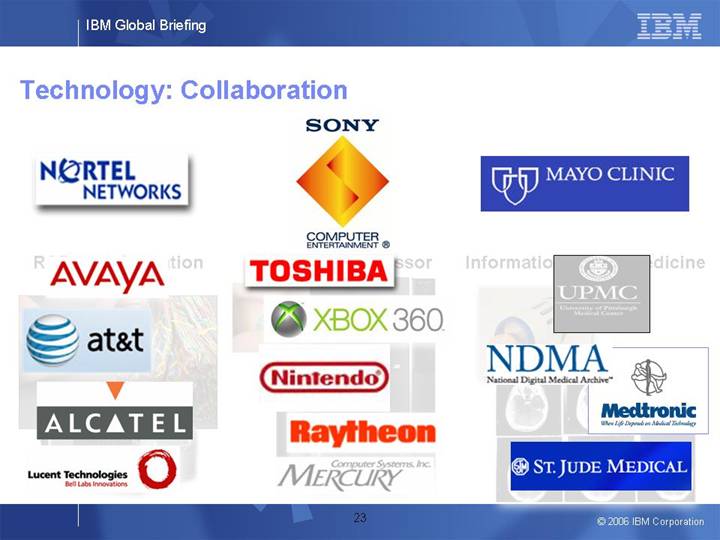
R&D transformation |
| Integrated processor |
| Information-based medicine |
|
|
|
|
|
[GRAPHIC] |
| [GRAPHIC] |
| [GRAPHIC] |
21
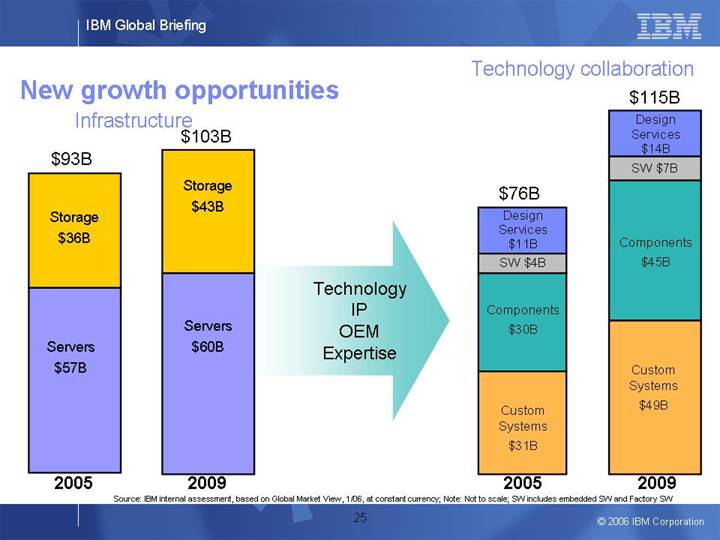
New growth opportunities
Infrastructure |
| Technology collaboration |
|
|
|
[CHART] | Technology | [CHART] |
Source: IBM internal assessment, based on Global Market View, 1/06, at constant currency; Note: Not to scale; SW includes embedded SW and Factory SW
25
Summary
• Extend server lead
• Lead in storage
• Exploit infrastructure solutions opportunity
• Expand technology collaboration opportunity
26
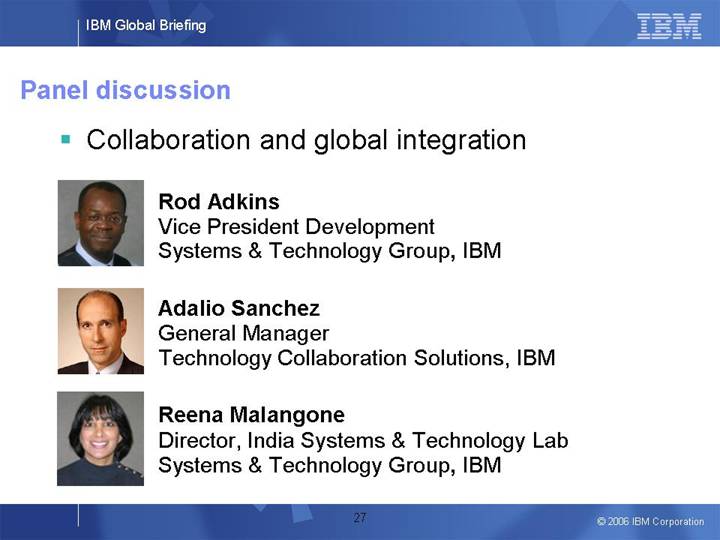
Panel discussion
• Collaboration and global integration
[GRAPHIC] |
| Rod Adkins |
| Vice President Development | |
| Systems & Technology Group, IBM | |
|
|
|
[GRAPHIC] |
| Adalio Sanchez |
| General Manager | |
| Technology Collaboration Solutions, IBM | |
|
|
|
[GRAPHIC] |
| Reena Malangone |
| Director, India Systems & Technology Lab | |
| Systems & Technology Group, IBM |
27
IBM Global Briefing |
|
|
Bangalore, India |
| [LOGO] |
Financial Model
Mark Loughridge
Senior Vice President and Chief Financial Officer
© 2006 IBM Corporation
2
Certain comments made in the presentation may be characterized as forward looking under the Private Securities Litigation Reform Act of 1995. Those statements involve a number of factors that could cause actual results to differ materially. Additional information concerning these factors is contained in the Company’s filings with the SEC. Copies are available from the SEC, from the IBM web site, or from IBM Investor Relations.
In an effort to provide additional and useful information regarding the company’s results as determined by generally accepted accounting principles (GAAP), these and the other materials presented during this event will include certain additional non-GAAP information.
The rationale for management’s use of this non-GAAP information, the reconciliation of that information to GAAP, and other related information is included in supplementary materials entitled “Non-GAAP Supplementary Materials” that are posted on the Company’s investor relations web site at http://www.ibm.com/investor/events/global0606/. The Non-GAAP Supplementary Materials are also included as Attachment II to the Company’s Form 8-K dated today.
3
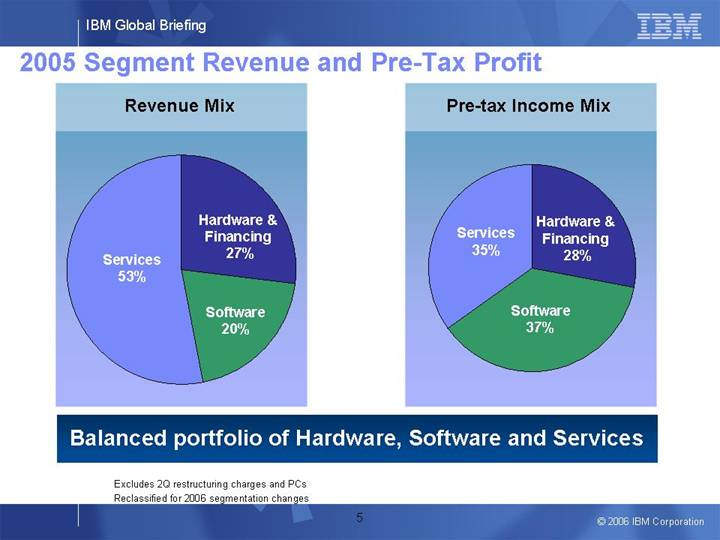
2005 Segment Revenue and Pre-Tax Profit
Revenue Mix |
| Pre-tax Income Mix |
|
|
|
[CHART] |
| [CHART] |
Balanced portfolio of Hardware, Software and Services
Excludes 2Q restructuring charges and PCs
Reclassified for 2006 segmentation changes
5
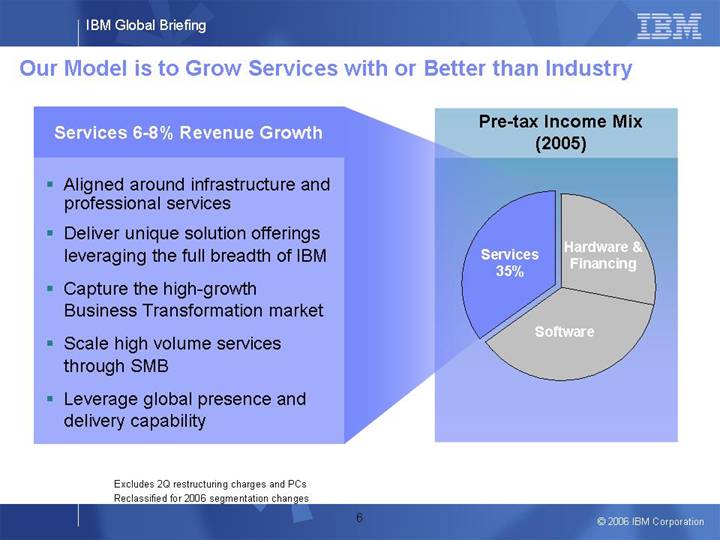
Our Model is to Grow Services with or Better than Industry
Pre-tax Income Mix
(2005)
[CHART]
Services 6-8% Revenue Growth
• Aligned around infrastructure and professional services
• Deliver unique solution offerings leveraging the full breadth of IBM
• Capture the high-growth Business Transformation market
• Scale high volume services through SMB
• Leverage global presence and delivery capability
Excludes 2Q restructuring charges and PCs
Reclassified for 2006 segmentation changes
6
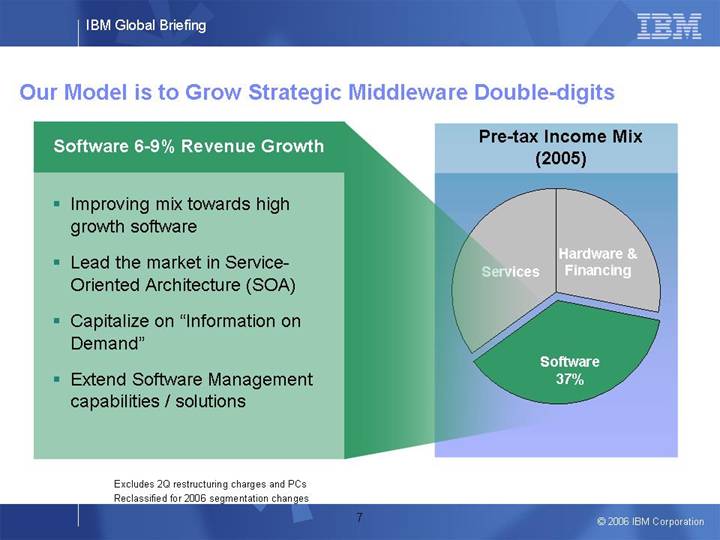
Our Model is to Grow Strategic Middleware Double-digits
Pre-tax Income Mix
(2005)
[CHART]
Software 6-9% Revenue Growth
• Improving mix towards high growth software
• Lead the market in Service-Oriented Architecture (SOA)
• Capitalize on “Information on Demand”
• Extend Software Management capabilities / solutions
Excludes 2Q restructuring charges and PCs
Reclassified for 2006 segmentation changes
7
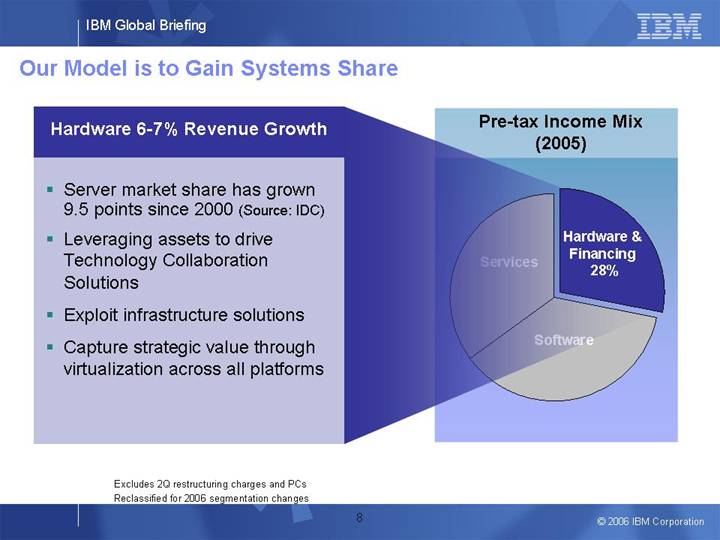
Our Model is to Gain Systems Share
Pre-tax Income Mix
(2005)
[CHART]
Hardware 6-7% Revenue Growth
• Server market share has grown 9.5 points since 2000 (Source: IDC)
• Leveraging assets to drive Technology Collaboration Solutions
• Exploit infrastructure solutions
• Capture strategic value through virtualization across all platforms
Excludes 2Q restructuring charges and PCs
Reclassified for 2006 segmentation changes
8
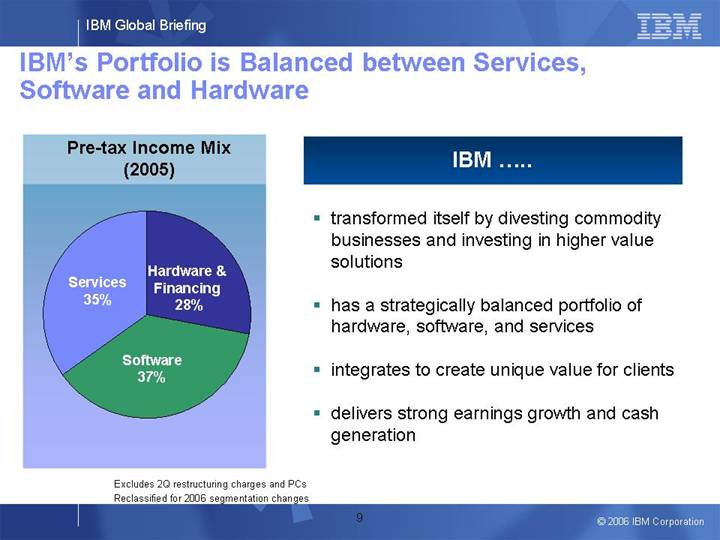
IBM’s Portfolio is Balanced between Services, Software and Hardware
Pre-tax Income Mix
(2005)
[CHART]
IBM .....
• transformed itself by divesting commodity businesses and investing in higher value solutions
• has a strategically balanced portfolio of hardware, software, and services
• integrates to create unique value for clients
• delivers strong earnings growth and cash generation
Excludes 2Q restructuring charges and PCs
Reclassified for 2006 segmentation changes
9
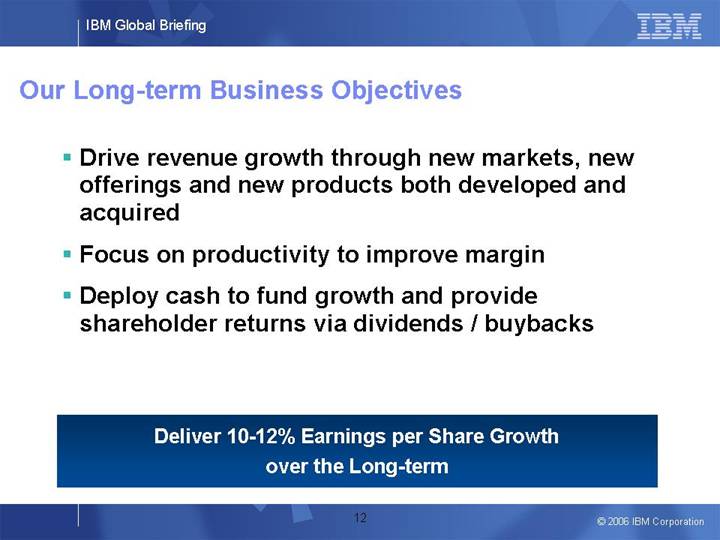
Our Long-term Business Objectives
• Drive revenue growth through new markets, new offerings and new products both developed and acquired
• Focus on productivity to improve margin
• Deploy cash to fund growth and provide shareholder returns via dividends / buybacks
Deliver 10-12% Earnings per Share Growth
over the Long-term
12
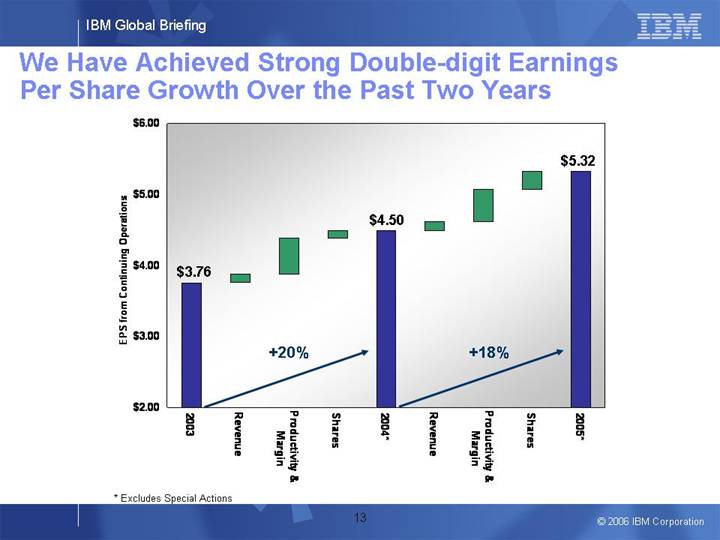
We Have Achieved Strong Double-digit Earnings Per Share Growth Over the Past Two Years
[CHART]
* Excludes Special Actions
13
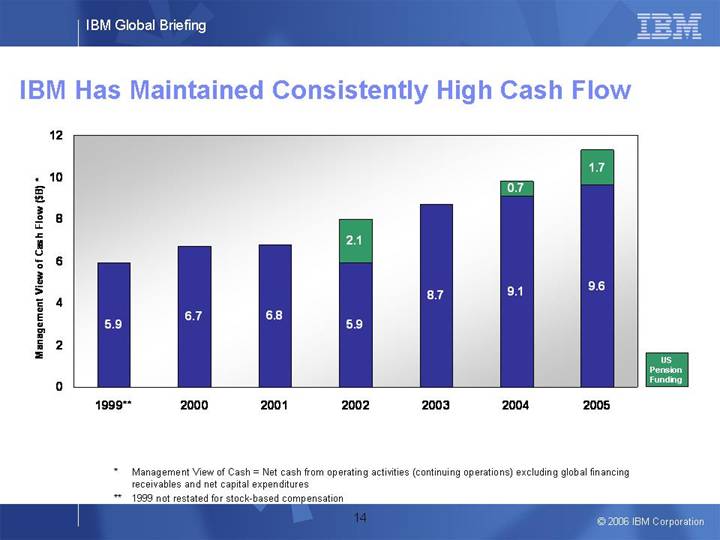
IBM Has Maintained Consistently High Cash Flow
[CHART]
* Management View of Cash = Net cash from operating activities (continuing operations) excluding global financing receivables and net capital expenditures
** 1999 not restated for stock-based compensation
14
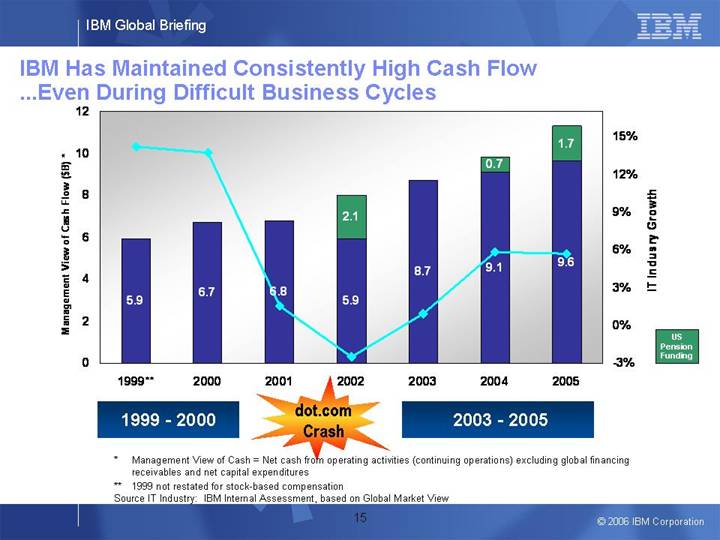
IBM Has Maintained Consistently High Cash Flow
....Even During Difficult Business Cycles
[CHART]
* Management View of Cash = Net cash from operating activities (continuing operations) excluding global financing receivables and net capital expenditures
** 1999 not restated for stock-based compensation
Source IT Industry: IBM Internal Assessment, based on Global Market View
15
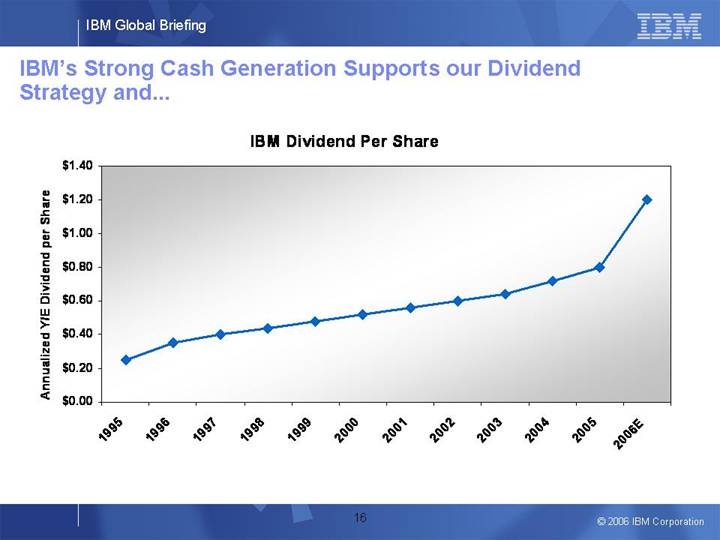
IBM’s Strong Cash Generation Supports our Dividend Strategy and...
IBM Dividend Per Share
[CHART]
16
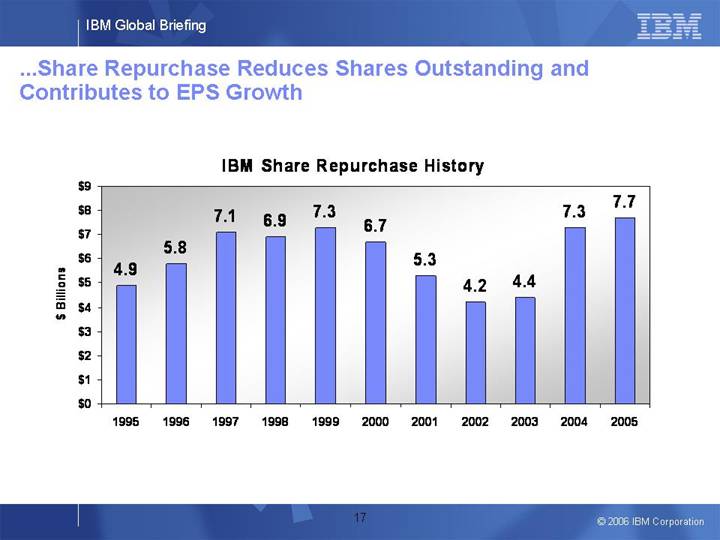
...Share Repurchase Reduces Shares Outstanding and Contributes to EPS Growth
IBM Share Repurchase History
[CHART]
17
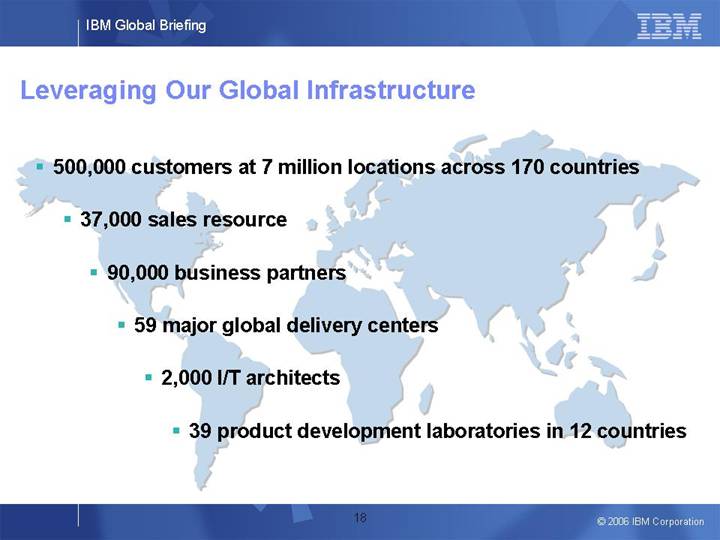
Leveraging Our Global Infrastructure
• 500,000 customers at 7 million locations across 170 countries
• 37,000 sales resource
• 90,000 business partners
• 59 major global delivery centers
• 2,000 I/T architects
• 39 product development laboratories in 12 countries
18
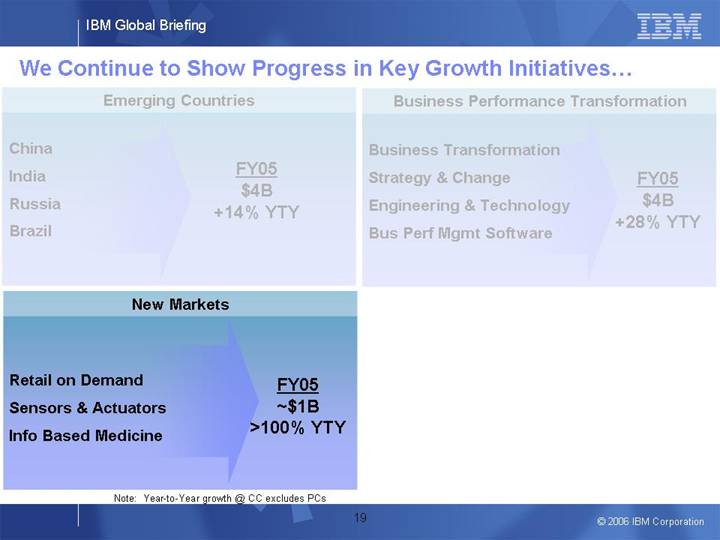
We Continue to Show Progress in Key Growth Initiatives…
Emerging Countries
China |
|
|
India |
| FY05 |
Russia |
| $4B |
Brazil |
| +14% YTY |
Business Performance Transformation
Business Transformation |
|
|
Strategy & Change |
| FY05 |
Engineering & Technology |
| $4B |
Bus Perf Mgmt Software |
| +28% YTY |
New Markets
Retail on Demand |
| FY05 |
Sensors & Actuators |
| ~$1B |
Info Based Medicine |
| >100% YTY |
Note: Year-to-Year growth @ CC excludes PCs
19
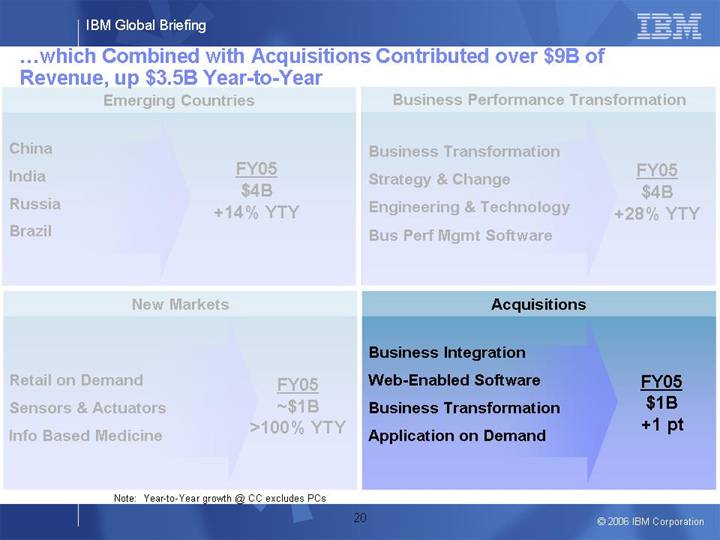
…which Combined with Acquisitions Contributed over $9B of Revenue, up $3.5B Year-to-Year
Emerging Countries
China |
|
|
India |
| FY05 |
Russia |
| $4B |
Brazil |
| +14% YTY |
New Markets
Retail on Demand |
| FY05 |
Sensors & Actuators |
| ~$1B |
Info Based Medicine |
| >100% YTY |
Business Performance Transformation
Business Transformation
Strategy & Change |
| FY05 |
Engineering & Technology |
| $4B |
Bus Perf Mgmt Software |
| +28% YTY |
Acquisitions
Business Integration |
|
|
Web-Enabled Software |
| FY05 |
Business Transformation |
| $1B |
Application on Demand |
| +1 pt |
Note: Year-to-Year growth @ CC excludes PCs
20
Our Recent Acquisitions Have Common Strategic Characteristics
[LOGO]
Strategic Acquisition targets are…
• enabled by powerful cash generation
• able to leverage IBM’s global infrastructure
• generally product-like
• highly scalable
• in growth areas
• a form of new product development
21
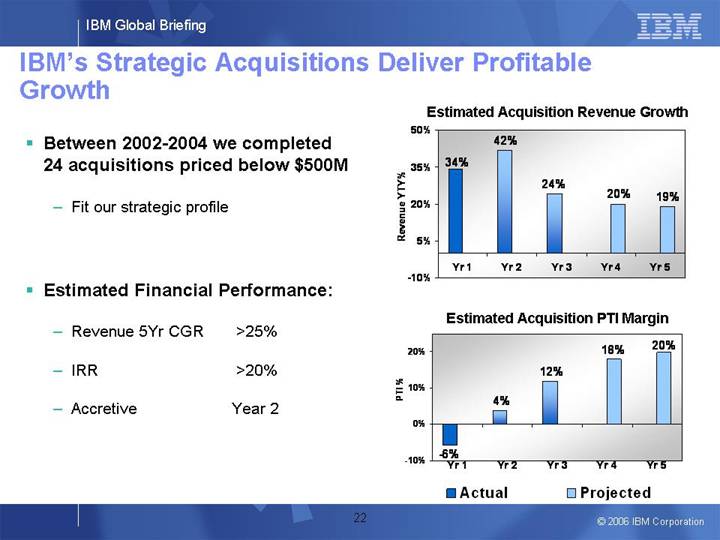
IBM’s Strategic Acquisitions Deliver Profitable Growth
• Between 2002-2004 we completed 24 acquisitions priced below $500M
• Fit our strategic profile
Estimated Acquisition Revenue Growth
[CHART]
• Estimated Financial Performance:
• Revenue 5Yr CGR |
| >25 | % |
|
|
|
|
• IRR |
| >20 | % |
|
|
|
|
• Accretive |
| Year 2 | |
Estimated Acquisition PTI Margin
[CHART]
22
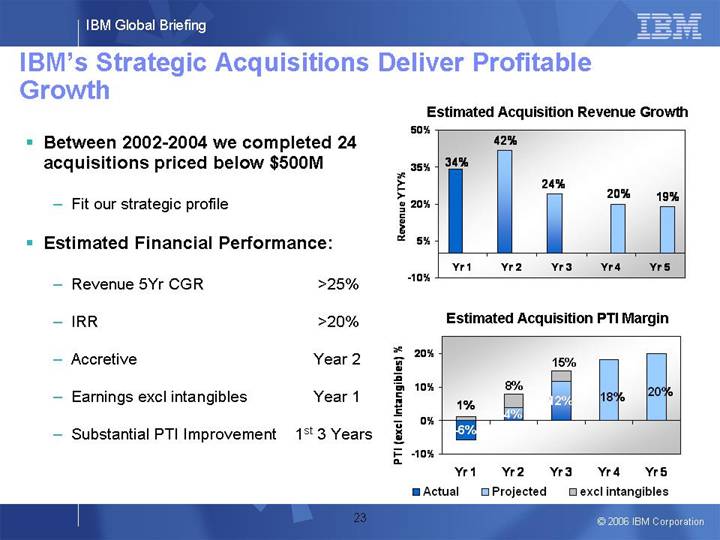
• Between 2002-2004 we completed 24 acquisitions priced below $500M
• Fit our strategic profile
Estimated Acquisition Revenue Growth
[CHART]
• Estimated Financial Performance:
• Revenue 5Yr CGR |
| >25 | % |
|
|
|
|
• IRR |
| >20 | % |
|
|
|
|
• Accretive |
| Year 2 | |
|
|
| |
• Earnings excl intangibles |
| Year 1 | |
|
|
| |
• Substantial PTI Improvement |
| 1st 3 Years | |
Estimated Acquisition PTI Margin
[CHART]
23
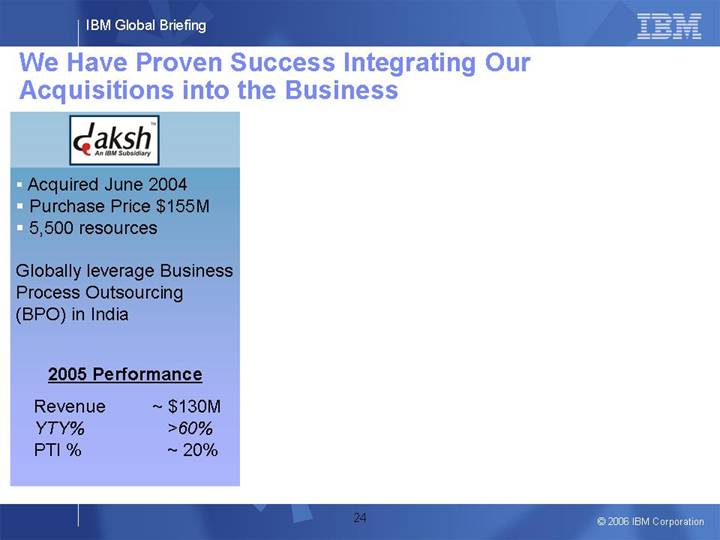
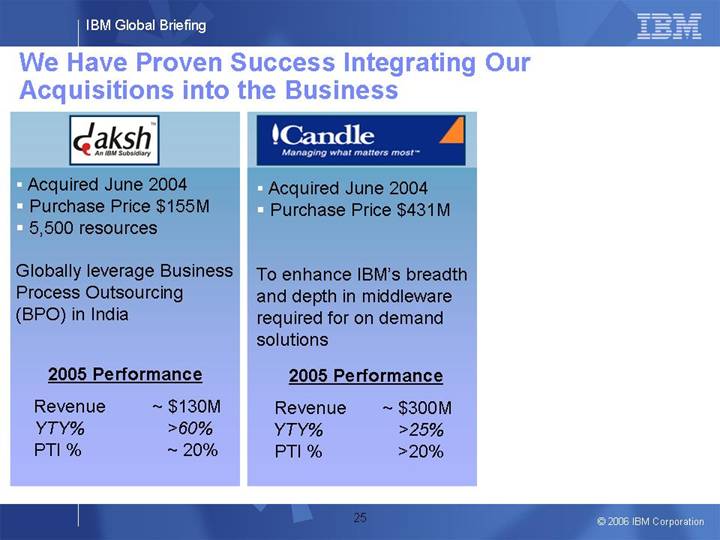
We Have Proven Success Integrating Our Acquisitions into the Business
[LOGO]
• Acquired June 2004
• Purchase Price $155M
• 5,500 resources
Globally leverage Business Process Outsourcing (BPO) in India
2005 Performance
Revenue |
| ~ $130M |
YTY% |
| >60% |
PTI % |
| ~ 20% |
24
[LOGO]
• Acquired June 2004
• Purchase Price $155M
• 5,500 resources
Globally leverage Business Process Outsourcing (BPO) in India
2005 Performance
Revenue |
| ~ $130M |
YTY% |
| >60% |
PTI % |
| ~ 20% |
[LOGO]
• Acquired June 2004
• Purchase Price $431M
To enhance IBM’s breadth and depth in middleware required for on demand solutions
2005 Performance
Revenue |
| ~ $300M |
YTY% |
| >25% |
PTI % |
| >20% |
25
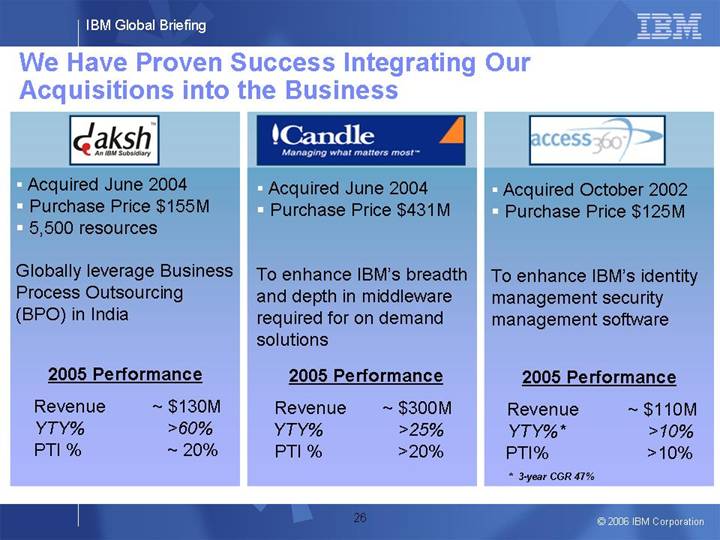
[LOGO]
• Acquired June 2004
• Purchase Price $155M
• 5,500 resources
Globally leverage Business Process Outsourcing (BPO) in India
2005 Performance
Revenue |
| ~ $130M |
YTY% |
| >60% |
PTI % |
| ~ 20% |
[LOGO]
• Acquired June 2004
• Purchase Price $431M
To enhance IBM’s breadth and depth in middleware required for on demand solutions
2005 Performance
Revenue |
| ~ $300M |
YTY% |
| >25% |
PTI % |
| >20% |
[LOGO]
• Acquired October 2002
• Purchase Price $125M
To enhance IBM’s identity management security management software
2005 Performance
Revenue |
| ~ $110M |
YTY%* |
| >10% |
PTI% |
| >10% |
* 3-year CGR 47%
26
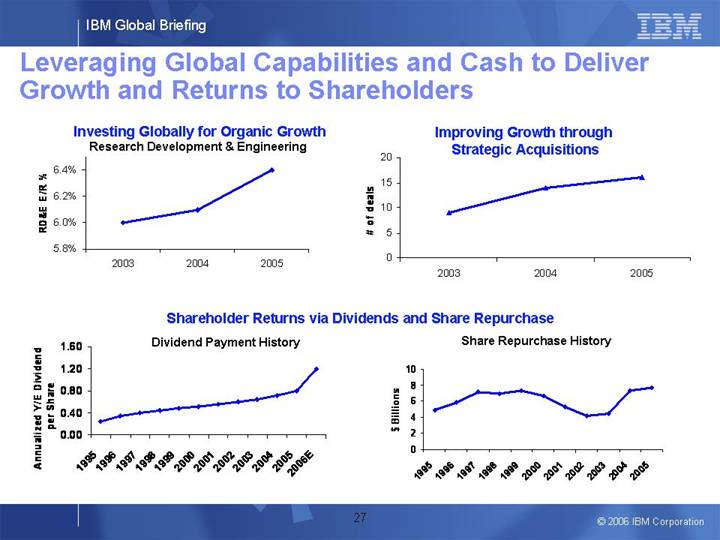
Leveraging Global Capabilities and Cash to Deliver Growth and Returns to Shareholders
Investing Globally for Organic Growth |
| Improving Growth through |
Research Development & Engineering |
| Strategic Acquisitions |
|
|
|
[CHART] |
| [CHART] |
Shareholder Returns via Dividends and Share Repurchase
Dividend Payment History |
| Share Repurchase History |
|
|
|
[CHART] |
| [CHART] |
27
Our Long-Term Business Objectives
• Drive revenue growth through new markets, new offerings and new products both developed and acquired
• Focus on productivity to improve margin
• Deploy cash to fund growth and provide shareholder returns via dividends / buybacks
Deliver 10-12% Earnings per Share Growth
over the Long-term
28
Non-GAAP Supplementary Materials
June 7, 2006
Non-GAAP Supplementary Materials
In an effort to provide investors with additional information regarding the company's results as determined by generally accepted accounting principles (GAAP), the company also discussed the following non-GAAP information which management believes provides useful information to investors.
Constant Currency
Management refers to growth rates at constant currency or adjusting for currency so that the business results can be viewed without the impact of changing foreign currency exchange rates, thereby facilitating period-to-period comparisons of the Company's business performance. Generally, when the dollar either strengthens or weakens against other currencies, the growth at constant currency rates or adjusting for currency will be higher or lower than growth reported at actual exchange rates.
2
Non-GAAP Supplementary Materials
Non-recurring Items/Special Actions
Management has presented certain financial results excluding the effects of the following one-time items: (1) a 2Q 2005 gain on the sale of the company’s PC business, (2) a 2Q 2005 gain related to a settlement agreement reached with Microsoft, (3) 2Q 2005 charges related to the company’s restructuring initiatives, (4) a one-time 3Q 2005 tax charge for the repatriation of foreign earnings, (5) a 4Q 2005 one-time curtailment charge relating to changes to the company’s U.S. defined benefit pension plans, (6) a one-time charge recorded in 3Q 2004 for the partial settlement of certain legal claims related to IBM’s pension plan and (7) the operational performance of the company’s divested PC business. Given the unique and non-recurring nature of these items, management believes that presenting certain financial information without these items is more representative of the company's operational performance and provides additional insight into, and clarifies the basis for, historical and/or future performance, which may be more useful for investors.
Additionally, the company has presented certain financial results excluding the effects of special actions in 1999, 2002 and 2005. Given the unique and non-recurring nature of these items (both gains and losses), management believes that presenting certain financial results without the effects of such actions is more representative of the company's operational performance and year-over-year dynamics.
3
Non-GAAP Supplementary Materials
Divested PC Business
On April 30, 2005, IBM sold its PC business. Management believes that it is important to investors to understand the financial results of the company adjusted for the impact of its divested PCD operations in order to show IBM’s results on a comparable basis year-to-year, and to best present ongoing operational performance. Accordingly, management has presented certain financial results excluding the effects of the PC business.
Consistent with the company's management system, its reportable segments include transactions between segments that are intended to reflect an arm's-length transfer price and include intercompany profit. Management believes that a more appropriate measure of the financial impacts that the divestiture of the PC business has on IBM's consolidated financial results should exclude any revenues associated with internal sales and intercompany profits, which are eliminated in consolidation. Accordingly, the results of the PC business have been adjusted from the reported PC segment. The basis for these adjustments are to give effect to intercompany and certain allocated expenses and the adjusted results are intended to display the impact on the IBM consolidated results on a basis comparable to which the company operates post-PC divestiture which management believes is meaningful and useful to investors.
4
Non-GAAP Supplementary Materials
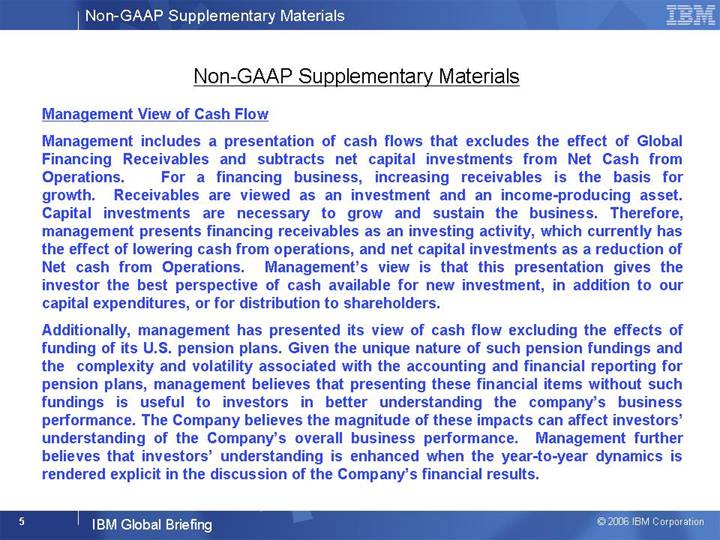
Management View of Cash Flow
Management includes a presentation of cash flows that excludes the effect of Global Financing Receivables and subtracts net capital investments from Net Cash from Operations. For a financing business, increasing receivables is the basis for growth. Receivables are viewed as an investment and an income-producing asset. Capital investments are necessary to grow and sustain the business. Therefore, management presents financing receivables as an investing activity, which currently has the effect of lowering cash from operations, and net capital investments as a reduction of Net cash from Operations. Management’s view is that this presentation gives the investor the best perspective of cash available for new investment, in addition to our capital expenditures, or for distribution to shareholders.
Additionally, management has presented its view of cash flow excluding the effects of funding of its U.S. pension plans. Given the unique nature of such pension fundings and the complexity and volatility associated with the accounting and financial reporting for pension plans, management believes that presenting these financial items without such fundings is useful to investors in better understanding the company’s business performance. The Company believes the magnitude of these impacts can affect investors’ understanding of the Company’s overall business performance. Management further believes that investors’ understanding is enhanced when the year-to-year dynamics is rendered explicit in the discussion of the Company’s financial results.
5
Non-GAAP Supplementary Materials
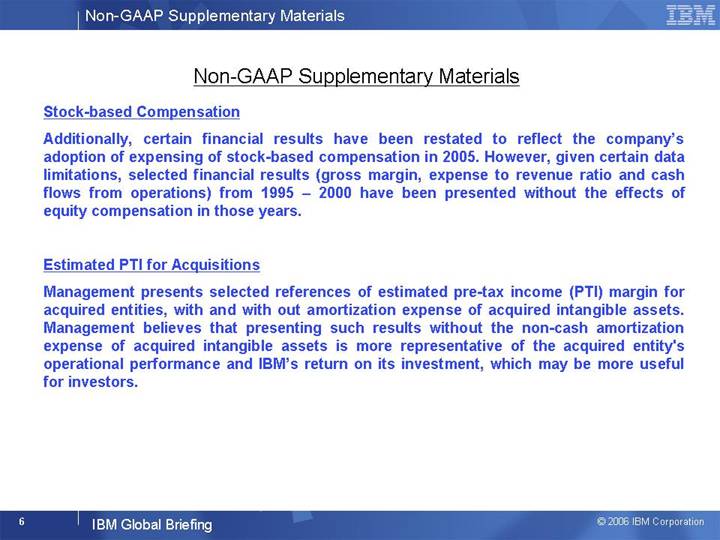
Stock-based Compensation
Additionally, certain financial results have been restated to reflect the company’s adoption of expensing of stock-based compensation in 2005. However, given certain data limitations, selected financial results (gross margin, expense to revenue ratio and cash flows from operations) from 1995 – 2000 have been presented without the effects of equity compensation in those years.
Estimated PTI for Acquisitions
Management presents selected references of estimated pre-tax income (PTI) margin for acquired entities, with and with out amortization expense of acquired intangible assets. Management believes that presenting such results without the non-cash amortization expense of acquired intangible assets is more representative of the acquired entity's operational performance and IBM’s return on its investment, which may be more useful for investors.
6
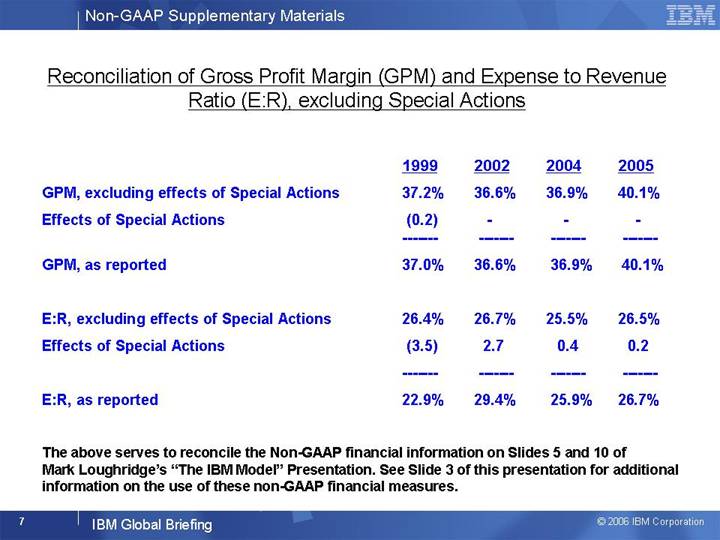
Reconciliation of Gross Profit Margin (GPM) and Expense to Revenue Ratio (E:R), excluding Special Actions
|
| 1999 |
| 2002 |
| 2004 |
| 2005 |
|
|
|
|
|
|
|
|
|
|
|
GPM, excluding effects of Special Actions |
| 37.2 | % | 36.6 | % | 36.9 | % | 40.1 | % |
Effects of Special Actions |
| (0.2 | ) | — |
| — |
| — |
|
GPM, as reported |
| 37.0 | % | 36.6 | % | 36.9 | % | 40.1 | % |
|
|
|
|
|
|
|
|
|
|
E:R, excluding effects of Special Actions |
| 26.4 | % | 26.7 | % | 25.5 | % | 26.5 | % |
Effects of Special Actions |
| (3.5 | ) | 2.7 |
| 0.4 |
| 0.2 |
|
E:R, as reported |
| 22.9 | % | 29.4 | % | 25.9 | % | 26.7 | % |
The above serves to reconcile the Non-GAAP financial information on Slides 5 and 10 of Mark Loughridge’s “The IBM Model” Presentation. See Slide 3 of this presentation for additional information on the use of these non-GAAP financial measures.
7
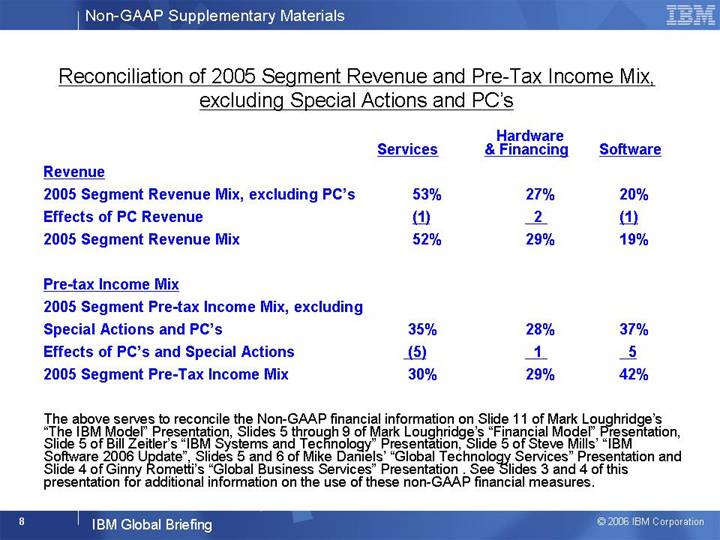
Reconciliation of 2005 Segment Revenue and Pre-Tax Income Mix, excluding Special Actions and PC’s
|
| Hardware |
| Services |
| Software |
|
Revenue |
|
|
|
|
|
|
|
2005 Segment Revenue Mix, excluding PC’s |
| 53 | % | 27 | % | 20 | % |
Effects of PC Revenue |
| (1 | ) | 2 |
| (1 | ) |
2005 Segment Revenue Mix |
| 52 | % | 29 | % | 19 | % |
|
|
|
|
|
|
|
|
Pre-tax Income Mix |
|
|
|
|
|
|
|
2005 Segment Pre-tax Income Mix, excluding Special Actions and PC’s |
| 35 | % | 28 | % | 37 | % |
Effects of PC’s and Special Actions |
| (5 | ) | 1 |
| 5 |
|
2005 Segment Pre-Tax Income Mix |
| 30 | % | 29 | % | 42 | % |
The above serves to reconcile the Non-GAAP financial information on Slide 11 of Mark Loughridge’s “The IBM Model” Presentation, Slides 5 through 9 of Mark Loughridge’s “Financial Model” Presentation, Slide 5 of Bill Zeitler’s “IBM Systems and Technology” Presentation, Slide 5 of Steve Mills’ “IBM Software 2006 Update”, Slides 5 and 6 of Mike Daniels’ “Global Technology Services” Presentation and Slide 4 of Ginny Rometti’s “Global Business Services” Presentation . See Slides 3 and 4 of this presentation for additional information on the use of these non-GAAP financial measures.
8
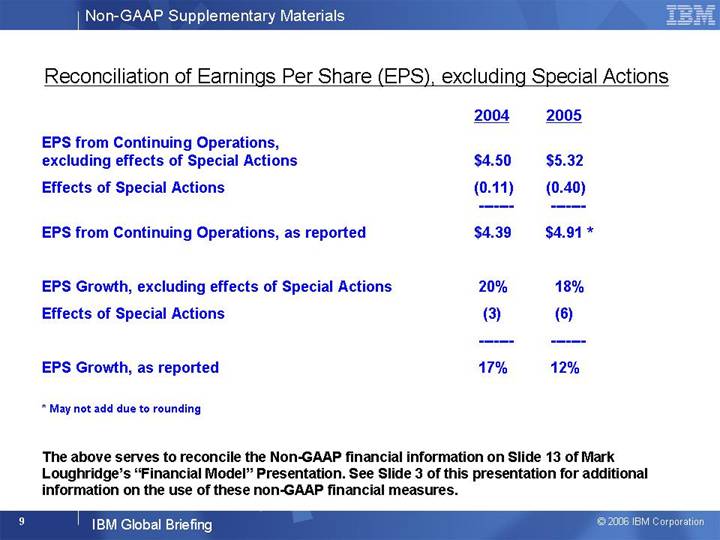
Reconciliation of Earnings Per Share (EPS), excluding Special Actions
|
| 2004 |
| 2005 |
| ||
EPS from Continuing Operations, excluding effects of Special Actions |
| $ | 4.50 |
| $ | 5.32 |
|
Effects of Special Actions |
| (0.11 | ) | (0.40 | ) | ||
EPS from Continuing Operations, as reported |
| $ | 4.39 |
| $ | 4.91 | * |
|
|
|
|
|
| ||
EPS Growth, excluding effects of Special Actions |
| 20 | % | 18 | % | ||
Effects of Special Actions |
| (3 | ) | (6 | ) | ||
EPS Growth, as reported |
| 17 | % | 12 | % | ||
* May not add due to rounding
The above serves to reconcile the Non-GAAP financial information on Slide 13 of Mark Loughridge’s “Financial Model” Presentation. See Slide 3 of this presentation for additional information on the use of these non-GAAP financial measures.
9
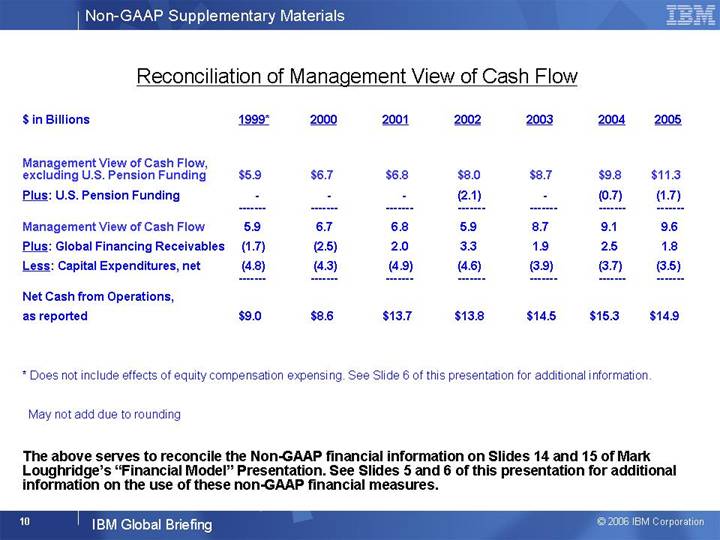
Reconciliation of Management View of Cash Flow
$ in Billions |
| 1999* |
| 2000 |
| 2001 |
| 2002 |
| 2003 |
| 2004 |
| 2005 |
| |||||||
Management View of Cash Flow, excluding U.S. Pension Funding |
| $ | 5.9 |
| $ | 6.7 |
| $ | 6.8 |
| $ | 8.0 |
| $ | 8.7 |
| $ | 9.8 |
| $ | 11.3 |
|
Plus: U.S. Pension Funding |
| — |
| — |
| — |
| (2.1 | ) | — |
| (0.7 | ) | (1.7 | ) | |||||||
Management View of Cash Flow |
| 5.9 |
| 6.7 |
| 6.8 |
| 5.9 |
| 8.7 |
| 9.1 |
| 9.6 |
| |||||||
Plus: Global Financing Receivables |
| (1.7 | ) | (2.5 | ) | 2.0 |
| 3.3 |
| 1.9 |
| 2.5 |
| 1.8 |
| |||||||
Less: Capital Expenditures, net |
| (4.8 | ) | (4.3 | ) | (4.9 | ) | (4.6 | ) | (3.9 | ) | (3.7 | ) | (3.5 | ) | |||||||
Net Cash from Operations, as reported |
| $ | 9.0 |
| $ | 8.6 |
| $ | 13.7 |
| $ | 13.8 |
| $ | 14.5 |
| $ | 15.3 |
| $ | 14.9 |
|
* Does not include effects of equity compensation expensing. See Slide 6 of this presentation for additional information.
May not add due to rounding
The above serves to reconcile the Non-GAAP financial information on Slides 14 and 15 of Mark Loughridge’s “Financial Model” Presentation. See Slides 5 and 6 of this presentation for additional information on the use of these non-GAAP financial measures.
10
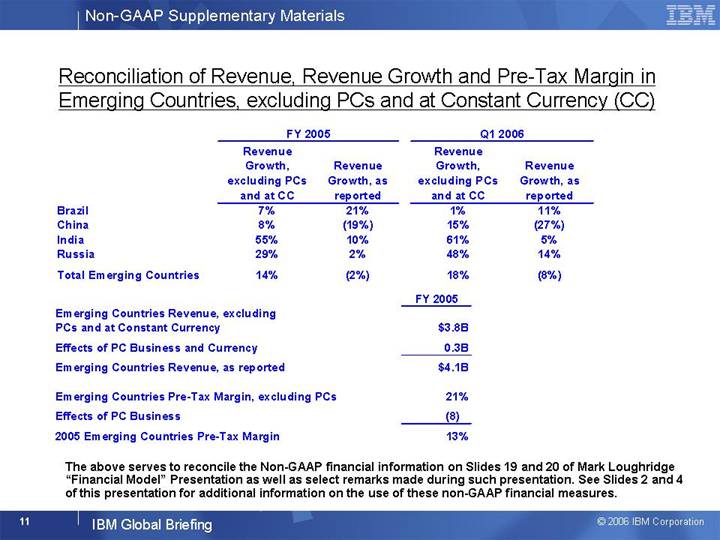
Reconciliation of Revenue, Revenue Growth and Pre-Tax Margin in Emerging Countries, excluding PCs
and at Constant Currency (CC)
[CHART]
[CHART]
The above serves to reconcile the Non-GAAP financial information on Slides 19 and 20 of Mark Loughridge “Financial Model” Presentation as well as select remarks made during such presentation. See Slides 2 and 4 of this presentation for additional information on the use of these non-GAAP financial measures.
11
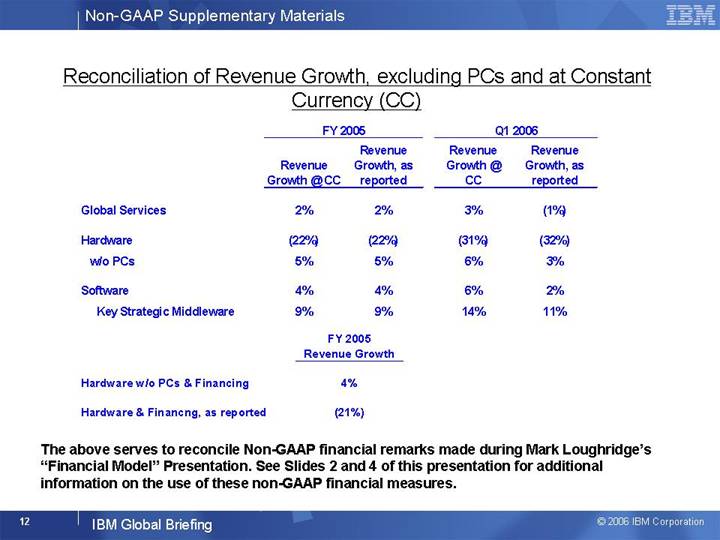
Reconciliation of Revenue Growth, excluding PCs and at Constant Currency (CC)
[CHART]
[CHART]
The above serves to reconcile Non-GAAP financial remarks made during Mark Loughridge’s “Financial Model” Presentation. See Slides 2 and 4 of this presentation for additional information on the use of these non-GAAP financial measures.
12