Item 2.02. Results of Operations and Financial Condition.
The registrant’s press release dated October 17, 2006 regarding its financial results for the periods ended September 30, 2006, including unaudited consolidated financial statements for the periods ended September 30, 2006, is Attachment I of this Form 8-K. Attachment II are the charts for IBM’s Chief Financial Officer Mark Loughridge’s third quarter earnings presentation on October 17, 2006, as well as certain reconciliation and other information (“Non-GAAP Supplementary Materials”) for information in Attachment I (press release), Attachment II (charts) and in Mr. Loughridge’s presentation.
All of the information in Attachments I and II is hereby filed except for the information set forth below, which is furnished but not filed.
Attachment I (Press Release):
The following statements on Page 1:
“or 9 percent, excluding the 2005 non-recurring item”;
“Income from continuing operations for the third quarter grew 9 percent compared with the third-quarter 2005 income from continued operations of $2.0 billion, excluding the one-time charge.”
The following statement on Page 3:
“Excluding the divested PC business, revenues increased 2 percent (3 percent, adjusting for currency) compared with the nine-month period of 2005.”
Attachment II (Charts):
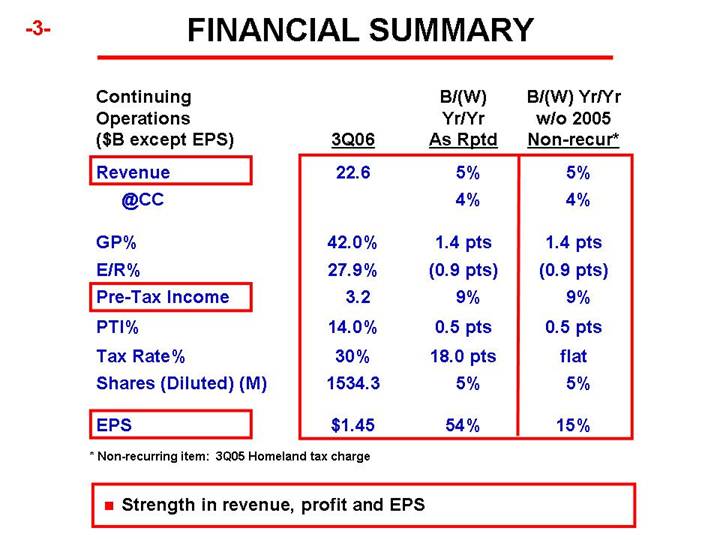
In the chart on Page 3 (Financial Summary), the data in the column entitled “B/(W) Yr/Yr w/o 2005 Non-recur*” for the row identifed as “Tax Rate%”.
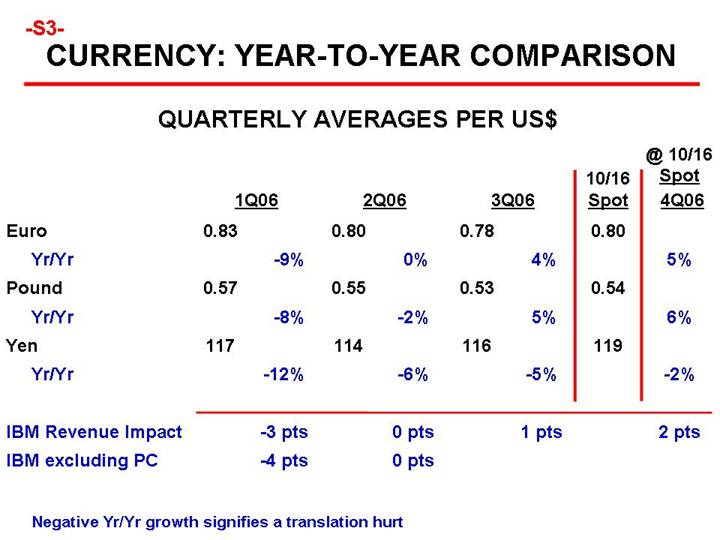
In the chart on Page S-3 (CURRENCY: YEAR-TO-YEAR COMPARISON), all the data in the row identified as “IBM excluding PC”.
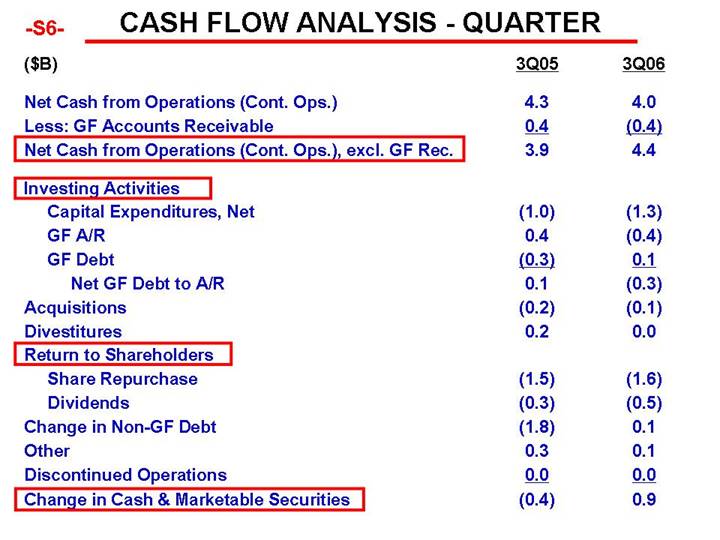
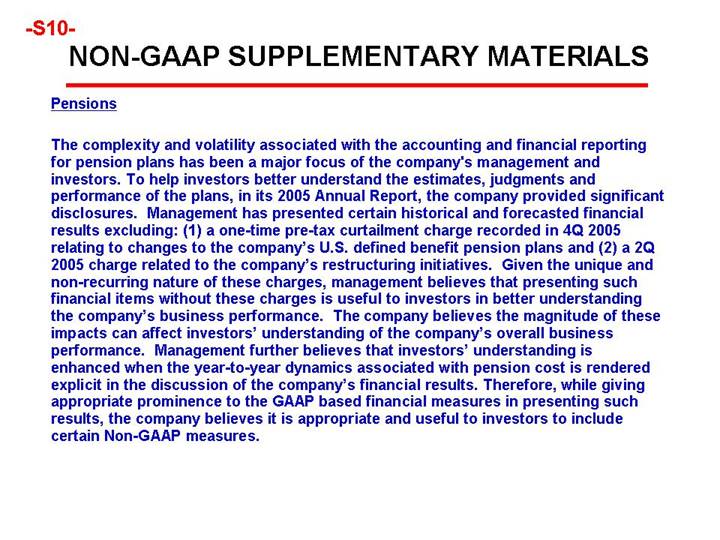
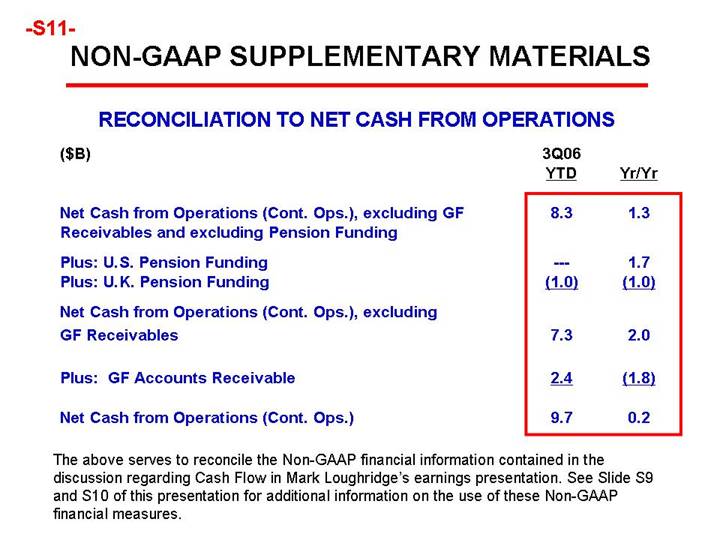
In the chart on Page S-11 (NON-GAAP SUPPLEMENTARY MATERIALS — RECONCILIATION TO NET CASH FROM OPERATIONS), all the data in the row identified as “Net Cash from Operations (Cont. Ops.), excluding GF Receivables and excluding Pension Funding”.
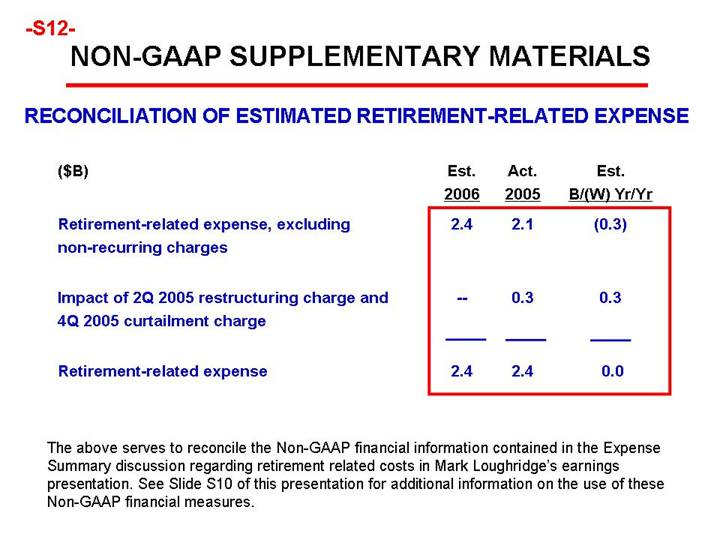
In the chart on Page S-12 (NON-GAAP SUPPLEMENTARY MATERIALS — RECONCILIATION OF ESTIMATED RETIREMENT-RELATED EXPENSE), all the data in the row identified as “Retirement-related expense, excluding non-recurring charges”.
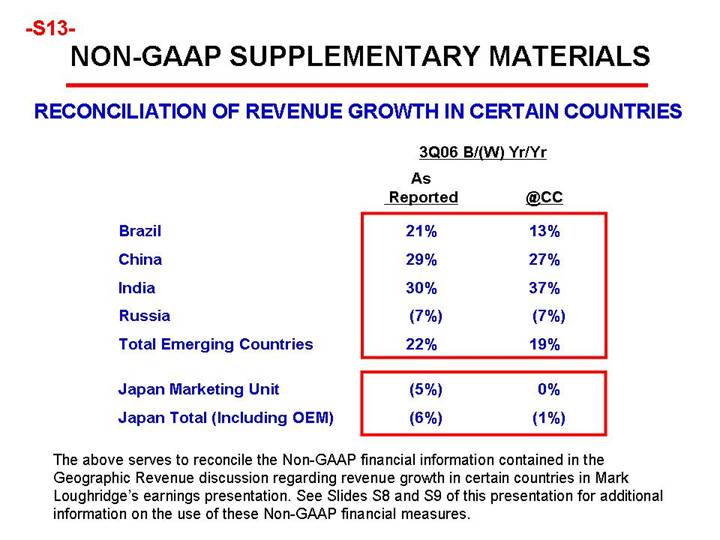
In the chart on Page S-13 (NON-GAAP SUPPLEMENTARY MATERIALS — RECONCILIATION OF REVENUE GROWTH IN CERTAIN COUNTRIES), all the data in the row entitled “Japan Marketing Unit”.
ATTACHMENT I
IBM REPORTS 2006 THIRD-QUARTER RESULTS
· Diluted earnings of $1.45 per share from continuing operations, up 54 percent as reported, or 15 percent compared with $1.26 per diluted share from the third-quarter 2005, excluding a non-recurring item;
· Income from continuing operations of $2.2 billion, up 47 percent, or 9 percent, excluding the 2005 non-recurring item;
· Total revenues of $22.6 billion, up 5 percent as reported.
ARMONK, N.Y., October 17, 2006 . . . IBM today announced third-quarter 2006 diluted earnings of $1.45 per share from continuing operations, an increase of 54 percent as reported, compared with diluted earnings of $.94 per share in the third quarter of 2005; the third-quarter 2005 diluted earnings include $.32 per share for a one-time charge of $525 million for taxes in connection with the 2005 repatriation of foreign earnings. Diluted earnings per share for the third-quarter 2006 grew 15 percent compared with the year-ago quarter of $1.26 per diluted share, without the one-time per share charge.
Third-quarter income from continuing operations was $2.2 billion compared with $1.5 billion in the third quarter of 2005, including the one- time charge, an increase of 47 percent. Income from continuing operations for the third quarter grew 9 percent compared with the third-quarter 2005 income from continued operations of $2.0 billion, excluding the one-time charge. Total revenues for the third quarter of 2006 of $22.6 billion increased 5 percent (4 percent, adjusting for currency) from the third quarter of 2005.
Samuel J. Palmisano, IBM chairman, president and chief executive officer, said: "Our strong performance is the result of excellent execution and the repositioning of IBM's business model to capture the growth and profit areas of a rapidly changing IT industry."
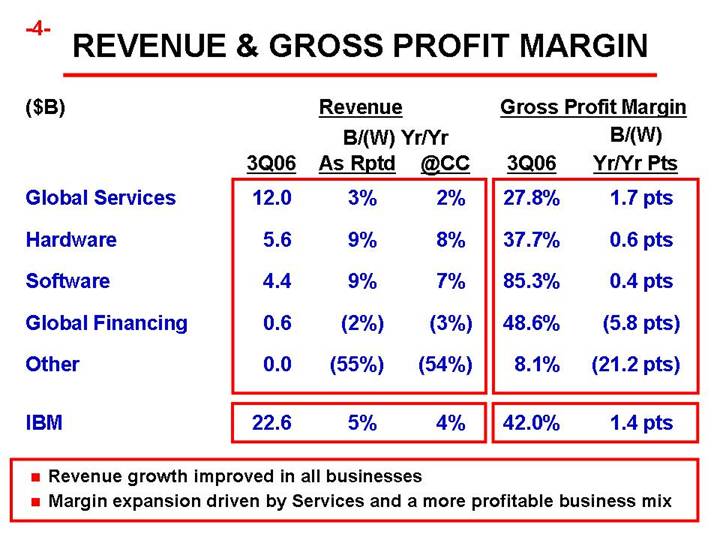
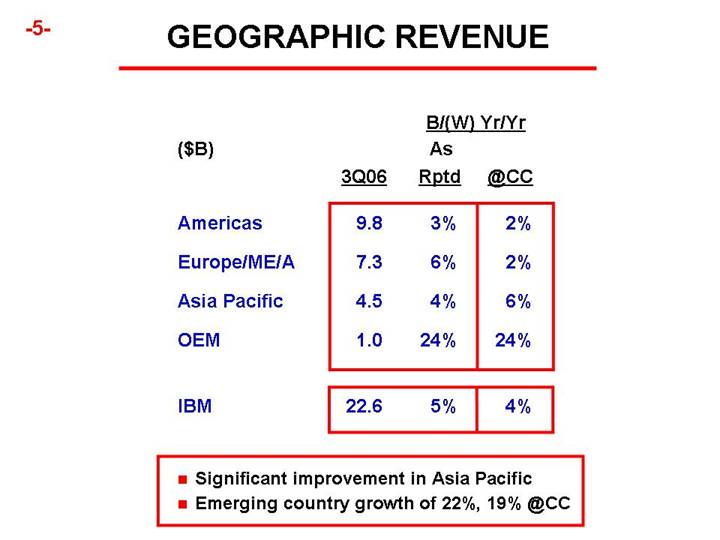
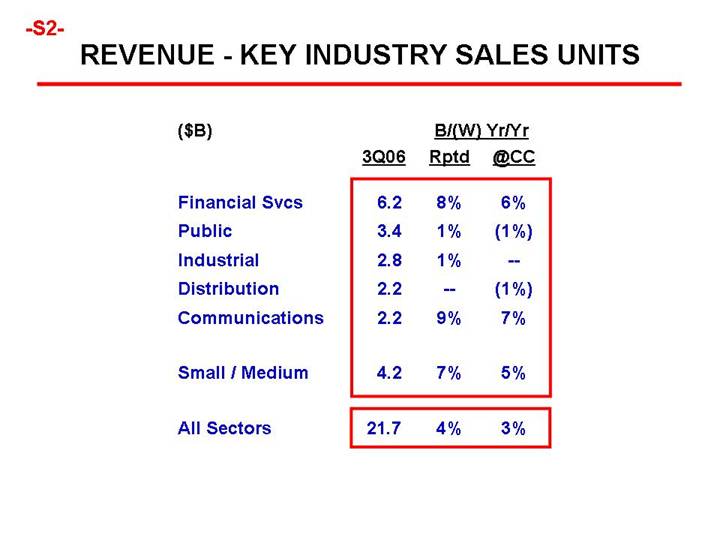
From a geographic perspective, the Americas third-quarter revenues were $9.8 billion, an increase of 3 percent as reported (2 percent, adjusting for currency) from the 2005 period. Revenues from Europe/Middle East/Africa were $7.3 billion, up 6 percent (2 percent, adjusting for currency). Asia-Pacific revenues increased 4 percent (6 percent, adjusting for currency) to $4.5 billion. OEM revenues were $1.0 billion, up 24 percent compared with the 2005 third quarter.
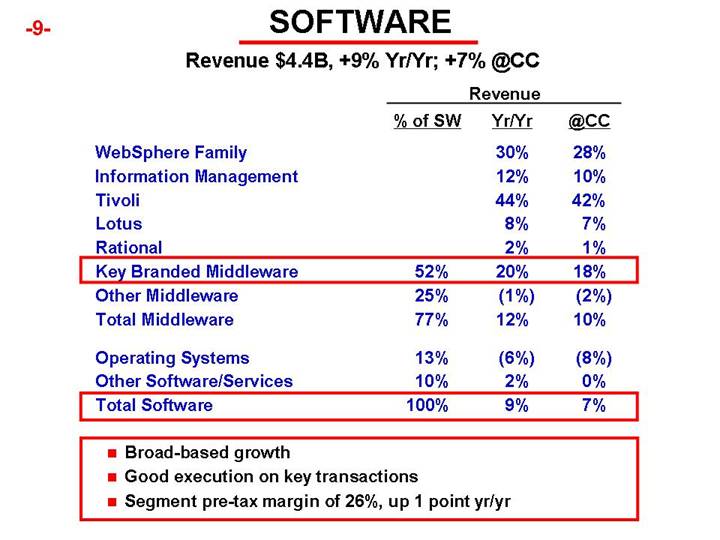
Revenues from Software were $4.4 billion, an increase of 9 percent (7 percent, adjusting for currency) compared with the third quarter of 2005. Revenues from IBM's middleware brands, which include WebSphere, Information Management, Tivoli, Lotus and Rational products, were $3.4 billion, up 12 percent versus the third quarter of 2005. Operating systems revenues decreased 6 percent to $552 million compared with the prior-year quarter. Revenues from other software and services increased, which includes the Product Lifecycle Management portfolio of products.
-1-
For the WebSphere family of software products, which facilitate customers' ability to manage a wide variety of business processes using open standards to interconnect applications, data and operating systems, revenues increased 30 percent. Revenues for Information Management software, which enables clients to leverage information on demand, increased 12 percent. Revenues from Tivoli software, infrastructure software that enables customers to centrally manage networks including security and storage capability, increased 44 percent, and revenues for Lotus software, which allows collaborating and messaging by customers in real-time communication and knowledge management, increased 8 percent year over year. Revenues from Rational software, integrated tools to improve the processes of software development, increased 2 percent compared with the year-ago quarter.
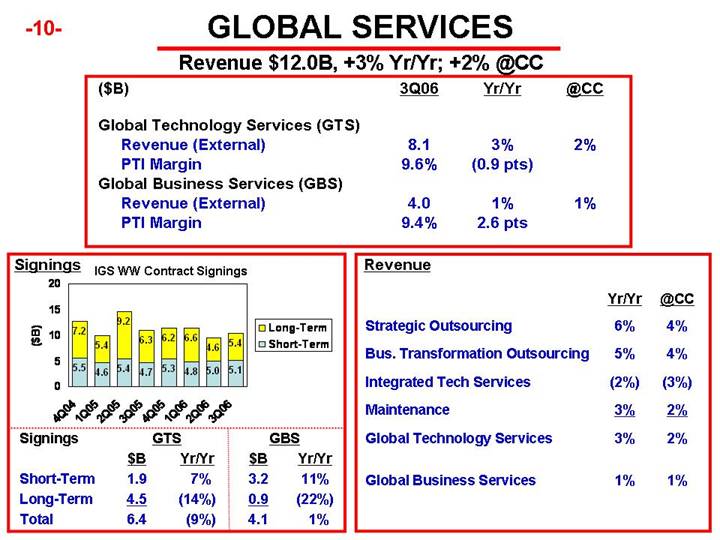
Revenues from Global Services increased 3 percent (2 percent, adjusting for currency) to $12.0 billion in the third quarter of 2006. IBM signed services contracts totaling $10.5 billion and ended the quarter with an estimated services backlog, including Strategic Outsourcing, Business Transformation Outsourcing, Global Business Services, Integrated Technology Services and Maintenance, of $109 billion.
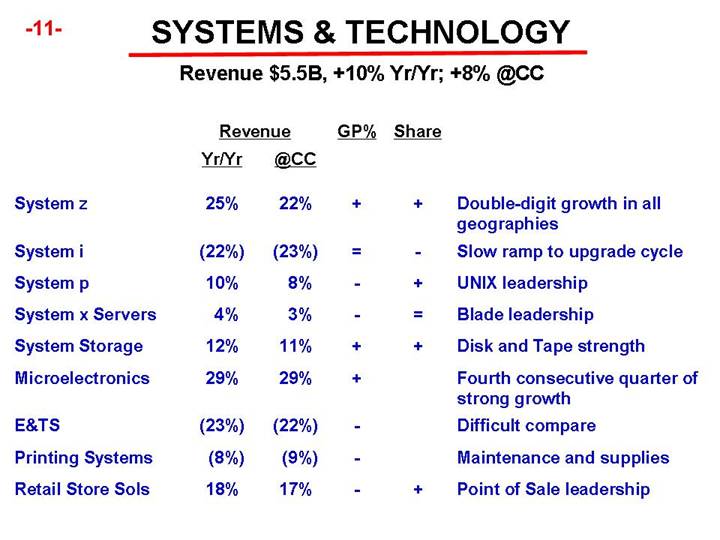
Hardware revenues increased 9 percent (8 percent, adjusting for currency) to $5.6 billion in the third-quarter 2006 compared to $5.1 billion in the year-ago period. Systems and Technology Group (S&TG) revenues totaled $5.5 billion for the quarter, up 10 percent. S&TG revenues from System z server products increased 25 percent compared with the year-ago period. Total delivery of System z computing power, which is measured in MIPS (millions of instructions per second), increased 16 percent. Revenues from the System p UNIX server products increased 10 percent compared with the 2005 period. Revenues from the System x servers increased 4 percent, and revenues from the System i servers decreased 22 percent. Revenues from Microelectronics increased 29 percent and revenues from System Storage increased 12 percent.
Global Financing revenues decreased 2 percent (3 percent, adjusting for currency) in the third quarter to $591 million.
The company's total gross profit margin was 42.0 percent in the 2006 third quarter compared with 40.6 percent in the 2005 period.
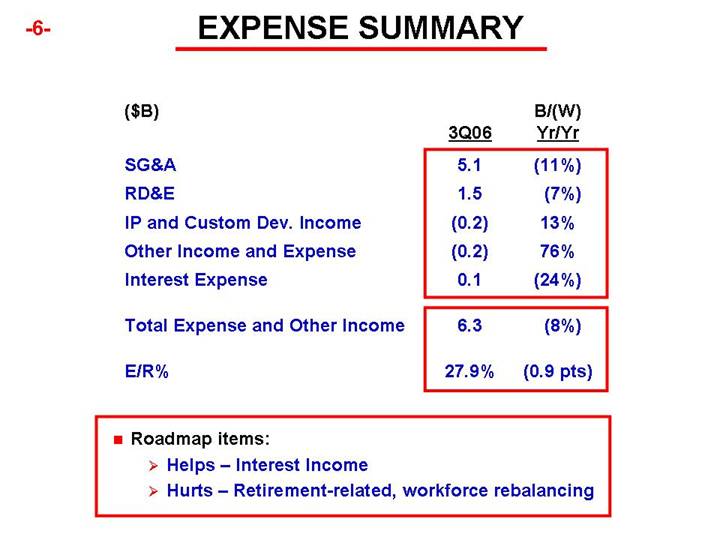
Total expense and other income increased 8 percent to $6.3 billion compared with the prior-year period. SG&A expense increased 11 percent to $5.1 billion. RD&E expense increased 7 percent compared with the year-ago period. Intellectual property and custom development income increased to $242 million compared with $213 million a year ago. Other (income) and expense was income of $174 million in the third quarter of 2006 versus income of $99 million in the third quarter of 2005.
IBM's effective tax rate in the third-quarter 2006 was 30.0 percent, compared with 48.0 percent in the third quarter of 2005. The tax rate decrease was substantially driven by the incremental tax charge of $525 million in the third quarter of 2005 related to the company's repatriation of foreign earnings.
Share repurchases totaled approximately $1.6 billion in the third quarter. The weighted-average number of diluted common shares outstanding in the third-quarter 2006 was 1.53 billion compared with 1.62 billion shares in the same period of 2005. As of September 30, 2006, there were 1.51 billion basic common shares outstanding.
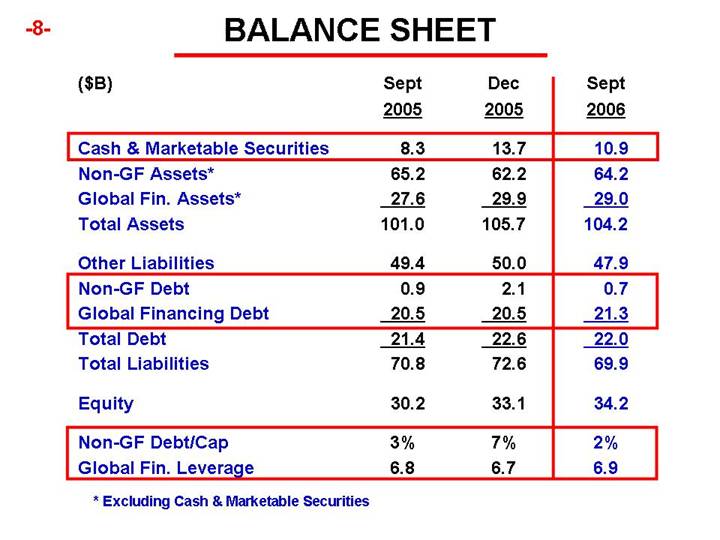
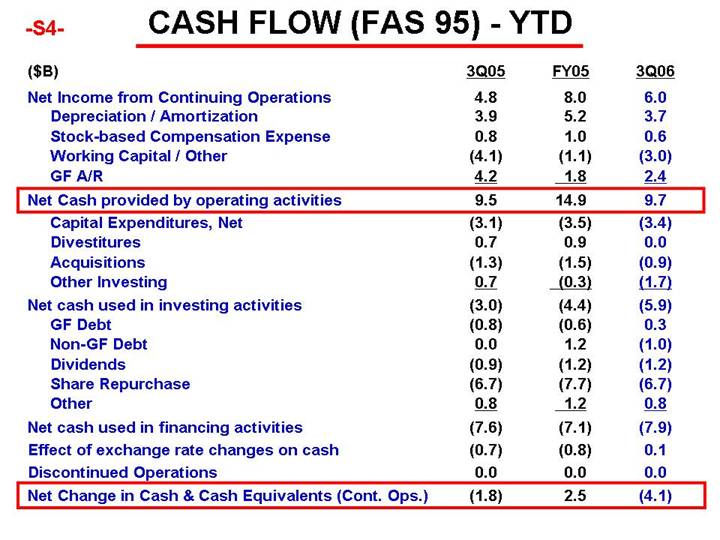
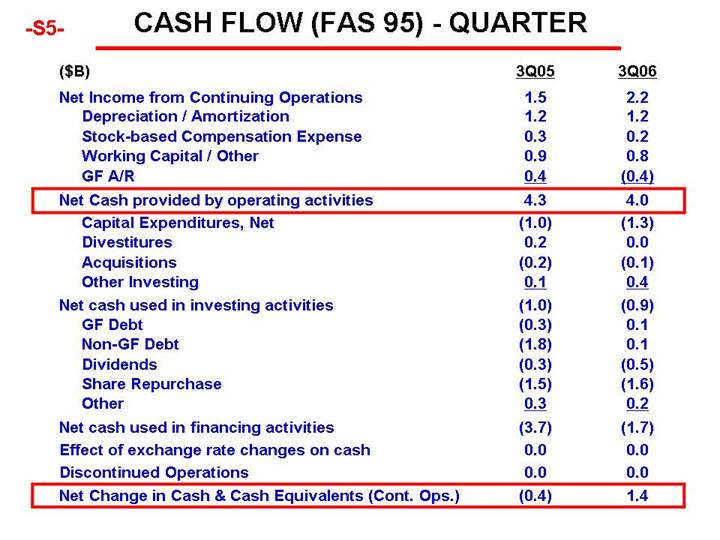
IBM ended the third quarter of 2006 with $10.9 billion of cash on hand. The balance sheet remains strong, and the company is well positioned to take advantage of opportunities.
Debt, including Global Financing, totaled $22.0 billion, compared with $22.6 billion at year-end 2005. From a management segment view, the non- global financing debt-to-capitalization ratio was 2.3 percent at the end of September 30, 2006, and Global Financing debt increased $771 million from year-end 2005 to a total of $21.3 billion, resulting in a debt-to-equity ratio of 6.9 to 1.
-2-
Year-To-Date 2006 Results
Income from continuing operations for the nine months ended September 30, 2006 was $6.0 billion, compared with $4.8 billion in the year-ago period, which includes a charge of $525 million for taxes in connection with the 2005 repatriation of foreign earnings, and non-recurring pretax items for incremental restructuring charges of $1.7 billion, offset by the $1.1 billion gain on the sale of the Personal Computing (PC) business, and the $775 million legal settlement received from Microsoft. Diluted earnings per share from continuing operations were $3.81 compared with $2.92 per diluted share for the 2005 period. Revenues from continuing operations for the nine-month period totaled $65.2 billion, a decrease of 2 percent as reported and adjusting for currency compared with $66.7 billion for the nine months of 2005, which includes PC revenues of $2.9 billion for the first four months of 2005 only. Excluding the divested PC business, revenues increased 2 percent (3 percent, adjusting for currency) compared with the nine-month period of 2005.
For total operations, net income for the nine months of 2006 was $6.0 billion, or $3.81 per diluted share, compared with the nine months of 2005 net income of $4.7 billion, or $2.90 per diluted share, which included a loss from discontinued operations of $27 million.
Forward-Looking and Cautionary Statements
Except for the historical information and discussions contained herein, statements contained in this release may constitute forward-looking statements within the meaning of the Private Securities Litigation Reform Act of 1995. These statements involve a number of risks, uncertainties and other factors that could cause actual results to differ materially, including the company's failure to continue to develop and market new and innovative products and services and to keep pace with technological change; competitive pressures; failure to obtain or protect intellectual property rights; quarterly fluctuations in revenues and volatility of stock prices; the company's ability to attract and retain key personnel; adverse affects from tax matters; currency fluctuations and customer financing risks; customer credit risk on trade receivables; the company's failure to maintain the adequacy of its internal controls; the company's use of certain estimates and assumptions; dependence on certain suppliers; changes in the financial or business condition of the company's distributors or resellers; the company's ability to successfully manage acquisitions and alliances; failure to have sufficient insurance; legal, political, health and economic conditions; risk factors related to IBM securities; and other risks, uncertainties and factors discussed in the company's Form 10-Q, Form 10-K and in the company's other filings with the U.S. Securities and Exchange Commission (SEC) or in materials incorporated therein by reference. The company assumes no obligation to update or revise any forward-looking statements.
Presentation of Information in this Press Release
In an effort to provide investors with additional information regarding the company's results as determined by generally accepted accounting principles (GAAP), the company has also disclosed in this press release the following non-GAAP information which management believes provides useful information to investors: IBM results:
· without non-recurring items,
· without divested PC business,
· adjusting for currency (i.e., at constant currency).
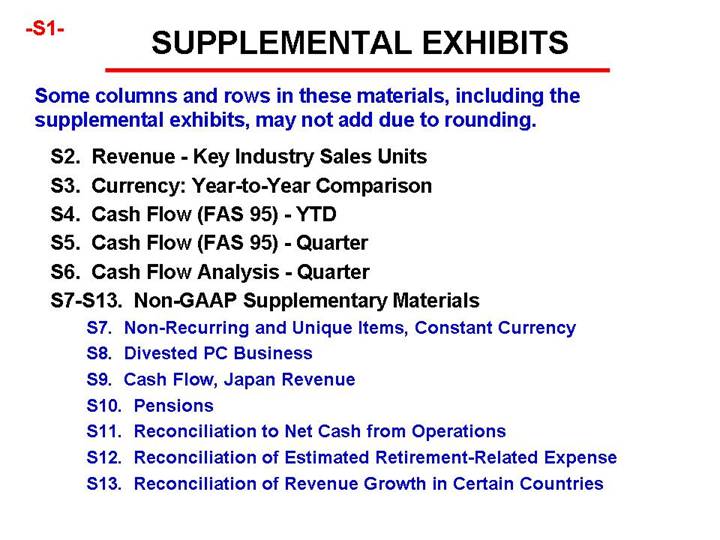
The rationale for management's use of non-GAAP measures is included as part of the supplementary materials presented within the third-quarter earnings materials. These materials are available on the IBM investor relations Web site at www.ibm.com/investor and are being included in Attachment II ("Non-GAAP Supplementary Materials") to the Form 8-K that includes this press release and is being submitted today to the SEC.
Conference Call and Webcast
IBM's regular quarterly earnings conference call is scheduled to begin at 4:30 p.m. EDT, today. Investors may participate by viewing the Webcast at www.ibm.com/investor/3q06. Presentation charts will be available on the Web site prior to the Webcast.
Financial Results Attached (amounts may not total due to rounding)
-3-
INTERNATIONAL BUSINESS MACHINES CORPORATION
COMPARATIVE FINANCIAL RESULTS
(Unaudited; Dollars in millions except per share amounts)
| | Three Months | | Nine Months | |
| | Ended September 30, | | Ended September 30, | |
| | | | | | Percent | | | | | | Percent | |
| | 2006 | | 2005* | | Change | | 2006 | | 2005* | | Change | |
REVENUE | | | | | | | | | | | | | |
Global Services | | $ | 12,017 | | $ | 11,697 | | 2.7 | % | $ | 35,478 | | $ | 35,407 | | 0.2 | % |
Gross margin | | 27.8 | % | 26.1 | % | | | 27.4 | % | 25.5 | % | | |
Hardware | | 5,583 | | 5,130 | | 8.9 | % | 15,306 | | 17,445 | | -12.3 | % |
Gross margin | | 37.7 | % | 37.1 | % | | | 35.1 | % | 32.3 | % | | |
Software | | 4,406 | | 4,059 | | 8.5 | % | 12,554 | | 11,930 | | 5.2 | % |
Gross margin | | 85.3 | % | 84.9 | % | | | 84.6 | % | 84.4 | % | | |
Global Financing | | 591 | | 600 | | -1.5 | % | 1,755 | | 1,802 | | -2.6 | % |
Gross margin | | 48.6 | % | 54.5 | % | | | 50.9 | % | 53.7 | % | | |
Other | | 20 | | 43 | | -54.5 | % | 74 | | 123 | | -39.9 | % |
Gross margin | | 8.1 | % | 29.2 | % | | | -9.1 | % | 51.5 | % | | |
TOTAL REVENUE | | 22,617 | | 21,529 | | 5.1 | % | 65,166 | | 66,707 | | -2.3 | % |
GROSS PROFIT | | 9,492 | | 8,738 | | 8.6 | % | 26,594 | | 25,767 | | 3.2 | % |
Gross margin | | 42.0 | % | 40.6 | % | | | 40.8 | % | 38.6 | % | | |
EXPENSE AND OTHER INCOME | | | | | | | | | | | | | |
S,G&A | | 5,121 | | 4,632 | | 10.5 | % | 14,639 | | 16,062 | | -8.9 | % |
% of revenue | | 22.6 | % | 21.5 | % | | | 22.5 | % | 24.1 | % | | |
R,D&E | | 1,543 | | 1,447 | | 6.6 | % | 4,520 | | 4,383 | | 3.1 | % |
% of revenue | | 6.8 | % | 6.7 | % | | | 6.9 | % | 6.6 | % | | |
Intellectual property and custom development income | | (242 | ) | (213 | ) | 13.2 | % | (659 | ) | (720 | ) | -8.4 | % |
Other (income) | | | | | | | | | | | | | |
and expense | | (174 | ) | (99 | ) | 75.9 | % | (616 | ) | (1,788 | ) | -65.6 | % |
Interest expense | | 70 | | 56 | | 24.0 | % | 207 | | 172 | | 20.6 | % |
| | | | | | | | | | | | | |
TOTAL EXPENSE AND | | | | | | | | | | | | | |
OTHER INCOME | | 6,317 | | 5,823 | | 8.5 | % | 18,091 | | 18,109 | | -0.1 | % |
% of revenue | | 27.9 | % | 27.0 | % | | | 27.8 | % | 27.1 | % | | |
| | | | | | | | | | | | | |
INCOME FROM CONTINUING | | | | | | | | | | | | | |
OPERATIONS BEFORE | | | | | | | | | | | | | |
INCOME TAXES | | 3,174 | | 2,915 | | 8.9 | % | 8,503 | | 7,658 | | 11.0 | % |
Pre-tax margin | | 14.0 | % | 13.5 | % | | | 13.0 | % | 11.5 | % | | |
Provision for income taxes | | 952 | | 1,399 | | -32.0 | % | 2,551 | | 2,884 | | -11.6 | % |
Effective tax rate | | 30.0 | % | 48.0 | % | | | 30.0 | % | 37.7 | % | | |
| | | | | | | | | | | | | |
INCOME FROM CONTINUING OPERATIONS | | $ | 2,222 | | $ | 1,516 | | 46.6 | % | $ | 5,952 | | $ | 4,774 | | 24.7 | % |
Net margin | | 9.8 | % | 7.0 | % | | | 9.1 | % | 7.2 | % | | |
DISCONTINUED OPERATIONS | | | | | | | | | | | | | |
Loss from discontinued operations | | (0 | ) | 0 | | | | (0 | ) | 27 | | | |
NET INCOME | | $ | 2,222 | | $ | 1,516 | | 46.5 | % | $ | 5,952 | | $ | 4,747 | | 25.4 | % |
EARNINGS/(LOSS)
PER SHARE OF COMMON STOCK: | | | | | | | | | | | | | |
ASSUMING DILUTION CONTINUING OPERATIONS | | $ | 1.45 | | $ | 0.94 | | 54.3 | % | $ | 3.81 | | $ | 2.92 | | 30.5 | % |
DISCONTINUED OPERATIONS | | (0.00 | ) | 0.00 | | | | (0.00 | ) | (0.02 | ) | | |
TOTAL | | $ | 1.45 | | $ | 0.94 | | 54.3 | % | $ | 3.81 | | $ | 2.90 | | 31.4 | % |
BASIC CONTINUING OPERATIONS | | $ | 1.47 | | $ | 0.95 | | 54.7 | % | $ | 3.87 | | $ | 2.97 | | 30.3 | % |
DISCONTINUED OPERATIONS | | (0.00 | ) | 0.00 | | | | (0.00 | ) | (0.02 | ) | | |
TOTAL | | $ | 1.47 | | $ | 0.95 | | 54.7 | % | $ | 3.87 | | $ | 2.95 | | 31.2 | % |
WEIGHTED-AVERAGE NUMBER | | | | | | | | | | | | | |
OF COMMON SHARES | | | | | | | | | | | | | |
OUTSTANDING (M's) | | | | | | | | | | | | | |
ASSUMING DILUTION | | 1,534.3 | | 1,617.2 | | | | 1,560.5 | | 1,635.2 | | | |
BASIC | | 1,513.2 | | 1,591.3 | | | | 1,538.6 | | 1,607.9 | | | |
* The company filed a Form 8-K with the U.S. SEC on June 13, 2006 to reclassify its historical financial statements and related footnotes to reflect changes to its management system in the first quarter of 2006.
-4-
INTERNATIONAL BUSINESS MACHINES CORPORATION
CONSOLIDATED STATEMENT OF FINANCIAL POSITION
(Unaudited)
| | At | | At | | | |
(Dollars in millions) | | September 30, | | December 31, | | Percent | |
| | 2006 | | 2005 | | Change | |
| | | | | | | |
ASSETS | | | | | | | |
| | | | | | | |
Cash, cash equivalents,
and marketable securities | | $ | 10,900 | | $ | 13,686 | | -20.4 | % |
| | | | | | | |
Receivables - net, inventories,
prepaid expenses | | 29,768 | | 31,975 | | -6.9 | % |
| | | | | | | |
Plant, rental machines,
and other property - net | | 14,059 | | 13,756 | | 2.2 | % |
| | | | | | | |
Investments and other assets | | 49,428 | | 46,331 | | 6.7 | % |
| | | | | | | |
TOTAL ASSETS | | $ | 104,155 | | $ | 105,748 | | -1.5 | % |
| | | | | | | |
LIABILITIES AND STOCKHOLDERS' EQUITY | | | | | | | |
| | | | | | | |
Short-term debt | | $ | 8,555 | | $ | 7,216 | | 18.6 | % |
Long-term debt | | 13,436 | | 15,425 | | -12.9 | % |
| | | | | | | |
Total debt | | 21,991 | | 22,641 | | -2.9 | % |
| | | | | | | |
Accounts payable, taxes,
and accruals | | 26,374 | | 27,936 | | -5.6 | % |
| | | | | | | |
Other liabilities | | 21,542 | | 22,073 | | -2.4 | % |
| | | | | | | |
TOTAL LIABILITIES | | 69,907 | | 72,650 | | -3.8 | % |
| | | | | | | |
STOCKHOLDERS' EQUITY | | 34,248 | | 33,098 | | 3.5 | % |
| | | | | | | |
TOTAL LIABILITIES AND | | | | | | | |
STOCKHOLDERS' EQUITY | | $ | 104,155 | | $ | 105,748 | | -1.5 | % |
-5-
INTERNATIONAL BUSINESS MACHINES CORPORATION
SEGMENT DATA
(Unaudited)
| | THIRD QUARTER 2006 | |
| | | | | | | | Pre-tax | | | |
| | | | | | | | Income | | | |
| | | | | | | | (Loss) | | | |
| | | | | | | | From | | | |
| | | | Revenue | | | | Continuing | | Pre-tax | |
(Dollars in millions) | | External | | Internal | | Total | | Operations | | Margin | |
| | | | | | | | | | | |
SEGMENTS | | | | | | | | | | | |
| | | | | | | | | | | |
Global Technology Services | | $ | 8,058 | | $ | 428 | | $ | 8,486 | | $ | 814 | | 9.6 | % |
% change | | 3.5 | % | -18.8 | % | 2.1 | % | -6.4 | % | | |
| | | | | | | | | | | |
Global Business Services | | 3,959 | | 337 | | 4,295 | | 405 | | 9.4 | % |
% change | | 1.2 | % | 0.6 | % | 1.2 | % | 40.8 | % | | |
| | | | | | | | | | | |
Systems and Technology | | | | | | | | | | | |
Group | | 5,466 | | 255 | | 5,721 | | 413 | | 7.2 | % |
% change | | 9.6 | % | -5.0 | % | 8.8 | % | 13.1 | % | | |
| | | | | | | | | | | |
Software | | 4,406 | | 559 | | 4,965 | | 1,302 | | 26.2 | % |
% change | | 8.5 | % | 15.1 | % | 9.2 | % | 15.2 | % | | |
| | | | | | | | | | | |
Global Financing | | 587 | | 337 | | 924 | | 335 | | 36.2 | % |
% change | | -2.1 | % | 16.7 | % | 4.0 | % | -7.9 | % | | |
| | | | | | | | | | | |
Personal Computing | | | | | | | | | | | |
Division | | 0 | | 0 | | 0 | | 0 | | 0.0 | % |
| | | | | | | | | | | |
TOTAL REPORTABLE SEGMENTS | | 22,476 | | 1,916 | | 24,391 | | 3,268 | | 13.4 | % |
% change | | 5.3 | % | 0.6 | % | 4.9 | % | 8.4 | % | | |
| | | | | | | | | | | |
Eliminations / Other | | 141 | | (1,916 | ) | (1,774 | ) | (94 | ) | | |
| | | | | | | | | | | |
TOTAL IBM CONSOLIDATED | | $ | 22,617 | | $ | 0 | | $ | 22,617 | | $ | 3,174 | | 14.0 | % |
% change | | 5.1 | % | | | 5.1 | % | 8.9 | % | | |
-6-
| | THIRD QUARTER 2005* | |
| | | | | | | | Pre-tax | | | |
| | | | | | | | Income | | | |
| | | | | | | | (Loss) | | | |
| | | | | | | | From | | | |
| | | | Revenue | | | | Continuing | | Pre-tax | |
(Dollars in millions) | | External | | Internal | | Total | | Operations | | Margin | |
| | | | | | | | | | | |
SEGMENTS | | | | | | | | | | | |
| | | | | | | | | | | |
Global Technology Services | | $ | 7,787 | | $ | 526 | | $ | 8,313 | | $ | 871 | | 10.5 | % |
| | | | | | | | | | | |
Global Business Services | | 3,910 | | 335 | | 4,245 | | 288 | | 6.8 | % |
| | | | | | | | | | | |
Systems and Technology | | | | | | | | | | | |
Group | | 4,988 | | 268 | | 5,256 | | 365 | | 6.9 | % |
| | | | | | | | | | | |
Software | | 4,059 | | 486 | | 4,545 | | 1,130 | | 24.9 | % |
| | | | | | | | | | | |
Global Financing | | 599 | | 289 | | 888 | | 363 | | 40.9 | % |
| | | | | | | | | | | |
Personal Computing | | | | | | | | | | | |
Division | | 0 | | 0 | | 0 | | 0 | | 0.0 | % |
| | | | | | | | | | | |
TOTAL REPORTABLE SEGMENTS | | 21,343 | | 1,904 | | 23,247 | | 3,017 | | 13.0 | % |
| | | | | | | | | | | |
Eliminations / Other | | 186 | | (1,904 | ) | (1,719 | ) | (101 | ) | | |
| | | | | | | | | | | |
TOTAL IBM CONSOLIDATED | | $ | 21,529 | | $ | 0 | | $ | 21,529 | | $ | 2,915 | | 13.5 | % |
* The company filed a Form 8-K with the U.S. SEC on June 13, 2006 to reclassify its financial statements and related footnotes to reflect changes to its management system effective as of the first quarter of 2006, including the separation of the Global Services segment into two new reportable segments: Global Technology Services and Global Business Services, as well as the reclassification of Enterprise Investments to other reportable segments.
-7-
INTERNATIONAL BUSINESS MACHINES CORPORATION
SEGMENT DATA
(Unaudited)
| | NINE MONTHS 2006 | |
| | | | | | | | Pre-tax | | | |
| | | | | | | | Income | | | |
| | | | | | | | (Loss) | | | |
| | | | | | | | From | | | |
| | | | Revenue | | | | Continuing | | Pre-tax | |
(Dollars in millions) | | External | | Internal | | Total | | Operations | | Margin | |
| | | |
SEGMENTS | | | | | | | | | | | |
Global Technology Services | | $ | 23,732 | | $ | 1,328 | | $ | 25,061 | | $ | 2,445 | | 9.8 | % |
% change | | 1.1 | % | -18.8 | % | -0.2 | % | 61.5 | % | | |
Global Business Services | | 11,746 | | 1,023 | | 12,769 | | 1,168 | | 9.1 | % |
% change | | -1.5 | % | -0.8 | % | -1.5 | % | 207.5 | % | | |
Systems and Technology Group | | 14,900 | | 807 | | 15,706 | | 582 | | 3.7 | % |
% change | | 5.4 | % | 5.7 | % | 5.4 | % | -13.7 | % | | |
Software | | 12,554 | | 1,616 | | 14,170 | | 3,478 | | 24.5 | % |
% change | | 5.2 | % | 13.6 | % | 6.1 | % | 22.3 | % | | |
Global Financing | | 1,744 | | 1,039 | | 2,784 | | 1,068 | | 38.4 | % |
% change | | -3.0 | % | 2.6 | % | -1.0 | % | -2.3 | % | | |
Personal Computing Division | | 0 | | 0 | | 0 | | 0 | | nm | |
% change | | nm | | nm | | nm | | nm | | | |
TOTAL REPORTABLE SEGMENTS | | 64,676 | | 5,814 | | 70,490 | | 8,741 | | 12.4 | % |
% change | | -2.2 | % | -1.5 | % | -2.2 | % | 37.9 | % | | |
Eliminations / Other | | 491 | | (5,814 | ) | (5,323 | ) | (239 | ) | | |
TOTAL IBM CONSOLIDATED | | $ | 65,166 | | $ | 0 | | $ | 65,166 | | $ | 8,503 | | 13.0 | % |
% change | | -2.3 | % | | | -2.3 | % | 11.0 | % | | |
| | NINE MONTHS 2005* | |
| | | | | | | | Pre-tax | | | |
| | | | | | | | Income | | | |
| | | | | | | | (Loss) | | | |
| | | | | | | | From | | | |
| | | | Revenue | | | | Continuing | | Pre-tax | |
(Dollars in millions) | | External | | Internal | | Total | | Operations | | Margin | |
| | | |
SEGMENTS | | | | | | | | | | | |
Global Technology Services | | $ | 23,481 | | $ | 1,636 | | $ | 25,117 | | $ | 1,514 | | 6.0 | % |
Global Business Services | | 11,926 | | 1,032 | | 12,958 | | 380 | | 2.9 | % |
Systems and Technology Group | | 14,132 | | 763 | | 14,895 | | 674 | | 4.5 | % |
Software | | 11,930 | | 1,423 | | 13,353 | | 2,844 | | 21.3 | % |
Global Financing | | 1,798 | | 1,013 | | 2,811 | | 1,092 | | 38.8 | % |
Personal Computing Division | | 2,876 | | 33 | | 2,909 | | (165 | ) | nm | |
TOTAL REPORTABLE SEGMENTS | | 66,143 | | 5,899 | | 72,042 | | 6,340 | | 8.8 | % |
Eliminations / Other | | 565 | | (5,899 | ) | (5,335 | ) | 1,319 | | | |
TOTAL IBM CONSOLIDATED | | $ | 66,707 | | $ | 0 | | $ | 66,707 | | $ | 7,658 | | 11.5 | % |
nm - not meaningful
* The company filed a Form 8-K with the U.S. SEC on June 13, 2006 to reclassify its financial statements and related footnotes to reflect changes to its management system effective as of the first quarter of 2006, including the separation of the Global Services segment into two new reportable segments: Global Technology Services and Global Business Services, as well as the reclassification of Enterprise Investments to other reportable segments.
-8-