UNITED STATES
SECURITIES AND EXCHANGE COMMISSION
WASHINGTON, D.C. 20549
FORM 8-K
CURRENT REPORT PURSUANT TO SECTION 13 OR 15 (d)
OF THE SECURITIES EXCHANGE ACT OF 1934
Date of Report: January 18, 2007
(Date of earliest event reported)
INTERNATIONAL BUSINESS MACHINES
CORPORATION
(Exact name of registrant as specified in its charter)
New York |
| 1-2360 |
| 13-0871985 |
(State of Incorporation) |
| (Commission File Number) |
| (IRS employer Identification No.) |
ARMONK, NEW YORK |
| 10504 |
(Address of principal executive offices) |
| (Zip Code) |
914-499-1900
(Registrant’s telephone number)
Check the appropriate box below if the Form 8-K filing is intended to simultaneously satisfy the filing obligation of the registrant under any of the following provisions:
o Written communications pursuant to Rule 425 under the Securities Act (17 CFR 230.425)
o Soliciting material pursuant to Rule 14a-12 under the Exchange Act (17 CFR 240.14a-12)
o Pre-commencement communications pursuant to Rule 14d-2(b) under the Exchange Act (17 CFR 240.14d-2(b))
o Pre-commencement communications pursuant to Rule 13e-4(c) under the Exchange Act (17 CFR 240.13e-4(c))
Item 2.02. Results of Operations and Financial Condition.
The registrant’s press release dated January 18, 2007 regarding its financial results for the periods ended December 31, 2006, including consolidated financial statements for the periods ended December 31, 2006, is Attachment I of this Form 8-K. Attachment II are the charts for IBM’s Chief Financial Officer Mark Loughridge’s fourth quarter earnings presentation on January 18, 2007, as well as certain reconciliation and other information (“Non-GAAP Supplementary Materials”) for information in Attachment I (press release), Attachment II (charts) and in Mr. Loughridge’s presentation.
Attachment I (Press Release):
The following statement on Page 1:
“Income from continuing operations for the fourth quarter grew 2 percent compared with the fourth-quarter 2005 income from continuing operations of $3.4 billion, excluding the one-time charge.”
The following statements on Page 2:
“Total revenues of $91.4 billion, up 4 percent excluding the divested PC business;”
“or up 9 percent excluding 2005 non-recurring items;”
The following statements on Page 3:
“Excluding the non-recurring items and tax charge for 2005, the growth for income from continuing operations was 9 percent year over year.”
“Excluding the divested PC business, revenues increased 4 percent (3 percent, adjusting for currency) compared with the 2005 period.”
“(4 percent, adjusting for currency and PCs)”
“(up 2 percent, adjusting for currency and PCs)”
“(up 2 percent, adjusting for currency and PCs)”
Attachment II (Charts):
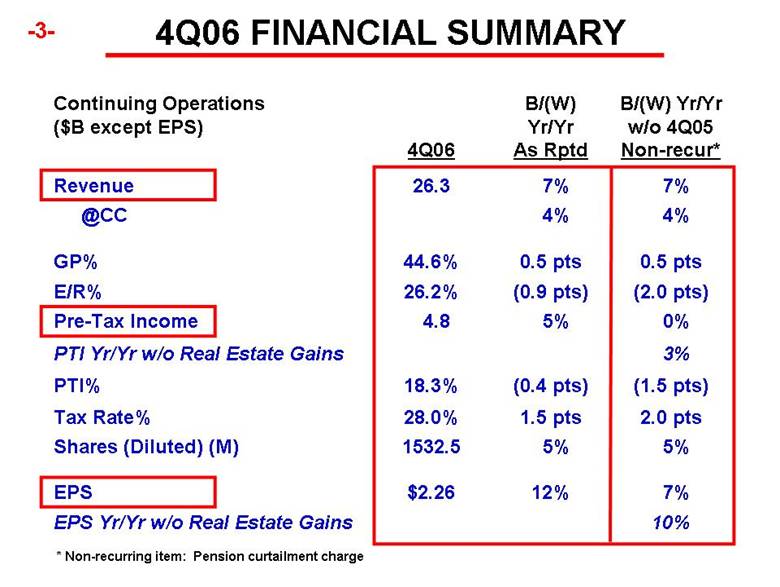
In the chart on Page 3 (4Q06 Financial Summary), the data in the column entitled “B/(W) Yr/Yr w/o 4Q05 Non-recur*” for the rows identified as “E/R%,” “Pre-Tax Income,” “PTI Yr/Yr w/o Real Estate Gains,” “PTI%,” and “Tax Rate%”.
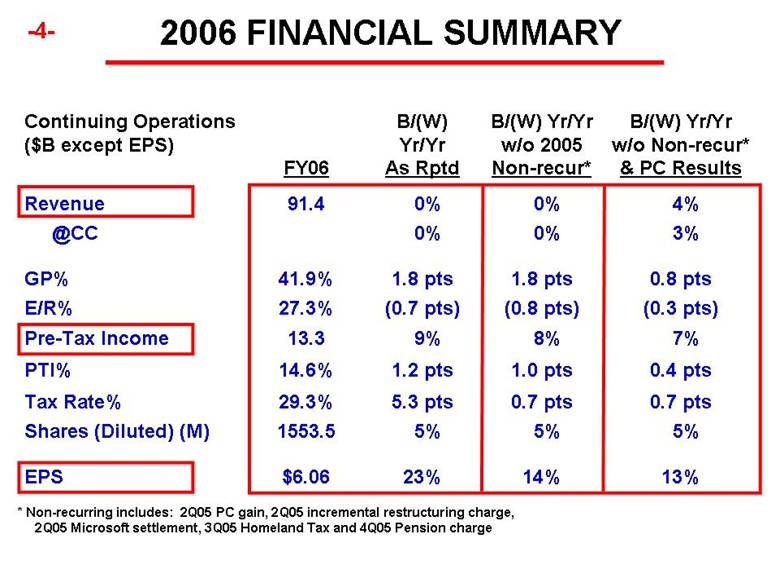
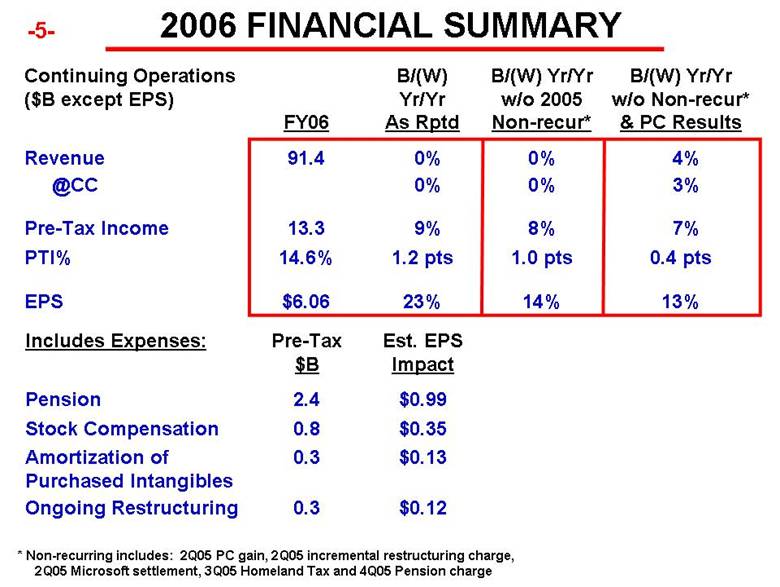
In the chart on Page 4 (2006 Financial Summary):
- the data in the column entitled “B/(W) Yr/Yr w/o 2005 Non-recur*” for the rows identified as “E/R%,” “Pre-Tax Income,” “PTI%,” and “Tax Rate%”
- the data in the column entitled “B/(W) Yr/Yr w/o Non-recur* & PC Results” for the rows identified as “Revenue”, “@CC”, “GP%,” “E/R%,” “Pre-Tax Income,” “PTI%,” and “Tax Rate%”.
In the chart on Page 5 (2006 Financial Summary):
- the data in the column entitled “B/(W) Yr/Yr w/o 2005 Non-recur*” for the rows identified as “Pre-Tax Income” and “PTI%”.
- the data in the column entitled “B/(W) Yr/Yr w/o Non-recur* & PC Results” for the rows identified as “Revenue”, “@CC”, “Pre-Tax Income” and “PTI%.”
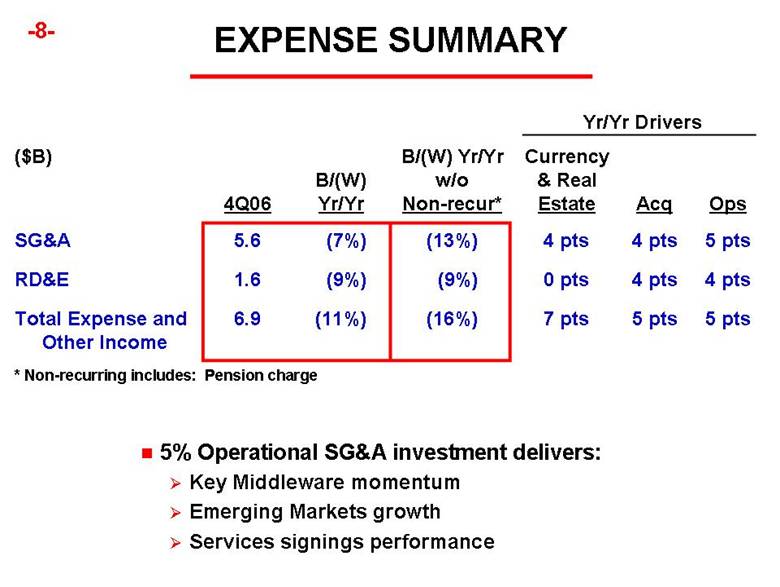
In the chart on Page 8 (Expense Summary), the data in the column entitled “B/(W) Yr/Yr w/o Non-recur*” for the rows identified as “SG&A” and “Total Expense and Other Income”.
On Page 16, the statement “34% Return on Invested Capital for core business.”
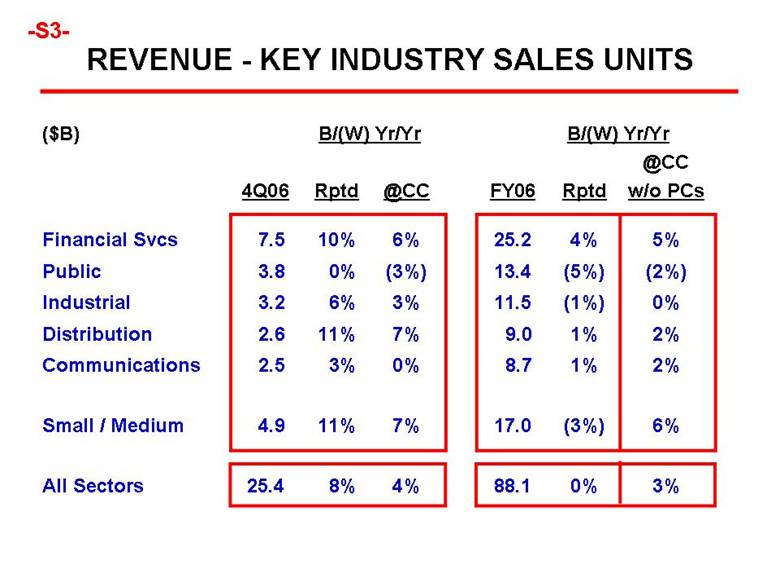
In the chart on Page S3 (Revenue - Key Industry Sales Units), all the data in the column entitled “@CC w/o PCs”.
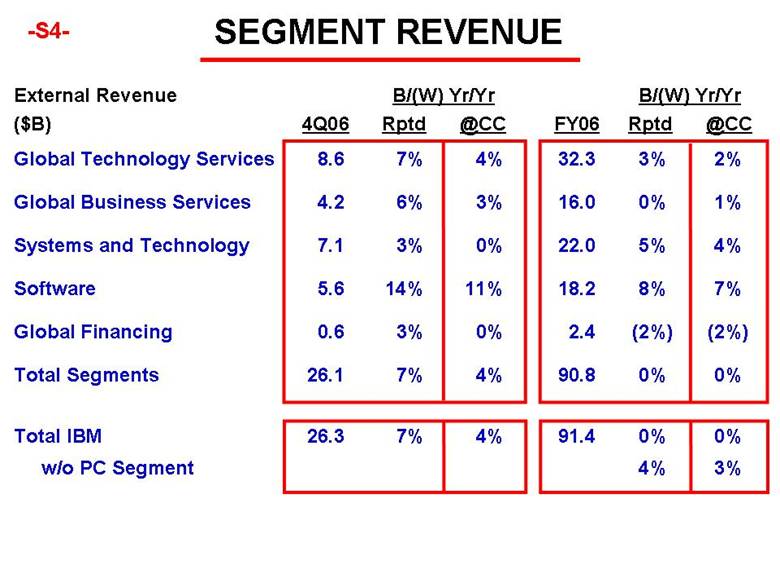
In the chart on Page S4 (Segment Revenue), all the data in the row identified as “w/o PC segment.”
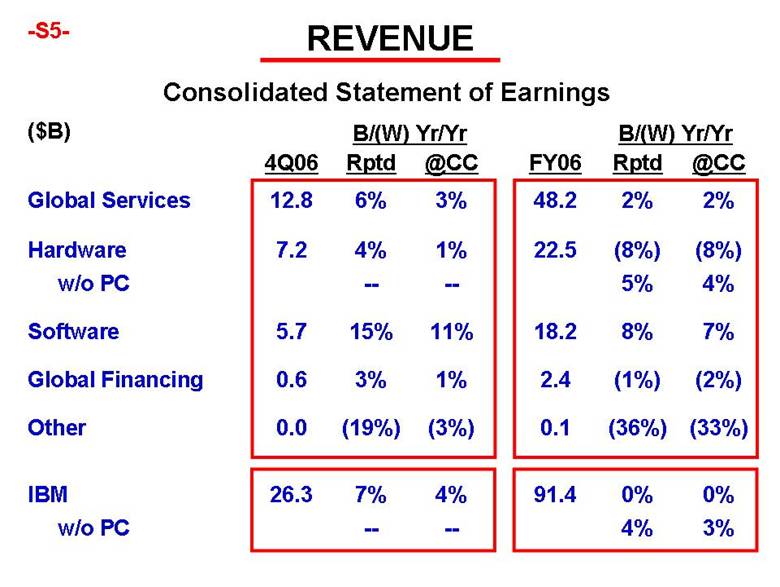
In the chart on Page S5 (Revenue), all the data in the two rows identified as “w/o PC.”
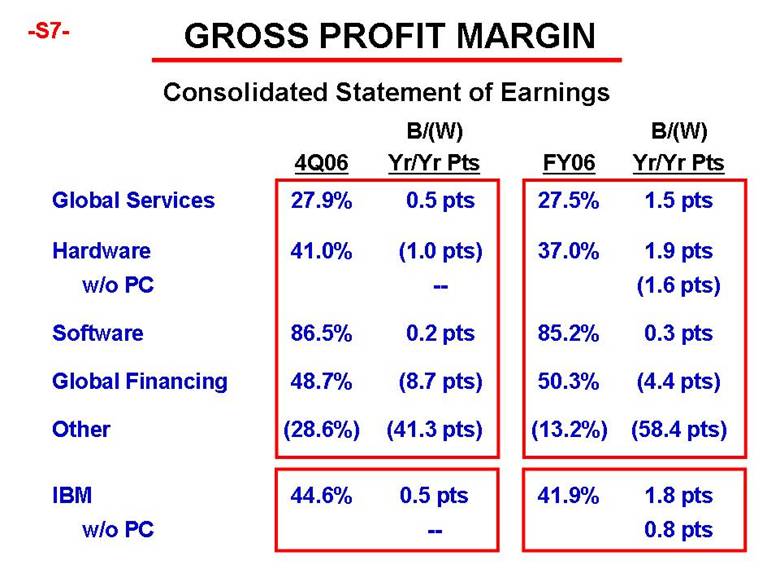
In the chart on Page S7 (Gross Profit Margin), all the data in the column entitled “B/(W) Yr/Yr Pts” for the two rows identified as “w/o PC.”
In the chart on Page S8 (Expense Summary):
- all the data in the column entitled “B/(W) Yr/Yr w/o Charge*” for the rows identified as “SG&A”, “Total Expense and Other Income” and “E/R%”.
- all the data in the column entitled “B/(W) Yr/Yr w/o Charges**” for the rows identified as “SG&A”, “Other Income and Expense”, the two rows identified as “w/o PCs” and the row identified as “E/R%”.
In the chart on Page S9, the amounts referenced for 2004 and 2005.
All of the information in Attachments I and II is hereby filed except for the information set forth below, which is furnished but not filed.
IBM’s web site (www.ibm.com) contains a significant amount of information about IBM, including financial and other information for investors (www.ibm.com/investor/). IBM encourages investors to visit its various web sites from time to time, as information is updated and new information is posted.
SIGNATURE
Pursuant to the requirements of the Securities Exchange Act of 1934, the registrant has duly caused this report to be signed on its behalf by the undersigned, hereunto duly authorized.
Date: January 18, 2007 |
|
|
|
|
|
| By: | /s/ Timothy S. Shaughnessy |
|
| Timothy S. Shaughnessy |
|
| Vice President and Controller |
ATTACHMENT I
IBM REPORTS 2006 FOURTH-QUARTER RESULTS
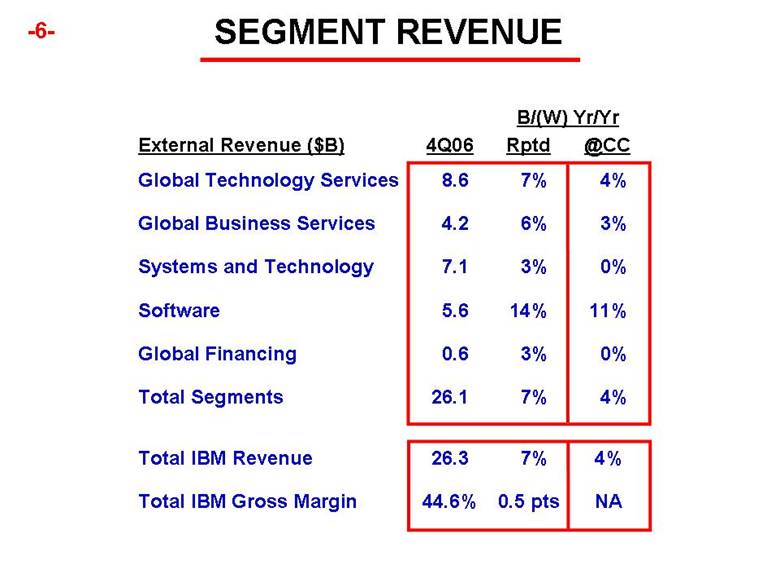
· Total revenues of $26.3 billion, up 7 percent as reported;
· Diluted earnings of $2.26 per share from continuing operations, up 12 percent as reported, or 7 percent compared with the fourth-quarter 2005, excluding pension curtailment charge;
· Services signings of $17.8 billion, up 55 percent.
ARMONK, N.Y., January 18, 2007 . . . IBM today announced fourth-quarter 2006 diluted earnings of $2.26 per share from continuing operations, an increase of 12 percent as reported, compared with diluted earnings of $2.01 per share in the fourth quarter of 2005; the fourth-quarter 2005 diluted earnings include $0.10 per share for a one-time pretax curtailment charge of $267 million related to pension changes. Diluted earnings per share for the fourth-quarter 2006 grew 7 percent compared with the year-ago quarter of $2.11 per diluted share, without the one-time per share charge. Fourth-quarter 2006 diluted earnings per share include a $0.06 benefit as a result of a lower tax rate.
Fourth-quarter income from continuing operations was $3.5 billion compared with $3.2 billion in the fourth quarter of 2005, an increase of 8 percent. Income from continuing operations for the fourth quarter grew 2 percent compared with the fourth-quarter 2005 income from continuing operations of $3.4 billion, excluding the one-time charge. Total revenues for the fourth quarter of 2006 of $26.3 billion increased 7 percent (4 percent, adjusting for currency) from the fourth quarter of 2005.
Samuel J. Palmisano, IBM chairman, president and chief executive officer, said: "IBM had a terrific quarter and a good year with record cash performance, profit and EPS, as well as record payouts to shareholders. We are well-positioned in the growth areas of a changing IT industry, focused on our evolving business model, and poised for long-term success for our clients and shareholders."
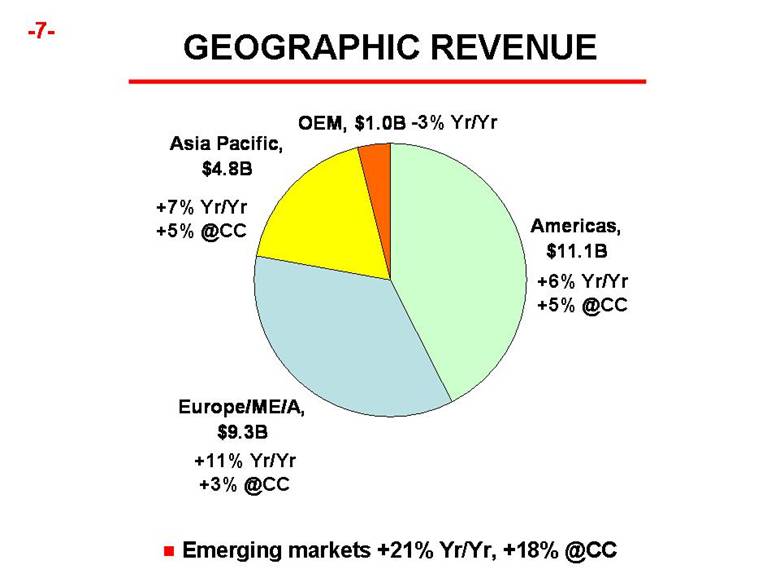
From a geographic perspective, the Americas fourth-quarter revenues were $11.1 billion, an increase of 6 percent as reported (5 percent, adjusting for currency) from the 2005 period. Revenues from Europe/Middle East/Africa were $9.3 billion, up 11 percent (3 percent, adjusting for currency). Asia-Pacific revenues increased 7 percent (5 percent, adjusting for currency) to $4.8 billion. OEM revenues were $1.0 billion, down 3 percent compared with the 2005 fourth quarter.
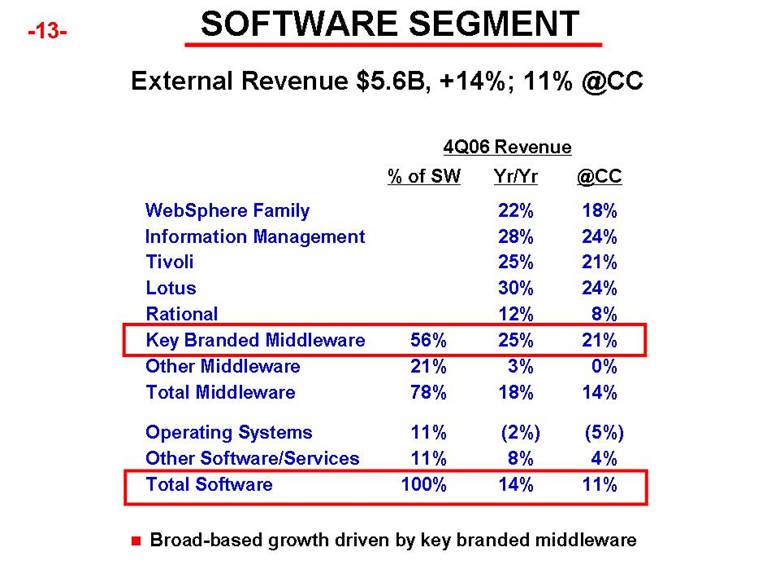
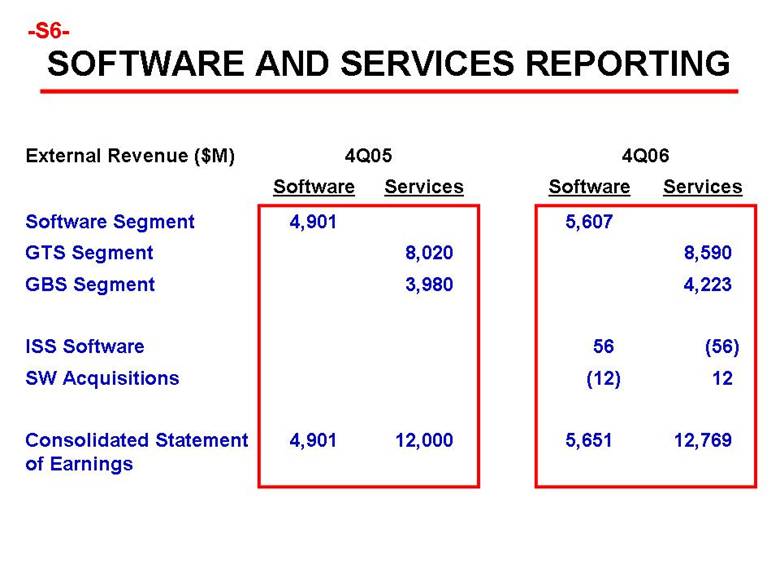
Revenues from the Software segment were $5.6 billion, an increase of 14 percent (11 percent, adjusting for currency) compared with the fourth quarter of 2005. Revenues from IBM's middleware brands, which include WebSphere, Information Management, Tivoli, Lotus and Rational products, were $4.4 billion, up 18 percent versus the fourth quarter of 2005. Operating systems revenues decreased 2 percent to $642 million compared with the prior-year quarter. Revenues from other software and services increased, which includes the Product Lifecycle Management portfolio of products.
For the WebSphere family of software products, which facilitate customers' ability to manage a wide variety of business processes using open standards to interconnect applications, data and operating systems, revenues increased 22 percent. Revenues for Information Management software, which enables clients to leverage information on demand, increased 28 percent. Revenues from Tivoli software, infrastructure software that enables customers to centrally manage networks including security and storage capability, increased 25 percent, and revenues for Lotus software, which allows collaborating and messaging by customers in real-time communication and knowledge anagement, increased 30 percent year over year. Revenues from Rational software, integrated tools to improve the processes of software development, increased 12 percent compared with the year-ago quarter.
1
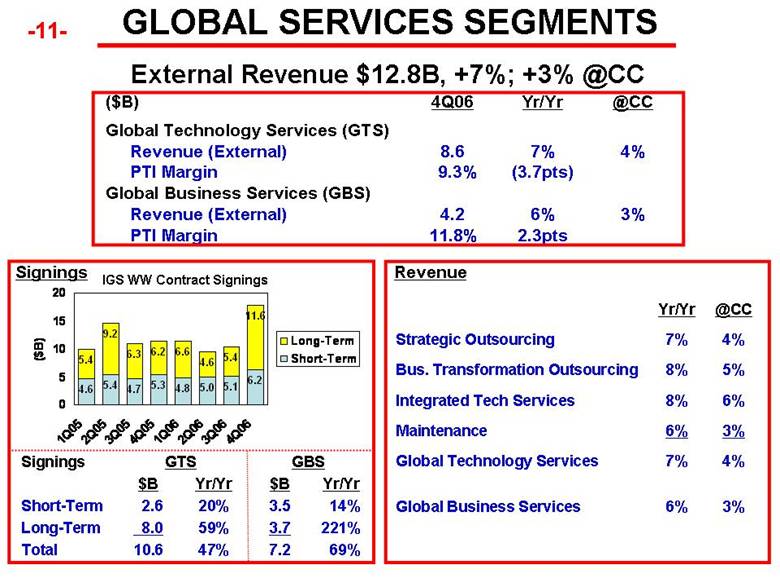
For the Global Services business, segment revenues from Global Technology Services increased 7 percent (4 percent, adjusting for currency) to $8.6 billion, and segment revenues from Global Business Services increased 6 percent (3 percent, adjusting for currency) to $4.2 billion. IBM signed services contracts totaling $17.8 billion, up 55 percent year over year, and ended the full year with an estimated services backlog, including Strategic Outsourcing, Business Transformation Outsourcing, Global Business Services, Integrated Technology Services and Maintenance, of $116 billion, an increase of $5 billion from the prior-year period.
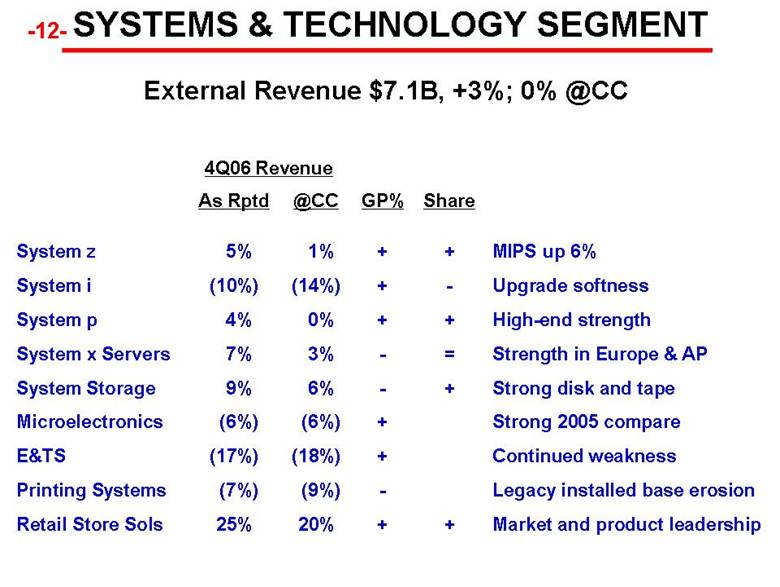
Revenues from the Systems and Technology Group (S&TG) segment totaled $7.1 billion for the quarter, up 3 percent (flat, adjusting for currency). S&TG revenues from System z server products increased 5 percent compared with the year-ago period. Total delivery of System z computing power, which is measured in MIPS (millions of instructions per second), increased 6 percent. Revenues from the System p UNIX server products increased 4 percent compared with the 2005 period. Revenues from the System x servers increased 7 percent, and revenues from the System i servers decreased 10 percent. Revenues from Microelectronics decreased 6 percent and revenues from System Storage increased 9 percent.
Global Financing segment revenues increased 3 percent (flat, adjusting for currency) in the fourth quarter to $620 million.
The company's total gross profit margin was 44.6 percent in the 2006 fourth quarter compared with 44.1 percent in the 2005 period.
Total expense and other income increased 11 percent to $6.9 billion compared with the prior-year period. SG&A expense increased 7 percent to $5.6 billion. RD&E expense increased 9 percent compared with the year-ago period. Intellectual property and custom development income increased to $241 million compared with $228 million a year ago. Other (income) and expense contributed income of $150 million in the fourth quarter of 2006 versus income of $334 million in the fourth quarter of 2005. In the fourth quarter of last year, gains on real estate transactions were unusually high due to several large transactions compared with real estate activity in the fourth quarter of this year, resulting in a decrease of $140 million year to year.
IBM's effective tax rate in the fourth-quarter 2006 was 28.0 percent compared with 29.5 percent in the fourth quarter of 2005. The decrease in the tax rate was caused by the favorable effect of several items in the quarter, including the retroactive reinstatement of the U.S. research tax credit and changes in the mix of income in various tax jurisdictions.
For total operations, net income for the fourth-quarter 2006 was $3.5 billion, or $2.31 per diluted share, which included a gain from discontinued operations related to country tax settlements of $76 million, compared with the fourth quarter of 2005 net income of $3.2 billion, or $1.99 per diluted share, which included a gain from discontinued operations of $3 million and a charge for the cumulative effect of the FASB Interpretation No. 47 accounting change of $36 million.
Share repurchases totaled approximately $1.4 billion in the fourth quarter. The weighted-average number of diluted common shares outstanding in the fourth-quarter 2006 was 1.53 billion compared with 1.60billion shares in the same period of 2005.
Full-Year 2006 Results
· Total revenue of $91.4 billion, up 4 percent excluding the divested PC business;
· Income from continuing operations of $9.4 billion, up 18 percent as reported, or up 9 percent excluding 2005 non-recurring items;
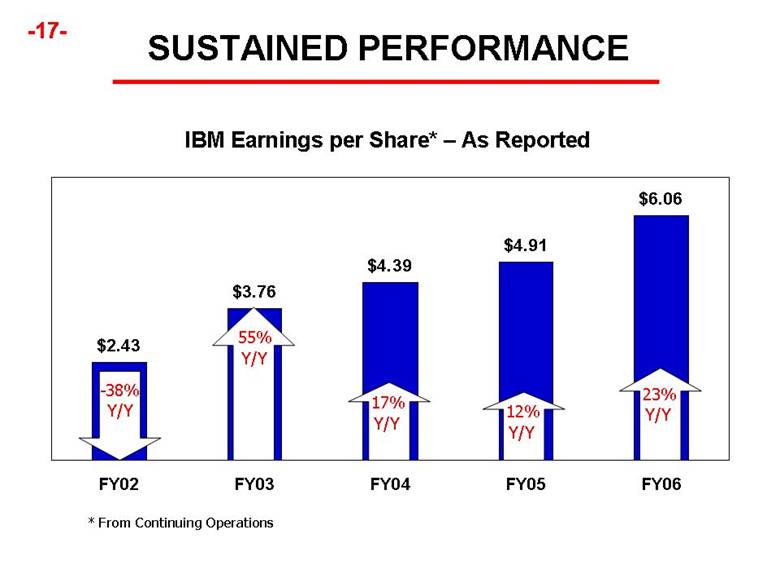
· Diluted earnings of $6.06 per share from continuing operations, up 23 percent as reported, or up 14 percent excluding 2005 non-
2
recurring items;
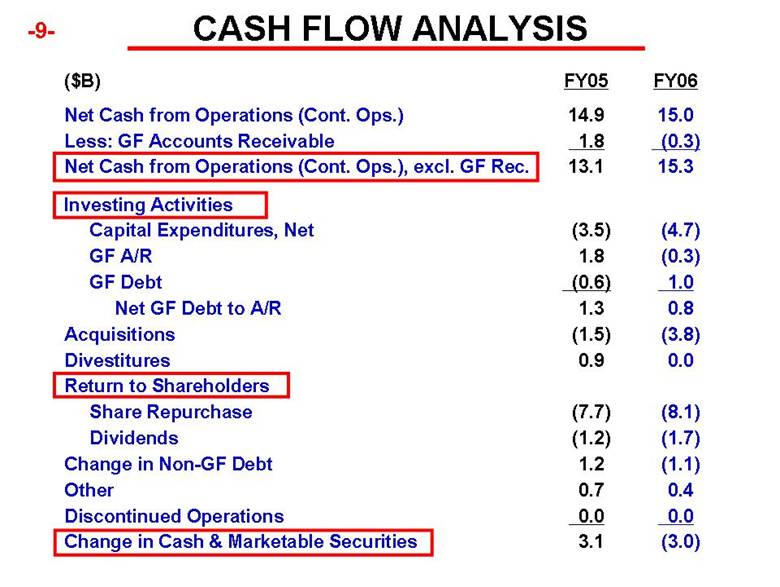
· Net cash from operations of $15.3 billion, up $2.2 billion, excluding Global Financing receivables.
Diluted earnings per share from continuing operations were $6.06 compared with $4.91 per diluted share for the 2005 period, including $0.40 per diluted share for the one-time items, an increase of 23 percent. Without the one-time items in 2005, diluted earnings in 2006 increased $0.74 per share, or 14 percent versus the comparable period last year.
Income from continuing operations for the year ended December 31, 2006 was $9.4 billion, compared with $8.0 billion in the year-ago period, or up 18 percent, which includes a charge of $525 million for taxes in connection with the 2005 repatriation of foreign earnings, and non- recurring pretax items for a curtailment charge of $267 million relating to the pension change and incremental restructuring charges of $1.7 billion, offset by the $1.1 billion gain on the sale of the Personal Computing (PC) business, and the $775 million legal settlement received from Microsoft. Excluding the non-recurring items and tax charge for 2005, the growth for income from continuing operations was 9 percent year over year.
Revenues from continuing operations for 2006 totaled $91.4 billion, essentially flat as reported and adjusting for currency compared with $91.1 billion for 2005, which includes PC revenues of $2.9 billion for the first four months of 2005 only. Excluding the divested PC business, revenues increased 4 percent (3 percent, adjusting for currency) compared with the 2005 period.
From a geographic perspective, the Americas full-year revenues were $39.5 billion, an increase of 2 percent as reported (4 percent, adjusting for currency and PCs) from the 2005 period. Revenues from Europe/Middle East/Africa were $30.5 billion, essentially flat (up 2 percent, adjusting for currency and PCs). Asia-Pacific revenues decreased 6 percent (up 2 percent, adjusting for currency and PCs) to $17.6 billion. OEM revenues were $3.9 billion, up 18 percent compared with 2005.
Software segment revenues in 2006 totaled $18.2 billion, an increase of 8 percent (7 percent, adjusting for currency). Revenues from the Global Technology Services segment totaled $32.3 billion, an increase of 3 percent (2 percent, adjusting for currency) compared with 2005. Revenues from the Global Business Services segment were $16.0 billion, flat (up 1 percent, adjusting for currency). S&TG segment revenues were $22.0 billion, an increase of 5 percent (4 percent, adjusting for currency). Global Financing revenues totaled $2.4 billion, a decrease of 2 percent (2 percent, adjusting for currency).
For total operations, net income for 2006 was $9.5 billion, or $6.11 per diluted share, which included a gain from discontinued operations related to country tax settlements of $76 million, compared with the 2005 net income of $7.9 billion, or $4.87 per diluted share, which included a loss from discontinued operations of $24 million and a charge for the cumulative effect of the FASB Interpretation No. 47 accounting change of $36 million.
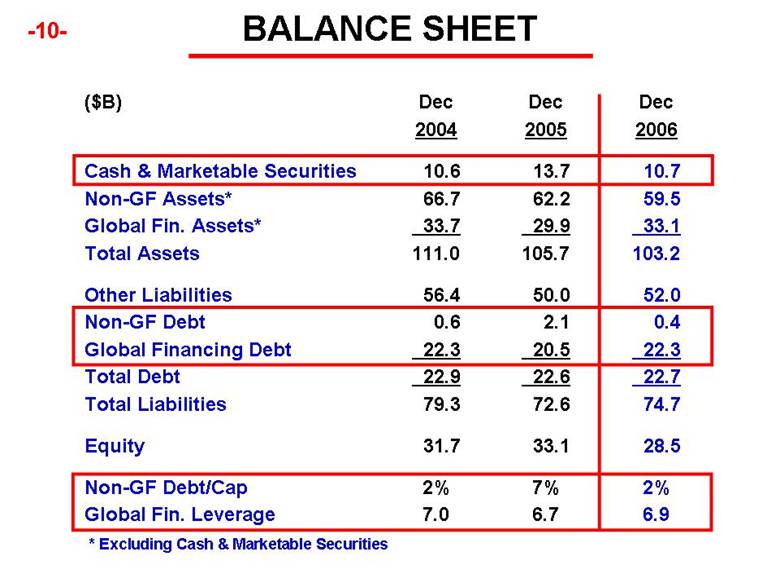
IBM ended 2006 with $10.7 billion of cash on hand and net cash provided from operations, excluding the year-to-year change in Global Financing receivables, was $15.3 billion - an increase of $2.2 billion from last year. The balance sheet remains strong, and the company is well positioned to take advantage of opportunities.
In December, the company adopted Statement of Financial Accounting Standards No. 158 (SFAS 158), new accounting guidance related to pension and other postretirement plans released by the Financial Accounting Standards Board in September 2006. This accounting standard requires companies to recognize the funded status of their postretirement plans in the statement of financial position (or balance sheet). The funded status is measured as the difference
3
between the value of pension plan assets and the company's benefit obligations to its current and retired employees. The adoption of SFAS 158 at December 31, 2006 reduced the company's assets by $9.2 billion, increased its liabilities by $0.3 billion and reduced stockholders' equity by $9.5 billion. These changes to the company's financial statements were non-cash and will have no impact on the company's existing debt covenants, credit ratings or financial flexibility.
Share repurchases totaled approximately $8.0 billion in 2006. The weighted-average number of diluted common shares outstanding in 2006 was 1.55 billion compared with 1.63 billion shares in 2005. As of December 31, 2006, there were 1.51 billion basic common shares outstanding.
Debt, including Global Financing, totaled $22.7 billion, compared with $22.6 billion at year-end 2005. From a management segment view, the non-global financing debt-to-capitalization ratio was 1.5 percent at the end of 2006, and Global Financing debt increased $1.8 billion from year-end 2005 to a total of $22.3 billion, resulting in a debt-to- equity ratio of 6.9 to 1.
Forward-Looking and Cautionary Statements
Except for the historical information and discussions contained herein, statements contained in this release may constitute forward-looking statements within the meaning of the Private Securities Litigation Reform Act of 1995. These statements involve a number of risks, uncertainties and other factors that could cause actual results to differ materially, including the company's failure to continue to develop and market new and innovative products and services and to keep pace with technological change; competitive pressures; failure to obtain or protect intellectual property rights; quarterly fluctuations in revenues and volatility of stock prices; the company's ability to attract and retain key personnel; adverse affects from tax matters; currency fluctuations and customer financing risks; customer credit risk on trade receivables; the company's failure to maintain the adequacy of its internal controls; the company's use of certain estimates and assumptions; dependence on certain suppliers; changes in the financial or business condition of the company's distributors or resellers; the company's ability to successfully manage acquisitions and alliances; failure to have sufficient insurance; legal, political, health and economic conditions; risk factors related to IBM securities; and other risks, uncertainties and factors discussed in the company's Form 10-Q, Form 10-K and in the company's other filings with the U.S. Securities and Exchange Commission (SEC) or in materials incorporated therein by reference. The company assumes no obligation to update or revise any forward-looking statements.
Presentation of Information in this Press Release
In an effort to provide investors with additional information regarding the company's results as determined by generally accepted accounting principles (GAAP), the company has also disclosed in this press release the following non-GAAP information which management believes provides useful information to investors:
IBM Results:
· without non-recurring and unique items;
· without divested PC business;
· adjusting for currency (i.e., at constant current);
· net cash from operations excluding Global Financing receivables.
The rationale for management's use of non-GAAP measures is included as part of the supplementary materials presented within the fourth-quarter earnings materials. These materials are available on the IBM investor relations Web site at www.ibm.com/investor and are being
4
included in Attachment II ("Non-GAAP Supplementary Materials") to the Form 8-K that includes this press release and is being submitted today to the SEC.
Conference Call and Webcast
IBM's regular quarterly earnings conference call is scheduled to begin at 4:30 p.m. EST, today. Investors may participate by viewing the Webcast at www.ibm.com/investor/4q06. Presentation charts will be available on the Web site prior to the Webcast.
Financial Results Attached (amounts may not total due to rounding)
INTERNATIONAL BUSINESS MACHINES CORPORATION
COMPARATIVE FINANCIAL RESULTS
(Dollars in millions except per share amounts)
|
| Three Months |
| Twelve Months |
| ||||||||||||
|
| Ended December 31, |
| Ended December 31, |
| ||||||||||||
|
|
|
|
|
| Percent |
|
|
|
|
| Percent |
| ||||
|
| 2006 |
| 2005* |
| Change |
| 2006 |
| 2005* |
| Change |
| ||||
REVENUE |
|
|
|
|
|
|
|
|
|
|
|
|
| ||||
|
|
|
|
|
|
|
|
|
|
|
|
|
| ||||
Global Services |
| $ | 12,769 |
| $ | 12,000 |
| 6.4 | % | $ | 48,247 |
| $ | 47,407 |
| 1.8 | % |
Gross margin |
| 27.9 | % | 27.4 | % |
|
| 27.5 | % | 26.0 | % |
|
| ||||
|
|
|
|
|
|
|
|
|
|
|
|
|
| ||||
Hardware |
| 7,193 |
| 6,897 |
| 4.3 | % | 22,499 |
| 24,343 |
| -7.6 | % | ||||
Gross margin |
| 41.0 | % | 42.0 | % |
|
| 37.0 | % | 35.1 | % |
|
| ||||
|
|
|
|
|
|
|
|
|
|
|
|
|
| ||||
Software |
| 5,651 |
| 4,901 |
| 15.3 | % | 18,204 |
| 16,830 |
| 8.2 | % | ||||
Gross margin |
| 86.5 | % | 86.3 | % |
|
| 85.2 | % | 84.9 | % |
|
| ||||
|
|
|
|
|
|
|
|
|
|
|
|
|
| ||||
Global Financing |
| 625 |
| 605 |
| 3.3 | % | 2,379 |
| 2,407 |
| -1.1 | % | ||||
Gross margin |
| 48.7 | % | 57.4 | % |
|
| 50.3 | % | 54.7 | % |
|
| ||||
|
|
|
|
|
|
|
|
|
|
|
|
|
| ||||
Other |
| 19 |
| 24 |
| -18.6 | % | 94 |
| 147 |
| -36.4 | % | ||||
Gross margin |
| -28.6 | % | 12.6 | % |
|
| -13.2 | % | 45.2 | % |
|
| ||||
|
|
|
|
|
|
|
|
|
|
|
|
|
| ||||
TOTAL REVENUE |
| 26,257 |
| 24,427 |
| 7.5 | % | 91,424 |
| 91,134 |
| 0.3 | % | ||||
|
|
|
|
|
|
|
|
|
|
|
|
|
| ||||
GROSS PROFIT |
| 11,701 |
| 10,765 |
| 8.7 | % | 38,295 |
| 36,532 |
| 4.8 | % | ||||
Gross margin |
| 44.6 | % | 44.1 | % |
|
| 41.9 | % | 40.1 | % |
|
| ||||
|
|
|
|
|
|
|
|
|
|
|
|
|
| ||||
EXPENSE AND OTHER INCOME |
|
|
|
|
|
|
|
|
|
|
|
|
| ||||
|
|
|
|
|
|
|
|
|
|
|
|
|
| ||||
S,G&A |
| 5,620 |
| 5,252 |
| 7.0 | % | 20,259 |
| 21,314 |
| -4.9 | % | ||||
% of revenue |
| 21.4 | % | 21.5 | % |
|
| 22.2 | % | 23.4 | % |
|
| ||||
|
|
|
|
|
|
|
|
|
|
|
|
|
| ||||
R,D&E |
| 1,587 |
| 1,459 |
| 8.8 | % | 6,107 |
| 5,842 |
| 4.5 | % | ||||
% of revenue |
| 6.0 | % | 6.0 | % |
|
| 6.7 | % | 6.4 | % |
|
| ||||
|
|
|
|
|
|
|
|
|
|
|
|
|
| ||||
Intellectual property and custom development income |
| (241 | ) | (228 | ) | 5.8 | % | (900 | ) | (948 | ) | -5.0 | % | ||||
Other (income) and expense |
| (150 | ) | (334 | ) | -55.0 | % | (766 | ) | (2,122 | ) | -63.9 | % | ||||
Interest expense |
| 71 |
| 48 |
| 48.0 | % | 278 |
| 220 |
| 26.6 | % | ||||
|
|
|
|
|
|
|
|
|
|
|
|
|
| ||||
TOTAL EXPENSE AND OTHER INCOME |
| 6,887 |
| 6,197 |
| 11.1 | % | 24,978 |
| 24,306 |
| 2.8 | % | ||||
% of revenue |
| 26.2 | % | 25.4 | % |
|
| 27.3 | % | 26.7 | % |
|
| ||||
|
|
|
|
|
|
|
|
|
|
|
|
|
| ||||
INCOME FROM CONTINUING OPERATIONS BEFORE INCOME TAXES |
| 4,814 |
| 4,568 |
| 5.4 | % | 13,317 |
| 12,226 |
| 8.9 | % | ||||
Pretax margin |
| 18.3 | % | 18.7 | % |
|
| 14.6 | % | 13.4 | % |
|
| ||||
|
|
|
|
|
|
|
|
|
|
|
|
|
| ||||
Provision for income taxes |
| 1,350 |
| 1,348 |
| 0.2 | % | 3,901 |
| 4,232 |
| -7.8 | % | ||||
Effective tax rate |
| 28.0 | % | 29.5 | % |
|
| 29.3 | % | 34.6 | % |
|
| ||||
|
|
|
|
|
|
|
|
|
|
|
|
|
| ||||
INCOME FROM CONTINUING OPERATIONS |
| 3,464 |
| 3,220 |
| 7.6 | % | 9,416 |
| 7,994 |
| 17.8 | % | ||||
Net margin |
| 13.2 | % | 13.2 | % |
|
| 10.3 | % | 8.8 | % |
|
| ||||
|
|
|
|
|
|
|
|
|
|
|
|
|
| ||||
DISCONTINUED OPERATIONS |
|
|
|
|
|
|
|
|
|
|
|
|
| ||||
Income/(loss) from discontinued operations |
| 76 |
| 3 |
|
|
| 76 |
| (24 | ) |
|
| ||||
CUMULATIVE EFFECT OF CHANGE IN ACCOUNTING PRINCIPLE** |
| — |
| (36 | ) |
|
| — |
| (36 | ) |
|
| ||||
|
|
|
|
|
|
|
|
|
|
|
|
|
| ||||
NET INCOME |
| $ | 3,541 |
| $ | 3,187 |
| 11.1 | % | $ | 9,492 |
| $ | 7,934 |
| 19.6 | % |
|
|
|
|
|
|
|
|
|
|
|
|
|
| ||||
EARNINGS/(LOSS) PER SHARE |
|
|
|
|
|
|
|
|
|
|
|
|
| ||||
|
|
|
|
|
|
|
|
|
|
|
|
|
| ||||
ASSUMING DILUTION |
|
|
|
|
|
|
|
|
|
|
|
|
| ||||
CONTINUING OPERATIONS |
| $ | 2.26 |
| $ | 2.01 |
| 12.4 | % | $ | 6.06 |
| $ | 4.91 |
| 23.4 | % |
|
|
|
|
|
|
|
|
|
|
|
|
|
| ||||
DISCONTINUED OPERATIONS |
| 0.05 |
| 0.00 |
|
|
| 0.05 |
| (0.01 | ) |
|
| ||||
|
|
|
|
|
|
|
|
|
|
|
|
|
| ||||
CUMULATIVE EFFECT OF CHANGE IN ACCOUNTING PRINCIPLE |
| — |
| (0.02 | ) |
|
| — |
| (0.02 | ) |
|
| ||||
|
|
|
|
|
|
|
|
|
|
|
|
|
| ||||
TOTAL |
| $ | 2.31 |
| $ | 1.99 |
| 16.1 | % | $ | 6.11 |
| $ | 4.87 |
| 25.5 | % |
|
|
|
|
|
|
|
|
|
|
|
|
|
| ||||
BASIC |
|
|
|
|
|
|
|
|
|
|
|
|
| ||||
CONTINUING OPERATIONS |
| $ | 2.30 |
| $ | 2.04 |
| 12.7 | % | $ | 6.15 |
| $ | 4.99 |
| 23.2 | % |
DISCONTINUED OPERATIONS |
| 0.05 |
| 0.00 |
|
|
| 0.05 |
| (0.02 | ) |
|
| ||||
CUMULATIVE EFFECT OF CHANGE IN ACCOUNTING PRINCIPLE |
| — |
| (0.02 | ) |
|
| — |
| (0.02 | ) |
|
| ||||
|
|
|
|
|
|
|
|
|
|
|
|
|
| ||||
TOTAL |
| $ | 2.35 |
| $ | 2.02 |
| 16.4 | % | $ | 6.20 |
| $ | 4.96 |
| 25.0 | % |
|
|
|
|
|
|
|
|
|
|
|
|
|
| ||||
WEIGHTED-AVERAGE NUMBER COMMON SHARES OUTSTANDING (M's) |
|
|
|
|
|
|
|
|
|
|
|
|
| ||||
ASSUMING DILUTION |
| 1,532.5 |
| 1,604.8 |
|
|
| 1,553.5 |
| 1,627.6 |
|
|
| ||||
BASIC |
| 1,507.3 |
| 1,578.5 |
|
|
| 1,530.8 |
| 1,600.6 |
|
|
| ||||
* The company filed a Form 8-K with the U.S. SEC on June 13, 2006 to reclassify its historical financial statements and related footnotes to reflect changes to its management system in the first quarter of 2006.
** Change in accounting principle related to the adoption of FASB Interpretation No. 47,"Accounting for Conditional Asset Retirement Obligations - an interpretation of FASB Statement No. 143."
5
INTERNATIONAL BUSINESS MACHINES CORPORATION
CONSOLIDATED STATEMENT OF FINANCIAL POSITION
|
| At |
| At |
|
|
| ||||
(Dollars in millions) |
|
|
| December 31, |
| December 31, |
| Percent |
| ||
|
| 2006* |
| 2005 |
| Change |
| ||||
|
|
|
|
|
|
|
| ||||
ASSETS |
|
|
|
|
|
|
| ||||
|
|
|
|
|
|
|
| ||||
Cash, cash equivalents, and marketable securities |
| $ | 10,657 |
| $ | 13,686 |
| -22.1 | % | ||
|
|
|
|
|
|
|
| ||||
Receivables—net, inventories, prepaid expenses |
| 34,003 |
| 31,975 |
| 6.3 | % | ||||
|
|
|
|
|
|
|
| ||||
Plant, rental machines, and other property—net |
| 14,440 |
| 13,756 |
| 5.0 | % | ||||
|
|
|
|
|
|
|
| ||||
Investments and other assets |
| 44,134 |
| 46,331 |
| -4.7 | % | ||||
|
|
|
|
|
|
|
| ||||
TOTAL ASSETS |
| $ | 103,234 |
| $ | 105,748 |
| -2.4 | % | ||
|
|
|
|
|
|
|
| ||||
LIABILITIES AND STOCKHOLDERS' EQUITY |
|
|
|
|
|
|
| ||||
|
|
|
|
|
|
|
| ||||
Short-term debt |
| $ | 8,902 |
| $ | 7,216 |
| 23.4 | % | ||
Long-term debt |
| 13,780 |
| 15,425 |
| -10.7 | % | ||||
|
|
|
|
|
|
|
| ||||
Total debt |
| 22,682 |
| 22,641 |
| 0.2 | % | ||||
|
|
|
|
|
|
|
| ||||
Accounts payable, taxes, and accruals |
| 31,189 |
| 27,936 |
| 11.6 | % | ||||
|
|
|
|
|
|
|
| ||||
Other liabilities |
| 20,857 |
| 22,073 |
| -5.5 | % | ||||
|
|
|
|
|
|
|
| ||||
TOTAL LIABILITIES |
| 74,728 |
| 72,650 |
| 2.9 | % | ||||
|
|
|
|
|
|
|
| ||||
STOCKHOLDERS' EQUITY |
| 28,506 |
| 33,098 |
| -13.9 | % | ||||
|
|
|
|
|
|
|
| ||||
TOTAL LIABILITIES AND STOCKHOLDERS' EQUITY |
| $ | 103,234 |
| $ | 105,748 |
| -2.4 | % | ||
* In December, the company adopted FASB Statement of Financial Accounting Standards No. 158, a new accounting guidance related to pension and other postretirement plans, resulting in the reduction of assets by $9,240 million, increased liabilities by $257 million and reduced stockholders' equity by $9,498 million.
6
INTERNATIONAL BUSINESS MACHINES CORPORATION
SEGMENT DATA
|
| FOURTH QUARTER 2006 |
| ||||||||||||||
|
|
|
|
|
|
|
| Pretax |
|
|
| ||||||
|
|
|
|
|
|
|
| Income |
|
|
| ||||||
|
|
|
|
|
|
|
| (Loss) |
|
|
| ||||||
|
|
|
|
|
|
|
| From |
|
|
| ||||||
(Dollars in millions) |
|
|
| Revenue |
| Continuing |
| Pretax |
| ||||||||
|
| External |
| Internal |
| Total |
| Operations |
| Margin |
| ||||||
|
|
|
|
|
|
|
|
|
|
|
| ||||||
SEGMENTS |
|
|
|
|
|
|
|
|
|
|
| ||||||
|
|
|
|
|
|
|
|
|
|
|
| ||||||
Global Technology Services* |
| $ | 8,590 |
| $ | 435 |
| $ | 9,025 |
| $ | 843 |
| 9.3 | % | ||
% change |
| 7.1 | % | -6.6 | % | 6.3 | % | -23.7 | % |
|
| ||||||
|
|
|
|
|
|
|
|
|
|
|
| ||||||
Global Business Services |
| 4,223 |
| 349 |
| 4,572 |
| 538 |
| 11.8 | % | ||||||
% change |
| 6.1 | % | 13.6 | % | 6.6 | % | 32.2 | % |
|
| ||||||
|
|
|
|
|
|
|
|
|
|
|
| ||||||
Systems and Technology Group |
| 7,070 |
| 362 |
| 7,432 |
| 1,158 |
| 15.6 | % | ||||||
% change |
| 3.2 | % | 2.1 | % | 3.2 | % | -4.2 | % |
|
| ||||||
|
|
|
|
|
|
|
|
|
|
|
| ||||||
Software** |
| 5,607 |
| 632 |
| 6,239 |
| 2,015 |
| 32.3 | % | ||||||
% change |
| 14.4 | % | 13.6 | % | 14.3 | % | 4.1 | % |
|
| ||||||
|
|
|
|
|
|
|
|
|
|
|
| ||||||
Global Financing |
| 620 |
| 488 |
| 1,108 |
| 387 |
| 34.9 | % | ||||||
% change |
| 2.9 | % | -1.0 | % | 1.1 | % | -21.0 | % |
|
| ||||||
|
|
|
|
|
|
|
|
|
|
|
| ||||||
Personal Computing Division |
| 0 |
| 0 |
| 0 |
| 0 |
| 0.0 | % | ||||||
|
|
|
|
|
|
|
|
|
|
|
| ||||||
TOTAL REPORTABLE SEGMENTS |
| 26,111 |
| 2,266 |
| 28,377 |
| 4,940 |
| 17.4 | % | ||||||
% change |
| 7.2 | % | 4.1 | % | 7.0 | % | -4.0 | % |
|
| ||||||
|
|
|
|
|
|
|
|
|
|
|
| ||||||
Eliminations / Other |
| 147 |
| (2,266 | ) | (2,120 | ) | (126 | ) |
|
| ||||||
|
|
|
|
|
|
|
|
|
|
|
| ||||||
TOTAL IBM CONSOLIDATED |
| $ | 26,257 |
| $ | 0 |
| $ | 26,257 |
| $ | 4,814 |
| 18.3 | % | ||
% change |
| 7.5 | % |
|
| 7.5 | % | 5.4 | % |
|
| ||||||
|
| FOURTH QUARTER 2005*** |
| ||||||||||||||
|
|
|
|
|
|
|
| Pretax |
|
|
| ||||||
|
|
|
|
|
|
|
| Income |
|
|
| ||||||
|
|
|
|
|
|
|
| (Loss) |
|
|
| ||||||
|
|
|
|
|
|
|
| From |
|
|
| ||||||
(Dollars in millions) |
|
|
| Revenue |
| Continuing |
| Pretax |
| ||||||||
|
| External |
| Internal |
| Total |
| Operations |
| Margin |
| ||||||
SEGMENTS |
|
|
|
|
|
|
|
|
|
|
| ||||||
|
|
|
|
|
|
|
|
|
|
|
| ||||||
Global Technology Services |
| $ | 8,020 |
| $ | 467 |
| $ | 8,487 |
| $ | 1,104 |
| 13.0 | % | ||
|
|
|
|
|
|
|
|
|
|
|
| ||||||
Global Business Services |
| 3,980 |
| 307 |
| 4,287 |
| 406 |
| 9.5 | % | ||||||
|
|
|
|
|
|
|
|
|
|
|
| ||||||
Systems and Technology Group |
| 6,849 |
| 355 |
| 7,204 |
| 1,209 |
| 16.8 | % | ||||||
|
|
|
|
|
|
|
|
|
|
|
| ||||||
Software |
| 4,901 |
| 556 |
| 5,457 |
| 1,935 |
| 35.5 | % | ||||||
|
|
|
|
|
|
|
|
|
|
|
| ||||||
Global Financing |
| 603 |
| 493 |
| 1,096 |
| 491 |
| 44.8 | % | ||||||
|
|
|
|
|
|
|
|
|
|
|
| ||||||
Personal Computing Division |
| 0 |
| 0 |
| 0 |
| 0 |
| 0.0 | % | ||||||
|
|
|
|
|
|
|
|
|
|
|
| ||||||
TOTAL REPORTABLE SEGMENTS |
| 24,353 |
| 2,178 |
| 26,531 |
| 5,145 |
| 19.4 | % | ||||||
|
|
|
|
|
|
|
|
|
|
|
| ||||||
Eliminations / Other |
| 74 |
| (2,178 | ) | (2,103 | ) | (578 | ) |
|
| ||||||
|
|
|
|
|
|
|
|
|
|
|
| ||||||
TOTAL IBM CONSOLIDATED |
| $ | 24,427 |
| $ | 0 |
| $ | 24,427 |
| $ | 4,568 |
| 18.7 | % | ||
* Includes revenue for acquisitions managed by the Global Technology Services segment but reported as Software revenue in the comparative financial results exhibit.
** Excludes revenue from acquisitions reported as Software revenue in the comparative financial results exhibit but managed by the Global Technology Services segment.
*** The company filed a Form 8-K with the U.S. SEC on June 13, 2006 to reclassify its financial statements and related footnotes to reflect changes to its management system effective as of the first quarter of 2006, including the separation of the Global Services segment into two new reportable segments: Global Technology Services and Global Business Services, as well as the reclassification of Enterprise Investments to other reportable segments.
7
INTERNATIONAL BUSINESS MACHINES CORPORATION
SEGMENT DATA
|
| TWELVE MONTHS 2006 |
| ||||||||||||||
|
|
|
|
|
|
|
| Pretax |
|
|
| ||||||
|
|
|
|
|
|
|
| Income |
|
|
| ||||||
|
|
|
|
|
|
|
| (Loss) |
|
|
| ||||||
|
|
|
|
|
|
|
| From |
|
|
| ||||||
(Dollars in millions) |
|
|
| Revenue |
| Continuing |
| Pretax |
| ||||||||
|
| External |
| Internal |
| Total |
| Operations |
| Margin |
| ||||||
|
|
|
|
|
|
|
|
|
|
|
| ||||||
SEGMENTS |
|
|
|
|
|
|
|
|
|
|
| ||||||
|
|
|
|
|
|
|
|
|
|
|
| ||||||
Global Technology Services* |
| $ | 32,322 |
| $ | 1,763 |
| $ | 34,086 |
| $ | 3,288 |
| 9.6 | % | ||
% change |
| 2.6 | % | -16.1 | % | 1.4 | % | 25.6 | % |
|
| ||||||
|
|
|
|
|
|
|
|
|
|
|
| ||||||
Global Business Services |
| 15,969 |
| 1,373 |
| 17,341 |
| 1,706 |
| 9.8 | % | ||||||
% change |
| 0.4 | % | 2.5 | % | 0.6 | % | 116.9 | % |
|
| ||||||
|
|
|
|
|
|
|
|
|
|
|
| ||||||
Systems and Technology Group |
| 21,970 |
| 1,168 |
| 23,138 |
| 1,739 |
| 7.5 | % | ||||||
% change |
| 4.7 | % | 4.5 | % | 4.7 | % | -7.6 | % |
|
| ||||||
|
|
|
|
|
|
|
|
|
|
|
| ||||||
Software** |
| 18,161 |
| 2,249 |
| 20,409 |
| 5,493 |
| 26.9 | % | ||||||
% change |
| 7.9 | % | 13.6 | % | 8.5 | % | 14.9 | % |
|
| ||||||
|
|
|
|
|
|
|
|
|
|
|
| ||||||
Global Financing |
| 2,365 |
| 1,527 |
| 3,892 |
| 1,455 |
| 37.4 | % | ||||||
% change |
| -1.5 | % | 1.4 | % | -0.4 | % | -8.1 | % |
|
| ||||||
|
|
|
|
|
|
|
|
|
|
|
| ||||||
Personal Computing Division |
| 0 |
| 0 |
| 0 |
| 0 |
| nm |
| ||||||
% change |
| nm |
| nm |
| nm |
| nm |
|
|
| ||||||
|
|
|
|
|
|
|
|
|
|
|
| ||||||
TOTAL REPORTABLE SEGMENTS |
| 90,787 |
| 8,080 |
| 98,867 |
| 13,682 |
| 13.8 | % | ||||||
% change |
| 0.3 | % | 0.0 | % | 0.3 | % | 19.1 | % |
|
| ||||||
|
|
|
|
|
|
|
|
|
|
|
| ||||||
Eliminations / Other |
| 637 |
| (8,080 | ) | (7,443 | ) | (365 | ) |
|
| ||||||
|
|
|
|
|
|
|
|
|
|
|
| ||||||
TOTAL IBM CONSOLIDATED |
| $ | 91,424 |
| $ | 0 |
| $ | 91,424 |
| $ | 13,317 |
| 14.6 | % | ||
% change |
| 0.3 | % |
|
| 0.3 | % | 8.9 | % |
|
| ||||||
nm – not meaningful
8
|
| TWELVE MONTHS 2005*** |
| ||||||||||||||
|
|
|
|
|
|
|
| Pretax |
|
|
| ||||||
|
|
|
|
|
|
|
| Income |
|
|
| ||||||
|
|
|
|
|
|
|
| (Loss) |
|
|
| ||||||
|
|
|
|
|
|
|
| From |
|
|
| ||||||
(Dollars in millions) |
|
|
| Revenue |
| Continuing |
| Pretax |
| ||||||||
|
| External |
| Internal |
| Total |
| Operations |
| Margin |
| ||||||
SEGMENTS |
|
|
|
|
|
|
|
|
|
|
| ||||||
|
|
|
|
|
|
|
|
|
|
|
| ||||||
Global Technology Services |
| $ | 31,501 |
| $ | 2,102 |
| $ | 33,603 |
| $ | 2,619 |
| 7.8 | % | ||
|
|
|
|
|
|
|
|
|
|
|
| ||||||
Global Business Services |
| 15,906 |
| 1,339 |
| 17,245 |
| 786 |
| 4.6 | % | ||||||
|
|
|
|
|
|
|
|
|
|
|
| ||||||
Systems and Technology Group |
| 20,981 |
| 1,118 |
| 22,099 |
| 1,883 |
| 8.5 | % | ||||||
|
|
|
|
|
|
|
|
|
|
|
| ||||||
Software |
| 16,830 |
| 1,979 |
| 18,809 |
| 4,779 |
| 25.4 | % | ||||||
|
|
|
|
|
|
|
|
|
|
|
| ||||||
Global Financing |
| 2,401 |
| 1,506 |
| 3,907 |
| 1,583 |
| 40.5 | % | ||||||
|
|
|
|
|
|
|
|
|
|
|
| ||||||
Personal Computing Division |
| 2,876 |
| 33 |
| 2,909 |
| (165 | ) | nm |
| ||||||
|
|
|
|
|
|
|
|
|
|
|
| ||||||
TOTAL REPORTABLE SEGMENTS |
| 90,495 |
| 8,077 |
| 98,572 |
| 11,485 |
| 11.7 | % | ||||||
|
|
|
|
|
|
|
|
|
|
|
| ||||||
Eliminations / Other |
| 639 |
| (8,077 | ) | (7,438 | ) | 741 |
|
|
| ||||||
|
|
|
|
|
|
|
|
|
|
|
| ||||||
TOTAL IBM CONSOLIDATED |
| $ | 91,134 |
| $ | 0 |
| $ | 91,134 |
| $ | 12,226 |
| 13.4 | % | ||
nm – not meaningful
* Includes revenue for acquisitions managed by the Global Technology Services segment but reported as Software revenue in the comparative financial results exhibit.
** Excludes revenue from acquisitions reported as Software revenue in the comparative financial results exhibit but managed by the Global Technology Services segment.
*** The company filed a Form 8-K with the U.S. SEC on June 13, 2006 to reclassify its financial statements and related footnotes to reflect changes to its management system effective as of the first quarter of 2006, including the separation of the Global Services segment into two new reportable segments: Global Technology Services and Global Business Services, as well as the reclassification of Enterprise Investments to other reportable segments.
Contact: IBM
John Bukovinsky, 914/499-6212
jbuko@us.ibm.com
9
ATTACHMENT II
| IBM 4Q 2006 Earnings Presentation January 2007 -1- |
| Certain comments made in this presentation may be characterized as forward looking under the Private Securities Litigation Reform Act of 1995. Those statements involve a number of factors that could cause actual results to differ materially. Additional information concerning these factors is contained in the Company's filings with the SEC. Copies are available from the SEC, from the IBM web site, or from IBM Investor Relations. These charts and the associated remarks and comments are integrally related, and are intended to be presented and understood together. -2- |
| 4Q06 FINANCIAL SUMMARY -3- 10% EPS Yr/Yr w/o Real Estate Gains PTI Yr/Yr w/o Real Estate Gains 1532.5 Shares (Diluted) (M) (1.5 pts) (0.4 pts) 18.3% PTI% 2.0 pts (2.0 pts) 0.5 pts B/(W) Yr/Yr w/o 4Q05 Non-recur* 12% 1.5 pts (0.9 pts) 0.5 pts B/(W) Yr/Yr As Rptd 28.0% Tax Rate% Continuing Operations ($B except EPS) $2.26 EPS Pre-Tax Income 26.2% E/R% 44.6% GP% 26.3 Revenue * Non-recurring item: Pension curtailment charge 4.8 4Q06 7% 5% 7% 0% 7% @CC 4% 4% 5% 5% 3% |
| 2006 FINANCIAL SUMMARY -4- 13% 0.7 pts 0.4 pts (0.3 pts) 0.8 pts B/(W) Yr/Yr w/o Non-recur* & PC Results 1553.5 Shares (Diluted) (M) 1.0 pts 1.2 pts 14.6% PTI% 14% 0.7 pts (0.8 pts) 1.8 pts B/(W) Yr/Yr w/o 2005 Non-recur* 23% 5.3 pts (0.7 pts) 1.8 pts B/(W) Yr/Yr As Rptd 29.3% Tax Rate% Continuing Operations ($B except EPS) $6.06 EPS 13.3 Pre-Tax Income 27.3% E/R% 41.9% GP% 91.4 Revenue * Non-recurring includes: 2Q05 PC gain, 2Q05 incremental restructuring charge, 2Q05 Microsoft settlement, 3Q05 Homeland Tax and 4Q05 Pension charge FY06 0% 9% 0% 8% @CC 0% 0% 5% 5% 4% 3% 7% 5% |
| 2006 FINANCIAL SUMMARY -5- 13% 0.4 pts B/(W) Yr/Yr w/o Non-recur* & PC Results 1.0 pts 1.2 pts 14.6% PTI% 0% 14% 8% 0% B/(W) Yr/Yr w/o 2005 Non-recur* 23% B/(W) Yr/Yr As Rptd Continuing Operations ($B except EPS) $6.06 EPS 13.3 Pre-Tax Income 91.4 Revenue * Non-recurring includes: 2Q05 PC gain, 2Q05 incremental restructuring charge, 2Q05 Microsoft settlement, 3Q05 Homeland Tax and 4Q05 Pension charge $0.12 0.3 Ongoing Restructuring $0.35 0.8 Stock Compensation $0.13 $0.99 Est. EPS Impact Pre-Tax $B Includes Expenses: 0.3 Amortization of Purchased Intangibles 2.4 Pension FY06 0% 9% @CC 0% 4% 3% 7% |
| SEGMENT REVENUE NA 0.5 pts 44.6% Total IBM Gross Margin 4% 26.3 Total IBM Revenue Systems and Technology Global Business Services 11% 26.1 Total Segments B/(W) Yr/Yr Rptd @CC 4Q06 External Revenue ($B) Global Financing 14% Software Global Technology Services -6- 8.6 7% 5.6 0.6 3% 7% 4% 0% 4% 4.2 6% 3% 7.1 3% 0% 7% |
| GEOGRAPHIC REVENUE -7- +6% Yr/Yr +5% @CC -3% Yr/Yr +7% Yr/Yr +5% @CC +11% Yr/Yr +3% @CC Emerging markets +21% Yr/Yr, +18% @CC Americas, $11.1B Europe/ME/A, $9.3B Asia Pacific, $4.8B OEM, $1.0B | |
| GEOGRAPHIC REVENUE -7- +6% Yr/Yr +5% @CC -3% Yr/Yr +7% Yr/Yr +5% @CC +11% Yr/Yr +3% @CC Emerging markets +21% Yr/Yr, +18% @CC Americas, $11.1B Europe/ME/A, $9.3B Asia Pacific, $4.8B OEM, $1.0B | |
| EXPENSE SUMMARY 5 pts 4 pts 4 pts 5 pts 4 pts 5 pts 7 pts 0 pts 4 pts Currency & Real Estate 1.6 RD&E (13%) 5.6 SG&A (16%) B/(W) Yr/Yr w/o Non-recur* (11%) 6.9 Total Expense and Other Income B/(W) Yr/Yr ($B) -8- * Non-recurring includes: Pension charge Yr/Yr Drivers 5% Operational SG&A investment delivers: Key Middleware momentum Emerging Markets growth Services signings performance 4Q06 (7%) (9%) (9%) Ops Acq |
| CASH FLOW ANALYSIS 15.3 15.0 FY06 Change in Cash & Marketable Securities Discontinued Operations Other Change in Non-GF Debt Return to Shareholders Divestitures Acquisitions Investing Activities 13.1 Net Cash from Operations (Cont. Ops.), excl. GF Rec. Less: GF Accounts Receivable 14.9 Net Cash from Operations (Cont. Ops.) FY05 ($B) -9- 1.8 Capital Expenditures, Net (3.5) GF A/R 1.8 GF Debt (0.6) Net GF Debt to A/R 1.3 (1.5) 0.9 Share Repurchase (7.7) Dividends (1.2) 1.2 0.7 0.0 3.1 (0.3) (4.7) (0.3) 1.0 0.8 (3.8) 0.0 (8.1) (1.7) (1.1) 0.4 0.0 (3.0) |
| BALANCE SHEET 6.9 2% 103.2 Dec 2006 6.7 7.0 Global Fin. Leverage 7% 2% Non-GF Debt/Cap Equity Total Liabilities Total Debt Global Financing Debt Non-GF Debt Other Liabilities 105.7 111.0 Total Assets Global Fin. Assets* Non-GF Assets* Cash & Marketable Securities Dec 2005 Dec 2004 ($B) * Excluding Cash & Marketable Securities -10- 10.6 13.7 66.7 62.2 33.7 29.9 56.4 50.0 0.6 2.1 22.3 20.5 22.9 22.6 79.3 72.6 31.7 33.1 10.7 59.5 33.1 52.0 0.4 22.3 22.7 74.7 28.5 |
| GLOBAL SERVICES SEGMENTS -11- (3.7pts) 2.3pts 11.8% Global Business Services (GBS) Global Technology Services (GTS) 3% 4% @CC 6% 4.2 7% 8.6 Yr/Yr 4Q06 ($B) 7.2 47% PTI margin 9.3% (3.7pts) PTI margin 11.8% 2.3 pts 10.6 Total 221% 3.7 59% Long-Term 3.5 20% Short-Term Yr/Yr $B Yr/Yr $B GBS GTS Signings 6% 7% 6% 8% 8% 7% Yr/Yr 3% Global Business Services 6% Integrated Tech Services 3% Maintenance 5% Bus. Transformation Outsourcing 4% Strategic Outsourcing 4% Global Technology Services @CC IGS WW Contract Signings Signings Revenue External Revenue $12.8B, +7%; +3% @CC 4.6 5.4 4.7 5.3 4.8 5.0 5.1 6.2 5.4 9.2 6.3 6.2 6.6 4.6 5.4 11.6 0 5 10 15 20 1Q05 2Q05 3Q05 4Q05 1Q06 2Q06 3Q06 4Q06 ($B) Long-Term Short-Term 2.6 14% 8.0 69% Revenue (External) Revenue (External) PTI Margin PTI Margin 9.3% | |
| GLOBAL SERVICES SEGMENTS -11- Global Business Services (GBS) Global Technology Services (GTS) 3% 4% @CC 6% 4.2 7% 8.6 Yr/Yr 4Q06 ($B) 7.2 47% 10.6 Total 221% 3.7 59% Long-Term 3.5 20% Short-Term Yr/Yr $B Yr/Yr $B GBS GTS Signings 6% 7% 6% 8% 8% 7% Yr/Yr 3% Global Business Services 6% Integrated Tech Services 3% Maintenance 5% Bus. Transformation Outsourcing 4% Strategic Outsourcing 4% Global Technology Services @CC IGS WW Contract Signings Signings Revenue External Revenue $12.8B, +7%; +3% @CC 4.6 5.4 4.7 5.3 4.8 5.0 5.1 6.2 5.4 9.2 6.3 6.2 6.6 4.6 5.4 11.6 0 5 10 15 20 1Q05 2Q05 3Q05 4Q05 1Q06 2Q06 3Q06 4Q06 ($B) Long-Term Short-Term 2.6 14% 8.0 69% Revenue (External) Revenue (External) | |
| SYSTEMS & TECHNOLOGY SEGMENT -12- Market and product leadership Legacy installed base erosion Continued weakness Strong 2005 compare Strong disk and tape Strength in Europe & AP High-end strength Upgrade softness MIPS up 6% 4Q06 Revenue 20% (18%) (14%) @CC + + 25% Retail Store Sols As Rptd + (17%) E&TS - Printing Systems + - - + + + GP% Microelectronics + System Storage = System x Servers + System p - (10%) System i + System z Share External Revenue $7.1B, +3%; 0% @CC 5% 4% 7% 9% (6%) (7%) 1% 0% 3% 6% (6%) (9%) |
| SOFTWARE SEGMENT -13- Broad-based growth driven by key branded middleware 21% 25% Tivoli Other Middleware Other Software/Services 14% 18% Total Middleware 100% % of SW 11% 14% Total Software Operating Systems 21% 25% Key Branded Middleware 4Q06 Revenue 24% 24% 18% @CC 12% Rational 30% Lotus 28% Information Management 22% WebSphere Family Yr/Yr External Revenue $5.6B, +14%; 11% @CC 8% (2%) (5%) 56% 11% 78% 11% 8% 4% 21% 3% 0% |
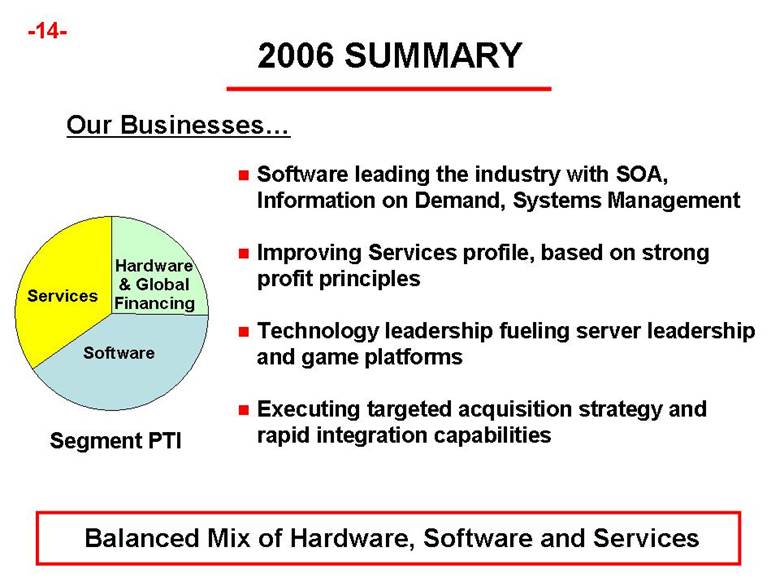
| 2006 SUMMARY -14- Balanced Mix of Hardware, Software and Services Software leading the industry with SOA, Information on Demand, Systems Management Improving Services profile, based on strong profit principles Technology leadership fueling server leadership and game platforms Executing targeted acquisition strategy and rapid integration capabilities Our Businesses Hardware & Global Financing Software Services Segment PTI |
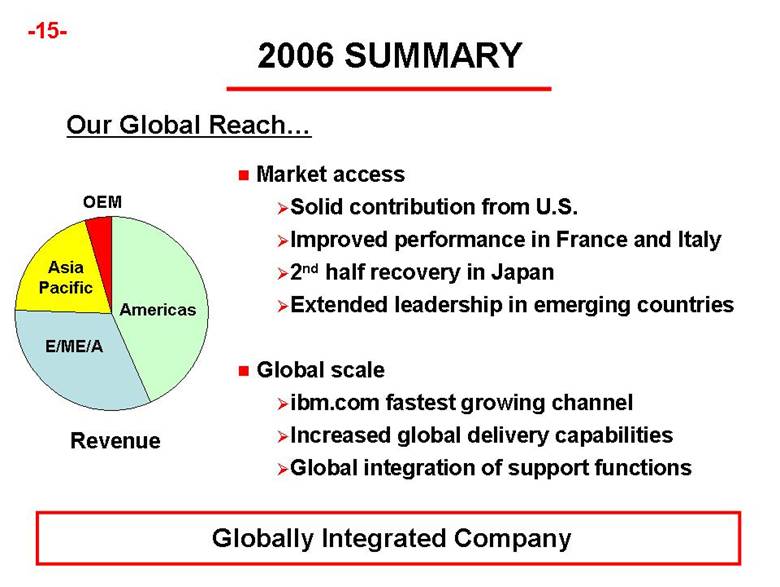
| 2006 SUMMARY -15- Globally Integrated Company Market access Solid contribution from U.S. Improved performance in France and Italy 2nd half recovery in Japan Extended leadership in emerging countries Global scale ibm.com fastest growing channel Increased global delivery capabilities Global integration of support functions Our Global Reach Americas E/ME/A Asia Pacific OEM Revenue |
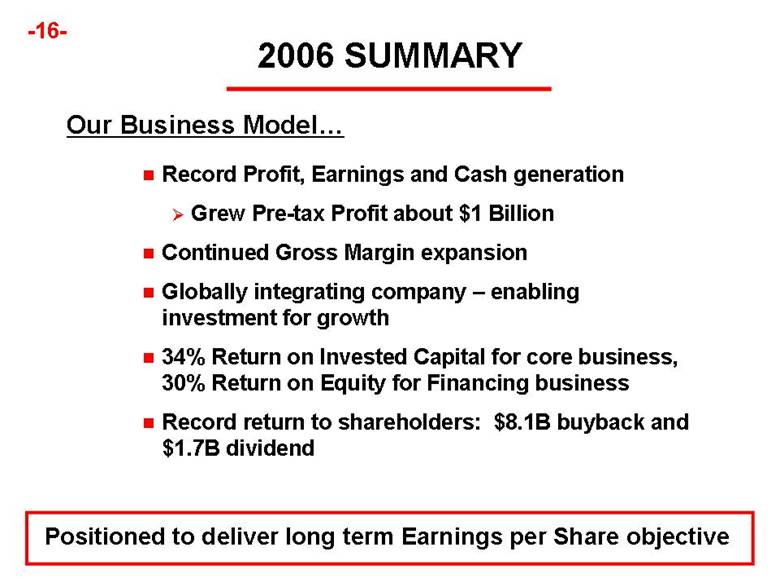
| 2006 SUMMARY -16- Positioned to deliver long term Earnings per Share objective Record Profit, Earnings and Cash generation Grew Pre-tax Profit about $1 Billion Continued Gross Margin expansion Globally integrating company – enabling investment for growth 34% Return on Invested Capital for core business, 30% Return on Equity for Financing business Record return to shareholders: $8.1B buyback and $1.7B dividend Our Business Model |
| SUSTAINED PERFORMANCE * From Continuing Operations -17- IBM Earnings per Share* – As Reported 17% Y/Y 12% Y/Y 23% Y/Y 55% Y/Y -38% Y/Y $2.43 $3.76 $4.39 $4.91 $6.06 FY02 FY03 FY04 FY05 FY06 |
| -18- |
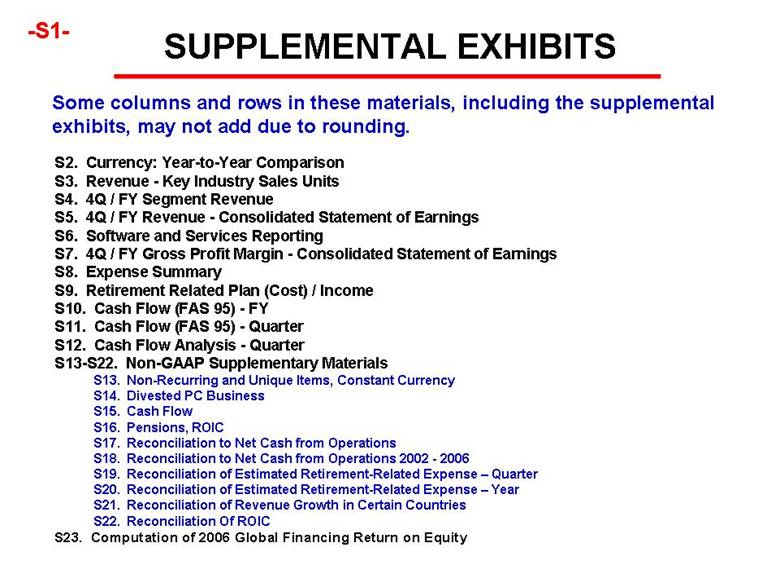
| SUPPLEMENTAL EXHIBITS -S1- S2. Currency: Year-to-Year Comparison S3. Revenue - Key Industry Sales Units S4. 4Q / FY Segment Revenue S5. 4Q / FY Revenue - Consolidated Statement of Earnings S6. Software and Services Reporting S7. 4Q / FY Gross Profit Margin - Consolidated Statement of Earnings S8. Expense Summary S9. Retirement Related Plan (Cost) / Income S10. Cash Flow (FAS 95) - FY S11. Cash Flow (FAS 95) - Quarter S12. Cash Flow Analysis - Quarter S13-S22. Non-GAAP Supplementary Materials S13. Non-Recurring and Unique Items, Constant Currency S14. Divested PC Business S15. Cash Flow S16. Pensions, ROIC S17. Reconciliation to Net Cash from Operations S18. Reconciliation to Net Cash from Operations 2002 - 2006 S19. Reconciliation of Estimated Retirement-Related Expense – Quarter S20. Reconciliation of Estimated Retirement-Related Expense – Year S21. Reconciliation of Revenue Growth in Certain Countries S22. Reconciliation Of ROIC S23. Computation of 2006 Global Financing Return on Equity Some columns and rows in these materials, including the supplemental exhibits, may not add due to rounding. | |
| SUPPLEMENTAL EXHIBITS -S1- S2. Currency: Year-to-Year Comparison S3. Revenue - Key Industry Sales Units S4. 4Q / FY Segment Revenue S5. 4Q / FY Revenue - Consolidated Statement of Earnings S6. Software and Services Reporting S7. 4Q / FY Gross Profit Margin - Consolidated Statement of Earnings S8. Expense Summary S9. Retirement Related Plan (Cost) / Income S10. Cash Flow (FAS 95) - FY S11. Cash Flow (FAS 95) - Quarter S12. Cash Flow Analysis - Quarter S13-S22. Non-GAAP Supplementary Materials S13. Non-Recurring and Unique Items, Constant Currency S14. Divested PC Business S15. Cash Flow S16. Pensions, ROIC S17. Reconciliation to Net Cash from Operations S18. Reconciliation to Net Cash from Operations 2002 - 2006 S19. Reconciliation of Estimated Retirement-Related Expense – Quarter S20. Reconciliation of Estimated Retirement-Related Expense – Year S21. Reconciliation of Revenue Growth in Certain Countries S22. Reconciliation Of ROIC S23. Computation of 2006 Global Financing Return on Equity Some columns and rows in these materials, including the supplemental exhibits, may not add due to rounding. | |
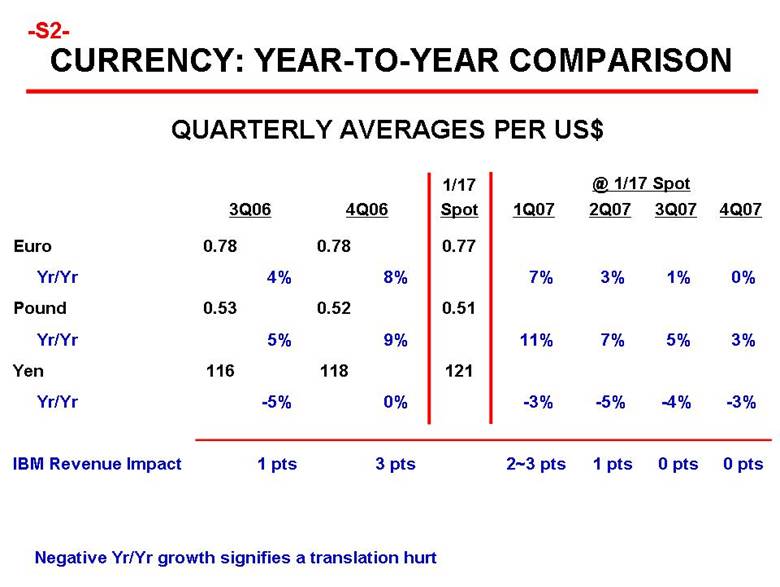
| CURRENCY: YEAR-TO-YEAR COMPARISON -S2- 0 pts -4% 5% 1% 3Q07 0 pts -3% 3% 0% 4Q07 1 pts -5% 7% 3% 2Q07 118 0.52 0.78 4Q06 3 pts 0% 9% 8% 116 0.53 0.78 3Q06 1 pts -5% 5% 4% 121 0.51 0.77 1/17 Spot 2~3 pts IBM Revenue Impact Yen 11% Pound Euro 1Q07 @ 1/17 Spot QUARTERLY AVERAGES PER US$ Negative Yr/Yr growth signifies a translation hurt Yr/Yr 7% Yr/Yr Yr/Yr -3% |
| REVENUE - KEY INDUSTRY SALES UNITS -S3- 88.1 17.0 11.5 13.4 25.2 0% (3%) 1% 1% (1%) (5%) 4% 3% 6% 2% 2% 0% (2%) 5% @CC w/o PCs 4% 7% 0% 7% 3% (3%) 6% 25.4 All Sectors 11% Small / Medium Communications 11% Distribution Industrial Public 10% Financial Svcs ($B) B/(W) Yr/Yr B/(W) Yr/Yr 4Q06 Rptd 7.5 3.8 0% 3.2 6% 2.6 2.5 3% 4.9 8% @CC Rptd FY06 9.0 8.7 |
| SEGMENT REVENUE 4% 5% 22.0 Systems and Technology 3% 0% 0% (2%) 7% 1% 2% 4% 0% 0% (2%) 8% 0% 3% B/(W) Yr/Yr Rptd @CC 91.4 90.8 18.2 16.0 32.3 FY06 Global Business Services 11% 26.3 Total IBM 26.1 Total Segments B/(W) Yr/Yr Rptd @CC 4Q06 External Revenue ($B) Global Financing 14% Software Global Technology Services -S4- 8.6 7% 5.6 0.6 3% 7% 7% 4% 0% 4% 4% 4.2 6% 3% w/o PC Segment 2.4 7.1 3% 0% |
| REVENUE -- 4% (3%) 1% 11% -- 1% 3% @CC -- 7% (19%) 3% 15% -- 4% 6% Rptd 3% 0% (33%) (2%) 7% 4% (8%) 2% @CC 4% 0% (36%) (1%) 8% 5% (8%) 2% Rptd 91.4 0.1 2.4 18.2 22.5 48.2 FY06 26.3 IBM 0.0 Other 4Q06 ($B) 0.6 Global Financing 5.7 Software 7.2 Hardware 12.8 Global Services -S5- Consolidated Statement of Earnings B/(W) Yr/Yr B/(W) Yr/Yr w/o PC w/o PC |
| SOFTWARE AND SERVICES REPORTING -S6- GBS Segment GTS Segment 12,769 Services 5,651 5,607 Software 4Q06 12,000 4,901 Consolidated Statement of Earnings SW Acquisitions ISS Software 4,901 Software Segment Services Software 4Q05 External Revenue ($M) 56 (12) (56) 12 8,020 8,590 3,980 4,223 |
| GROSS PROFIT MARGIN 0.8 pts 1.8 pts (58.4 pts) (4.4 pts) 0.3 pts (1.6 pts) 1.9 pts 1.5 pts B/(W) Yr/Yr Pts 41.9% (13.2%) 50.3% 85.2% 37.0% 27.5% FY06 -- 0.5 pts 44.6% IBM (41.3 pts) (28.6%) Other B/(W) Yr/Yr Pts 4Q06 48.7% Global Financing 86.5% Software 41.0% Hardware 27.9% Global Services -S7- Consolidated Statement of Earnings 0.5 pts (1.0 pts) 0.2 pts (8.7 pts) w/o PC -- w/o PC |
| EXPENSE SUMMARY -- (2.0 pts) (16%) (48%) (55%) (13%) B/(W) Yr/Yr w/o Charge* (0.3 pts) (0.8 pts) (27%) 58% B/(W) Yr/Yr w/o Charges** (0.7 pts) (27%) (64%) 27.3 25.0 20.3 (0.9 pts) 26.2% E/R% (11%) 6.9 Total Expense and Other Income (48%) 0.1 Interest Expense (55%) (0.2) Other Income and Expense (0.2) IP and Custom Dev. Income 1.6 RD&E 5.6 SG&A ($B) -S8- * Includes $0.3B pension charge ** Includes 2Q05 PC gain, 2Q05 incremental restructuring charge, 2Q05 Microsoft settlement and 4Q05 pension charge 4Q06 B/(W) Yr/Yr (7%) (9%) 6% FY06 6.1 (0.9) (0.8) 0.3 B/(W) Yr/Yr 5% (5%) (5%) (3%) w/o PCs w/o PCs (4%) (5%) (5%) (3%) (5%) (9%) 6% |

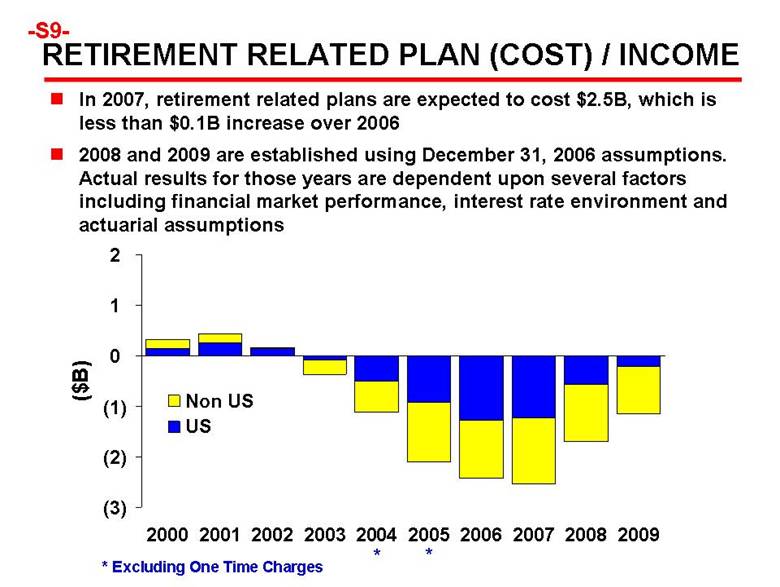
| RETIREMENT RELATED PLAN (COST) / INCOME * Excluding One Time Charges -S9- In 2007, retirement related plans are expected to cost $2.5B, which is less than $0.1B increase over 2006 2008 and 2009 are established using December 31, 2006 assumptions. Actual results for those years are dependent upon several factors including financial market performance, interest rate environment and actuarial assumptions * * (3) (2) (1) 0 1 2 2000 2001 2002 2003 2004 2005 2006 2007 2008 2009 ($B) Non US US |
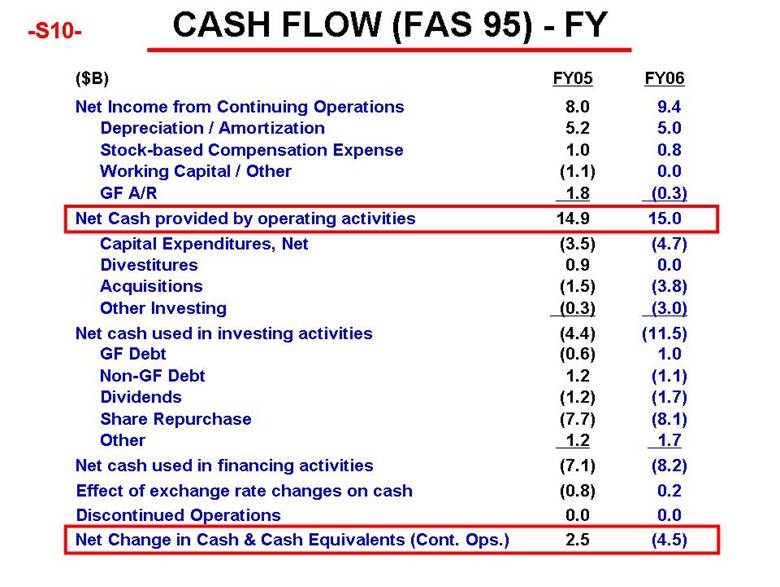
| CASH FLOW (FAS 95) - FY -S10- (11.5) 15.0 FY06 Effect of exchange rate changes on cash Net Change in Cash & Cash Equivalents (Cont. Ops.) Discontinued Operations Net cash used in financing activities Net cash used in investing activities 14.9 Net Cash provided by operating activities Net Income from Continuing Operations FY05 ($B) 8.0 Depreciation / Amortization 5.2 Working Capital / Other (1.1) GF A/R 1.8 Capital Expenditures, Net (3.5) Divestitures 0.9 Acquisitions (1.5) Other Investing (0.3) (4.4) GF Debt (0.6) Dividends (1.2) Share Repurchase (7.7) Other 1.2 (7.1) 0.0 2.5 Non-GF Debt 1.2 (0.8) Stock-based Compensation Expense 1.0 9.4 5.0 0.8 0.0 (0.3) (4.7) 0.0 (3.8) (3.0) 1.0 (1.1) (1.7) (8.1) 1.7 (8.2) 0.2 0.0 (4.5) |
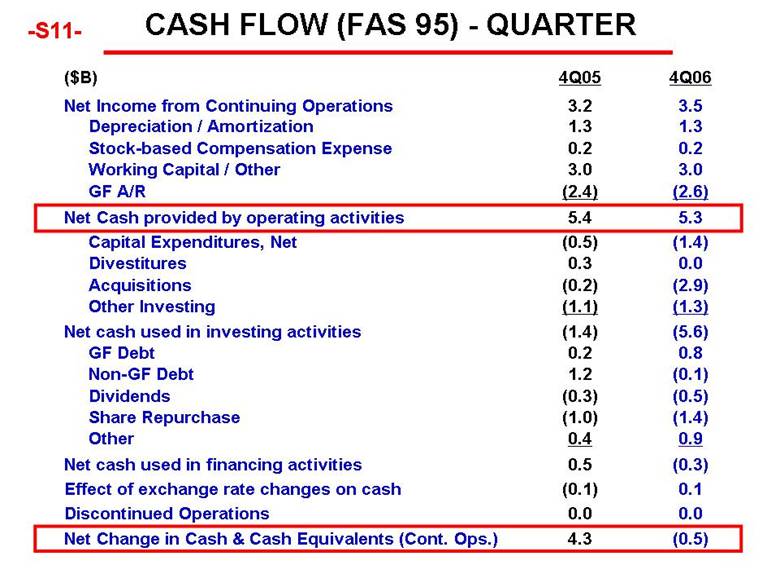
| CASH FLOW (FAS 95) - QUARTER -S11- 4.3 0.0 (0.1) 0.5 0.4 (1.0) (0.3) 1.2 0.2 (1.4) (1.1) (0.2) 0.3 (0.5) 5.4 (2.4) 3.0 0.2 1.3 3.2 4Q05 0.2 0.1 Effect of exchange rate changes on cash (0.1) (0.5) Net Change in Cash & Cash Equivalents (Cont. Ops.) 0.0 Discontinued Operations (0.3) Net cash used in financing activities 0.9 (1.4) (0.5) 0.8 (5.6) Net cash used in investing activities (1.3) (2.9) 0.0 (1.4) 5.3 Net Cash provided by operating activities (2.6) 3.0 1.3 3.5 Net Income from Continuing Operations 4Q06 ($B) Depreciation / Amortization Working Capital / Other GF A/R Capital Expenditures, Net Divestitures Acquisitions Other Investing GF Debt Dividends Share Repurchase Other Non-GF Debt Stock-based Compensation Expense |
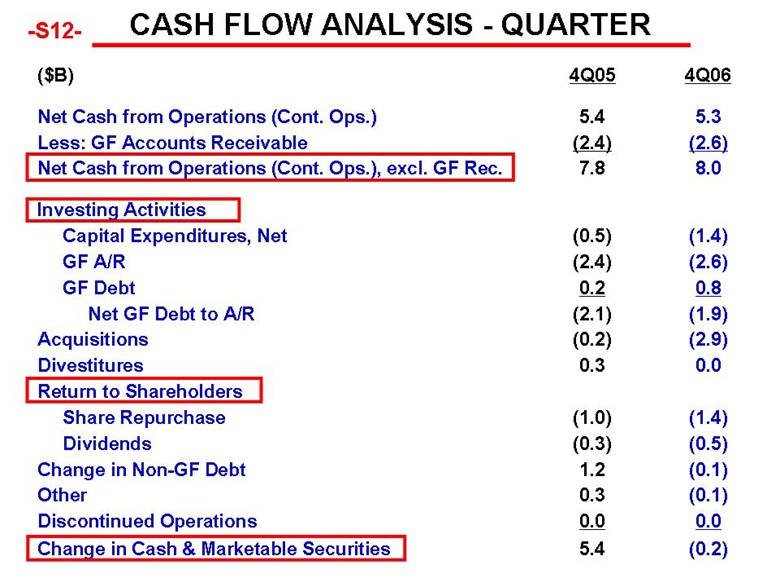
| CASH FLOW ANALYSIS - QUARTER 5.4 0.0 0.3 1.2 (0.3) (1.0) 0.3 (0.2) (2.1) 0.2 (2.4) (0.5) 7.8 (2.4) 5.4 4Q05 (0.2) Change in Cash & Marketable Securities 0.0 Discontinued Operations (0.1) Other (0.1) Change in Non-GF Debt (0.5) (1.4) Return to Shareholders 0.0 Divestitures (2.9) Acquisitions (1.9) 0.8 (2.6) (1.4) Investing Activities 8.0 Net Cash from Operations (Cont. Ops.), excl. GF Rec. (2.6) Less: GF Accounts Receivable 5.3 Net Cash from Operations (Cont. Ops.) 4Q06 ($B) -S12- Capital Expenditures, Net GF A/R GF Debt Net GF Debt to A/R Share Repurchase Dividends |
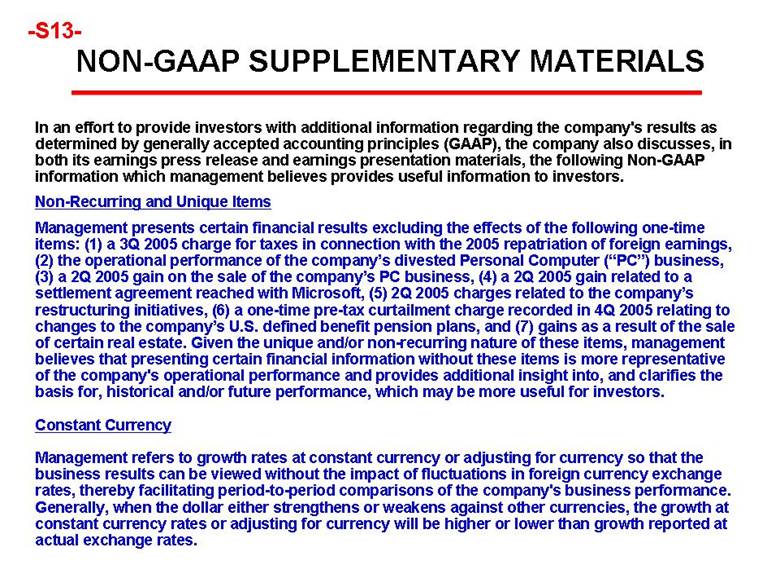
| NON-GAAP SUPPLEMENTARY MATERIALS In an effort to provide investors with additional information regarding the company's results as determined by generally accepted accounting principles (GAAP), the company also discusses, in both its earnings press release and earnings presentation materials, the following Non-GAAP information which management believes provides useful information to investors. Non-Recurring and Unique Items Management presents certain financial results excluding the effects of the following one-time items: (1) a 3Q 2005 charge for taxes in connection with the 2005 repatriation of foreign earnings, (2) the operational performance of the company’s divested Personal Computer (“PC”) business, (3) a 2Q 2005 gain on the sale of the company’s PC business, (4) a 2Q 2005 gain related to a settlement agreement reached with Microsoft, (5) 2Q 2005 charges related to the company’s restructuring initiatives, (6) a one-time pre-tax curtailment charge recorded in 4Q 2005 relating to changes to the company’s U.S. defined benefit pension plans, and (7) gains as a result of the sale of certain real estate. Given the unique and/or non-recurring nature of these items, management believes that presenting certain financial information without these items is more representative of the company's operational performance and provides additional insight into, and clarifies the basis for, historical and/or future performance, which may be more useful for investors. Constant Currency Management refers to growth rates at constant currency or adjusting for currency so that the business results can be viewed without the impact of fluctuations in foreign currency exchange rates, thereby facilitating period-to-period comparisons of the company's business performance. Generally, when the dollar either strengthens or weakens against other currencies, the growth at constant currency rates or adjusting for currency will be higher or lower than growth reported at actual exchange rates. -S13- |
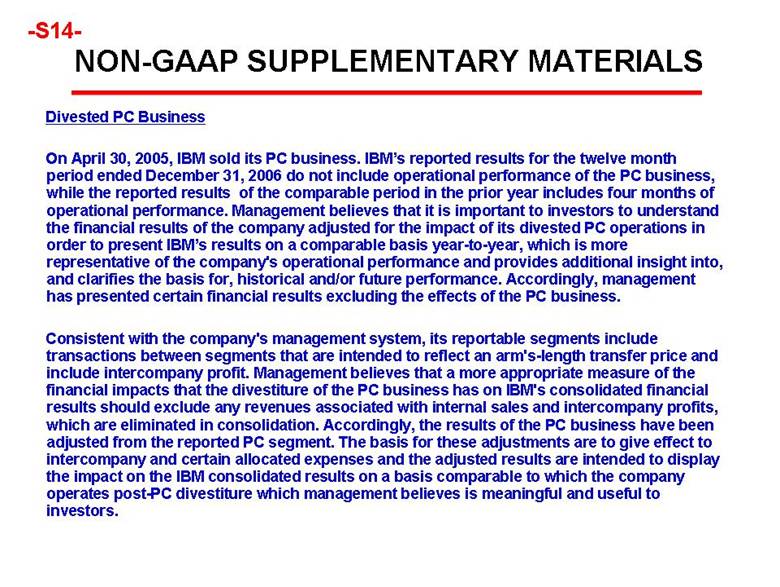
| NON-GAAP SUPPLEMENTARY MATERIALS Divested PC Business On April 30, 2005, IBM sold its PC business. IBM’s reported results for the twelve month period ended December 31, 2006 do not include operational performance of the PC business, while the reported results of the comparable period in the prior year includes four months of operational performance. Management believes that it is important to investors to understand the financial results of the company adjusted for the impact of its divested PC operations in order to present IBM’s results on a comparable basis year-to-year, which is more representative of the company's operational performance and provides additional insight into, and clarifies the basis for, historical and/or future performance. Accordingly, management has presented certain financial results excluding the effects of the PC business. Consistent with the company's management system, its reportable segments include transactions between segments that are intended to reflect an arm's-length transfer price and include intercompany profit. Management believes that a more appropriate measure of the financial impacts that the divestiture of the PC business has on IBM's consolidated financial results should exclude any revenues associated with internal sales and intercompany profits, which are eliminated in consolidation. Accordingly, the results of the PC business have been adjusted from the reported PC segment. The basis for these adjustments are to give effect to intercompany and certain allocated expenses and the adjusted results are intended to display the impact on the IBM consolidated results on a basis comparable to which the company operates post-PC divestiture which management believes is meaningful and useful to investors. -S14- |
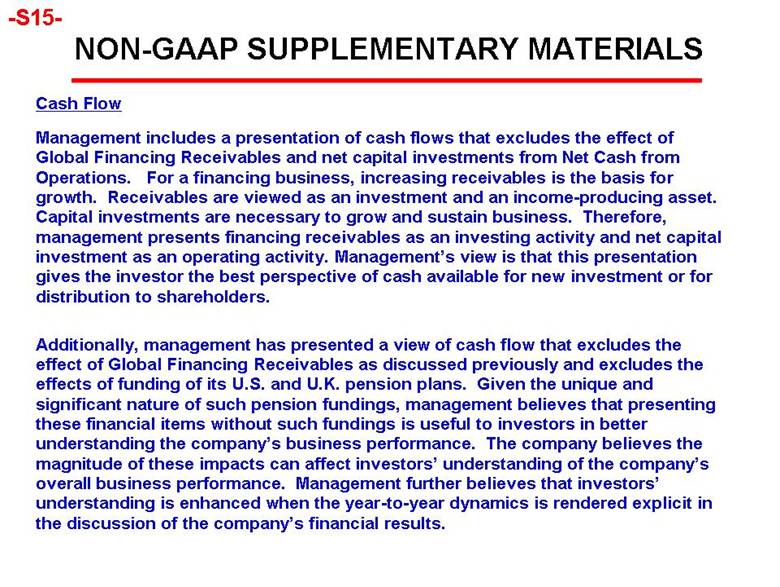
| NON-GAAP SUPPLEMENTARY MATERIALS Cash Flow Management includes a presentation of cash flows that excludes the effect of Global Financing Receivables and net capital investments from Net Cash from Operations. For a financing business, increasing receivables is the basis for growth. Receivables are viewed as an investment and an income-producing asset. Capital investments are necessary to grow and sustain business. Therefore, management presents financing receivables as an investing activity and net capital investment as an operating activity. Management’s view is that this presentation gives the investor the best perspective of cash available for new investment or for distribution to shareholders. Additionally, management has presented a view of cash flow that excludes the effect of Global Financing Receivables as discussed previously and excludes the effects of funding of its U.S. and U.K. pension plans. Given the unique and significant nature of such pension fundings, management believes that presenting these financial items without such fundings is useful to investors in better understanding the company’s business performance. The company believes the magnitude of these impacts can affect investors’ understanding of the company’s overall business performance. Management further believes that investors’ understanding is enhanced when the year-to-year dynamics is rendered explicit in the discussion of the company’s financial results. -S15- | |
| NON-GAAP SUPPLEMENTARY MATERIALS Cash Flow Management includes a presentation of cash flows that excludes the effect of Global Financing Receivables and net capital investments from Net Cash from Operations. For a financing business, increasing receivables is the basis for growth. Receivables are viewed as an investment and an income-producing asset. Capital investments are necessary to grow and sustain business. Therefore, management presents financing receivables as an investing activity and net capital investment as an operating activity. Management’s view is that this presentation gives the investor the best perspective of cash available for new investment or for distribution to shareholders. Additionally, management has presented a view of cash flow that excludes the effect of Global Financing Receivables as discussed previously and excludes the effects of funding of its U.S. and U.K. pension plans. Given the unique and significant nature of such pension fundings, management believes that presenting these financial items without such fundings is useful to investors in better understanding the company’s business performance. The company believes the magnitude of these impacts can affect investors’ understanding of the company’s overall business performance. Management further believes that investors’ understanding is enhanced when the year-to-year dynamics is rendered explicit in the discussion of the company’s financial results. -S15- | |
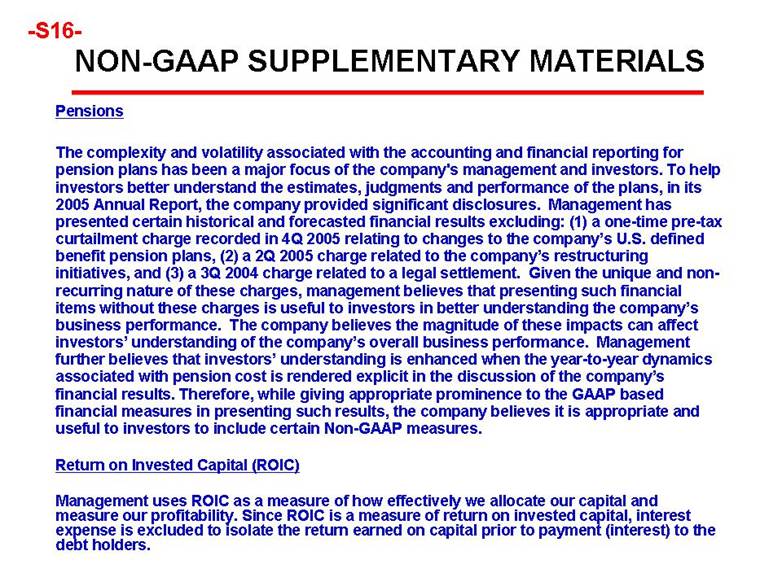
| NON-GAAP SUPPLEMENTARY MATERIALS Pensions The complexity and volatility associated with the accounting and financial reporting for pension plans has been a major focus of the company's management and investors. To help investors better understand the estimates, judgments and performance of the plans, in its 2005 Annual Report, the company provided significant disclosures. Management has presented certain historical and forecasted financial results excluding: (1) a one-time pre-tax curtailment charge recorded in 4Q 2005 relating to changes to the company’s U.S. defined benefit pension plans, (2) a 2Q 2005 charge related to the company’s restructuring initiatives, and (3) a 3Q 2004 charge related to a legal settlement. Given the unique and non-recurring nature of these charges, management believes that presenting such financial items without these charges is useful to investors in better understanding the company’s business performance. The company believes the magnitude of these impacts can affect investors’ understanding of the company’s overall business performance. Management further believes that investors’ understanding is enhanced when the year-to-year dynamics associated with pension cost is rendered explicit in the discussion of the company’s financial results. Therefore, while giving appropriate prominence to the GAAP based financial measures in presenting such results, the company believes it is appropriate and useful to investors to include certain Non-GAAP measures. Return on Invested Capital (ROIC) Management uses ROIC as a measure of how effectively we allocate our capital and measure our profitability. Since ROIC is a measure of return on invested capital, interest expense is excluded to isolate the return earned on capital prior to payment (interest) to the debt holders. -S16- |
| 1.5 16.3 Net Cash from Operations (Cont. Ops.), excluding GF Receivables and excluding Pension Funding 1.7 (1.0) -- (1.0) Plus: U.S. Pension Funding Plus: U.K. Pension Funding 0.1 15.0 Net Cash from Operations (Cont. Ops.) (2.1) (0.3) Plus: GF Accounts Receivable 2.2 15.3 Net Cash from Operations (Cont. Ops.), excluding GF Receivables Yr/Yr ($B) RECONCILIATION TO NET CASH FROM OPERATIONS NON-GAAP SUPPLEMENTARY MATERIALS The above serves to reconcile the Non-GAAP financial information contained in the discussion regarding Cash Flow in Mark Loughridge’s earnings presentation. See Slide S15 and S16 of this presentation for additional information on the use of these Non-GAAP financial measures. -S17- 2006 |

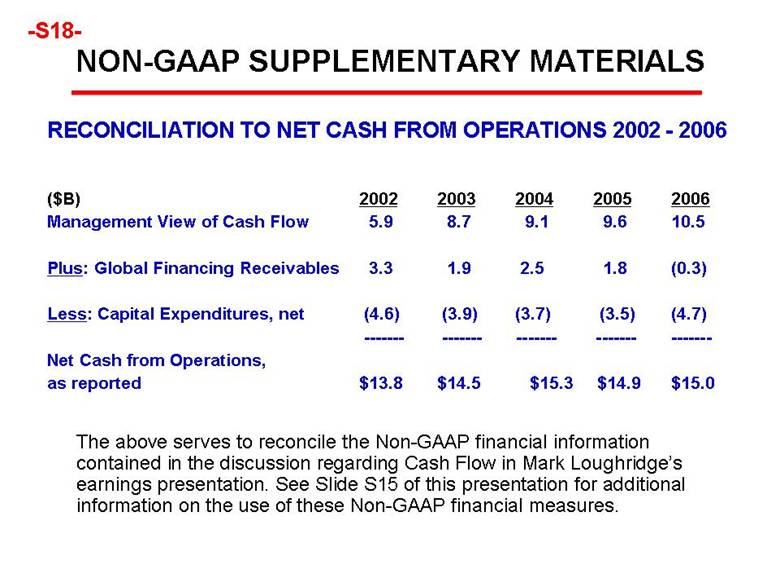
| NON-GAAP SUPPLEMENTARY MATERIALS RECONCILIATION TO NET CASH FROM OPERATIONS 2002 - 2006 ($B) 2002 2003 2004 2005 2006 Management View of Cash Flow 5.9 8.7 9.1 9.6 10.5 Plus: Global Financing Receivables 3.3 1.9 2.5 1.8 (0.3) Less: Capital Expenditures, net (4.6) (3.9) (3.7) (3.5) (4.7) ------- ------- ------- ------- ------- Net Cash from Operations, as reported $13.8 $14.5 $15.3 $14.9 $15.0 The above serves to reconcile the Non-GAAP financial information contained in the discussion regarding Cash Flow in Mark Loughridge’s earnings presentation. See Slide S15 of this presentation for additional information on the use of these Non-GAAP financial measures. -S18- |
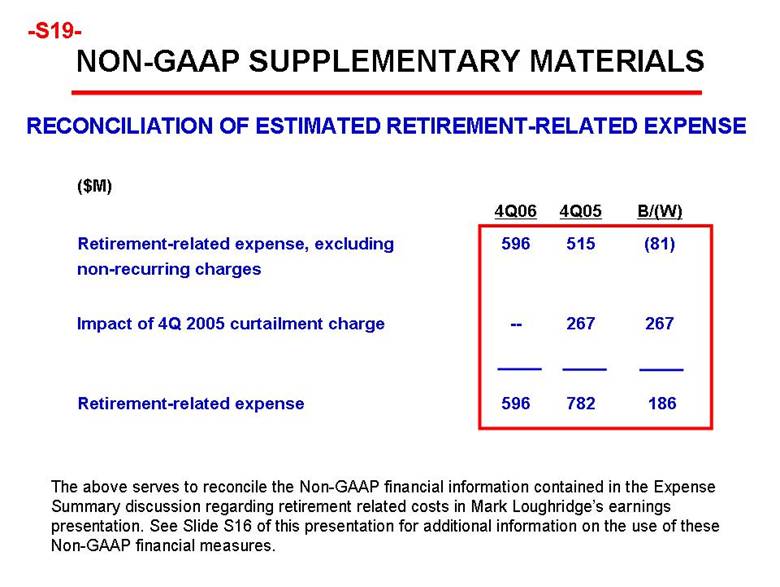
| RECONCILIATION OF ESTIMATED RETIREMENT-RELATED EXPENSE 4Q05 782 267 515 186 596 Retirement-related expense -- 596 B/(W) ($M) 267 Impact of 4Q 2005 curtailment charge (81) Retirement-related expense, excluding non-recurring charges -S19- The above serves to reconcile the Non-GAAP financial information contained in the Expense Summary discussion regarding retirement related costs in Mark Loughridge’s earnings presentation. See Slide S16 of this presentation for additional information on the use of these Non-GAAP financial measures. NON-GAAP SUPPLEMENTARY MATERIALS 4Q06 |
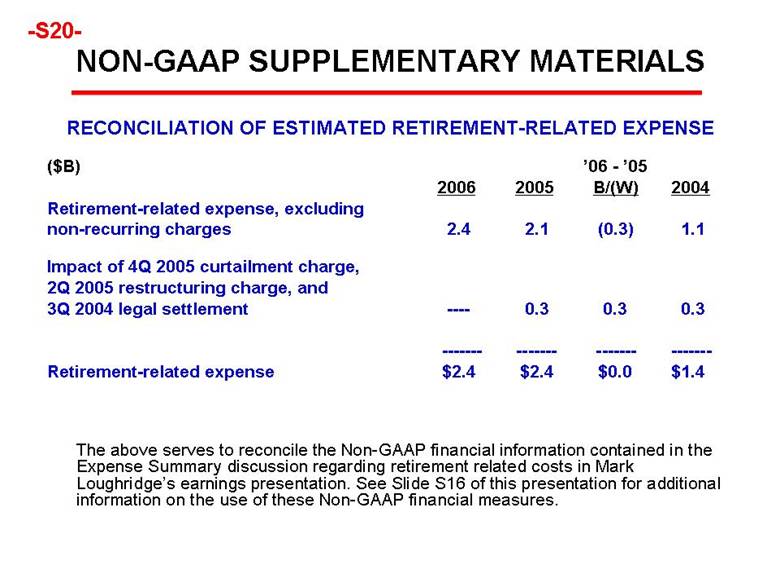
| NON-GAAP SUPPLEMENTARY MATERIALS RECONCILIATION OF ESTIMATED RETIREMENT-RELATED EXPENSE ($B) ’06 - ’05 2006 2005 B/(W) 2004 Retirement-related expense, excluding non-recurring charges 2.4 2.1 (0.3) 1.1 Impact of 4Q 2005 curtailment charge, 2Q 2005 restructuring charge, and 3Q 2004 legal settlement ---- 0.3 0.3 0.3 ------- ------- ------- ------- Retirement-related expense $2.4 $2.4 $0.0 $1.4 The above serves to reconcile the Non-GAAP financial information contained in the Expense Summary discussion regarding retirement related costs in Mark Loughridge’s earnings presentation. See Slide S16 of this presentation for additional information on the use of these Non-GAAP financial measures. -S20- | |
| NON-GAAP SUPPLEMENTARY MATERIALS -S20- RECONCILIATION ESTIMATED RETIREMENT-RELATED EXPENSE ($B) ’06 - ’05 2006 2005 B/(W) 2004 Retirement-related expense, excluding non-recurring charges 2.4 2.1 (0.3) 1.1 Impact of 4Q 2005 curtailment charge, 2Q 2005 restructuring charge, and 3Q 2004 legal settlement ---- 0.3 0.3 0.3 ------- ------- ------- ------- Retirement-related expense $2.4 $2.4 $0.0 $1.4 The above serves to reconcile the Non-GAAP financial information contained in the Expense Summary discussion regarding retirement related costs in Mark Loughridge’s earnings presentation. See Slide S16 of this presentation for additional information on the use of these Non-GAAP financial measures. | |
| RECONCILIATION OF REVENUE GROWTH IN EMERGING COUNTRIES -S21- 5% 16% 10% 21% Total Emerging Countries w/o PC 18% 21% Total Emerging Countries 38% 38% Russia 31% 33% India 18% 20% China 9% 15% Brazil @CC As Reported 4Q06 B/(W) Yr/Yr NON-GAAP SUPPLEMENTARY MATERIALS The above serves to reconcile the Non-GAAP financial information contained in the Geographic Revenue discussion regarding revenue growth in certain countries in Mark Loughridge’s earnings presentation. See Slides S13 and S14 of this presentation for additional information on the use of these Non-GAAP financial measures. 2006 B/(W) Yr/Yr |
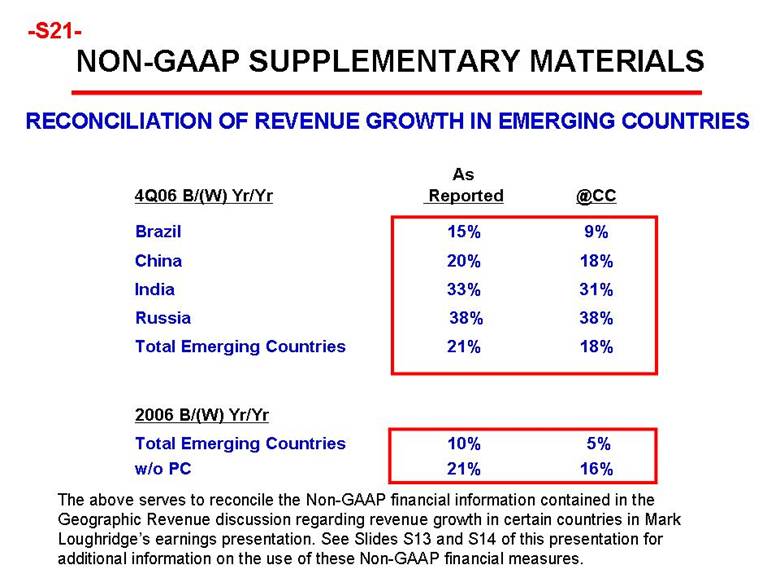
| NON-GAAP SUPPLEMENTARY MATERIALS The above serves to reconcile the Non-GAAP financial information contained in the Geographic Revenue discussion regarding 2006 business model performance in Mark Loughridge’s earnings presentation. See Slide S16 of this presentation for additional information on the use of these Non-GAAP financial measures * Calculated using IBM’s consolidated effective tax rate ** Allocated based on ratio of Global Financing debt to total 16,750 Global Financing Invested Capital 25,536 (b) Invested Capital, excluding GF business 13,539 Total Global Financing Invested Capital: 42,286 IBM Invested Capital 28,506 13,780 Total IBM Invested Capital: Non-GF income from continuing operations Income from continuing operations, as reported FY 2006 ($M) (a) Income from continuing operations, excluding Global Financing business and interest expense Numerator: 34% * (a)/(b) Return on Invested Capital, excluding Global Financing business and Interest Expense Denominator: -S22- RECONCILIATION OF ROIC Stockholders’ Equity 3,211 8,698 9,416 Less: Global Financing net income 914 8,502 Add: Interest Expense, after tax* 196 Long-Term debt Stockholders’ Equity Long-term debt** |
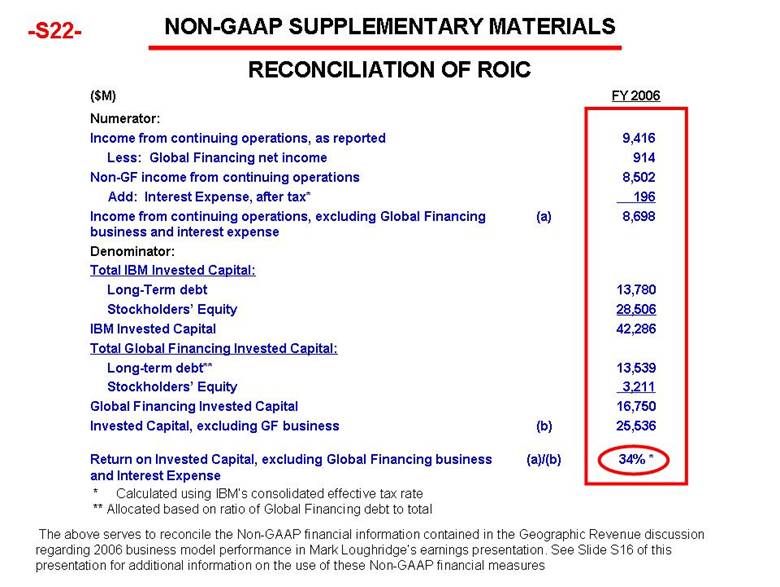
| -S23- COMPUTATION OF 2006 GLOBAL FINANCING RETURN ON EQUITY The following are details on the computation of IBM’s Global Financing Return on Equity. The Global Financing segment is in the business of providing financing to IBM’s clients and its business partners, and is measured as if it were a standalone entity. A financing business is managed on a leveraged basis and therefore, we measure the profitability of a financing entity based on its after-tax earnings in relation to the equity employed in the business . FY 2006 ($M) (a) Global Financing After Tax Income* Numerator: 30% * (a)/(b) Global Financing Return on Equity 3,097 (b) Average Global Financing Equity** Denominator: * Calculated based upon an estimated tax rate principally based on Global Financing’s geographic mix of earnings as IBM’s provision for income taxes is determined on a consolidated basis. ** Average of the ending equity for the Global Financing Segment for the last five quarters. 914 |
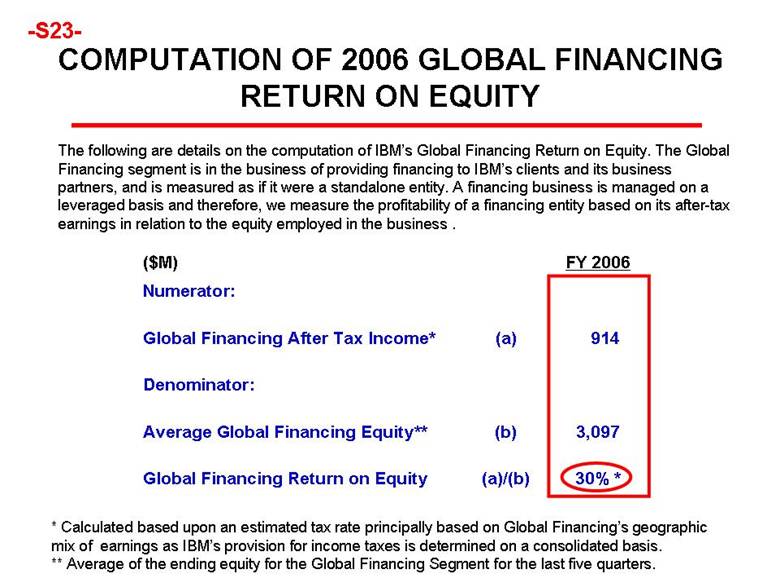
|
|