Exhibit 99.3
| |
| IBM 3Q 2021 Earnings October 20, 2021 ibm.com/investor |
| Forward Looking Statements and Non-GAAP Information Certain comments made in this presentation may be characterized as forward looking under the PrivateSecurities Litigation Reform Act of 1995. Forward-looking statements are based on the company’s current assumptions regarding future business and financial performance. Those statements by their nature address matters that are uncertain to different degrees. Those statements involve a number of factors that could cause actual results to differ materially. Additional information concerning these factors is contained in the Company’s filings with the SEC. Copies are available from the SEC, from the IBM website, or from IBM Investor Relations. Any forward -looking statement made during this presentation speaks only as of the date on which it is made. The company assumes no obligation to update or revise any forward-looking statements except as required by law; these charts and the associated remarks and comments are integrally related and are intended to be presented and understood together. In an effort to provide additional and useful information regarding the company’s financial results and other financial information as determined by generally accepted accounting principles (GAAP), the company also discusses, in its earnings press release and earnings presentation materials, certain non-GAAP information including year to year change in revenue for Red Hat normalized for historical comparability, revenue normalized to exclude Kyndryl, revenue adjusting for divested businesses and currency, operating earnings, other “operating” financial measures, including free cash flow, adjusted free cash flow, net cash from operating activities excluding Global Financing receivables, and adjustments for currency. The rationale for management’s use of this non-GAAP information is included as Exhibit 99.2 to the company’s Form 8-K submitted to the SEC on October 20, 2021. The reconciliation of non-GAAP information to GAAP is included on the slides entitled “Non-GAAP Supplemental Materials” in this presentation, as well as in Exhibit 99.1 to the company’s Form 8-K submitted to the SECon October 20, 2021. For other related information please visit the Company’s investor relations website at: https://www.ibm.com/investor/events/earnings-3q21 2 |
| Arvind Krishna Chairman and Chief Executive Officer James Kavanaugh SVP, Finance & Operations, Chief Financial Officer 3 |

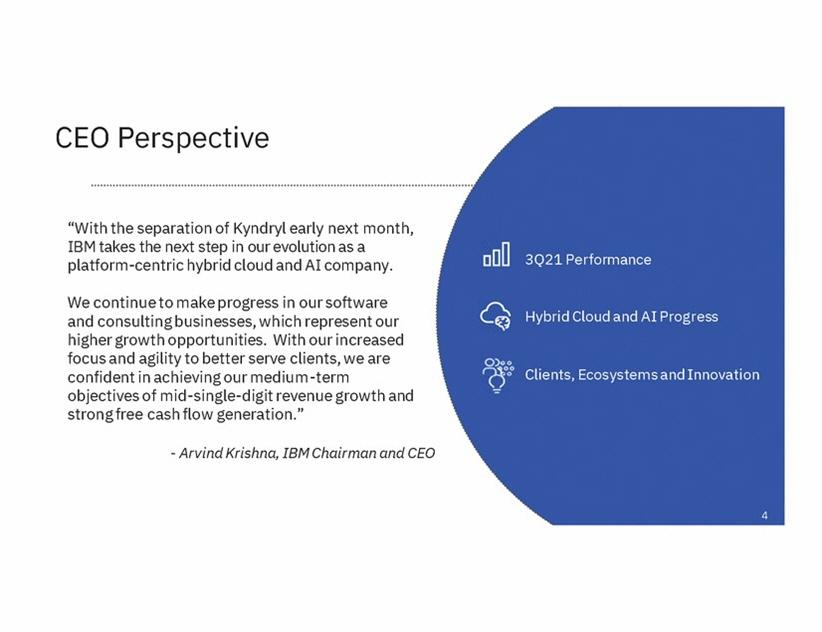
| CEO Perspective “With the separation of Kyndryl early next month, IBM takes the next step in our evolution as a platform-centric hybrid cloud and AI company. 3Q21 Performance We continue to make progress in our software and consulting businesses, which represent our higher growth opportunities. With our increased focus and agility to better serve clients, we are confident in achieving our medium-term objectives of mid-single-digit revenue growth and strong free cash flow generation.” Hybrid Cloud and AI Progress Clients, Ecosystems and Innovation - Arvind Krishna, IBM Chairman and CEO 4 |
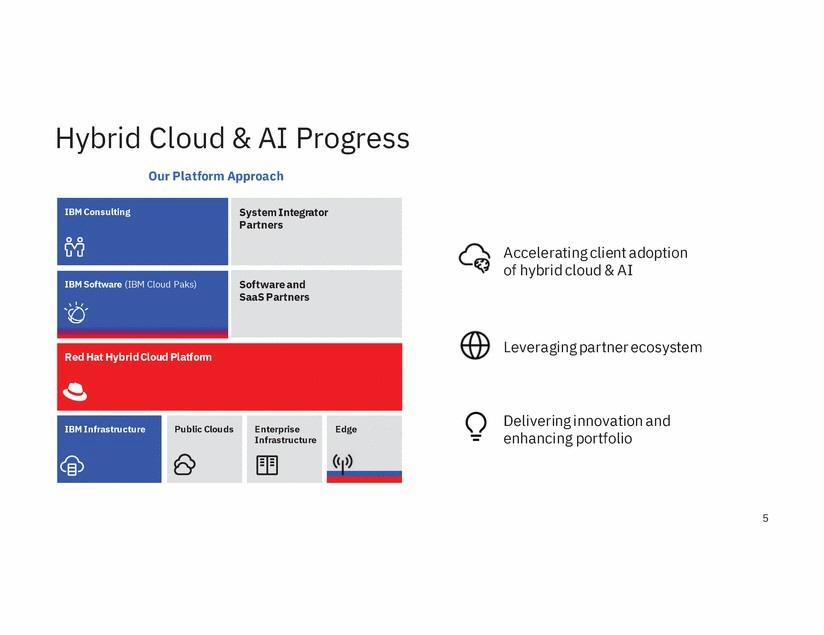
| Hybrid Cloud & AI Our Platform Approach Progress Accelerating client adoption of hybrid cloud & AI IBM Software (IBM Cloud Paks) Leveraging partner ecosystem Delivering innovation and enhancing portfolio 5 Enterprise Infrastructure Public Clouds IBM Infrastructure Edge Red Hat Hybrid Cloud Platform Software and SaaS Partners System Integrator Partners IBM Consulting |
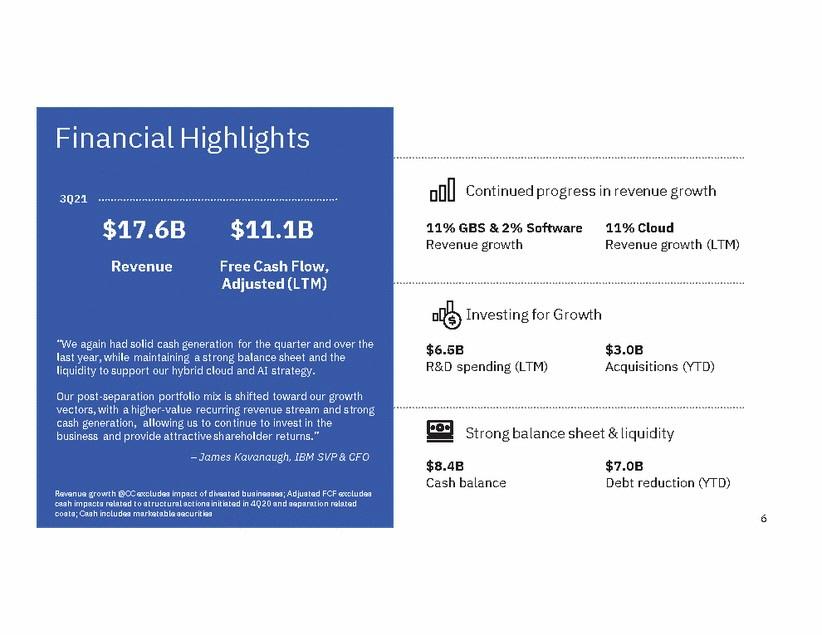
| Revenue growth Revenue growth (LTM) 6 Financial Highlights 3Q21 $17.6B $11.1B RevenueFree Cash Flow, Adjusted (LTM) “We again had solid cash generation for the quarter and over the last year, while maintaining a strong balance sheet and the liquidity to support our hybrid cloud and AI strategy. Our post-separation portfolio mix is shifted toward our growth vectors, with a higher-value recurring revenue stream and strong cash generation, allowing us to continue to invest in the business and provide attractive shareholder returns.” – James Kavanaugh, IBM SVP & CFO Revenue growth @CC excludes impact of divested businesses; Adjusted FCF excludes cash impacts related to structural actions initiated in 4Q20 and separation related costs; Cash includes marketable securities Continued progress in revenue growth 11% GBS & 2% Software 11% Cloud Investing for Growth $6.5B $3.0B R&D spending (LTM)Acquisitions (YTD) Strong balance sheet & liquidity $8.4B $7.0B Cash balance Debt reduction (YTD) |
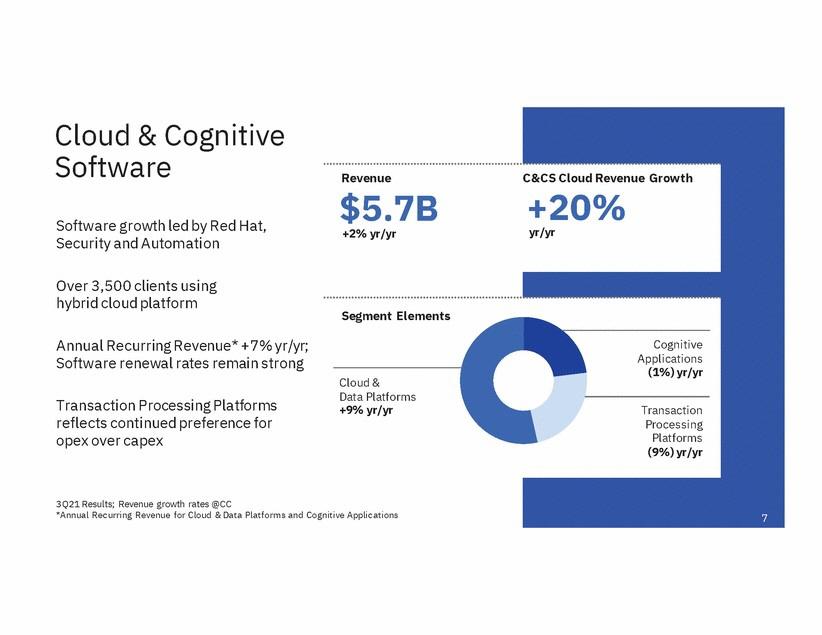
| Cloud & Cognitive Software Revenue C&CS Cloud Revenue Growth +20% yr/yr $5.7B +2% yr/yr Software growth led by Red Hat, Security and Automation Over 3,500 clients using hybrid cloud platform Segment Elements Annual Recurring Revenue* +7% yr/yr; Software renewal rates remain strong Cognitive Applications (1%) yr/yr Cloud & Data Platforms +9% yr/yr Transaction Processing Platforms reflects continued preference for opex over capex Transaction Processing Platforms (9%) yr/yr 3Q21 Results; Revenue growth rates @CC *Annual Recurring Revenue for Cloud & Data Platforms and Cognitive Applications 7 |
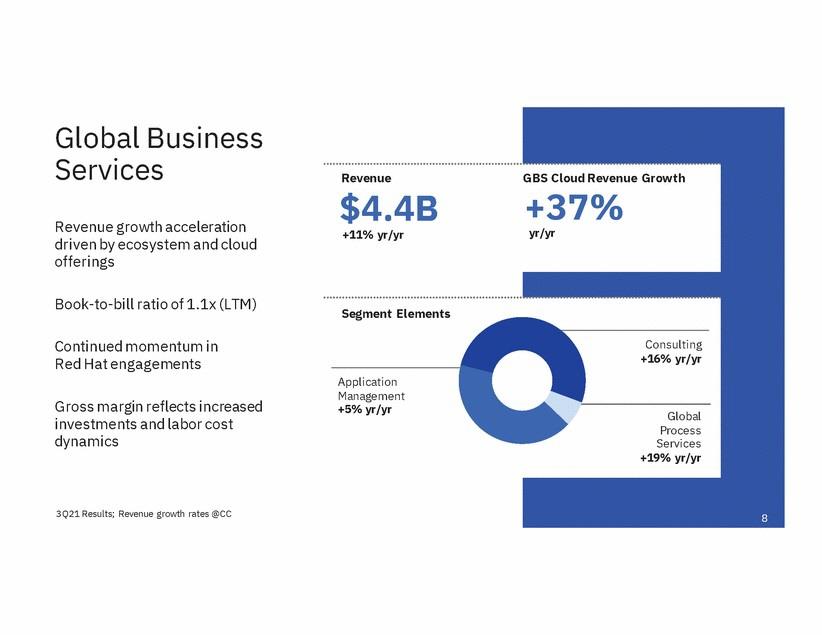
| Global Business Services Revenue $4.4B +11% yr/yr GBS Cloud Revenue Growth +37% yr/yr Revenue growth acceleration driven by ecosystem and cloud offerings Book-to-bill ratio of 1.1x (LTM) Segment Elements Consulting +16% yr/yr Continued momentum in Red Hat engagements Application Management +5% yr/yr Gross margin reflects increased investments and labor cost dynamics Global Process Services +19% yr/yr 3Q21 Results; Revenue growth rates @CC 8 |
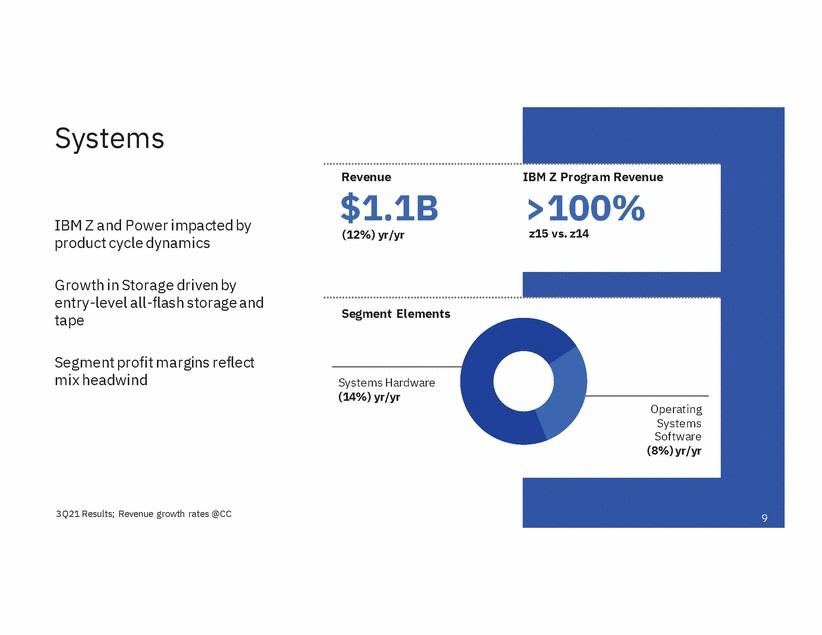
| Systems Revenue $1.1B (12%) yr/yr IBM Z Program Revenue >100% z15 vs. z14 IBM Z and Power impacted by product cycle dynamics Growth in Storage driven by entry-level all-flash storage and tape Segment Elements Segment profit margins reflect mix headwind Systems Hardware (14%) yr/yr Operating Systems Software (8%) yr/yr 3Q21 Results; Revenue growth rates @CC 9 |
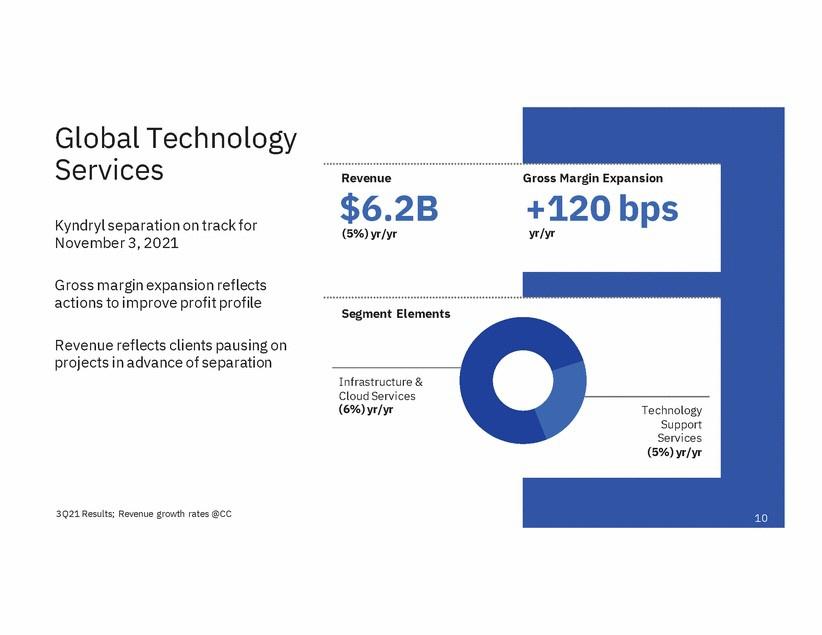
| Global Technology Services Revenue Gross Margin Expansion $6.2B (5%) yr/yr +120 yr/yr bps Kyndryl separation on track for November 3, 2021 Gross margin expansion reflects actions to improve profit profile Segment Elements Revenue reflects clients pausing on projects in advance of separation Infrastructure & Cloud Services (6%) yr/yr Technology Support Services (5%) yr/yr 3Q21 Results; Revenue growth rates @CC 10 |
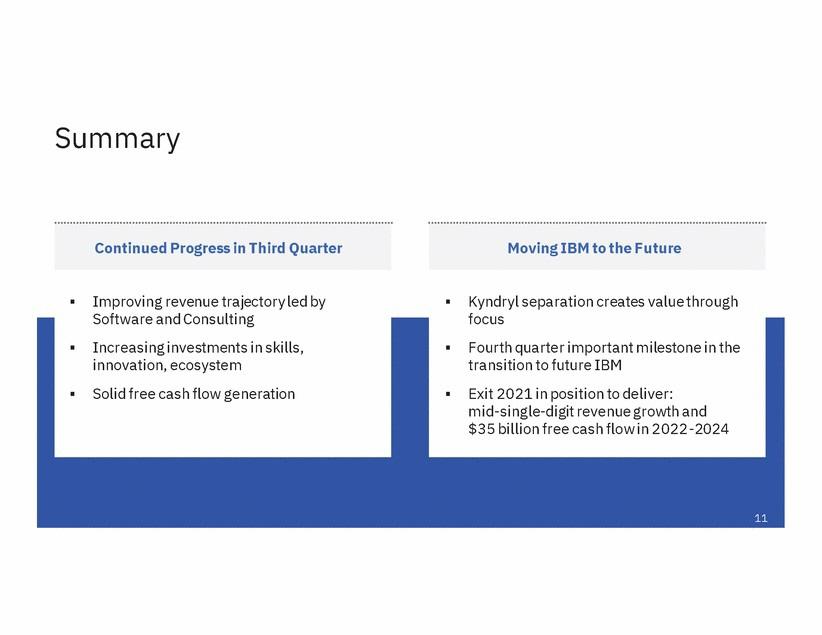
| Summary Improving revenue trajectory led by Software and Consulting Kyndryl separation creates value through focus ƒ ƒ Increasing investments in skills, innovation, ecosystem Solid free cash flow generation Fourth quarter important milestone in the transition to future IBM Exit 2021 in position to deliver: mid-single-digit revenue growth and $35 billion free cash flow in 2022-2024 ƒ ƒ ƒ ƒ 11 Moving IBM to the Future Continued Progress in Third Quarter |
| ibm.com/investor |

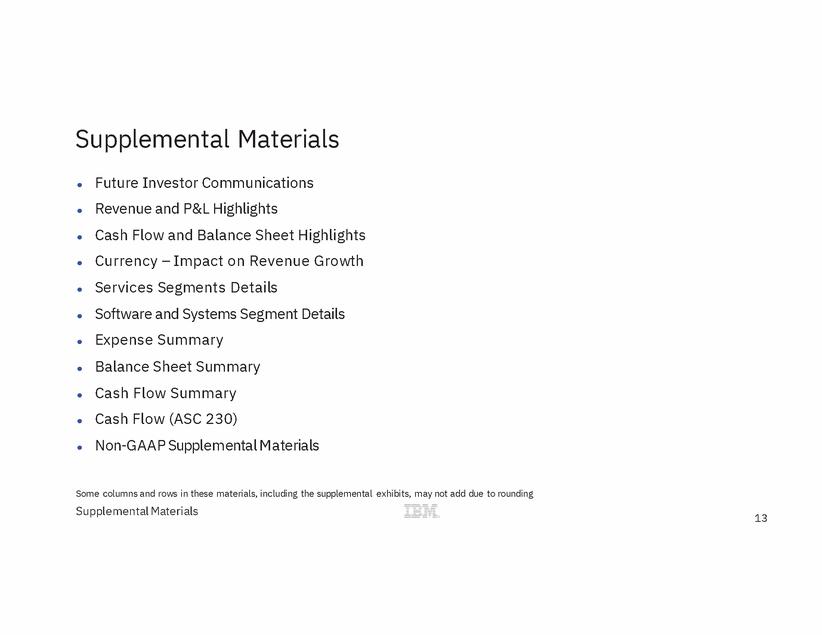
| Supplemental Materials Future Investor Communications Revenue and P&L Highlights Cash Flow and Balance Sheet Highlights Currency – Impact on Revenue Growth Services Segments Details Software and Systems Segment Details Expense Summary Balance Sheet Summary Cash Flow Summary Cash Flow (ASC 230) Non-GAAP Supplemental Materials ● ● ● ● ● ● ● ● ● ● ● Some columns and rows in these materials, including the supplemental exhibits, may not add due to rounding Supplemental Materials 13 |
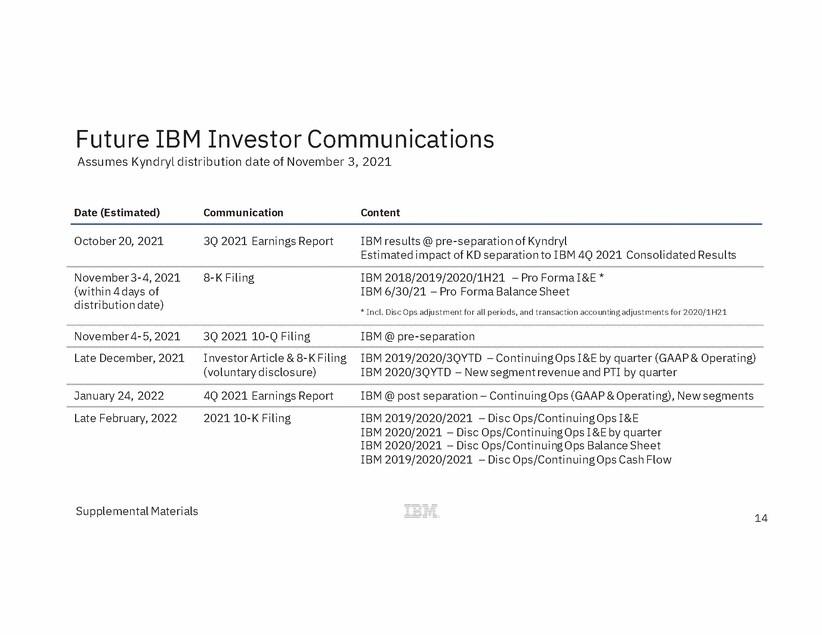
| Future IBM Investor Communications Assumes Kyndryl distribution date of November 3, 2021 Date (Estimated) Communication Content October 20, 2021 3Q 2021 Earnings Report IBM results @ pre-separation of Kyndryl Estimated impact of KD separation to IBM 4Q 2021 Consolidated Results November 3-4, 2021 (within 4 days of distribution date) 8-K Filing IBM 2018/2019/2020/1H21 – Pro Forma I&E * IBM 6/30/21 – Pro Forma Balance Sheet * Incl. Disc Ops adjustment for all periods, and transaction accounting adjustments for 2020/1H21 November 4-5, 2021 3Q 2021 10-Q Filing IBM @ pre-separation Late December, 2021 Investor Article & 8-K Filing (voluntary disclosure) IBM 2019/2020/3QYTD – Continuing Ops I&E by quarter (GAAP & Operating) IBM 2020/3QYTD – New segment revenue and PTI by quarter January 24, 2022 4Q 2021 Earnings Report IBM @ post separation – Continuing Ops (GAAP & Operating), New segments Late February, 2022 2021 10-K Filing IBM 2019/2020/2021 – Disc Ops/Continuing Ops I&E IBM 2020/2021 – Disc Ops/Continuing Ops I&E by quarter IBM 2020/2021 – Disc Ops/Continuing Ops Balance Sheet IBM 2019/2020/2021 – Disc Ops/Continuing Ops Cash Flow Supplemental Materials 14 |
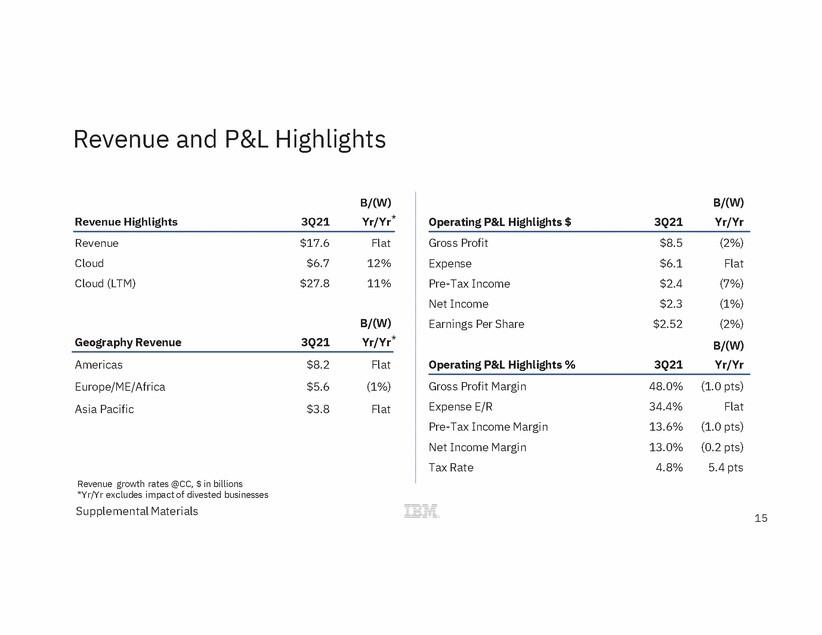
| Revenue and P&L Highlights B/(W) Yr/Yr* B/(W) Yr/Yr Revenue Highlights 3Q21 Operating P&L Highlights $ 3Q21 Revenue Cloud Cloud (LTM) $17.6 $6.7 $27.8 Flat 12% 11% Gross Profit Expense Pre-Tax Income Net Income Earnings Per Share $8.5 $6.1 $2.4 $2.3 $2.52 (2%) Flat (7%) (1%) (2%) B/(W) Yr/Yr B/(W) Yr/Yr* Geography Revenue 3Q21 Americas Europe/ME/Africa Asia Pacific $8.2 $5.6 $3.8 Flat (1%) Flat Operating P&L Highlights % 3Q21 Gross Profit Margin Expense E/R Pre-Tax Income Margin Net Income Margin Tax Rate 48.0% 34.4% 13.6% 13.0% 4.8% (1.0 pts) Flat (1.0 pts) (0.2 pts) 5.4 pts Revenue growth rates @CC, $ in billions *Yr/Yr excludes impact of divested businesses Supplemental Materials 15 |
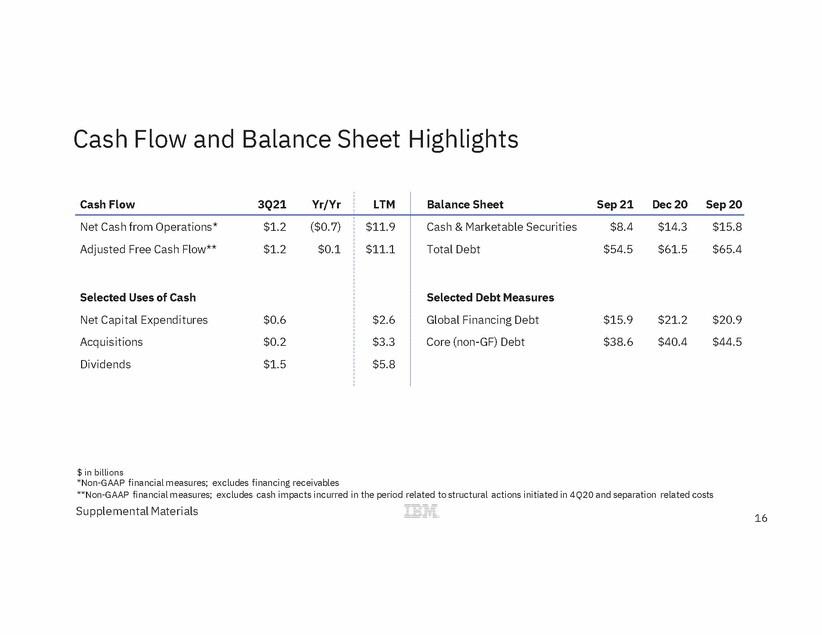
| Cash Flow and Balance Sheet Highlights $ in billions *Non-GAAP financial measures; excludes financing receivables **Non-GAAP financial measures; excludes cash impacts incurred in the period related to structural actions initiated in 4Q20 and separation related costs Supplemental Materials 16 Cash Flow 3Q21 Yr/Yr LTM Balance SheetSep 21 Dec 20 Sep 20 Net Cash from Operations* $1.2 ($0.7) Adjusted Free Cash Flow** $1.2 $0.1 Selected Uses of Cash Net Capital Expenditures $0.6 Acquisitions $0.2 Dividends $1.5 $11.9 $11.1 $2.6 $3.3 $5.8 Cash & Marketable Securities $8.4 $14.3 $15.8 Total Debt $54.5 $61.5 $65.4 Selected Debt Measures Global Financing Debt $15.9 $21.2 $20.9 Core (non-GF) Debt $38.6 $40.4 $44.5 |
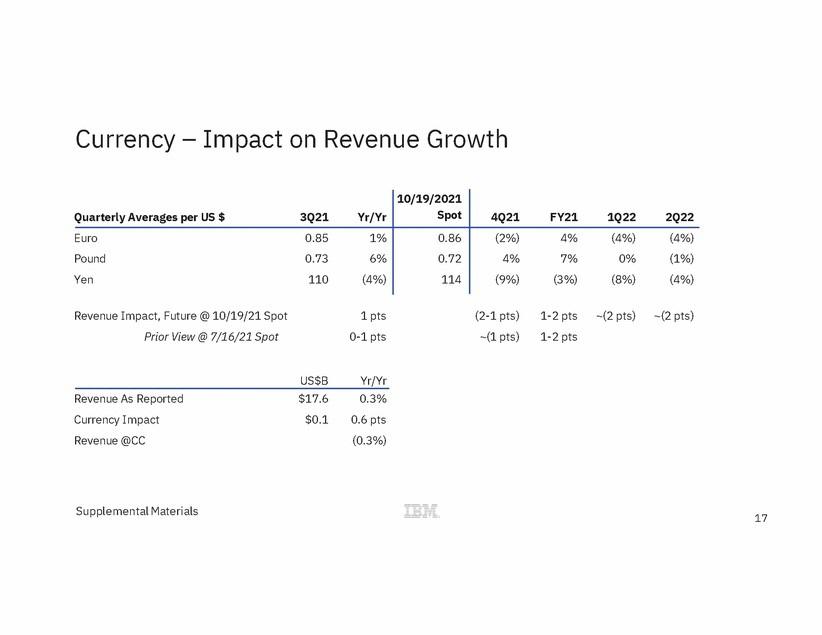
| Currency – Impact on Revenue Growth Revenue Impact, Future @ 10/19/21 Spot Prior View @ 7/16/21 Spot 1 pts 0-1 pts (2-1 pts) ~(1 pts) 1-2 pts 1-2 pts ~(2 pts) ~(2 pts) US$B Yr/Yr Revenue As Reported Currency Impact Revenue @CC $17.6 $0.1 0.3% 0.6 pts (0.3%) Supplemental Materials 17 Quarterly Averages per US $ 3Q21 Yr/Yr 10/19/2021 Spot 4Q21 FY21 1Q22 2Q22 Euro 0.85 1% Pound 0.73 6% Yen 110 (4%) 0.86 0.72 114 (2%) 4% (4%) (4%) 4% 7% 0% (1%) (9%) (3%) (8%) (4%) |
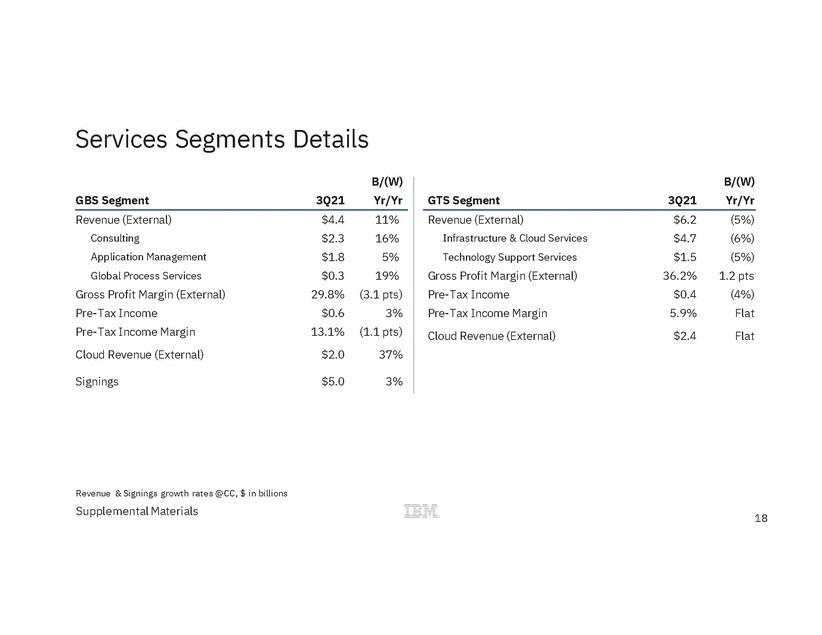
| Services Segments Details B/(W) Yr/Yr B/(W) Yr/Yr GBS Segment 3Q21 GTS Segment 3Q21 Revenue (External) Consulting Application Management Global Process Services Gross Profit Margin (External) Pre-Tax Income Pre-Tax Income Margin Cloud Revenue (External) $4.4 $2.3 $1.8 $0.3 29.8% $0.6 13.1% $2.0 11% 16% 5% 19% (3.1 pts) 3% (1.1 pts) 37% Revenue (External) Infrastructure & Cloud Services Technology Support Services Gross Profit Margin (External) Pre-Tax Income Pre-Tax Income Margin Cloud Revenue (External) $6.2 $4.7 $1.5 36.2% $0.4 5.9% $2.4 (5%) (6%) (5%) 1.2 pts (4%) Flat Flat Signings $5.0 3% Revenue & Signings growth rates @CC, $ in billions Supplemental Materials 18 |
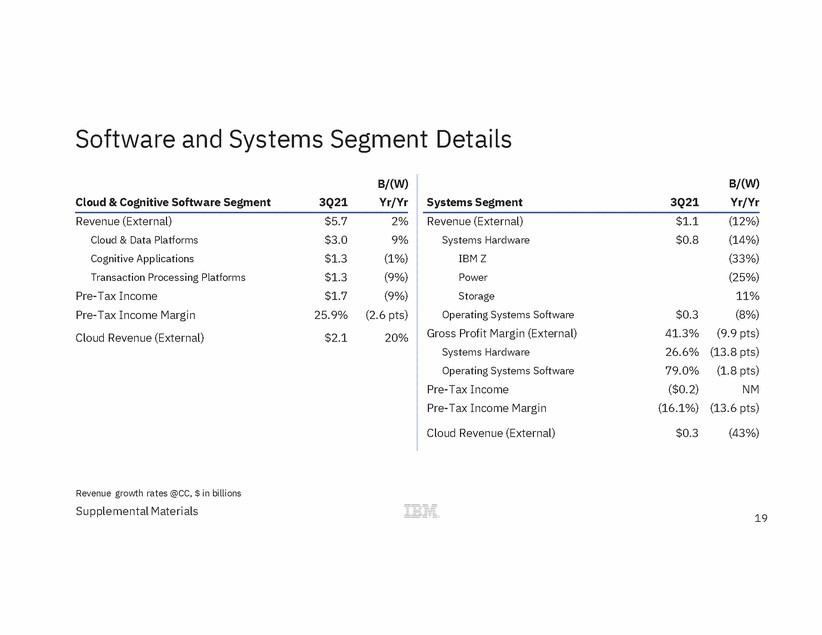
| Software and Systems Segment Details B/(W) Yr/Yr B/(W) Yr/Yr Cloud & Cognitive Software Segment 3Q21 Systems Segment 3Q21 Revenue (External) Systems Hardware IBM Z Power Storage Operating Systems Software Gross Profit Margin (External) Systems Hardware Operating Systems Software Pre-Tax Income Pre-Tax Income Margin $1.1 $0.8 (12%) (14%) (33%) (25%) 11% (8%) (9.9 pts) (13.8 pts) (1.8 pts) NM (13.6 pts) Revenue (External) Cloud & Data Platforms Cognitive Applications Transaction Processing Platforms Pre-Tax Income Pre-Tax Income Margin Cloud Revenue (External) $5.7 $3.0 $1.3 $1.3 $1.7 25.9% $2.1 2% 9% (1%) (9%) (9%) (2.6 pts) 20% $0.3 41.3% 26.6% 79.0% ($0.2) (16.1%) Cloud Revenue (External) $0.3 (43%) Revenue growth rates @CC, $ in billions Supplemental Materials 19 |
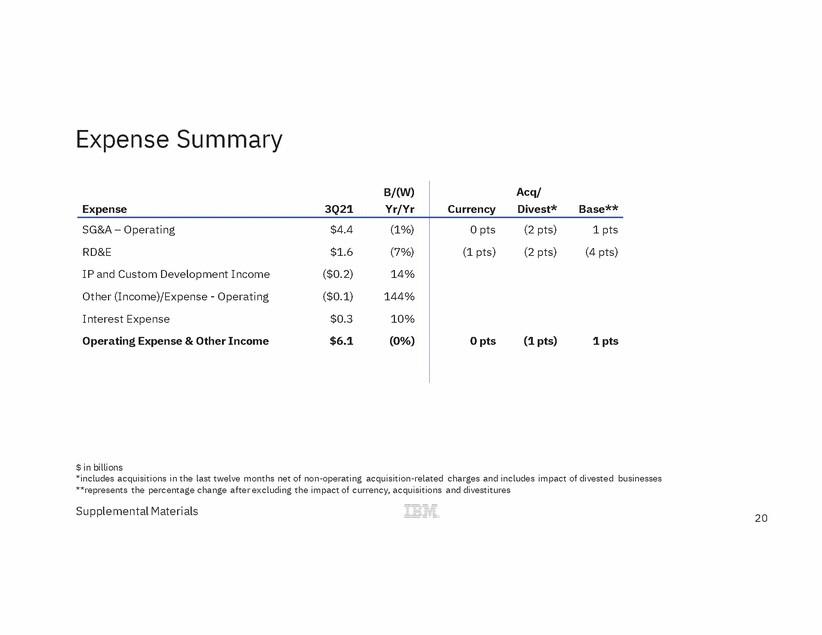
| Expense Summary $ in billions *includes acquisitions in the last twelve months net of non-operating acquisition-related charges and includes impact of divested businesses **represents the percentage change after excluding the impact of currency, acquisitions and divestitures Supplemental Materials 20 B/(W) Expense3Q21 Yr/Yr Acq/ CurrencyDivest*Base** SG&A – Operating $4.4 (1%) RD&E $1.6 (7%) IP and Custom Development Income ($0.2) 14% Other (Income)/Expense - Operating ($0.1) 144% Interest Expense $0.3 10% Operating Expense & Other Income $6.1 (0%) 0 pts (2 pts) 1 pts (1 pts) (2 pts) (4 pts) 0 pts(1 pts)1 pts |
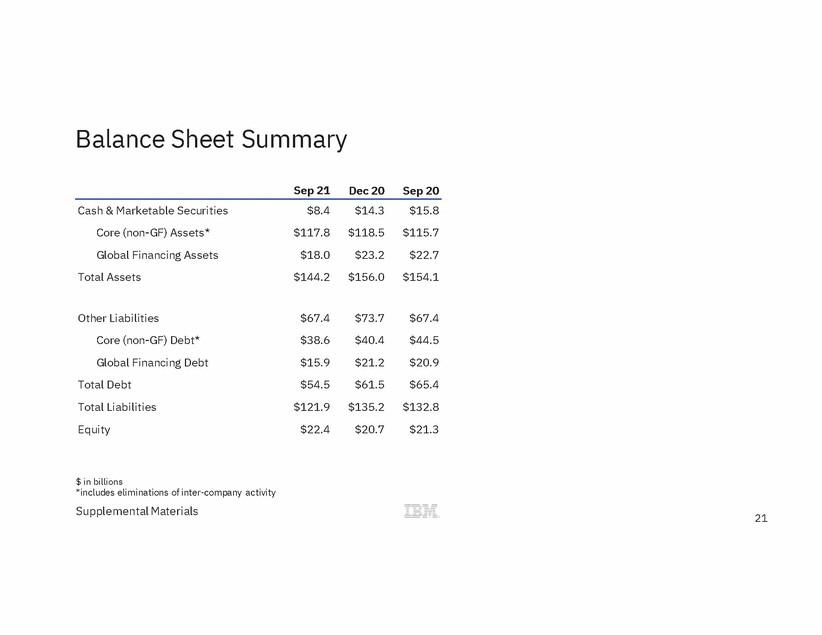
| Balance Sheet Summary Sep 21 Dec 20 Sep 20 Cash & Marketable Securities Core (non-GF) Assets* Global Financing Assets Total Assets $8.4 $117.8 $18.0 $144.2 $14.3 $118.5 $23.2 $156.0 $15.8 $115.7 $22.7 $154.1 Other Liabilities Core (non-GF) Debt* Global Financing Debt Total Debt Total Liabilities Equity $67.4 $38.6 $15.9 $54.5 $121.9 $22.4 $73.7 $40.4 $21.2 $61.5 $135.2 $20.7 $67.4 $44.5 $20.9 $65.4 $132.8 $21.3 $ in billions *includes eliminations of inter-company activity Supplemental Materials 21 |
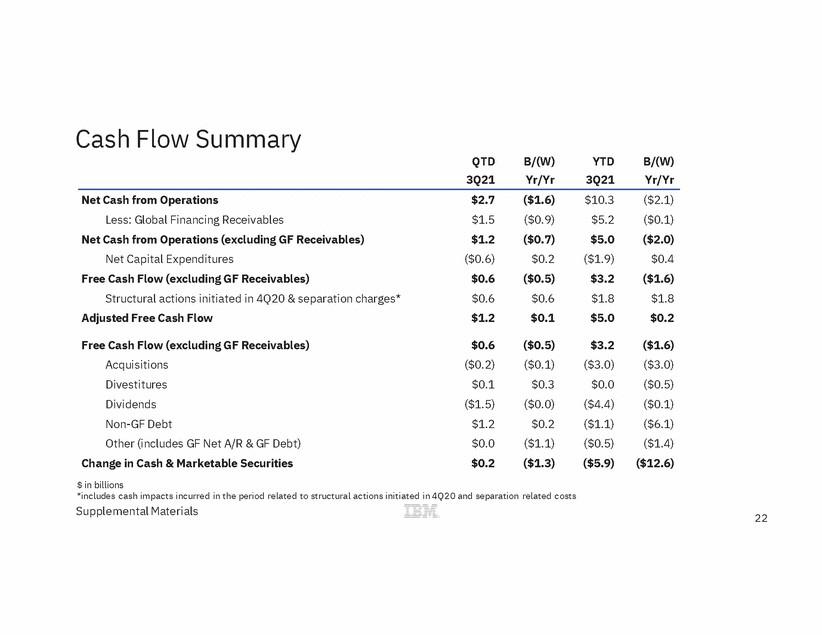
| Cash Flow Summary QTD 3Q21 B/(W) Yr/Yr YTD 3Q21 B/(W) Yr/Yr Net Cash from Operations Less: Global Financing Receivables Net Cash from Operations (excluding GF Receivables) Net Capital Expenditures Free Cash Flow (excluding GF Receivables) Structural actions initiated in 4Q20 & separation charges* Adjusted Free Cash Flow $2.7 $1.5 $1.2 ($0.6) $0.6 $0.6 $1.2 ($1.6) ($0.9) ($0.7) $0.2 ($0.5) $0.6 $0.1 $10.3 $5.2 $5.0 ($1.9) $3.2 $1.8 $5.0 ($2.1) ($0.1) ($2.0) $0.4 ($1.6) $1.8 $0.2 Free Cash Flow (excluding GF Receivables) Acquisitions Divestitures Dividends Non-GF Debt Other (includes GF Net A/R & GF Debt) Change in Cash & Marketable Securities $ in billions $0.6 ($0.2) $0.1 ($1.5) $1.2 $0.0 $0.2 ($0.5) ($0.1) $0.3 ($0.0) $0.2 ($1.1) ($1.3) $3.2 ($3.0) $0.0 ($4.4) ($1.1) ($0.5) ($5.9) ($1.6) ($3.0) ($0.5) ($0.1) ($6.1) ($1.4) ($12.6) *includes cash impacts incurred in the period related to structural actions initiated in 4Q20 and separation related costs Supplemental Materials 22 |
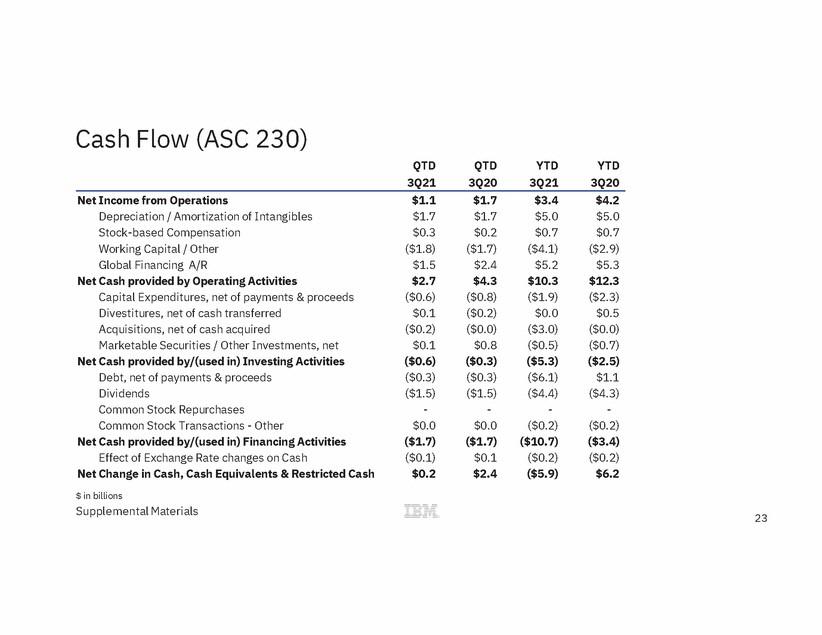
| Cash Flow (ASC 230) QTD 3Q21 QTD 3Q20 YTD 3Q21 YTD 3Q20 Net Income from Operations Depreciation / Amortization of Intangibles Stock-based Compensation Working Capital / Other Global Financing A/R Net Cash provided by Operating Activities Capital Expenditures, net of payments & proceeds Divestitures, net of cash transferred Acquisitions, net of cash acquired Marketable Securities / Other Investments, net Net Cash provided by/(used in) Investing Activities Debt, net of payments & proceeds Dividends Common Stock Repurchases Common Stock Transactions - Other Net Cash provided by/(used in) Financing Activities Effect of Exchange Rate changes on Cash Net Change in Cash, Cash Equivalents & Restricted Cash $ in billions Supplemental Materials $1.1 $1.7 $0.3 ($1.8) $1.5 $2.7 ($0.6) $0.1 ($0.2) $0.1 ($0.6) ($0.3) ($1.5) - $0.0 ($1.7) ($0.1) $0.2 $1.7 $1.7 $0.2 ($1.7) $2.4 $4.3 ($0.8) ($0.2) ($0.0) $0.8 ($0.3) ($0.3) ($1.5) - $0.0 ($1.7) $0.1 $2.4 $3.4 $5.0 $0.7 ($4.1) $5.2 $10.3 ($1.9) $0.0 ($3.0) ($0.5) ($5.3) ($6.1) ($4.4) - ($0.2) ($10.7) ($0.2) ($5.9) $4.2 $5.0 $0.7 ($2.9) $5.3 $12.3 ($2.3) $0.5 ($0.0) ($0.7) ($2.5) $1.1 ($4.3) - ($0.2) ($3.4) ($0.2) $6.2 23 |
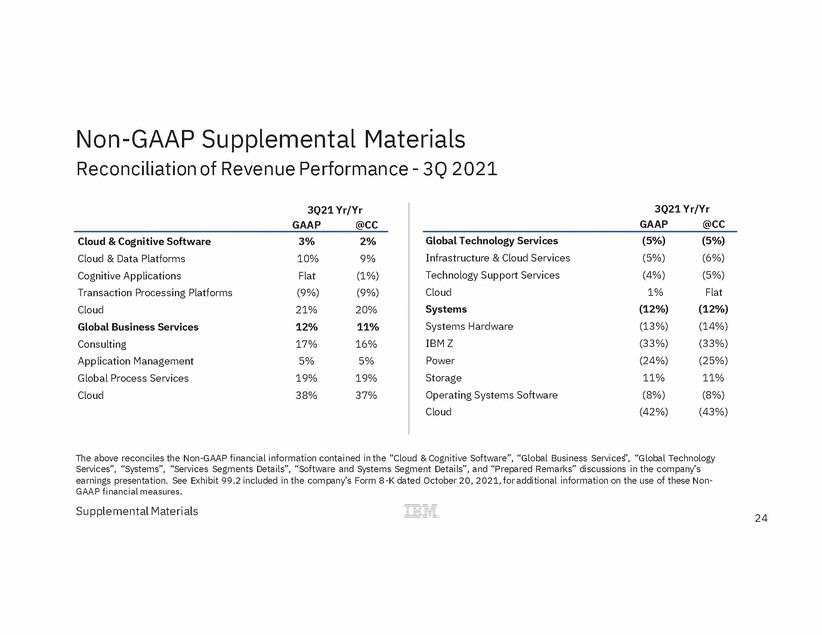
| Non-GAAP Supplemental Materials Reconciliation of Revenue Performance - 3Q 2021 3Q21 Yr/Yr 3Q21 Yr/Yr GAAP @CC GAAP @CC Cloud & Cognitive Software Cloud & Data Platforms Cognitive Applications Transaction Processing Platforms Cloud Global Business Services Consulting Application Management Global Process Services Cloud 3% 10% Flat (9%) 21% 12% 17% 5% 19% 38% 2% 9% (1%) (9%) 20% 11% 16% 5% 19% 37% Global Technology Services Infrastructure & Cloud Services Technology Support Services Cloud Systems Systems Hardware IBM Z Power Storage Operating Systems Software Cloud (5%) (5%) (4%) 1% (12%) (13%) (33%) (24%) 11% (8%) (42%) (5%) (6%) (5%) Flat (12%) (14%) (33%) (25%) 11% (8%) (43%) The above reconciles the Non-GAAP financial information contained in the “Cloud & Cognitive Software”, “Global Business Services”, “Global Technology Services”, “Systems”, “Services Segments Details”, “Software and Systems Segment Details”, and “Prepared Remarks” discussions in the company’s earnings presentation. See Exhibit 99.2 included in the company’s Form 8 -K dated October 20, 2021, for additional information on the use of these Non-GAAP financial measures. Supplemental Materials 24 |
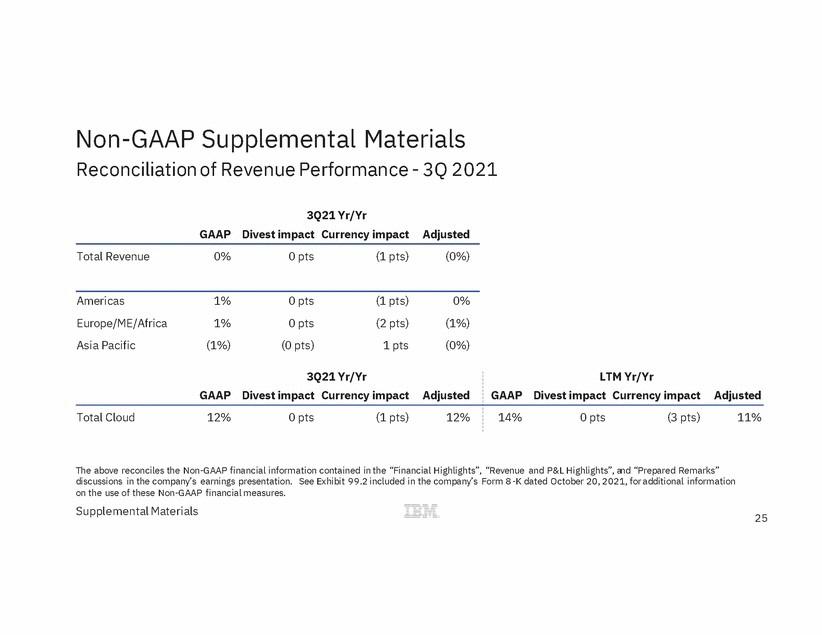
| Non-GAAP Supplemental Materials Reconciliation of Revenue Performance - 3Q 2021 3Q21 Yr/Yr GAAP Divest impact Currency impact Adjusted Total Revenue 0% 0 pts (1 pts) (0%) Americas Europe/ME/Africa Asia Pacific 1% 1% (1%) 0 pts 0 pts (0 pts) (1 pts) (2 pts) 1 pts 0% (1%) (0%) The above reconciles the Non-GAAP financial information contained in the “Financial Highlights”, “Revenue and P&L Highlights”, and “Prepared Remarks” discussions in the company’s earnings presentation. See Exhibit 99.2 included in the company’s Form 8 -K dated October 20, 2021, for additional information on the use of these Non-GAAP financial measures. Supplemental Materials 25 3Q21 Yr/Yr GAAPDivest impact Currency impact Adjusted LTM Yr/Yr GAAPDivest impact Currency impact Adjusted Total Cloud 12% 0 pts (1 pts) 12% 14% 0 pts (3 pts) 11% |
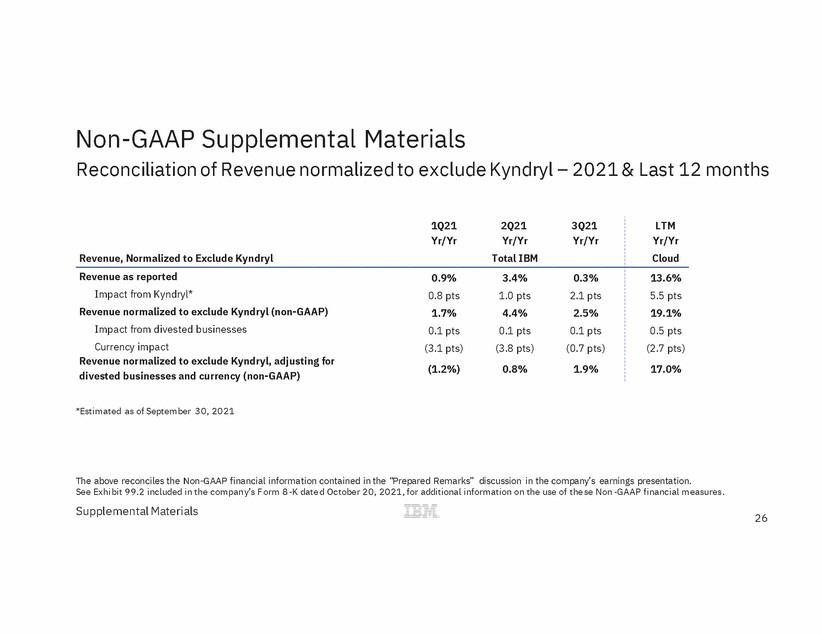
| Non-GAAP Supplemental Materials Reconciliation of Revenue normalized to exclude Kyndryl – 2021 & Last 12 months *Estimated as of September 30, 2021 The above reconciles the Non-GAAP financial information contained in the “Prepared Remarks” discussion in the company’s earnings presentation. See Exhi bit 99.2 included in the company’s F orm 8 -K date d October 20, 2021, for additional information on the use of the se Non -GAAP financial measures. Supplemental Materials 26 1Q21 2Q21 3Q21 Yr/YrYr/YrYr/Yr Revenue, Normalized to Exclude KyndrylTotal IBM LTM Yr/Yr Cloud Revenue as reported0.9% 3.4% 0.3% Impact from Kyndryl* 0.8 pts 1.0 pts 2.1 pts Revenue normalized to exclude Kyndryl (non-GAAP)1.7% 4.4% 2.5% Impact from divested businesses0.1 pts 0.1 pts 0.1 pts Currency impact (3.1 pts) (3.8 pts) (0.7 pts) Revenue normalized to exclude Kyndryl, adjusting for divested businesses and currency (non-GAAP)(1.2%) 0.8% 1.9% 13.6% 5.5 pts 19.1% 0.5 pts (2.7 pts) 17.0% |
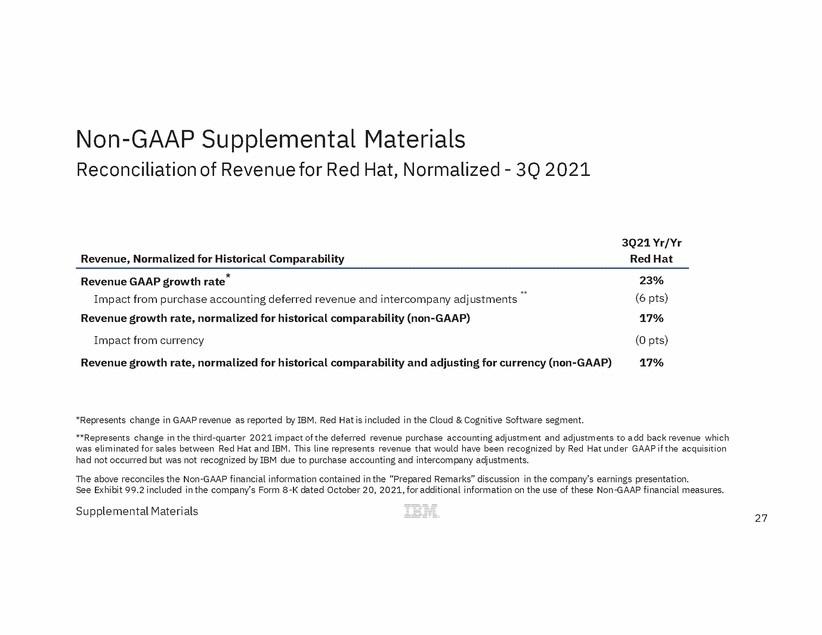
| Non-GAAP Supplemental Materials Reconciliation of Revenue for Red Hat, Normalized - 3Q 2021 3Q21 Yr/Yr Red Hat Revenue, Normalized for Historical Comparability Revenue GAAP growth rate* Impact from purchase accounting deferred revenue and intercompany adjustments ** Revenue growth rate, normalized for historical comparability (non-GAAP) Impact from currency Revenue growth rate, normalized for historical comparability and adjusting for currency (non-GAAP) 23% (6 pts) 17% (0 pts) 17% *Represents change in GAAP revenue as reported by IBM. Red Hat is included in the Cloud & Cognitive Software segment. **Represents change in the third-quarter 2021 impact of the deferred revenue purchase accounting adjustment and adjustments to a dd back revenue which was eliminated for sales between Red Hat and IBM. This line represents revenue that would have been recognized by Red Hat und er GAAP if the acquisition had not occurred but was not recognized by IBM due to purchase accounting and intercompany adjustments. The above reconciles the Non-GAAP financial information contained in the “Prepared Remarks” discussion in the company’s earnings presentation. See Exhibit 99.2 included in the company’s Form 8 -K dated October 20, 2021, for additional information on the use of these Non-GAAP financial measures. Supplemental Materials 27 |
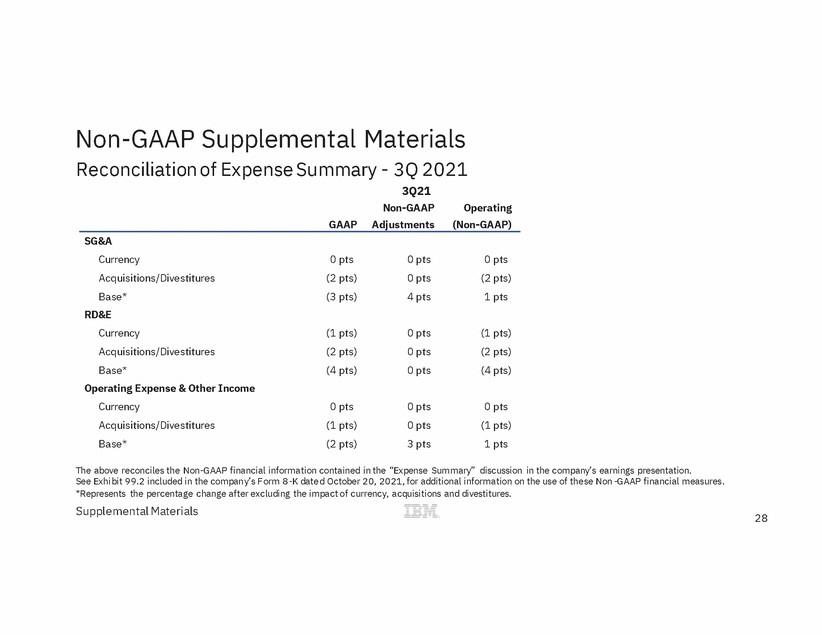
| Non-GAAP Supplemental Materials Reconciliation of Expense Summary - 3Q 2021 3Q21 Non-GAAP Adjustments Operating (Non-GAAP) GAAP SG&A Currency Acquisitions/Divestitures Base* RD&E Currency Acquisitions/Divestitures Base* Operating Expense & Other Income Currency Acquisitions/Divestitures Base* 0 pts (2 pts) (3 pts) 0 pts 0 pts 4 pts 0 pts (2 pts) 1 pts (1 pts) (2 pts) (4 pts) 0 pts 0 pts 0 pts (1 pts) (2 pts) (4 pts) 0 pts (1 pts) (2 pts) 0 pts 0 pts 3 pts 0 pts (1 pts) 1 pts The above reconciles the Non-GAAP financial information contained in the “Expense Summary” discussion in the company’s earnings presentation. See Exhi bit 99.2 included in the company’s F orm 8 -K date d October 20, 2021, for additional information on the use of the se Non -GAAP financial measures. *Represents the percentage change after excluding the impact of currency, acquisitions and divestitures. Supplemental Materials 28 |
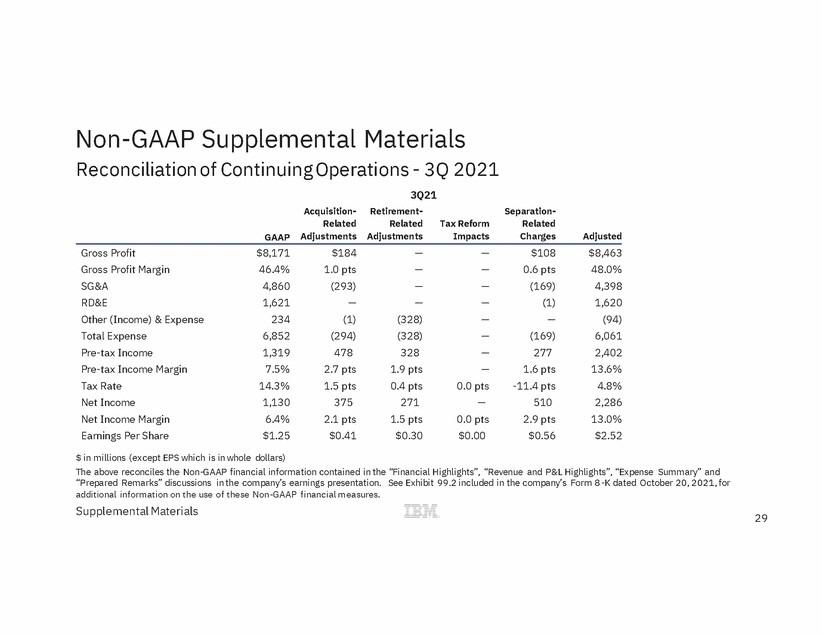
| Non-GAAP Supplemental Materials Reconciliation of Continuing Operations - 3Q 2021 3Q21 Acquisition-Related Adjustments Retirement-Related Adjustments Separation-Related Charges Tax Reform Impacts Adjusted GAAP Gross Profit Gross Profit Margin SG&A RD&E Other (Income) & Expense Total Expense Pre-tax Income Pre-tax Income Margin Tax Rate Net Income Net Income Margin Earnings Per Share $8,171 46.4% 4,860 1,621 234 6,852 1,319 7.5% 14.3% 1,130 6.4% $1.25 $184 1.0 pts (293) — (1) (294) 478 2.7 pts 1.5 pts 375 2.1 pts $0.41 — — — — (328) (328) 328 1.9 pts 0.4 pts 271 1.5 pts $0.30 — — — — — — — — 0.0 pts — 0.0 pts $0.00 $108 0.6 pts (169) (1) — (169) 277 1.6 pts -11.4 pts 510 2.9 pts $0.56 $8,463 48.0% 4,398 1,620 (94) 6,061 2,402 13.6% 4.8% 2,286 13.0% $2.52 $ in millions (except EPS which is in whole dollars) The above reconciles the Non-GAAP financial information contained in the “Financial Highlights”, “Revenue and P&L Highlights”, “Expense Summary” and “Prepared Remarks” discussions in the company’s earnings presentation. See Exhibit 99.2 included in the company’s Form 8 -K dated October 20, 2021, for additional information on the use of these Non-GAAP financial measures. Supplemental Materials 29 |
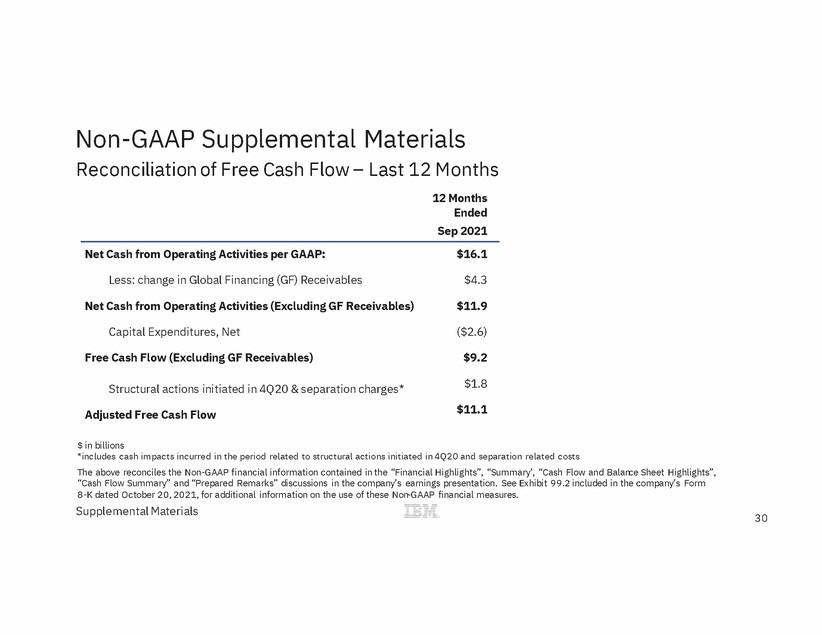
| Non-GAAP Supplemental Materials Reconciliation of Free Cash Flow – Last 12 Months 12 Months Ended Sep 2021 Net Cash from Operating Activities per GAAP: $16.1 Less: change in Global Financing (GF) Receivables $4.3 Net Cash from Operating Activities (Excluding GF Receivables) $11.9 Capital Expenditures, Net ($2.6) Free Cash Flow (Excluding GF Receivables) $9.2 $1.8 Structural actions initiated in 4Q20 & separation charges* $11.1 Adjusted Free Cash Flow $ in billions *includes cash impacts incurred in the period related to structural actions initiated in 4Q20 and separation related costs The above reconciles the Non-GAAP financial information contained in the “Financial Highlights”, “Summary’, “Cash Flow and Balance Sheet Highlights”, “Cash Flow Summary” and “Prepared Remarks” discussions in the company’s earnings presentation. See Exhibit 99.2 included in the company’s Form 8-K dated October 20, 2021, for additional information on the use of these Non-GAAP financial measures. Supplemental Materials 30 |
| ibm.com/investor |