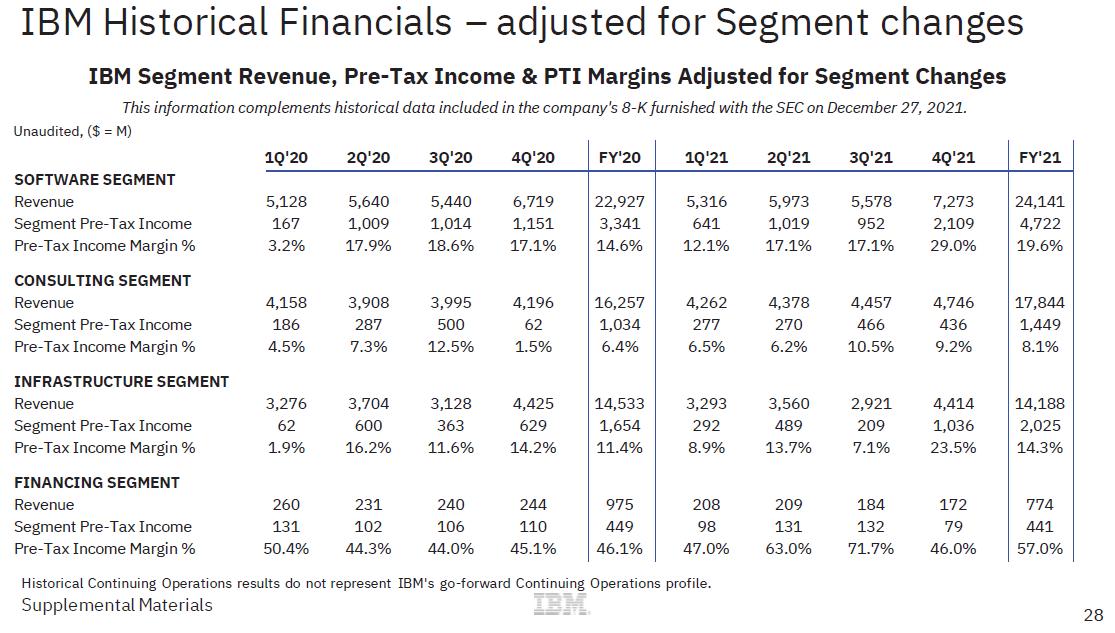
| IBM Historical Financials – adjusted for Segment changes IBM Segment Revenue, Pre-Tax Income & PTI Margins Adjusted for Segment Changes This information complements historical data included in the company's 8-K furnished with the SEC on December 27, 2021. Unaudited, ($ = M) SOFTWARE SEGMENT Revenue Segment Pre-Tax Income Pre-Tax Income Margin % CONSULTING SEGMENT Revenue Segment Pre-Tax Income Pre-Tax Income Margin % INFRASTRUCTURE SEGMENT Revenue Segment Pre-Tax Income Pre-Tax Income Margin % FINANCING SEGMENT Revenue Segment Pre-Tax Income Pre-Tax Income Margin % 50.4% 44.3% 44.0% 45.1% Historical Continuing Operations results do not represent IBM's go-forward Continuing Operations profile. Supplemental Materials 28 1Q'20 2Q'20 3Q'20 4Q'20 FY'20 1Q'21 2Q'21 3Q'21 4Q'21 FY'21 5,128 5,640 5,440 6,719 167 1,009 1,014 1,151 3.2% 17.9% 18.6% 17.1% 4,158 3,908 3,995 4,196 186 287 500 62 4.5% 7.3% 12.5% 1.5% 3,276 3,704 3,128 4,425 62 600 363 629 1.9% 16.2% 11.6% 14.2% 260 231 240 244 131 102 106 110 22,927 3,341 14.6% 16,257 1,034 6.4% 14,533 1,654 11.4% 975 449 46.1% 5,316 5,973 5,578 7,273 641 1,019 952 2,109 12.1% 17.1% 17.1% 29.0% 4,262 4,378 4,457 4,746 277 270 466 436 6.5% 6.2% 10.5% 9.2% 3,293 3,560 2,921 4,414 292 489 209 1,036 8.9% 13.7% 7.1% 23.5% 208 209 184 172 98 131 132 79 47.0% 63.0% 71.7% 46.0% 24,141 4,722 19.6% 17,844 1,449 8.1% 14,188 2,025 14.3% 774 441 57.0% |